Preprint
Article

Cracking Resistance of Steam-Cured Precast Concrete with Modified Fly Ash Cement

Altmetrics

Downloads

74

Views

21

Comments

0

A peer-reviewed article of this preprint also exists.

Submitted:

20 September 2023

Posted:

21 September 2023

You are already at the latest version

Alerts
Abstract
Fly ash cement has rarely been used in Japan, mainly because its strength development is slower than ordinary Portland cement. In this research, the effect of the new fly ash cement with both high alite (C3S) cement and fly ash modified by electrostatic belt separation method on cracking resistance of precast concrete prepared by steam curing was studied. The mechanical and shrinkage properties of the proposed fly ash concrete were compared with those of concrete made using OPC cement without fly ash. In order to study the cracking tendency of precast concrete with the proposed fly ash cement, thermal stress analysis was conducted taking into consideration of the experimental data of concrete properties with the different concrete mix proportions. A standard precast concrete box culvert model was used in this 3D FEM analysis and the distribution of temperature and relative humidity in cross section and induced restraint stress during and after steam curing were discussed. Steam-cured concrete with fly ash and high alite cement developed higher compressive strength on the first day of age than concrete with OPC. The proposed fly ash concrete developed high cracking resistance in the early days. On the other hand, the results showed that the drying shrinkage at later ages was the main cause of cracking.
Keywords: 
Subject: Engineering  -   Civil Engineering

1. Introduction

Fly ash is a residual material of energy production that is driven out of the boiler with the flue gases and has numerous advantages for use in concrete. Due to rising landfill costs and increased interest in sustainable development, recycling fly ash has become a severe problem in recent years, it is one of the primary sources of carbon dioxide emissions and air pollution on Earth, however, it is nevertheless seen as a green resource, it is mainly regarded as eco-friendly when utilized in buildings because it is recycled material. Considering that power plants will burn coal and produce fly ash anyhow, in that case, it will be very beneficial to use it to save money and energy in the construction sector.
Until now, the use of FA as an admixture at concrete mixing plants is still rare in Japan. This is mainly because the strength development of FA cement concrete is slower than that of OPC concrete. Another reason is that the unburned carbon content in fly ash affects the properties of concrete and makes quality control very difficult. To solve this problem, a new modified fly ash with low unburned carbon has been developed using an electrostatic belt separation method which is a special technique using the differences in conductivity between the particles of the minerals to separate them from each other [1,2].
Precast concrete is widely used globally for many kinds of construction. Also in Japan, in order to cope with the declining birthrate and aging population, the use of precast concrete products is increasing year by year because it is effective in labor-saving construction.
One of the most important points to focus on in any industry is increasing productivity, and in the precast concrete industry, we need to use the molds as many times as possible in the shortest time. This means demolding in the shortest possible time, therefore, suitable compressive strength must be reached to demoed safely. The most common way to improve the compressive strength of precast concrete at an early age is by using the steam curing method [3,4] which has an effect on the physical properties of the concrete. However, using fly ash will slow down the compressive strength development of the concrete, as mentioned before. To solve this problem, it is recommended to use high alite (C3S) cement with modified fly ash to accelerate the strength development of the concrete [5]. In general, the main chemical components of OPC are Alite (C3S) and Belite (C2S). Alite’s chemical reaction is much faster than belite’s, as a result, it is responsible for early strength of concrete [6]. Supported by the results of a previous study [7], the authors reported that using high alite cement with fly ash will increase compressive strength at early ages in cast-in-place concrete structures.
Controlling concrete cracking, which can appear in precast concrete products at various ages due to the material's quasi-brittle nature and limited ability to deform under tensile stresses [8,9,10], is one of the critical problems. Concrete shrinkage is frequently blamed for cracks that may appear sooner or later, and the size of those cracks has an adverse impact on the durability of the concrete. It has been acknowledged that the correct material selection, mix proportions, curing conditions, and construction techniques can control concrete cracking brought on by both temperature change and shrinkage [11].
In this research, the effect of the new fly ash cement with high alite (C3S) cement and fly ash modified by electrostatic belt separation method on precast concrete prepared by steam curing was studied. The mechanical and shrinkage properties of the proposed fly ash concrete were compared with those of concrete made using ordinary Portland cement without fly ash. In order to study the cracking tendency of precast concrete with the proposed fly ash cement, thermal stress analysis was conducted taking into consideration of the experimental data of concrete properties with the different concrete mix proportions, A standard precast concrete box culvert model was used in this 3D FEM analysis and temperature distribution in cross section and induced restraint stress during and after steam curing were discussed.

2. Materials and Mix Proportions

Table 1 shows the physical and chemical properties of binder materials, high alite cement (A), and ordinary Portland cement OPC (N), which were used for experiments in this study.
Ordinary Portland cement is commercially produced and conforms to the Japanese standard JIS R 5210: 2009—standard specification for Portland cement [12].
It can be seen that the Blaine fineness is higher and the amount of free calcium oxide (f.CaO) and alite (C3S) in the high alite cement (A) are larger than those in conventional ordinary Portland cement (N), however, the production process in the cement factories for both is almost the same regarding raw materials, kiln temperature, and power consumption for raw materials treatment [7]. For that reason, it can be said from the environmental viewpoint that the emission of CO2 by using fly ash with high alite cement is less than when producing OPC.
Table 2 shows the physical and chemical properties of the fly ash used for experiments in this study. FA-1 is typical fly ash conforming to the requirements of Japanese standards. FA-2 is modified fly ash from which unburnt carbon is removed from FA-1 by the electrostatic belt separation method. FA in Table 2, which also modified fly ash prepared by the same method, was used for the experiments indicated in the following chapters. As shown in the table, ignition loss and methylene blue adsorption of FA-2 and FA are much lower than that of FA-1 suggesting that unburnt carbon is effectively removed.
Table 3 shows four mix proportions of concrete used in the experiments. Air-entraining agent (AE), and superplasticizer (SP) are used to introduce entrained air and improve workability. The target slump and air content for the experiments were 12±2.5cm and 4.5±1.0% respectively. The replacement ratio of the fly Ash in the cement was taken to be 18%.
The coarse aggregate used in this study was crushed sandstone obtained from Kuzu region in Japan, while river sand obtained from Kinugawa river in Japan was used as fine aggregate. Table 4 shows the physical properties of the Aggregates which were used in this study.

3. Experimental procedures

3.1. Compressive strength and modulus of elasticity

For Compressive strength tests, cylindrical concrete specimens of 100-mm diameter and 200-mm height were cast according to JIS A1108: 2006—method of test for compressive strength of concrete [13], and ASTM C39/C39M-18: 2018—standard test method for compressive strength of cylindrical concrete specimens [14].
After casting, the specimens for steam curing were stored in a temperature-controlled room at 20°C and 80% R.H. After 2 hours of casting time, the specimens for 1, 14, and 91 days of compressive strength test were subjected to steam curing. The temperature increased gradually during 2 hours and 15 minutes, up to 65°C as a stable maximum temperature for 3 hours, the target temperature used in the experiments was similar to steam curing in general precast concrete factories. The temperature gradually reduced during 10 hours to stable at 20°C for 6 hours and 45 minutes, the total time for the steam curing procedure was 24 hours. Figure 1 shows the general temperature regime for a typical steam curing profile.
After steam curing, the specimens were demolded after 24 hours and compressive strength was measured. Then the steam-cured specimens were subjected to drying conditions in a temperature-controlled room at 20°C and 60% R.H. to observe compressive strength at 14 and 91 days.
The other cylinder specimens were stored in water at 20°C to observe 7, 28, and 91 days of compressive strength under standard conditions.
The modulus of elasticity of concrete was also measured on the cylinder specimens used for compressive strength tests.

3.2. Autogenous and Drying shrinkage

Autogenous shrinkage identified as microscopic shrinkage happens in concrete after the initial setting because of cement hydration [15]. Concrete has drying shrinkage as a result of the different levels of moisture inside and outside the concrete [16]. Embedded strain gauges connected to a data logger were positioned in the center of beam concrete specimens sized 100mmx100mmx400mm, and they were used to measure concrete strain and temperature during the experiments. Figure 2 shows the cross and side sections in the mold. Immediately after casting, the specimens were stored in a temperature-controlled room at 20°C and 80% R.H. Then after 2 hours, they were subjected to steam curing protocol as shown in Figure 1. All specimens were demolded after 24 hours. Then the accelerated cured specimens were subjected to drying conditions in a temperature-controlled room at 20°C and 60% R.H. The strain and temperature were measured in all specimens up to 230 days.
The initial setting time, which is defined as the starting point of autogenous shrinkage, was 3.5 hours after casting, the concrete’s thermal expansion coefficient was assumed to be 10x10-6/°C in accordance with JCI (2016) [17], and the total strain from which the thermal strain was subtracted to find autogenous shrinkage was observed.

3.3. Adiabatic temperature rise

To characterize the adiabatic temperature rise properties of concrete for mix proportions (A+FA), an adiabatic temperature rise test was conducted using an adiabatic temperature rise testing machine that used air and water circulation to control the temperature inside the chamber. Concrete was cast in a mold with a diameter of 400mm and height of 400mm and was put in the temperature-controlled chamber, an automatic controller was used to control the air temperature in the chamber to be exactly the same as the temperature inside the concrete specimen during the time. As the temperature of the tested concrete rises, the air temperature inside the chamber continues to rise, and the temperature of the water circulating inside the chamber also rises following the air temperature inside the chamber. the temperature of the central portion of concrete was measured for two weeks using copper-constantan thermocouples.

3.4. Thermal stress analysis using three-dimensional finite element method (3-D FEM)

During the cement hydration process at an early concrete age, thermal cracking occurs due to restrained temperature deformations caused by excessive temperature differences within a massive concrete member of the structure or outer restraint from other attached structural members [18]. This thermal difference generates tensile stresses in concrete. As a rule, when external restraint is predominant, cracks penetrating through a concrete section (through cracks) are formed [17]. Guidelines for control of cracking of mass concrete JCI (2016) highlights some other factors that lead to thermal cracking in concrete structures including volume change due to heat of cement hydration, autogenous shrinkage, combined erects of the type of structure, boundary conditions, materials, mixture proportions, construction method, weather conditions, etc. The above factors are prominent in mass concrete structures. However, in thin concrete members, the effects of heat of cement hydration are low due to the insignificant temperature gradients that enable easy and uniform heat dissipation into the surrounding.
JCI guidelines provide an indication of concrete behavior, used as an index of cracking probability, the thermal cracking index, which is the percentage of tensile strength from the maximum principal stresses. The chance of cracking is higher when the thermal cracking index is low. when the cracking index value is 1.0 the probability of cracking is 50%, and when it decrees to be less than 0.6 the cracking probability will increase to be 100%. Equation (1) was used to calculate the thermal cracking index [17]:
Preprints 85684 i001
where Icr: thermal cracking index, ft(te): splitting tensile strength (N/mm2), σmax(te): maximum principal stress (N/mm2), and te : temperature adjusted age (day).
In this study, thermal cracking index Icr includes the influence of thermal, autogenous, and drying shrinkage in different ratios, regarding to that, from here on, it will be referred as cracking index.
In this study, thermal analysis and thermal stress analysis were conducted by 3-D FEM for a precast concrete product for mix proportions (N 45%) and (A+FA 45%) using the modified fly ash cement proposed in this study which is subjected to steam curing (which is shown in Figure 1), then air curing conditions for 6 months (at 20°C and 60% R.H.).
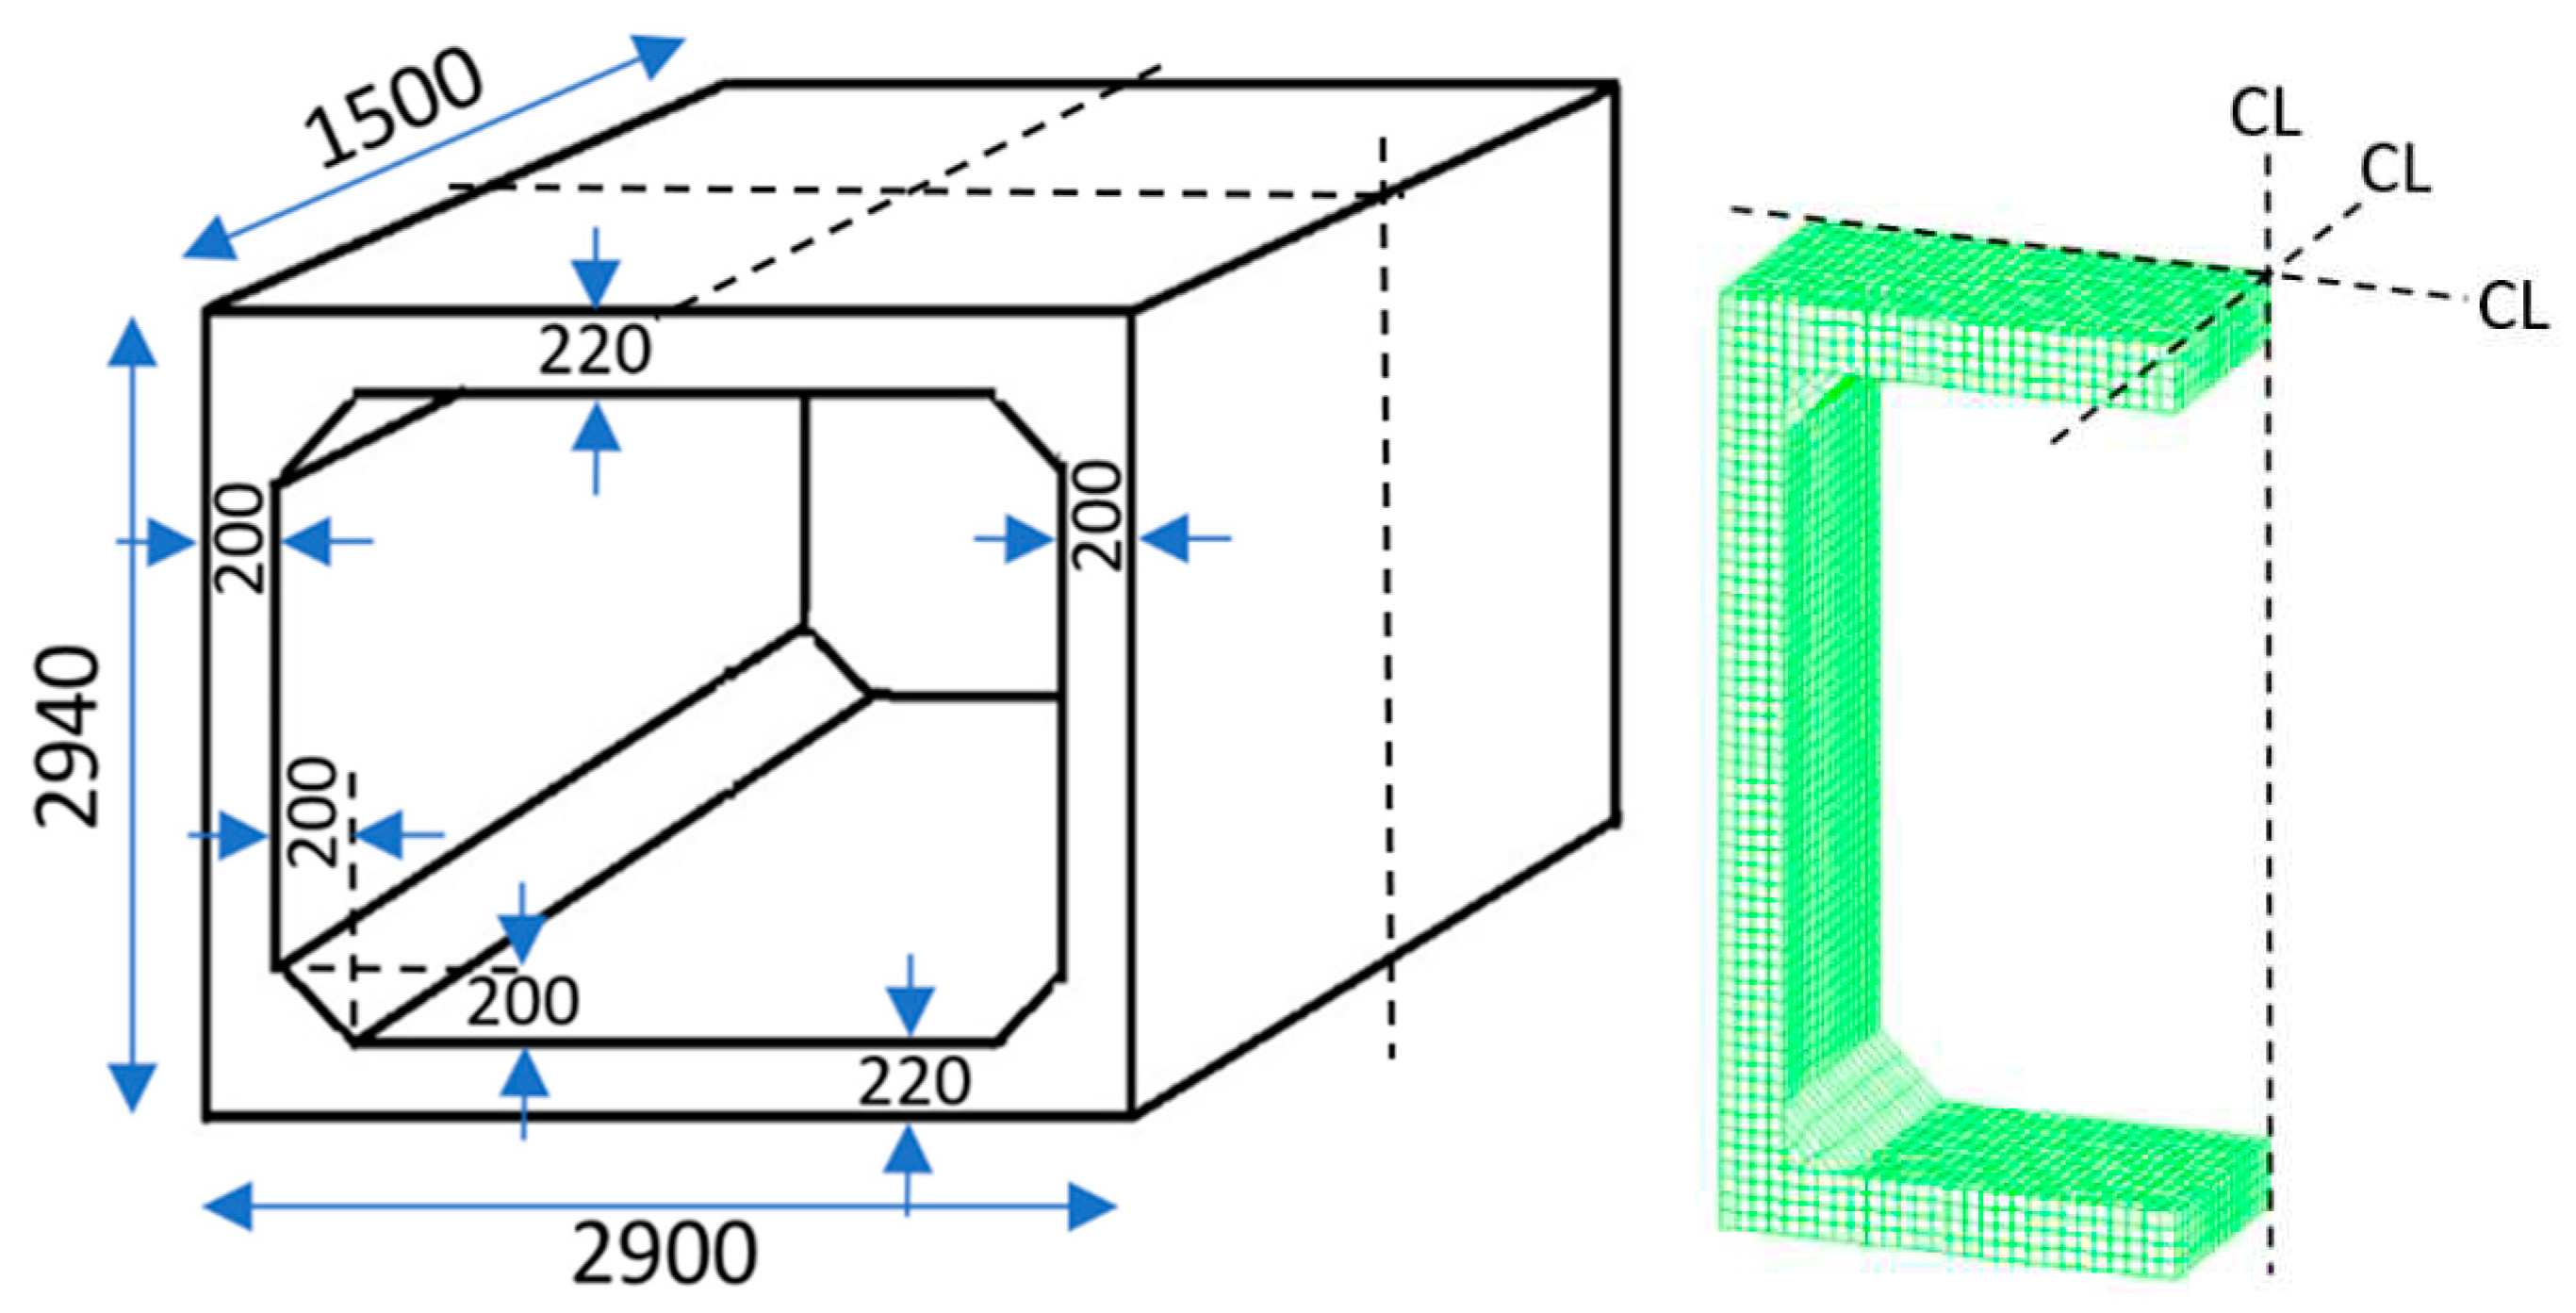
For FEM analysis, a precast concrete model similar to a standard precast box culvert was selected from JIS A 5372- 2016 - precast reinforced concrete products [19]. Figure 3 shows the actual design of a culvert box and quarter portion for numerical analysis, computer program of thermal stress analysis for mass concrete structures (JCMAC-3) proposed by JCI, which is a 3-D finite element method (FEM) simulation tool, was used. In order to simulate the time-dependent distributions of temperature and relative humidity in a concrete member, the transient heat transfer and moisture transfer analyses based on diffusion equations were carried out by 3D FEM analysis. In thermal stress analyses, autogenous shrinkage strain was added to thermal strain and linear elastic analyses were carried out, in which stress relaxation due to creep of concrete was taken into account by using the reduction coefficient of elastic modulus as shown below.
Dr. Ishikawa proposed a drying shrinkage model using the capillary tension theory for the pore size distribution of the hardened cement paste to calculate the drying shrinkage strain of unrestrained concrete element from its relative humidity [20]. In this study, Ishikawa’s model was adopted to calculate the restraint stress due to drying shrinkage. In FEM analysis for mix proportion (N 45%) the values of the coefficients in the model to consider the influence of materials used and concrete mix proportion on drying shrinkage were determined so that calculated restraint stress coincided with the observed values by the stress release method [21]. Drying shrinkage strain of concrete specimens was also measured and the coefficient for mix proportion (A+FA 45%) was decided as the coefficient for mix proportion (N 45%) multiplied by the ratio of drying strain of (A+FA 45%) to that of (N 45%).
In the FEM analysis, the real properties of the concrete which were obtained as experimental results such as adiabatic temperature rise, compressive strength, modulus of elasticity, autogenous and drying shrinkage, and casting temperature were used. Splitting tensile strength was calculated utilizing compressive strength data and constants as specified in JCI guidelines for Equation (2) [17]:
Preprints 85684 i002
where ft(te): splitting tensile strength of concrete at (te) (N/mm2 ), fc(te): compressive strength of concrete at (te) (N/mm2 ), te: temperature adjusted age (days), C1 = 0.13, C2 = 0.85,
Some other properties were also obtained from JCI Guidelines [17] such as specific heat (1.15 J/g °C) and coefficient of thermal conductivity (2.7 w/m °C). Poisson’s ratio was at 0.23, creep of concrete influence was evaluated by using the effective modulus of elasticity, which was obtained by multiplying modulus of elasticity by a reduction coefficient using Equation (3).
Preprints 85684 i003
where Ee(te): effective modulus of elasticity of concrete at (te), ϕ(te): reduction coefficient for modulus of elasticity due to creep, EC (te): modulus of elasticity of concrete at (te).
At the early age during hardening process until reaching the maximum temperature the reduction constant ϕ(te) was taken to be 0.42, and then it increses during one day of reaching the maximum temperature to be 0.65 as a stable value to the later ages as recommended by JCI guidelines [17].
For equations (1), (2), and (3) the temperature-adjusted age (te) can be calculated by using Equation (4) provided by JCI [17].
Preprints 85684 i004
where ∆ti: Period of constant temperature continuing in concrete (day), T(∆ti): concrete temperature for ∆ti (°C), and T0 is 1 °C.

4. Results and Discussions

4.1. Properties of concrete

4.1.1. Fresh properties

Table 5 shows the results of fresh concrete tests conducted on all mix proportions to determine their suitability for casting and compaction, including the concrete slump, temperature, and air content.
The concrete casting temperatures were used as one of the input parameters in the 3D FEM thermal stress analysis.

4.1.2. Compressive strength and Modulus of elasticity

Figure 4 shows the temperatures of the specimens during the curing time, and it is similar to the target temperature profile in the main plan in Figure 1.
It can be seen from Figure 5 that steam-cured concrete with fly ash and high alite cement develops higher compressive strength at one day than concrete with ordinary Portland cement. On the other hand, underwater cured concrete with (N) always shows higher compressive strength than (A+FA).
For precast concrete factories, the early strength development of the proposed FA cement is highly desirable for early demolding capability. This target was achieved by steam curing as shown in Figure 5, However, compressive strength development was very slow after 14 days of age.
In general, compressive strength results after the first day were much higher with underwater curing than with steam curing.
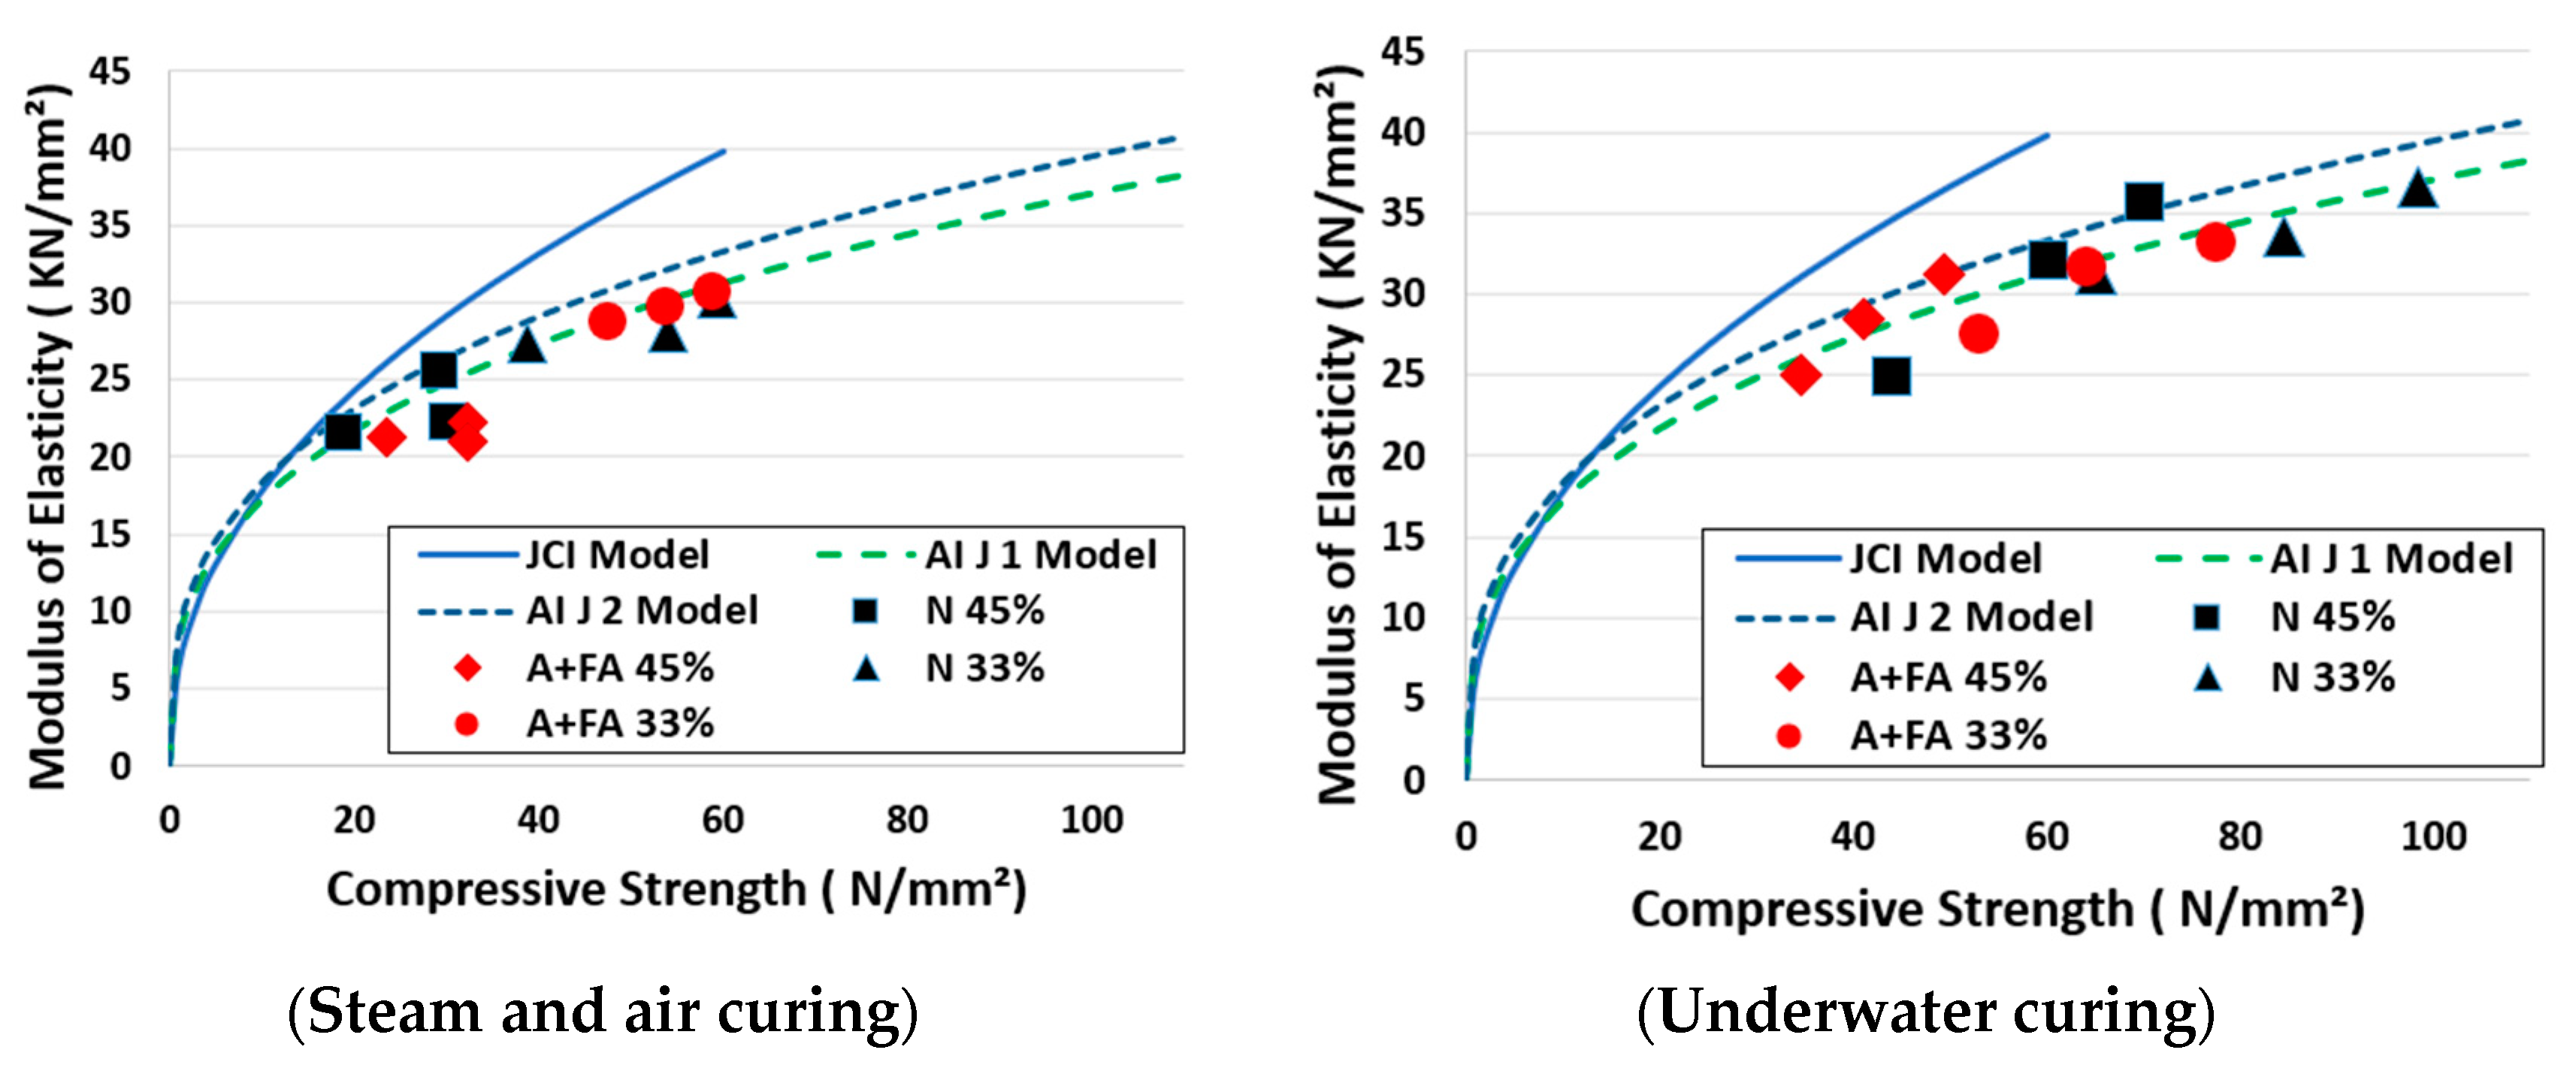
Figure 6 shows the results of the modulus of elasticity compared with the JCI model [22] and AIJ model [23], and the results are very close to the AIJ model. In most cases, modulus of elasticity of mix proportions with (N) and with (A+FA) are similar in relation to compressive strength results.

4.1.3. Autogenous and Drying Shrinkage

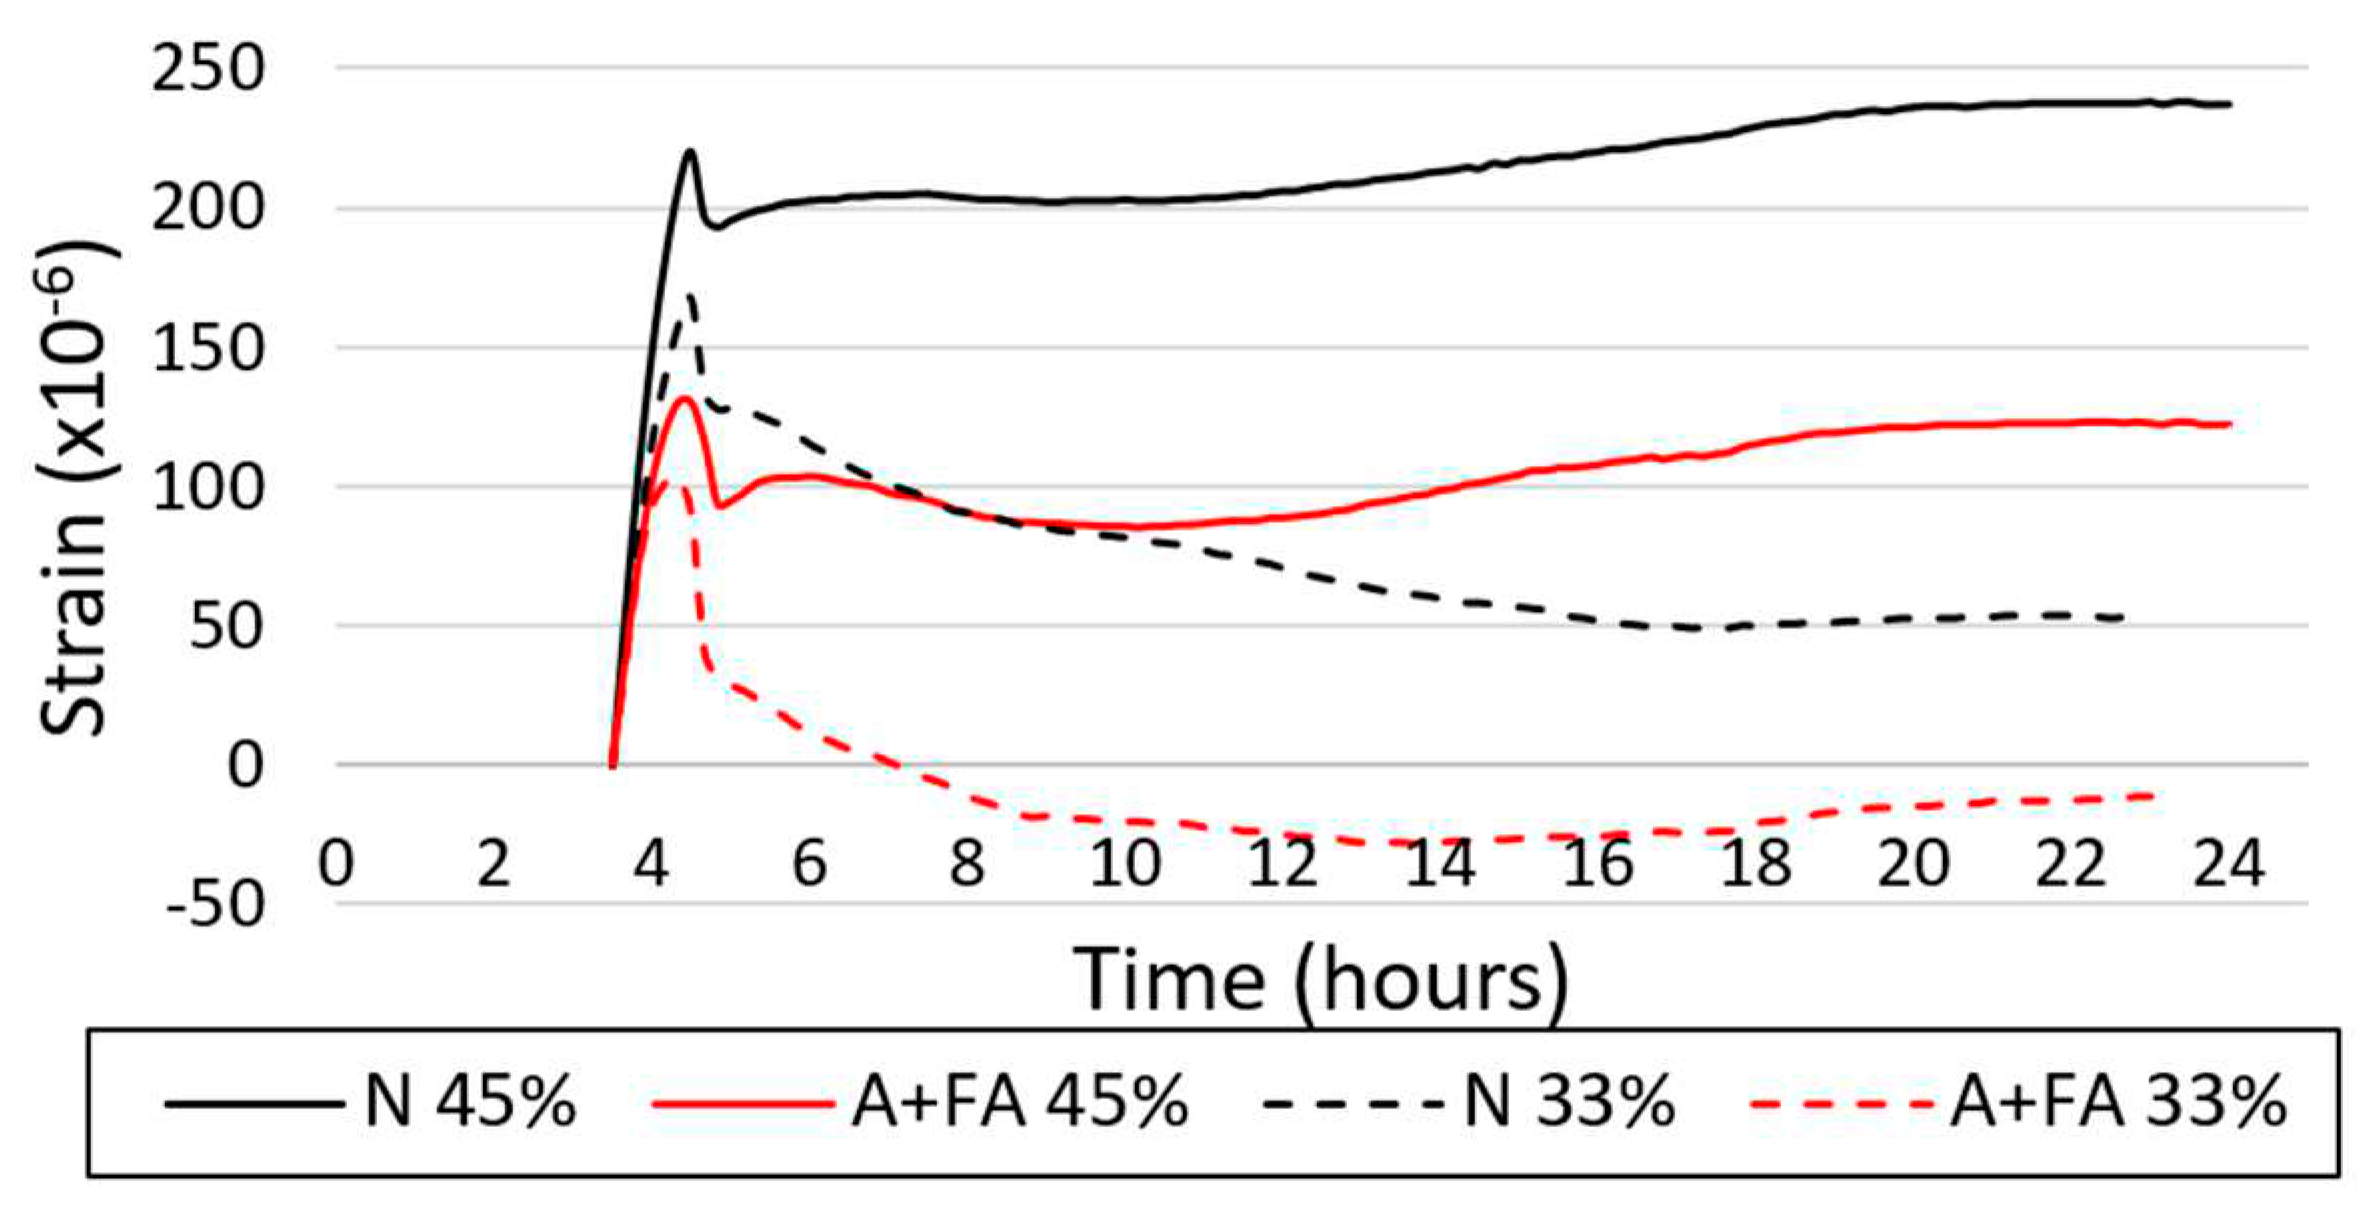
Figure 7 shows the strain due to autogenous volume change during steam curing. It can be seen from Figure 7 that mix proportions with (N) showed higher expansion at an early age than mix proportions with (A+FA). That expansion may include thermal expansion not only due to hydration process but also due to an increase in the surrounding temperature for steam curing procedure since the thermal expansion coefficient of concrete at very early age is probably much higher than 10x10-6/°C which is an assumed value in this study. It is recommended to study on the precise estimation of thermal expansion coeffect at very early ages.
After expansion at the very early age, concrete with W/B of 33% showed autogenous shrinkage of around 100x10-6/°C at the age of 24 hours, which is larger than concrete with W/B of 45%.
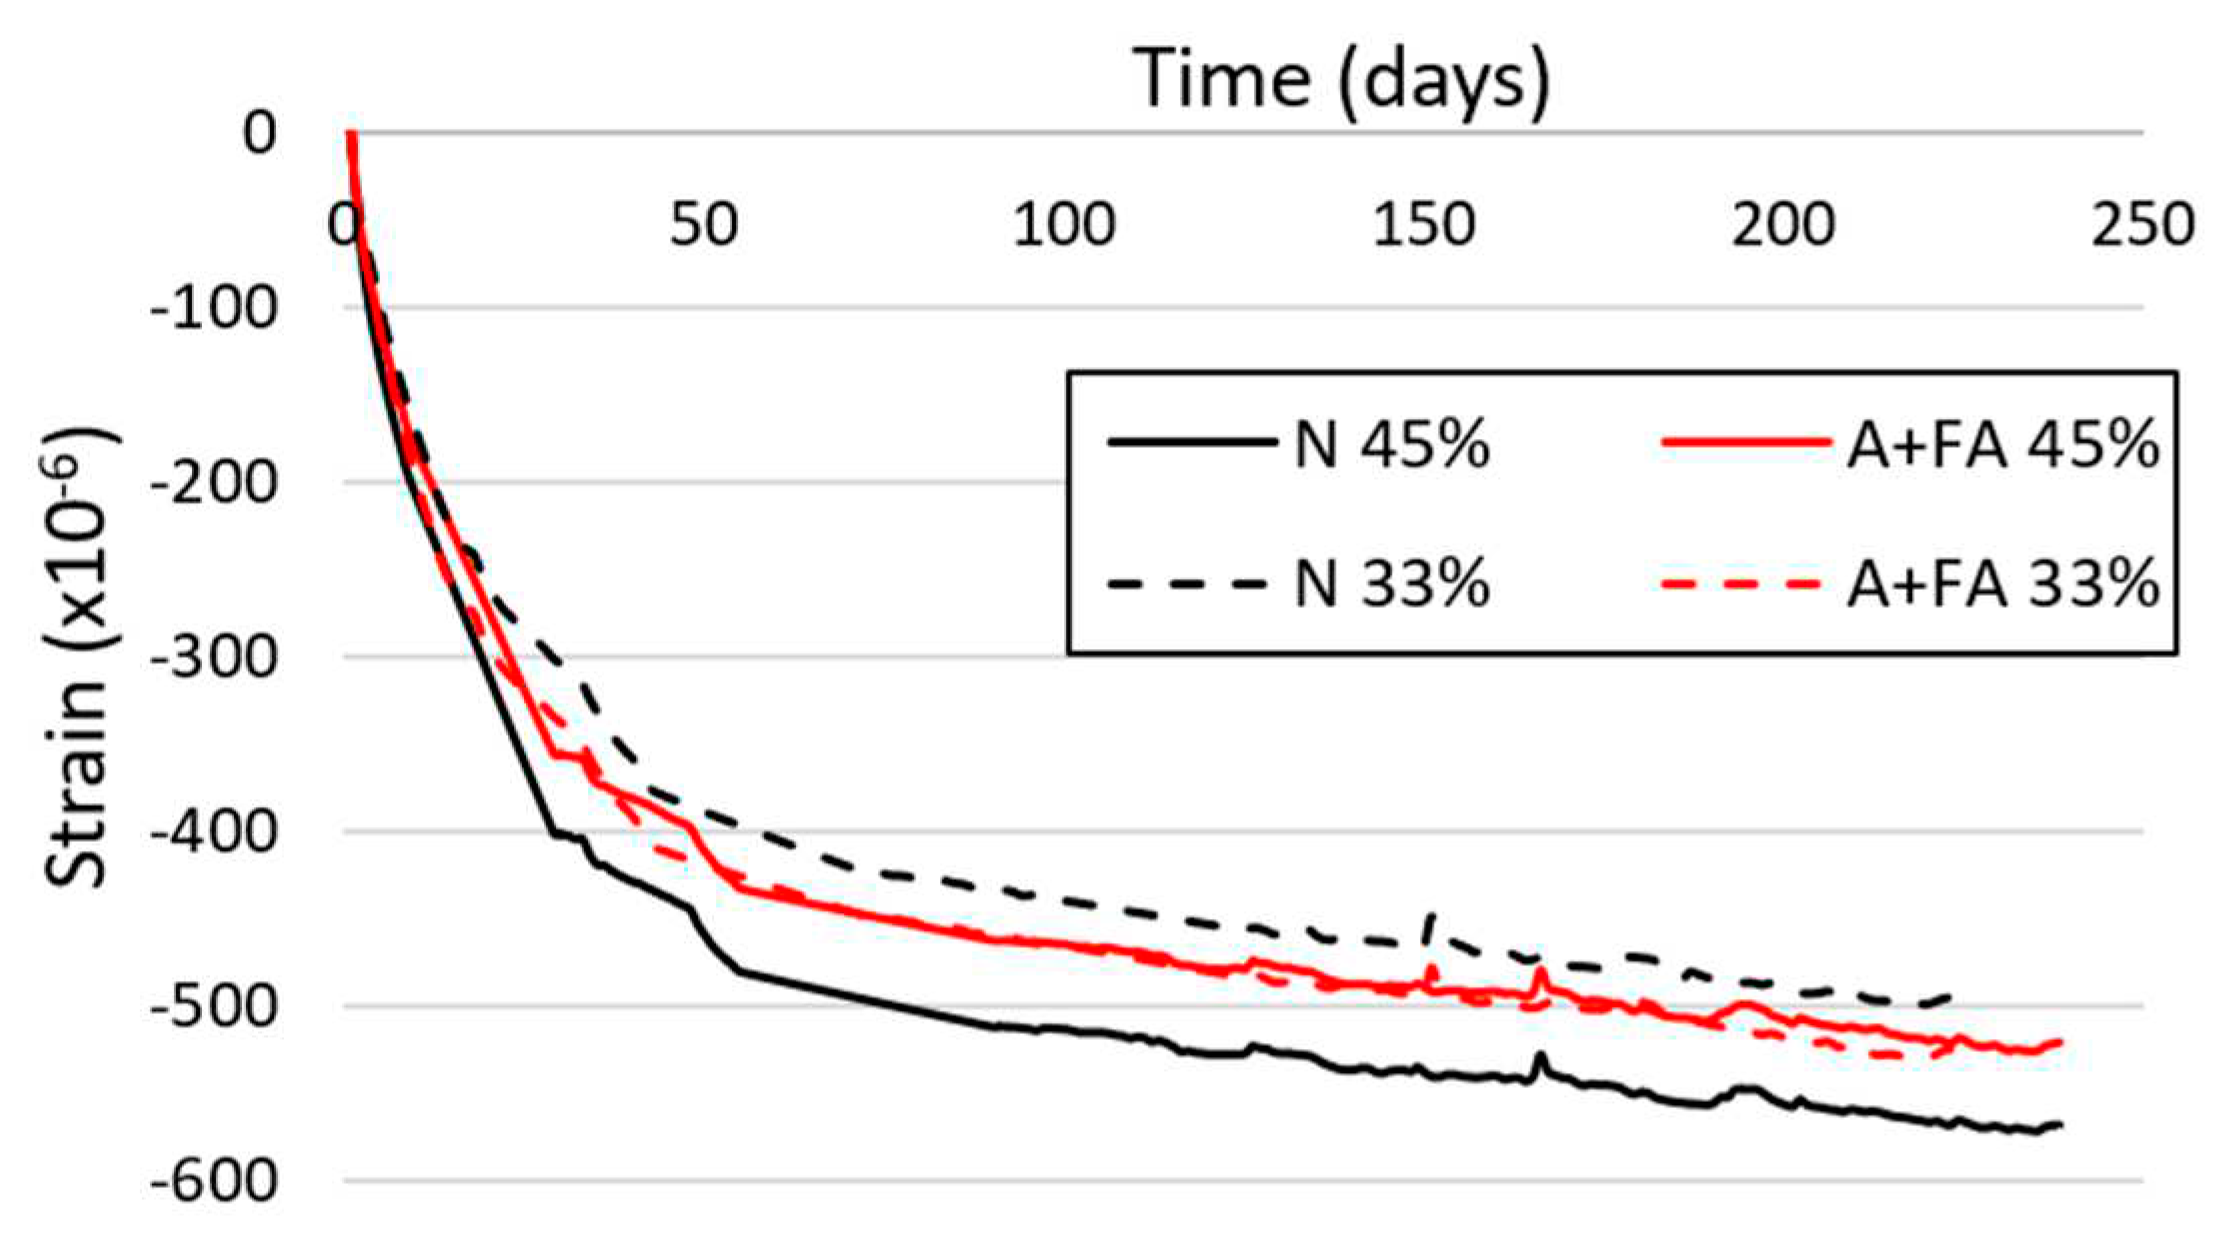
The drying shrinkage of concrete after steam curing is also shown in Figure 8. For concrete with (W/B=45%), mix proportion with (N) showed larger drying shrinkage than with (A+FA). However, with mix proportions (W/B=33%), (A+FA) showed larger drying shrinkage than (N). Also, it can be seen that for mix proportions A+FA, the difference in drying shrinkage was very small between (W/B=33%) and (W/B=45%).

4.1.4. Adiabatic temperature rise

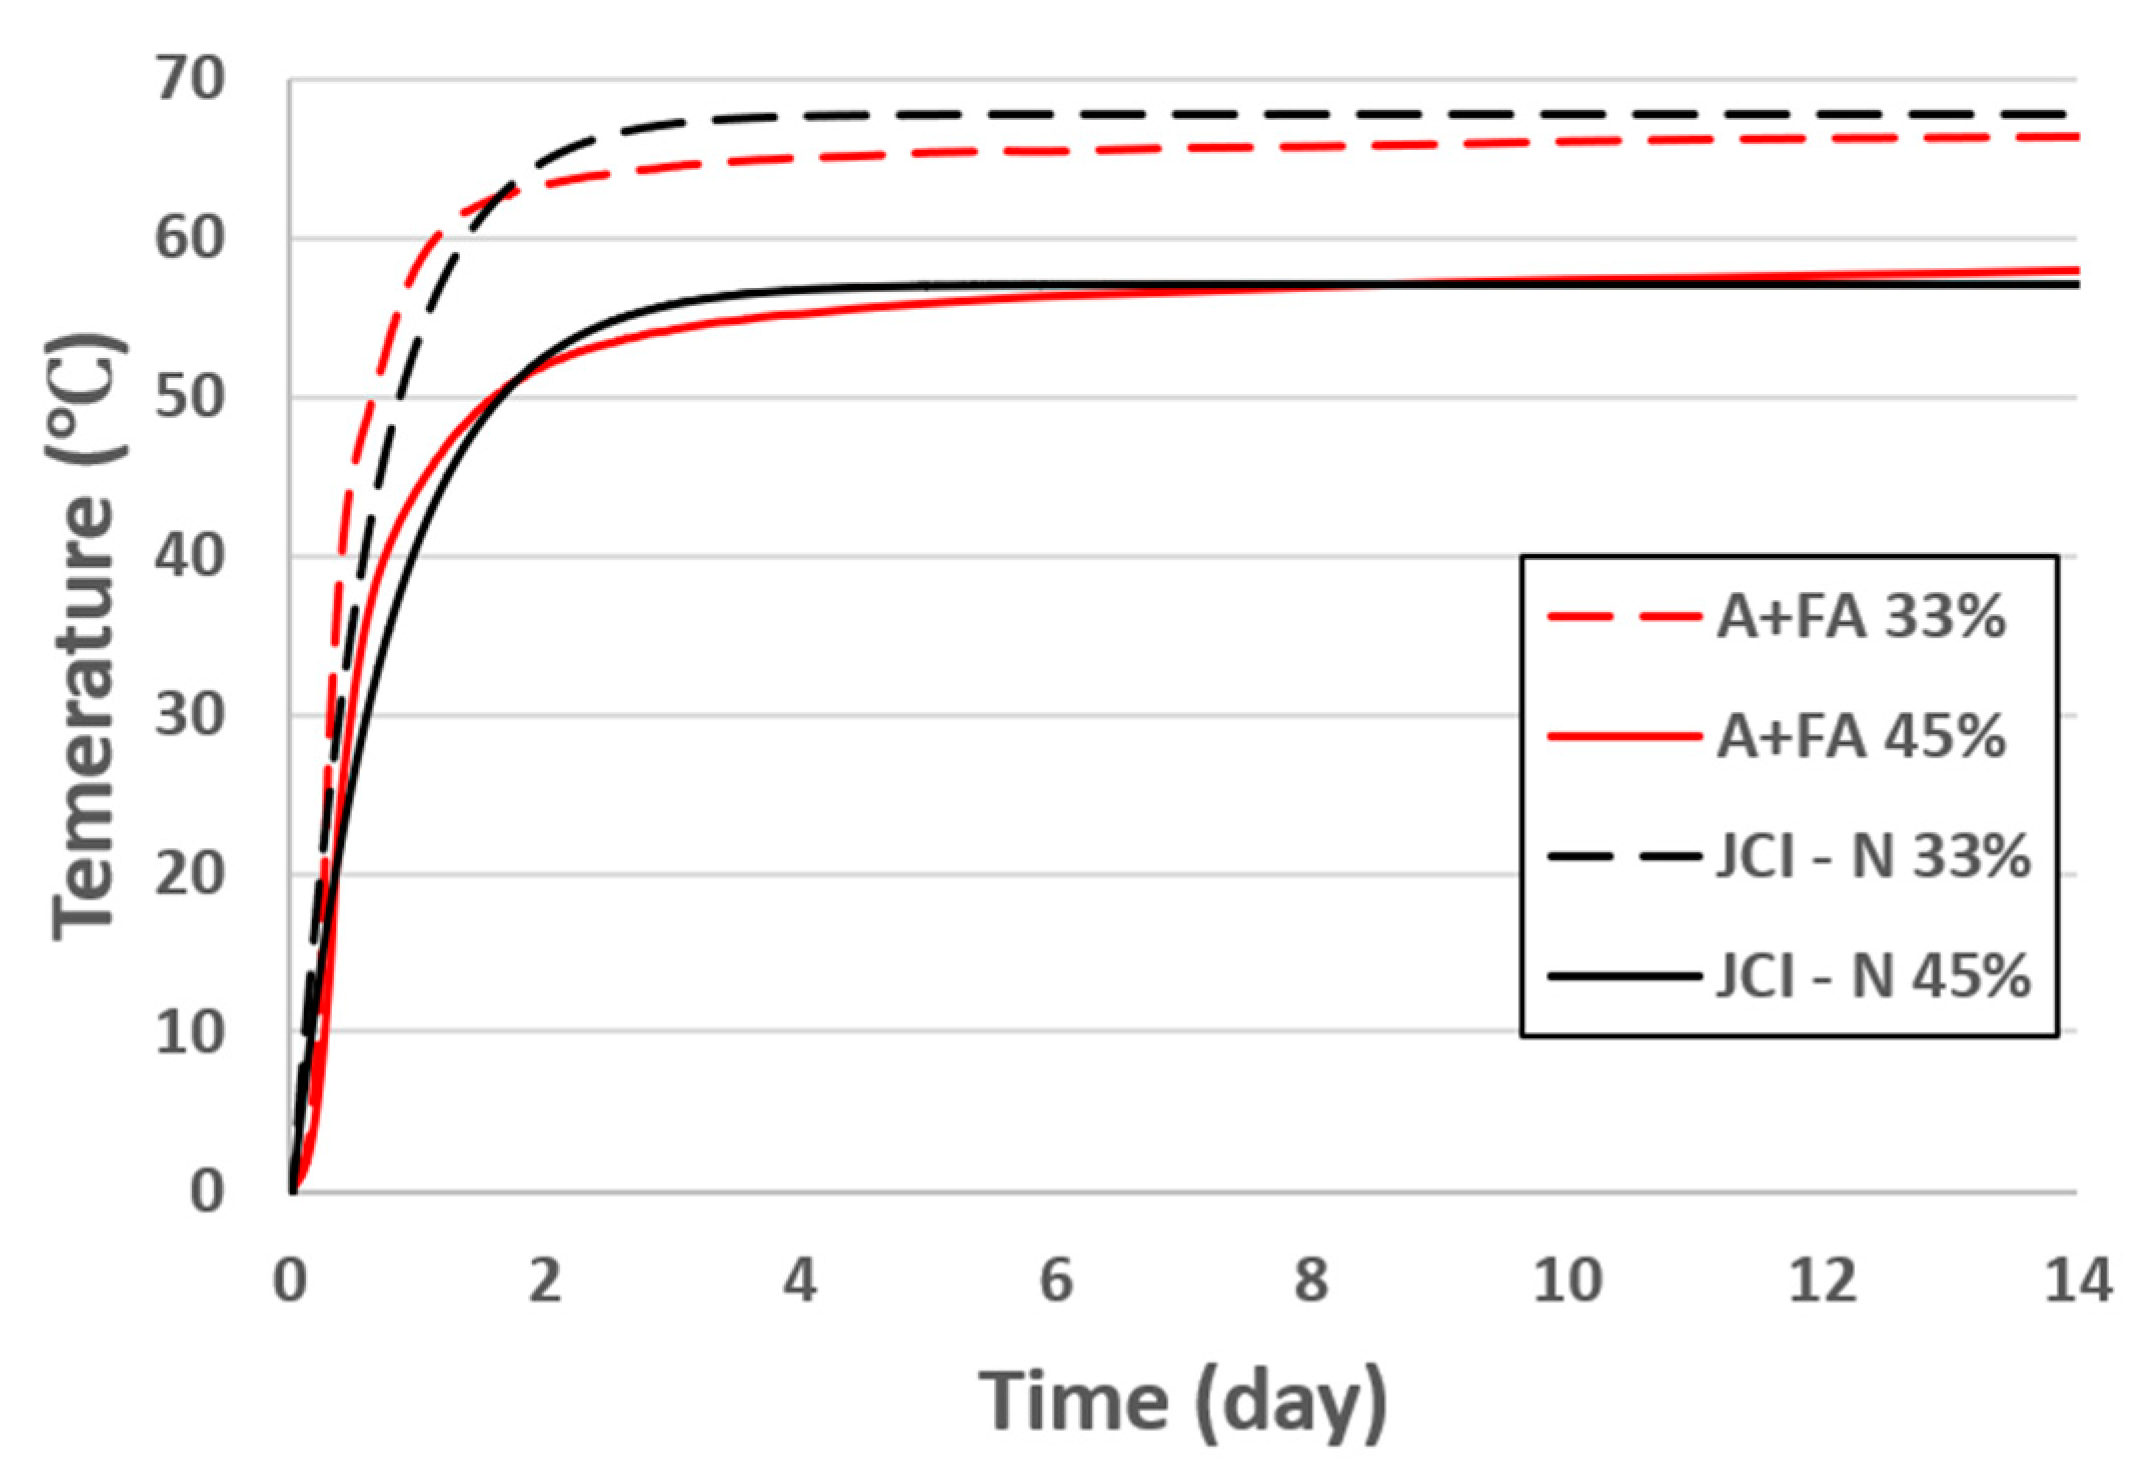
Figure 9 shows the results of the adiabatic temperature rise test for all mix proportions. For mix proportions (N 45%) and (N 33%) the ultimate adiabatic temperature rise was predicted from Equation (5), where Q∞ and other constants that are related to the rate of temperature rise were also determined as functions of cement content, casting temperature and type of cement in accordance with JCI Guidelines for control of cracking of mass concrete 2016 [17].
Preprints 85684 i005
where; t: Age (day), Q (t): Adiabatic temperature rise at t (°C), 𝑸: Ultimate adiabatic temperature rise (°C), r𝑨𝑻, 𝑺𝑨𝑻: Parameters representing rate of adiabatic temperature rise, t𝟎,𝑸: Age at starting of temperature rise (day).
It can be seen that the temperature due to heat of hydration was clearly higher when (W/B=33%) than (W/B=45%). And the maximum temperatures were almost the same for A+FA and N with same water-to-cement ratio, it can be seen also that the rate of adiabatic temperature rise on the first day was higher for both A+FA mix proportions, which was related to the influence of high alite cement on hydration at early ages. Later on, the rate will start to decrease for A+FA, then it will be higher for OPC, this relation will have a great influence on thermal stresses behavior related to type of binder, as described in 4.2.

4.2. Thermal stress analysis

4.2.1. Thermal stress during steam curing

By using the experimental results for compressive strength, elastic modulus, adiabatic temperature rise, and autogenous shrinkage shown in (Figure 5, Figure 6, Figure 7, and Figure 9) for mix proportions (N 45%) and (A+FA 45%), FEM thermal stress analysis was conducted.
Figure 10 provides the temperature profile for points across the region at the middle of the precast concrete model for both mix proportions. The thermal analysis results showed that the maximum temperatures were in the core of the concrete member. By choosing only two points, the first at the core of the concrete element section no.1, and the second one on the surface no.2, it can be seen that the temperature reached its maximum value at the surface after 8 hours, but for the core of the concrete element section, it reached the maximum value after 11 hours from the beginning of steam curing process as shown in Figure 10. Also, it can be seen that the maximum difference in temperature between the core and the surface was after 17 hours from the beginning of the steam curing process. It can be seen from the analysis that high alite cement with modified fly ash shows higher maximum temperatures than OPC due to its chemical properties.
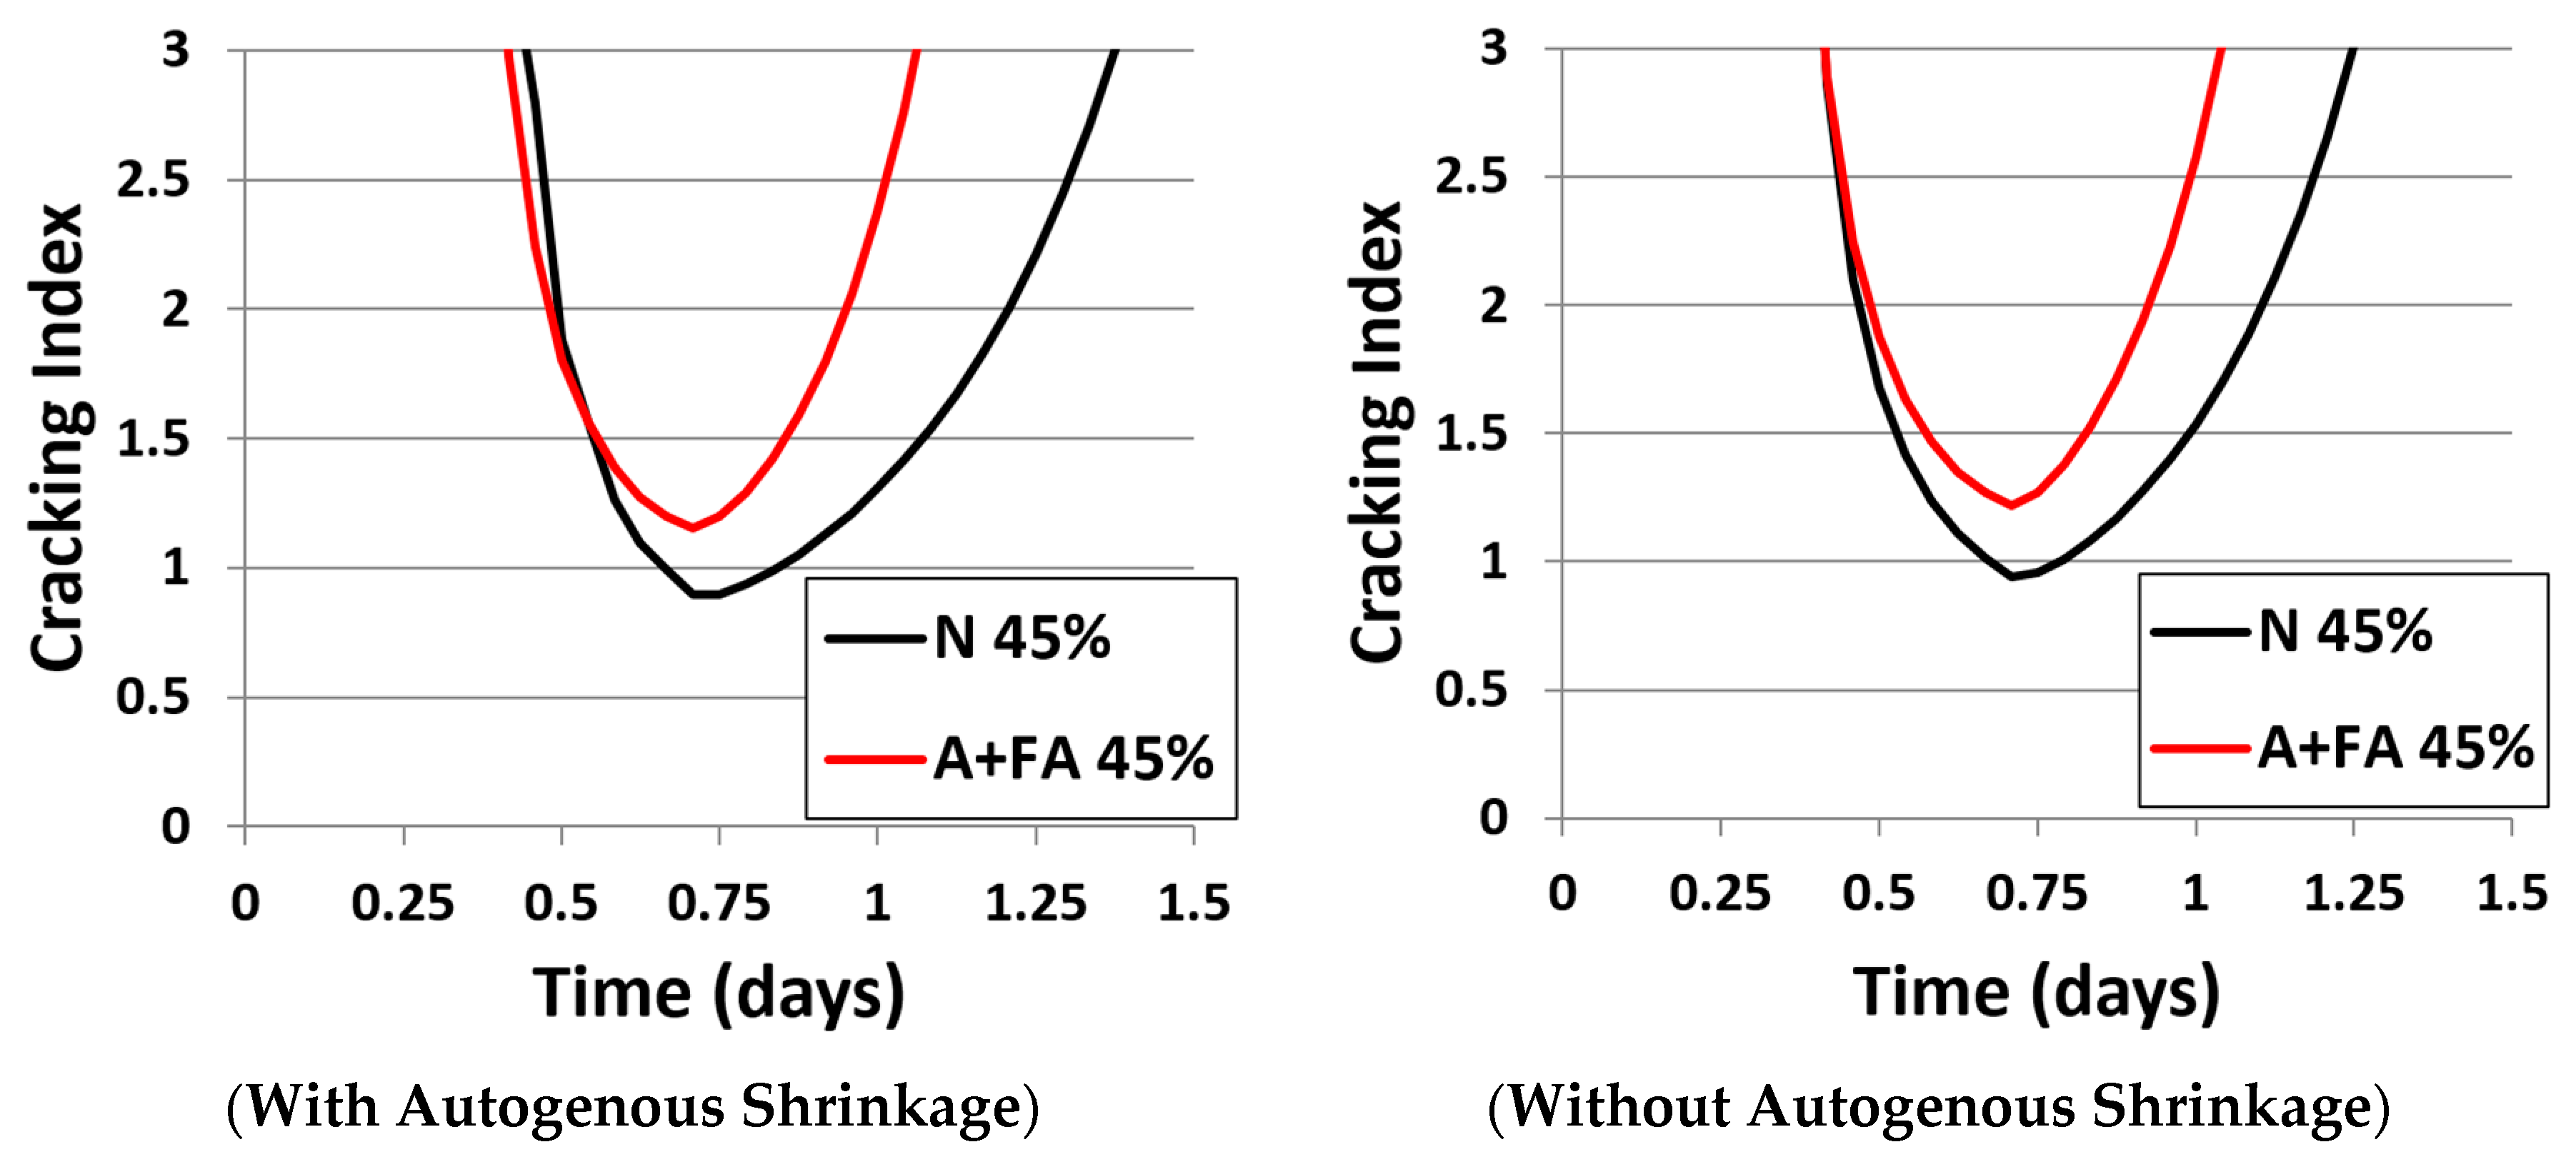
Figure 11 shows the cracking index diagram by considering the effect of heat of hydration and autogenous shrinkage. The time at which the cracking index becomes the minimum value is called the critical time in that stage. It can be noticed that the critical times for both cases coincide with the time for the maximum temperature difference shown in Figure 10.
For the critical region, Figure 12 shows cracking index chart by time. It can be seen that the cracking index was at its minimum value after 17 hours from the beginning of the steam curing process which is the critical time in that stage. By considering the effect of autogenous shrinkage, cracking index values were (Icr =1.15) and (Icr =0.89) for (A+FA 45%) and (N 45%) respectively, then after excluding the effect of autogenous shrinkage the values were (Icr =1.21) and (Icr =0.94) for (A+FA 45%) and (N 45%) respectively. It can be said that the effect of autogenous shrinkage was very small on cracking resistance for both mix proportions, the contribution of autogenous strain was negligible comparing with thermal strain at this stage. For both cases, cracking resistance of concrete with high alite cement with fly ash was higher than OPC concrete.
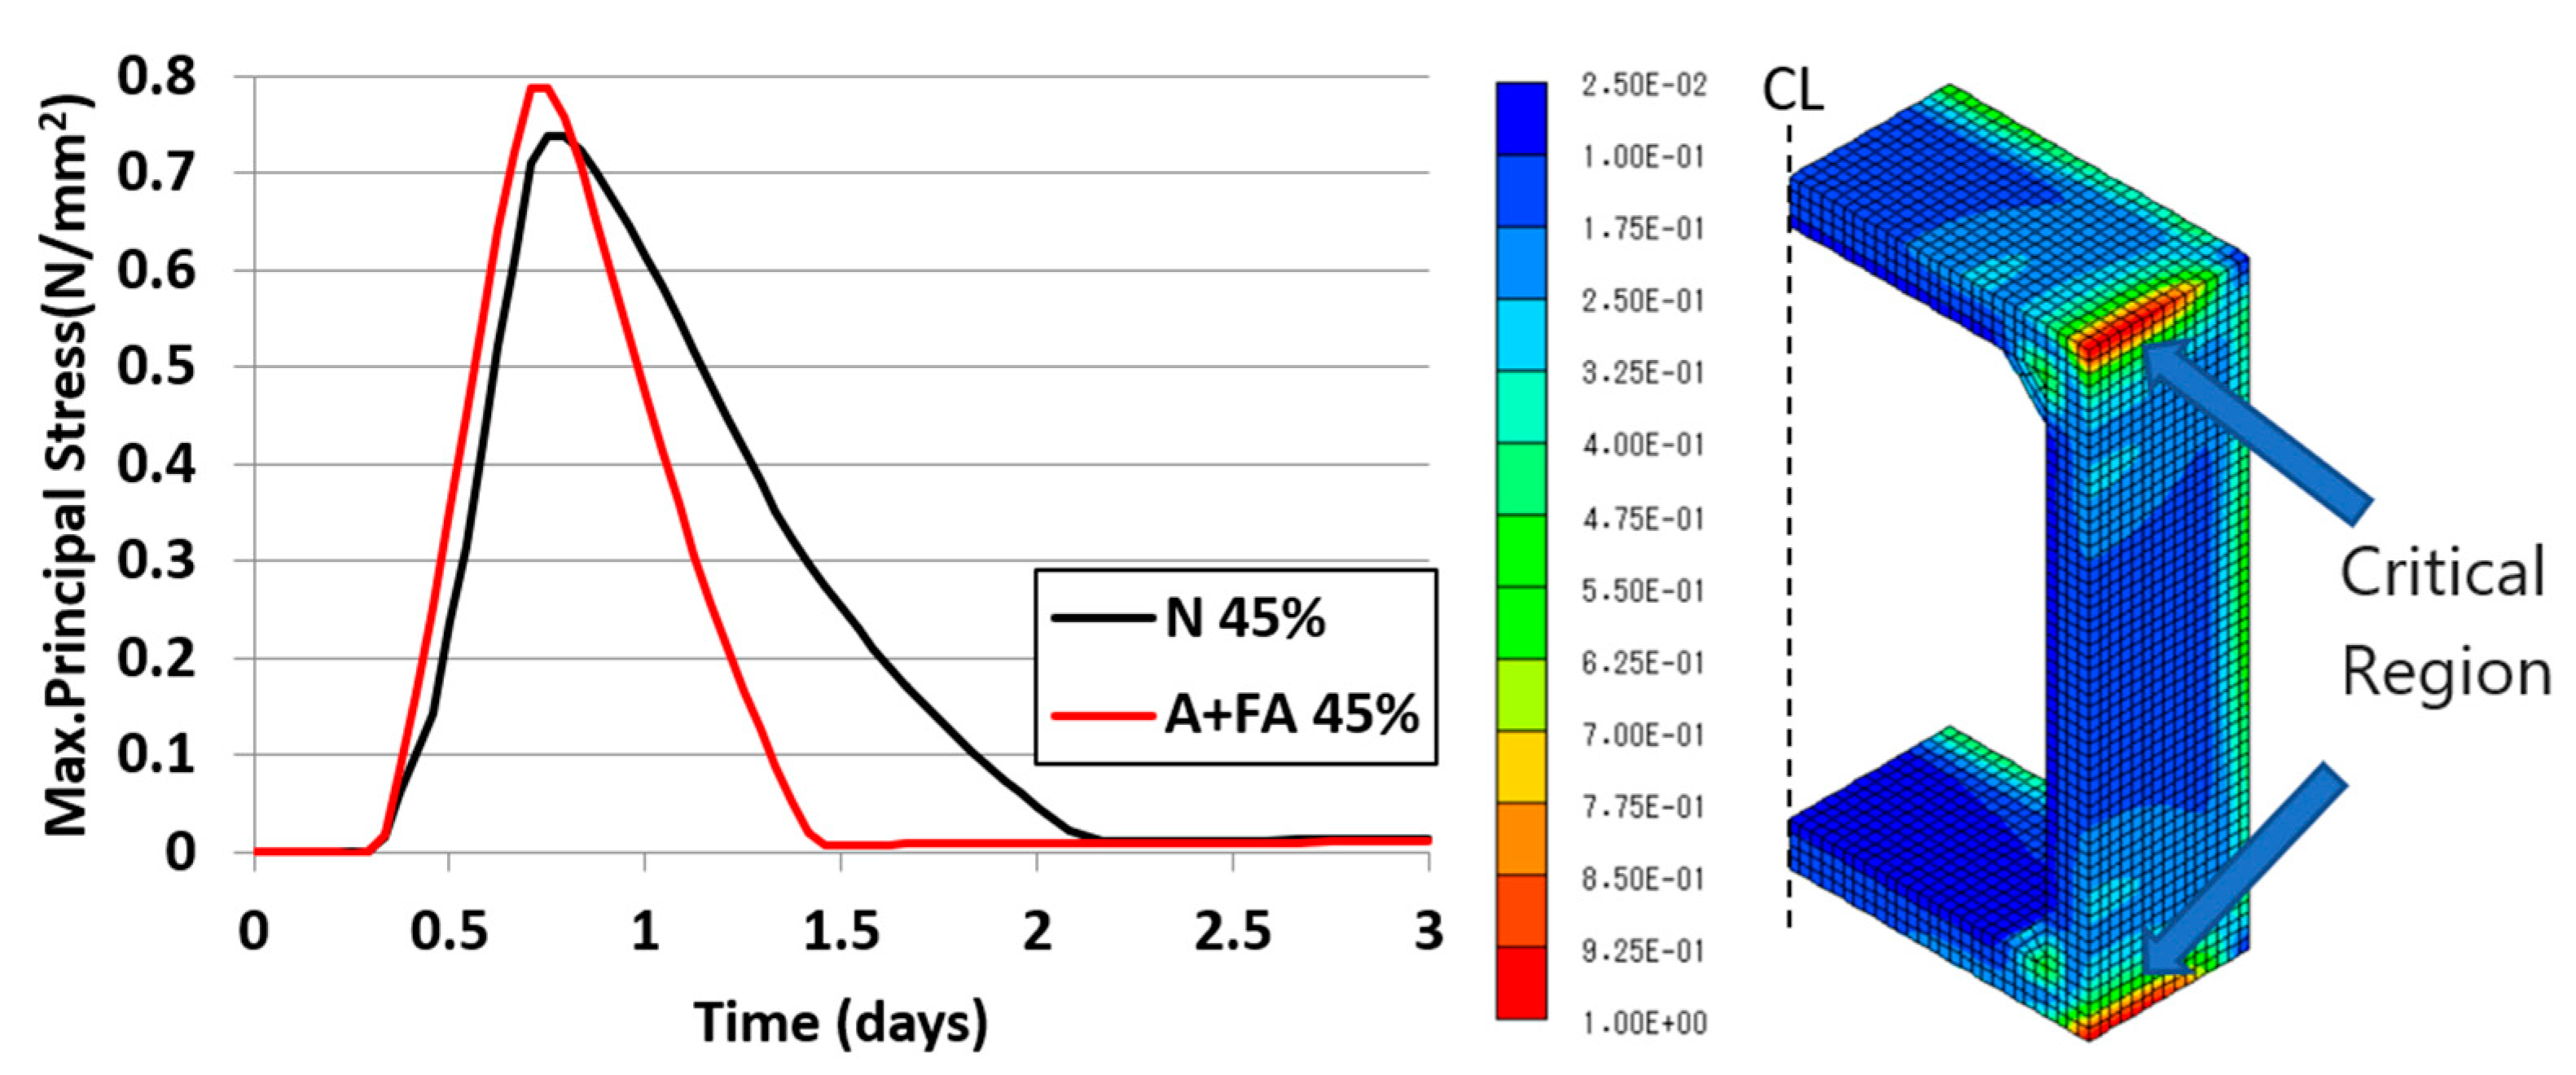
Figure 13 shows the maximum principal stresses for the critical region, it can be seen that they have reached their maximum values after 17 hours from the beginning of the steam curing process.
Also, it can be seen that rate of stress decreasing for A+FA is more than OPC, the stresses with A+FA will be almost zero after 1.5 day, but with OPC it will keep decreasing for more than two days. That was due to adiabatic temperature rise increasing ratio which was shown in Figure 9. Related to this point, it can be seen in Figure 10 that the difference in temperature between the core and the surface after 1.5 days was larger with OPC than A+FA which means that more stresses will be generated at that time.
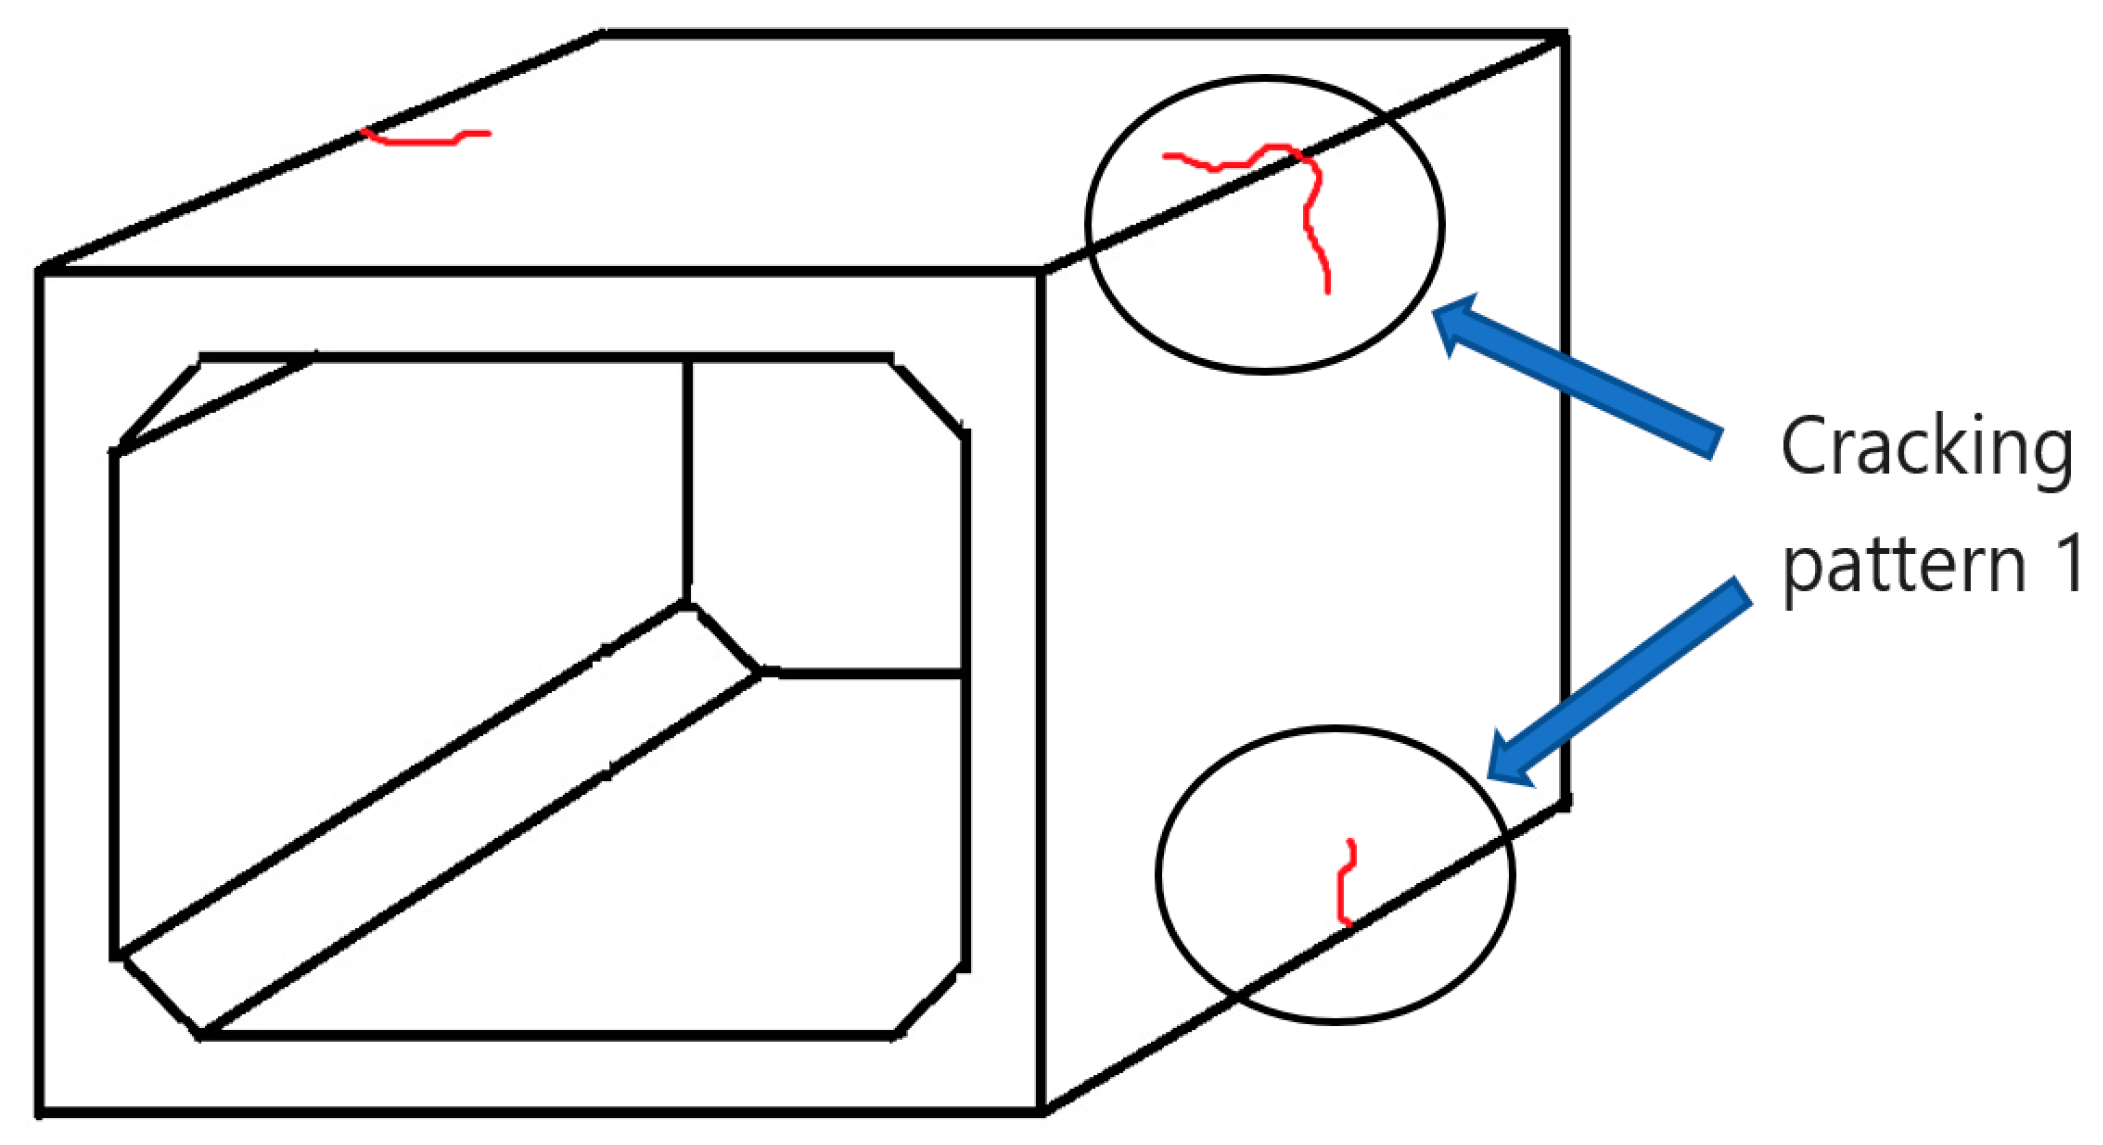
By comparing the diagrams for this stage, it can be noticed that the stresses reached their maximum value at the same time when the difference between the core temperature and the surface temperature was greatest. That is when the relative instantaneous expansion between the core and the surface of the concrete element was greatest. Therefore, internal restrain due to differential temperature leads to the tensile stresses on the surface of the concrete element in the critical region. The directions of the maximum tensile stresses in the critical region at the critical time are given by the FEM analysis, Therefore, cracking patterns can be predicted since the cracks will be developed perpendicular to the directions of the tensile stresses as shown in Figure 14.

4.2.2. Drying shrinkage stress after steam curing

The second stage was to study the effects of drying shrinkage on restraint stress generation and cracking after steam curing.
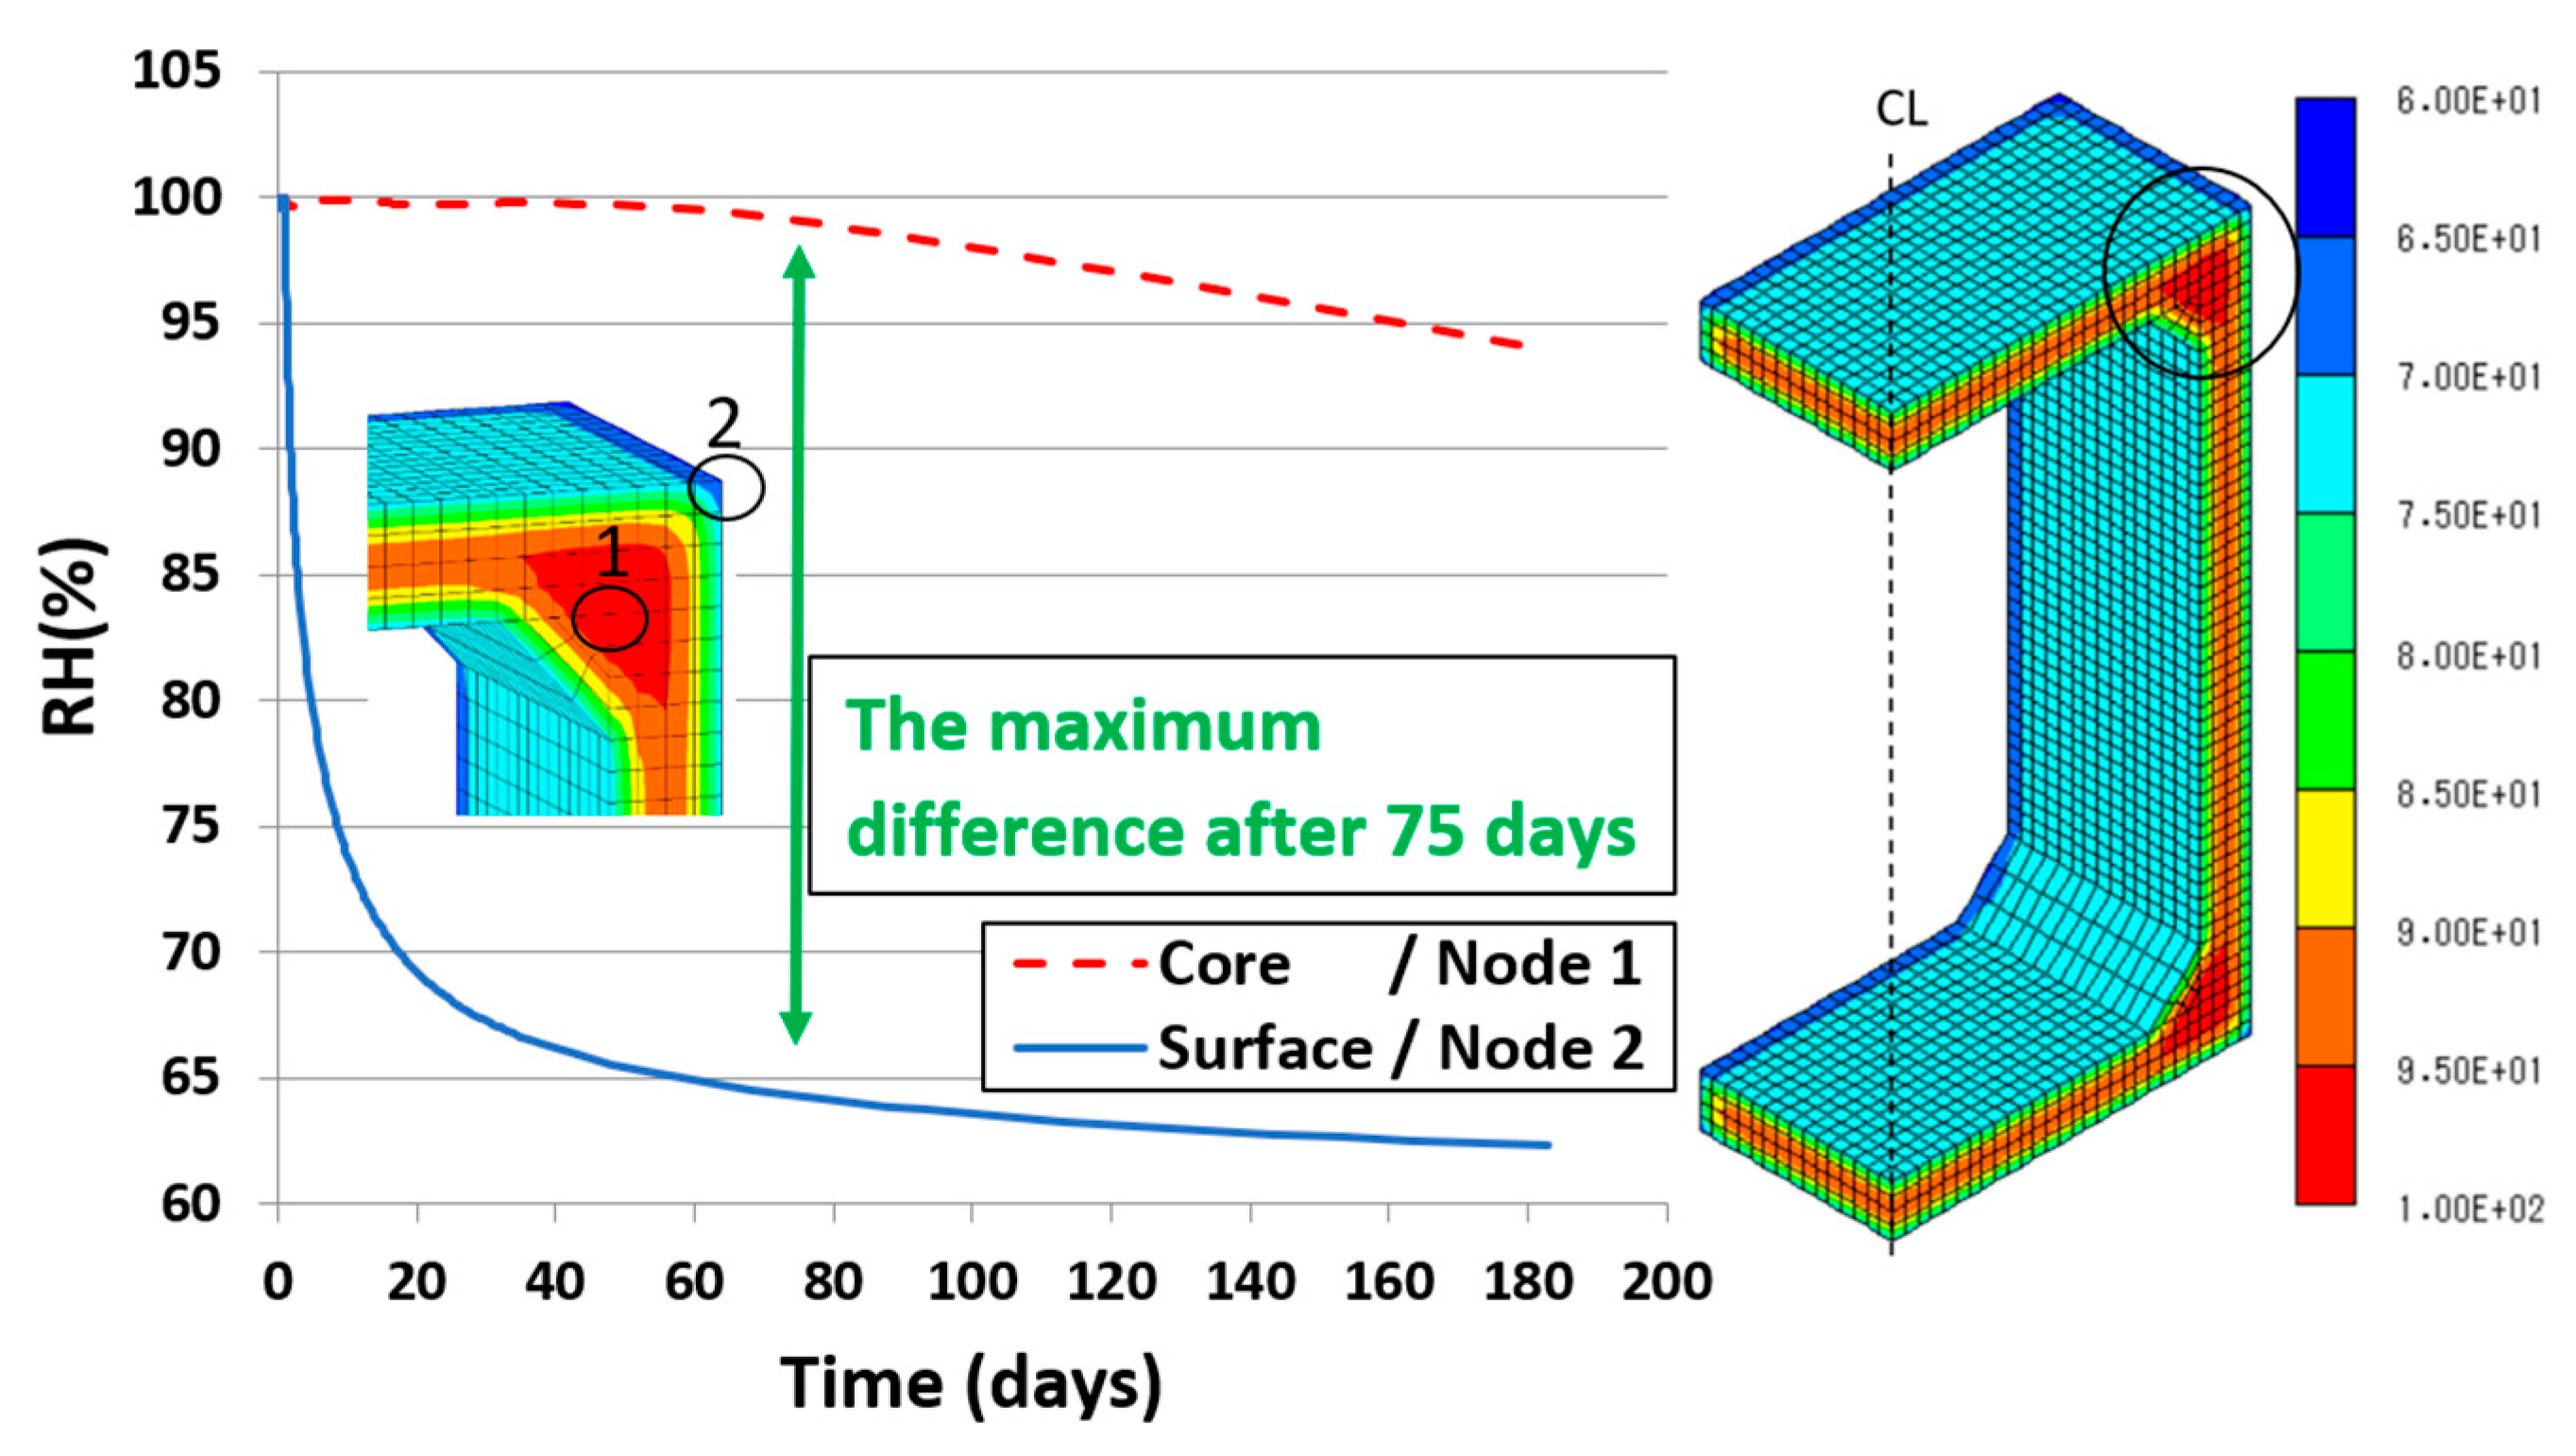
Figure 15 shows the concrete humidity changes on the outside surface and in the core of the concrete member. During this time, the relative humidity of the surface will decrease rapidly. The difference in relative humidity between the surface and the core was at its maximum value at the time of 75 days from the beginning of the process. In general, the surface of the concrete loses moisture much faster than the internal parts of the concrete member, internal restrain due to differential humidity will lead to the tensile stresses on the surface of the concrete element.
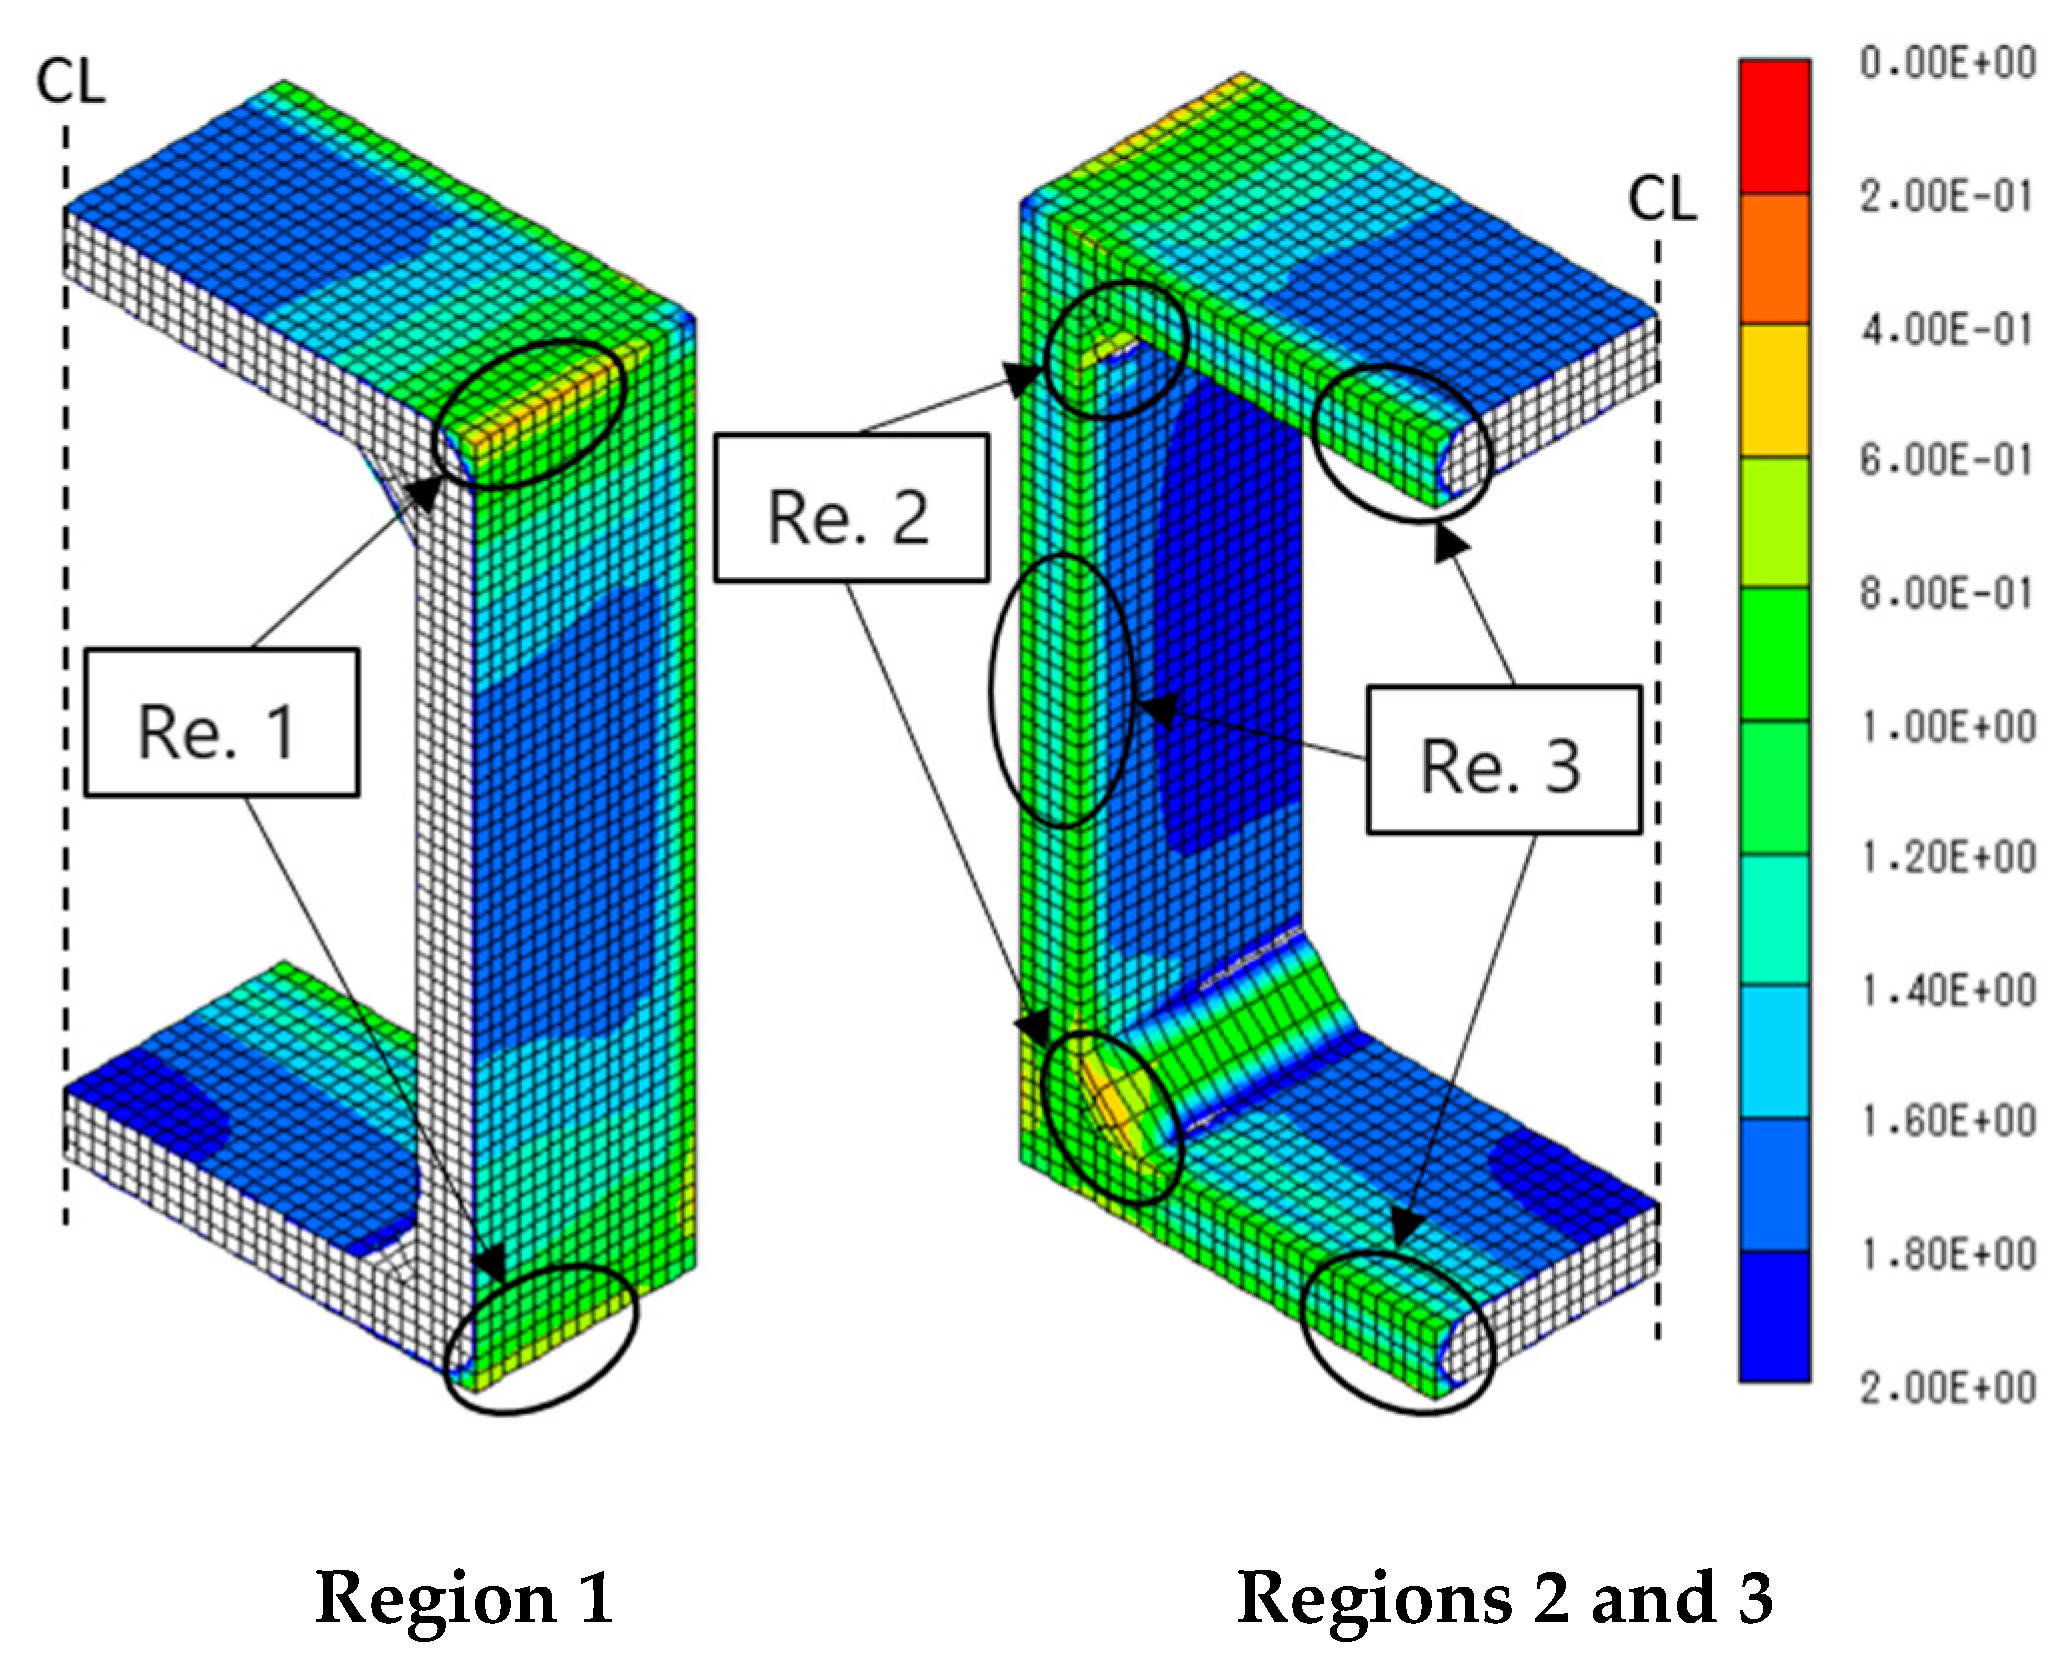
Figure 16 shows the minimum cracking index considering the drying shrinkage in which the critical region (Region 1) shown in Figure 15, and another two critical regions (2 and 3) are shown.
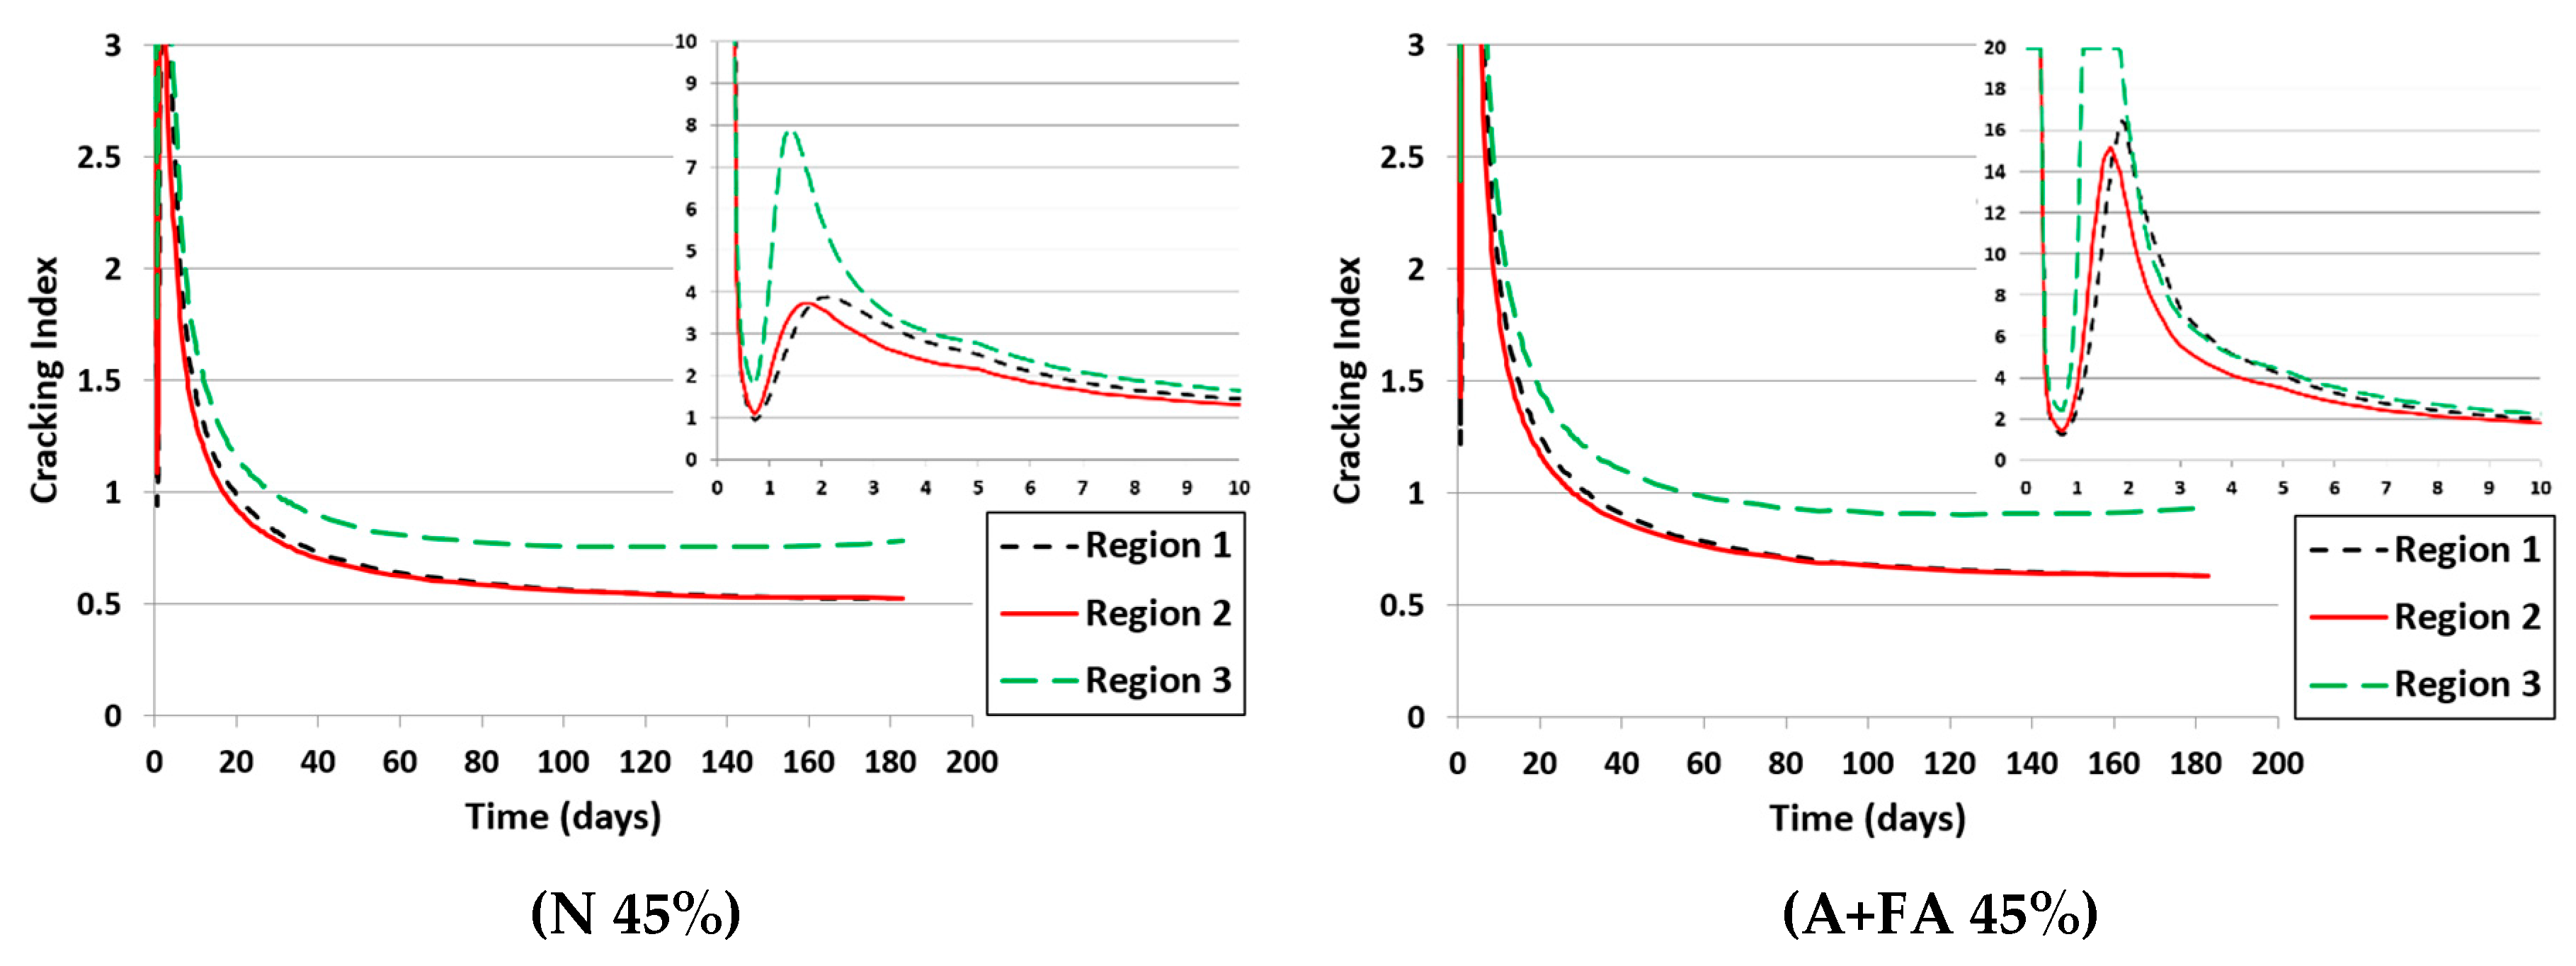
Figure 17 shows the cracking index changes by time. It can be seen that cracking index has reached the minimum values after 180 days, regions 1 and 2 had the same final values (Icr =0.63) and (Icr =0.0.52) for (A+FA 45%) and (N 45%) respectively, the values for region 3 were (Icr =0.91) and (Icr =0.75) for (A+FA 45%) and (N 45%) respectively. As a result, it can be said that cracking resistance with high alite cement with modified fly ash was higher than it was with OPC, but cracking probability may be very high for both mix proportions as well since the cracking index is much lower than 1.0.
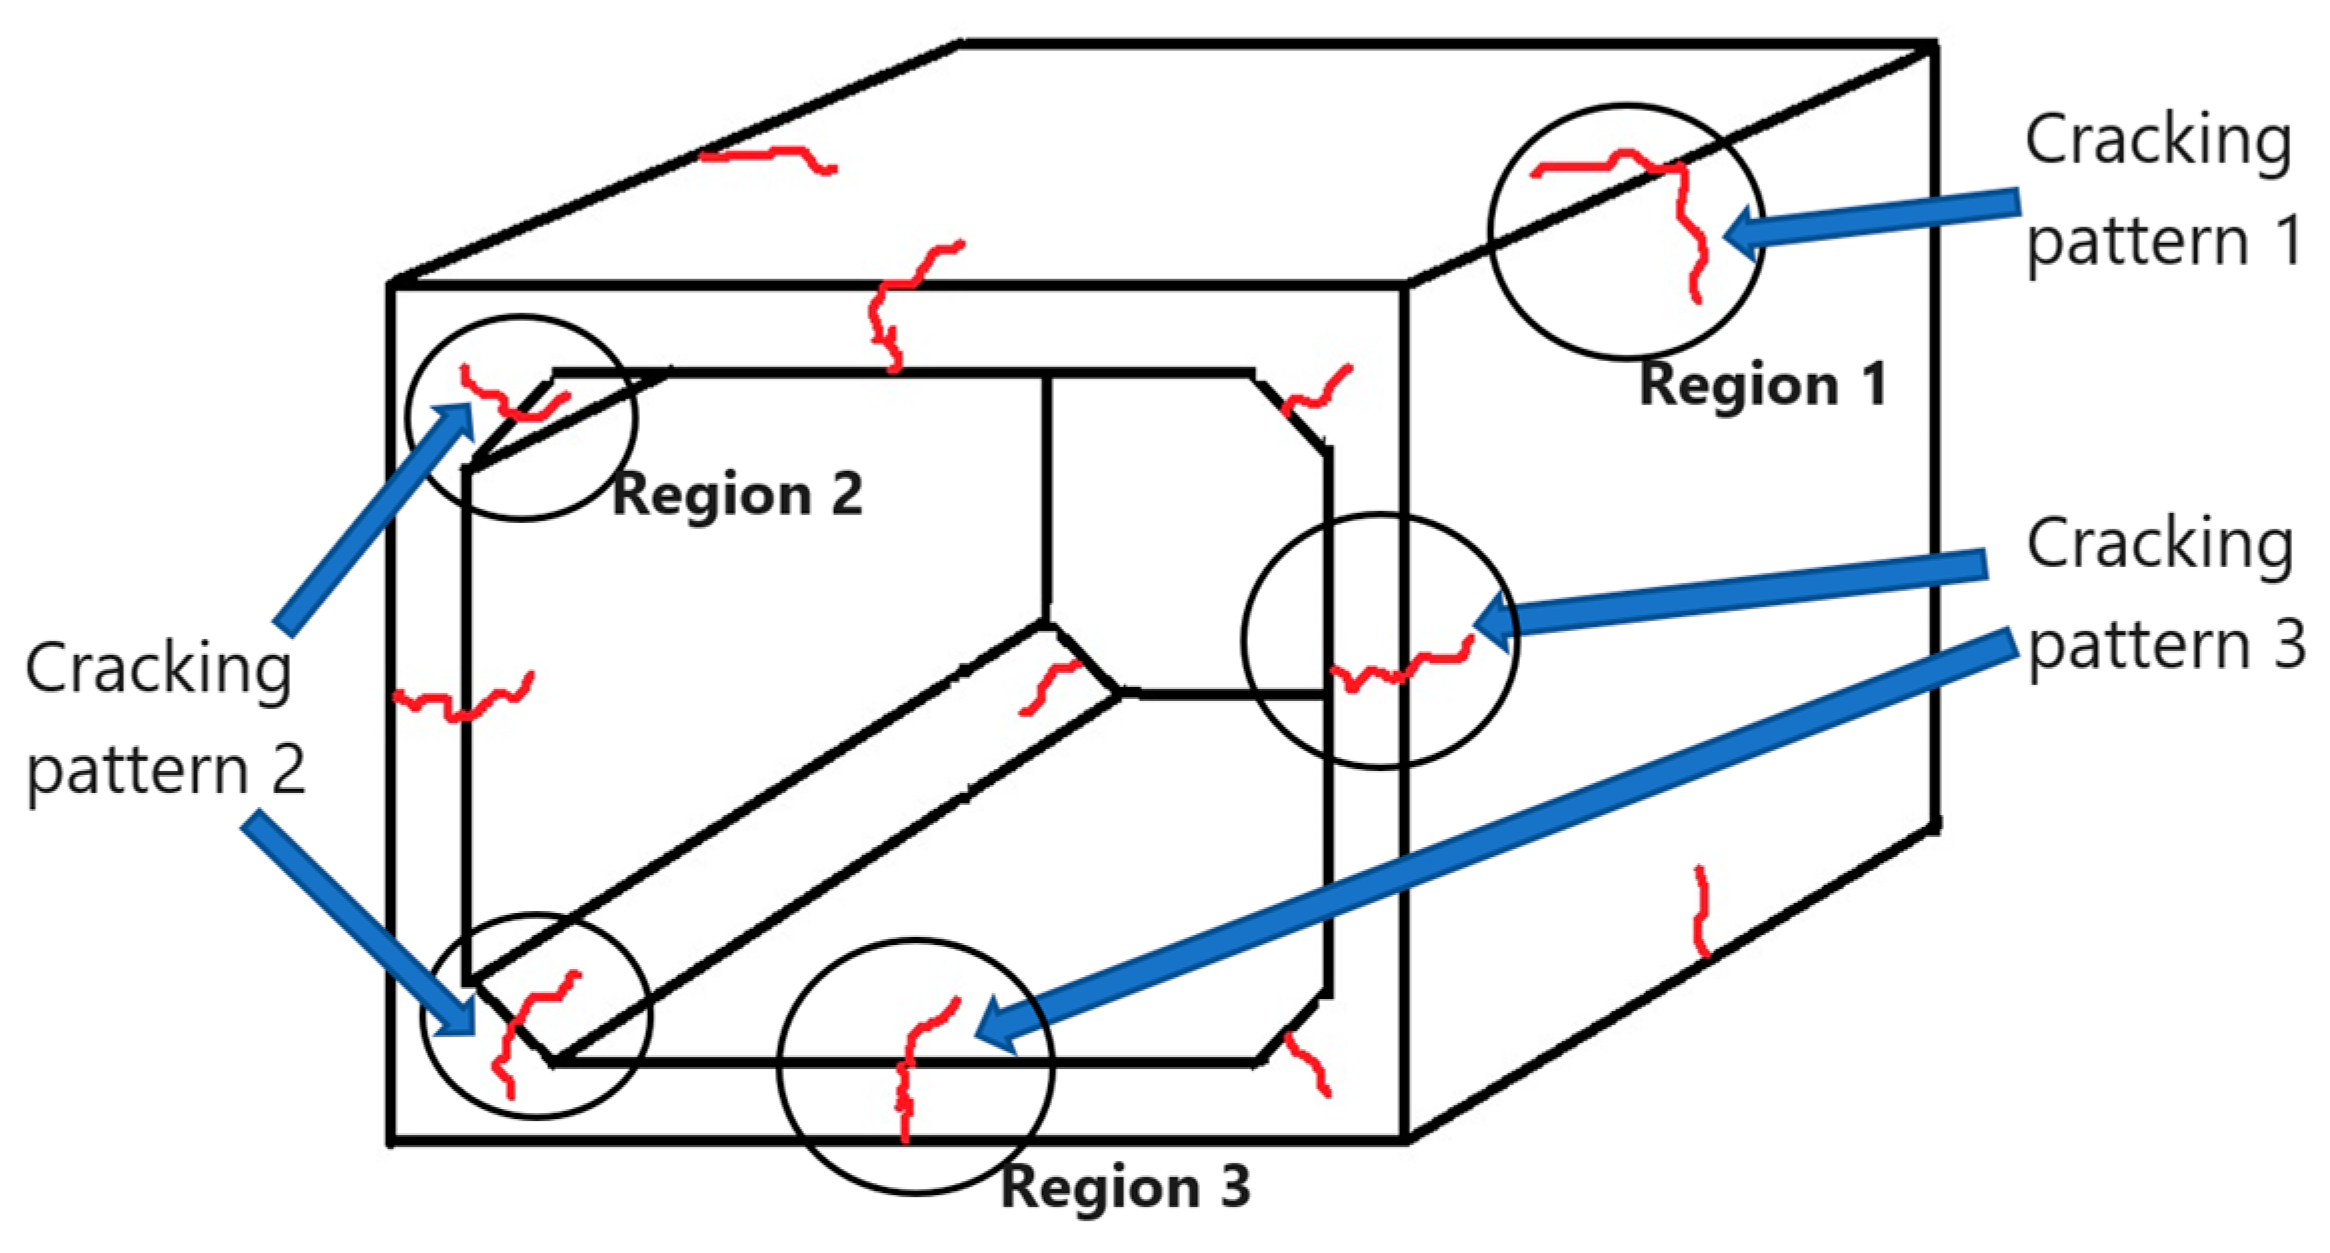
In the FEM analysis used, the directions of the maximum tensile stresses in the critical regions are also given. Therefore, cracking patterns can be predicted since the cracks will be developed perpendicular to the directions of the tensile stresses. It is also shown from the FEM analysis that, other patterns, (2 and 3) will appear on the outside edges of the concrete member in addition to cracking pattern 1 as shown in Figure 18.
Table 5 shows the summary of the results for the minimum cracking index including the results in 4.2. During steam curing, the value of cracking index for the concrete with the proposed modified fly ash cement was more than 1.0, it can be said that there will not be a high probability of cracking. On the other hand, cracking index for OPC concrete was less than 1.0, so the probability of cracking is higher relatively due to thermal strain. After steam curing process, the values of cracking index were much lower than 1.0 for A+FA and OPC, especially in regions 1 and 2, so it can be said that there will be a very high probability of cracking development due to drying shrinkage strain. It can be noticed that cracking resistance was always higher with high alite cement with modified fly ash (A+FA) than with ordinary Portland cement (N).
Table 5. The minimum cracking index.
Mix Proportion During steam curing After steam curing up to 6 months
Region 1 Region 1 Region 2 Region 3
N 45% 0.89 0.52 0.52 0.75
A+FA 45% 1.15 0.63 0.63 0.91

5. Conclusions

  • Steam-cured concrete with modified fly ash and high alite cement develops higher compressive strength on the first day of age than concrete with ordinary Portland cement.
  • There are no big differences in the modulus of elasticity between the steam-cured concrete and the underwater-cured concrete regardless of fly ash addition.
  • The concrete with fly ash has larger drying shrinkage values than the normal concrete when (W/B=33%), but when (W/B=45%) the drying shrinkage of the concrete with fly ash was less than it was in the concrete with (N).
  • It is proved from FEM stress analysis for a steam-cured box culvert that the effect of autogenous shrinkage on cracking probability was very small, it can be said that thermal shrinkage was the dominant factor for generating internal stresses in the concrete at the early age, On the other hand, drying shrinkage was dominated at later ages due to decrease of internal humidity of the concrete.
  • Using the proposed fly ash cement with high alite cement and modified fly ash improves the cracking resistance of the precast concrete box culvert more than OPC during steam curing process.
  • After steam curing, drying shrinkage is the main cause of cracking in the precast concrete box culvert at later ages regardless of the type of binder.

Author Contributions

S.M., A.A., N.N., R.K., and E.S. conceived and designed the experiments; A.A., S.M., N.N., and R.K. performed the experiments; A.A., S.M., and E.S. analyzed the data; A.A. and S.M. contributed to manuscript preparation and participated in revising the article critically for important intellectual content. All authors have read and agreed to the published version of the manuscript.

Acknowledgments

The study was carried out as the activity of “Technical Committee on AFC for Precast Concrete”. The authors express sincere gratitude to the parties concerned. Also, the first author expresses his great gratitude to the Japan International Corporation Agency (JICA), the JELA foundation, and The Kubota Fund, for supporting him during his journey.

References

  1. Sugandha, S.; Manas, K.G.; Kamal, K.K. Extraction of Unburned Carbon from Coal Fly Ash. Handbook of Fly Ash. 2022, 403–449. [Google Scholar]
  2. Sakai, E.; Umetsu, M.; Matsuzawa, K.; Kuga, R. Properties of Fly Ash Treated by Electrostatic Belt Separation Method. Cement Science and Concrete Technology 2019, 73, 65–70, in Japanese. [Google Scholar] [CrossRef]
  3. Habeeb, G.; Zainab, H.; Sattar Ghali, A. Effect of Accelerated Curing on Compressive Strength of High Strength Concrete with Nano-Silica. 2015. (PDF) EFFECT OF ACCELERATED CURING ON COMPRESSIVE STRENGTH OF HIGH STRENGTH CONCRETE WITH NANO- SILICA (researchgate.net).
  4. Vollenweider, B. Various methods of accelerated curing for precast concrete applications, and their impact on short and long term compressive strength. Concrete Technology 2004, 241, 1–22. [Google Scholar]
  5. Japan Standards Association, JIS A 6201, Fly ash for use in concrete; Japanese Standards Association: Tokyo, Japan, 2012.
  6. Portland Cement Association; National Ready Mixed Concrete Association; MIT CSHub; Improving Concrete Sustainability through Alite and Belite Reactivity, MIT Concrete Sustainability Hub. September 2013. https://cshub.mit.edu/sites/default/files/documents/alite-belite-whitepaper.pdf.
  7. Benson, K.; Teng, Z.; Miyazawa, S.; Sakai, E.; Nito, N.; Hirao, H. Effect of C3S content of clinker on properties of fly ash cement concrete. Construction and Building Materials 2020, 240. Effect of C3S content of clinker on properties of fly ash cement concrete - ScienceDirect. [Google Scholar]
  8. Klemczak, B.; Jedrzejewska, A. Early age thermal and shrinkage cracks in concrete structures- Description of the problem. Chemistry 2011, 4, 35–47, (PDF) Early age thermal and shrinkage cracks in concrete structures - Description of the problem (researchgate.net). [Google Scholar]
  9. Bamforth, P.B. Early-Age Thermal Crack Control in Concrete; CIRIA C660: London, UK, 2007; Available online: https://www1.ing.unlp.edu.ar/catedras/C1130/descargar.php?secc=0&id=C0130&id_inc=54286.
  10. Mihashi, H.; de Barros Leite, J.P. State-of-the-art report on control of cracking in early age concrete. J. Adv. Concr. Technol. 2004, 2, 141–154, State-of-the-Art Report on Control of Cracking in Early Age Concrete (jst.go.jp). [Google Scholar] [CrossRef]
  11. Klemczak, B.; Maciej, B.; Maciej, P.; Aneta, ĩ. Analysis of cracking risk in early age mass concrete with different aggregate. Procedia Eng. 2017, 193, 234–241, Analysis of Cracking Risk in Early Age Mass Concrete with Different Aggregate Types - ScienceDirect. [Google Scholar] [CrossRef]
  12. Japanese Standards Association. JIS R 5210: Portland Cement; Japanese Standards Association: Tokyo, Japan, 2009. [Google Scholar]
  13. Japanese Standards Association. JIS A1108: Method of Test for Compressive Strength of Concrete; Japanese Standards Association: Tokyo, Japan, 2006. [Google Scholar]
  14. ASTM International. ASTM C39/C39M-18: Standard Test Method for Compressive Strength of Cylindrical Concrete Specimens; ASTM International: West Conshohocken, PA, USA, 2018. [Google Scholar]
  15. Japan Society of Civil Engineers. Recommendation for Construction of Self-Compacting Concrete; Technical Session: Recommendations and Materials: Tokyo, Japan, 1998; pp. 417–437. [Google Scholar]
  16. Cement Concrete and Aggregates Australia. Drying Shrinkage of Cement and Concrete; Cement Concrete and Aggregates Australia: Sydney, Australia, 2002. [Google Scholar]
  17. Japan Concrete Institute. Guidelines for Control of Cracking of Mass Concrete; Japan Concrete Institute: Tokyo, Japan, 2016. [Google Scholar]
  18. Jang, I.; Maruyama, I. Numerical Predication of crack width in massive concrete member due to heat of hydration. CONCRACK 2017, 5, 91–100. [Google Scholar]
  19. Japanese Standards Association. JIS A 5372: Precast reinforced concrete products; Japanese Standards Association: Tokyo, Japan, 2016. [Google Scholar]
  20. K. Nijs, K.; Ishikawa, M. Finite Element Implementation of a Drying Shrinkage Model Based on Pore Evaporation Mechanics, High Tech Concrete: Where Technology and Engineering Meet; Springer International Publishing AG, 2018; pp. 49–55. [Google Scholar]
  21. Tazawa, E.; Miyazawa, S. Tensile and flexural strength of cement mortar subjected to non-uniform self-stress. Magazine of Concrete Research 1992, 161, 241–248. [Google Scholar] [CrossRef]
  22. Japan Concrete Institute. Guidelines for Modulus of elasticity; Japan Concrete Institute: Tokyo, Japan, 2016. [Google Scholar]
  23. Architectural Institute of Japan. State of the Report on High Strength Concrete; Architectural Institute of Japan: Tokyo, Japan, 2009. [Google Scholar]
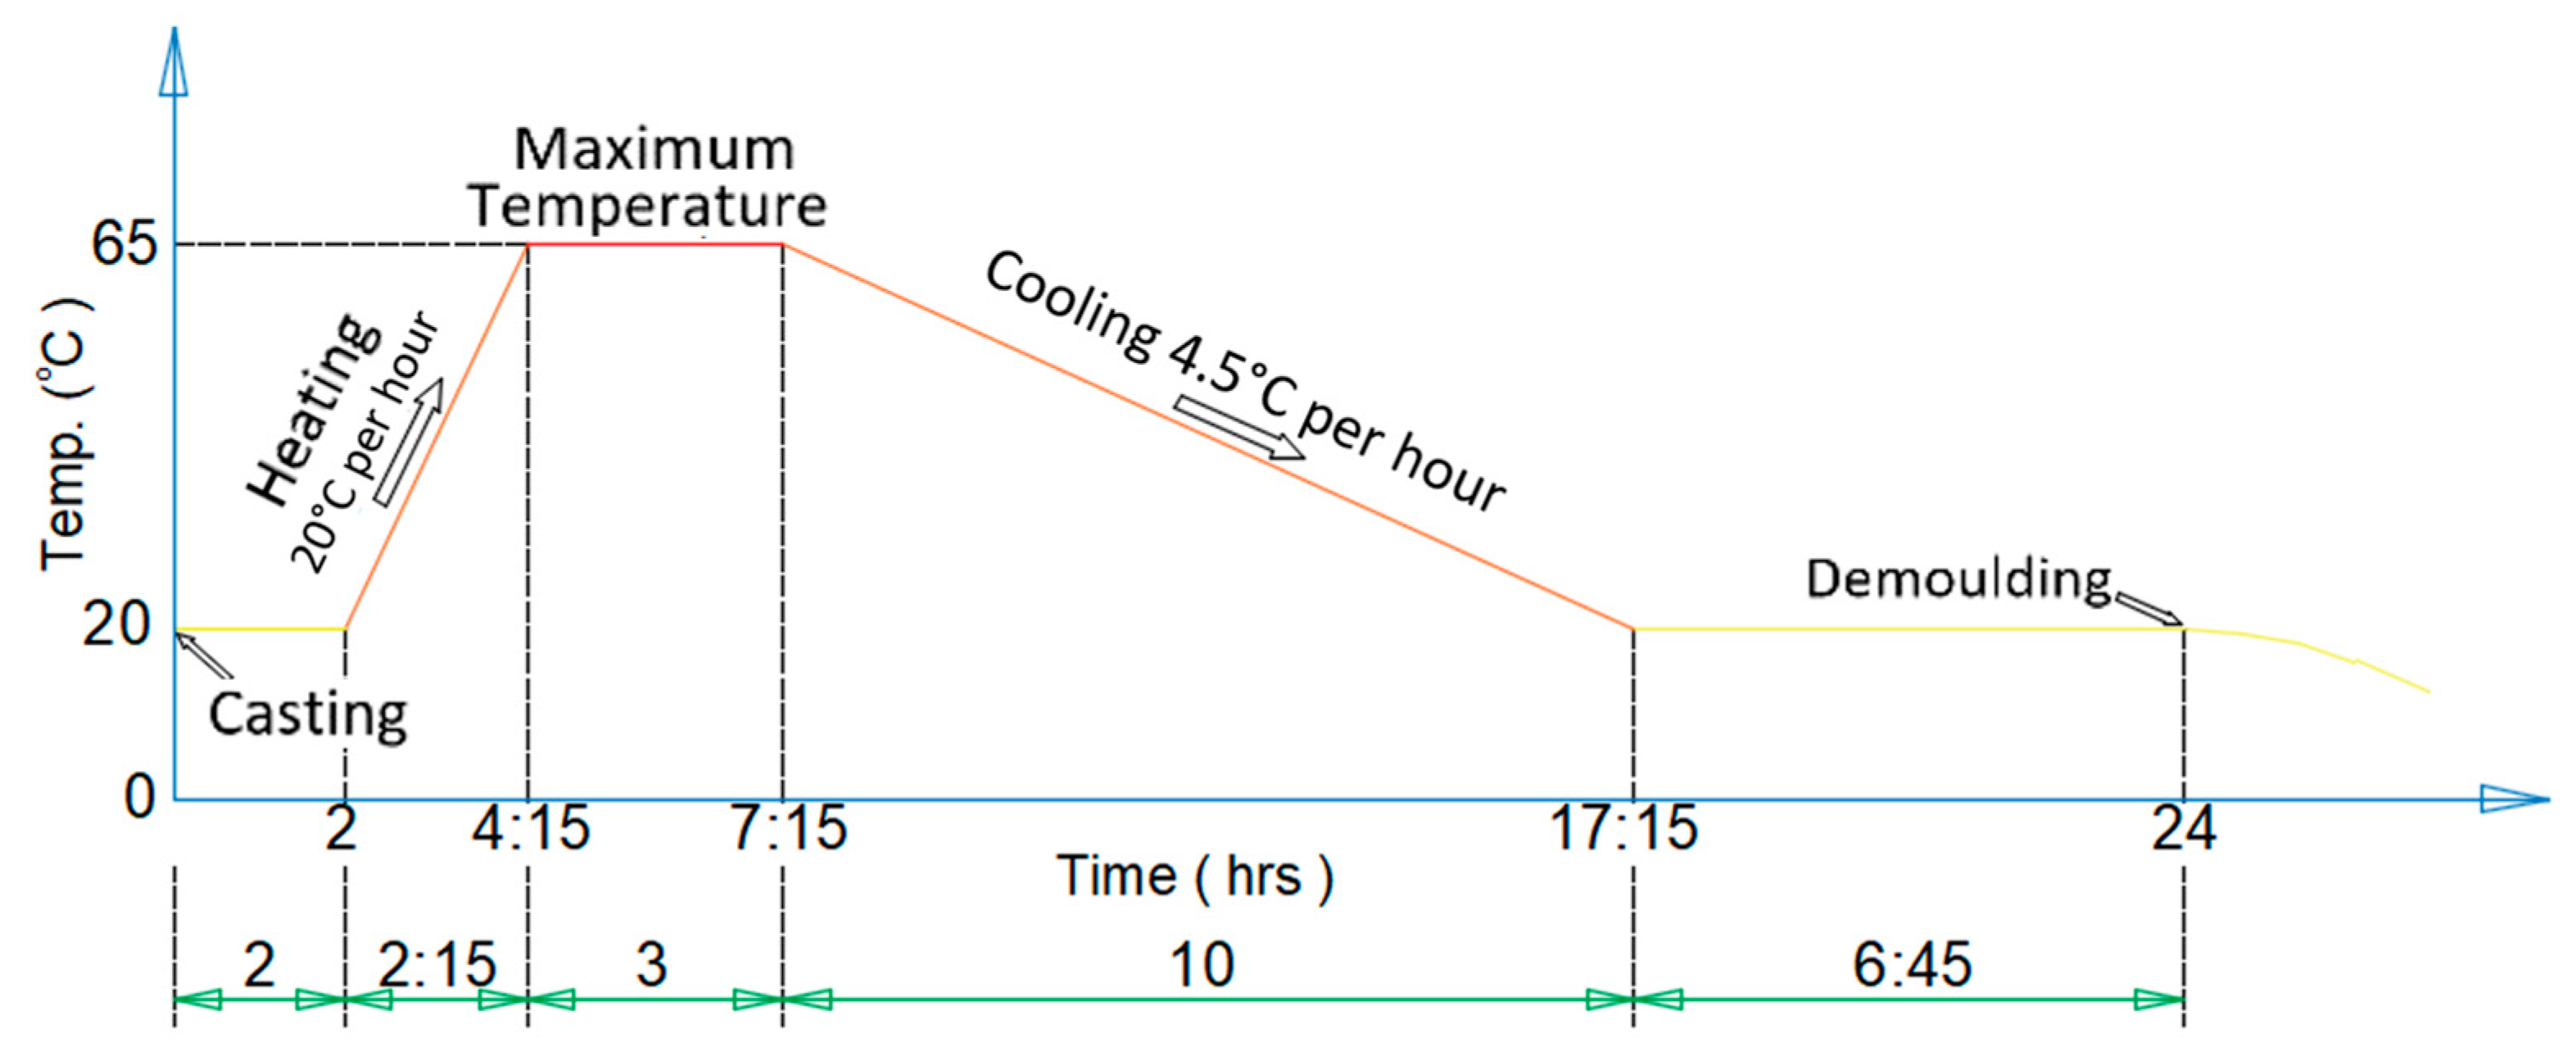
Figure 1. Steam curing temperature history.
Preprints 85684 g001
Figure 2. Steel mold for concrete specimen with a strain gauge in the center.
Preprints 85684 g002
Figure 3. The actual dimensions of the box culvert and quarter portion Drawing not to scale (Dimensions in millimeters).
Preprints 85684 g003
Figure 4. Temperature History of Steam Curing.
Preprints 85684 g004
Figure 5. Compressive Strength.
Preprints 85684 g005
Figure 6. Modulus of Elasticity.
Preprints 85684 g006
Figure 7. Autogenous Shrinkage.
Preprints 85684 g007
Figure 8. Drying Shrinkage.
Preprints 85684 g008
Figure 9. Adiabatic temperature rise due to heat of hydration.
Preprints 85684 g009
Figure 10. temperature profile at the surface and the core.
Preprints 85684 g010
Figure 11. Cracking index diagram.
Preprints 85684 g011
Figure 12. Thermal cracking index for the critical region.
Preprints 85684 g012
Figure 13. Maximum principle stresses in the critical region.
Preprints 85684 g013
Figure 14. Cracking pattern in the first stage.
Preprints 85684 g014
Figure 15. Concrete humidity (W/B=45%).
Preprints 85684 g015
Figure 16. The minimum cracking index considering drying shrinkage.
Preprints 85684 g016
Figure 17. Thermal cracking index for the critical regions.
Preprints 85684 g017
Figure 18. cracking patterns in the second stage.
Preprints 85684 g018
Table 1. Physical and chemical properties of cement.
Name Density
(g/cm3)
Blaine fineness
(cm2/g)
f.CaO
(%)
Mineral composition (%)
C3S C2S C3A C4AF
A 3.11 5380 2.1 69.3 2.9 9.4 7.7
N 3.16 3170 0.2 61.6 15.1 8.2 9.1
(A) high alite cement, (N) ordinary Portland cement OPC.
Table 2. Physical and chemical properties of Fly Ash.
Name Density
(g/cm3)
Blaine fineness
(cm2/g)
SiO2
(%)
Ig. Loss
(%)
Flow percent of control (%) Methylene blue adsorption (mg/g) Strength Activity Index (%)
7days 28days 91days
FA-1 2.24 3900 59.7 5.2 101 1.96 74 82 92
FA-2 2.25 4030 63.9 0.8 106 0.53 78 85 97
FA 2.19 3490 65.3 0.9 106 0.33 74 84 99
Table 3. Mix proportions of concrete.
Proportion W/B
(%)
s/a
(%)
Amounts of contents (kg/m3) Chemical Admixture (B X %)
Water N A FA S G SP AE303 AE785
N 45% 45 45 160 356 795 993 0.8 0.001
A+FA 45% 45 160 292 64 783 977 0.75 0.03
N 33% 33 43 160 485 715 967 0.88 0.0015
A+FA 33% 43 160 398 87 699 946 0.8 0.035
(W) Water, (B) Binder, (S) Sand, (G) Corse Aggregates, (a) Volume of aggregate
Table 4. Physical properties of Aggregates.
Aggregates Provenance Maximum size
(mm)
Density
(g/cm3)
Absorption
(%)
Fineness modulus
Coarse aggregates (a) Sandstone from Kuzu region 20 2.62 0.76
Fine aggregates (sand) River sand from Kinugawa river 2.60 2.11 2.75
Table 5. Fresh properties of concrete.
Proportion W/B
(%)
Fresh Properties
Slump (cm) Air content (%) Temperature at casting (°C)
N 45% 45 12.2 5.4 18.0
A+FA 45% 11.4 5.2 18.5
N 33% 33 13.1 4.7 18.5
A+FA 33% 11.6 4.3 18.0
(A) high alite cement, (N) ordinary Portland cement OPC, (FA) fly ash
Disclaimer/Publisher’s Note: The statements, opinions and data contained in all publications are solely those of the individual author(s) and contributor(s) and not of MDPI and/or the editor(s). MDPI and/or the editor(s) disclaim responsibility for any injury to people or property resulting from any ideas, methods, instructions or products referred to in the content.
Copyright: This open access article is published under a Creative Commons CC BY 4.0 license, which permit the free download, distribution, and reuse, provided that the author and preprint are cited in any reuse.
Prerpints.org logo

Preprints.org is a free preprint server supported by MDPI in Basel, Switzerland.

Subscribe

© 2024 MDPI (Basel, Switzerland) unless otherwise stated