1. Introduction
The global hotel industry, a multi-billion-dollar sector focused on guest comfort, faces challenges related to high energy consumption [
1]. Service areas in hotels tend to consume more energy, and thermal losses occur in their public areas [
2]. The rising energy costs and increasing customer demands pose a dilemma for hotel owners who aim to balance cost reduction with maintaining service quality.
A European study by the Hotel Energy Solutions group (2011), showed that HVAC and domestic hot water (DHW) accounted for 72-75% of energy used in hotels, while lighting for 8-9%, while catering accounted for 15%. However, energy costs in hotels can be minimized by adopting excellent management practices as highlighted by Suriyaprabha and Subbiah (2016). Unachukwu and Onyegegbu (2000) in their publication on electrical energy consumption pattern of a cement company in Nigeria, defined energy conservation as it relates to energy efficiency.
This study, conducted in the University City of Nsukka, Nigeria, recognizes the need to assess and improve energy utilization in hotels. The purpose of the study is to investigate energy management practices in Nsukka hotels and benchmark their energy consumption to determine effectiveness. The objectives include assessing energy consumption, calculating energy costs, identifying wastage areas, proposing energy management recommendations, and comparing cost savings achieved through these measures.
It will pinpoint inefficiencies in energy costs and emphasize the importance of minimizing energy waste. To analyze energy use in hotels, end-use patterns are usually surveyed and energy audits are conducted Lu et al [
1]. Energy audits involve site investigations, data collection and analysis, cost-benefit ratio analysis [
2], documentation of findings, and the implementation of action plans. Data collected can be analyzed using Energy benchmarking, regression-based analysis, clustering techniques, and DEA. Energy benchmarking compares a hotel's energy performance to similar establishments [
3]. This is carried out to help improve energy efficiency or put in place better energy efficient strategies.
2. Materials and Methods
Ten hotels were selected for the study: New Ikenga Hotel, Kennan Lodge Hotel, Golden Valley Hotel, Jucony Hotel, See New Hotel, CEC Guest House UNN, Grace Manor Hotel, Old Carolina Hotel, Discovery Lodge and Jerry Marriot Hotel, all located within the Nsukka metropolis.
Data availability on energy consumption in the hotel industry in Nigeria is limited and in Nsukka, non-existent. There is no central database for periodic documentations and in most cases, hoteliers do not recognize the need for energy audits and may not have done it since inception. Thus data used in this research were generated from primary sources which included personal visitations to the selected hotels and administration of questionnaire. The questionnaire requested building information, energy indexes and building operation characteristics to quantify the energy consumption within the selected hotels. Data collected from these hotels with the aid of this questionnaire was subjected to a correlation test.
Table 1 shows the correlation between the inputs and outputs.
2.1. Benchmarking Hotel Energy Consumption using Data envelopment analysis (DEA)
The DEA as a benchmarking approach can take into consideration multiple inputs and outputs and can be used on both large and small samples of hotels [
4]. The DEA evaluates a set of decision making units (DMUs) showing how well they convert inputs to outputs. These DMUs are then located on their efficiency frontiers. For best application of the DEA approach, the minimum number of DMUs must be at least twice the sum of the total inputs and outputs [
3]. Also, all inputs must be positively correlated to at least one output [
4]. Researches conducted with application of DEA in hotels made use of different accounting and non-financial information for input variables and outputs [
4]. Katarina et al [
5] have compiled some of these influential factors. Details of energy efficiency analysis using data envelopment analysis (DEA) have been comprehensively presented in Abbas et al (2017). For the purpose of this study, we shall be applying the Constant Return to Scale (CRS) model with an input orientation which assumes that the returns to scale is constant such that all the DMUs are operating at optimal scale [
6]. The model inputs are energy use intensity (EUI), number of employees and diesel consumption, while the output is occupancy ratio. In order to get a clarify this methodology, a sample hotel, New Ikenga Hotel can be noted as ‘DMU
i’; one input, EUI, can be noted as ’j’ and one output, occupancy ratio can be noted as ’k’.
Hence, the objective is to obtain ; subject to ∀ i and vk, uj ≥ 0 ∀ k, j ; where yki = amount of output k produced by DMUi, xji = amount of input j utilised by DMUi, vk = weight given to output k, uj = weight given to input j. The DEA fractional models can be converted to a linear programming method,
subject to and ;
∀ i and vk, uj ≥ 0 ∀ k, j
3. Results and discussions
3.1. Variables for the Data Envelopment Analysis
3.1.1. Occupancy ratio
Monthly occupancy ratio data were collected from the hotels for a period of one year – 2021. DMU H2 recorded the highest mean occupancy rate of 79.75% while DMU H7 had the lowest mean occupancy ratio of 26%. Most of the DMUs recorded their highest occupancy ratios in the month of December. This may not be unrelated to the boom during the festivities at this period as it also impacted their January figures. Generally, the occupancy ratios were lowest in June and July as these are the peak of the rainy season when there is a decline in outdoor activities and occasions.
3.1.2. Energy Use Intensity
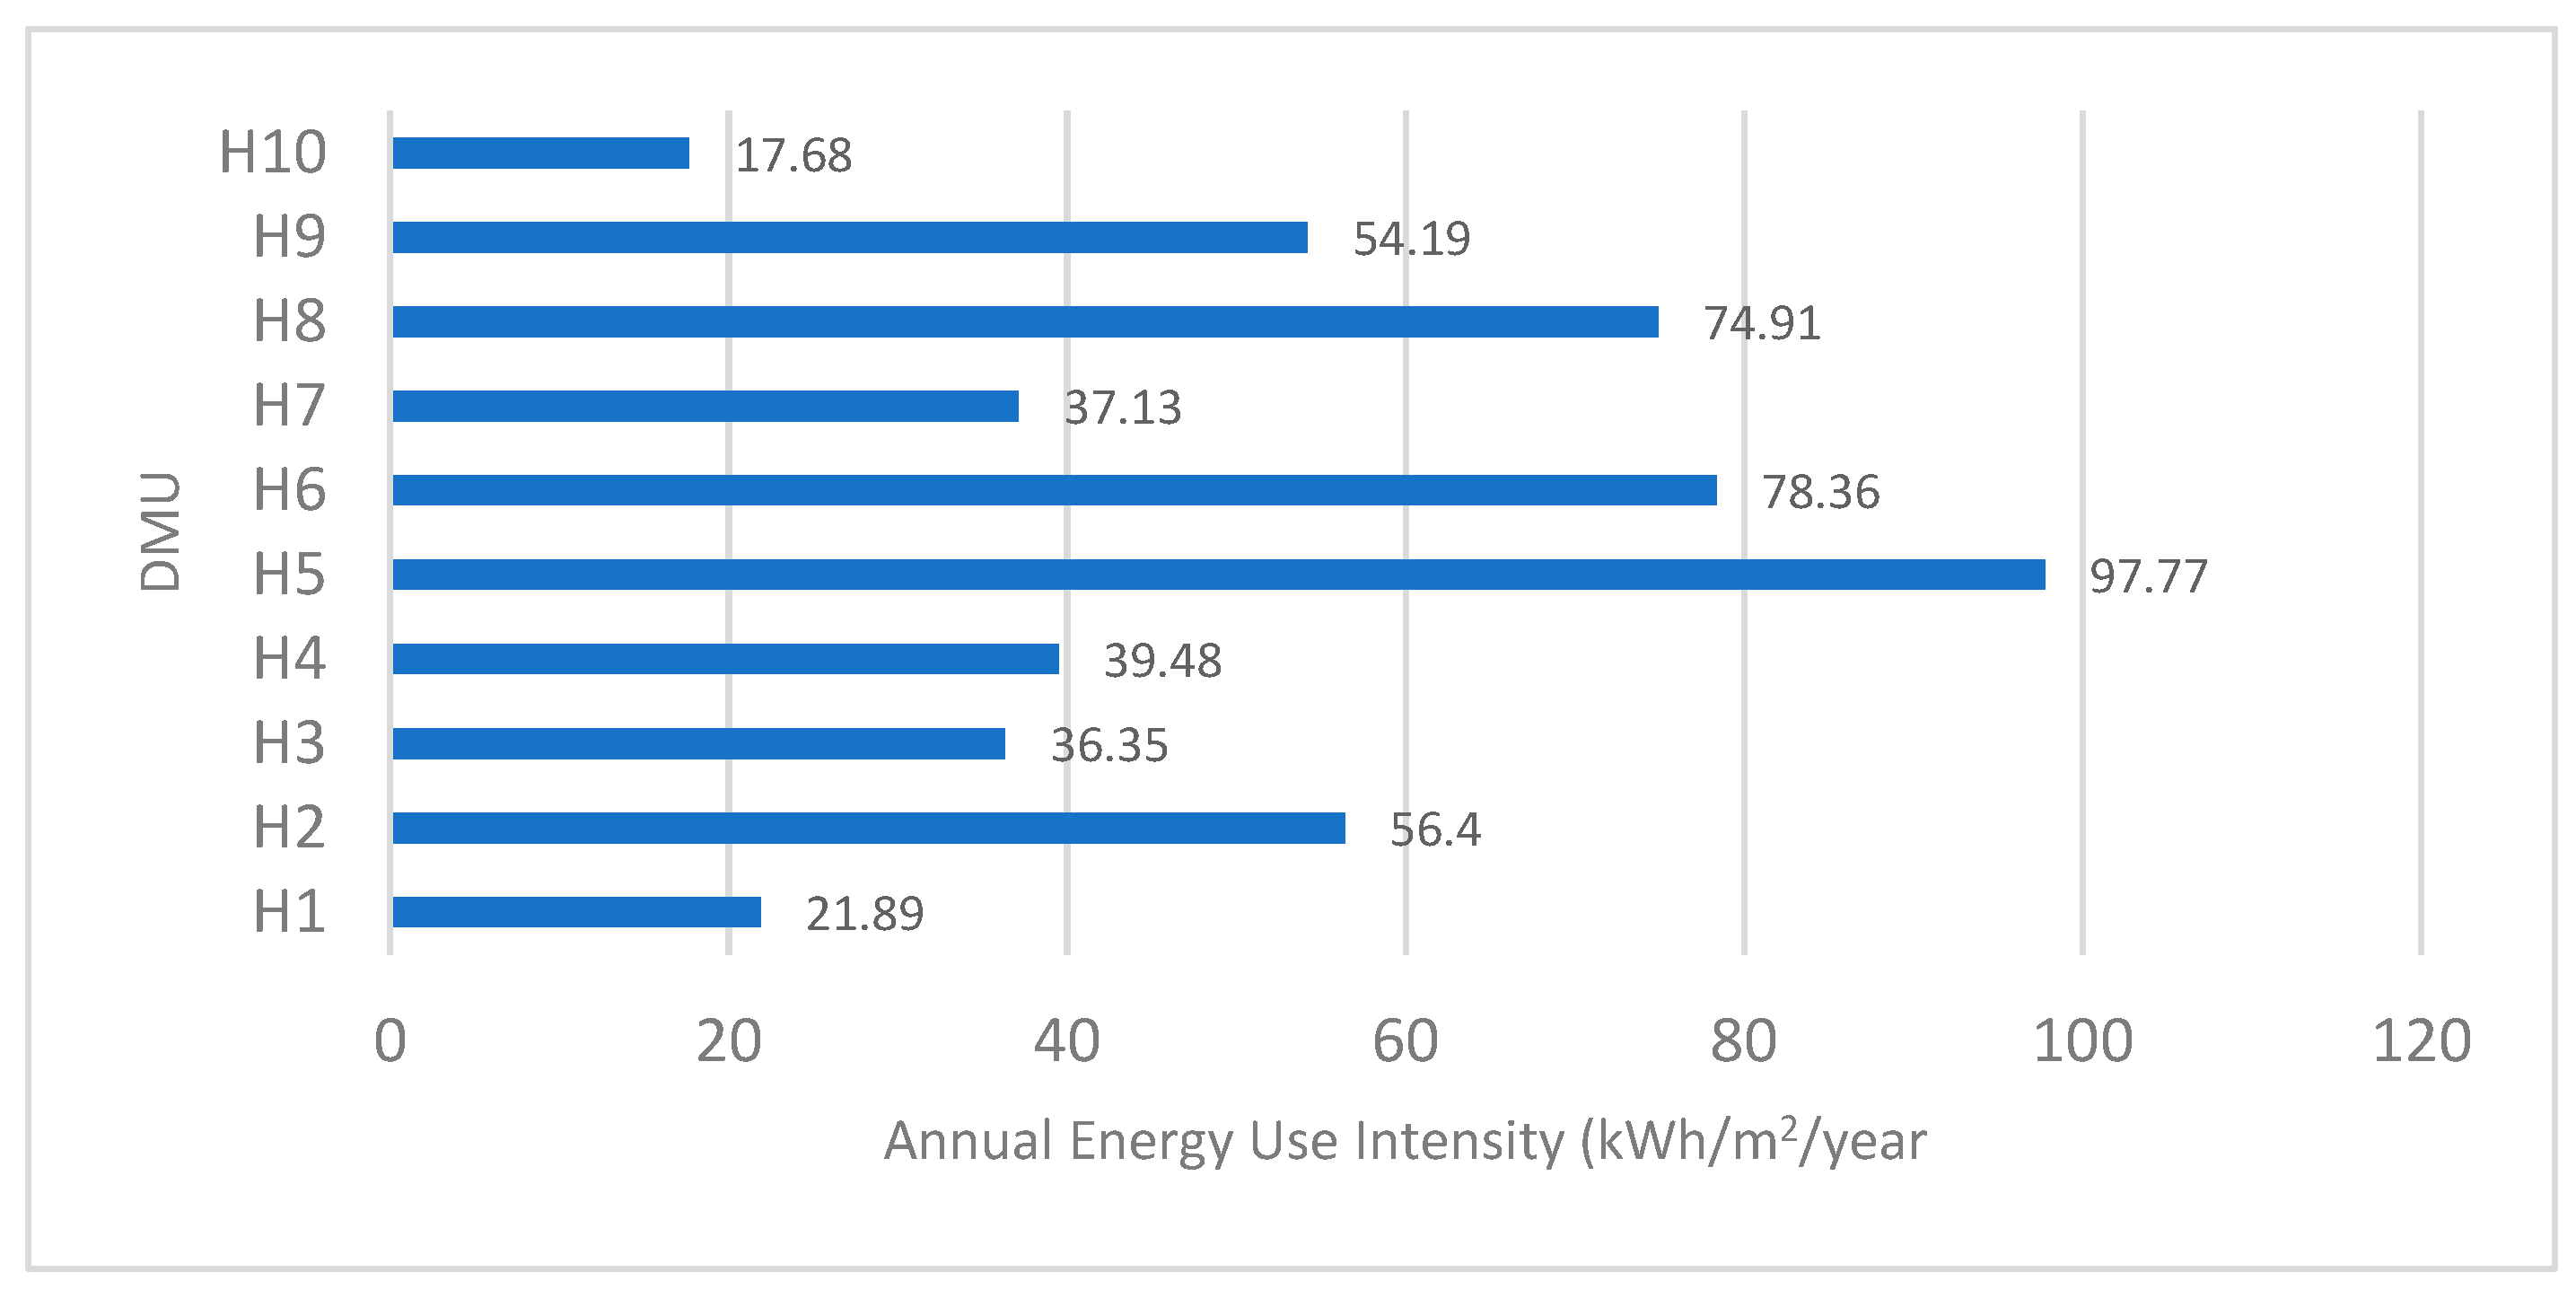
Figure 1 shows the annual EUI for the surveyed hotels. To aid a detailed analysis of the energy performances of all DMUs, the monthly EUI for each hotel was also obtained. The data collected showed that the surveyed hotels had a mean EUI of 51.42kWh/m
2/year. DMU H5 recorded the highest EUI of 97.77kWh/m2/year while the lowest EUI was recorded by DMU H10 with 17.68kWh/m
2/year. Though the EUI varied for each hotel, most of them showed that electricity consumption in January, April and December were above the mean electricity consumption. These months were also the top three in terms of the occupancy ratios. There is usually high level of activities in these periods arising from the celebration of Christmas and Easter holidays. Similarly, the consumption was lowest at end of the second quarter into the third quarter where the least occupancy ratios were recorded.
3.1.3. Diesel Consumption
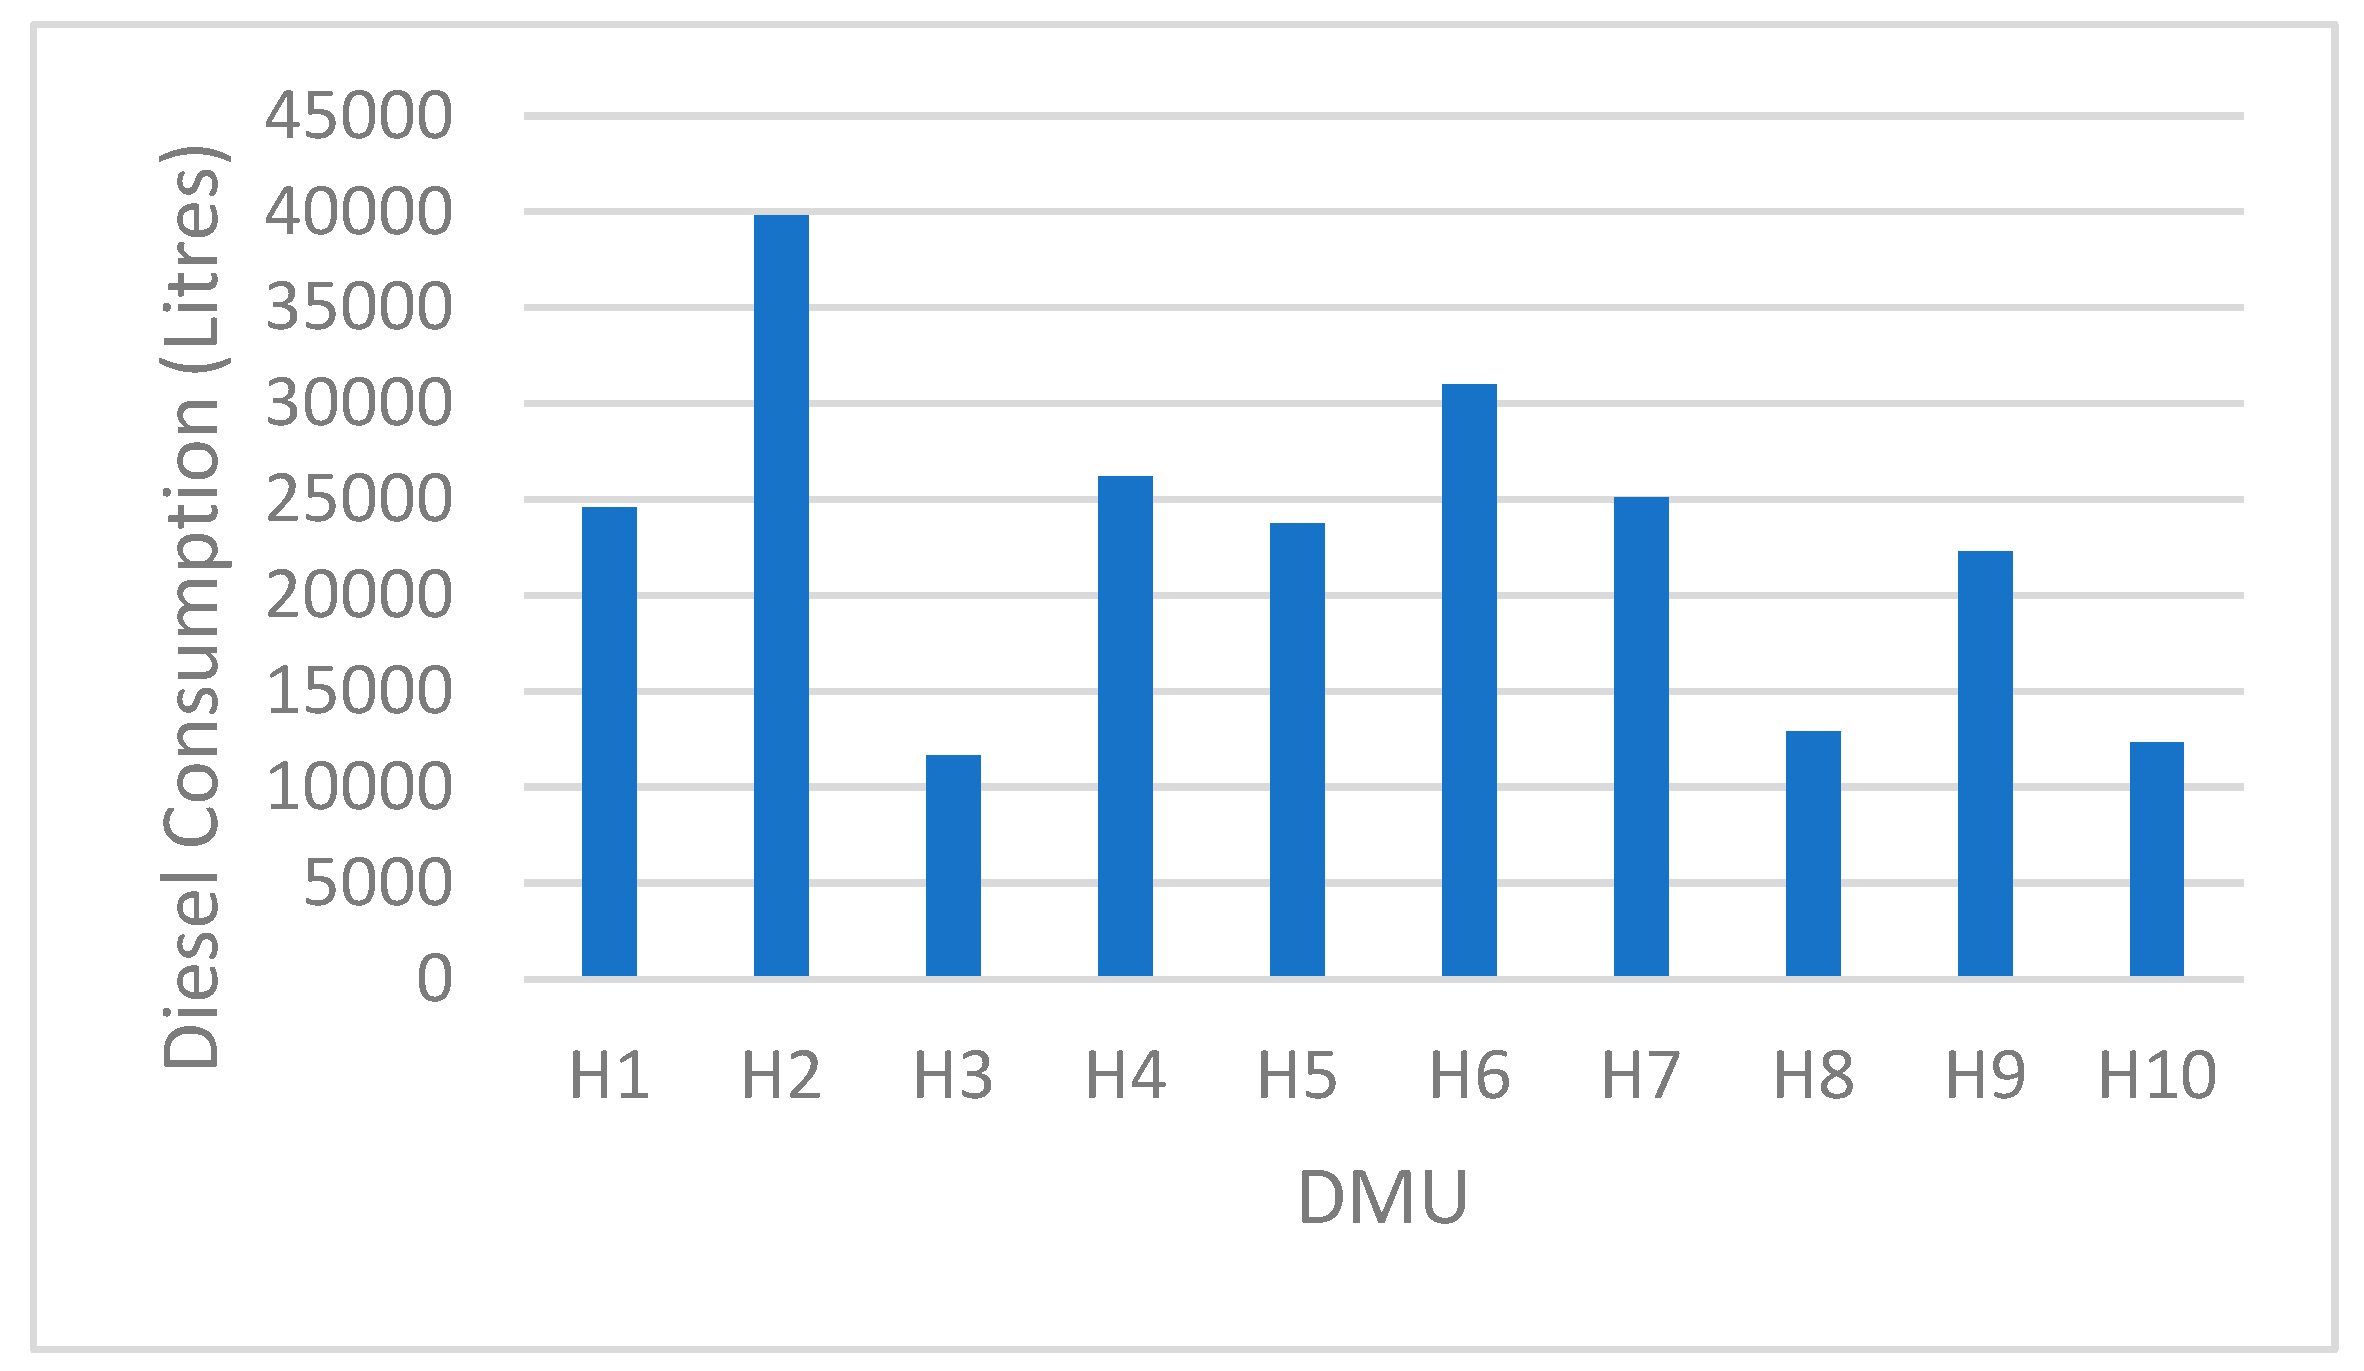
Figure 2 shows that the DMUs consumed an average of 22,970 litres of diesel for their annual operations. This quantity is higher than the diesel used by DMU H3 which has the least annual diesel consumption of 11,682 litres, DMU H2 recorded the highest diesel consumption of 39,790 litres which correlates with its high occupancy ratio.
On a monthly basis, the DMUs used the most diesel quantities in December and April where they had high average occupancy ratios of 62.3 and 57.9, respectively. It generally appeared that the quantity of diesel consumed increased as the occupancy ratios increased.
3.1.4. Number of Employee
The number of employees remained constant for all DMUs during the period this research was conducted.
3.2. Data Envelopment Analysis of Energy Efficiencies in the Surveyed Hotels
3.2.1. Technical Efficiency
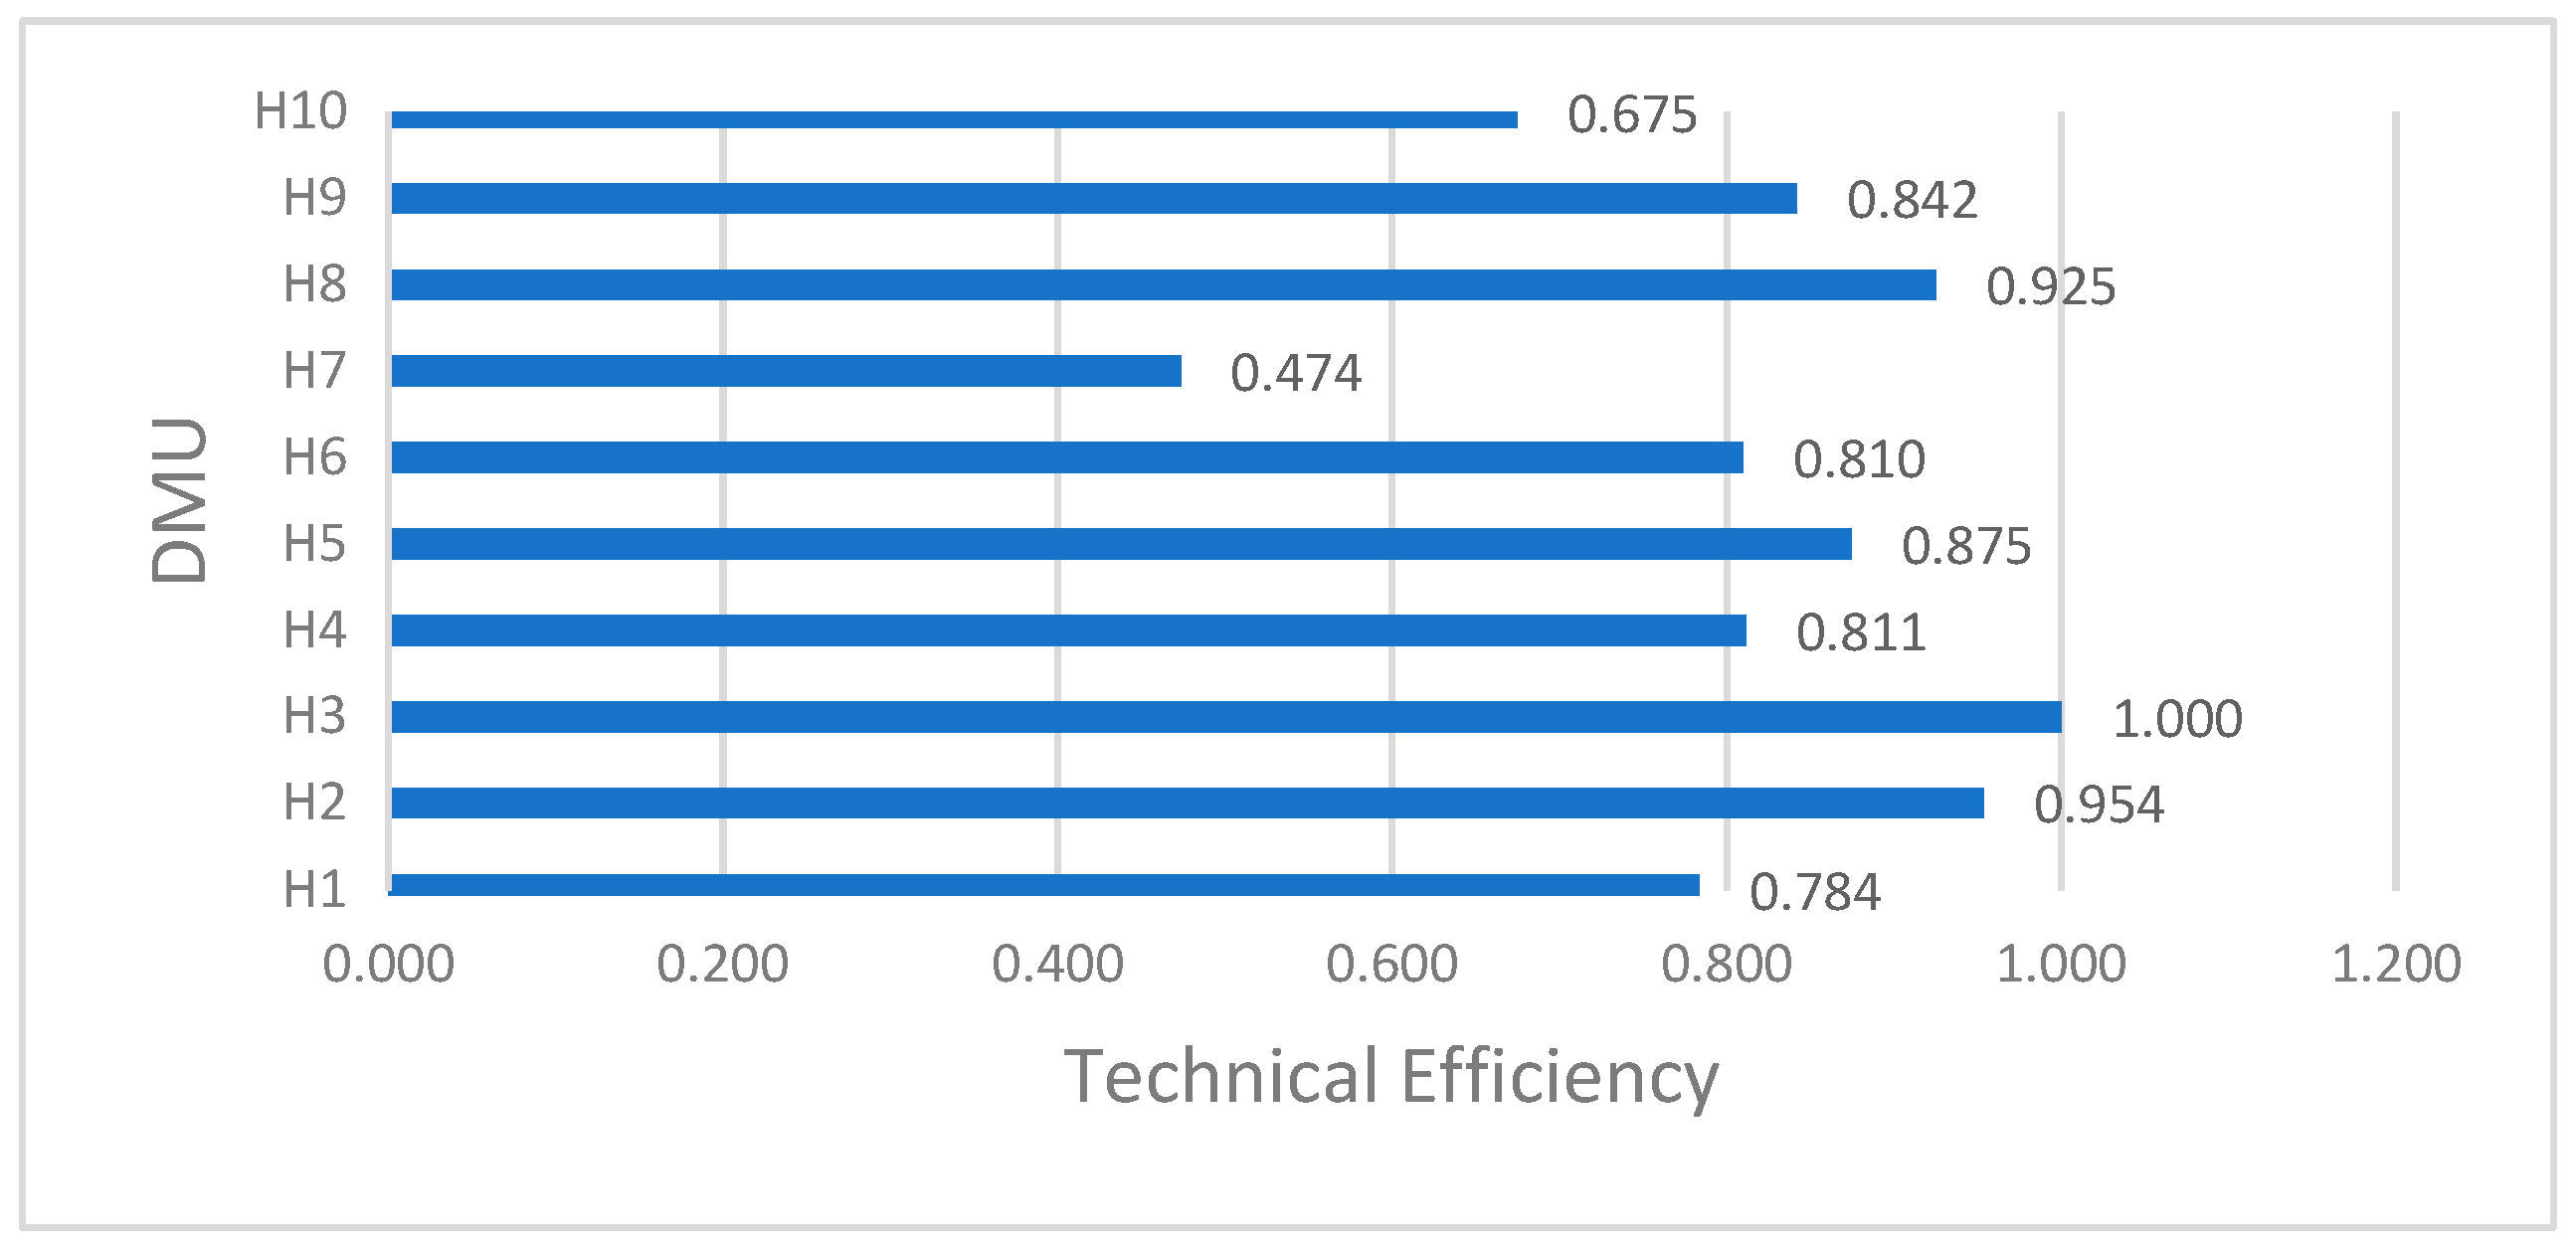
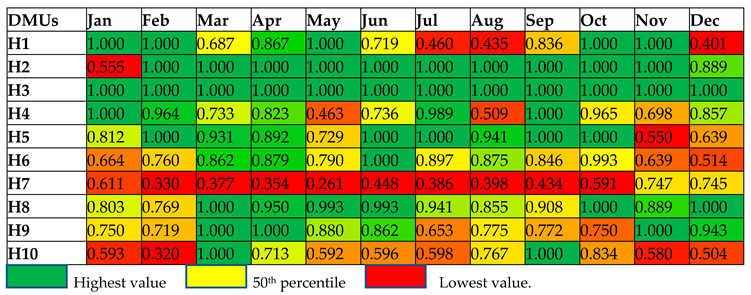
The analysis was performed with the DEAP Version 2.1 software. Input-oriented CRS multi-stage DEA modelling was used to obtain the technical efficiencies of the hotels (DMUs) over the period of twelve months as shown in
Figure 3. The technical efficiencies of the DMUs obtained for each month and the summary of peers is presented in
Table 2 and
Table 3 respectively.
Table 2 shows that for the month of January, DMUs H1, H3, and H4 had an efficiency score of 1 while DMU H2 had the least technical efficiency of 0.555. Therefore, DMU H2 needs to improve her efficiency by 44.5% to achieve the efficiency frontier in January. The model suggests that DMU H2 is peers with DMU H4 and DMU H1. A peer set indicates to an inefficient firm the firm to aspire to as a reference [
7]. Therefore, DMU H2 can become similarly efficient by following input-output trends of either DMUs H4 or H1. If the EUI, diesel consumption and number of employees of DMU H2 are adjusted to be equal to 68.3% of equivalent values for DMU H4 or 14.5% of the values for DMU H1, an efficiency score of unity will be obtained. Similarly, in the month of February, four DMUs are on the efficiency frontier while the others require varying degrees of improvement. The least efficient DMU in this month – H10, can attain an efficiency score of 1 if its inputs are adjusted to the input-output trends of its peer -DMU H3, H2 and H1. Following these observations, similar deductions can be made for the remaining months.
3.3. Potential Annual Savings from Recommended Adjustments for Surveyed Hotels
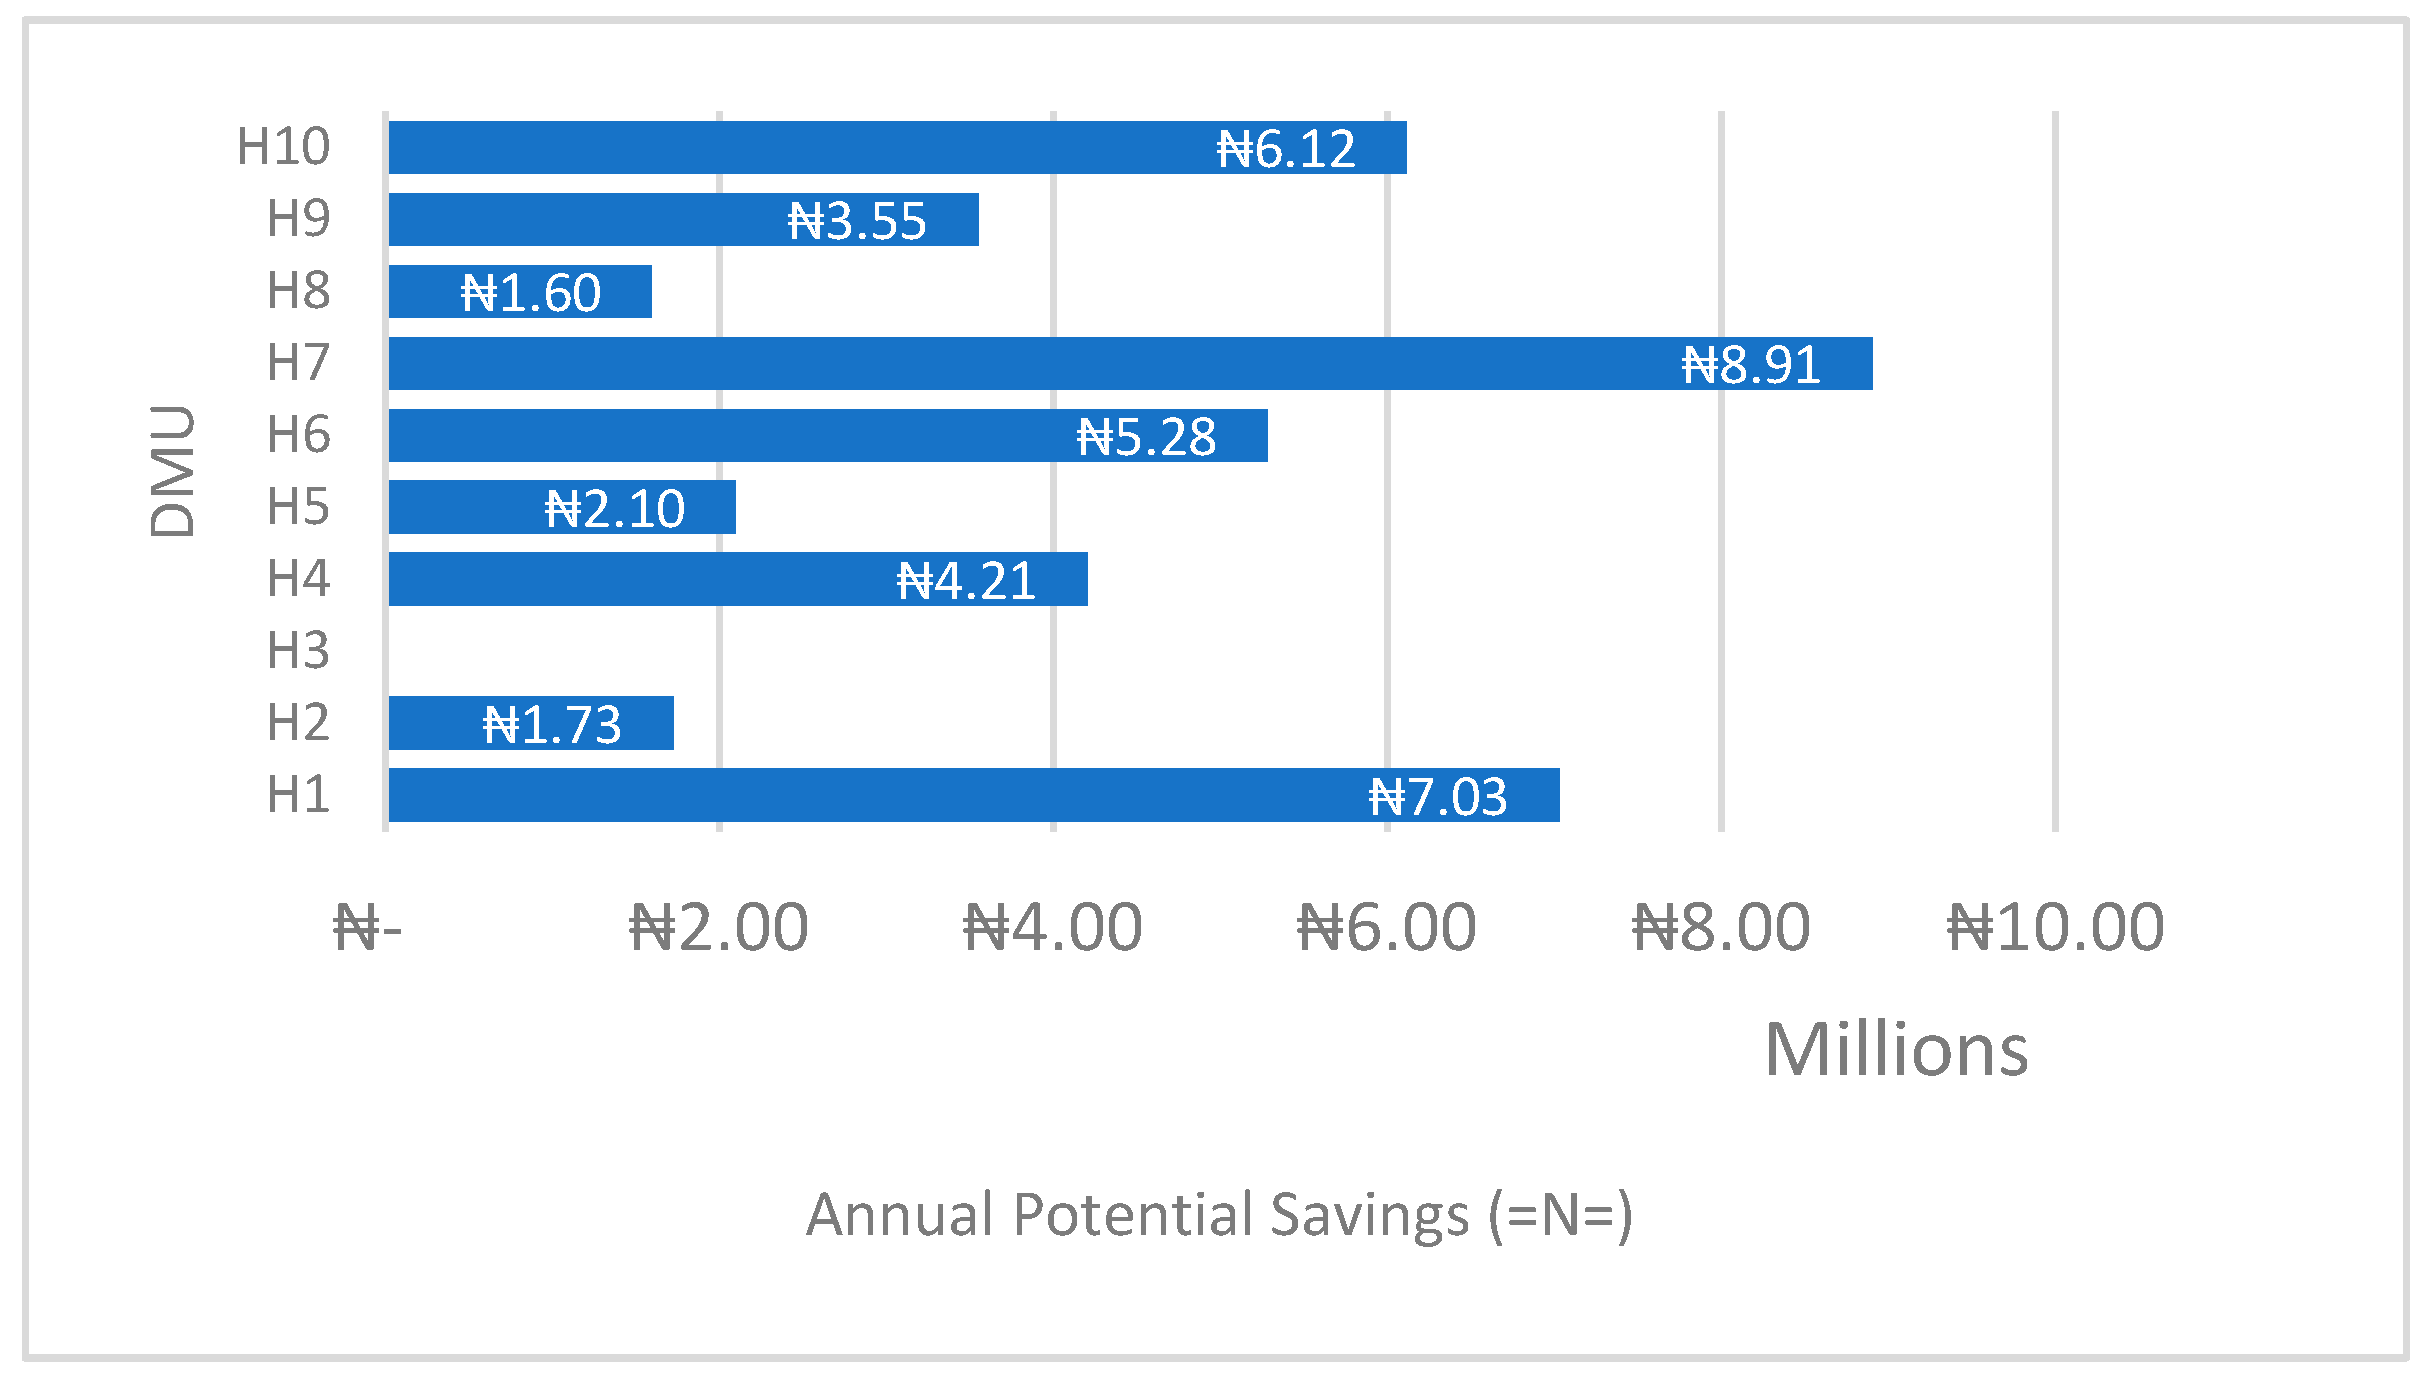
The DEA analysis showed that only DMU H3 was efficient having a technical efficiency score of 1. All other DMUs had varying degrees of inefficiencies as well as slack and radial movements. These adjustments show the potential savings the DMUs will realise while raising their technical efficiency score to 1.
From
Figure 4, we see that all but one of the surveyed hotels had some amount of potential savings should they implement the recommended adjustments to improve their energy performances. DMU H7, H1 and H10 had the highest potential savings of over NGN8.91 million (11,598.06USD), NGN7.03 million (9,150.88USD) and NGN6.12 million (7,966.34) respectively while DMU H2, H8 and H3 operated more efficiently with potential savings of less than NGN2 million (2,603.38USD) in a year.
4. Conclusion
Notably, the hotels relied more on electricity for their energy needs complemented by diesel for their back-up electricity generators and gas for cooking. It was also observed that more than 70% of the electricity was used for HVAC indicating the weight impact of cooling energy use on the total energy used by hotels in the study environment. We have shown that significant savings opportunities exist in the studied hotels. Such savings potentials can similarly be identified in other hotels to improve profitability and reduce the environmental burden of their operations. This research is significant due to Nigeria's energy supply challenges, including inadequate power supply from the national grid. Hoteliers can benefit from this study as it explores a methodology for assessing energy losses, improving energy efficiency, and exploring alternative energy sources like solar and generators.
Author Contributions
Conceptualization, C.O. and H.N.; methodology, C.O.; software, C.O.; validation, C.O., H.N.; writing—original draft preparation, C.O.; writing—review and editing, H.N.; supervision, P.A., H.N.;. All authors have read and agreed to the published version of the manuscript.
Data Availability Statement
References
- Shilei Lu, Shasha Wei, Ke Zhang, Xiangfei Kong and Wei Wu, Investigation and Analysis on the Energy Consumption of Starred Hotel Buildings in Hainan Province, the Tropical Region of China. Energy Conversion and Management 2013, 75, 570–580. [CrossRef]
- Yahya Ali, Mairna Mustafa, Shireen Al-Mashaqbah, Kholoud Mashal, Mousa Mohsen, Potential of Energy Savings in the Hotel Sector in Jordan. Energy Conversion and Management 2008, 49, 3391–3397.
- Wu Xuchao, Energy Performance of Hotel Buildings, Completed, National University of Singapore, 2007.
- Subramanian Senthilkannan Muthu. Energy Footprints of the Bio-refinery, Hotel, and Building Sectors, 1st ed.; Springer Nature: Singapore, 2019. [Google Scholar]
- Katarina Poldrugovac, Metka Tekavcic and Sandra Jankovic. Efficiency in the hotel industry: an empirical examination of the most influential factors. Economic Research-Ekonomska Istraživanja, 2016, 29, 583–597. [Google Scholar] [CrossRef]
- Hiroshi Morita and Necmi, K. Avkiran. Selecting Inputs and Outputs in Data Envelopment Analysis by Designing Statistical Experiments. Journal of the Operations Research 2009, 52, 163–173. [Google Scholar]
- Jean-Marc Huguenin, Data Envelopment Analysis (DEA): A Pedagogical Guide for Decision Makers in the Public Sector, Swiss Graduate School of Public Administration (IDHEAP), Lausanne, Switzerland, 2012.
|
Disclaimer/Publisher’s Note: The statements, opinions and data contained in all publications are solely those of the individual author(s) and contributor(s) and not of MDPI and/or the editor(s). MDPI and/or the editor(s) disclaim responsibility for any injury to people or property resulting from any ideas, methods, instructions or products referred to in the content. |
© 2023 by the authors. Licensee MDPI, Basel, Switzerland. This article is an open access article distributed under the terms and conditions of the Creative Commons Attribution (CC BY) license (http://creativecommons.org/licenses/by/4.0/).
