Preprint
Article

Epidemiological Evolution and Economic Impact of the COVID-19 Pandemic in the European Union and Worldwide and Effects of Control Strategies on Them: A Descriptive Study

Altmetrics

Downloads

239

Views

370

Comments

0

Submitted:

21 September 2023

Posted:

22 September 2023

You are already at the latest version

Alerts
Abstract
We evaluated epidemiological evolution and economic impact of COVID-19 pandemic in the European Union (EU) and worldwide, and the effects of control strategies on them. We collected incidence, mortality, and gross domestic product (GDP) data between the first quarter of 2020 and of 2023. Then, we reviewed the effectiveness of the mitigation and zero-COVID control strategies. The statistical analysis was done calculating the incidence rate ratio (IRR) of two rates and its 95% confidence interval (CI). In the EU, COVID-19 presented six epidemic waves. The sixth one at the beginning of 2022 was the biggest. Globally, the biggest wave occurred at the beginning of 2023. Highest mortality rates were observed in the EU during 2020-2021 and globally at the beginning of 2021. In mitigation countries, mortality was much higher than in zero-COVID countries (IRR= 6.82; CI:6.14-7.60; p<0.001). A GDP reduction was observed worldwide, except in Asia. None of the eight zero-COVID countries presented a GDP growth percentage lower than the EU percentage in 2020, and 3/8 in 2022 (p=0.054). COVID-19 pandemic caused epidemic waves with high mortality rates and a negative impact on GDP. The zero-COVID strategy was more effective in avoiding mortality and potentially had less impact on GDP.
Keywords: 
Subject: Public Health and Healthcare  -   Health Policy and Services

1. Introduction

From the beginning of the COVID-19 pandemic, collecting data was a priority. The Johns Hopkins University reported over 676 million cases and nearly 7 million deaths worldwide between January 22, 2020 and March 3, 20231. The global annual incidence and mortality of COVID-19 in 2020, 2021, and 2022 has strongly surpassed that of other historical infectious diseases, such as HIV, tuberculosis, and influenza. Therefore, it is reasonable to assume that the SARS-CoV-2 virus causing COVID-19 will persist for years within the world population.
On January 6, 2021 over 20.5 million years of life had been lost because of COVID-19 in 81 countries2. In particular, at the beginning, the pandemic found the world unprepared and caused a greater loss of years of life per capita in wealthier countries. Indeed, COVID-19-related mortality is closely linked to age3, and the population structure in wealthier countries shows a constrictive pyramid, with 21.1% of the European Union (EU) population, for example, aged 65 years or over in 20214. Moreover, in developed countries, many elderly resided in nursing homes, and so were more exposed to contacts and contagion between them. In particular, among the 21 countries with highest income worldwide, the United States of America (USA) had the greatest decline in life expectancy in 2020 (1.87 years), followed by Spain, England and Wales, Belgium, and Italy5.
Finally, in 2021, an analysis of the Gross Domestic Product (GDP) per capita revealed an increase in inequalities between countries as a result of the pandemic6.
To fight COVID-19, common measures were implemented worldwide: pharmaceutical (e.g., vaccines and antivirals treatments ); and non-pharmaceutical (e.g., masks, physical distancing mandates, and monitoring of indoor air quality). However, specific strategies were also implemented by different countries: mitigation or elimination (zero-COVID).
The mitigation strategy was implemented by most countries (e.g., EU; Brazil; UK; USA). It aimed to reduce incidence, mortality, and morbidity to levels that did not collapse the healthcare system, while not disrupting economic and social life. The objective was to flat the epidemic curve and achieving herd immunity in the population with public health interventions focused on protecting vulnerable and high risk groups, while allowing transmission among low risk groups7,. The term ‘herd immunity’, as defined in 19238, refers to the state where a sufficiently large proportion of the population is immune, making it challenging or even preventing the transmission of an infection. Such immunity can be acquired through previous infection, vaccination, or a combination of both (hybrid immunity). The zero-COVID strategy was implemented by a minority of countries: Australia, China, Hong Kong, Japan, New Zealand, Singapore, South Korea, and Vietnam. It involved implementing very restrictive policies and measures to achieve zero incidence within the territory where applied9.
Previous reviews have described different aspects of the COVID-19 pandemic, but none of them has comprehensively examined both epidemiological and economic data, and how control strategies influenced them. The current work aims to review the epidemiological evolution and economic impact of the COVID-19 pandemic in the EU and worldwide, and the effects of the principal control strategies (mitigation and zero-COVID) on them.

2. Material and Methods

We performed a descriptive analysis of the published epidemiological data on COVID-19 of the EU and the world from January 1, 2020 to March 31, 2023. We reviewed the periodical publications of the World Health Organization (WHO), European Center for Disease Prevention and Control, Our World in Data (OWID), and Johns Hopkins University. To minimize the influence of notification delays, we collected the data on April 15, 2023. In particular, OWID reported the data on COVID-19 cases and deaths from the WHO. The WHO published updates on cases and deaths on its dashboard every week for all countries10. From January 1, 2020 to March 21 2020, data were sourced through official communications under the International Health Regulations (IHR, 2005), complemented by publications on official ministries of health websites and social media accounts. Since 22 March 2020, data were compiled through WHO region-specific dashboards or direct reports to WHO. The source of our figures was OWID11.
We based our study on the OWID definition of confirmed cases: the ones with a PCR or an antigen test in their dataset12.
To avoid any bias linked to small population, we only considered the effect of the mitigation and zero-COVID strategies in countries with a large population, those with more than five million inhabitants. Specifically, EU countries, Brazil, UK, and USA and most of the remaining countries in the world were mitigation countries, and Australia, China, Hong Kong, Japan, New Zealand, Singapore, South Korea, and Vietnam were zero-COVID countries13.
We analyzed the following aspects: 1) the evolution of the incidence of new daily COVID-19 cases, expressed as a 7-day rolling average; 2) the distribution of cumulative incidences of new COVID-19 cases in the countries that have reported the highest number of cases between January 1, 2020 and March 31, 2023; 3) the evolution of new daily COVID-19-related deaths, expressed as a 7-day rolling average; 4) the distribution of cumulative mortality from COVID-19; 5) the evolution of the excess of mortality in 19 countries of the EU for the years 2020, 2021, 2022, and 2023 up to week 15, in relation to the mortality observed in the pre-pandemic years14, and 6) the economic impact through the evolution of the GDP using data from the World Bank.
We calculated rates per million inhabitants, except for the cumulative incidence of cases, which was calculated per 100 inhabitants. We evaluated the effectiveness of the two principal control strategies on incidence and mortality, by analyzing the incidence rate ratio (IRR) of two rates and its 95% confidence interval (CI). We used MedCalc Statistical Software for these calculations15. For GDP growth comparisons, we choose EU countries average as control (all EU countries followed the mitigation strategy), and evaluated how many zero-COVID countries performed worse. Chi-square test with Yates’ correction was used and when we observed a zero value, we used an appropriated chi-square test calculator16.

3. Results

3.1. Epidemiological data: incidence and effect of the control strategies on it

In our study period, 182.470 million cases were registered in the EU (405,472/million inhabitants), and 760.770 million worldwide (95,440/million inhabitants) (IRR=4.25; CI:4.22-4.28; p<0.0001). The evolution of the COVID-19 incidence in the EU and worldwide showed different epidemic waves, with a first one occurring in March-April 2020 (Figure 1). As a result of this first wave, on January 30, 2020, the WHO declared the pandemic a “Public Health Emergency of International Concern”17. To better manage the health crisis, in Spain for example, a "State of Alarm" was decreed (Royal Decree 463/208 of March 14, 2020), leading to a prolonged lockdown that lasted until the end of June 2020. EU countries that implemented this measure experienced a sudden decrease in incidence. In zero-COVID countries, where the lockdown was much longer, the incidence was maintained low.
In total, in the EU, there were six incidence waves of COVID-19. The sixth , at the beginning of 2022, was the largest, with an incidence of 2815/million inhabitants, accumulating more cases than all the previous ones combined (Figure 1). This was due to the most transmissible Omicron variant. Globally, the most pronounced wave occurred at the beginning of 2023, with an incidence of 796/million people (Figure 1). It was due to the fact that China reported a large increase in cases with an incidence of 4125/million people on 26 December 2022 after a sudden withdrawal of the zero-COVID strategy few days before.
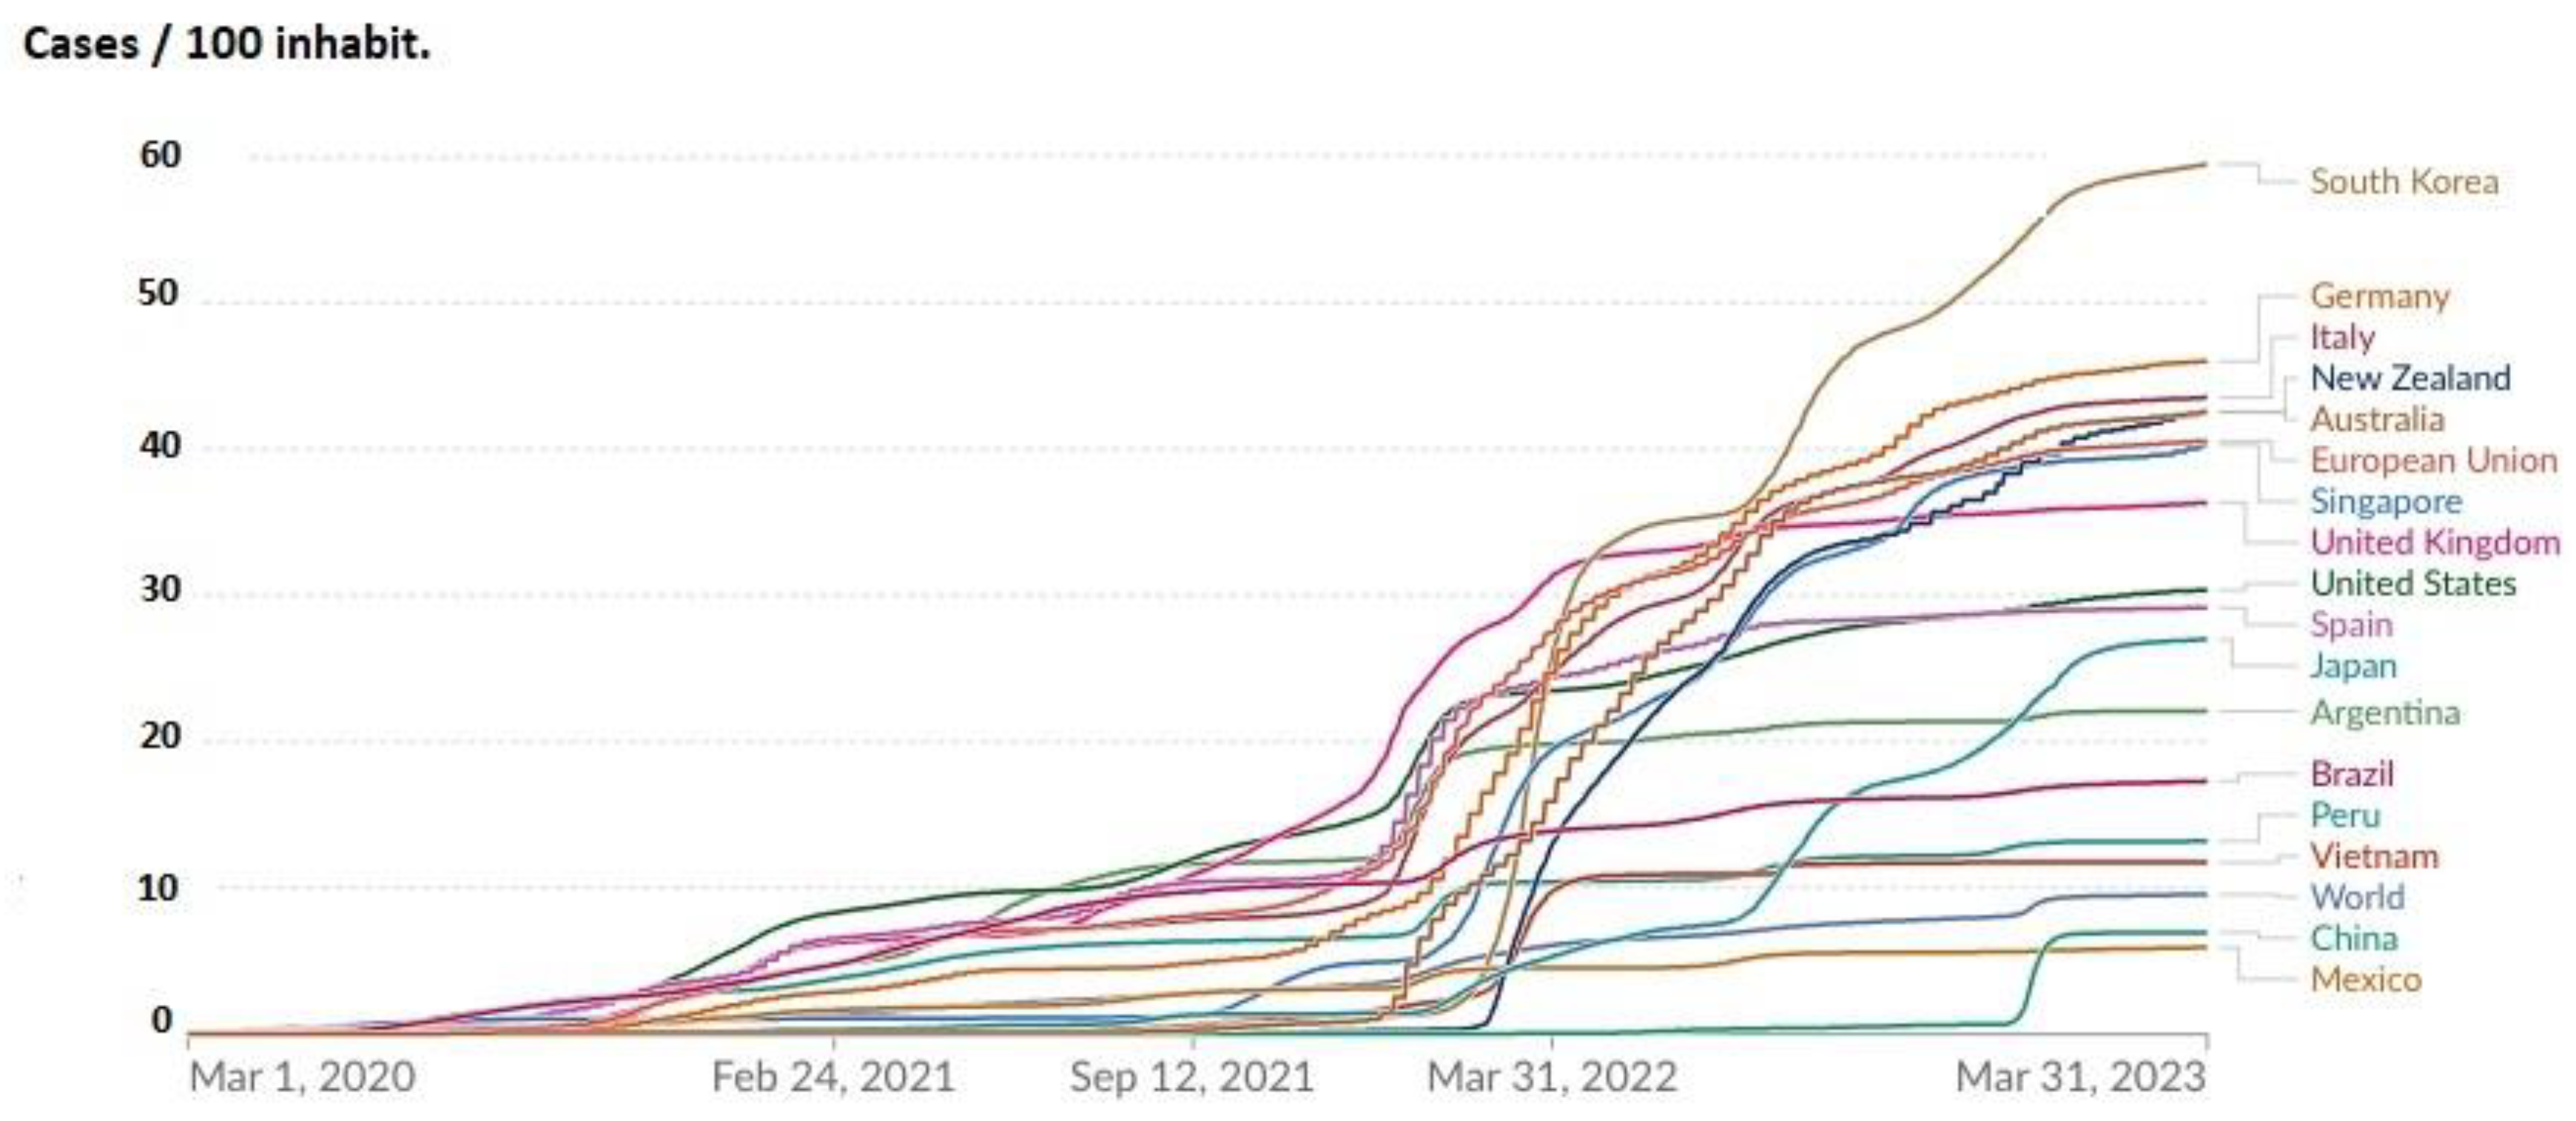
By the end of March 2023, the EU had a higher cumulative COVID-19 incidence than the one registered worldwide (44.5/100 and 9.5/100 inhabitants, respectively; IRR=4.68; IC: 3.74-5.90; p< 0.0001) (Figure 2). In zero-COVID countries such as Australia, Japan, New Zealand, South Korea, and Vietnam, the pandemic was well-controlled until the spring-summer of 2022. Then, a pronounced increase in incidence occurred with the surge in the more transmissible Omicron variant (Figure 2). Finally, some EU countries, Australia, Japan, New Zealand, South Korea, and the USA reported the highest cumulative incidences, whereas Argentina, Brazil, China, Mexico, Peru, and Vietnam, reported the lowest (Figure 2).

3.2. Epidemiological data: mortality and effect of the control strategies on it

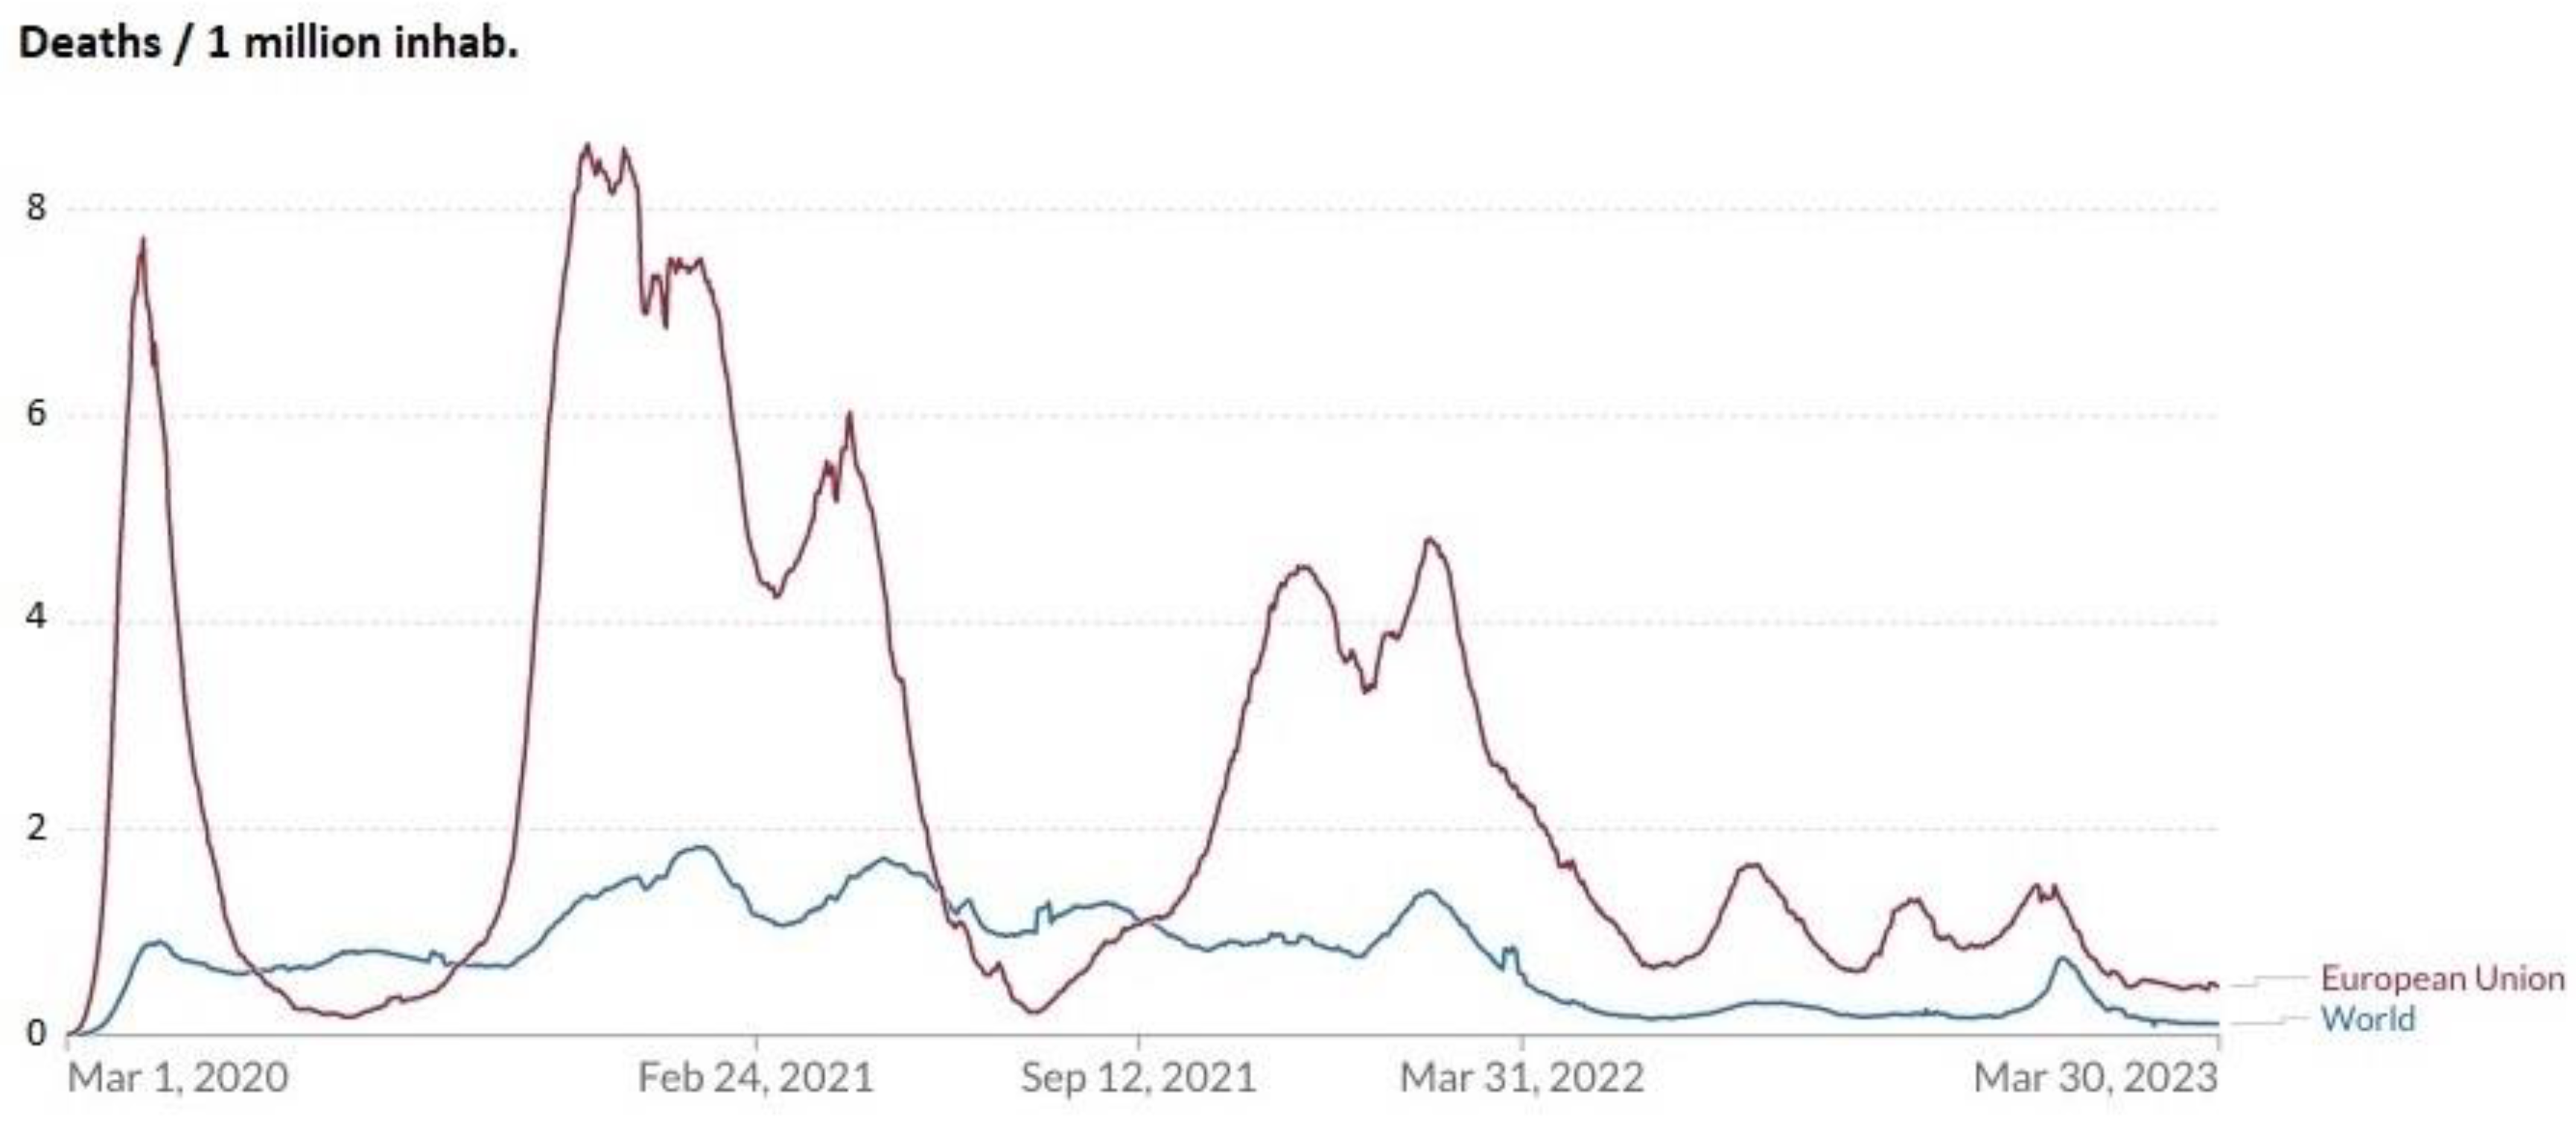
In total, there were 1.23 million deaths in the EU (2,731/1 million inhabitants) and 6.9 worldwide (865/1 million inhabitants). IRR=3.15; CI:2.92-3.41; p<0.0001). In the EU, the highest mortality rate was observed during 2020-2021. The first incidence wave of COVID-19 was accompanied by high mortality rates, reaching 8 deaths/million inhabitants (Figure 3). Then, the lockdowns imposed by many countries, that caused a sudden decrease in incidence, had the same effect on mortality. All the other incidence waves also presented high mortality rates. Globally, the highest mortality rate was observed at the beginning of 2021. Similarly to what happened for incidence, China caused another world’s peak of mortality in March 2023 (Figure 3), after a sudden withdrawal of its zero-COVID control strategy.
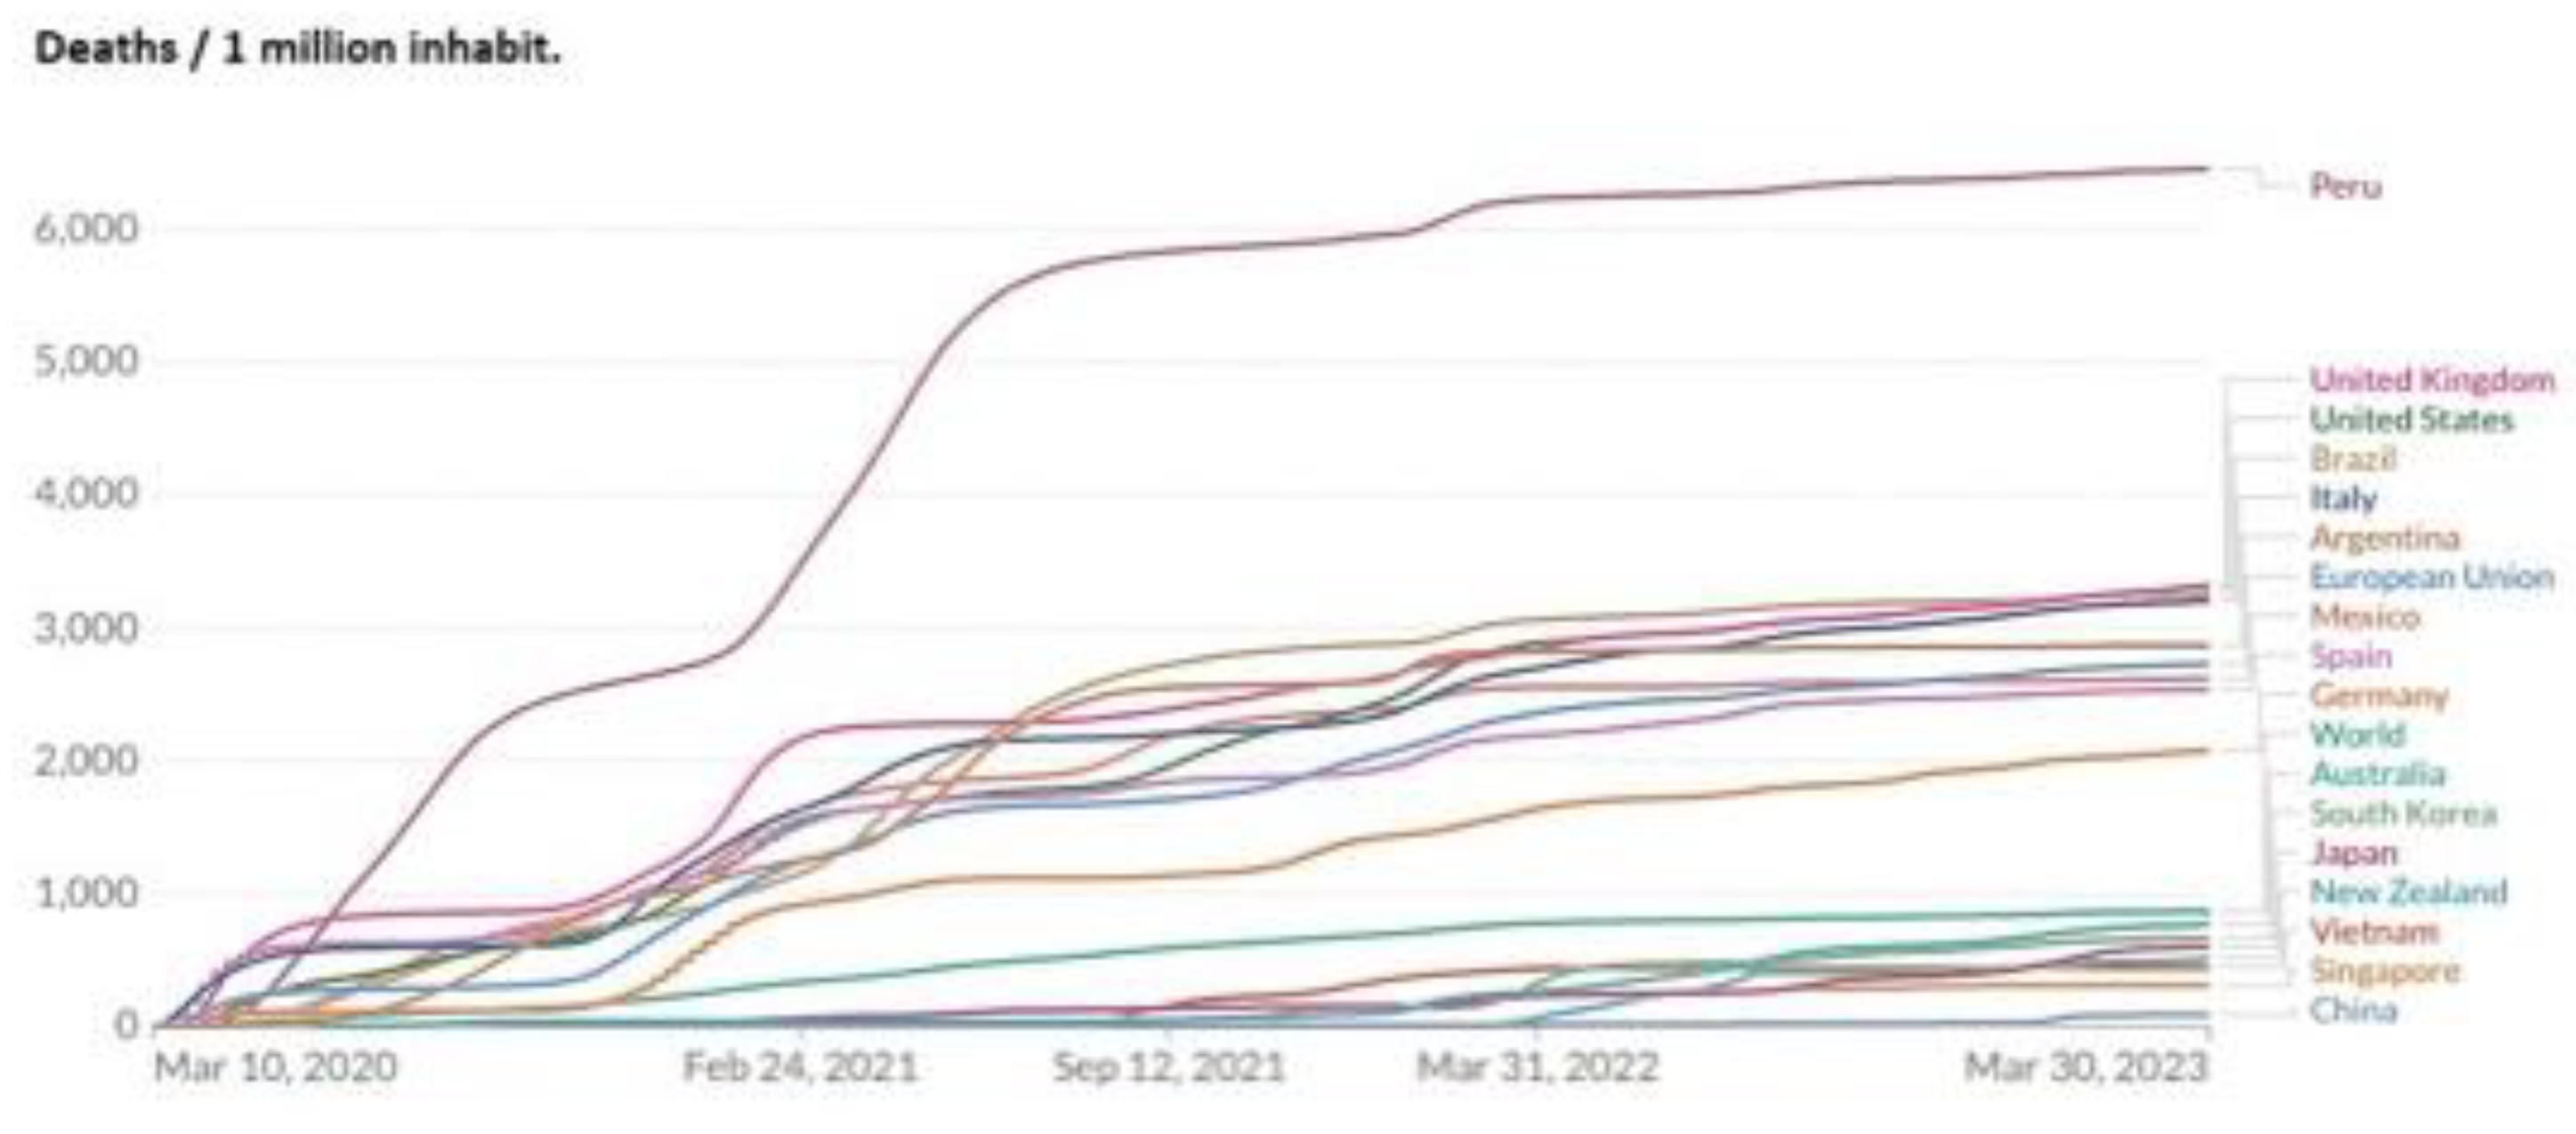
At the end of March 2023, Peru had the highest cumulative mortality rate among all countries. Cumulative mortality in zero-COVID countries such as Australia, Hong Kong, Japan, New Zealand, South Korea, and Vietnam, was low until the spring-summer of 2022, and it increased with the surge in the more transmissible Omicron variant. However, mitigation countries had much more cumulative mortality rates than zero-COVID countries (IRR= 6.82; CI:6.14-7.60; p<0.001). (Figure 4).
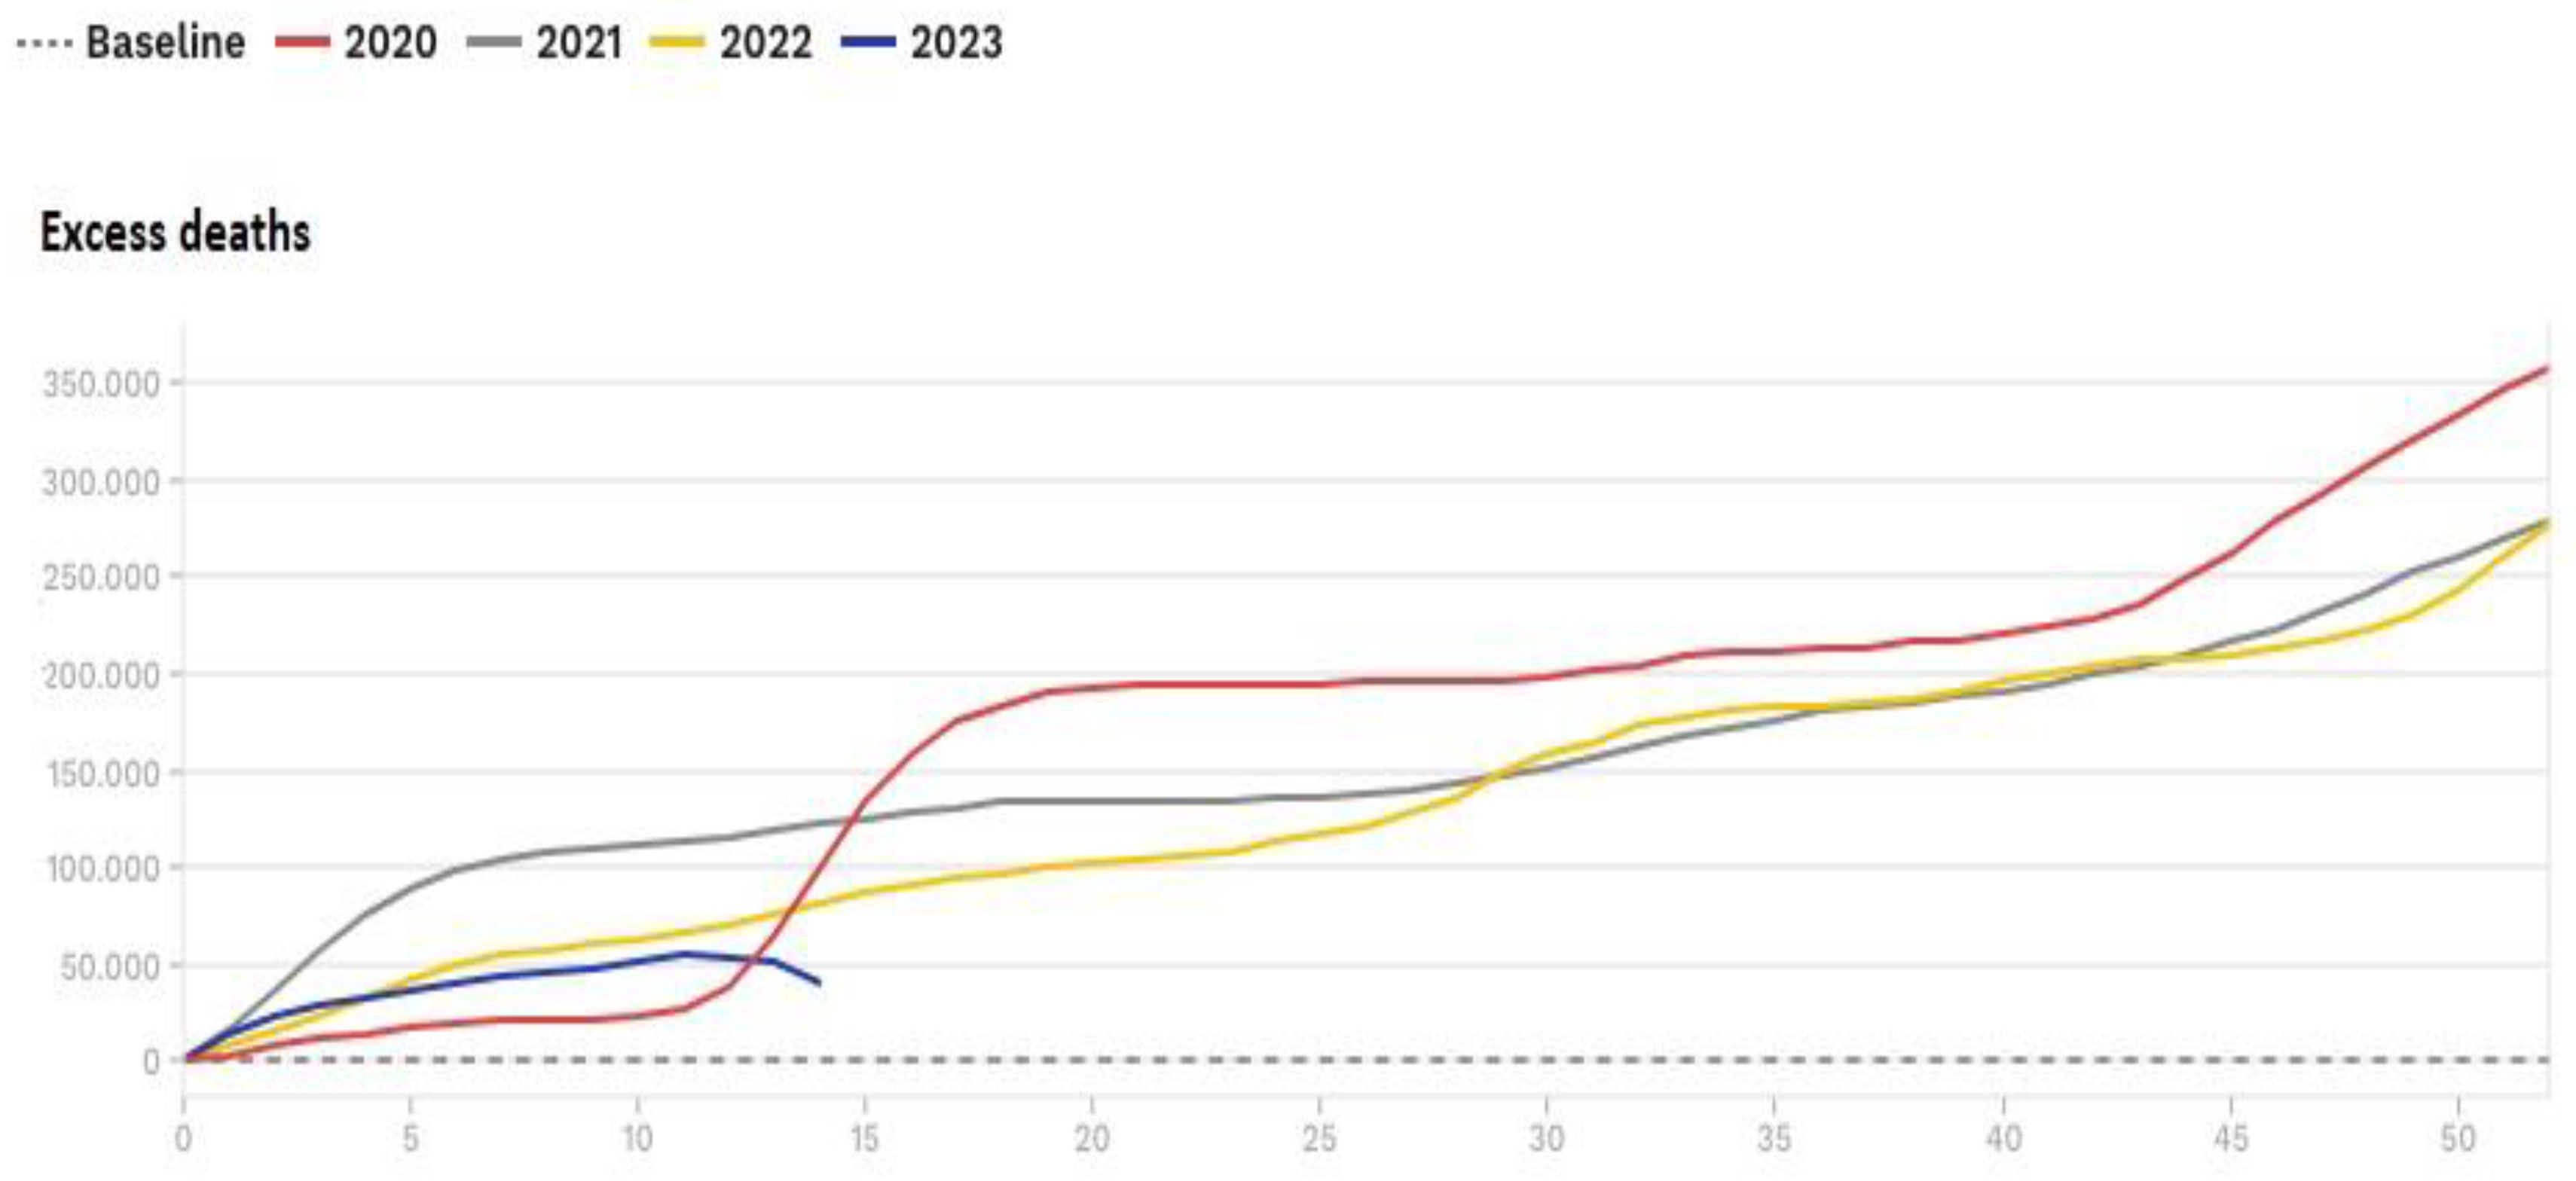
Finally, many EU countries experienced excess mortalities by COVID-19 in 2020 and 2021. Moreover, they had considerable excess mortality by COVID-19 and by other causes in 2022 and early 202314 (Figure 5).

3.3. Economic impact: GDP and effect of the control strategies on it

Worldwide, the GDP declined 3.07 points in 2020 and it was 5.67 in EU, in comparison with 2019 (Table 1). This decrease affected all continents except Asia, where it slightly increased. South America experienced the most pronounced decline. In 2021, all continents except South America exceeded their 2019 values18,19. The evolution was highly variable in these years in the EU, with maximum values in Ireland (6.2%, 13.6%, and 12.8%) and minimums in Spain (-11.3%, 5.5%, and 5.5%). Finally, in 2022, the EU experimented an increase in GDP of 3.54%.
Differences were observed in the evolution of percentage of the annual growth of GDP in the EU (where all countries followed the mitigation strategy), and in zero-COVID countries. In 2020, none of the eight zero-COVID countries presented a GDP growth percentage lower than the EU average (-5.67%), and in 2022 three of these countries presented a worse value than those of the EU (3.54%) (p=0.054) (Table 1).

4. Discussion

COVID-19 pandemic has strongly affected the world. In this study, we analyzed its strong epidemiological and economic impact in the EU and worldwide. Moreover, we show the effects of the two main control strategies.

4.1. Epidemiology: incidence, mortality, and effect of the control strategies on them

This work highlights the apparent contradiction between the evolution of COVID-19 incidence and mortality rates especially during 2020-2021, revealing relatively low incidences in comparison with the mortality rates. Moreover, because of varying protocols and challenges in the attribution of the cause of death, the real death toll may have been three times higher than the officially recorded data, particularly during the initial two years21.
This divergency is very clear for example in the first wave in the EU. To understand it, it is crucial to consider the limited availability of diagnostic tests during the early months of the pandemic, which resulted in a significant under-detection of cases. Also, many individuals were asymptomatic or pauci-symptomatic, often remaining undiagnosed22. Moreover, campaigns such as the "Stay at Home" initiative, apart from reducing the transmission, also limited access to healthcare resources, thereby contributing to the underestimation of the actual incidence. A better estimation of the incidence was given by the progressive improvement of the pandemic surveillance with the development of better detection and monitoring systems. However, because of the differences in the use of these systems between countries, there were varying degrees of under-reporting and, by the end of March 2023, the cumulative COVID-19 incidence was highly variable. In Peru23, for example, the data showed important discordances, with low cumulative incidences coinciding with high mortality rates.
In spite of these discordances, the cumulative incidences and mortalities in EU are much higher than those observed worldwide. In particular, zero-COVID countries (all outside EU) detected a lower incidence and mortality, and China, a country with vast population (more than 1,400 million inhabitants, equivalent to 17.7% of the total world population24) had a great influence on the data. However, these differences could be due to different control strategies.
The excess of death in several EU countries was high even when the COVID-19 mortality decreased. Indeed, some authors suggested that the full impact of the pandemic has been much greater than what indicated by repor,ted deaths caused by COVID-19 alone. For example, the large number of COVID-19 cases overwhelmed the health systems leading to the under-diagnosis of various pathologies and delays in patient follow-up. Further research is warranted to help distinguish the proportion of excess mortality that was directly caused by COVID-19 and the one that was an indirect consequence of the pandemic25.
In agreement with our observations, other authors showed that countries that adopted the zero-COVID strategy experienced mortality rates approximately 25 times lower than countries that opted for the mitigation strategy26. Therefore, the former showed better results by reducing incidence and mortality during the first two years of the pandemic. Finally, the advantages of this strategy ranged from short-term, such as limited virus infections, hospitalizations, and deaths; to medium-term, such as reduced presence of other infectious diseases; and long-term, such as low incidence of long COVID27. The latter is emerging as a frequent cause for medical consultation. A meta-analysis has estimated that 80% of COVID-19 cases develop one or more symptoms beyond 2 weeks following acute infection28. In a recent study, at least 5–10% of subjects surviving COVID-19 develop long COVID and recovery is extremely rare during the first two years, posing a major challenge to healthcare systems in the upcoming years29.
However, the zero-COVID strategy also led to significant individual and social costs20. Most of zero-COVID countries generally performed a gradual and highly controlled transition to a new living-with-COVID phase by relaxing control measures while intensifying vaccination efforts30. However, in 2022, after the Omicron wave, in South Korea for example, where older people had a low vaccination coverage, mortality was very high in this age-group31. Moreover, in China, COVID-19 incidence and deaths strongly increased after swiftly lifting a long and strict zero-COVID policy in January 2023, in coincidence with the Chinese New Year, favoring travels and overcrowding. Prior to this decision, a study estimated that eliminating the “zero-COVID” policy, which the WHO considered unsustainable over time32, could lead to 1.55 million deaths33. While it appears that this figure has not been reached, doubts persist about the veracity of the mortality data reported by China34.
The mitigation strategy has been more respectful with human rights35. Countries that employed this strategy, after the Omicron wave, transitioned to a “new normality” where cases were no longer isolated and contacts were not required to quarantine. The high level of immunity achieved in these countries has justified the strategic shift: over 90% of the population aged 12 or above fully vaccinated, history of prior infections, and circulating variants. Indeed, the impact of the pandemic on health systems was much lower than before, despite transition to the “new normality”. However, some countries, like the US, Brazil, and the UK, experienced high incidence and mortality rates because of the denialist position of their political leaders that minimized the relevance of the pandemic and therefore did not apply enough control measure36 Moreover, among some countries, the low vaccination coverage and limited measures of prevention and control among the oldest people favored a high mortality. Efforts are now focused on protecting the most vulnerable individuals and areas, monitoring severe cases, and maintaining control over the emergence of potential variants37.

4.2. Economic impact: GDP and effect of the control strategies on it

GDP is a measure of the economic activity, defined as the value of all goods and services produced minus the value of any goods or services used in their creation. Calculating the annual growth rate of GDP volume allows comparing the dynamics of economic development both over time and between economies of different sizes38.
The COVID-19 pandemic caused a reduction in GDP and a collapse of the stock market, resulting in a crisis and the greatest economic recession since World War II in EU and globally39. By continents, only Asia presented an increase of GDP in 2020 and 2021. These results could be explained by the positive influence of several Asian zero-COVID countries as China (the second economy in the world), South Korea, and Vietnam in 2020; and Hong Kong and Singapore in 2022.
In countries with high mortality, the implementation of full or partial lockdown measures and other restrictions aimed at preventing the transmission of SARS-CoV-2 and alleviating the pressure on overwhelmed healthcare systems, have also led to negative economic consequences: a decline in per capita consumption; a slowdown of global economic activity; a reduction in operations or the close down of many companies; job losses; a negative impact on service providers and manufacturers; a decrease in agriculture and food industry; and a decline in education and sports industry, and in the entertainment sector40.
There has also been an increase in socio-economic inequalities6. Indeed, the fiscal response to the COVID-19 emergency has required a significant increase in both public and private debt. Such fiscal response has been substantially large in most high-income countries and limited or non-existent in low-income countries. Moreover, low-income countries will likely require more time to recover from it. These discrepancies have greatly influenced both the initial economic impact and subsequent repercussions. Indeed, in 2020, 51 countries (including 44 emerging economies) registered a reduction in their public debt risk ratings41.
These differences between countries, together with other non-COVID-19 related factors affecting the economy in the same period (rising inflation rates, increased interest rates to contain inflation, and intensified geopolitical tensions, particularly the Russo-Ukrainian war42), makes it challenging to assess the precise economic impact of the pandemic.
Finally, data from the World Bank indicates that countries that adopted the zero-COVID strategy have experienced a lower negative impact on their GDP in the first year of the pandemic, in comparison to countries adopting the mitigation strategy43. However, in 2022, four zero-COVID countries presented negative values on their annual GDP growth percentage. Therefore, it seems that the evolution of zero-COVID strategy after the Omicron wave was not adequate in some of these countries but they delayed the economic impact

4.3. The role of vaccines

Vaccines played an important role in the control of the pandemic. In general, vaccination reduces the risk of hospitalization and death, especially in high-risk situations, such as elderly care homes44.
Unfortunately, in 2020, vaccines were not available and the mortality was very high, especially in mitigation countries. In early 2021, those countries began implementing vaccination programs that effectively reduced mortality rates from COVID-19. On the contrary, zero-COVID countries, having a better epidemiological situation, gave the priority to maintaining strict measures until vaccines could be fully available. Therefore, in most of these countries, the sudden increase in incidence and mortality caused by the Omicron variant in spring-summer 2022 was exacerbated by the limited vaccination coverage.
Experts have estimated that to achieve ‘herd immunity’ with COVID-19, transmission would need to be limited beyond 70% and a large global vaccination coverage45 should be ensured. This is currently not possible for several reasons. First, SARS-CoV-2 vaccine protection is temporary; second, while current vaccines are extremely beneficial46, they are not effective in preventing infection47; third, despite the WHO COVAX48 strategy (focused on accelerating the development, production, and equitable access to COVID-19 tests, treatments, and vaccines), vaccine availability is limited by several factors (price, distribution capacity, and administration) in regions with precarious healthcare systems; then, there is the risk of the emergence of highly transmissible or vaccine-resistant variants; and finally, there are many mild cases that may not confer lasting immunity. Therefore, currently, the Vaccine-plus action49 seek to sustain low infection rates through a combination of vaccination, public health measures, and financial support measures.

4.4. How to improve COVID-19 control today?

When facing health crises, resource allocation influences the number of cases and deaths in the short and medium term. These resources should rely on surveillance, prevention, and control programs of proven quality, that combine pharmacological and non-pharmacological measures with adequate economic budgets. These programs must be regularly evaluated to correct dysfunctions, and their economic costs depend on the existence of up-to-date response plans and previous investments in healthcare services. Social assistance also plays an important role in the control of diseases since, as in the case of COVID-1950, the most socio-economically disadvantaged population is often the most affected. Already in 1914, Biggs stated that "Public health can be bought, and each country can determine its own mortality rate"51. This notion was further supported by the publication of “How much tuberculosis do we want?”52, which, in response to the increasing incidence of tuberculosis, it was argued that the control of a disease depended on the definition of public health priorities and the resources invested.
On May 5, 2023, the WHO emergency committee officially declared the end of the “Public Health Emergency of International Concern”53 that had been in force for COVID-19 since January 30, 2020. However, the committee remarked that the pandemic still poses a global threat. Considering all the factors discussed above, together with the existence of a partially unknown animal reservoir, eradicating SARS-CoV-2 in the short to medium term does not appear feasible. To end this persistent global threat to public health, it is advisable to follow the recommendations of experts, such as those recently published after a Delphi consensus carried out by a multidisciplinary panel of 386 academic, health, and non-governmental organization; governments; and other experts in COVID-19 response54.
Finally, on the basis of our analysis, in combination with previous data on different health crises, to achieve effective control of COVID-19 or other potential future pandemics, we recommend two complementary approaches:
1) Reduce the incidence of infection as much as possible, particularly among vulnerable populations who are at higher risk of severe illness, while closely monitoring the potential emergence of new variants. In particular, as in any large outbreaks, the communication strategy is key to raise awareness and obtain people’s collaboration, particularly considering the pandemic fatigue after enduring more than three years of limitations. It is essential to explain that the disease will not disappear in the short term and that adapting to new routines of social interaction is necessary, and these may vary depending on the incidence of the infection. In this context, and although most preventive measures may no longer be necessary in the current scenario, it is important to remain alert to potential spikes in infection.
2) Achieve a better control over the virus with a high level of immunity, which effectively minimizes the number of susceptible individuals. To accomplish this, it is essential to improve the coverage vaccination and to develop vaccines that are effective in preventing infection. It is equally important to ensure that vaccines reach every country worldwide, without discrimination, while safeguarding proper pharmacovigilance. These type of measures require economic investments, but they are profitable in terms of health and necessary to minimize economic crises. By achieving high vaccination coverage, especially with sterilizing vaccines, we can stop the global impact of COVID-19.

4.5. Limitations

This study present several limitations. First, there have been different degrees of detection and notification of cases and deaths. Moreover, GDP is a useful indicator of a nation’s economic performance, and it is the most commonly used measure of well-being. However, it has some important limitations, including, for example, the failure to account for or represent the degree of income inequality in society55. Therefore, the available epidemiological and economic data for the COVID-19 pandemic and comparisons between countries must be considered indicative. Also, it was difficult to evaluate the maintenance of the control strategies during the years and even among different regions of single countries; therefore, the analysis of the effectiveness of the control strategies must also be considered indicative56. The excess of mortality data were available only in EU countries, then no comparison was possible with zero-COVID countries or worldwide. Finally, the limited number of zero-COVID countries difficult the statistical comparisons due to low statistical power.

5. Conclusions

COVID-19 is a catastrophic zoonotic disease that has generated an unexpected pandemic with millions of cases and deaths in the XXI century. On the basis of our results and previous observations (e.g., SARS in 2003 [57]), we conclude that the zero-COVID strategy might be a better option for coping with possible future global crisis caused by new transmissible diseases with high incidence and fatality rate. The mitigation strategy instead could be appropriate for old or new infections with lower epidemiological repercussion. In both cases, vaccine coverage is crucial for reducing mortality after the withdrawal of most preventive measures. Finally, we believe that this work could help in the adoption of more effective and efficient control measures in response to future pandemics.

Author Contributions

Conceptualization, JAC, JMB, JPM, AM, JMJ; Methodology, JAC, JPM; Validation, JAC, AM ; Formal Analysis, JAC, JMB; Investigation, JAC, JMB, JMJ; Writing – Original Draft Preparation, JAC, JMB; Writing – Review & Editing, JAC, JMB, JPM, AM, JMJ; Supervision, JAC.

Funding

This research received no external funding.

Institutional Review Board Statement

Ethical review and approval were waived because this study is only based on published epidemiological data.

Informed Consent Statement

Patient consent was waived because this study is only based on published epidemiological data.

Acknowledgments

Thanks to Valeria Di Giacomo, from ThePaperMill, for her accurate revision.

Conflicts of Interest

The authors declare that they have no conflicts of interest.

References

  1. Johns Hopkins University (JHU). Last Update at 10/03/2023. Available online: https://coronavirus.jhu.edu/map.html (accessed on 10 March 2023).
  2. Pifarré i Arolas H, Acosta E, López-Casasnovas G, Lo A, Nicodemo C, Riffe T, et al. Years of life lost to COVID-19 in 81 countries. Sci Rep 2021, 11, 3504. [Google Scholar] [CrossRef] [PubMed]
  3. Medeiros Figueiredo A, Daponte-Codina A, Moreira Marculino Figueiredo DC, Toledo Vianna RP, Costa de Lima K, Gil-García E. Factores asociados a la incidencia y la mortalidad por COVID-19 en las comunidades autónomas. Gac Sanit 2021, 35, 445–452. [CrossRef] [PubMed]
  4. Eurostat, Statistics explained. Population structure and ageing. Available online: https://ec.europa.eu/eurostat/statistics-explained/index.php?title=Population%20_structure_and_ageing&oldid=502987 (accessed on 21 August 2023).
  5. Woolf SH, Masters RK, Aron LY. Changes in Life Expectancy Between 2019 and 2020 in the US and 21 Peer Countries. JAMA Netw Open. 2022;5(4):e22706.
  6. Ferreira FHG. Inequality on time of COVID-19 Finance & Development. June 2021. Available online: https://www.imf.org/external/pubs/ft/fandd/2021/06/pdf/inequality-and-covid-19-ferreira.pdf (accessed on 17 May 2023).
  7. Wu S, Neill R, De Foo C, Qijia Chua C, Jung AS, Haldane V, et al. Aggressive containment, suppression, and mitigation of covid-19: lessons learnt from eight countries. BMJ 2021; 375. [CrossRef]
  8. Topley WW, Wilson GS. The Spread of Bacterial Infection. The Problem of Herd-Immunity. J Hyg (Lond) 1923, 21, 243–249. [CrossRef]
  9. McKee, M. Achieving zero covid is not easy, but the alternative is far worse. BMJ. 2020, 371, m3859. [Google Scholar] [CrossRef]
  10. Our World in Data. Confirmed deaths and cases: our data source. Available online: https://ourworldindata.org/covid-cases (accessed on 16 August 2023).
  11. 1 Our World in Data. Explore the global data on COVID-19 confirmed cases. Available online: https://ourworldindata.org/covid-cases (accessed on 16 August 2023).
  12. Our World In Data. Testing for COVID-19: Background. Available online: https://ourworldindata.org/coronavirus-testing#tests-per-confirmed-case (accessed on September 8 2023).
  13. Zhan Z, Li J, Cheng ZJ. Zero-COVID strategy: What’s next? IJHPM. 2023, 12, 6757. Available online: https://www.ijhpm.com/article_4189_db238cf8ceb74d76a3863ee4b485b6e4.pdf (accessed on 16 August 2023). (accessed on 21 August 2023).
  14. EuroMomo. Excess mortality. Last updated on week 15, 2023. Available online: https://www.euromomo.eu/graphs-and-maps#excess-mortality (accessed on 21 August 2023).
  15. MedCalc Statistical Software version 19.2.6 (MedCalc Software bv, Ostend, Belgium; 2020. Available online: https://www.medcalc.org (accessed on 21 August 2023).
  16. Mprotsis T, Doxani C, Zintzaras E (2022 August). Chi-square test calculation. An interactive calculator for chi-square tests of independence. Available online: https://biomath.med.uth.gr (accessed on 21 August 2023).
  17. WHO. COVID-19 Public Health Emergency of International Concern (PHEIC) Global research and innovation forum. Available online: https://www.who.int/publications/m/item/covid-19-public-health-emergency-of-international-concern-.
  18. The World Bank. World Development Report 2022. Available online: https://www.worldbank.org/en/publication/wdr2022 (accessed on 21 august 2023).
  19. International Monetary Fund World Economic Outlook (Octrober-20211) UN. Available online: https://statisticstimes.com/economy/continents-by-gdp.php (accessed on 21 August 2023).
  20. Eurostat. Data browser. Real GPD grouth rate-volume. Available online: https://ec.europa.eu/eurostat/databrowser/view/tec00115/default/table?lang=en (accessed on 21 August 2023).
  21. COVID-19 Excess Mortality Collaborators. Estimating excess mortality due to the COVID-19 pandemic: a systematic analysis of COVID-19 related mortality, 2020-2021. The Lancet 2022;399: 1513. Available online: https://www.thelancet.com/journals/lancet/article/PIIS0140-6736(2102796-3/fulltext#seccestitle10 (accessed on 21 August 2023).
  22. Flaxman S, Mishra S, Gandy A, Unwin HJT, Mellan TA, Coupland H, et al. Estimating the effects of non-pharmaceutical interventions on COVID-19 in Europe. Nature 2020; 584: 257-61.
  23. Sanz, E.; How Peru became the country with the highest COVID death rate in the world. The Conversation, Nov 16 2021. Available online: https://theconversation.com/how-peru-became-the-country-with-the-highest-covid-death-rate-in-the-world-169779 (accessed on 21 August 2023).
  24. Worldometer. China Population(2023). Available online: https://www.worldometers.info/world-population/china-population/ (accessed on 8 September 2023).
  25. COVID-19 Excess Mortality Collaborators Estimating excess mortality due to the COVID-19 pandemic: a systematic analysis of COVID-19-related mortality, 2020–2021. Lancet 2022, 399, 1513–1536. [CrossRef]
  26. Oliu-Barton M, Pradelski BSR, Aghion P, Artus P, Kickbusch I, Lazarus JV, et al SARS-CoV-2 elimination, not mitigation, creates best outcomes for health, the economy, and civil liberties. Lancet 2021, 397, 2234–2236. [CrossRef] [PubMed]
  27. Su Z, Cheshmehzangi A, Dean McDonnell, Junaid Ahmad, Šegalo S, Yu-Tao Xiang The Advantages of the Zero-COVID-19 Strategy. Int. J. Environ. Res. Public Health 2022, 19, 8767. [CrossRef]
  28. Lopez-Leon S, Wegman-Ostrosky T, Perelman C, Sepulveda R, Rebolledo PA, Cuapio A, et al S. More than 50 long-term effects of COVID-19: a systematic review and meta-analysis. Sci Rep. 2021, 11, 16144. [CrossRef] [PubMed]
  29. Mateu L, Tebe C, Loste C, Santos JR, LLadós G, López C, et al. Determinants of the Onset and prognosis of the Post-COVID-19 Condition: A 2-year Prospective Cohort Study. The Lancet Regional Europe 2023. [Preprint]. Available online: https://www.thelancet.com/journals/lanepe/article/PIIS2666-7762.
  30. De Foo C, Grépin KA, Cook AR, Hsu LY, Bartos M, Singh S, et al Navigating from SARS-CoV-2 elimination to endemicity in Australia, Hong Kong, New Zealand, and Singapore. Lancet 2021, 398, 1547–1551. [CrossRef] [PubMed]
  31. Park SK, Choe YJ, Jang EJ, Kim R, Lim D-S, Yi S Effectiveness of a Fourth Dose of COVID-19 mRNA Vaccine in the Elderly Population During the Omicron BA.2 and BA.5 Circulation: A Nationwide Cohort Study in Korea (K-COVE). Osong Public Health Res Perspect. 2022, 13, 443–447. [CrossRef]
  32. Portal Posts Salud. La OMS cataloga la política “Cero COVID” DE China como “insostenible”. Available online: https://www.keilahradio.com/la-oms-cataloga-la-politicacero-covid-de-china-como-insostenible/ (accessed on 21 August 2023).
  33. Cai J, Deng X, Yang J, Sun K, Liu H, Chen Z, et al Modeling transmission of SARS-CoV-2 Omicron in China. . Nat Med 2022, 28, 1468–1475. [CrossRef] [PubMed]
  34. BBC. China Covid: How many cases and deaths are there? January 16, 2023. Available online: https://www.bbc.com/news/59882774 (accessed on 20 September 2023).
  35. Sekalala S, Forman L, Habibi R, Meier BM, et al Health and human rights are inextricably linked in the COVID-19 response. BMJ Global Health 2020, 5, e003359. [CrossRef] [PubMed]
  36. Three Leaders Downplayed Covid and Ended Up Catching It. Available online: https://www.bloomberg.com/news/articles/2020-10-02/three-leaders-downplayed-covid-and-ended-up-catching-it#xj4y7vzkg (accessed on 10 September 2023).
  37. Ministerio de Sanidad. Estrategia de vigilancia y control frente a COVID-19 tras la fase aguda de la pandemia Actualizado a 3 de junio de 2022. Revisado a 8 de noviembre de 2022. Available online: https://www.sanidad.gob.es/profesionales/saludPublica/ccayes/alertasActual/nCov/documento s/Nueva_estrategia_vigilancia_y_control.pdf (accessed on 21 August 2023).
  38. WorldBank. Metadata Glossary. Available online: https://databank.worldbank.org/metadataglossary/world-development-indicators/series/NY.GDP.MKTP.KD.ZG (accessed on 18 August 2023).
  39. Banco Mundial Comunicado de Prensa junio 08, 2020. La COVID-19 (coronavirus) hunde a la economía mundial en la peor recesión desde la Segunda Guerra Mundial. Available online: https://www.bancomundial.org/es/news/press-release/2020/06/08/covid-19-to-plungeglobal-economy-into-worst-recession-since-world-war-ii (accessed on 21 August 2023).
  40. Naseer S, Khalid S, Parveen S, Abbass K, Song H, Achim MV. COVID-19 outbreak: Impact on global economy. Front. Public Health, 2022; 10. Available online: https://doi.org/10.3389/fpubh.2022.1009393 (accessed on 21 August 2023). [CrossRef]
  41. Banco Mundial. Los impactos económicos de la pandemia y los nuevos riesgos para la recuperación. Available online: https://www.bancomundial.org/es/publication/wdr2022/brief/chapter-1-introductionthe-economic-impacts-of-the-covid-19-crisis (accessed on 21 August 2023).
  42. Ramírez C, Durón RM. The Russia-Ukraine war could bring catastrophic public-health challenges beyond COVID-19. Int J Infect Dis. 2022 Jul;120:44-45. [CrossRef]
  43. Philippé C, Marqués N. Zero Covid: fewer deaths and much less contraction in GDP. The European Money and Finance Forum. SUERF Policy Briefs No 83, April 2021. Available online: https://www.suerf.org/docx/f_d337961ae3a865e12888d8785f8032d8_23897_suerf.pdf (accessed on 21 August 2023).
  44. Mauriz E, Fernández-Vázquez JP, Díez-Flecha C, Reguero-Celada S, Fernández-Villa T, Fernández-Somoano A et al. Impact of a COVID-19 Outbreak in an Elderly Care Home after Primary Vaccination. Vaccines 2023, 11, 1382. [CrossRef] [PubMed]
  45. Aschwanden, C. Five reasons why COVID herd immunity is probably impossible. Nature 2021;591:520-2.
  46. Puranik A, Lenehan PJ, Silvert E, Niesen MJM, Corchado-Garcia J, O'Horo JC, et al. Comparison of two highly-effective mRNA vaccines for COVID-19 during periods of Alpha andDelta variant prevalence. medRxiv [Preprint]. 2021. [CrossRef]
  47. Singanayagam A Hakki S Dunning J, Madon KJ, Crone MA, Koycheva A, et al. Community transmission and viral load kinetics of the SARS-CoV-2 delta (B.1.617.2) variant in vaccinated and unvaccinated individuals in the UK: a prospective, longitudinal, cohort study. Lancet Infect Dis 2022, 22, 183–195.
  48. WHO. COVAX: Working for global equitable access to COVID-19 vaccines. Available online: https://www.who.int/initiatives/act-accelerator/covax (accessed on 21 August 2023).
  49. 49. World Federation of Public Health Associations. Covid-19: An urgent call for global “vaccines-plus” action. BMJ, 2022; 376. [CrossRef]
  50. Baena-Díez JM, Barroso M, Cordeiro-Coelho SI, Díaz JL, Grau M. Impact of COVID-19 outbreak by income: hitting hardest the most deprived. J Public Health (Oxf). 2020, 42, 698–703. [CrossRef] [PubMed]
  51. Markel, H. Public Health Is Purchasable. Milbank Q. 2016, 94, 441–447. [Google Scholar] [CrossRef] [PubMed]
  52. Caylà JA, Jansà JM. ¿Cuánta tuberculosis queremos? Rev Esp Salud Pública 2000, 74, 449–450.
  53. WHO. Statement on the fifteenth meeting of the IHR (2005) Emergency Committee on the COVID-19 pandemic. Available online: https://www.who.int/news/item/05-05-2023-statement-on-the-fifteenth-meeting-of-the-international-health-regulations-(2005)-emergency-committee-regarding-the-coronavirus-disease-(covid-19)-pandemic (accessed on 21 August 2023).
  54. Lazarus JV, Romero D, Kopka CJ, Karim SA, Abu-Raddad LJ, Almeida G, et al. COVID-19Consensus Statement Panel. A multinational Delphi consensus to end the COVID-19 public health threat. Nature. 2022, 611, 332–345. [CrossRef] [PubMed]
  55. Khan Academy. Lesson summary: The limitations of GDP. Available online: https://www.khanacademy.org/economics-finance-domain/ap-macroeconomics/economic-iondicators-and-the-business-cycle/limitations-of-gdp/a/lesson-summary-the-limitations-of-gdp (accessed on 14 September 2023).
  56. Torres ML, Palma Díaz D, Oliver-Parra A, Millet JP, Cosialls D, Guillaumes M, Rius C,Vásquez-Vera H. Inequities in the incidence and mortality due to COVID-19 in nursing homesin Barcelona by characteristics of the nursing homes. PLoS One. 2022, 17, e0269639. [CrossRef]
  57. Anderson RM, Fraser C, Ghani AC, Donnelly CA, Riley S, Ferguson NM et al. Epidemiology, transmission dynamics and control of SARS: the 2002–2003 epidemic. Philosophical Transactions of the Royal Society B; 2004. Available online: https://doi.org/10.1098/rstb.2004.1490 (accessed on 21 August 2023). [CrossRef]
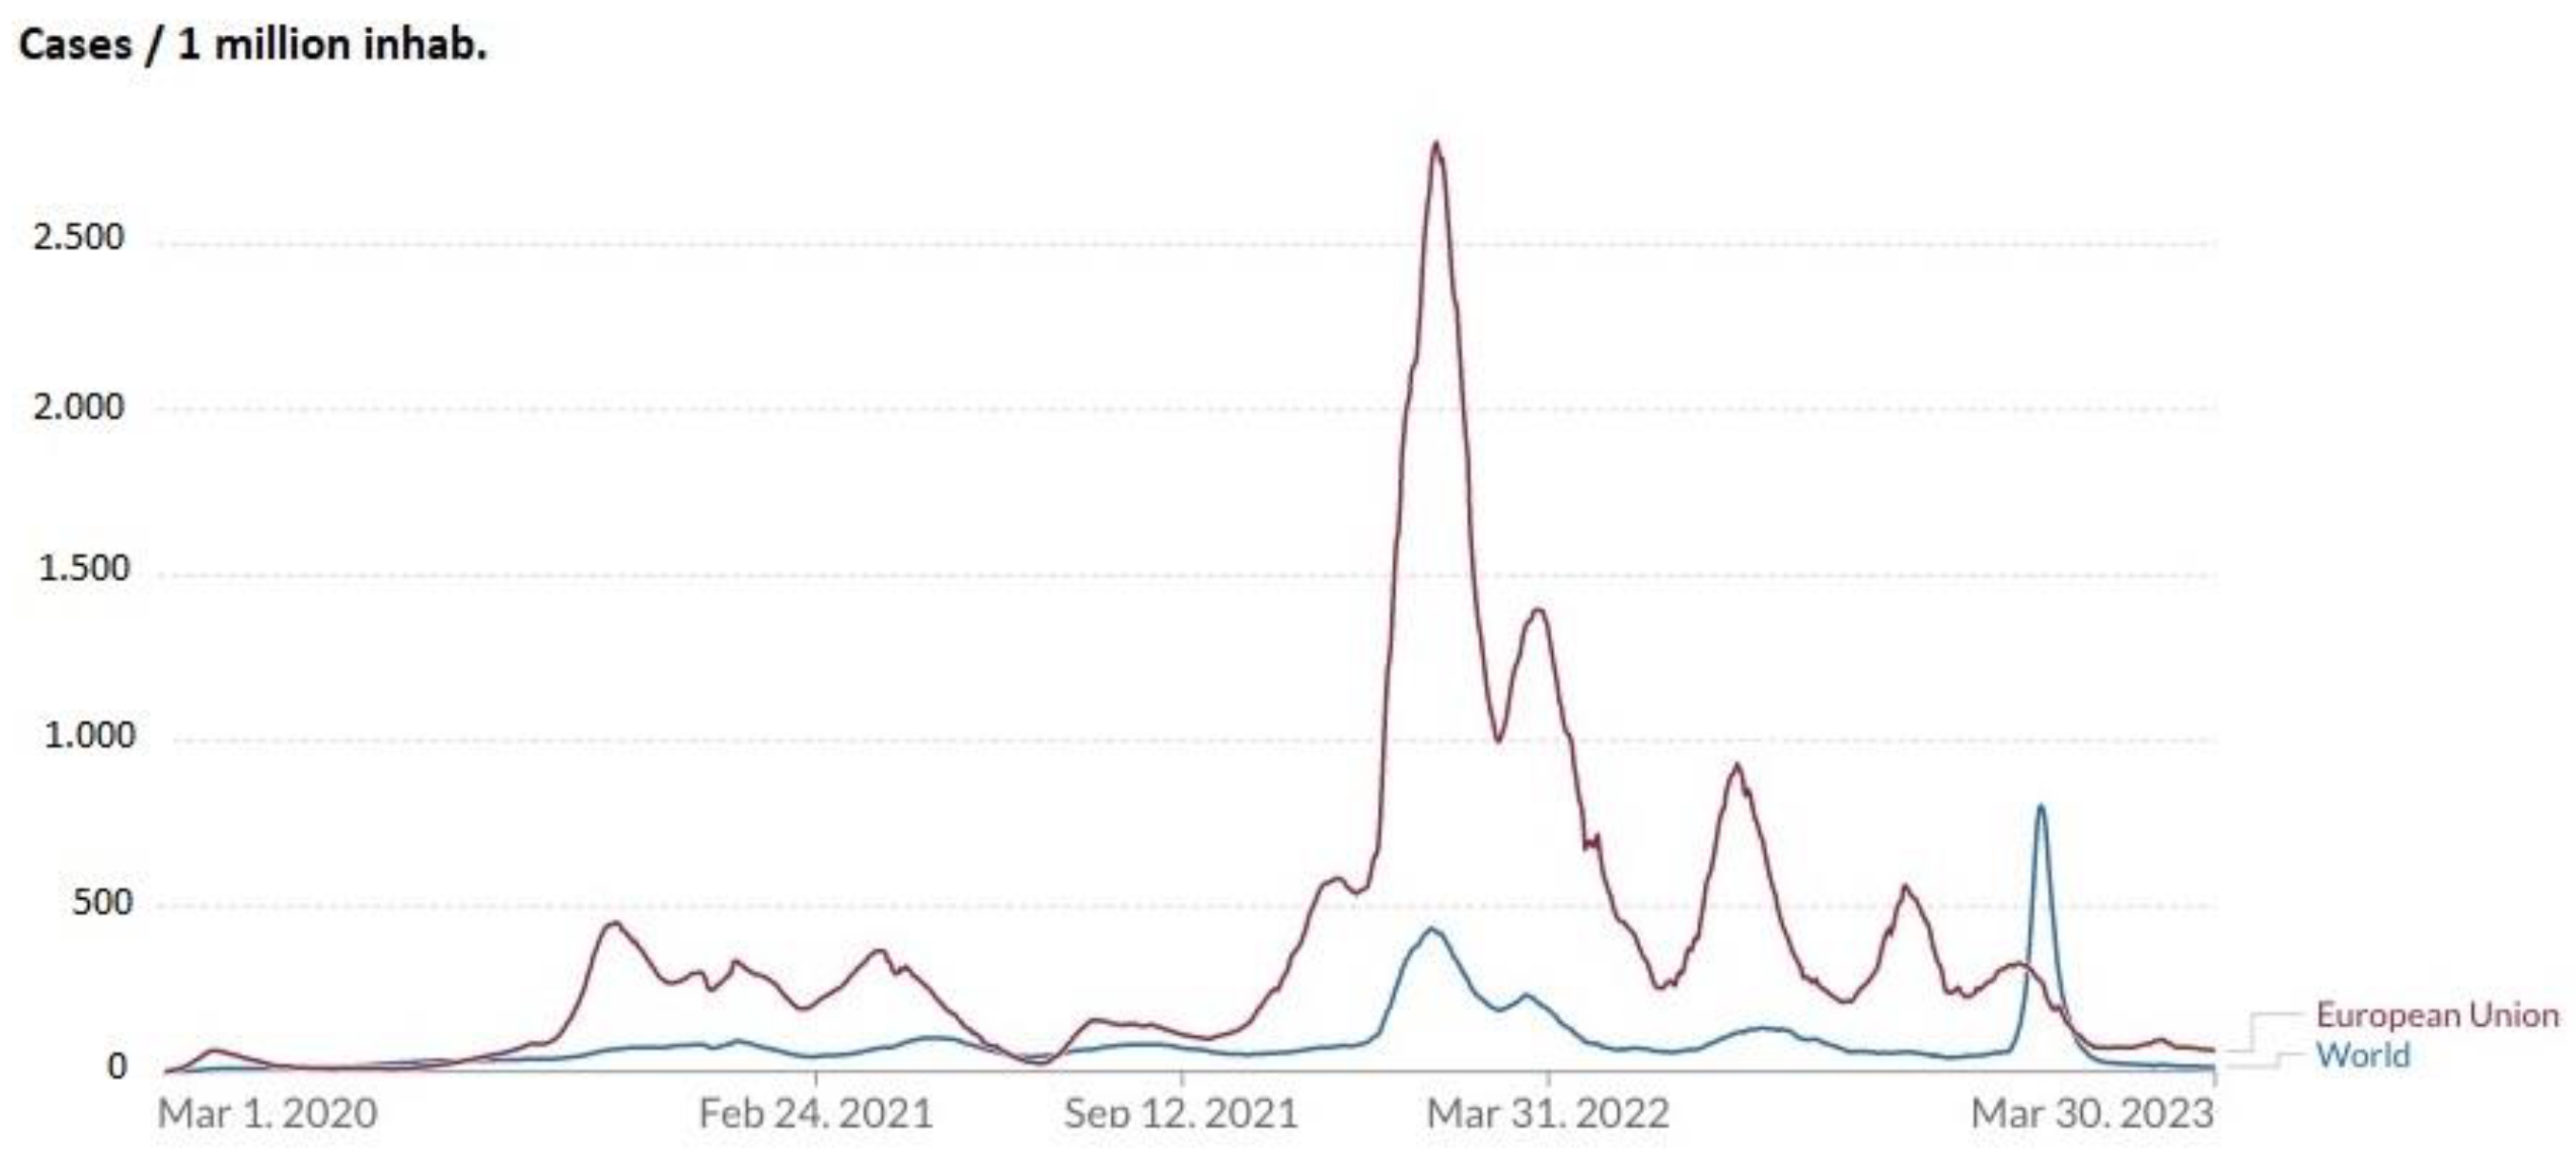
Figure 1. Evolution of the incidence of new daily cases of COVID-19 per million people expressed as a 7-day rolling average in European Union and worldwide, from March 1, 2020 to March 31, 2023. Sources: Johns Hopkins University. CSSE COVID-19 Data and https://ourworldindata.org/covid-cases.
Preprints 85781 g001
Figure 2. Distribution of cumulative incidence per 100 inhabitants of COVID-19 in the European Union, worldwide, and in the countries that have reported the highest number of cases from March 1, 2020 to March 31, 2023. Sources: Johns Hopkins University. CSSE COVID-19 Data and https://ourworldindata.org/covid-cases.
Preprints 85781 g002
Figure 3. Evolution of new daily COVID-19-related deaths per million people expressed as a 7-day rolling average in the European Union and worldwide, from March 1, 2020 to March 31, 2023. Sources: Johns Hopkins University. CSSE COVID-19 Data and https://ourworldindata.org/grapher/total-daily-covid-deaths.
Preprints 85781 g003
Figure 4. Distribution of cumulative COVID-19 deaths per million people in the European Union, worldwide, and in the countries that have reported the highest number of cases between March 10, 2020 and March 31, 2023. Sources: Johns Hopkins University. CSSE COVID-19 Data and https://ourworldindata.org/grapher/total-daily-covid-deaths.
Preprints 85781 g004
Figure 5. Evolution of excess mortality in 19 countries of the European Union for the years 2020, 2021, 2022 and 2023 (up to week 15) in relation to the mortality observed in the pre-pandemic years. Source: reference 14.
Preprints 85781 g005
Table 1. Evolution of percentage of the annual growth of gross domestic product in relation to previous year in the European Union, worldwide, and in zero-COVID countries (2019-2022). Sources: references 18, 19 and 20.
Area 2019 2020 2021 2022
European Union 1.81 -5.67 5.47 3.54
World 2.59 -3.07 6.02 3.08
Australia -2.52 -0.1 17.01 7.09
China 5.95 2.24 8.45 2.99
Hong Kong 0.37 -4.99 6.59 -2.4
Japan 1.53 -4.3 -0.86 -15.47
New Zealand 0.57 -0.7 20.22 -3.25
Singapore -0.01 -3.9 21.64 10.14
South Korea -4.26 -0.7 10.13 -8.05
Vietnam 7.36 2.87 2.56 8.02
Disclaimer/Publisher’s Note: The statements, opinions and data contained in all publications are solely those of the individual author(s) and contributor(s) and not of MDPI and/or the editor(s). MDPI and/or the editor(s) disclaim responsibility for any injury to people or property resulting from any ideas, methods, instructions or products referred to in the content.
Copyright: This open access article is published under a Creative Commons CC BY 4.0 license, which permit the free download, distribution, and reuse, provided that the author and preprint are cited in any reuse.
Prerpints.org logo

Preprints.org is a free preprint server supported by MDPI in Basel, Switzerland.

Subscribe

© 2024 MDPI (Basel, Switzerland) unless otherwise stated