1. Introduction
Recently, the number of cases for which data have been acquired using multiple sensors at industrial sites has increased. For example, in an environment where it is difficult to obtain an accurate image using an RGB camera alone, such as at night, in heavy rain, or in fog, an IR sensor can be used to compensate for the disadvantages of an RGB camera [
1]. Integrating IR and RGB images increases the performance of tasks such as object detection[
1] and object tracking [
2,
3] in computer vision(CV).
when data are obtained through multiple sensors, each sensor has external factors, such as the base curve of the lens, the position of the sensor, and the measurement angle; therefore, the images obtained using the sensor have different coordinates. To integrate the data of two images, different coordinates must be matched. In many fields utilizing multi-sensor data, image registration between data with different modalities, such as IR and RGB, called multi-modality image registration is a very important task.
Classical multi-modal image registration [
23] was adapted to another image by transforming an image in a direction that maximizes the resulting value of the predefined similarity comparison method. To accurately match external parameters such as lens curvature, the camera position and distance between sensors must be known to make accurate matching, and it is difficult to achieve accurate matching without parameters. In addition, the computational cost is excessively high for classical methodologies, which is a fatal problem in task requiring real-time response, such as autonomous driving.
Because of these problems, it is difficult to perform image registration through classical methodologies only image without additional environmental parameters. To solve this problem, research on image registration methodology using deep learning has become increasingly active.
In the medical field, multi-modality image registration uses deep learning to perform multi-modality image registration such as MRI and CT images[
5]. However, in the case of medical images, the shooting environment is limited, so there is almost no background noise. So, general supervised learning-based image registration methodology uses images that have already been registered as ground truth. After setting the imaging device parameters to obtain images with the same coordinates, an affine transformation was applied to one image to artificially create an image with a misaligned coordinate and use it as the input . Thus, this approach is very inefficient and contradictory to misaligned the matched image again to train the registration network.
In this study, we propose a network that matches IR-RGB images and a method for evaluating spatial matching by comparing the masking of the two images. Through a deformation field generator(DFG), a deformation filed representing the x-axis and the y-axis change rates were inferred for each pixel to match the IR image with the RGB image, and each IR pixel is warped into a coordinate corresponding to the deformation field through a grid sampler to obtain an IR image that matched the RGB image. In addition, after converting the IR-masking iamge using this deformation field and then comparing the image with RGB masking image, we solved the spatial similarity comparison problem between the cross-modality images by converting them into mono-modality. The main contribution of out work are:
We proposed a multi-modality image registration methodology that performs image matching between IR-RGB images through deformation field inference.
We proposed a mask loss that compares the masking image of the image to solve the cross-modality problem.
Experiments show that the proposed method is effective not only areas where image masking information is provided but also in areas where image masking information is not given.
2. Related works
2.1. Feature matching based
The traditional image registration method consists of four steps. First is Feature detection, which finds the same features regardless of image conversion or degradation. Second is feature matching, which considers the relationship between the features of non-aligned and reference images obtained during the feature detection process. Third is transform mode assessment, which determines the transformation parameters to be applied to the non-aligned images. Last is image transformation step, during which registration is performed by applying transformation parameters to non-aligned images.In Feature matching-based image registration methodology, feature detection and feature matching are very important. Representative methodologies that focused on processes such as the Harris corner [
24], SIFT [
25], and AGAST [
26]. It is difficult to achieve accurate registration using this methodology alone and many studies have been conducted recently to increase accuracy through deep learning.
2.2. Homography estimation based
Homography-based image registration is a method in which image transformation is applied after obtaining a homography matrix with eight parameters based on a 2D image, which is a transformation parameter in the transform mode assessment stage. In studies such as [
8,
9,
10], deep learning networks perform feature detection and matching, and transform mode assessment steps to infer accurate homography matrices using only image pairs. Deep homography estimation [
8] infers a homography matrix using 10 simple convolutional(conv) layers and shows that image matching is possible using it. In this study, a deep learning-based methodology for inferring homography was a deep learning-based methodology for inferring homography was not accurate when two images are obtained using different cameras, such as RGB-IR, and the types of transformations that can occur through homography are limited. Owing to these limitations, optical flow-based image registrations have appeared, which yield the conversion matrix itself for each image pixel. The estimation of the movement of pixels or features in an image from a continuous image is called optical flow estimation.
2.3. Optical flow based
Estimating the movement of pixels or features in an image from a continuous image yielded optical flow estimation. These are as follows [
11,
15]:. as end-end methods that infer optical flow between two images for an image provided as input. Some studies have used optical flow for image registration [
12,
13,
14]. FlowReg[
13] uses FlowNet[
11] to match medical images. FlowReg consists of FlowRegA, which estimates a 3D affine matrix, and FlowReg-O, which estimates optical flow. After converting the images using the affine matrix obtained from FlowRegA, fine-tuning was performed using FlowReg-O. In the case of PWC-Net [
17] and pointPWC [
18], the matching performance improved by pyramid-structured architecture. RAFT [19] improved performance by adding the GRU structure to the Iteration method. However, these studies performed image registration on mono-modality.
3. Method
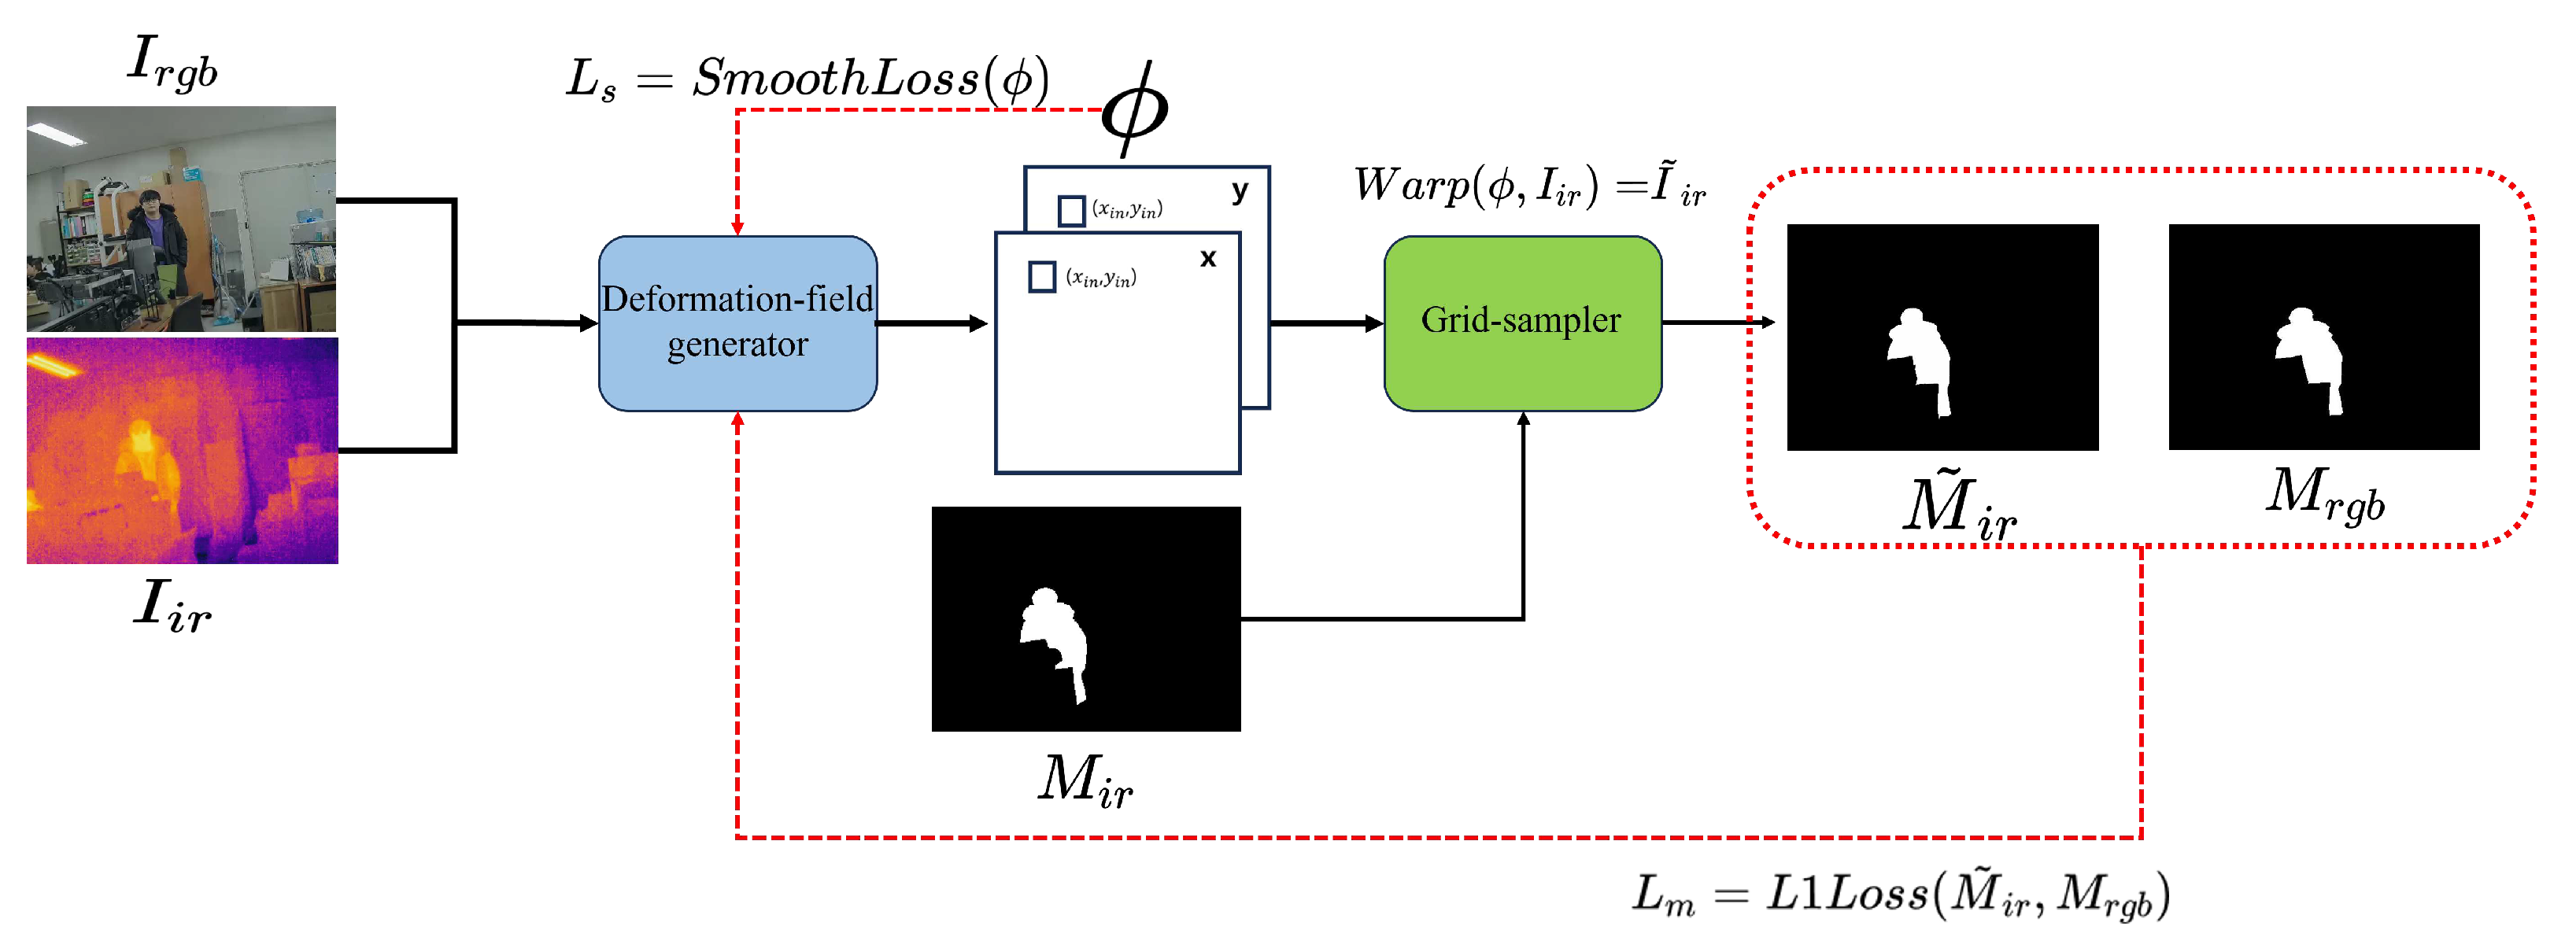
In this study, the previously mentioned feature detection, feature matching, and IR-RGB image matching proceed in two stages: the DFG network, which replaces the transform mode analysis process, and a grid sampler that performs image transformation. The first step is a DFG, ResUnet[
20]-based registration network that receives IR images(
) and RGB images(
) as input and generates a deformation field(
).
represents the x-axis and y-axis translation of each pixel and has the same resolution as the input image. In the second step,
and
obtained through DFG are received as inputs, and a warped IR image(
) is obtained using a grid sampler that performs an image transform that converts each pixel based on the deformation field on the IR image.
Figure 1 shows the inference structure of the multi-modality image registration network proposed in this paper.
3.1. Deformation Field Generator
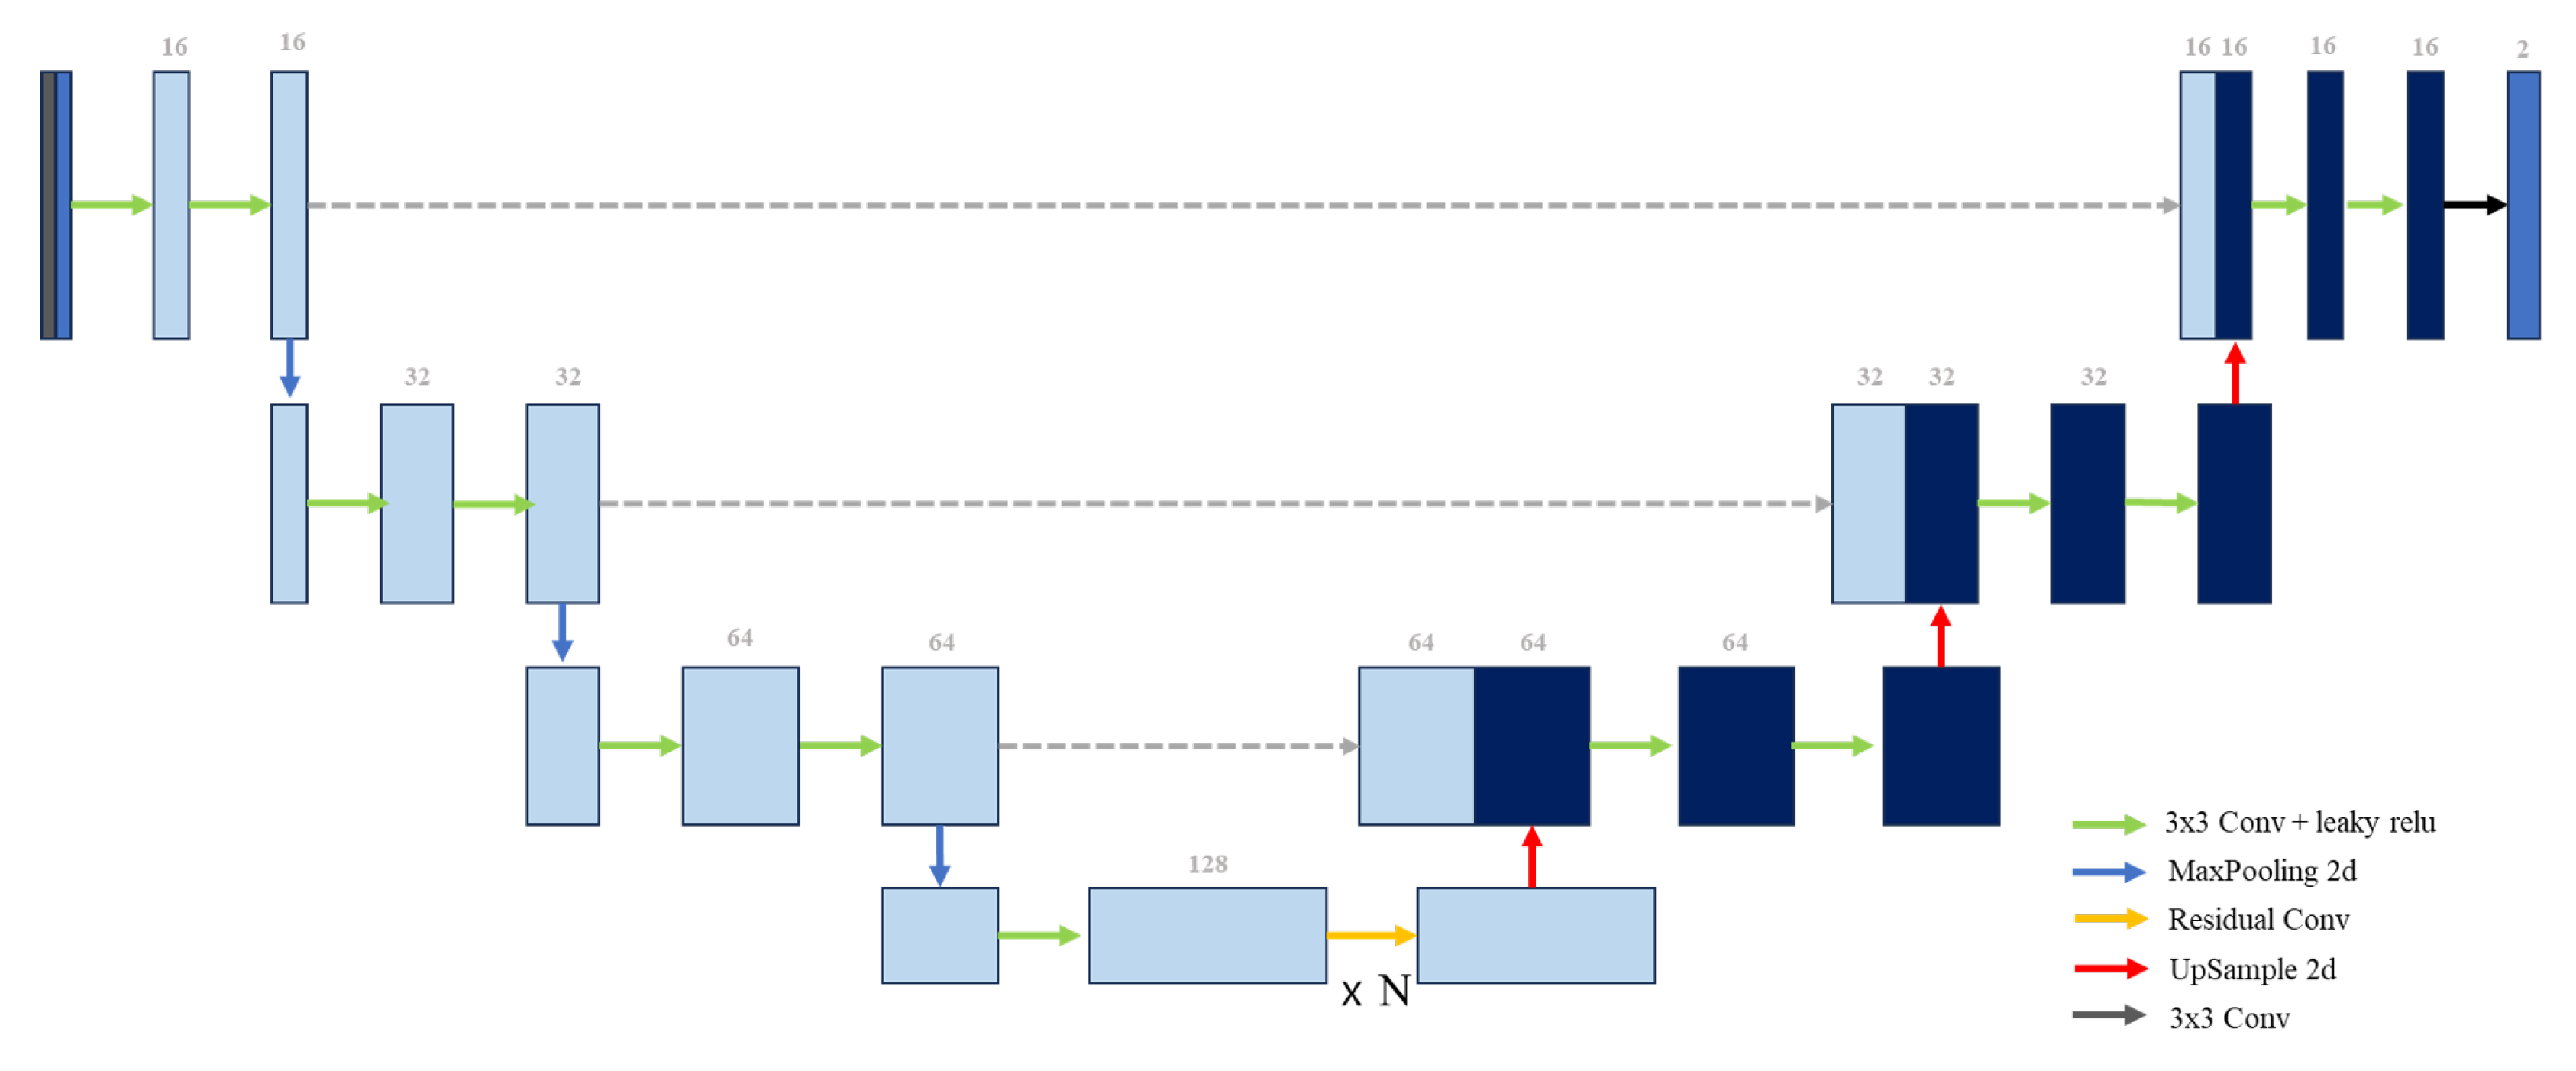
If input image’s resolution
, the deformation field generator (DFG) infers a 2-channel deformation field with resolution
and two channels representing the transformation in the x- and y-axes for image registration. DFG process sequentially receives data including tomcat
and
as input and then repeats the following process: passing through a block composed of
, and performing down-sampling. Before performing down-sampling, the feature map was stored at each step. After down-sampling, the residual block is passed
N times. In this study,
N was set to 3, 5, or 7. Next, the up-sampling process was performed by combining the feature map and residual block results for the same input resolution previously saved in the down-sampling process. Finally, up-sampling was repeated until
, which is the same resolution as the input image, and then
was applied and finally output a 2-channel result.
Figure 2 shows the DFG structure.
However, if the output of the network (
) is directly transformed through a grid sampler, there is no information on the spatial feature of the original data in the early stages of training, which results in severe spatial distortion and difficulty in training. Therefore, we utilize the identical deformation field (
) to allow the network to learn the process of maintaining and transforming the spatial characteristics of the original data to some extent. The identical deformation field satisfies Equation
2 as a deformation field representing the identical transform that allows the input image to emerge without transforming the image when the image and
are inputted to the grid-sampler. As shown in Equation
3, the structure transforms the image into a deformation field(
) created by adding
and
so it can maintain spatial features of the original image rather than using
directly.
As shown in Equation
3, the structure transforms the image into
created by adding
and
so it can maintain spatial features of the original image rather than obtaining a matrix of
that directly matches RGB-IR.
3.2. Grid sampler
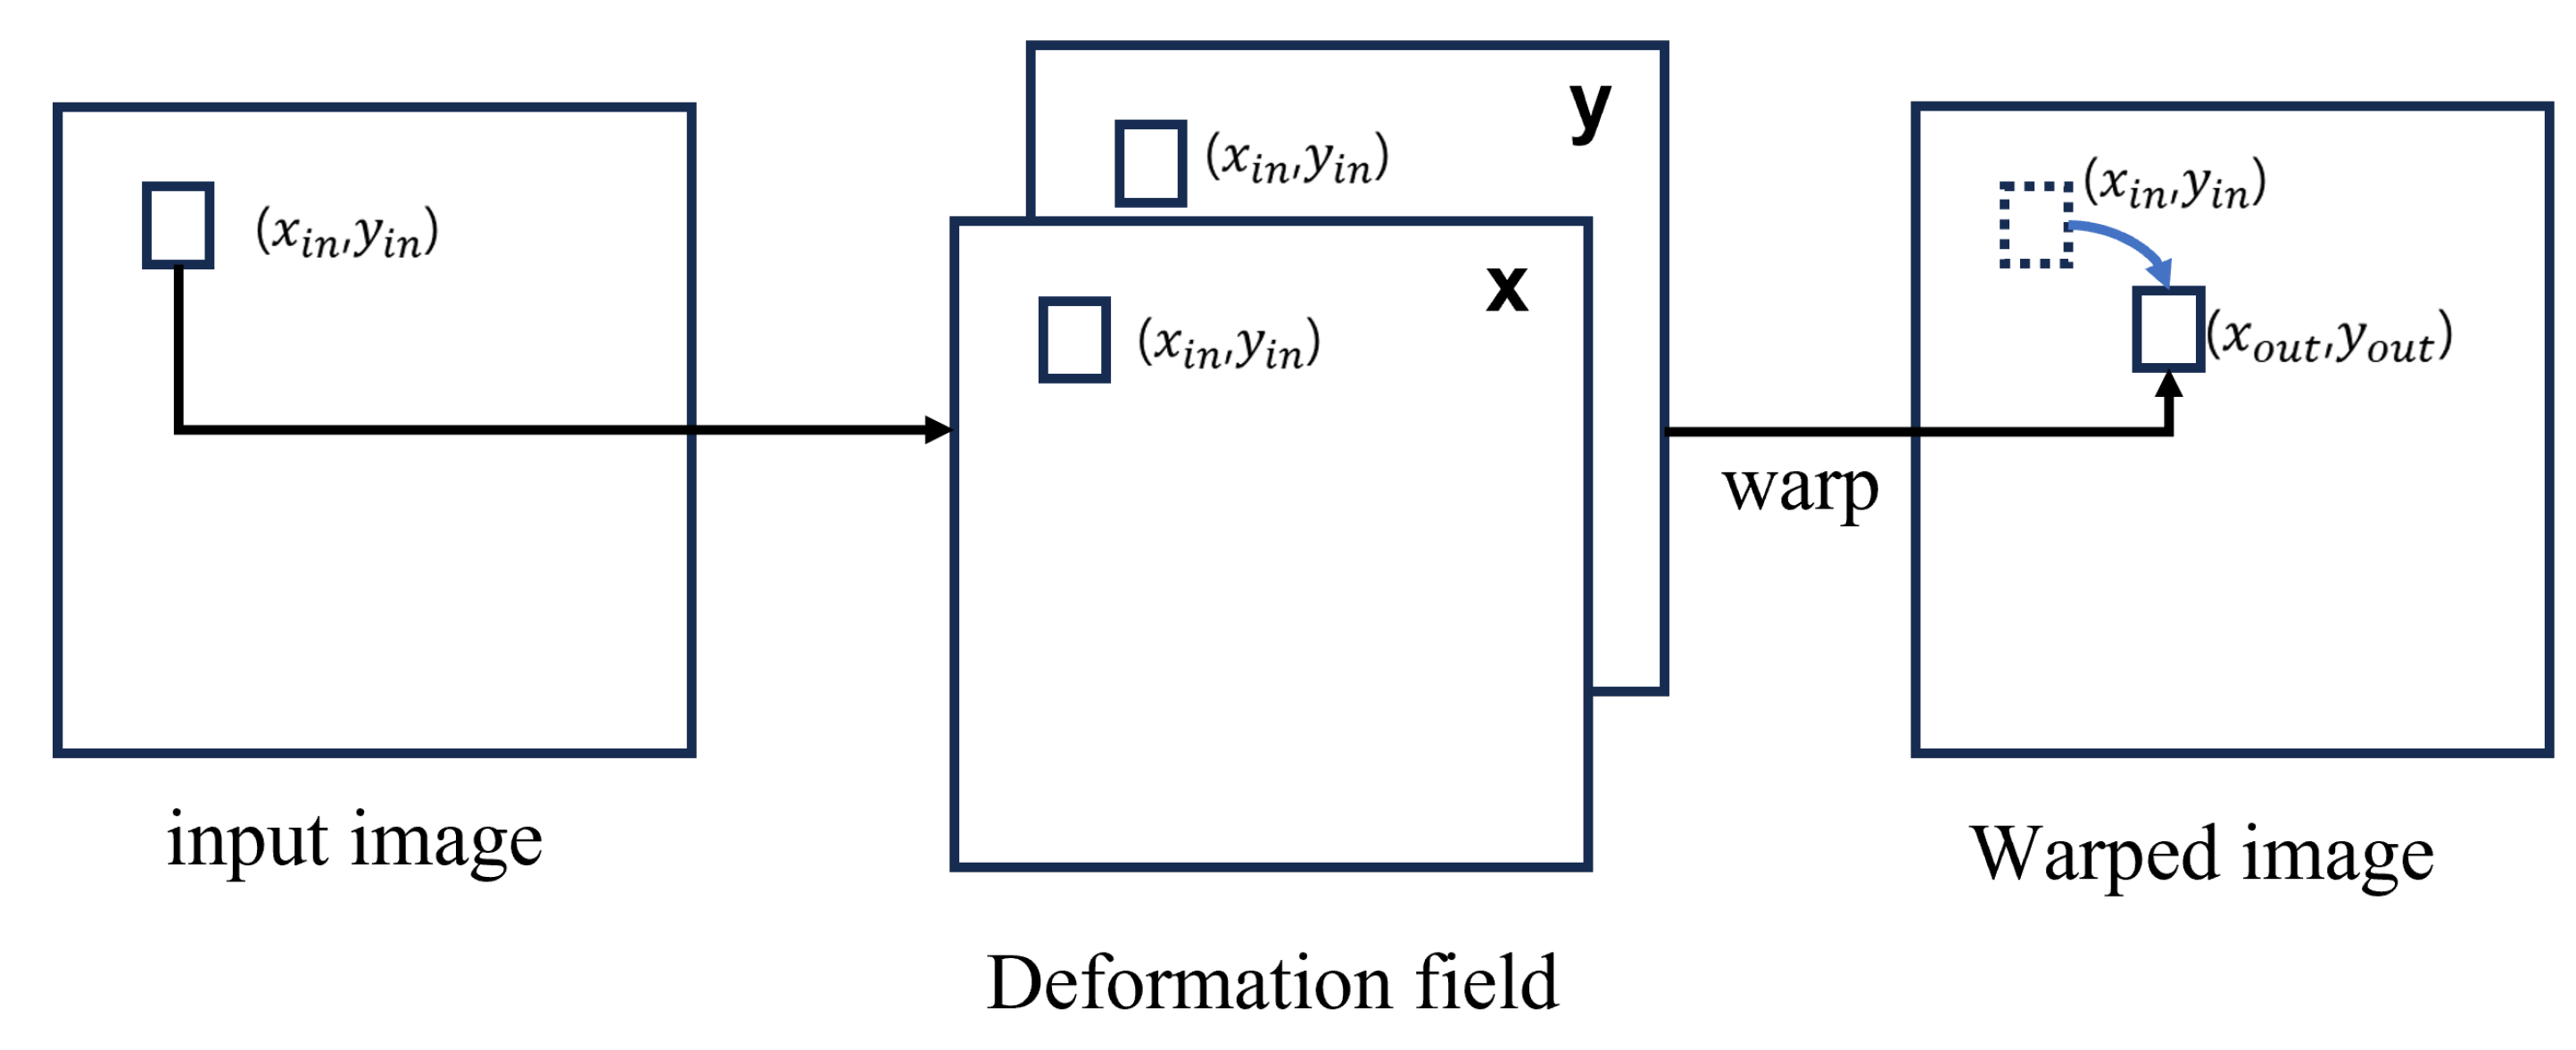
Figure 3 shows how the grid sampler changes the input image according to the deformation field. When any coordinate
of
is
v, when a value located in
v of
is defined as
, when the two-dimensional value is defined as
, and each pixel in
is transformed into an x-axis given as input, as in Equation
4. As shown in Equation
5, all coordinates in
are converted to obtain
, which is an image warped by the gird-sampler. In addition, the grid sampler did not participate in training, there were no learning parameters, and only the image translation step was performed.
3.3. Object function
3.3.1. Mask loss
To train the image registration process in the model, it is necessary to quantitatively indicate how the spatial match rate was calculated. In this study, this problem was solved by comparing the masking images of each RGB-IR image. Insert
and
into DFG to obtain the deformation field and then insert
and the deformation field into the Grid-sampler to obtain warped masking image
. Using L1loss,
and RGB masking image(
) were compared and used as the object function. Equation
7 represents the mask loss.
3.3.2. Smooth Loss
When converting an image using a grid sampler, it was necessary to limit the DFG to prevent the value of
from becoming too large to damage the spatial properties of existing images and to ensure the spatial locality. Smooth loss applying L1 regularization allows the deformation field (
) to represent a natural transformation. The smooth loss compares the similarity between each pixel and surrounding pixels in
obtained from DFG. When difference values in x-axis and y-axis between each pixel and surrounding pixels defined as
,
, Equation
8 shows the smooth loss.
Finally, the total loss used for model training is shown using Equation
9.
4. Experiment
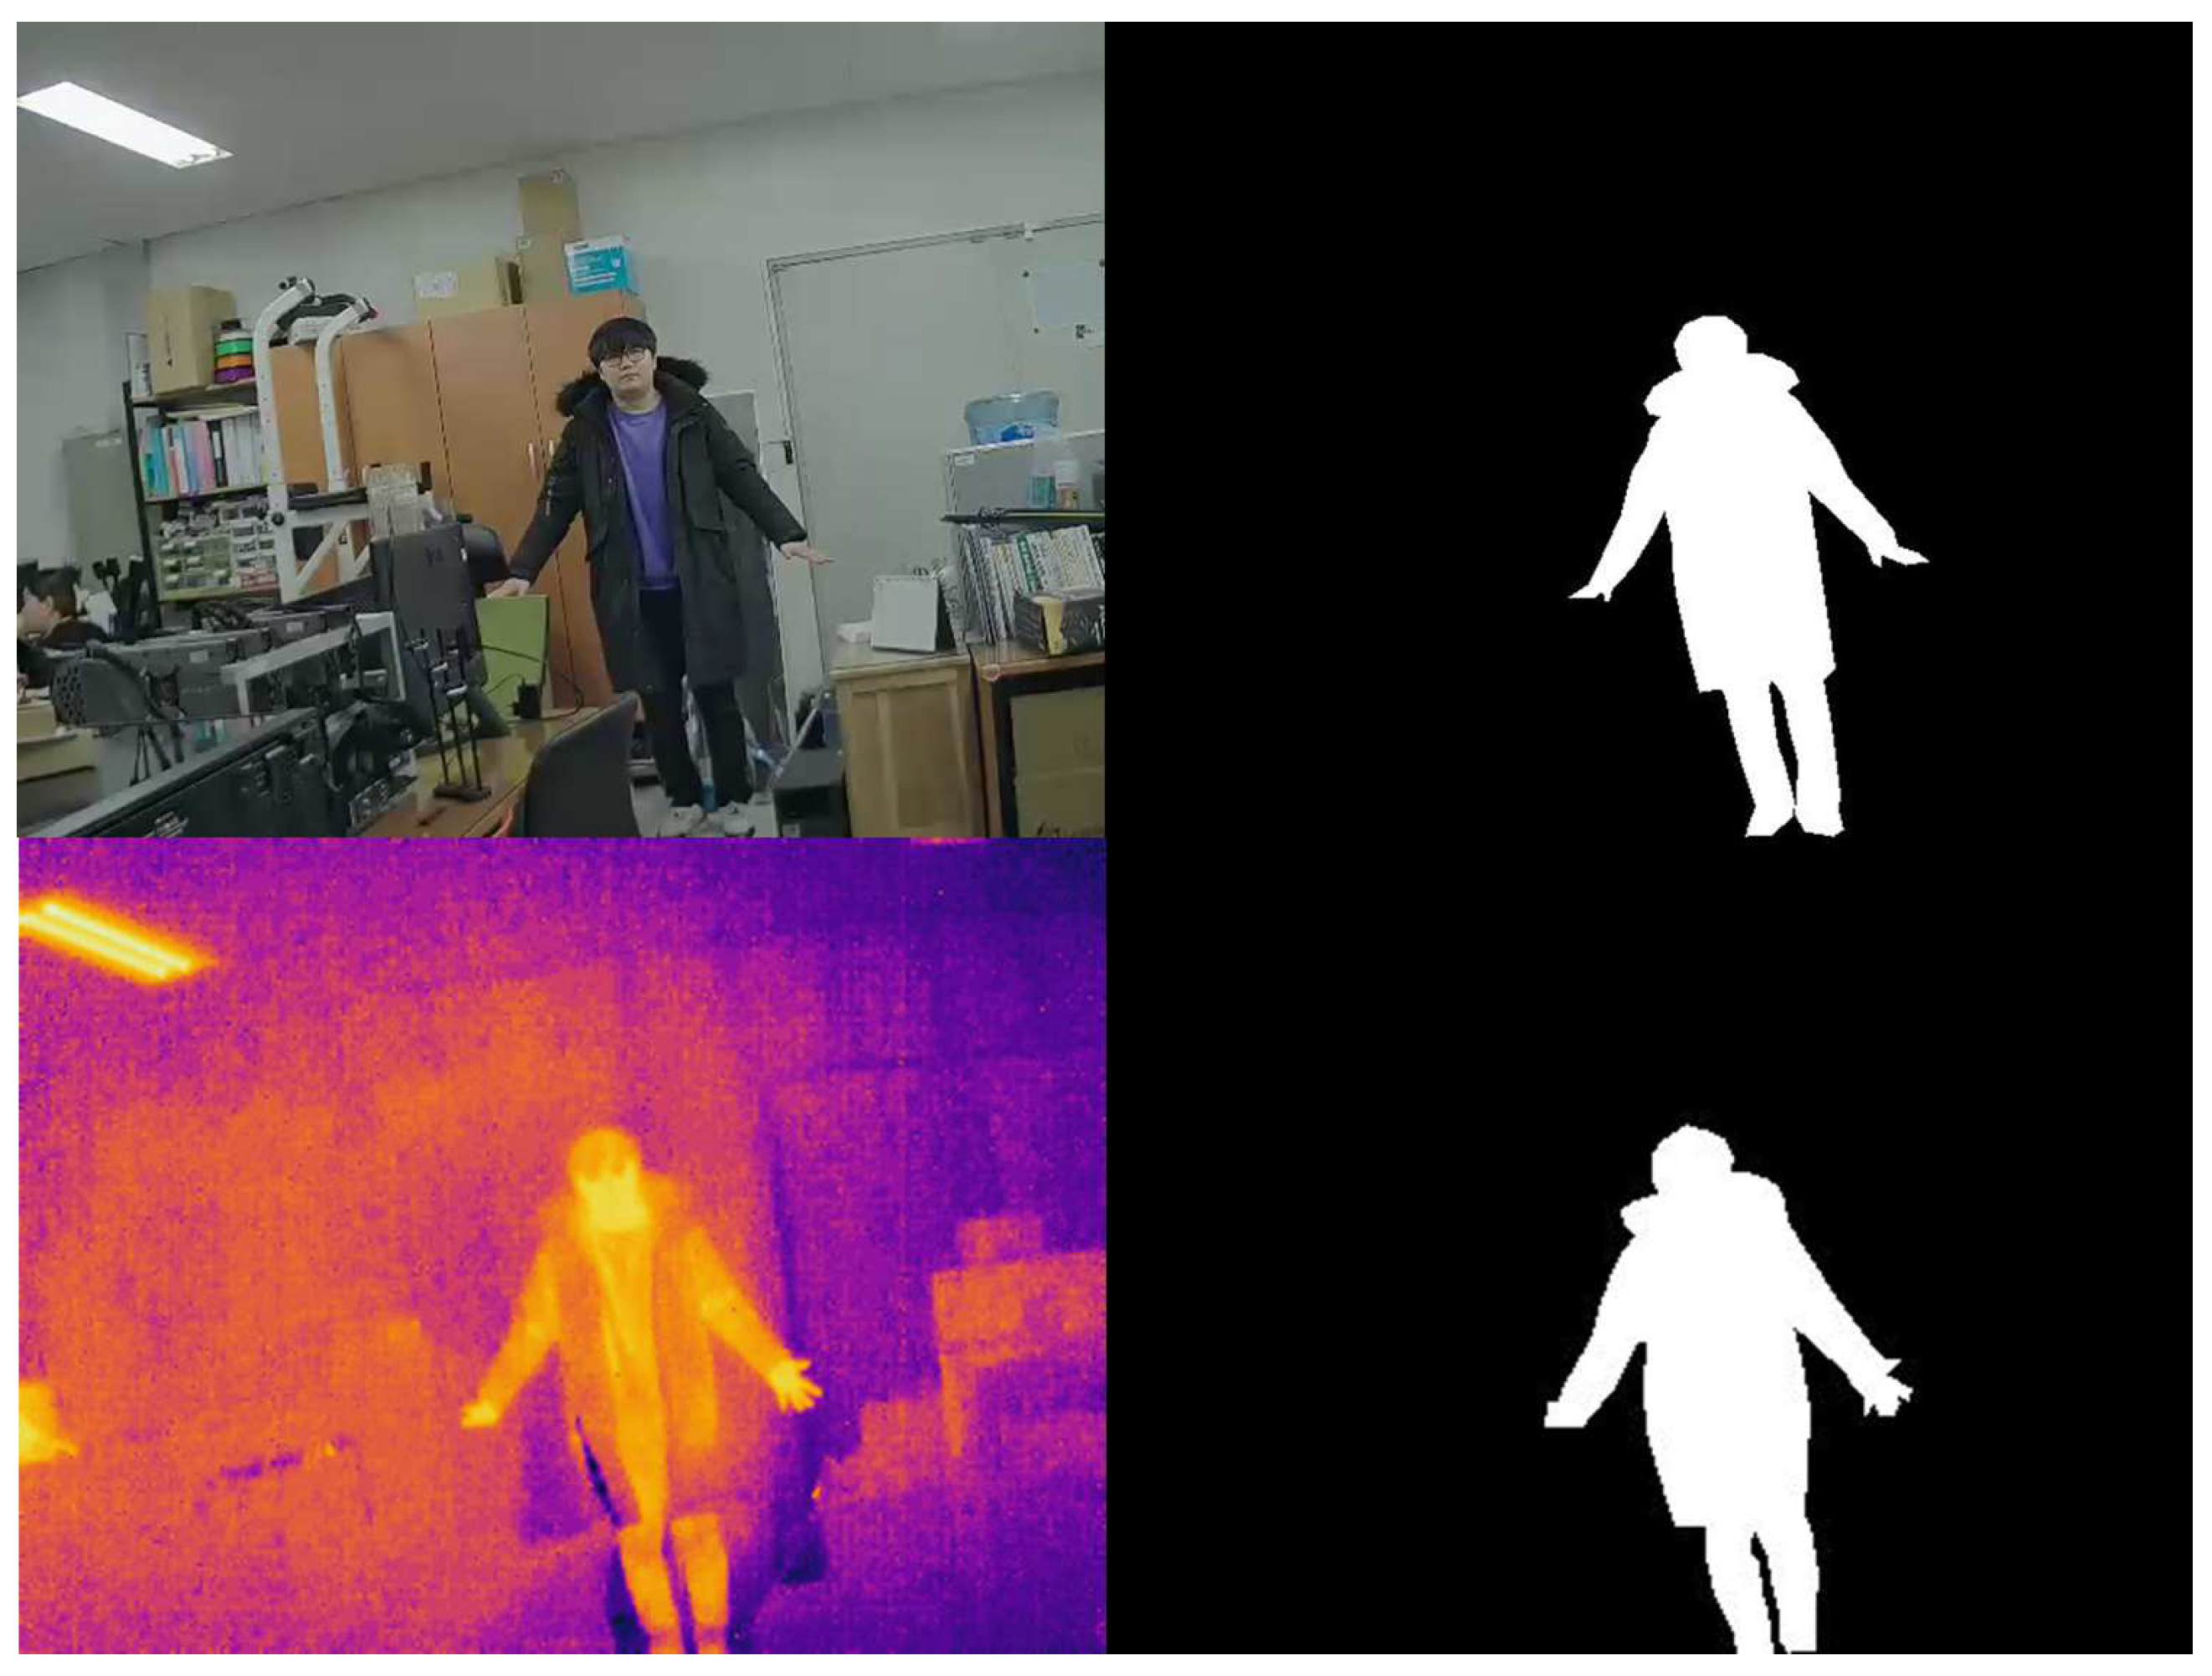
To obtain the dataset used in the experiment in this study, we used Ozray HK380,which has a thermal imaging sensor and an RGB sensor used at industrial sites. The specifications of each sensor are listed in
Table 1. The IR-RGB images measured from the camera are defined in units of one data according to the fps of each sensor of one data according to the fps of each sensor. In addition, annotation was performed on one object taken in the same IR image and RGB images of each data pair to generate a masking image for loss calculation and evaluation. A total of 3,296 images were captured by changing the shooting angle at three different locations.
Figure 5 shows a sample of the acquired dataset.
4.1. Evaluation
Intersection over union (IoU), a metric used in segmentation, was used as a metric to evaluate the proposed matching method. The deformation field (
) and IR masking image (
) obtained through DFG are input into a grid sampler to produce a matching IR masking image (
). Then, the IoU between
and
masks is calculated using Equation
10, which represents IoU.
4.2. Result
The dataset used in this experiment consists of 3,296 pairs of image frames of IR and RGB images and the corresponding masking images, of which 660 were used as test datasets, 20 percent, and the remaining 2,576 were used as train datasets. To determine whether our methodology is effective for image matching; we compute the inter-IoU pair ir-mask () and RGB-mask image () and then transform the IR-mask image(). After applying this methodology, we compared the IoU between and to compare IoU scores before and after applying the methodology. Comparison of the input size and performance according to the network depth of the model, the remaining layers of the DFG were changed to 3, 5, and 7 and the size of the input image was set to 640 × 480,512 × 512, and 256 × 256, and the application results were compared.
Table 2 shows that when the input size was
, and the number of residual layers was 5, IoU
was the highest, and when the residual layer was increased to 7, it was
, which was lower than when the number of layers was 5. When the input size was set to
, the performance was highest at IoU
when the number of residual layers was 3, and the performance was degraded at 5 when the number of layers was further increased. The larger the input size, the higher the matching performance and the higher the IoU score when the number of residual layers was properly adjusted depending on the input size.
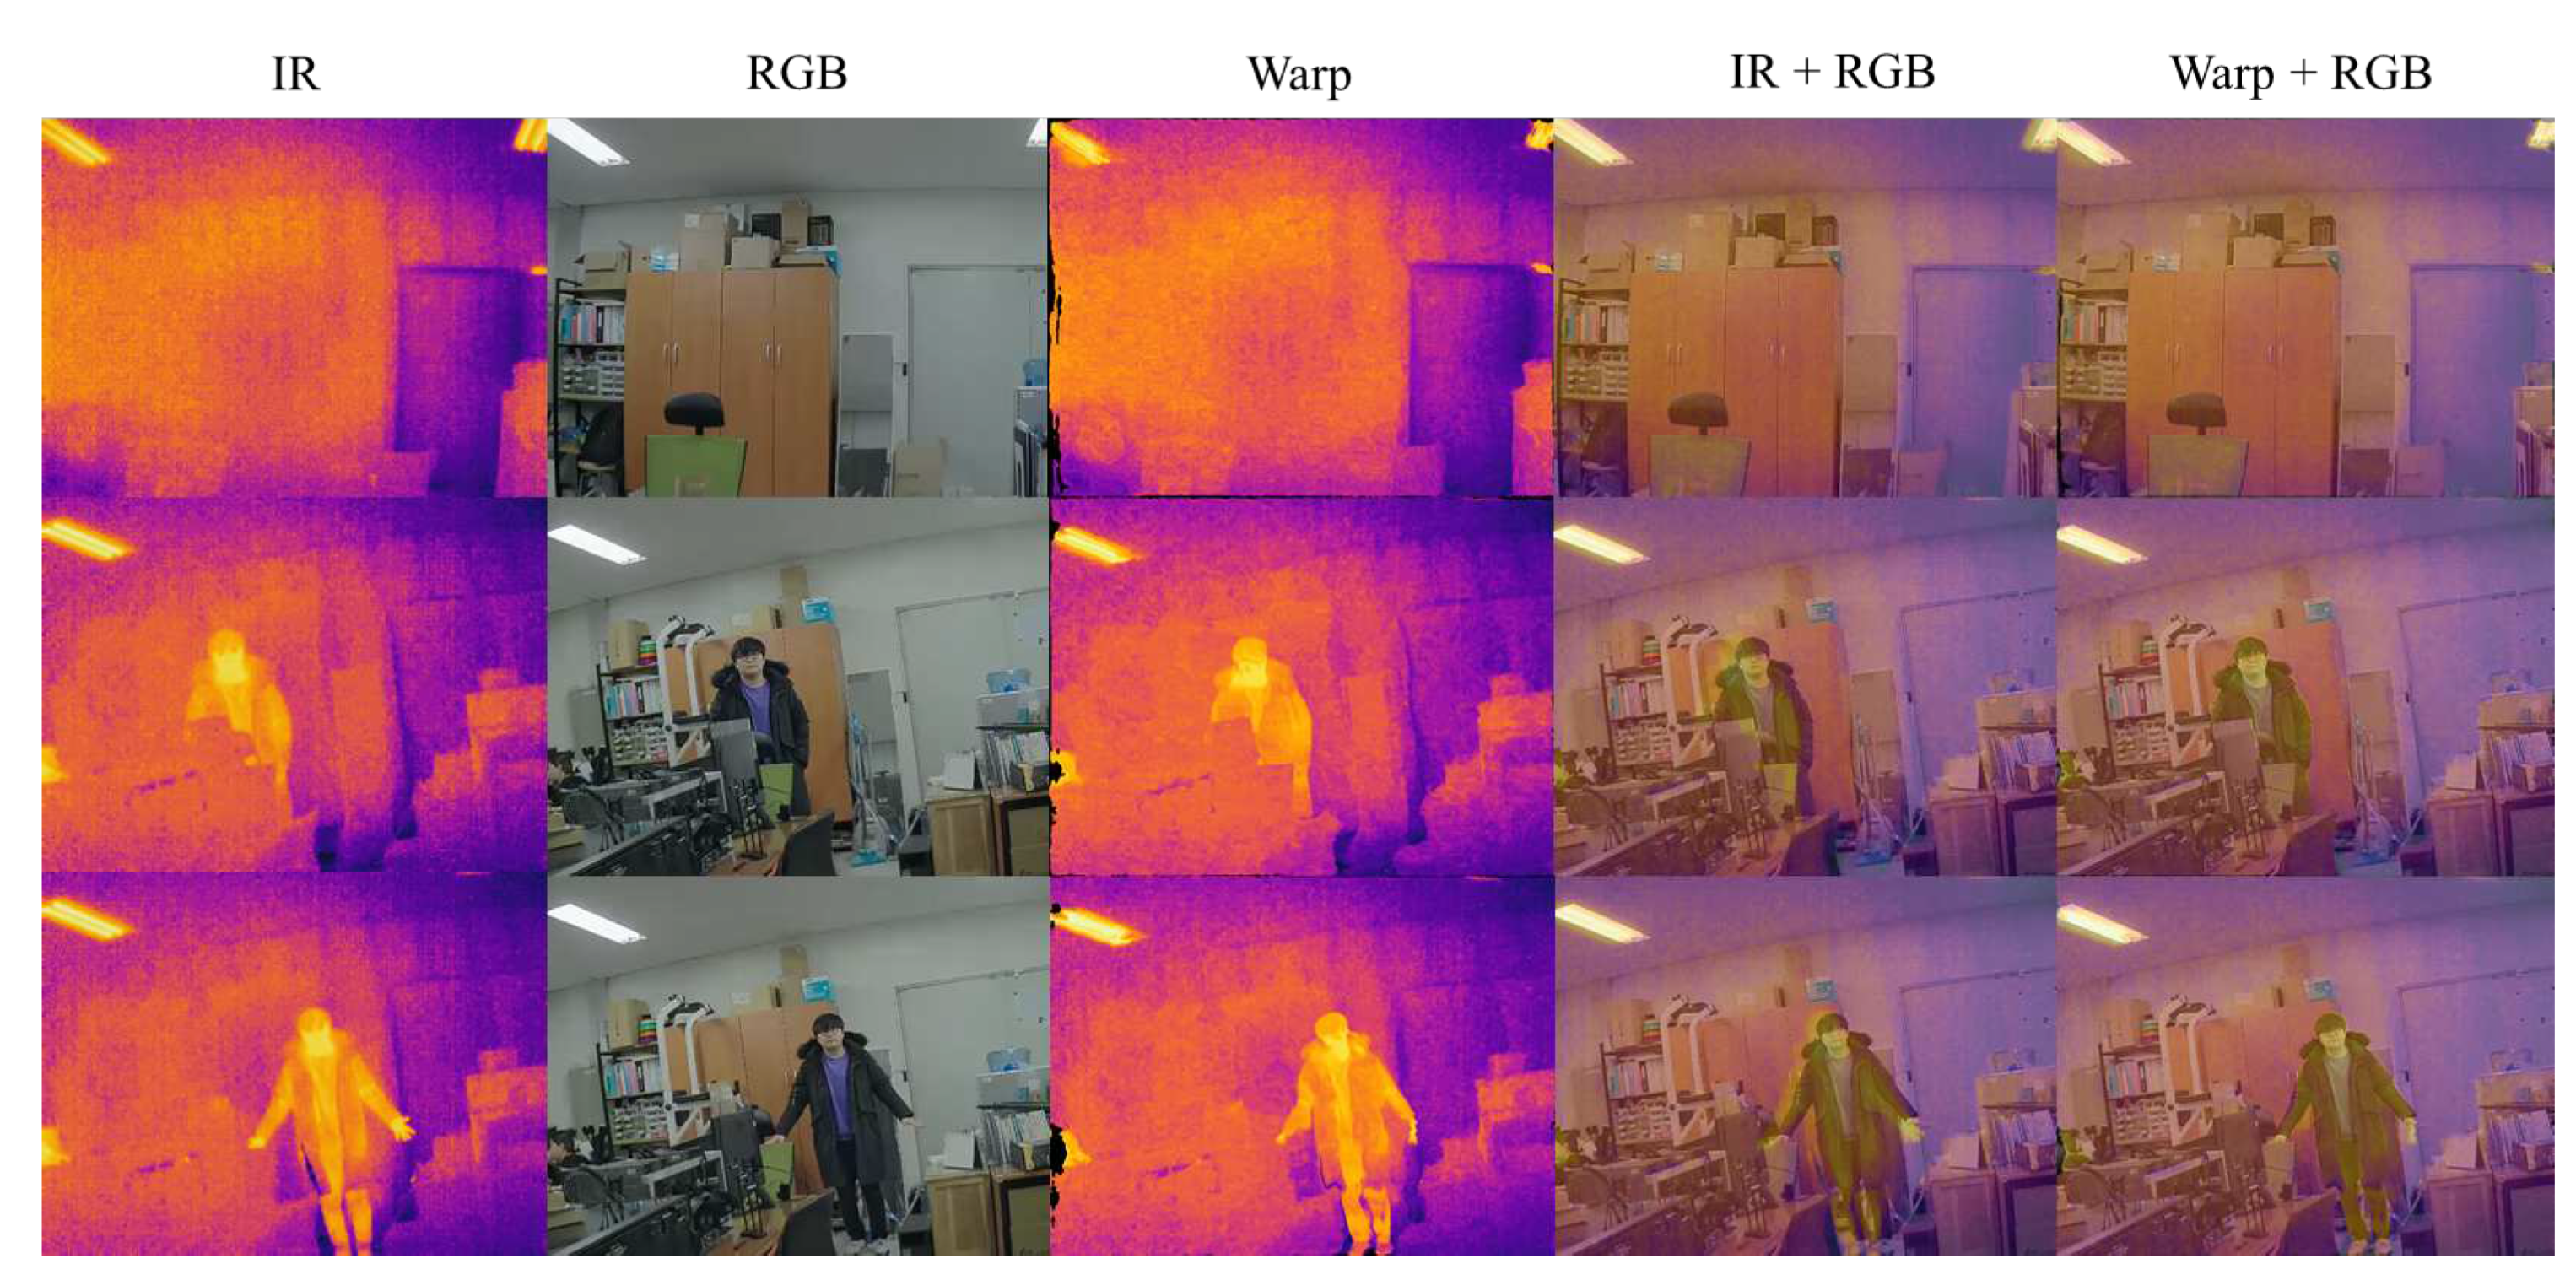
Figure 7 shows the results of matching the IR image using the proposed method. From left are IR images, RGB images, warped IR images, and alpha-blending results between
and
, and alpha-blending results between
and
.
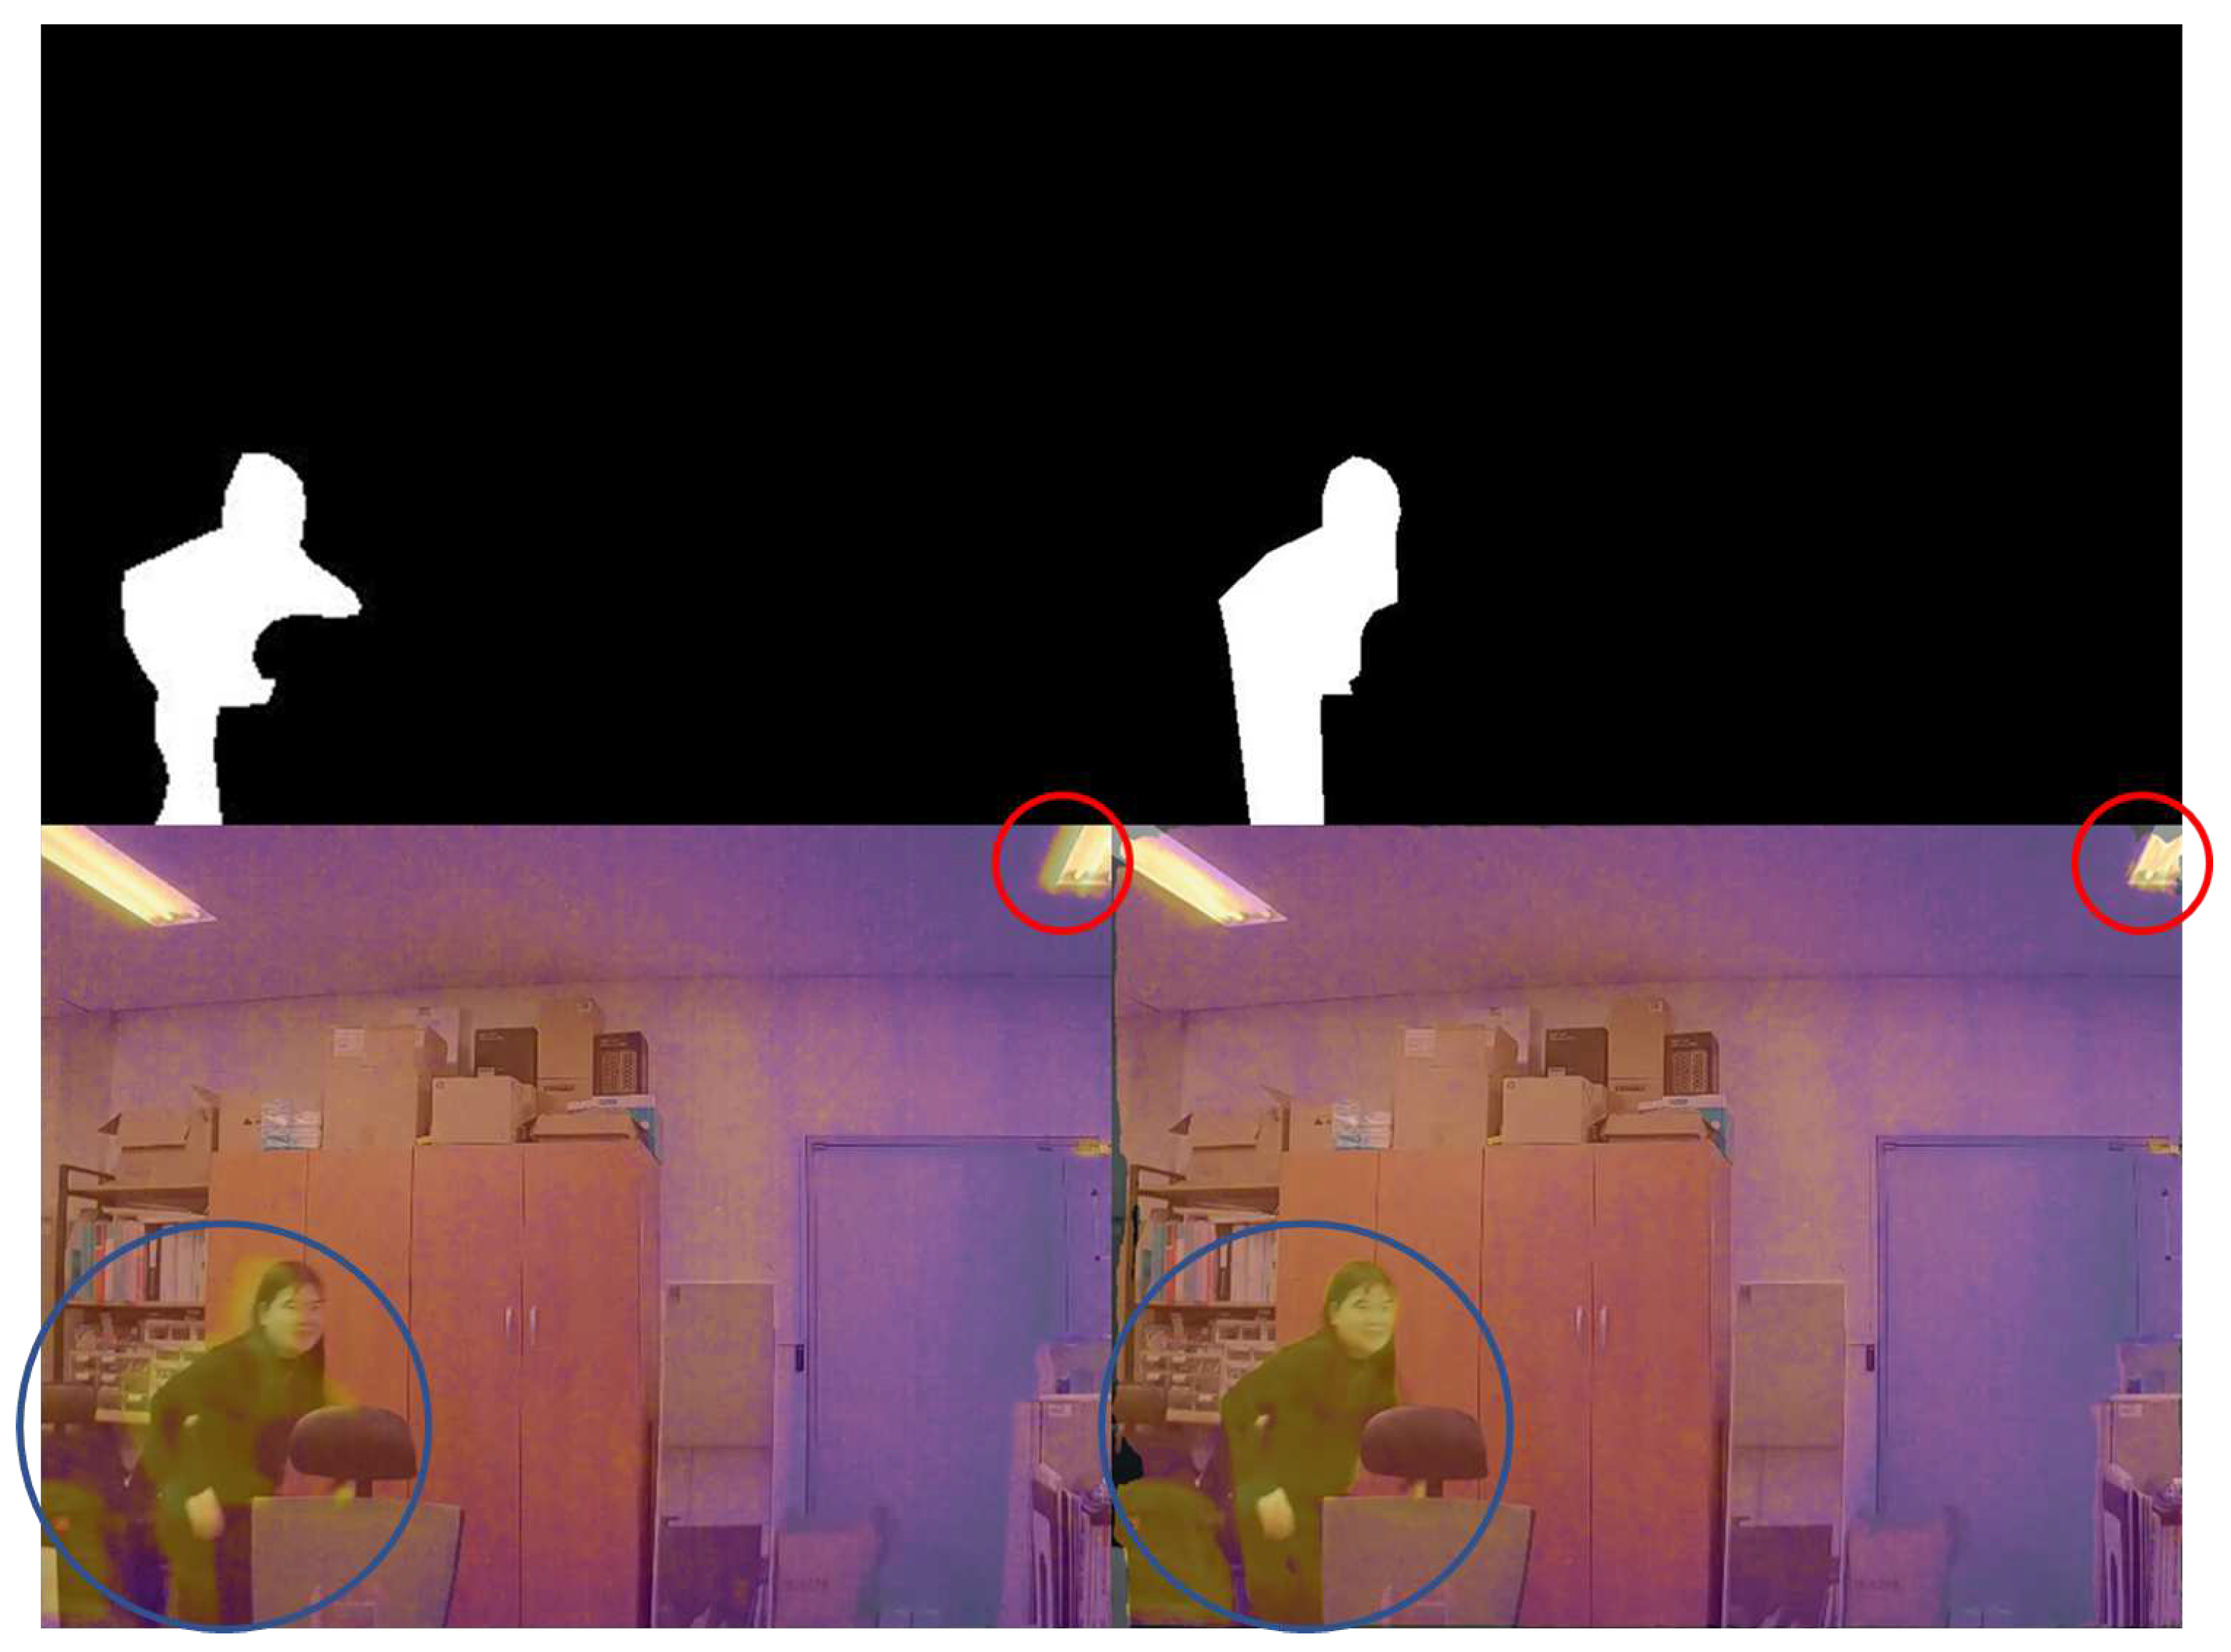
In addition, instead of using the same frame, matching was performed on an image with a frame difference of four between the RGB and IR images.
Figure 7 shows the result, and if you look at the part marked with a blue circle, it can be seen that the two images are matched, even though the human posture in the IR image and the posture in the RGB image are different. In addition, if we look at the part indicated by the orange circle, the image was corrected for lights that had not been segmented. This result indicates that the model learned the process of matching an entire image, even though a mask image segmented only one object common in the entire image was assigned for training.
5. Conclusion
In this study, a multi-modality image registration was conducted. The deformation field between the two images was inferred by receiving the IR and RGB images as input through the DFG network with two different modalities, and the IR image was corrected to match the RGB image using a grid sampler that converted the IR image based on inferred deformation fields. In addition, for the IR and RGB images, it was difficult to calculate the correction rate between the two images because they have different modalities. However, this study solved the problem by comparing the mask images rather than directly comparing the two images. Additionally, to prevent the spatial characteristics of the original data from being excessively distorted owing to the deformation file, locality was guaranteed through an identical field, which performs the same transformation, and Smooth loss, which compares the difference values with the surrounding pixels. To show that our proposed methodology is effective for multi-image registration, we conducted an experiment. As a result of the experiment, the IoU score of the original before matching increased by from to based on an input size of , and matching appeared in the entire image, including areas where masking information was not provided.
Author Contributions
Conceptualization, M.L.; methodology, M.L.; software, M.L.; validation, M.L.; formal analysis, M.L.; investigation, M.L.; resources, M.L; data curation, M.L.; writing—original draft preparation, M.L.; writing—review and editing, M.L. and J.K.; visualization, M.L.; supervision, M.L.,J.K.; project administration, J.K.; All authors have read and agreed to the published version of the manuscript.
Funding
This research received no external funding
Institutional Review Board Statement
Not applicable.
Informed Consent Statement
Informed consent was obtained from all subjects involved in the study.
Data Availability Statement
The data collected for this work is not available.
Acknowledgments
This work was supported by Korea Institute of Energy Technology Evaluation and Planning(KETEP) grant funded by the Korea government(MOTIE)(20224B10100060, Development of Artificial Intelligence Vibration Monitoring System for Rotating Machinery).
Conflicts of Interest
The authors declare no conflict of interest.
References
- Yang, L.; Ma, R.; Zakhor, A. Drone object detection using rgb/ir fusion. arXiv 2022, arXiv:2201.03786. [Google Scholar] [CrossRef]
- Lan, X.; Ye, M.; Zhang, S.; Zhou, H.; Yuen, P.C. Modality-correlation-aware sparse representation for RGB-infrared object tracking. Pattern Recognition Letters 2020, 130, 12–20. [Google Scholar] [CrossRef]
- Zhang, X.; Ye, P.; Leung, H.; Gong, K.; Xiao, G. Object fusion tracking based on visible and infrared images: A comprehensive review. Information Fusion 2020, 63, 166–187. [Google Scholar] [CrossRef]
- Cao, X.; Yang, J.; Wang, L.; Xue, Z.; Wang, Q.; Shen, D. Deep learning based inter-modality image registration supervised by intra-modality similarity. In Proceedings of the Machine Learning in Medical Imaging: 9th International Workshop, MLMI 2018, Held in Conjunction with MICCAI 2018, Granada, Spain, 16 September 2018; Proceedings 9; Springer International Publishing, 2018; pp. 55–63. [Google Scholar]
- Wei, W.; Haishan, X.; Alpers, J.; Rak, M.; Hansen, C. A deep learning approach for 2D ultrasound and 3D CT/MR image registration in liver tumor ablation. Computer Methods and Programs in Biomedicine 2021, 206, 106117. [Google Scholar] [CrossRef] [PubMed]
- Lei, Y.; Fu, Y.; Wang, T.; Liu, Y.; Patel, P.; Curran, W.J. . Yang, X. 4D-CT deformable image registration using multiscale unsupervised deep learning. Physics in Medicine & Biology 2020, 65, 085003. [Google Scholar]
- Kuppala, K.; Banda, S.; Barige, T.R. An overview of deep learning methods for image registration with focus on feature-based approaches. International Journal of Image and Data Fusion 2020, 11, 113–135. [Google Scholar] [CrossRef]
- DeTone, D.; Malisiewicz, T.; Rabinovich, A. Deep image homography estimation. arXiv 2016, arXiv:1606.03798. [Google Scholar]
- Zhang, J.; Wang, C.; Liu, S.; Jia, L.; Ye, N.; Wang, J. ; In .. & Sun, J. Content-aware unsupervised deep homography estimation. In Proceedings of the Computer Vision–ECCV 2020: 16th European Conference, Glasgow, UK, 23–28 August 2020; Proceedings, Part I 16; Springer International Publishing, 2020; pp. 653–669. [Google Scholar]
- Nie, L.; Lin, C.; Liao, K.; Liu, S.; Zhao, Y. Depth-aware multi-grid deep homography estimation with contextual correlation. IEEE Transactions on Circuits and Systems for Video Technology 2021, 32, 4460–4472. [Google Scholar] [CrossRef]
- Dosovitskiy, A.; Fischer, P.; Ilg, E.; Hausser, P.; Hazirbas, C.; Golkov, V. networks. In Proceedings of the Proceedings of the IEEE international conference on computer vision, 2015; pp. 2758–2766.
- Lefébure, M.; Cohen, L.D. Image registration, optical flow and local rigidity. Journal of Mathematical Imaging and Vision 2001, 14, 131–147. [Google Scholar] [CrossRef]
- Mocanu, S.; Moody, A.R.; Khademi, A. Flowreg: Fast deformable unsupervised medical image registration using optical flow. arXiv 2021, arXiv:2101.09639. [Google Scholar] [CrossRef]
- Yu, Q.; Jiang, Y.; Zhao; W; Sun, T. High-Precision Pixelwise SAR–Optical Image Registration via Flow Fusion Estimation Based on an Attention Mechanism. IEEE Journal of Selected Topics in Applied Earth Observations and Remote Sensing 2022, 15, 3958–3971. [Google Scholar] [CrossRef]
- Ilg, E.; Mayer, N.; Saikia, T.; Keuper, M.; Dosovitskiy, A.; Brox, T. Flownet 2. In 0: Evolution of optical flow estimation with deep networks. In Proceedings of the IEEE conference on computer vision and pattern recognition; 2017; pp. 2462–2470. [Google Scholar]
- Uzunova, H.; Wilms, M.; Handels, H.; Ehrhardt, J. Training CNNs for image registration from few samples with model-based data augmentation. In Proceedings of the Medical Image Computing and Computer Assisted Intervention—MICCAI 2017: 20th International Conference, Quebec City, QC, Canada, 11–13 September 2017; Proceedings, Part I 20; Springer International Publishing, 2017; pp. 223–231. [Google Scholar]
- Sun, D.; Yang, X.; Liu, M.Y.; Kautz, J. Pwc-net: Cnns for optical flow using pyramid, warping, and cost volume. In Proceedings of the IEEE conference on computer vision and pattern recognition; 2018; pp. 8934–8943. [Google Scholar]
- Wu, W.; Wang, Z.; Li, Z.; Liu, W.; Fuxin, L. Pointpwc-net: A coarse-to-fine network for supervised and self-supervised scene flow estimation on 3d point clouds. arXiv 2019, arXiv:1911.12408. [Google Scholar]
- Teed, Z.; Deng, J. Raft: Recurrent all-pairs field transforms for optical flow. Computer Vision–ECCV 2020: 16th European Conference, Proceedings, Part II 16. Glasgow, UK, 23–28 August 2020; Springer International Publishing, 2020; pp. 402–419. [Google Scholar]
- He, K.; Zhang, X.; Ren, S.; Sun, J. Deep residual learning for image recognition. In Proceedings of the IEEE conference on computer vision and pattern recognition; 2016; pp. 770–778. [Google Scholar]
- Zhang, Z.; Liu, Q.; Wang, Y. Road extraction by deep residual u-net. IEEE Geoscience and Remote Sensing Letters 2018, 15, 749–753. [Google Scholar] [CrossRef]
- Jha, D.; Smedsrud, P.H.; Riegler, M.A.; Johansen, D.; De Lange, T.; Halvorsen, P.; Johansen, H.D. (2019, December). Resunet++: An advanced architecture for medical image segmentation. 2019 IEEE international symposium on multimedia (ISM); IEEE; pp. 225–2255.
- Zitova, B.; Flusser, J. Image registration methods: a survey. Image and vision computing 2003, 21, 977–1000. [Google Scholar] [CrossRef]
- Derpanis, K.G. The harris corner detector. York University 2004, 2, 1–2. [Google Scholar]
- Goncalves, H.; Corte-Real, L.; Goncalves, J.A. Automatic image registration through image segmentation and SIFT. IEEE Transactions on Geoscience and Remote Sensing 2011, 49, 2589–2600. [Google Scholar] [CrossRef]
- Mair, E.; Hager, G.D.; Burschka, D.; Suppa, M.; Hirzinger, G. Adaptive and generic corner detection based on the accelerated segment test. Computer Vision–ECCV 2010: 11th European Conference on Computer Vision. Heraklion, Crete, Greece, September 5-11, 2010, Proceedings, Part II 11 (pp. 183-196).
Springer Berlin Heidelberg..
- Cho, K.; Van Merriënboer, B.; Gulcehre, C.; Bahdanau, D.; Bougares, F.; Schwenk, H.; Bengio, Y. Learning phrase representations using RNN encoder-decoder for statistical machine translation. arXiv 2014, arXiv:1406.1078. [Google Scholar]
- Arar, M.; Ginger, Y.; Danon, D.; Bermano, A.H.; Cohen-Or, D. Unsupervised multi-modal image registration via geometry preserving image-to-image translation. In Proceedings of the Proceedings of the IEEE/CVF conference on computer vision and pattern recognition, 2020; pp. 13410–13419.
|
Disclaimer/Publisher’s Note: The statements, opinions and data contained in all publications are solely those of the individual author(s) and contributor(s) and not of MDPI and/or the editor(s). MDPI and/or the editor(s) disclaim responsibility for any injury to people or property resulting from any ideas, methods, instructions or products referred to in the content. |
© 2023 by the authors. Licensee MDPI, Basel, Switzerland. This article is an open access article distributed under the terms and conditions of the Creative Commons Attribution (CC BY) license (http://creativecommons.org/licenses/by/4.0/).

