Preprint
Article

A Comparative Study of Equine Hoof Progenitor Cells and Adipose-Derived Stem Cells in Hyperinsulinemia

Altmetrics

Downloads

132

Views

66

Comments

0

Submitted:

22 September 2023

Posted:

25 September 2023

You are already at the latest version

Alerts
Abstract
Recently, we isolated and characterized a new pool of mesenchymal stem cells- HPC (Hoof Progenitor Cells), which reside in the coronary corium of equine hooves. We hypothesize, that due to their location, HPC may be involved in the pathogenesis of laminitis, and could possibly be utilized in its treatment. The aim of this study was to compare the newly described HPC to a well-established cell pool-ASC (Adipose Stem Cells). The two cell populations were maintained either in standard culture conditions or under a hyperinsulinemic milieu as hyperinsulinemia is often observed alongside laminitis. Cell cycle dynamics, mitochondrial membrane potential and oxidative stress were analyzed with microcapillary cytometry. Furthermore, the expression of key markers of mitochondrial metabolism, oxidative stress, apoptosis, immunomodulation and insulin signalling were analyzed with the RT-qPCR method. Additionally, a selected panel of miRNA was analyzed with the RT-qPCR method. In standard culture conditions, ASC exhibit higher proliferation than HPC while in hyperinsulinemia a shift towards S phase was observed in both populations. As for the mitochondrial membrane potential, in standard culture conditions, HPC was characterized by a higher percent of live cells. Hyperinsulinemia did not strongly affect the mitochondrial membrane potential of the analyzed populations. Our findings indicate that HPC are characterized by higher activity in terms of mitochondrial dynamics, mitophagy, and mitochondrial biogenesis under standard culture conditions. Yet in both populations, a diminished mitochondrial dynamic and metabolism was observed in hyperinsulinemia. The analysis of oxidative stress revealed, that HPC might possess somewhat higher resistance towards oxidative stress than ASC. Minimal change was observed in the expression of key markers of apoptosis in ASC and HPC under hyperinsulinemia. The analysis of key immunomodulatory markers indicated that HPC may help the cytokine storm for a more effective phenotype change to an immunosuppressing pool of cells with better migratory and healing abilities under hyperinsulinemia than ASC. As for insulin signalling, the obtained data suggests that HPC might be more resistant to hyperinsulinemia and may have greater therapeutic potential in reducing laminitis. Obtained results demonstrated that HPC possesses better potential to modulate the PTEN-AKT pathway by miR-21 and reverse high glucose and high insulin-induced insulin resistance. Taken together, the obtained results indicate that HPC may be a very promising cell pool with therapeutic potential in laminitis treatment, and could be more effective than ASC.
Keywords: 
Subject: Biology and Life Sciences  -   Biochemistry and Molecular Biology

1. Introduction

A direct response to the demand for effective and individualised treatment options for various human and animal conditions is the growth of stem cell-based therapy in regenerative medicine[1,2,3]. The main goal of stem cell-based therapy is to improve the repair of the targeted cells, tissues, or organs by restoring homeostasis and encouraging regeneration [3]. This objective is achieved by increasing the population of stem cells or influencing the activity of locally present endogenous stem cells [4]. In the past, various types of stem cells, such as multipotent mesenchymal stem cells (MSC) and induced pluripotent stem cells (IPSCs), have been investigated and used in clinical trials [5]. Furthermore, modern treatment strategies are willing to use MSCs derived from various sources. Most of which are muscle, bone marrow, adipose tissue, placenta, liver, and umbilical cord, and are widely used in various stem cell-based therapies in both human and veterinary medicine due to a lack of ethical concerns and a relatively simple isolation and culture process [5]. During the last decade, various studies have identified different molecular signatures and biological abilities for each MSC population, depending on the type of tissue from which they originate [6,7,8]. Therefore, the expected results of MSC-based therapies may strictly depend on their intrinsic properties [6]. Furthermore, the origin of donor stem cells and the condition play a crucial role in their therapeutic potential [6,9]. It is evident that resident stem cell populations are affected during the progression of numerous diseases and that their impairment contributes to the development of symptoms, as they influence the function of other cell types within the tissue [10,11,12]. Adipose-derived stem cells (ASC) are one of the most promising subsets of MSC due to their isolation, which is easily accessible in large amounts and has been used in a variety of clinical applications [13]. Furthermore, numerous soluble mediators, inflammatory cytokines, and trophic and growth factors, including vascular endothelial growth factor (VEGF), hepatocyte growth factor (HGF), brain-derived neurotrophic factor (BDNF), insulin-like growth factor (IGF), basic fibroblast growth factor (bFGF), transforming growth factor beta 1 (TGF-1) and interleukins, as well as paracrine factors that aid tissue regeneration, wound healing, and organ regeneration, are secreted by ASC [14]. Recently, we isolated and described new stem progenitor cells (HPC) that reside in the coronary corium of the equine hoof [15]. These cells have shown high levels of gene expression of surface markers such as cell adhesion molecules CD29 and an immunoglobulin superfamily membrane protein CD200, as well as nestin, a class VI intermediate filament protein, keratin 15 (K15), vascular endothelial growth factor (VEGF), and angiopoietin-1 (Ang1), indicating their high potential role in regeneration of the dermis and epidermis during laminitis [15]. Furthermore, as with other stem cell populations, HPC may be affected by inflammation in the same way that ASC are affected by equine metabolic syndrome (EMS), a disorder in which inflammation is one of the critical components for the development of insulin resistance [16,17]. Furthermore, laminitis, associated with conditions such as EMS, can develop as a result of endocrinopathy in association with dysregulation of insulin homeostasis, often in obese horses and foals. It is also worse in animals that graze in lush pastures (pasture laminitis) [18]. Therefore, it is believed that hyperinsulinemia with or without IR, which can occur as transient or persistent postprandial hyperinsulinemia, is the most common and important pathophysiologic factor of laminitis and has profound consequences for horses [19,20,21,22]. The common explanation is that chronically high doses of insulin in the bloodstream could cross-react with IGF-1 receptors, which are abundant in lamellar tissue. According to this notion, insulin-mediated activation of the IGF-1 receptor can cause lamellar structural damage by stimulating cell proliferation [23,24]. However, this theory has since been called into question [23]. Recent research has revealed that lamellar epithelial cells exposed to insulin proliferate, which can be blocked by an IGF-1 receptor-blocking antibody. Abnormal cell signalling may occur in conjunction with growth factor-activated cell proliferation, altering the cellular cytoskeleton and/or cell adhesion dynamics. Furthermore, during the acute stage of laminitis, there is a decrease in mitochondrial respiration. A decrease in the activity of the mitochondrial oxidative phosphorylation system (OXYPHOS) may lead to a decrease in the levels of ATP in the cells. This is particularly true if the glycolytic pathway is unable to compensate for inadequate ATP. A decrease in the availability of nutrients and/or oxygen may result in an energy deficit, as may mitochondrial dysfunction itself [25]. Therefore, targeting mitochondria during EMS and Laminitis should be considered essential to a better understanding of the physiopathology and new treatment strategies that support mitochondria, preventing their dysfunction and maintaining their homeostasis. Persistent hyperinsulinemia also causes stress in the endoplasmic reticulum, disrupting the complex lamellar architecture. Furthermore, there is limited evidence to support a specific therapeutic method that directly inhibits the progression of laminitis in active episodes. Endocrinopathic laminitis therapy is very difficult and focuses mainly on prevention interventions and analgesia in active patients. Therefore, we hypothesise that Equine Hoof Progenitor Cells (HPC) could be a new promising cell pool for the treatment of laminitis. Therefore, this study aimed to compare native HPC populations with ASC under both standard culture and hyperinsulinemic conditions.

2. Results

2.1. Hyperinsulinemia exerts a similar effect on the cell cycle dynamics in ASC and HPC
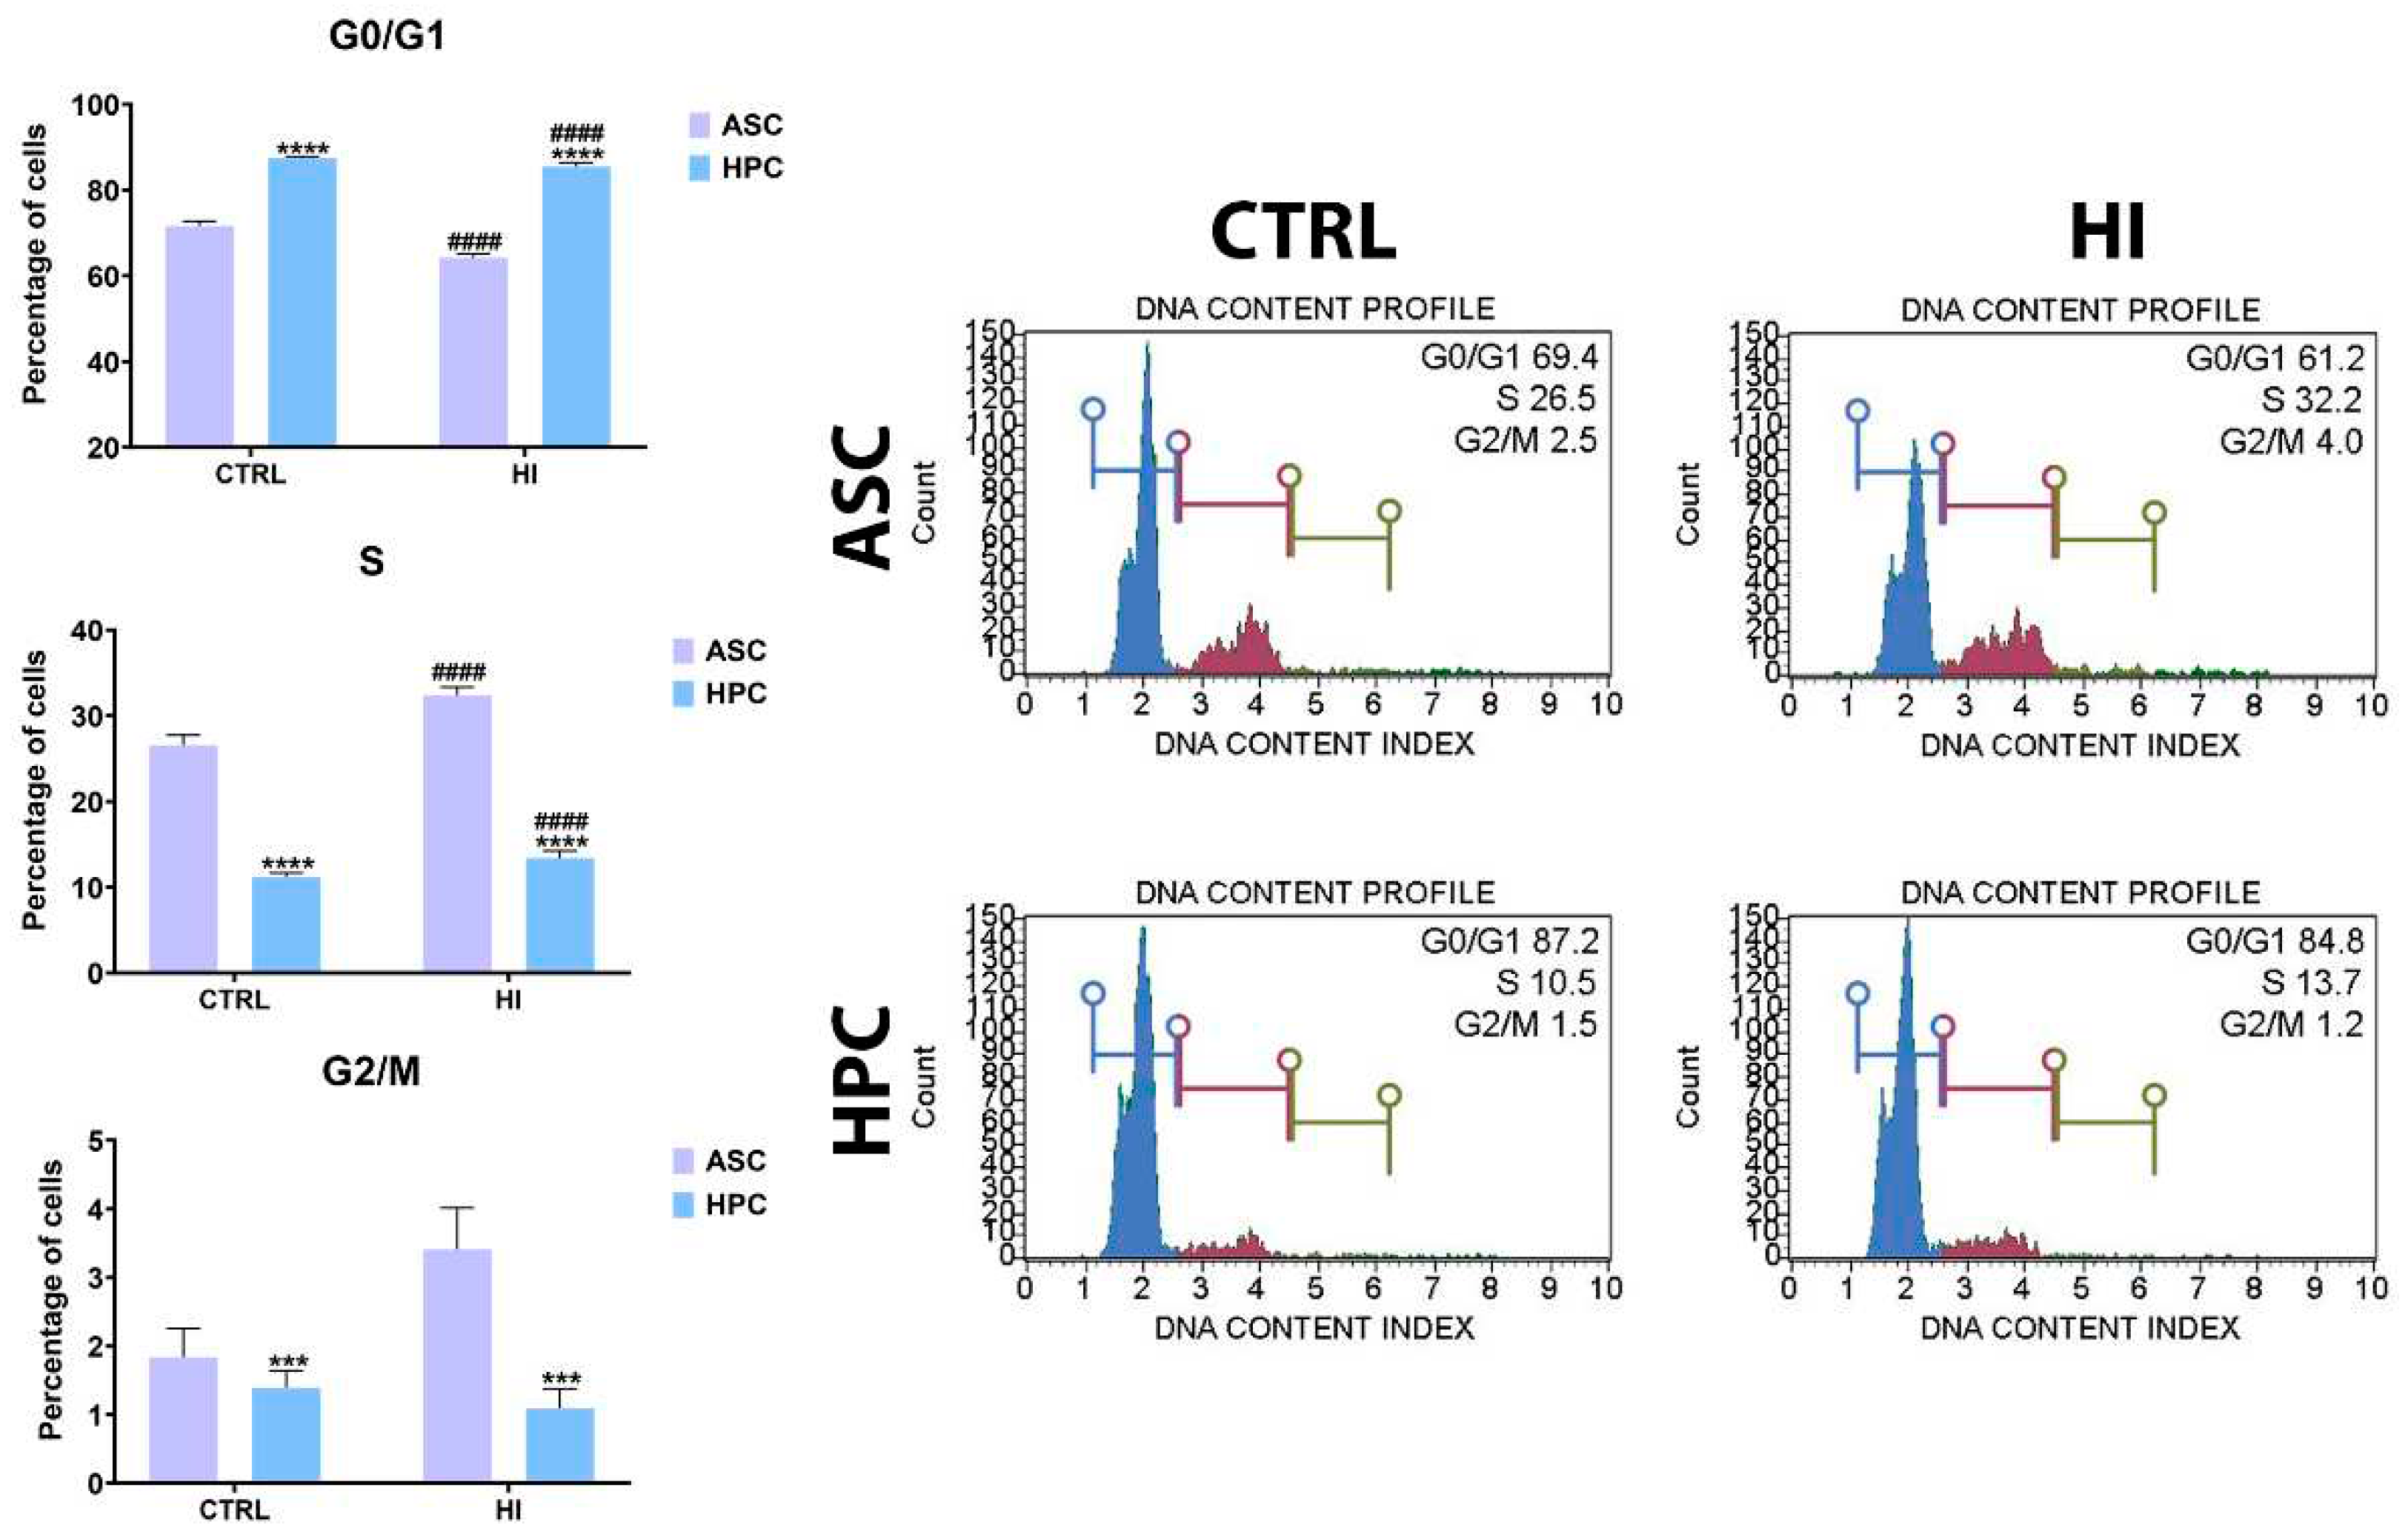
To assess the cell cycle dynamics in ASC and HPC under standard and hyperinsulinemia conditions, a microcapillary cell cycle analysis was performed. Under standard conditions, HPC were characterised by a significantly higher percentage of cells in the G0/G1 phase (****) and a lower percentage of cells in the S phase (****) and the G2/M phase (***). In both cell populations, as a result of the insulin treatment, the percentage of cells in the G0/G1 phase decreased while the percentage of cells in the S phase increased significantly. Interestingly, the hyperinsulinemia conditions did not affect the percentage of cells in the G2/M phase.
Figure 1. Cell cycle analysis was performed using a Muse™ Cell Cycle Assay Kit and the Muse™ Cell Analyzer. Results are expressed as mean ± SD. The statistically significant difference between the ASC and HPC is marked with an asterisk (*p < 0.05, **p < 0.01, ***p < 0.001,***p < 0.0001), while the statistically significant difference between the control group (CTRL) and the hyperinsulinemia group (HI) is marked with a hash sign (#p < 0.05, ##p < 0.01, ###p < 0.001,####p < 0.0001).
Preprints 85905 g001

2.2. Mitochondrial membrane potential is not strongly influenced by hyperinsulinemia in ASC and HPC.
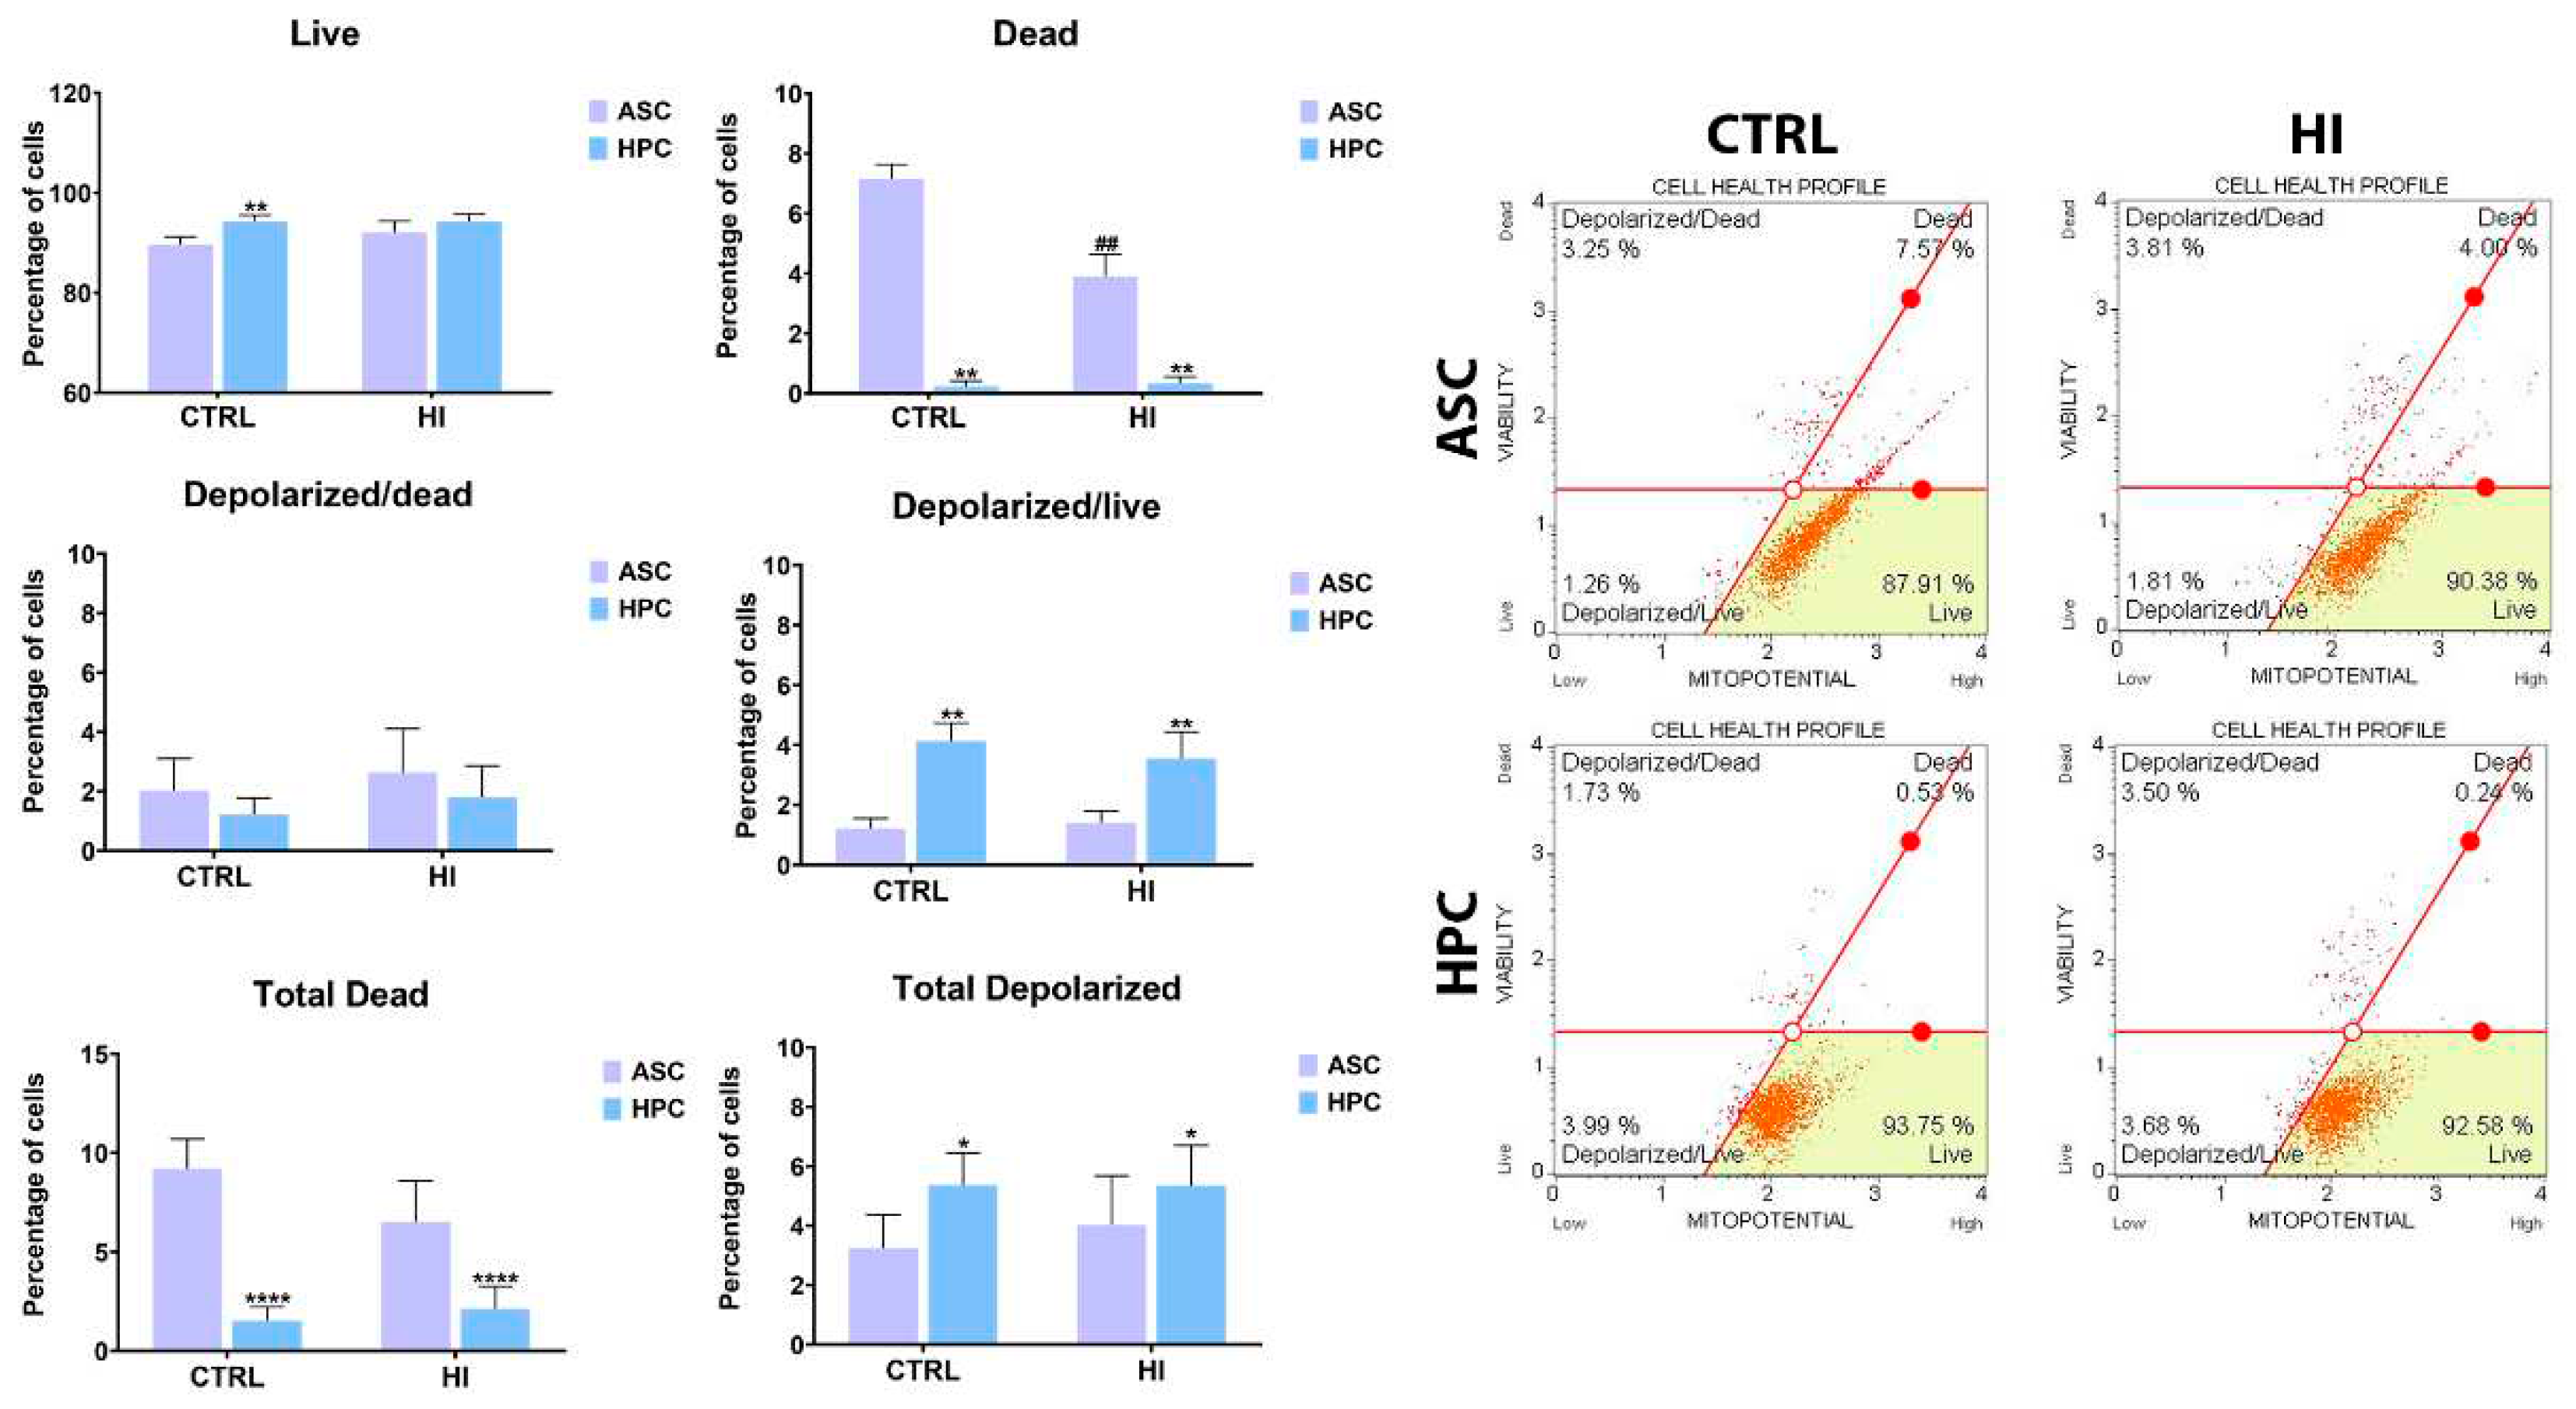
To elucidate the effect of hyperinsulinemia on metabolic activity, a mitochondrial membrane evaluation was performed using a Muse® MitoPotential Assay Kit (Luminex). In standard culture conditions, HPC were characterised by a higher percentage of alive cells (**) and a lower percentage of dead(**) and total dead cells (****), compared to ASC. Furthermore, a higher percentage of alive cells with depolarised membranes (**) and total depolarized cells(*) was observed in HPC in standard culture conditions. There was no significant difference in the number of dead cells with depolarised membranes and the total depolarized cell count between all experimental groups. Interestingly, the percentage of dead cells (##) decreased in ASC after hyperinsulinemia induction. Generally, hyperinsulinemia did not strongly affect the mitochondrial membrane potential of both populations.
Figure 2. Mitochondrial membrane potential was assessed using the Muse® MitoPotential Assay Kit and the Muse™ Cell Analyser. Results are expressed as mean ± SD. The statistically significant difference between ASC and HPC is marked with an asterisk (*p < 0.05, **p < 0.01, ***p < 0.001, **** p < 0.0001), while the statistically significant difference between the control group (CTRL) and the hyperinsulinemia group (HI) is marked with a hash sign (#p < 0.05, ##p < 0.01, ###p < 0.001, #### p < 0.0001).
Preprints 85905 g002

2.3. Hyperinsulinemia exerts a different effect on the mitochondrial metabolism of ASC and HPC
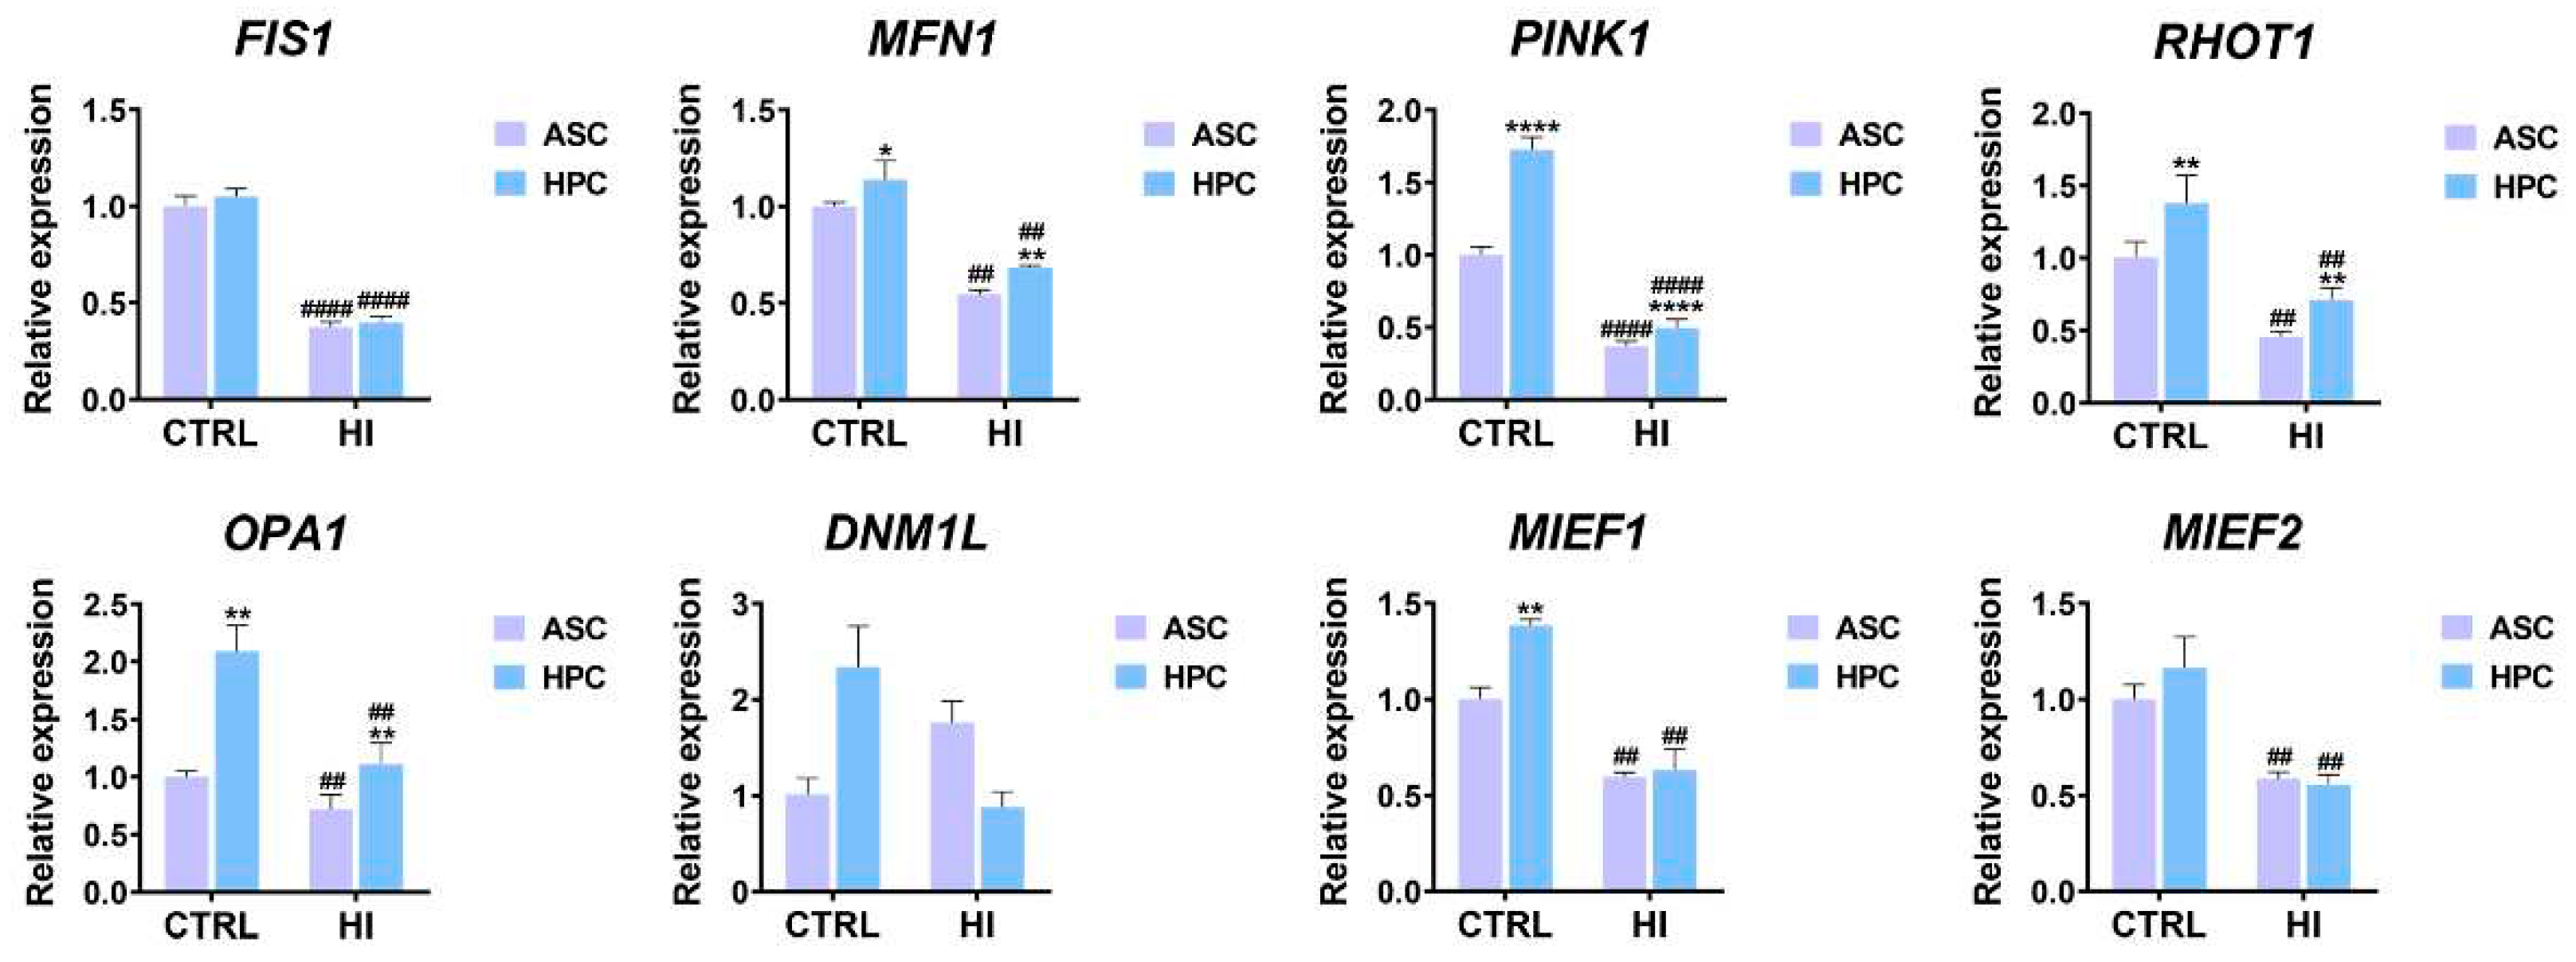
To analyse the effect of hyperinsulinemia on mitochondrial metabolism in ASC and HPC, the expression of key markers for mitophagy, fission&fussion, mitochondria trafficking and metabolism was evaluated with the RT-qPCR method. The expression of markers related to fission and fusion was generally higher in HPC in standard culture conditions when compared to ASC (MFN1*, RHOT1**, OPA1**, MIEF1**), except for FIS1, DNM1L AND MIEF2, where there was no significant difference between the groups. Furthermore, the expression of PINK1(****), a marker of mitophagy, was also higher in HPC in standard culture conditions. Overall, the expression of fission and fusion-related markers, as well as the mitophagy marker PINK1, decreased as a result of the hyperinsulinemia induction in both groups, except for DNML1, in which case, no significant difference was observed when comparing standard culture groups to hyperinsulinemia groups. Interestingly, the expression of MFN1(**), PINK1(****), RHOT1(**) AND OPA1(**) was higher in the HPC HI group, compared to the ASC HI group.
Figure 3. The expression of key markers for mitophagy and mitochondrial fission&fussion was assessed using the RT-qPCR method. Results are expressed as mean ± SD. The statistically significant difference between ASC and HPC is marked with an asterisk (*p < 0.05, **p < 0.01, ***p < 0.001, ****p < 0.0001), while a statistically significant difference between the control group (CTRL) and the hyperinsulinemia group (HI) is marked with a hash sign (#p < 0.05, ##p < 0.01, ###p < 0.001, ####p < 0.0001).
Preprints 85905 g003
Furthermore, the expression of mitochondrial metabolism markers was generally higher in HPC in standard culture conditions (MRPL24****, MTERF4**, OXA1L**, PPARGC1B****, TFAM**, NDUFA9**, UQCRC2****, COX4I1****) except for PUSL1 and PIGBOS1, for which no statistical significance in expression between the groups was observed. After insulin treatment, the expression of most markers analysed decreased in ASC (MRPL24#### OXA1L##, PPARGC1B####, PIGBOS1####, TFAM##, NDUFA9##, UQCRC2####, COX4I1####), except for MTERF4 and PUSL1, where no statistical significance has been noted. A similar trend was observed in HPC (MRPL24#, MTERF4##, OXA1L##, PPARGC1B####, PIGBOS1####, TFAM##, NDUFA9##, UQCRC2####, COX4I1####) except for PUSL1, in which case there was no difference in the expression between the untreated and insulin-treated HPC. Overall, in standard culture conditions and under hyperinsulinemia, the expression of most analyzed markers was significantly higher in HPC when compared to ASC. Finally, the mitochondrial network was visualized with fluorescent staining (Figure 4A), and the fluorescence intensity was measured with Fiji just ImageJ software (Figure 4C). There was no difference between ASC and HPC fluorescence intensity in standard culture conditions, however, the fluorescence intensity was significantly higher after the hyperinsulinemia induction in both populations. Additionally, after the insulin treatment, the fluorescence intensity in HPC was significantly lower when compared to ASC.

2.4. Hyperinsulinemia exerts a different effect on ASC and HPC oxidative stress levels

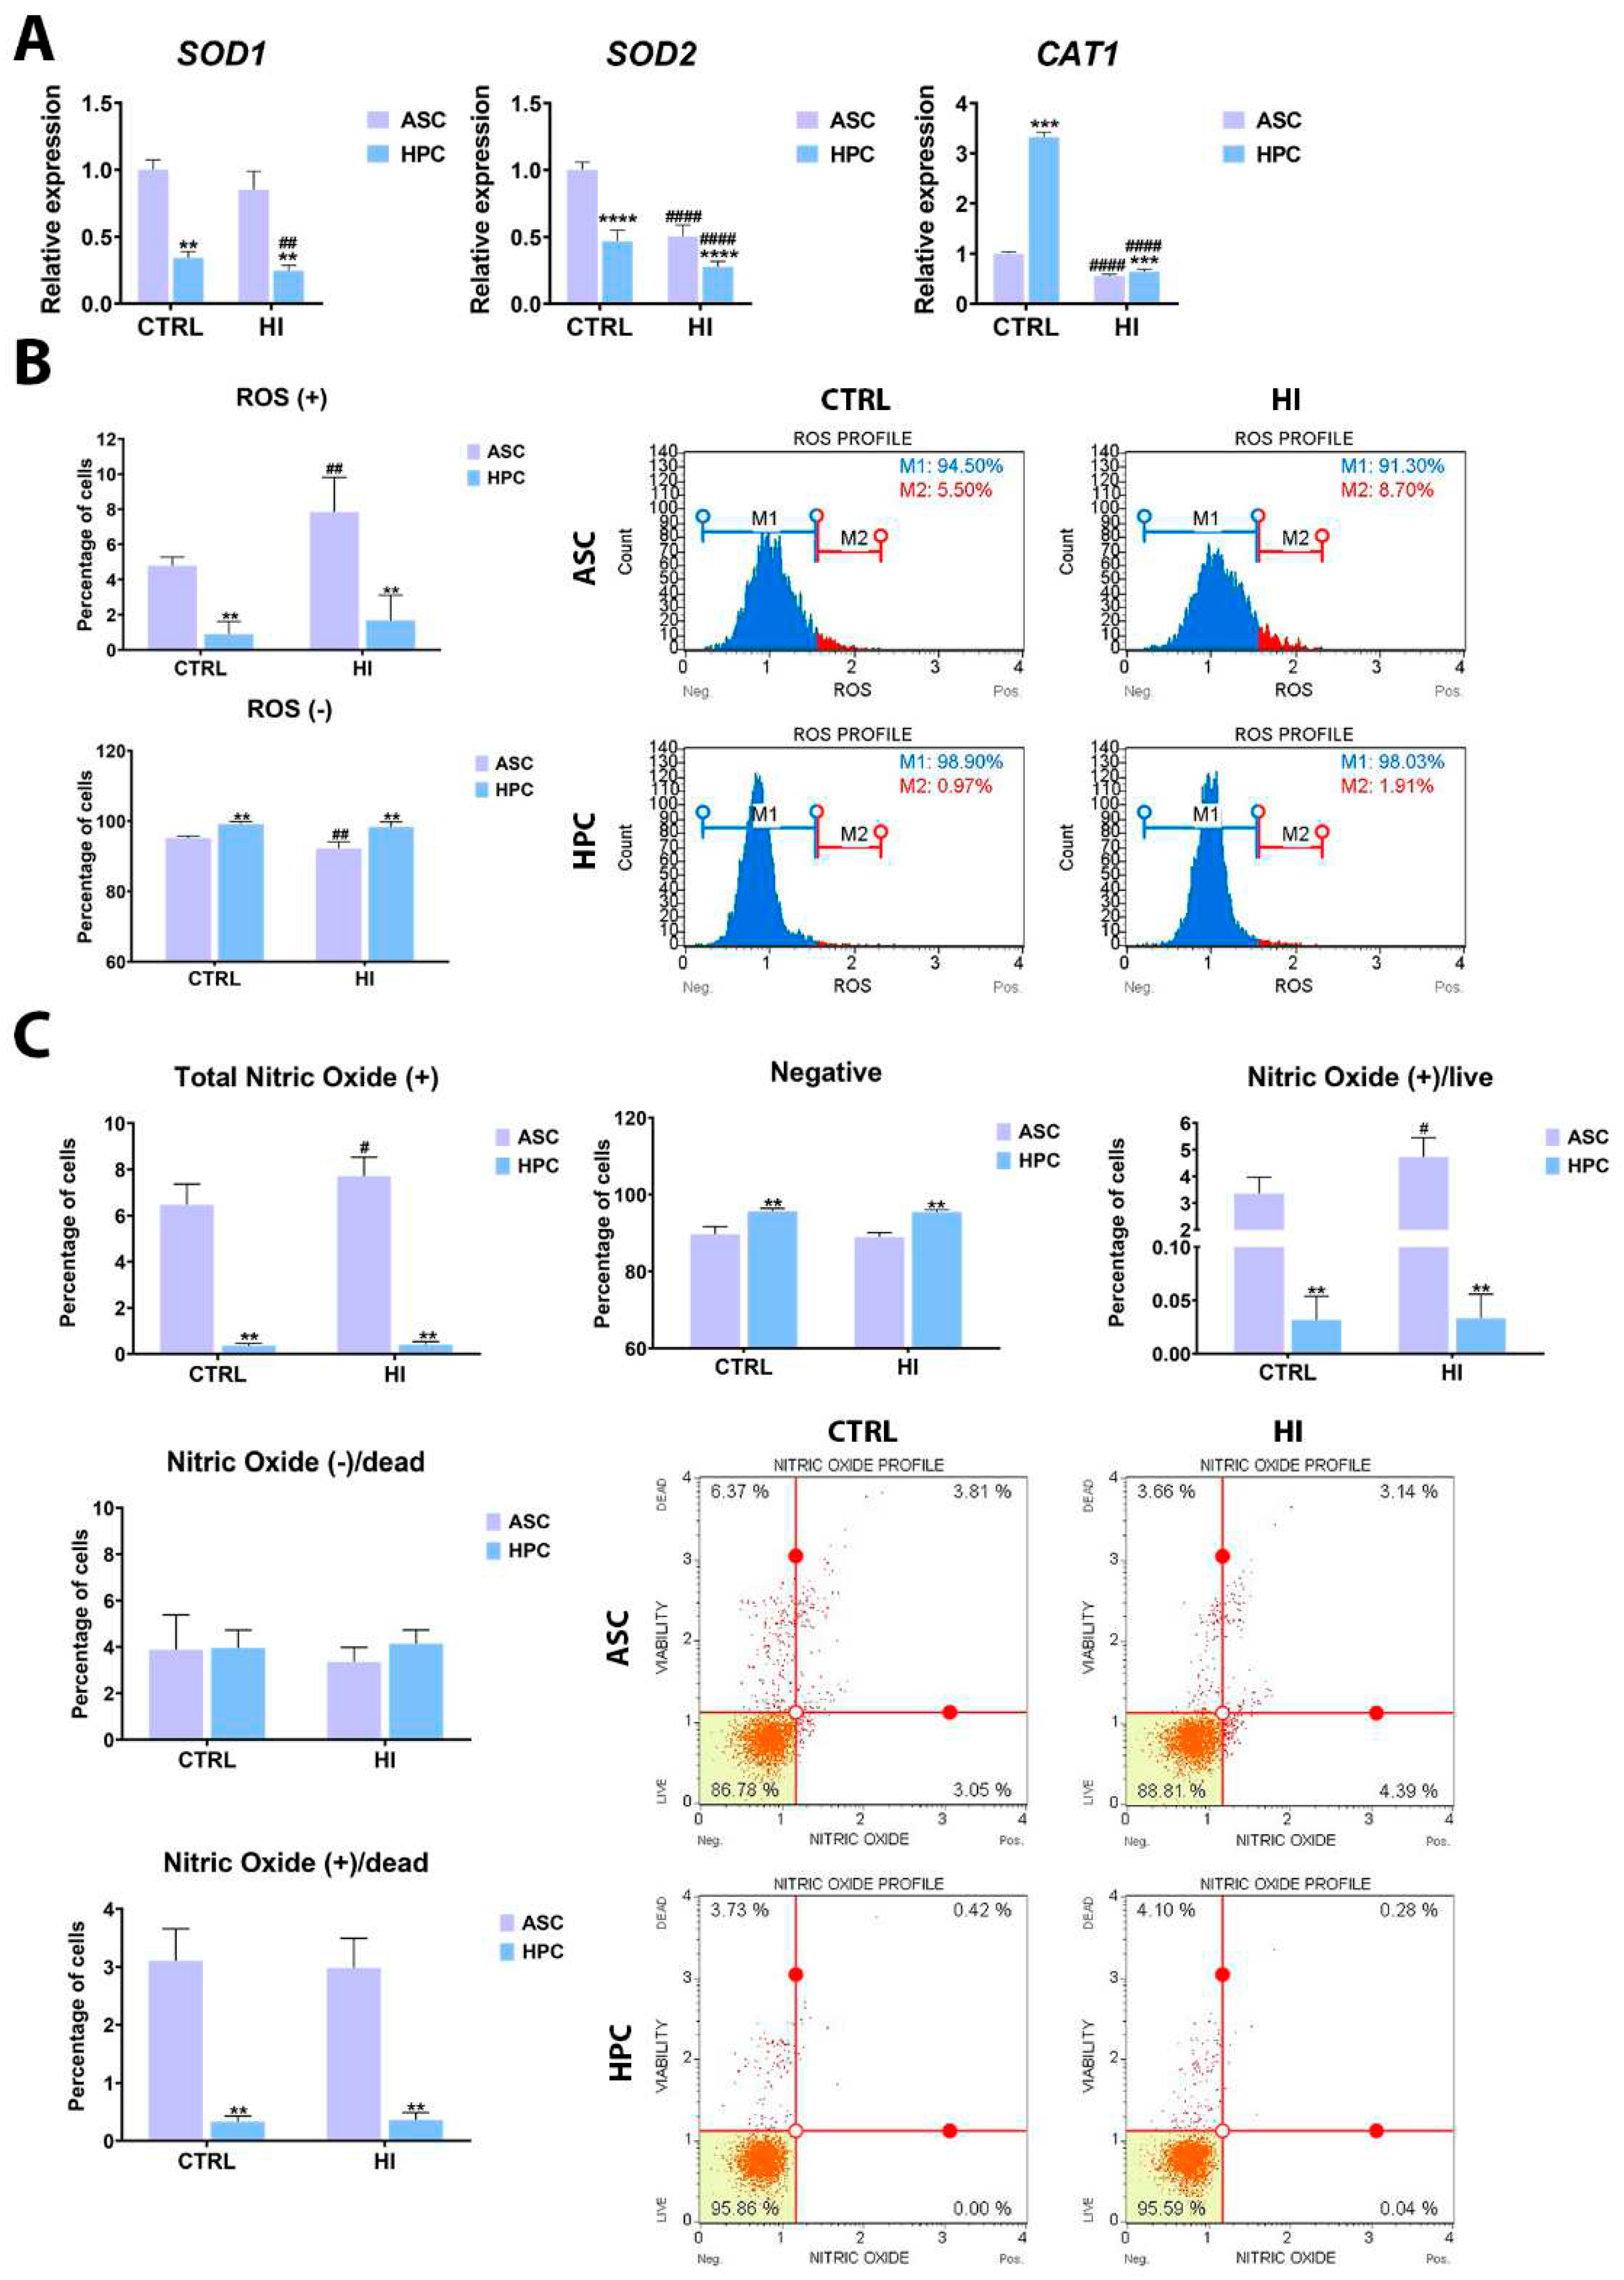
The gene expression of key oxidative stress markers (Figure 5A) as well as reactive oxygen species (ROS), (Figure 5B) and nitric oxide (NO), (Figure 5C) content in all experimental groups was assessed to elucidate how hyperinsulinemia affects ASC and HPC oxidative stress levels. In standard culture conditions, the HPC population was characterized by a lower expression of SOD1(**), SOD2(****) and a higher expression of CAT1(***) than ASC. As a result of hyperinsulinemia, the expression of SOD2 and CAT1 decreased in both ASC and HPC, but the expression of SOD1 only decreased in the HPC and remained unchanged in the ASC population. The amount of ROS(+) cells (was significantly lower in HPC, both in standard culture conditions as well as hyperinsulinemia. As a result of insulin treatment, an increase of ROS(+) cells in the ASC population was observed, but not in the HPC. The percentage of alive and dead, nitric oxide (+) cells as well as the Total Nitric Oxide (+) cells count was higher in the ASC(**) population, before the insulin treatment and after. Simultaneously, the percentage of nitric oxide negative cells was higher in the HPC population, both before and after the hyperinsulinemia induction.

2.5. Apoptosis, immunomodulation and insulin signalling markers expression differs between ASC and HPC in standard culture conditions and hyperinsulinemia

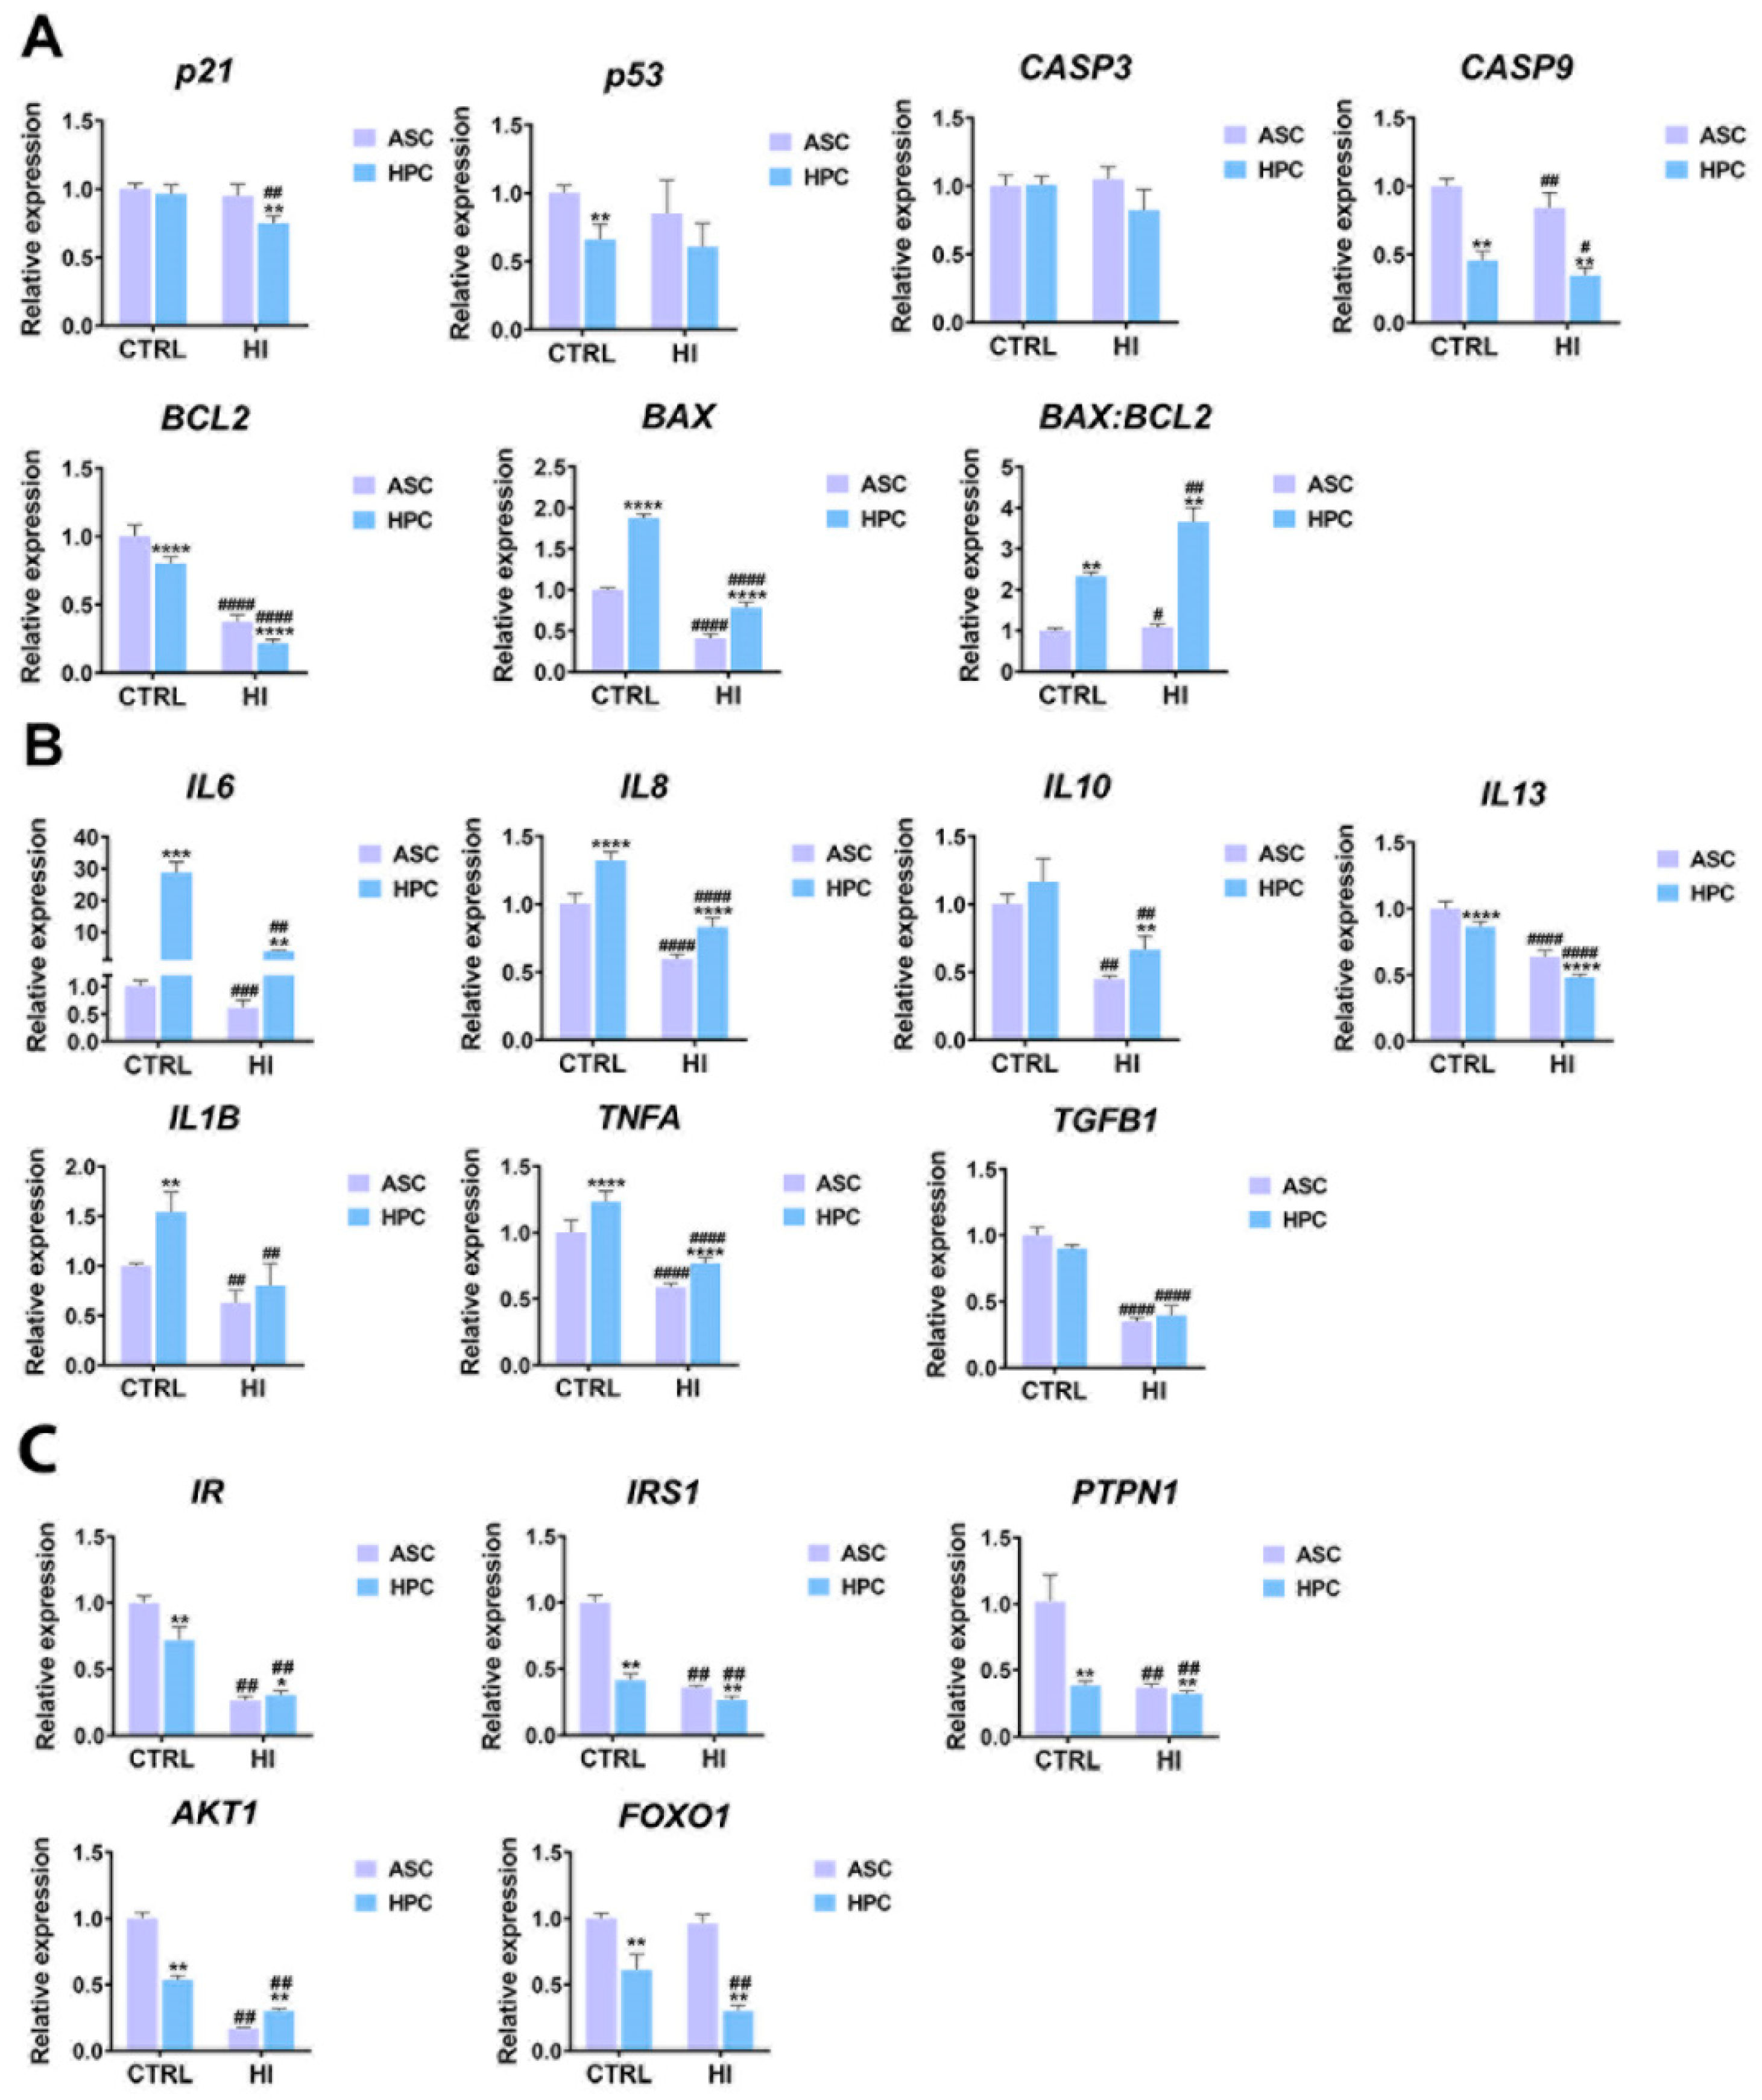
The expression of genes associated with apoptosis (Figure 6A), immunomodulation (Figure 6B) and insulin signalling (Figure 6C) was assessed in ASC and HPC in standard culture conditions and after hyperinsulinemia induction. The expression of p53 was lower (**) in HPC in standard culture conditions, but there was no significant difference between the two populations in the expression of its target- P21. Yet, after the insulin treatment, the expression of P21(##) decreased in HPC only, while the expression of P53 remained unchanged in both groups. As for other markers associated with apoptosis, in both standard culture conditions and after the insulin treatment, HPC exhibited lower expression of CASP9(**) and BLC2(****) with simultaneous higher expression of pro-apoptotic BAX(****), when compared to ASC. Furthermore, the BAX: BCL2(**) ratio was significantly higher in the HPC population. In both ASC and HPC, the expression of CASP9, BAX and BCL2 decreased as a result of hyperinsulinemia, while the BAX: BCL2 ratio increased significantly. The expression of pro-inflammatory cytokines, IL6(***) and IL8(****), was higher in the HPC population and decreased in both populations as a result of hyperinsulinemia. Furthermore, the expression of IL1β and TNFA was higher in the HPC population, both in standard culture conditions and hyperinsulinemia. Importantly, the expression of IL1β and Tnfα decreased in both populations after the hyperinsulinemia induction. Finally, the expression of TGFΒ also decreased after the insulin treatment but there was no difference between ASC and HPC in standard culture conditions. As for the markers of the insulin signalling pathway, HPC was characterized by a lower expression in standard culture conditions than ASC. As a result of hyperinsulinemia induction, a decrease in the expression of insulin signalling-related markers was observed, notably the expression of IR and AKT was higher in the insulin-treated HPC when compared to ASC.

2.6. HPC and ASC are characterized by a disparate miRNome in standard culture conditions and hyperinsulinemia
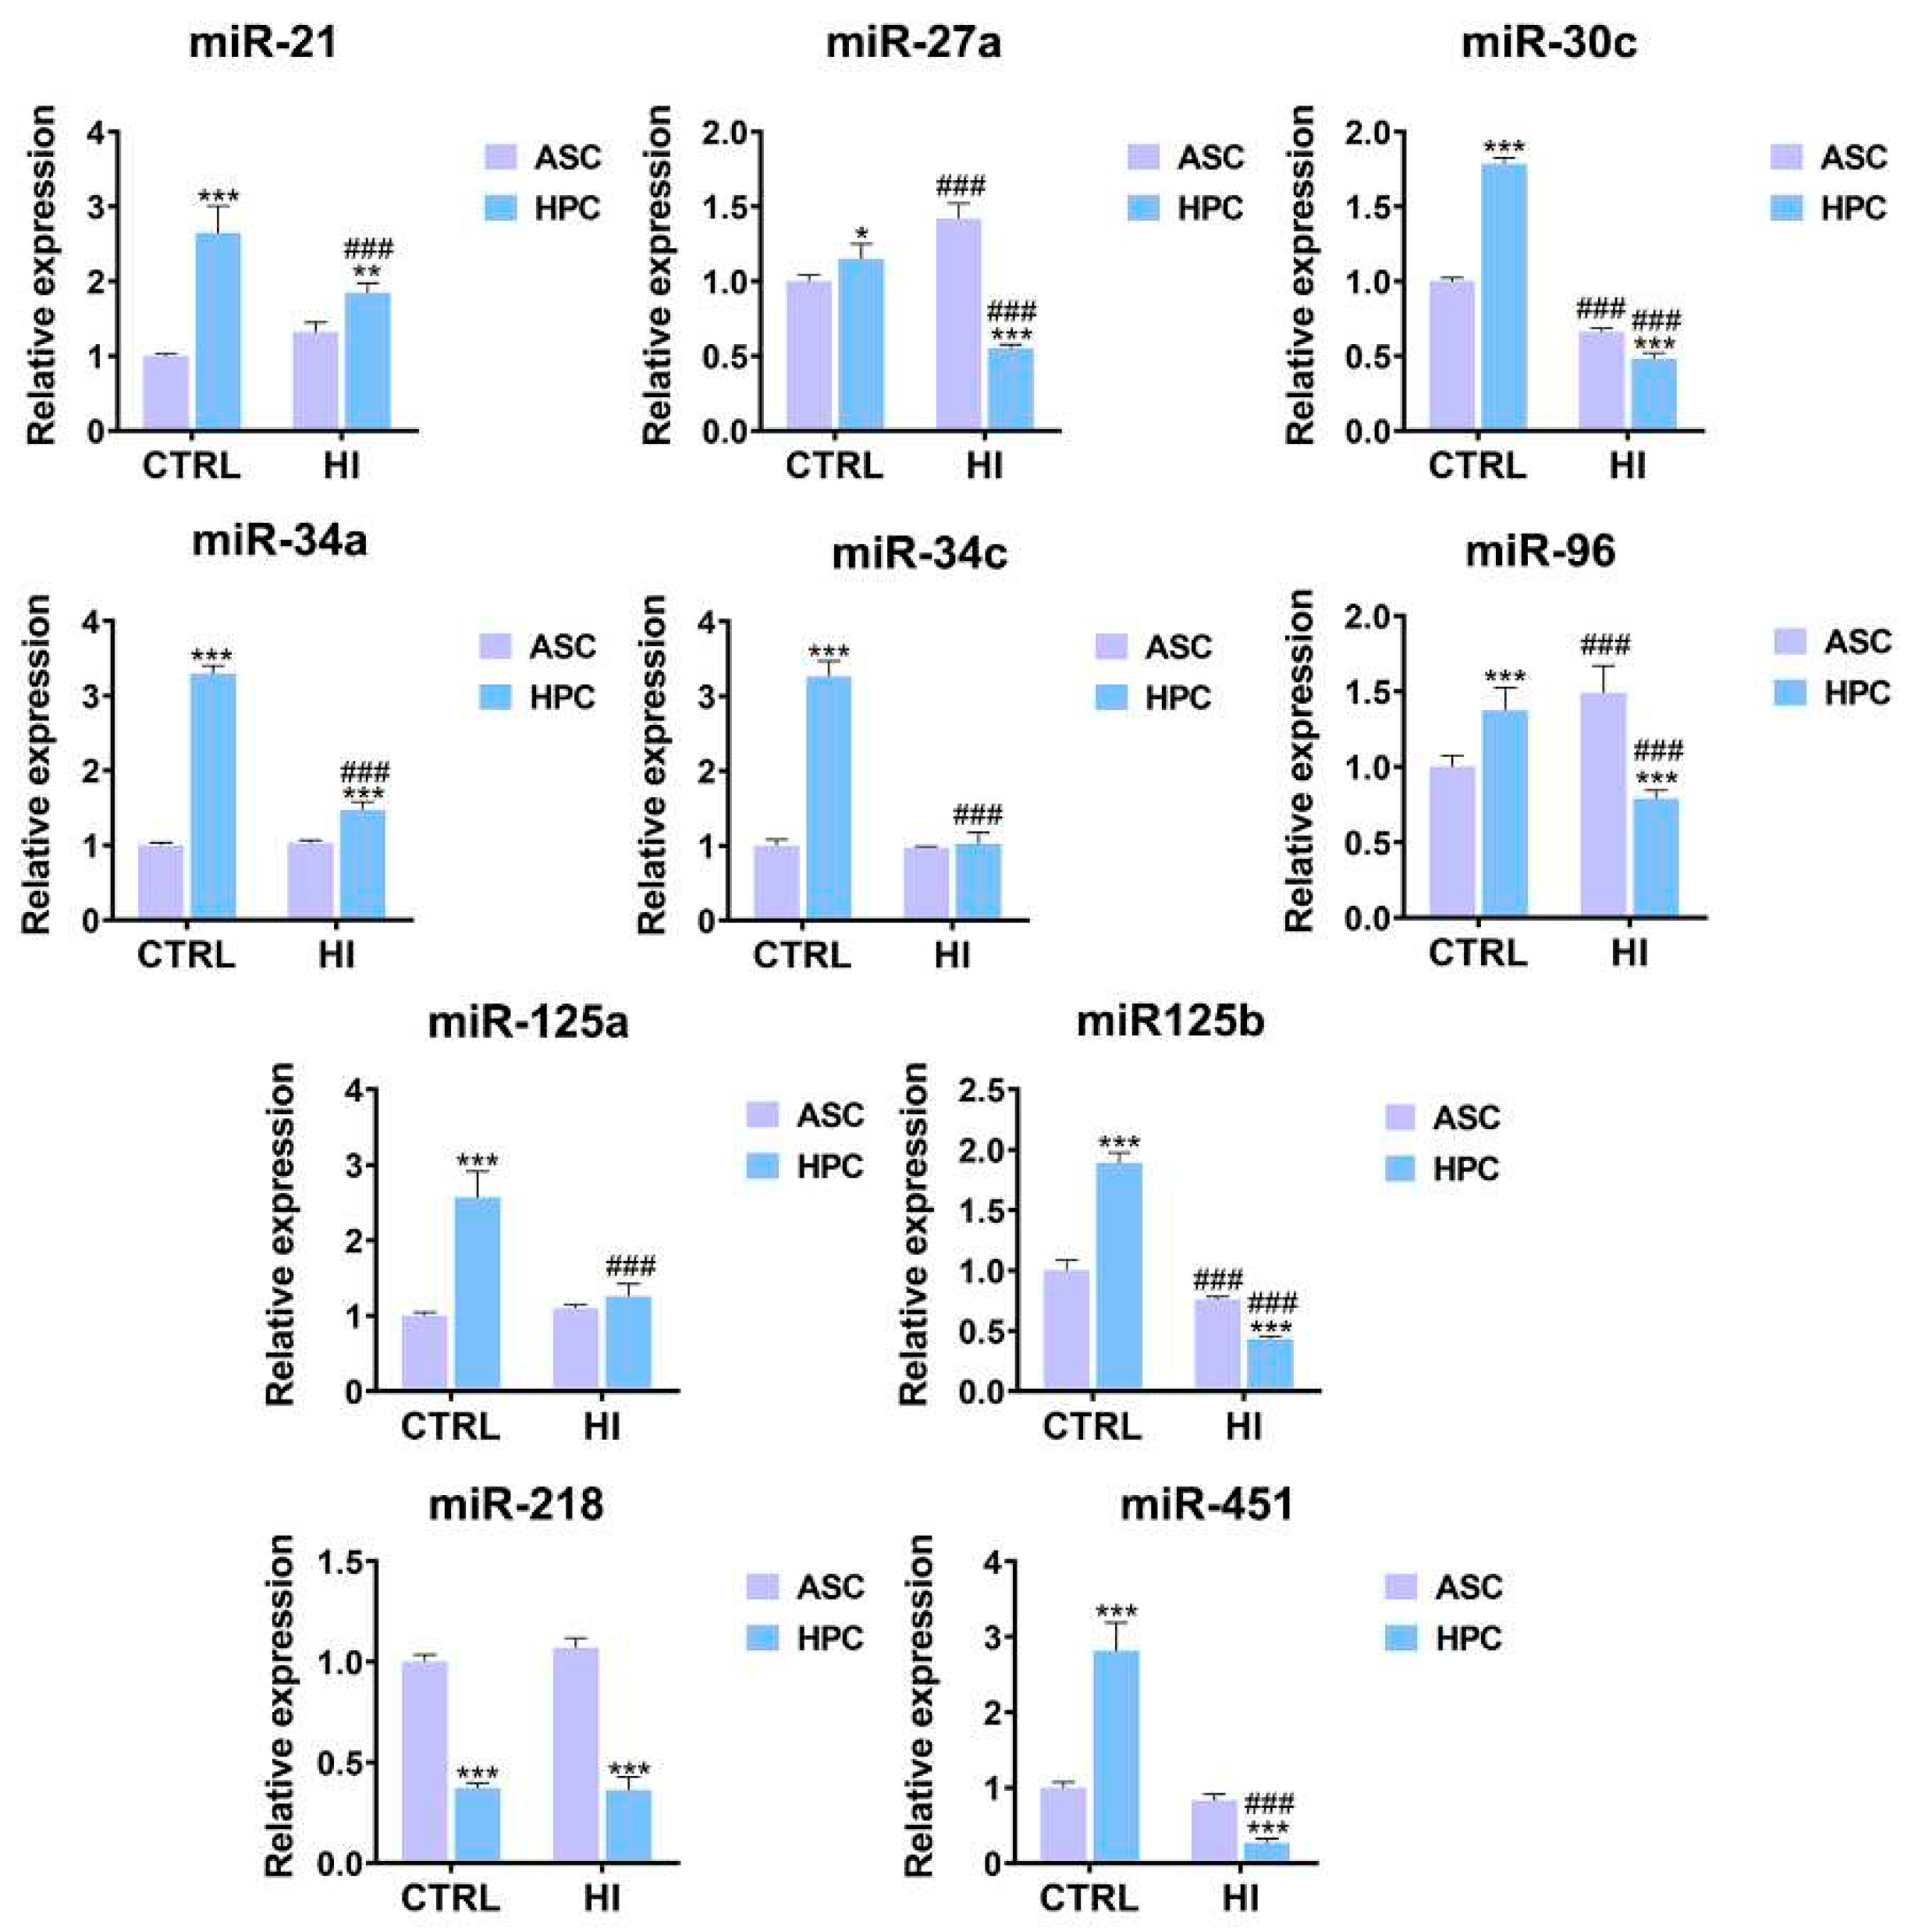
The expression of 9 out of 10 analyzed miRNAs was higher in HPC under standard culture conditions (mir-21**, miR-27a*, miR-30c*, miR-34a**, miR-34c**, miR-96**, miR-125a**, miR-125b**, miR-451**). In hyperinsulinemia, the expression of most miRNAs decreased in both ASC and HPC, except for mir-27a## and mir-96##, whose expression increased in ASC. Overall, after the hyperinsulinemia induction, the expression of 6 analyzed miRNAs was lower in the HPC (miR-27a**, miR-30c, miR-96**, miR-125b**, miR-218****, miR-451**), except for miR-21** and miR34a**, in which case the expression was higher in the HPC when compared to ASC.
Figure 7. Relative expression level of miRNA in ASC and HPC cells in control and hyperinsulinemia conditions. Data represent the mean ± SD. The statistically significant difference between ASC and HPC is marked with an asterisk (*p < 0.05, **p < 0.01, ***p < 0.001, ****p < 0.0001), while the statistically significant difference between the control group (CTRL) and the hyperinsulinemia group (HI) is marked with a hash sign (#p < 0.05, ##p < 0.01, ###p < 0.001, ####p < 0.0001).
Preprints 85905 g007

3. Discussion

Hyperinsulinemia is a common symptom of various endocrinopathic and metabolic disorders in equids such as laminitis, EMS, Cushing’s syndrome, or iatrogenic corticosteroid administration and is often a manifestation of insulin resistance. In general, it has been widely accepted that insulin resistance and hyperinsulinemia are crucial components in the pathology of laminitis. Although high serum insulin concentrations have previously been reported in ponies with reoccurring laminitis, in the absence of clinical signs, this could be attributed to developing some tolerance margin for insulin resistance. Therefore, it is important to note that laminitis is a multifactorial disorder with complicated pathology. However, de Laat et al., [26] demonstrated that a prolonged and consistent elevated serum insulin concentration may cause laminitis in Standardbred horses, in the absence of pre-existing insulin resistance.
In this study, our objective was to assess how hyperinsulinemia will affect two pools of stem cells with potential in the treatment of laminitis, the well-established ASC and the recently described HPC [15,27]. Cell cycle dynamics, mitochondrial metabolism, oxidative stress, apoptosis, and miRNA expression were compared between the two populations, under standard culture conditions and hyperinsulinemia.
The present study indicates that, under standard culture conditions, ASC exhibits a higher proliferation rate than HPC, which might be a negative prediction for possible therapeutic use. Interestingly, a progression from the G0/G1 phase to the S-phase of the cell cycle was observed in both populations, as a result of the insulin treatment [28]. It was reported by Li et al that insulin can, in a dose-dependent manner, promote a transition from the G0/G1 phase to the S-phase, in human Umbilical Cord Matrix-Derived mesenchymal stem cells. However, it is imperative to note, that the insulin concentration used by Li et al (maximum 20 μM) was much lower than the concentration used in this study to induce hyperinsulinemia. Chronic hyperinsulinemia was also found to increase the proliferation of myoblasts in fetal sheep skeletal muscle [29]. Endometrial epithelial cells and colorectal epithelial cell proliferation were also enhanced by hyperinsulinemia [30,31]. On the other hand, hyperinsulinemia has a negative impact on the proliferation of the circulating endothelial progenitor cells, as demonstrated by Tan et al. [32]. In this study, the cells were harvested after 24h incubation with insulin, therefore, the observed shift from the G0/G1 phase towards the S phase might be an initial response, which could change after a longer incubation. Additional research with prolonged incubation time would be necessary to further establish such a hypothesis.
To further elucidate how HPC react in the face of hyperinsulinemia, mitochondrial membrane potential and gene expression of mitochondrial markers were analysed. Interestingly, hyperinsulinemia did not strongly affect the mitochondrial membrane potential of the analysed populations. However, in standard culture conditions, HPC was characterised by a higher percent of live cells; this difference was diminished in hyperinsulinemia, but the percent of alive cells with depolarised mitochondrial membranes was higher in the HPC populations in both sets of experimental conditions. Mitochondrial membrane polarisation is a vital marker of overall cell health, and its loss can be attributed to the early stages of apoptosis [33]. Mitochondrial fission and fusion are processes associated with normal cellular functioning, but also with apoptosis and the cell response to stress. Fusion can mitigate cell stress by mixing contents of partially damaged mitochondria while fission leads to the creation of new mitochondria, but can also facilitate apoptosis by allowing the removal of comprised mitochondria [34]. Generally, there was no difference between ASC and HPC in the expression of fission-related markers, except for MIEF1, whose expression was higher in the HPC, however, the expression of MFN1 and OPA1 was higher in the HPC. In instances of type 2 diabetes, a shift towards a higher expression of fission-related markers was observed in several studies [35,36,37,38]. Furthermore, decreased expression of MF1 and MFN2 was reported in HepG2 cells in hyperinsulinemia and hyperglycemia [39]. The results obtained are in keeping with the reported findings, as hyperinsulinemia led to a decrease in the expression of fusion and fission-related markers in both populations, suggesting a diminished mitochondrial dynamic.
Furthermore, the mitophagy marker PINK1 was expressed at a higher level in HPC compared to ASC under standard culture conditions and after induction of hyperinsulinemia. Nevertheless, its expression also decreased in both populations after hyperinsulinemia induction. The results obtained indicate that under hyperinsulinemic conditions, mitochondrial dynamics are diminished. Extensive research has been published on the role of mitophagy and mitochondrial dynamics in type 2 diabetes and insulin resistance [40,41,42,43]. For example, mice depleted of a Fundc1 mitophagy receptor were characterised by impaired mitochondrial quality, more severe obesity, and insulin resistance, due to mitophagy dysfunction [44]. Another study reported that in patients with type 2 diabetes, the expression of mitophagy-related genes such as NIZ, PINK1, and PARKIN was reduced [45]. The detrimental effect of hyperinsulinemia on the mitochondrial condition of ASC and HPC was further indicated by an analysis of the expression of genes related to mitochondrial metabolism and biogenesis. Under standard culture conditions, HPC were characterised by a higher expression of most of the analysed mitochondrial metabolism and biogenesis markers, with the exception of PUSL1 and PIGBOS1. In hyperinsulinemia, downregulation of almost all the markers (except PUSL1) occurred in both ASC and HPC. PPARGC-1B encodes the peroxisome proliferator–activated receptor-γ coactivator 1β (PGC-1β) [46] that plays a crucial role in mitochondrial activity in tissues with active oxidative metabolism; it is crucial for proper mitochondrial biogenesis and metabolism [47]. In a study published by Sparks et al., a 3-day high-fat diet led to a reduction in PGC-1 gene expression of PGC-1β in healthy men [48]. Down-regulation of PGC-1 Β has also been observed in CGI-58-deficient peritoneal macrophages from mice fed a high-fat diet [49]. Mammalian mitochondria possess ribosomes that synthesise 13 key subunits of the oxidative phosphorylation system (OXPHOS). MRPL24 and MTERF4 are involved in mitoribosome formation and assembly [50]. Bourebaba et al. [39] demonstrated that in the hyperinsulinemia-hyperglycemia environment, HepG2 cells exhibited lower expression of the markers mentioned above. The mitochondrial oxidative phosphorylation system (OXPHOS) is composed of four respiratory chain complexes and the F1F0-ATP synthase (complex V) and is responsible for the majority of ATP production in aerobic cells. The biogenesis of OXPHOS is complicated and therefore several specific gene products are needed to meet these requirements, among them OXA1L is involved in the biogenesis of mitochondrial membrane proteins [51]. Bioinformatic analysis indicated that OXA1L may be related to diabetic retinopathy [52]. OXA1L was also down-regulated in serum collected from patients with uncontrolled diabetes [53]. The PIGBOS1 gene encodes PIGBOS which is an integral mitochondrial outer membrane protein. Functional investigations show that the absence of PIGBOS increases UPR and cell death and can, in turn, modulate cellular sensitivity to ER stress [54]. Our work reveals that higher expression levels of PIGBOS1 in HPC cells suggested that this cell pool could be more resistant to ER stress than ASC. Furthermore, a similar higher expression of TFAM was observed in HPC. TFAM is crucial for the maintenance of mitochondrial DNA, as it acts as a master regulator for the expression of 13 gene products of mitochondrial DNA as well as a repair protein [55]. In hyperinsulinemia, downregulation of TFAM is observed in vascular smooth muscle cells (VSMC) and the liver [56,57]. Finally, our results demonstrated that under hyperinsulinemia both ASC and HPC exhibited a decrease in the expression of the OXPHOS-related genes NDUFA9, UQCRC2, and COX4I1, similar results were reported in HepG2 cells by Bourebaba et al. [39]. Our findings indicate that HPC are characterised by higher activity in terms of mitochondrial dynamics, mitophagy, and mitochondrial biogenesis under standard culture conditions, yet the effect of hyperinsulinemia on these processes is similar in ASC and HPC.
Oxidative stress is a state in which the accumulation of excessive reactive oxygen species (ROS) leads to cellular disruption and damage in important structures such as proteins, lipids, and nucleic acids. ROS are produced by the mitochondria, as a product of cellular respiration, and homeostasis is maintained through a cellular antioxidant defence system, composed mainly of enzymes such as superoxide dismutase (SOD) or catalase (CAT), among others. Importantly, oxidative stress can be a major risk factor and component of various diseases, including type 2 diabetes, metabolic disorders, or cardiovascular diseases [58]. Under standard culture conditions, ASC exhibited a higher expression of SOD1 and SOD2 while HPC exhibited a higher expression of CAT1, however, under hyperinsulinemia the expression of the markers decreased in both populations, which may suggest an aggravation of oxidative stress in the cell and a disruption of the cellular antioxidant defence system. A similar dynamic was observed in Fisher rats fed a high-refined sugar diet, where Roberts et al. observed down-regulation of SOD isoforms in the kidney and aorta [59]. Deterioration of the expression of the genes of antioxidant enzymes in hyperglycemia-hyperinsulinemia was also observed in HepG2 cells [39]. Following our previous findings, under standard culture conditions, HPC were characterised by a lower level of ROS and nitric oxide [27]. Interestingly, ROS and nitric oxide levels did not change in HPC after insulin treatment, yet they increased in ASC. Such results may indicate a somewhat higher resistance towards oxidative stress in HPC, however, it is not apparent when weighting in the diminished antioxidant enzymes gene expression. In general, increasing evidence indicates an inverse dependency between insulin sensitivity and ROS levels [60] and the presented results show that hyperinsulinemia has a negative impact on oxidative stress levels in both ASC and HPC.
Apoptosis, also known as programmed cell death, is crucial to maintaining homeostasis, however, intensified apoptosis is often associated with various pathologies, oxidative stress, hyperinsulinemia, and insulin resistance [32,61,62,63]. Interestingly, the obtained results do not unequivocally support this notion, except for the increase in BAX: BCL2 ratio under hyperinsulinemia in both populations. Such findings could be explained by the short duration of hyperinsulinemia in the experimental environment, for example., Turina et al. showed that short-term changes in glucose and insulin concentrations do not affect neutrophils' ability to enter the apoptotic program [61]. Furthermore, the relationship between hyperinsulinemia and apoptosis is not universally similar; for example, hyperinsulinemia can also be observed alongside impaired apoptosis, especially in some cancers such as colorectal adenoma [64] or prostate cancer [65].
Inflammation is also often observed alongside insulin resistance, hyperinsulinemia, and type 2 diabetes [66,67]. Acute hyperinsulinemia has been reported to increase plasma interleukin-6 levels in non-diabetic and type 2 diabetes patients [67]. Interleukin-6 expression was also upregulated in digital lamellar tissue collected from horses subjected to the euglycemic-hyperinsulinemic clamp (EHC) model of laminitis [68]. Similarly, plasma IL-8 concentration increases in obese subjects [69] and in diabetic patients [70]. Interestingly, both ASC and HPC exhibited decreased expression of the inflammatory markers mentioned in hyperinsulinemia. The expression of all the markers analysed associated with inflammation was decreased in both cell populations as a result of insulin treatment. Importantly, insulin is well known for its anti-inflammatory properties and its’ immunomodulatory activity [71]. For example, in a rat model of severe inflammatory insult, insulin therapy led to significant suppression of circulating proinflammatory TNF-α and IL-6 [72]. Furthermore, the expression of IL-1β in human macrophages challenged with LPS was suppressed, following an insulin treatment (insulin dose at 25 IU/mL and higher) [73]. In a porcine model of sepsis, the hyperinsulinemic-euglycemic clamp decreased the release of TNF and IL-6 [74]. Previous results indicated that IL-10 and IL13 decreased in type 2 diabetic patients and are associated with metabolic syndrome [75,76]. The level of investigated IL10 and IL13 in the present work decreased in both types of cells under hyperinsulinemia. Interestingly, the levels of IL10 were found to be considerably higher in HPC than in ASC. However, opposite results were found for IL13. Camilo et al., [77] demonstrate that serum levels of IL-13 are significantly elevated in insulin-resistant patients without showing a correlation with parameters of low-grade systemic inflammation such as TNF-α, and IL-10. Together with higher expression of IL-8 and IL-6, this suggests that HPC may help the cytokine storm for a more effective phenotype change to an immunosuppressing pool of cells with better migratory and healing abilities under hyperinsulinemia than ASC.
We also investigated the effects of hyperinsulinemia on genes involved in insulin action. In HPC, we observed significantly lower expression of PTPN1 than in ASC. The protein tyrosine phosphatase PTPN1 plays a crucial role in the regulation of insulin signalling and metabolic health through dephosphorylation of the insulin receptor, inhibition of insulin action, and increased glucose absorption through increased transporter expression [78]. Lower PTPN1 activity promotes glucose uptake through increased cell surface expression of its transporter. Furthermore, HPC cells showed a decreased level of FOXO1. FoxO1 is a transcription factor; however, it also shows transcription-independent effects by regulating the activities of numerous other transcription factors, including the androgen receptor, the signal transducer, and the transcription-3 activator (STAT3) and regulating IR expression. Nakae et al., [79] showed that FoxO1-heterozygous mice are resistant to diet-induced diabetes. Increased FoxO1 activity in animal models contributes to the phenotype of insulin resistance and diabetes, however, it is crucial to stress that FoxO1 does not function primarily as an insulin antagonist with a pro-diabetic role. For example, mouse FoxO1 has been shown to enhance adiponectin receptor expression, which is expected to promote insulin sensitivity [80].
Hyperinsulinemia was found to cause a significant decrease in the expression of the IR gene (alias INSR) and, as a result, a decrease in surface INSR and total INSR protein, implying that reduced IR expression by hyperinsulinemia may be a key independent factor in INSR down-regulation and insulin resistance [81,82] . Moreover, hyperinsulinemia has a large impact on AKT and ERK signalling, INSR abundance, localisation, and transcriptional activities [82]. Previous studies have shown that exposing the neuronal cell line to insulin induced bluted AKT signalling and lysosomal degradation of INSR. However, it did not influence the IR mRNA level [83]. Here, we show that HPC as opposed to ASC show significantly increased expression of IR and AKT genes. In addition to them, the opposite result was shown for the IRS1 gene which encodes IRS1- a major mediator between the insulin receptor and phosphatidylinositol 3-kinase (PI3K) in the insulin signalling pathway. However, the fold change of IRS1 expression was lower in HPC than in ASC. This leads us to conclude that HPC are more resistant to hyperinsulinemia and may have greater therapeutic potential in reducing EMS and/or Laminitis.
Obesity is the primary risk factor for the development of EMS (Equine Metabolic Syndrome), covering risk factors for endocrinopathic laminitis in which metabolic alterations promote injury to the laminae of the hoof material and disturb the balanced interrelationship between plasma concentrations of insulin, glucose, and lipids [84]. High insulin concentrations may restrict the veins, resulting in inadequate blood flow to the foot [85] and may have a direct influence on hoof cells through insulin-like growth factor (IGF-1), causing a delay in hoof keratinization [86]. Moreover, insulin dysregulation can manifest as one or more of the following: basal hyperinsulinemia; an excessive or prolonged hyperinsulinemic response to carbohydrates, with or without excessive or prolonged hyperglycemia, and tissue insulin resistance [84]. MicroRNAs are endogenously produced short noncoding RNAs that can regulate gene expression. Dysregulated miRNA expressions, either directly or indirectly, can have a large impact on a wide range of cellular functions, including proliferation, apoptosis, and cell fate [87]. Furthermore, microRNAs affect the expression and/or activity of molecules involved in antioxidative signalling pathways (e.g., FOXOs), as well as effector enzymes (for example, CAT, SOD1 / 2) and genes involved in many signalling pathways related to insulin sensitivity and lipid metabolism that contribute to metabolic imbalance[88]]. Additionally, miRNAs have emerged as important players in both adipogenesis and osteogenesis, targeting and degrading critical adipogenic and osteogenic genes [89,90,91]. Furthermore, stem cells have specific miRNA expression profiles that modulate stem cell fate during tissue regeneration due to their fundamental role in the control of stem cell destiny [92]. To determine the effects of hyperinsulinemia on miRNA strand selection, ASC and HPC were subjected to hyperinsulinemic conditions. The miRNA strand selection was then analysed and compared between ASC and HPC. We showed that miR-125b and miR-125a were down-regulated in both cell types investigated under hyperinsulinemia. Overexpression of both miRNAs has been reported to inhibit proliferation and osteogenic differentiation [93]. Furthermore, miR-125 family is involved in neuronal differentiation as well as self-renewal and differentiation of skin stem cells [94,95,96]. We also observed lower expression of miR-96, miR-218, and miR-451 in HPC, which are involved in the improvement of new bone formation, the acceleration of fracture healing, and osteoblast differentiation [97,98,99]. miR-96 has been reported to partake in wound healing, keratinocyte proliferation and migration [100,101,102,103] , while miR-218 was described to regulate skin and hair follicle development [99,104]. As for miR-451, it has been demonstrated that it exhibits immunomodulatory and inflammation-supressing activity in diabetic retinopathy and microgila-mediated neuroinflammation [105,106]. However, during hyperinsulinemia, miR-96 and miR-218 increased in ASC cells, suggesting a more promising therapeutic target for bone repair in future clinical applications. Here we also demonstrated the decrease in the expression of miR-34a and miR-34c which are responsible for repressed reprogramming [107]. miR-34 miRNAs and p21 are the main downstream targets that work together to suppress iPSC production. A significant downstream target of p53 is p21, which inhibits cell growth. Changes in cell proliferation, immortalization, apoptosis, and DNA damage response are all influenced by p53 [107]. What is interesting is that the miR-34 family has a higher expression level in HPC in control and experimental conditions. In the current study, we also investigate the expression of miR-21, miR-27a and miR-30c. Previously, it was discovered that patients with metabolic syndrome and type 2 diabetes had higher circulating levels of miR-27ainvolved in the PPAR-γ-PI3K/AKT-GLUT4 signalling axis, thus leading to increased glucose uptake and decreased insulin resistance [108,109,110]. Compared to ASC, mir-27a expression significantly decreased in HPC during hyperinsulinemia. It could be consistent with the findings of Yao et al. who discovered that miR-27a is important for obesity through modulating insulin resistance in adipocytes and serving as an adipocyte differentiation repressor [110]. In our study, we observed two times higher relative expression of miR-30c in equine hoof progenitors than in adipose-derived stem cells. However, during hyperinsulinemia miR-30c was downregulated in both cells. The miR-30 family is highly conserved and known to target the Notch1 ligand DLL4, which is a ligand that contributes to metabolic disease and macrophage inflammation [111,112]. These data suggest that miR-30 induction holds therapeutic potential for regulating macrophage-driven inflammatory and metabolic disorders. On the other hand, miR-30c was induced during adipogenesis but was downregulated in obese adipocytes [113]. Furthermore, diabetes mellitus significantly downregulated miR-30c-5p associated with stem cell survival, proliferation, and differentiation in cardiac progenitor cells [114]. The last of the analysed miRNAs was miR-21,s which was significantly downregulated in insulin-resistant adipocytes [115]. Moreover, Kim et al., reported that miR-21 regulated adipogenic differentiation through the modulation of TGF-β signaling [116]. Results of qRT-PCR showed that miR-21 concentrations were significantly higher in HPC than in APC in both CTRL and HI groups, as well as TGFB1 in the HI group. Taken together, the current results demonstrated that HPC possesses better potential to modulate the PTEN-AKT pathway by miR-21 and reverse high glucose and high insulin-induced insulin resistance, as was suggested by Ling et al., [115]. Tha main limitations of the presented study are the small sample size and limited information about the animals.

4. Materials and Methods

4.1. Sample Acquisition and Cell Isolation

Coronary corium tissue samples were collected postmortem at a local slaughterhouse, the reason for the euthanization of the animal was unrelated to this study. Samples were obtained from one young (approximately 1-3 years old), of unknown sex and breed. As for the adipose tissue, it was dissected from an 8-year-old warm-blood mare. The tissue samples were immediately transported to the laboratory and the cells were isolated as previously described [117,118]. Briefly, adipose tissue and coronary corium tissue samples were washed 3 times with PBS and then dissected in a Petri dish with a #10 scalpel blade in 1×1mm squares. After dissection, the minced tissue was transferred to a sterile 50 mL tube with a solution of collagenase type I (1 mg/mL) in DMEM/F12 (Merck, Poznan, Poland). The tube containing minced coronary corium tissue was incubated at 37 °C for 2 hours with 2-dimensional agitation while the falcon containing minced adipose tissue was incubated under the same conditions for 40 minutes. After digestion, the coronary corium-containing solution was filtered with a 100 μm filter and then with a 70 μm filter, while the solution containing adipose tissue was not filtered. Subsequently, both samples were centrifuged for 10 min at 1,200×g, the supernatant was discarded and the cell pellet was then centrifuged again for 4 minutes at 300×g. After the isolation, HPC were phenotyped, as previously described. The HPC and ASC were cryopreserved in a freezing medium (89% FBS, 10% DMSO, 1% penicillin/streptomycin mix) and stored at -156 °C. Before the experiment started, the HPC were thawed and cultured in DMEM/F12 (Sigma Aldrich/Merck, Poznan, Po-land) 1% penicillin/streptomycin mix (P/S, Sigma Aldrich, Poznan, Poland) and 10% FBS (Foetal Bovine Serum, Sigma Aldrich/Merck, Poznan, Poland), while ASC was cultured in Dulbecco’s modified Eagle medium (DMEM) containing 1000 mg/L glucose, supplemented with 1% penicillin/streptomycin mix (P/S, Sigma Aldrich, Poznan, Poland) and 5% of FBS. Both ASC and HPC cultures were in the 10th passage at the time of the experiment.

4.2. Hyperinsulinemia model

For the hyperinsulinemia model, both ASC and HPC cells were starved for 2 hours without FBS, then 500 nmol of insulin was added and cells were incubated for 24 hours in a humidified incubator at 37 °C in 5% CO2. Subsequently, cells were harvested for further analysis.

4.3. Cell Imagining and Mitochondrial Network Visualization.

The mitochondrial network of ASC and HPC was evaluated based on fluorescent staining. Briefly, cells were first incubated with the MitoRed dye solution (Sigma-Aldrich/Merck, Poznan, Poland) at 37 °C in a CO2 incubator for 30 minutes and then fixed with 4% paraformaldehyde (PFA, Sigma-Aldrich/Merck, Poznan, Poland) for 30 minutes at room temperature. After fixation, cells were washed 3 times with PBS and nuclei were stained with 4′,6-Diamidine-2′-phenylindole dihydrochloride using ProLong™ Diamond Antifade Mountant with DAPI (Thermo Fisher Scientific, Warsaw, Poland). A confocal microscope (Leica TCSSPE, Leica Microsystems, KAWA.SKA Sp. z o. o., Zalesie Górne, Poland) was used to observe and imagine the cells at 630x magnification. All images were subsequently processed with Fiji software (ImageJ 1.52n, Wayne Rasband, National Institute of Health, Bethesda, MD, USA).

4.4. Microcapillary Flow Cytometry Analysis

ASC and HPC cells were analysed with the commercially available Muse™ Assay Kit and the Muse™ Cell Analyzer (Merck KGaA, Darmstadt, Germany) according to the manufacturer’s protocol. Briefly, after harvesting, cells were centrifuged at 300×g for 5 minutes, washed with PBS, and fixed overnight using a 70% ethanol solution at -20 °C. Subsequently, cells were centrifuged at 300×g for 5 minutes and rinsed again with PBS. The cells were incubated with the Muse™ Cell Cycle Reagent (Muse™ Cell Cycle As-say Kit; Merck, Warsaw, Poland) for 30 minutes and analyzed. Furthermore, the mitochondrial membrane potential was assessed with the Muse® MitoPotential Assay Kit (Luminex). Briefly, the solution containing the harvested cells was diluted with 1x Assay buffer and incubated with the MitoPotential working solution for 20 min at 37 °C. Then Muse 7-AAD was added to the samples and the resulting solution was incubated for 5 minutes at room temperature. Finally, the samples were analysed with the Muse™ Cell Analyzer. In terms of intracellular oxidative stress factor analysis, Muse® Oxidative Stress kit (Luminex) was used, according to the manufacturer’s instruction. Briefly, samples were incubated at 37 °C for 30 minutes with the Muse® Oxidative Stress Working Solution. After incubation mixed thoroughly and analysed on the Muse™ Cell Analyser. Nitric oxide activity in ASC and HPC was evaluated using the Muse® Nitric Oxide Kit (Luminex), following the manufacturer’s protocol. Briefly, the samples were incubated with Muse® Nitric Oxide working solution at 37 °C for 30 minutes, and then Muse® 7-AAD working solution was added and mixed with the samples. Subsequently, the samples were analysed with the Muse™ Cell Analyzer.

4.5. RNA isolation and RT-qPCR

To assess the expression of key markers for apoptosis, inflammation, autophagy, insulin signalling pathway, mitochondrial metabolism and miRNAs, total RNA was isolated from ASC and HPC cells, using the phenol-chloroform method as described before [119]. RNA concentrations and purity were calculated based on the absorbance at 260/280 nm with a nano spectrophotometer (Epoch, Biotek, Bad Friedrichshall, Germany). A 150 ng of total RNA was used for digestion with RNAse free DNAse I (Sig-ma-Aldrich/Merck, Poznan, Poland), subsequently, cDNA synthesis was performed using the PrimeScript RT Reagent Kit (Takara Bio Europe, Saint-Germaine, Laye, France), both digestion and synthesis reaction was completed on a T100 Thermal Cycler (Bio-Rad, Hercules, CA, USA). The obtained cDNA was diluted with nuclease-free water in a 1:3 ratio and used for RT-qPCR analysis. The expression of mRNA and miRNA transcripts was detected using specific primers (Table 1) and the SensiFAST SYBR & Fluorescein Kit (Meridian Bioscience, London, UK). All RT-qPCR analyses were performed using the CFX Connect™ Real-Time PCR Detection System (Bio-Rad), as previously described [120]. The relative expressions were calculated using the 2−ΔΔCQ method [121] with the glyceraldehyde 3-phosphate dehydrogenase (GAPDH) as a reference gene for the mRNA or U6 for miRNA. The control (CTRL) samples were used as a reference.

4.6. The isolation of mitochondria and mtRNA

Intact mitochondria were isolated from ASC and HPC cultures, using the Mitochondria Isolation Kit for Cultured Cells (ThermoFisher Scientific, Warsaw, Poland), according to the manufacturer's instructions. Then, mtRNA was isolated from the extracted mitochondria with the phenol-chloroform method, as described above [119].

4.7. Statistical analysis

At least three technical replicates were performed for each biological assay and the results are presented as a mean ± SD. The normality of the data was assessed with Kolmogorov-Smirnov or Shapiro-Wilk test and the variance was analyzed with the Fisher test. The statistical difference between the experimental groups was calculated using the unpaired Student’s t-test or Mann-Whitney U test. The GraphPad Prism 8 software (La Jolla, CA, USA) was used to process the data and prepare the graphs. Differences between ASC and HPC were marked with an asterisk (*) while differences between the control group and the hyperinsulinemia group were marked with a dash (#). Differences with a probability of P < 0.05 were considered significant and the significance was marked with one asterisk/dash (*)/(#), the differences with a probability of P  < 0.01 were marked with two asterisks/dash (**) and differences with a probability of P  < 0.001 were marked with three asterisks (***).

5. Conclusions

In this study, our objective was to assess how hyperinsulinemia will affect two pools of stem cells with potential in the treatment of laminitis, the well-established ASC and the recently described HPC. Cell cycle dynamics, mitochondrial metabolism, oxidative stress, apoptosis, and miRNA expression were compared between the two populations, under standard culture conditions and hyperinsulinemia. Our findings indicate that HPC are characterised by higher activity in terms of mitochondrial dynamics, mitophagy, and mitochondrial biogenesis under standard culture conditions, yet the effect of hyperinsulinemia on these processes is similar in ASC and HPC. Furthermore, the obtained results indicate that HPC may possess a somewhat higher resistance towards oxidative stress than ASC. Additionally, the analysis of immunomodulatory markers expression revealed that HPC may help the cytokine storm for a more effective phenotype change to an immunosuppressing pool of cells with better migratory and healing abilities under hyperinsulinemia than ASC. Furthermore, we observed that HPC are more resistant to hyperinsulinemia and may have greater therapeutic potential in reducing EMS and/or Laminitis. Additionally, the current results demonstrated that HPC possesses better potential to modulate the PTEN-AKT pathway by miR-21 and reverse high glucose and high insulin-induced insulin resistance. Taken together, the obtained results indicate that HPC may be a very promising cell pool with therapeutic potential in laminitis treatment, and could be more effective than ASC. However, further research is necessary to fully elucidate HPC therapeutic potential.

Author Contributions

Conceptualization, A.P. and K.M.; methodology, A.P., M.K.; validation, A.P., M.K., J.K., and K.M.; formal analysis, A.P., and M.K.; investigation, A.P., M.K.; resources, K.M.; data curation, M.K, A.P.; writing—original draft preparation, A.P., J.K; writing—review and editing, A.P. and J.K.; visualization, A.P. , M.K.; supervision, K.M.; project administration, K.M, A.P.; funding acquisition, K.M. All authors have read and agreed to the published version of the manuscript.

Funding

Publication financed by the project “UPWR 2.0:international and interdisciplinary programme of development of Wrocław University of Environmental and Life Sciences”, co-financed by the European Social Fund under the Operational Program Knowledge Education Development, under contract No. POWR.03.05.00-00-Z062/18 of 4 June 2019.

Institutional Review Board Statement

The animal study protocol was approved by the Local Ethical Committee in Wroclaw for animal experiments (permit no. 84/2018).

Data Availability Statement

All the data that support the findings of this study are available from the corresponding author upon reasonable request.

Conflicts of Interest

The authors declare no conflict of interest.

References

  1. El-Husseiny, H.M.; Mady, E.A.; Helal, M.A.Y.; Tanaka, R. The Pivotal Role of Stem Cells in Veterinary Regenerative Medicine and Tissue Engineering. Vet. Sci. 2022, Vol. 9, Page 648 2022, 9, 648. [Google Scholar] [CrossRef]
  2. Chandra, V.; Mankuzhy, P.; Sharma G., T. Mesenchymal Stem Cells in Veterinary Regenerative Therapy: Basic Physiology and Clinical Applications. Curr. Stem Cell Res. Ther. 2021, 17, 237–251. [Google Scholar] [CrossRef] [PubMed]
  3. Jovic, D.; Yu, Y.; Wang, D.; Wang, K.; Li, H.; Xu, F.; Liu, C.; Liu, J.; Luo, Y. A Brief Overview of Global Trends in MSC-Based Cell Therapy. Stem Cell Rev. Reports 2022 185 2022, 18, 1525–1545. [Google Scholar] [CrossRef]
  4. Hoang, D.M.; Pham, P.T.; Bach, T.Q.; Ngo, A.T.L.; Nguyen, Q.T.; Phan, T.T.K.; Nguyen, G.H.; Le, P.T.T.; Hoang, V.T.; Forsyth, N.R.; et al. Stem Cell-Based Therapy for Human Diseases. Signal Transduct. Target. Ther. 2022 71 2022, 7, 1–41. [Google Scholar] [CrossRef]
  5. Zakrzewski, W.; Dobrzyński, M.; Szymonowicz, M.; Rybak, Z. Stem Cells: Past, Present, and Future. Stem Cell Res. Ther. 2019, 10, 1–22. [Google Scholar] [CrossRef]
  6. Guan, Y.T.; Xie, Y.; Li, D.S.; Zhu, Y.Y.; Zhang, X.L.; Feng, Y.L.; Chen, Y.P.; Xu, L.J.; Liao, P.F.; Wang, G. Comparison of Biological Characteristics of Mesenchymal Stem Cells Derived from the Human Umbilical Cord and Decidua Parietalis. Mol. Med. Rep. 2019, 20, 633–639. [Google Scholar] [CrossRef]
  7. Abu Kasim, N.H.; Govindasamy, V.; Gnanasegaran, N.; Musa, S.; Pradeep, P.J.; Srijaya, T.C.; Aziz, Z.A.C.A. Unique Molecular Signatures Influencing the Biological Function and Fate of Post-Natal Stem Cells Isolated from Different Sources. J. Tissue Eng. Regen. Med. 2015, 9, E252–E2662015. [Google Scholar] [CrossRef]
  8. Menicanin, D.; Bartold, P.M.; Zannettino, A.C.W.; Gronthos, S. Identification of a Common Gene Expression Signature Associated with Immature Clonal Mesenchymal Cell Populations Derived from Bone Marrow and Dental Tissues. https://home.liebertpub.com/scd 2010, 19, 1501–1510. [Google Scholar] [CrossRef]
  9. Yamaguchi, S.; Horie, N.; Satoh, K.; Ishikawa, T.; Mori, T.; Maeda, H.; Fukuda, Y.; Ishizaka, S.; Hiu, T.; Morofuji, Y.; et al. Age of Donor of Human Mesenchymal Stem Cells Affects Structural andfunctional Recovery after Cell Therapy Following Ischaemic. J. Cereb. Blood Flow Metab. 2018, 38, 1199. [Google Scholar] [CrossRef]
  10. Oliva-Olivera, W.; Coin-Aragüez, L.; Lhamyani, S.; Clemente-Postigo, M.; Torres, J.A.; Bernal-Lopez, M.R.; El Bekay, R.; Tinahones, F.J. Adipogenic Impairment of Adipose Tissue–Derived Mesenchymal Stem Cells in Subjects With Metabolic Syndrome: Possible Protective Role of FGF2. J. Clin. Endocrinol. Metab. 2017, 102, 478–487. [Google Scholar] [CrossRef]
  11. Marzano, M.; Fosso, B.; Piancone, E.; Defazio, G.; Pesole, G.; De Robertis, M. Stem Cell Impairment at the Host-Microbiota Interface in Colorectal Cancer. Cancers 2021, Vol. 13, Page 996 2021, 13, 996. [Google Scholar] [CrossRef] [PubMed]
  12. Bogeska, R.; Mikecin, A.M.; Kaschutnig, P.; Fawaz, M.; Büchler-Schäff, M.; Le, D.; Ganuza, M.; Vollmer, A.; Paffenholz, S. V.; Asada, N.; et al. Inflammatory Exposure Drives Long-Lived Impairment of Hematopoietic Stem Cell Self-Renewal Activity and Accelerated Aging. Cell Stem Cell 2022, 29, 1273–1284.e8. [Google Scholar] [CrossRef] [PubMed]
  13. Al-Ghadban, S.; Artiles, M.; Bunnell, B.A. Adipose Stem Cells in Regenerative Medicine: Looking Forward. Front. Bioeng. Biotechnol. 2022, 9, 837464. [Google Scholar] [CrossRef]
  14. Trzyna, A.; Bana´sbana´s-Z, A. ; Abczyk, ˛; Ong, W. K.; Sheard, J. Adipose-Derived Stem Cells Secretome and Its Potential Application in “Stem Cell-Free Therapy.” Biomol. 2021, Vol. 11, Page 878 2021, 11, 878. [Google Scholar] [CrossRef]
  15. Marycz, K.; Pielok, A.; Kornicka-Garbowska, K. Equine Hoof Stem Progenitor Cells (HPC) CD29 + /Nestin + /K15 + – a Novel Dermal/Epidermal Stem Cell Population With a Potential Critical Role for Laminitis Treatment. Stem Cell Rev. Reports 2021, 1, 3. [Google Scholar] [CrossRef] [PubMed]
  16. Marycz, K.; Weiss, C.; Śmieszek, A.; Kornicka, K. Evaluation of Oxidative Stress and Mitophagy during Adipogenic Differentiation of Adipose-Derived Stem Cells Isolated from Equine Metabolic Syndrome (EMS) Horses. Stem Cells Int. 2018, 2018. [Google Scholar] [CrossRef]
  17. Suagee, J.K.; Corl, B.A.; Geor, R.J. A Potential Role for Pro-Inflammatory Cytokines in the Development of Insulin Resistance in Horses. Anim. 2012, Vol. 2, Pages 243-260 2012, 2, 243–260. [Google Scholar] [CrossRef]
  18. Karikoski, N.P.; Horn, I.; McGowan, T.W.; McGowan, C.M. The Prevalence of Endocrinopathic Laminitis among Horses Presented for Laminitis at a First-Opinion/Referral Equine Hospital. Domest. Anim. Endocrinol. 2011, 41, 111–117. [Google Scholar] [CrossRef]
  19. Morgan, R.; Keen, J.; McGowan, C. Equine Metabolic Syndrome. Vet. Rec. 2015, 177, 173–179. [Google Scholar] [CrossRef]
  20. Frank, N.; Tadros, E.M. Insulin Dysregulation. Equine Vet. J. 2014, 46, 103–112. [Google Scholar] [CrossRef]
  21. de Laat, M.A.; McGree, J.M.; Sillence, M.N. Equine Hyperinsulinemia: Investigation of the Enteroinsular Axis during Insulin Dysregulation. Am. J. Physiol. - Endocrinol. Metab. 2015, 310, E61–E722015. [Google Scholar] [CrossRef] [PubMed]
  22. Asplin, K.E.; Sillence, M.N.; Pollitt, C.C.; McGowan, C.M. Induction of Laminitis by Prolonged Hyperinsulinaemia in Clinically Normal Ponies. Vet. J. 2007, 174, 530–535. [Google Scholar] [CrossRef] [PubMed]
  23. Nanayakkara, S.N.; Rahnama, S.; Harris, P.A.; Anderson, S.T.; de Laat, M.A.; Bailey, S.; Sillence, M.N. Characterization of Insulin and IGF-1 Receptor Binding in Equine Liver and Lamellar Tissue: Implications for Endocrinopathic Laminitis. Domest. Anim. Endocrinol. 2019, 66, 21–26. [Google Scholar] [CrossRef] [PubMed]
  24. Kullmann, A.; Weber, P.S.; Bishop, J.B.; Roux, T.M.; Norby, B.; Burns, T.A.; McCutcheon, L.J.; Belknap, J.K.; Geor, R.J. Equine Insulin Receptor and Insulin-like Growth Factor-1 Receptor Expression in Digital Lamellar Tissue and Insulin Target Tissues. Equine Vet. J. 2016, 48, 626–632. [Google Scholar] [CrossRef] [PubMed]
  25. Serteyn, D.U. de L.-Ul.> D. clinique des animaux de compagnie et des équidés (DCA) > A. gén. et pathologie chirurg. des grds animaux; de la Rebière de Pouyade, G.U. de L.-Ul.> D. clinique des animaux de compagnie et des équidés (DCA) > A. gén. et pathologie chirurg. des grds animaux; Sandersen, C.U. de L.-Ul.> D. clinique des animaux de compagnie et des équidés (DCA) > A. et réanimation vétérinaires; Salciccia, A.U. de L.-Ul.> D. clinique des animaux de compagnie et des équidés (DCA) > D. clinique des animaux de compagnie et des équidés (DCA); Grulke, S.U. de L.-Ul.> D. clinique des animaux de compagnie et des équidés (DCA) > D. clinique des animaux de compagnie et des équidés (DCA); Mouithys-Mickalad, A.U. de L.-Ul.> C. de l’oxygène : R. et développement (C. O.R.D..; Franck, T.U. de L.-Ul.> C. de l’oxygène : R. et développement (C. O.R.D..; Lejeune, J.-P.U. de L.-Ul.> D. clinique des animaux de compagnie et des équidés (DCA) > A. gén. et pathologie chirurg. des grds animaux; Ceusters, J.U. de L.-Ul.> C. des grands animaux (chirurgie) Muscle Mitochondrial Dysfunction in Horses Affected by Acute Laminitis. Bioenergetics 2014, 03. [Google Scholar] [CrossRef]
  26. de Laat, M.A.; McGowan, C.M.; Sillence, M.N.; Pollitt, C.C. Equine Laminitis: Induced by 48 h Hyperinsulinaemia in Standardbred Horses. Equine Vet. J. 2010, 42, 129–135. [Google Scholar] [CrossRef]
  27. Pielok, A.; K˛ Epska, M.; Steczkiewicz, Z.; Grobosz, S.; Bourebaba, L.; Marycz, K. Equine Hoof Progenitor Cells Display Increased Mitochondrial Metabolism and Adaptive Potential to a Highly Pro-Inflammatory Microenvironment. Int. J. Mol. Sci. 2023, Vol. 24, Page 11446 2023, 24, 11446. [Google Scholar] [CrossRef]
  28. Li, P.; Wei, J.; Gao, X.; Wei, B.; Lin, H.; Huang, R.; Niu, Y.; Lim, K.; Jing, K.; Chu, J. Insulin Promotes the Proliferation of Human Umbilical Cord Matrix-Derived Mesenchymal Stem Cells by Activating the Akt-Cyclin D1 Axis. Stem Cells Int. 2017, 2017. [Google Scholar] [CrossRef]
  29. Brown, L.D.; Wesolowski, S.R.; Kailey, J.; Bourque, S.; Wilson, A.; Andrews, S.E.; Hay, W.W.; Rozance, P.J. Chronic Hyperinsulinemia Increases Myoblast Proliferation in Fetal Sheep Skeletal Muscle. Endocrinology 2016, 157, 2447–2460. [Google Scholar] [CrossRef]
  30. Zheng, X. rong; Pan, X.; Zhang, J.; Cao, X. Hyperinsulinemia-Induced PAX6 Expression Promotes Endometrial Epithelial Cell Proliferation via Negatively Modulating P27 Signaling. Biomed. Pharmacother. 2018, 97, 802–808. [Google Scholar] [CrossRef]
  31. Tran, T.T.; Naigamwalla, D.; Oprescu, A.I.; Lam, L.; McKeown-Eyssen, G.; Bruce, W.R.; Giacca, A. Hyperinsulinemia, But Not Other Factors Associated with Insulin Resistance, Acutely Enhances Colorectal Epithelial Proliferation in Vivo. Endocrinology 2006, 147, 1830–1837. [Google Scholar] [CrossRef] [PubMed]
  32. Tan, Q.; Li, Y.; Li, X.; Zhang, S. Hyperinsulinemia Impairs Functions of Circulating Endothelial Progenitor Cells. Acta Diabetol. 2019, 56, 785–795. [Google Scholar] [CrossRef] [PubMed]
  33. Guerriero, E.; Sorice, A.; Capone, F.; Stor Ti, G.; Colonna, G.; Ciliberto, G.; Costantini, S. Combining Doxorubicin with a Phenolic Extract from Flaxseed Oil: Evaluation of the Effect on Two Breast Cancer Cell Lines. Int. J. Oncol. 2017, 50, 468–476. [Google Scholar] [CrossRef] [PubMed]
  34. Youle, R.J.; Bliek, A.M. Van Der; Complementation, F.P.; Mitochondria, B.D.; Fusion, M.; Proteins, F. REVIEW Mitochondrial Fission, Fusion, and Stress. 2012, 337, 1062–1066. [Google Scholar] [PubMed]
  35. Zorzano, A.; Liesa, M.; Palacin, M. Mitochondrial Dynamics as a Bridge between Mitochondrial Dysfunction and Insulin Resistance. 2009, 115, 1–12. [Google Scholar] [CrossRef]
  36. Zhu, Y.; Yang, H.; Deng, J.; Fan, D. Ginsenoside Rg5 Improves Insulin Resistance and Mitochondrial Biogenesis of Liver via Regulation of the Sirt1/PGC-1α Signaling Pathway in Db/Db Mice. J. Agric. Food Chem. 2021, 69, 8428–8439. [Google Scholar] [CrossRef]
  37. Mazibuko-Mbeje, S.E.; Mthembu, S.X.H.; Dludla, P. V.; Madoroba, E.; Chellan, N.; Kappo, A.P.; Muller, C.J.F. Antimycin A-Induced Mitochondrial Dysfunction Is Consistent with Impaired Insulin Signaling in Cultured Skeletal Muscle Cells. Toxicol. Vitr. 2021, 76, 105224. [Google Scholar] [CrossRef]
  38. Cooper, I.D.; Brookler, K.H.; Kyriakidou, Y.; Elliott, B.T.; Crofts, C.A.P. Metabolic Phenotypes and Step by Step Evolution of Type 2 Diabetes: A New Paradigm. Biomed. 2021, Vol. 9, Page 800 2021, 9, 800. [Google Scholar] [CrossRef]
  39. Bourebaba, N.; Kornicka-Garbowska, K.; Marycz, K.; Bourebaba, L.; Kowalczuk, A. Laurus Nobilis Ethanolic Extract Attenuates Hyperglycemia and Hyperinsulinemia-Induced Insulin Resistance in HepG2 Cell Line through the Reduction of Oxidative Stress and Improvement of Mitochondrial Biogenesis – Possible Implication in Pharmacotherapy. Mitochondrion 2021, 59, 190–213. [Google Scholar] [CrossRef]
  40. Shan, Z.; Fa, W.H.; Tian, C.R.; Yuan, C.S.; Jie, N. Mitophagy and Mitochondrial Dynamics in Type 2 Diabetes Mellitus Treatment. Aging (Albany. NY). 2022, 14, 2902–2919. [Google Scholar] [CrossRef]
  41. Zhou, P.; Xie, W.; Meng, X.; Zhai, Y.; Dong, X.; Zhang, X.; Sun, G.; Sun, X. Notoginsenoside R1 Ameliorates Diabetic Retinopathy through PINK1-dependent Activation of Mitophagy. Cells 2019, 8. [Google Scholar] [CrossRef]
  42. He, F.; Huang, Y.; Song, Z.; Zhou, H.J.; Zhang, H.; Perry, R.J.; Shulman, G.I.; Min, W. Mitophagy-Mediated Adipose Inflammation Contributes to Type 2 Diabetes with Hepatic Insulin Resistance. J. Exp. Med. 2021, 218. [Google Scholar] [CrossRef]
  43. Sun, D.; Wang, J.; Toan, S.; Muid, D.; Li, R.; Chang, X.; Zhou, H. Molecular Mechanisms of Coronary Microvascular Endothelial Dysfunction in Diabetes Mellitus: Focus on Mitochondrial Quality Surveillance. Angiogenesis 2022, 25, 307–329. [Google Scholar] [CrossRef] [PubMed]
  44. Wu, H.; Wang, Y.; Li, W.; Chen, H.; Du, L.; Liu, D.; Wang, X.; Xu, T.; Liu, L.; Chen, Q. Deficiency of Mitophagy Receptor FUNDC1 Impairs Mitochondrial Quality and Aggravates Dietary-Induced Obesity and Metabolic Syndrome. Autophagy 2019, 15, 1882–1898. [Google Scholar] [CrossRef] [PubMed]
  45. Scheele, C.; Nielsen, A.R.; Walden, T.B.; Sewell, D.A.; Fischer, C.P.; Brogan, R.J.; Petrovic, N.; Larsson, O.; Tesch, P.A.; Wennmalm, K.; et al. Altered Regulation of the PINK1 Locus: A Link between Type 2 Diabetes and Neurodegeneration? FASEB J. 2007, 21, 3653–3665. [Google Scholar] [CrossRef] [PubMed]
  46. Ishii, K.A.; Fumoto, T.; Iwai, K.; Takeshita, S.; Ito, M.; Shimohata, N.; Aburatani, H.; Taketani, S.; Lelliott, C.J.; Vidal-Puig, A.; et al. Coordination of PGC-1β and Iron Uptake in Mitochondrial Biogenesis and Osteoclast Activation. Nat. Med. 2009 153 2009, 15, 259–266. [Google Scholar] [CrossRef] [PubMed]
  47. Vidal-Puig, A.J. Metabolic Characterisation of PGC1b Ko Mice. FASEB J. 2007, 21, A91–A912007. [Google Scholar] [CrossRef]
  48. Sparks, L.M.; Xie, H.; Koza, R.A.; Mynatt, R.; Hulver, M.W.; Bray, G.A.; Smith, S.R. A High-Fat Diet Coordinately Downregulates Genes Required for Mitochondrial Oxidative Phosphorylation in Skeletal Muscle. Diabetes 2005, 54, 1926–1933. [Google Scholar] [CrossRef]
  49. Miao, H.; Ou, J.; Ma, Y.; Guo, F.; Yang, Z.; Wiggins, M.; Liu, C.; Song, W.; Han, X.; Wang, M.; et al. Macrophage CGI-58 Deficiency Activates ROS-Inflammasome Pathway to Promote Insulin Resistance in Mice. Cell Rep. 2014, 7, 223–235. [Google Scholar] [CrossRef]
  50. Lopez Sanchez, M.I.G.; Krüger, A.; Shiriaev, D.I.; Liu, Y.; Rorbach, J. Human Mitoribosome Biogenesis and Its Emerging Links to Disease. Int. J. Mol. Sci. 2021, 22. [Google Scholar] [CrossRef]
  51. Stiburek, L.; Fornuskova, D.; Wenchich, L.; Pejznochova, M.; Hansikova, H.; Zeman, J. Knockdown of Human Oxa1l Impairs the Biogenesis of F1Fo-ATP Synthase and NADH:Ubiquinone Oxidoreductase. J. Mol. Biol. 2007, 374, 506–516. [Google Scholar] [CrossRef] [PubMed]
  52. Xu, W.; Liang, Y.; Zhuang, Y.; Yuan, Z. Identification of MiRNA-MRNA Regulatory Networks Associated with Diabetic Retinopathy Using Bioinformatics Analysis. Endocr. Metab. Immune Disord. Drug Targets 2023, 23. [Google Scholar] [CrossRef] [PubMed]
  53. Matyal, R.; Sakamuri, S.; Huang, T.; Owais, K.; Parikh, S.; Khabbaz, K.; Wang, A.; Sellke, F.; Mahmood, F. Oxidative Stress and Nerve Function after Cardiopulmonary Bypass in Patients with Diabetes. Ann. Thorac. Surg. 2014, 98, 1635–1644. [Google Scholar] [CrossRef] [PubMed]
  54. Chu, Q.; Martinez, T.F.; Novak, S.W.; Donaldson, C.J.; Tan, D.; Vaughan, J.M.; Chang, T.; Diedrich, J.K.; Andrade, L.; Kim, A.; et al. Regulation of the ER Stress Response by a Mitochondrial Microprotein. Nat. Commun. 2019 101 2019, 10, 1–13. [Google Scholar] [CrossRef]
  55. Lee, K.-U.; Harris, R.A.; Lee, I.-K.; Roy, S. Mitochondria and Endoplasmic Reticulum in Diabetes and Its Complications Experimental Diabetes Research.
  56. Abhijit, S.; Bhaskaran, R.; Narayanasamy, A.; Chakroborty, A.; Manickam, N.; Dixit, M.; Mohan, V.; Balasubramanyam, M. Hyperinsulinemia-Induced Vascular Smooth Muscle Cell (VSMC) Migration and Proliferation Is Mediated by Converging Mechanisms of Mitochondrial Dysfunction and Oxidative Stress. Mol. Cell. Biochem. 2013, 373, 95–105. [Google Scholar] [CrossRef]
  57. Liu, H.Y.; Hong, T.; Wen, G.B.; Han, J.; Zuo, D.; Liu, Z.; Cao, W. Increased Basal Level of Akt-Dependent Insulin Signaling May Be Responsible for the Development of Insulin Resistance. Am. J. Physiol. - Endocrinol. Metab. 2009, 297, 898–906. [Google Scholar] [CrossRef]
  58. Pizzino, G.; Irrera, N.; Cucinotta, M.; Pallio, G.; Mannino, F.; Arcoraci, V.; Squadrito, F.; Altavilla, D.; Bitto, A. Oxidative Stress: Harms and Benefits for Human Health. Oxid. Med. Cell. Longev. 2017, 2017. [Google Scholar] [CrossRef]
  59. Roberts, C.K.; Barnard, R.J.; Sindhu, R.K.; Jurczak, M.; Ehdaie, A.; Vaziri, N.D. Oxidative Stress and Dysregulation of NAD(P)H Oxidase and Antioxidant Enzymes in Diet-Induced Metabolic Syndrome. Metabolism 2006, 55, 928–934. [Google Scholar] [CrossRef]
  60. Rains, J.L.; Jain, S.K. Oxidative Stress, Insulin Signaling, and Diabetes. Free Radic. Biol. Med. 2011, 50, 567–575. [Google Scholar] [CrossRef]
  61. Turina, M.; Miller, F.N.; Tucker, C.; Polk, H.C. Effects of Hyperglycemia, Hyperinsulinemia, and Hyperosmolarity on Neutrophil Apoptosis. https://home.liebertpub.com/sur 2006, 7, 111–121. [Google Scholar] [CrossRef] [PubMed]
  62. Ni, X.R.; Sun, Z.J.; Hu, G.H.; Wang, R.H. High Concentration of Insulin Promotes Apoptosis of Primary Cultured Rat Ovarian Granulosa Cells Via Its Increase in Extracellular HMGB1. 2014, 22, 271–277. [Google Scholar] [CrossRef]
  63. Sifuentes-Franco, S.; Padilla-Tejeda, D.E.; Carrillo-Ibarra, S.; Miranda-Díaz, A.G. Oxidative Stress, Apoptosis, and Mitochondrial Function in Diabetic Nephropathy. Int. J. Endocrinol. 2018, 2018. [Google Scholar] [CrossRef] [PubMed]
  64. Santoro, M.A.; Blue, R.E.; Andres, S.F.; Mah, A.T.; Van Landeghem, L.; Lund, P.K. Obesity and Intestinal Epithelial Deletion of the Insulin Receptor, but Not the IGF 1 Receptor, Affect Radiation-Induced Apoptosis in Colon. Am. J. Physiol. - Gastrointest. Liver Physiol. 2015, 309, G578–G5892015. [Google Scholar] [CrossRef]
  65. Di Sebastiano, K.M.; Pinthus, J.H.; Duivenvoorden, W.C.M.; Mourtzakis, M. Glucose Impairments and Insulin Resistance in Prostate Cancer: The Role of Obesity, Nutrition and Exercise. Obes. Rev. 2018, 19, 1008–1016. [Google Scholar] [CrossRef]
  66. Püschel, G.P.; Klauder, J.; Henkel, J. Macrophages, Low-Grade Inflammation, Insulin Resistance and Hyperinsulinemia: A Mutual Ambiguous Relationship in the Development of Metabolic Diseases. J. Clin. Med. 2022, Vol. 11, Page 4358 2022, 11, 4358. [Google Scholar] [CrossRef]
  67. Ruge, T.; Lockton, J.A.; Renstrom, F.; Lystig, T.; Sukonina, V.; Svensson, M.K.; Eriksson, J.W. Acute Hyperinsulinemia Raises Plasma Interleukin-6 in Both Nondiabetic and Type 2 Diabetes Mellitus Subjects, and This Effect Is Inversely Associated with Body Mass Index. Metabolism 2009, 58, 860–866. [Google Scholar] [CrossRef] [PubMed]
  68. Watts, M.R.; Hegedus, O.C.; Eades, S.C.; Belknap, J.K.; Burns, T.A. Association of Sustained Supraphysiologic Hyperinsulinemia and Inflammatory Signaling within the Digital Lamellae in Light-Breed Horses. J. Vet. Intern. Med. 2019, 33, 1483–1492. [Google Scholar] [CrossRef]
  69. Straczkowski, M.; Dzienis-Straczkowska, S.; Stêpieñ, A.; Kowalska, I.; Szelachowska, M.; Kinalska, I. Plasma Interleukin-8 Concentrations Are Increased in Obese Subjects and Related to Fat Mass and Tumor Necrosis Factor-α System. J. Clin. Endocrinol. Metab. 2002, 87, 4602–4606. [Google Scholar] [CrossRef]
  70. Zozulinska, D.; Majchrzak, A.; Sobieska, M.; Wiktorowicz, K.; Wierusz-Wysocka, B. Serum Interleukin-8 Level Is Increased in Diabetic Patients [1]. Diabetologia 1999, 42, 117–118. [Google Scholar] [CrossRef]
  71. van Niekerk, G.; Christowitz, C.; Conradie, D.; Engelbrecht, A.M. Insulin as an Immunomodulatory Hormone. Cytokine Growth Factor Rev. 2020, 52, 34–44. [Google Scholar] [CrossRef]
  72. Zhu, Z.; Hu, T.; Wang, Z.; Wang, J.; Liu, R.; Yang, Q.; Zhang, X.; Xiong, Y. Anti-Inflammatory and Organ Protective Effect of Insulin in Scalded MODS Rats without Controlling Hyperglycemia. Am. J. Emerg. Med. 2018, 36, 202–207. [Google Scholar] [CrossRef]
  73. Leffler, M.; Hrach, T.; Stuerzl, M.; Horch, R.E.; Herndon, D.N.; Jeschke, M.G. Insulin Attenuates Apoptosis and Exerts Anti-Inflammatory Effects in Endotoxemic Human Macrophages. J. Surg. Res. 2007, 143, 398–406. [Google Scholar] [CrossRef]
  74. Brix-Christensen, V.; Andersen, S.K.; Andersen, R.; Mengel, A.; Dyhr, T.; Andersen, N.T.; Larsson, A.; Schmitz, O.; Ørskov, H.; Tønnesen, E. Acute Hyperinsulinemia Restrains Endotoxin-Induced Systemic Inflammatory ResponseAn Experimental Study in a Porcine Model. Anesthesiology 2004, 100, 861–870. [Google Scholar] [CrossRef]
  75. Van Exel, E.; Gussekloo, J.; De Craen, A.J.M.; Frölich, M.; Wiel, A.B. Van Der; Westendorp, R.G.J. Low Production Capacity of Interleukin-10 Associates with the Metabolic Syndrome and Type 2 Diabetes: The Leiden 85-plus Study. Diabetes 2002, 51, 1088–1092. [Google Scholar] [CrossRef]
  76. Jiang, L.Q.; Franck, N.; Egan, B.; Sjögren, R.J.O.; Katayama, M.; Duque-Guimaraes, D.; Arner, P.; Zierath, J.R.; Krook, A. Autocrine Role of Interleukin-13 on Skeletal Muscle Glucose Metabolism in Type 2 Diabetic Patients Involves MicroRNA Let-7. Am. J. Physiol. - Endocrinol. Metab. 2013, 305, 1359–1366. [Google Scholar] [CrossRef]
  77. Martínez-Reyes, C.P.; Gómez-Arauz, A.Y.; Torres-Castro, I.; Manjarrez-Reyna, A.N.; Palomera, L.F.; Olivos-García, A.; Mendoza-Tenorio, E.; Sánchez-Medina, G.A.; Islas-Andrade, S.; Melendez-Mier, G.; et al. Serum Levels of Interleukin-13 Increase in Subjects with Insulin Resistance but Do Not Correlate with Markers of Low-Grade Systemic Inflammation. J. Diabetes Res. 2018, 2018. [Google Scholar] [CrossRef]
  78. Calera, M.R.; Vallega, G.; Pilch, P.F. Dynamics of Protein-Tyrosine Phosphatases in Rat Adipocytes. J. Biol. Chem. 2000, 275, 6308–6312. [Google Scholar] [CrossRef]
  79. Nakae, J.; Kitamura, T.; Kitamura, Y.; Biggs, W.H.; Arden, K.C.; Accili, D. The Forkhead Transcription Factor Fox01 Regulates Adipocyte Differentiation. Dev. Cell 2003, 4, 119–129. [Google Scholar] [CrossRef]
  80. Tsuchida, A.; Yamauchi, T.; Ito, Y.; Hada, Y.; Maki, T.; Takekawa, S.; Kamon, J.; Kobayashi, M.; Suzuki, R.; Hara, K.; et al. Insulin/Foxo1 Pathway Regulates Expression Levels of Adiponectin Receptors and Adiponectin Sensitivity. J. Biol. Chem. 2004, 279, 30817–30822. [Google Scholar] [CrossRef]
  81. Okabayashi, Y.; Maddux, B.A.; McDonald, A.R.; Logsdon, C.D.; Williams, J.A.; Goldfine, I.D. Mechanisms of Inslulin-Induced Insulin-Receptor Downregulation. Decrease of Receptor Biosynthesis and MRNA Levels. Diabetes 1989, 38, 182–187. [Google Scholar] [CrossRef] [PubMed]
  82. Cen, H.H.; Hussein, B.; Botezelli, J.D.; Wang, S.; Zhang, J.A.; Noursadeghi, N.; Jessen, N.; Rodrigues, B.; Timmons, J.A.; Johnson, J.D. Human and Mouse Muscle Transcriptomic Analyses Identify Insulin Receptor MRNA Downregulation in Hyperinsulinemia-Associated Insulin Resistance. FASEB J. 2022, 36. [Google Scholar] [CrossRef] [PubMed]
  83. Mayer, C.M.; Belsham, D.D. Central Insulin Signaling Is Attenuated by Long-Term Insulin Exposure via Insulin Receptor Substrate-1 Serine Phosphorylation, Proteasomal Degradation, and Lysosomal Insulin Receptor Degradation. Endocrinology 2010, 151, 75–84. [Google Scholar] [CrossRef]
  84. Durham, A.E.; Frank, N.; McGowan, C.M.; Menzies-Gow, N.J.; Roelfsema, E.; Vervuert, I.; Feige, K.; Fey, K. ECEIM Consensus Statement on Equine Metabolic Syndrome. J. Vet. Intern. Med. 2019, 33, 335–349. [Google Scholar] [CrossRef] [PubMed]
  85. Venugopal, C.; Holmes, E.; Beadle, R.; Kearney, M.; Eades, S. Comparison of Insulin-Induced Digital Vessel Ring Responses of Laminitic and Clinically Healthy Horses. J. Equine Vet. Sci. 2014, 34, 998–1002. [Google Scholar] [CrossRef]
  86. Carter, R.A.; Treiber, K.H.; Geor, R.J.; Douglass, L.; Harris, P.A. Prediction of Incipient Pasture-Associated Laminitis from Hyperinsulinaemia, Hyperleptinaemia and Generalised and Localised Obesity in a Cohort of Ponies. Equine Vet. J. 2009, 41, 171–178. [Google Scholar] [CrossRef]
  87. Martin, E. C. , Qureshi, A. T., Dasa, V., Freitas, M. A., Gimble, J. M., & Davis, T.A. MicroRNA Regulation of Stem Cell Differentiation and Diseases of the Bone and Adipose Tissue. Biochimie. 2014, 124, 98–111. [Google Scholar] [CrossRef]
  88. Włodarski, A.; Strycharz, J.; Wróblewski, A.; Kasznicki, J.; Drzewoski, J.; Śliwińska, A. The Role of MicroRNAs in Metabolic Syndrome-Related Oxidative Stress. Int. J. Mol. Sci. 2020, Vol. 21, Page 6902 2020, 21, 6902. [Google Scholar] [CrossRef]
  89. Huang, J.; Zhao, L.; Xing, L.; Chen, D. MicroRNA-204 Regulates Runx2 Protein Expression and Mesenchymal Progenitor Cell Differentiation. Stem Cells 2010, 28, 357–364. [Google Scholar] [CrossRef]
  90. Xu, S.; Cecilia Santini, G.; De Veirman, K.; Vande Broek, I.; Leleu, X.; De Becker, A.; Van Camp, B.; Vanderkerken, K.; Van Riet, I. Upregulation of MiR-135b Is Involved in the Impaired Osteogenic Differentiation of Mesenchymal Stem Cells Derived from Multiple Myeloma Patients. PLoS One 2013, 8, e797522013–8. [Google Scholar] [CrossRef]
  91. Tay, Y.; Zhang, J.; Thomson, A.M.; Lim, B.; Rigoutsos, I. MicroRNAs to Nanog, Oct4 and Sox2 Coding Regions Modulate Embryonic Stem Cell Differentiation. Nat. 2008 4557216 2008, 455, 1124–1128. [Google Scholar] [CrossRef] [PubMed]
  92. Marson, A.; Levine, S.S.; Cole, M.F.; Frampton, G.M.; Brambrink, T.; Johnstone, S.; Guenther, M.G.; Johnston, W.K.; Wernig, M.; Newman, J.; et al. Connecting MicroRNA Genes to the Core Transcriptional Regulatory Circuitry of Embryonic Stem Cells. Cell 2008, 134, 521–533. [Google Scholar] [CrossRef] [PubMed]
  93. Mizuno, Y.; Yagi, K.; Tokuzawa, Y.; Kanesaki-Yatsuka, Y.; Suda, T.; Katagiri, T.; Fukuda, T.; Maruyama, M.; Okuda, A.; Amemiya, T.; et al. MiR-125b Inhibits Osteoblastic Differentiation by down-Regulation of Cell Proliferation. Biochem. Biophys. Res. Commun. 2008, 368, 267–272. [Google Scholar] [CrossRef] [PubMed]
  94. Boissart, C.; Nissan, X.; Giraud-Triboult, K.; Peschanski, M.; Benchoua, A. MiR-125 Potentiates Early Neural Specification of Human Embryonic Stem Cells. Development 2012, 139, 1247–1257. [Google Scholar] [CrossRef] [PubMed]
  95. Takeda, Y.S.; Xu, Q. Neuronal Differentiation of Human Mesenchymal Stem Cells Using Exosomes Derived from Differentiating Neuronal Cells. PLoS One 2015, 10. [Google Scholar] [CrossRef]
  96. Zhang, L.; Stokes, N.; Polak, L.; Fuchs, E. Specific MicroRNAs Are Preferentially Expressed by Skin Stem Cells to Balance Self-Renewal and Early Lineage Commitment. Cell Stem Cell 2011, 8, 294–308. [Google Scholar] [CrossRef]
  97. Ma, S.; Wang, D.D.; Ma, C.Y.; Zhang, Y.D. MicroRNA-96 Promotes Osteoblast Differentiation and Bone Formation in Ankylosing Spondylitis Mice through Activating the Wnt Signaling Pathway by Binding to SOST. J. Cell. Biochem. 2019, 120, 15429–15442. [Google Scholar] [CrossRef]
  98. Karvande, A.; Kushwaha, P.; Ahmad, N.; Adhikary, S.; Kothari, P.; Tripathi, A.K.; Khedgikar, V.; Trivedi, R. Glucose Dependent MiR-451a Expression Contributes to Parathyroid Hormone Mediated Osteoblast Differentiation. Bone 2018, 117, 98–115. [Google Scholar] [CrossRef]
  99. Shi, L.; Feng, L.; Liu, Y.; Duan, J. qiang; Lin, W. ping; Zhang, J. fang; Li, G. MicroRNA-218 Promotes Osteogenic Differentiation of Mesenchymal Stem Cells and Accelerates Bone Fracture Healing. Calcif. Tissue Int. 2018, 103, 227–236. [Google Scholar] [CrossRef]
  100. Huang, Y.; Zhu, N.; Chen, T.; Chen, W.; Kong, J.; Zheng, W.; Ruan, J. Triptolide Suppressed the Microglia Activation to Improve Spinal Cord Injury Through MiR-96/IKKβ/NF-ΚB Pathway. Spine (Phila. Pa. 1976). 2019, 44, E707–E7142019. [Google Scholar] [CrossRef]
  101. Wu, P.; Cao, Y.; Zhao, R.; Wang, Y. MiR-96-5p Regulates Wound Healing by Targeting BNIP3/FAK Pathway. J. Cell. Biochem. 2019, 120, 12904–12911. [Google Scholar] [CrossRef]
  102. Uwiera, R.R.E.; Egyedy, A.F.; Ametaj, B.N. Laminitis: A Multisystems Veterinary Perspective with Omics Technologies. Periparturient Dis. Dairy Cows A Syst. Biol. Approach 2017, 185–200. [Google Scholar] [CrossRef]
  103. Mobasheri, A.; Critchlow, K.; Clegg, P.D.; Carter, S.D.; Canessa, C.M. Chronic Equine Laminitis Is Characterised by Loss of GLUT1, GLUT4 and ENaC Positive Laminar Keratinocytes. Equine Vet. J. 2004, 36, 248–254. [Google Scholar] [CrossRef] [PubMed]
  104. Chen, S.; Xu, Z.; Shao, J.; Fu, P.; Wu, H. MicroRNA-218 Promotes Early Chondrogenesis of Mesenchymal Stem Cells and Inhibits Later Chondrocyte Maturation. BMC Biotechnol. 2019, 19, 1–10. [Google Scholar] [CrossRef] [PubMed]
  105. Sun, Y.; Peng, R.; Peng, H.; Liu, H.; Wen, L.; Wu, T.; Yi, H.; Li, A.; Zhang, Z. MiR-451 Suppresses the NF-KappaB-Mediated Proinflammatory Molecules Expression through Inhibiting LMP7 in Diabetic Nephropathy. Mol. Cell. Endocrinol. 2016, 433, 75–86. [Google Scholar] [CrossRef]
  106. Sun, X.; Zhang, H. MiR-451 Elevation Relieves Inflammatory Pain by Suppressing Microglial Activation-Evoked Inflammatory Response via Targeting TLR4. Cell Tissue Res. 2018, 374, 487–495. [Google Scholar] [CrossRef]
  107. Choi, Y.J.; Lin, C.P.; Ho, J.J.; He, X.; Okada, N.; Bu, P.; Zhong, Y.; Kim, S.Y.; Bennett, M.J.; Chen, C.; et al. MiR-34 MiRNAs Provide a Barrier for Somatic Cell Reprogramming. Nat. Cell Biol. 2011 1311 2011, 13, 1353–1360. [Google Scholar] [CrossRef]
  108. Alvarez, M.L.; Khosroheidari, M.; Eddy, E.; Done, S.C. MicroRNA-27a Decreases the Level and Efficiency of the LDL Receptor and Contributes to the Dysregulation of Cholesterol Homeostasis. Atherosclerosis 2015, 242, 595–604. [Google Scholar] [CrossRef]
  109. Karolina, D.S.; Tavintharan, S.; Armugam, A.; Sepramaniam, S.; Pek, S.L.T.; Wong, M.T.K.; Lim, S.C.; Sum, C.F.; Jeyaseelan, K. Circulating MiRNA Profiles in Patients with Metabolic Syndrome. J. Clin. Endocrinol. Metab. 2012, 97, E2271–E22762012. [Google Scholar] [CrossRef]
  110. Yao, F.; Yu, Y.; Feng, L.; Li, J.; Zhang, M.; Lan, X.; Yan, X.; Liu, Y.; Guan, F.; Zhang, M.; et al. Adipogenic MiR-27a in Adipose Tissue Upregulates Macrophage Activation via Inhibiting PPARγ of Insulin Resistance Induced by High-Fat Diet-Associated Obesity. Exp. Cell Res. 2017, 355, 105–112. [Google Scholar] [CrossRef]
  111. Bridge, G.; Monteiro, R.; Henderson, S.; Emuss, V.; Lagos, D.; Georgopoulou, D.; Patient, R.; Boshoff, C. The MicroRNA-30 Family Targets DLL4 to Modulate Endothelial Cell Behavior during Angiogenesis. Blood 2012, 120, 5063–5072. [Google Scholar] [CrossRef] [PubMed]
  112. Nakano, T.; Fukuda, D.; Koga, J.I.; Aikawa, M. Delta-Like Ligand 4-Notch Signaling in Macrophage Activation. Arterioscler. Thromb. Vasc. Biol. 2016, 36, 2038–2047. [Google Scholar] [CrossRef] [PubMed]
  113. Xie, H.; Sun, L.; Lodish, H.F. Targeting MicroRNAs in Obesity. Expert Opin. Ther. Targets 2009, 13, 1227–1238. [Google Scholar] [CrossRef] [PubMed]
  114. Purvis, N.; Kumari, S.; Chandrasekera, D.; Bellae Papannarao, J.; Gandhi, S.; van Hout, I.; Coffey, S.; Bunton, R.; Sugunesegran, R.; Parry, D.; et al. Diabetes Induces Dysregulation of MicroRNAs Associated with Survival, Proliferation and Self-Renewal in Cardiac Progenitor Cells. Diabetologia 2021, 64, 1422–1435. [Google Scholar] [CrossRef]
  115. Ling, H.Y.; Hu, B.; Hu, X.B.; Zhong, J.; Feng, S.D.; Qin, L.; Liu, G.; Wen, G.B.; Liao, D.F. MiRNA-21 Reverses High Glucose and High Insulin Induced Insulin Resistance in 3T3-L1 Adipocytes through Targeting Phosphatase and Tensin Homologue. Exp. Clin. Endocrinol. Diabetes 2012, 120, 553–559. [Google Scholar] [CrossRef]
  116. Jeong Kim, Y.; Jin Hwang, S.; Chan Bae, Y.; Sup Jung, J. MiR-21 Regulates Adipogenic Differentiation through the Modulation of TGF-β Signaling in Mesenchymal Stem Cells Derived from Human Adipose Tissue. Stem Cells 2009, 27, 3093–3102. [Google Scholar] [CrossRef]
  117. Yang, Q.; Pinto, V.M.R.; Duan, W.; Paxton, E.E.; Dessauer, J.H.; Ryan, W.; Lopez, M.J. In Vitro Characteristics of Heterogeneous Equine Hoof Progenitor Cell Isolates. Front. Bioeng. Biotechnol. 2019, 7, 155. [Google Scholar] [CrossRef]
  118. Marędziak, M.; Marycz, K.; Lewandowski, D.; Siudzińska, A.; Śmieszek, A. Static Magnetic Field Enhances Synthesis and Secretion of Membrane-Derived Microvesicles (MVs) Rich in VEGF and BMP-2 in Equine Adipose-Derived Stromal Cells (EqASC)—a New Approach in Veterinary Regenerative Medicine. Vitr. Cell. Dev. Biol. - Anim. 2015, 51, 230–240. [Google Scholar] [CrossRef]
  119. CHOMZYNSKI, P. Single-Step Method of RNA Isolation by Acid Guanidinium Thiocyanate–Phenol–Chloroform Extraction. Anal. Biochem. 1987, 162, 156–159. [Google Scholar] [CrossRef]
  120. Mularczyk, M.; Bourebaba, N.; Marycz, K.; Bourebaba, L. Astaxanthin Carotenoid Modulates Oxidative Stress in Adipose-Derived Stromal Cells Isolated from Equine Metabolic Syndrome Affected Horses by Targeting Mitochondrial Biogenesis. Biomol. 2022, Vol. 12, Page 1039 2022, 12, 1039. [Google Scholar] [CrossRef]
  121. Suszynska, M.; Poniewierska-Baran, A.; Gunjal, P.; Ratajczak, J.; Marycz, K.; Kakar, S.S.; Kucia, M.; Ratajczak, M.Z. Expression of the Erythropoietin Receptor by Germline-Derived Cells - Further Support for a Potential Developmental Link between the Germline and Hematopoiesis. J. Ovarian Res. 2014, 7, 66. [Google Scholar] [CrossRef] [PubMed]
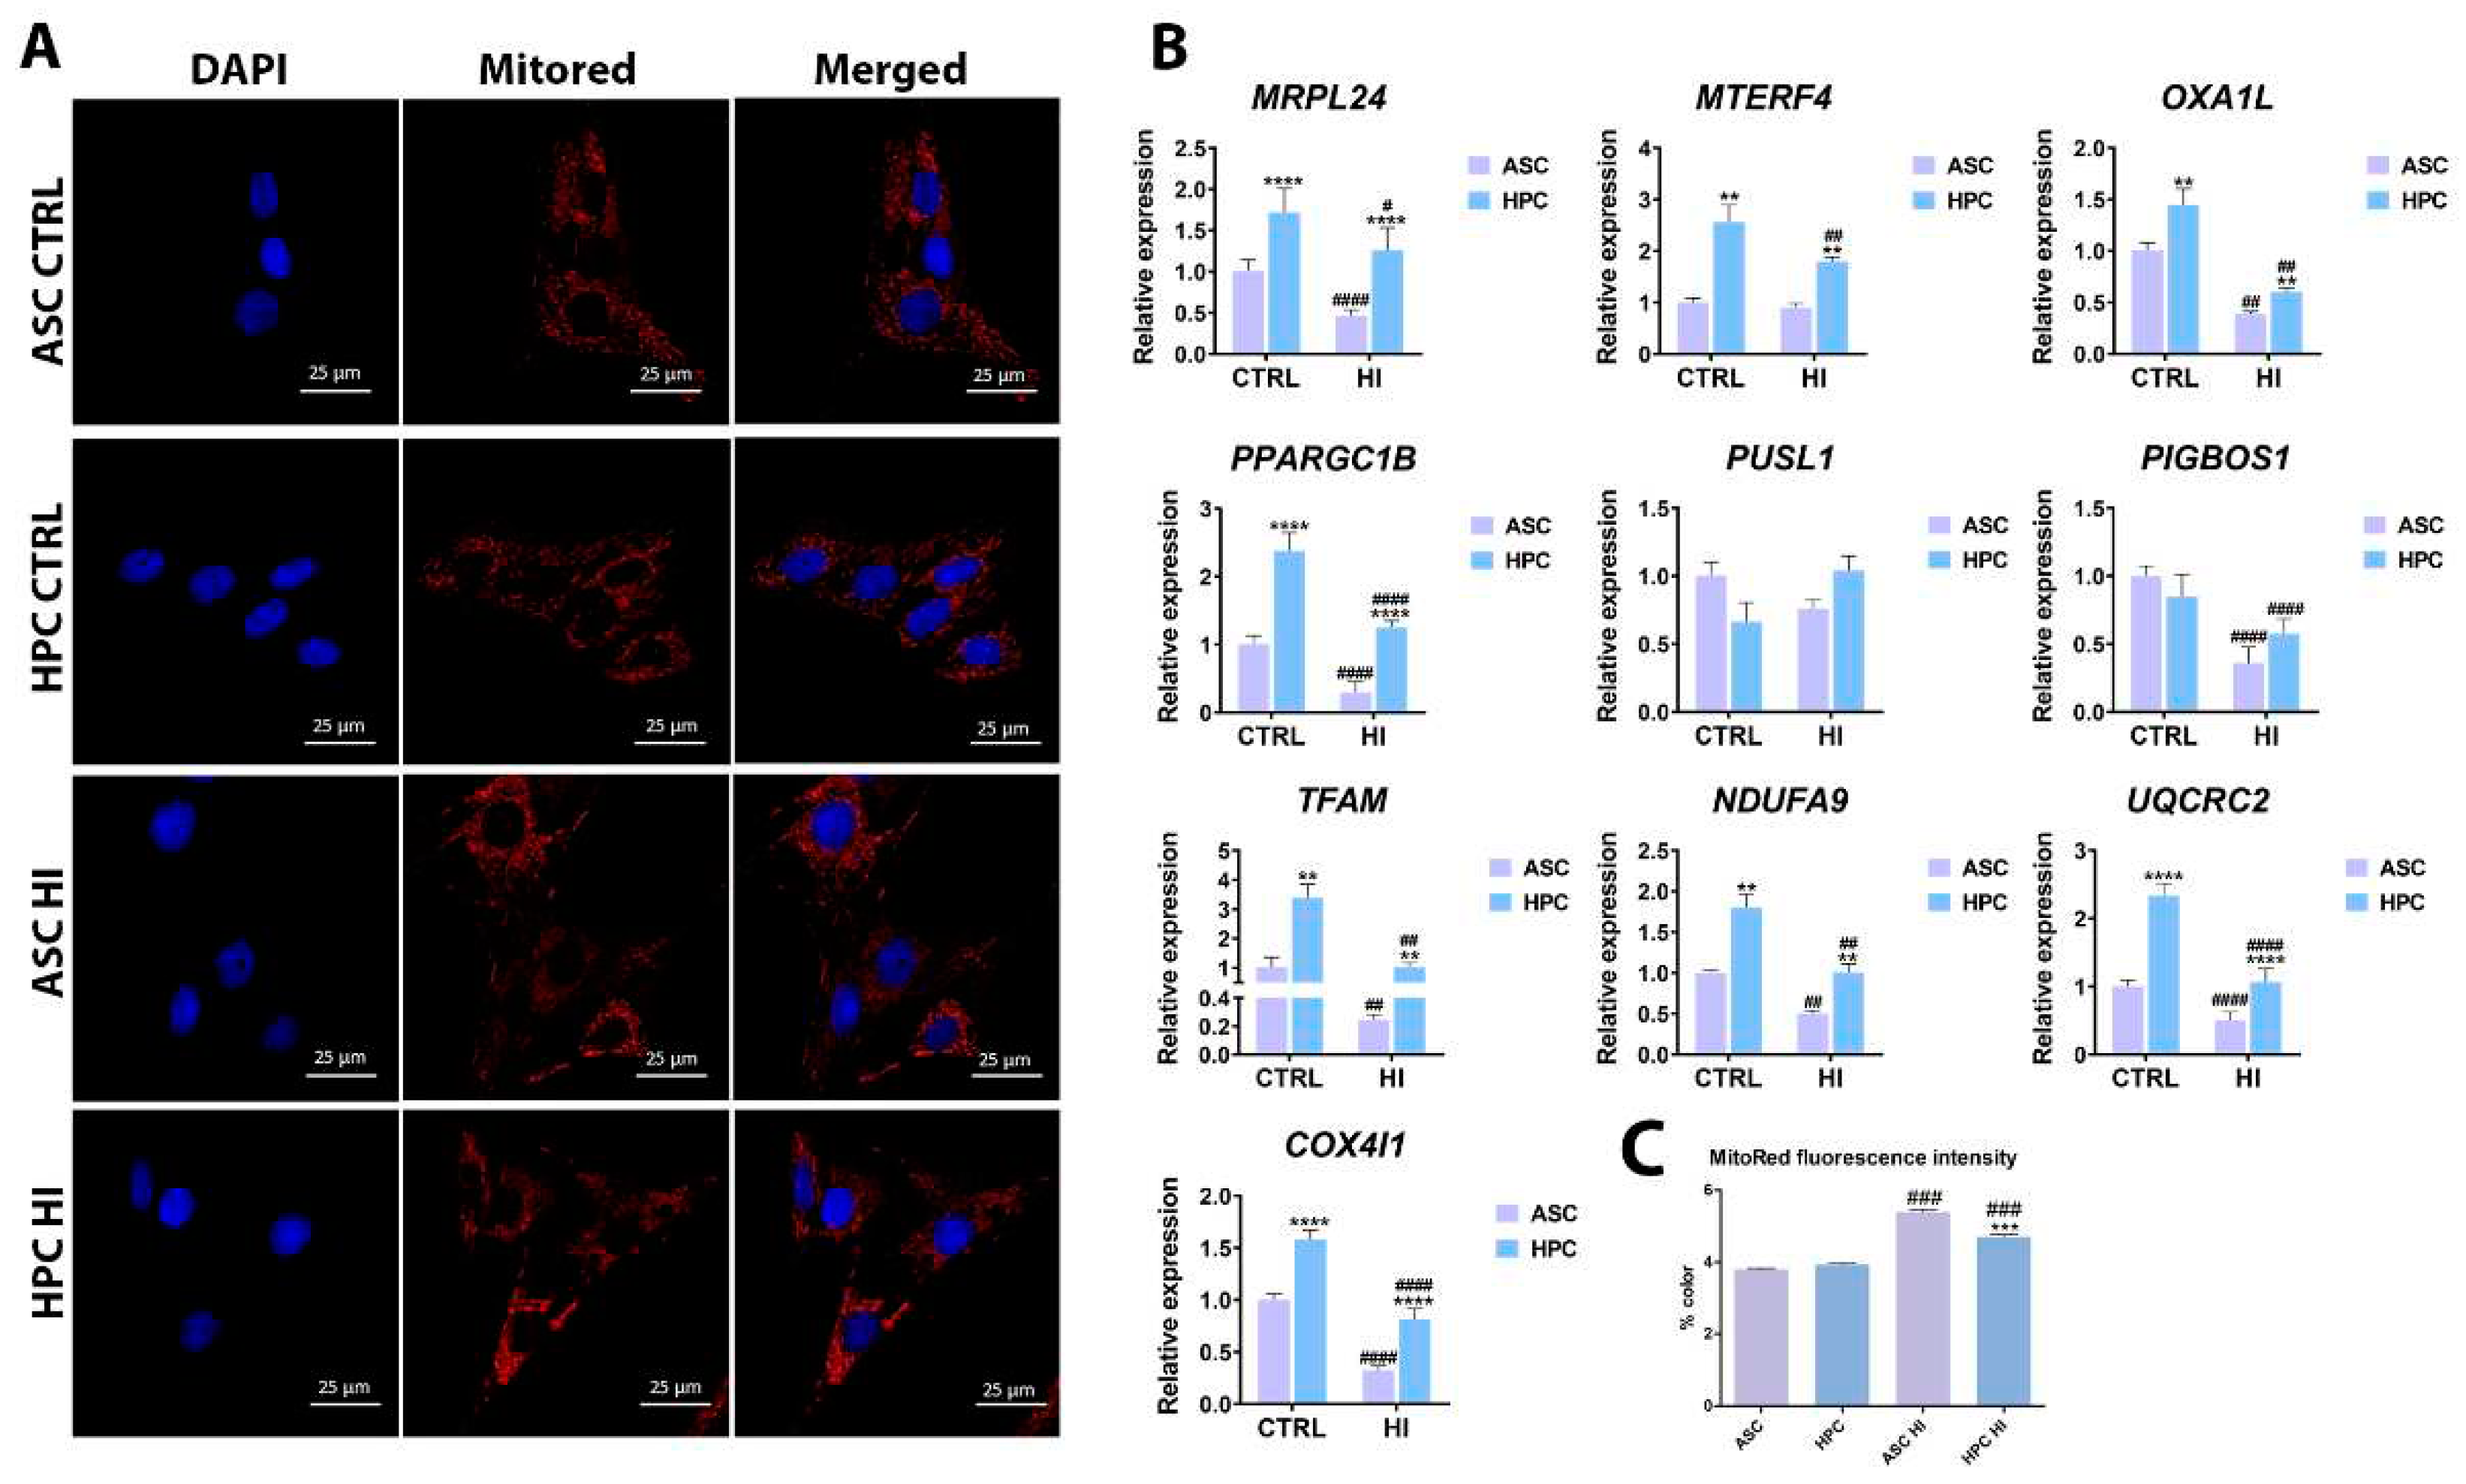
Figure 4. (A) Mitochondrial network staining performed with MitoRed dye and DAPI. (B) Gene expression analysis of key mitochondrial metabolism markers (MRPL24, MTERF4, PPARGC1B, UQCRC2, OXA1L, COXHI1, NDUFA9, PUSL1, MIEF1, MIEF2). (C) MitoRed dye fluorescence intensity (% colour) measured with Fiji is just ImageJ software. Results are expressed as mean ± SD. The statistically significant difference between ASC and HPC is marked with an asterisk (*p < 0.05, **p < 0.01, ***p < 0.001, ****p < 0.0001), while the statistically significant difference between the control group (CTRL) and the hyperinsulinemia group (HI) is marked with a hash sign (#p < 0.05, ##p < 0.01, ###p < 0.001, ####p < 0.0001).
Preprints 85905 g004
Figure 5. (A) The gene expression of key oxidative stress markers (SOD1, SOD2, CAT1). (B) Oxidative stress analysis performed with Muse® Oxidative Stress kit. (C) Nitric oxide activity was assessed with Muse® Nitric Oxide Kit. Results are expressed as mean ± SD. The statistically significant difference between ASC and HPC is marked with an asterisk (*p < 0.05, **p < 0.01, ***p < 0.001, ****p < 0.0001), while the statistically significant difference between the control group (CTRL) and the hyperinsulinemia group (HI) is marked with a hash sign (#p < 0.05, ##p < 0.01, ###p < 0.001, ####p < 0.0001).
Preprints 85905 g005
Figure 6. Hyperinsulinemia induces changes in gene expression of P21, P53, CASP3, CASP9, BAX, and BCL2 that are associated with apoptosis, BAX: BCL2 ratio was calculated (A), immunomodulation (IL6, IL8, IL10, IL13, IL18, TNFA, and TGFB1) (B), and insulin signalling (IR, IRS1, PTPN1, AKT, and FOXO1) (C). Data represent the mean ± SD. The statistically significant difference between ASC and HPC is marked with an asterisk (*p < 0.05, **p < 0.01, ***p < 0.001, ****p < 0.0001), while the statistically significant difference between the control group (CTRL) and the hyperinsulinemia group (HI) is marked with a hash sign (#p < 0.05, ##p < 0.01, ###p < 0.001, ####p < 0.0001).
Preprints 85905 g006
Disclaimer/Publisher’s Note: The statements, opinions and data contained in all publications are solely those of the individual author(s) and contributor(s) and not of MDPI and/or the editor(s). MDPI and/or the editor(s) disclaim responsibility for any injury to people or property resulting from any ideas, methods, instructions or products referred to in the content.
Copyright: This open access article is published under a Creative Commons CC BY 4.0 license, which permit the free download, distribution, and reuse, provided that the author and preprint are cited in any reuse.
Prerpints.org logo

Preprints.org is a free preprint server supported by MDPI in Basel, Switzerland.

Subscribe

© 2024 MDPI (Basel, Switzerland) unless otherwise stated