Preprint
Article

Differences in Brain Network Topology Based on Alcohol Use History in Adolescents

Altmetrics

Downloads

83

Views

37

Comments

0

A peer-reviewed article of this preprint also exists.

Submitted:

22 September 2023

Posted:

25 September 2023

You are already at the latest version

Alerts
Abstract
Approximately 6 million youth aged 12 to 20 consume alcohol monthly in the United States. The effect of alcohol consumption in adolescence on behavior and cognition is heavily researched, however, little is known about how alcohol consumption in adolescence may alter brain function, leading to long-term developmental detriments. In order to investigate differences in brain connectivity associated with alcohol use in adolescents, brain networks were constructed using resting state functional magnetic resonance imaging data collected by the National Consortium on Alcohol and NeuroDevelopment in Adolescence (NCANDA) from 698 youth (12-21 years, 117 hazardous drinkers and 581 no/low drinkers). Analyses assessed differences in brain network topology based on alcohol consumption in eight pre-defined brain networks, as well as in whole-brain connectivity. Within the central executive network (CEN), basal ganglia network (BGN), and sensorimotor network (SMN), no/low drinkers demonstrated stronger and more frequent connections between highly globally efficient nodes, with fewer and weaker connections between highly clustered nodes. Inverse results were observed within the dorsal attention network (DAN), visual network (VN), and frontotemporal network (FTN), with no/low drinkers demonstrating weaker connections between nodes with high efficiency and increased frequency of clustered nodes compared to hazardous drinkers. Results from this study show clear organizational differences between adolescents with no/low or hazardous alcohol use, suggesting that aberrant connectivity in these brain networks is associated with risky drinking behaviors.
Keywords: 
Subject: Biology and Life Sciences  -   Neuroscience and Neurology

1. Introduction

It is well-known that the brain undergoes a variety of developmental changes during adolescence and even into early adulthood, leading to both structural and functional changes, along with corresponding changes in behavior and cognition [1,2,3,4,5,6,7,8,9]. During this period of vital neurodevelopment, accumulating research suggests that the adolescent brain is increasingly vulnerable to adverse experiences, due to sensitive periods of adolescent brain development that are heavily shaped by experience and environment, leading to deviations in typical development and potentially resulting in long-standing changes in brain structure and function [10,11,12]. Associated with the remodeling of frontal and limbic brain regions, adolescence also marks a period of increased risk taking, including initiating use of illicit substances such as alcohol [13,14].
Alcohol is the most commonly used illicit substance among youth in the United States, with over 5.9 million adolescents aged 12-20 reporting consuming more than “just a few sips” of alcohol in the past month, according to a 2021 study by the National Institute on Alcohol Abuse and Alcoholism [15]. A large number of studies have linked adolescent alcohol use to impaired cognitive, emotional, and behavioral functioning, including impaired attention and working memory [16], as well as worsened verbal learning and memory, cognitive flexibility, and learning capabilities [17,18,19,20]. Adolescent alcohol use is also associated with poor educational performance, deficits in decision-making, and worse cognitive flexibility [21]. Additionally, alcohol consumption in adolescence has been linked to alterations in brain structure and function. Youth who consume alcohol heavily exhibit accelerated decreases in frontal and temporal gray matter, as well as stunted development of white matter in cortical areas [21,22,23,24]. Compared to control, adolescents with an alcohol use disorder had smaller prefrontal cortex and hippocampal gay matter volumes [25,26,27]. During working memory tasks, adolescents with heavy drinking behaviors exhibited decreased activation within the precuneus, precentral gyrus, and occipital areas, as well as increased activation within the parietal lobe [27,28,29]. Adolescent binge drinkers have also been shown to exhibit increased activation within the limbic brain regions during decision-making tasks (the Iowa Gambling task) compared to non-drinking adolescents [27,30]. Other activation studies have found decreases in activation within the frontal, temporal, and parietal cortices during response inhibition tasks [27,31]. These alcohol-associated alterations in cognition, behavior, and brain structure have also been suggested to cause permanent changes in the typical neurodevelopment of the adolescent brain, leading to long-term cognitive deficits and increased vulnerability to developing an alcohol use disorder (AUD) later in life [22,32,33].
Despite numerous studies investigating the effects of alcohol use history (AUH) on behavior, cognition, and brain structure, little is known about how heavy alcohol use in adolescence affects functional brain network organization. Functional network analyses have proven to be a popular tool used to study resting-state functional magnetic resonance imaging (rs-fMRI) [34] through investigating fluctuations in synchronous activity in blood oxygen level-dependent (BOLD) signal [35]. Brain networks provide a way of assessing a variety of behavioral, emotional, and cognitive processes, making them key analytic tools for better understanding typical and non-typical brain function and organization [36]. Analyses of brain networks using rs-fMRI has been performed in a number of studies examining patterns in functional connectivity in a variety of adolescent populations, exploring research questions including how organization of brain networks changes with age [37,38,39,40], as well how brain network organization differs in adolescents with attentional-deficit hyperactivity disorder (ADHD) [41,42,43] and autism spectrum disorder (ASD) [44,45,46].
More recently, research has begun to examine associations between alcohol and other substance use and functional brain organization in adolescents [33,47,48]. Studies analyzing resting-state networks (RSN) built from rs-fMRI in adolescent heavy alcohol users have found weaker functional connectivity in networks involved with emotions, social behaviors, and self-referential thoughts [33], and hyperconnectivity within the sensorimotor network in adolescent females heavy alcohol consumers [48]. Additional studies have found that heavy alcohol use in adolescence is associated with dysfunction in brain areas governing inhibitory control and emotion/stress responses [49,50]. Not all researchers agree with the described findings, and given the diverse findings from this limited number of studies [21], more research is needed investigating associations between alcohol consumption and RSN organization in adolescence. Therefore, the aim of this study was to supplement current knowledge on the association between brain function and alcohol use by comparing RSN organization in adolescents with no-to-low levels of alcohol consumption and adolescents who exhibit hazardous drinking behaviors.
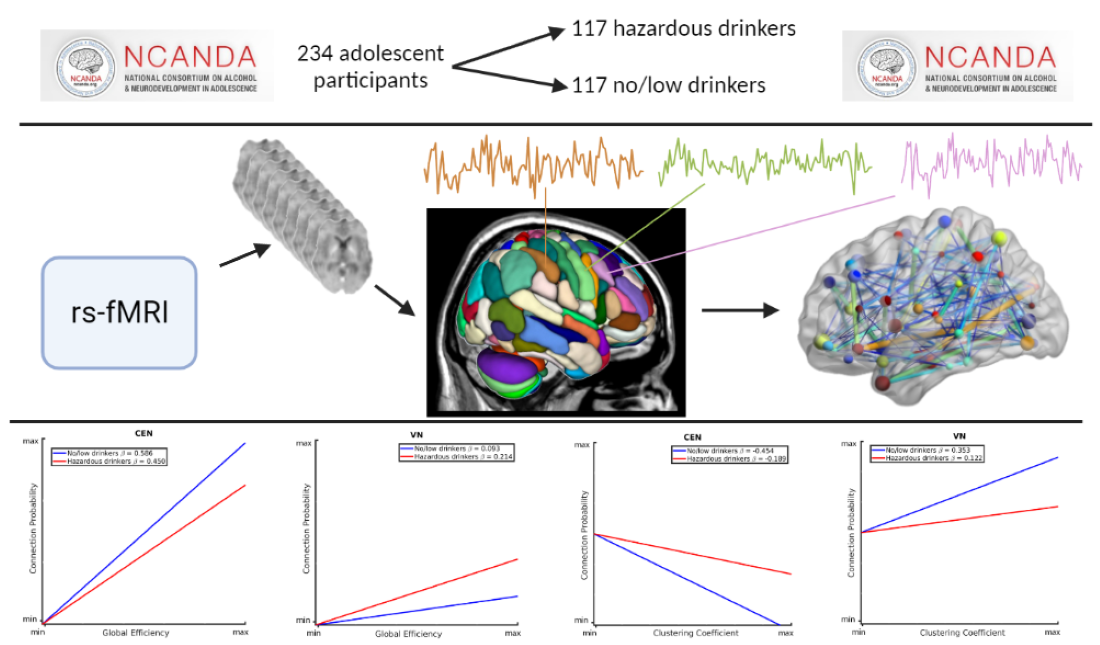
In order to investigate RSN organization in adolescents with no-to-low or hazardous alcohol consumption history, we performed graph theory-based network analyses on baseline rs-fMRI data from participants in the National Consortium on Alcohol and NeuroDevelopment in Adolescence (NCANDA) study. As described above, heavy alcohol use has been linked to a diverse range of behavioral, cognitive, and neurological effects, implicating numerous distinct brain regions. Across the field of alcohol research, most studies have focused on specific brain regions, neglecting more global function and interactions between discrete brain areas. This may partially explain the divergent findings in the literature. In the current study, we chose to perform analyses on eight RSNs in an attempt to identify associations between alcohol use and network organization across the brain. Collectively, these eight RSNs covered the entire brain and were constructed through building one static network spanning the whole brain, which was subsequently parcellated into eight functional derived subnetworks/RSNs for more detailed analyses. A major strength of this novel methodology is that it allows for the calculation of network metrics from the full brain, not just within individual RSNs [51,52,53]. We examined drinking group differences in network organization of the default mode network (DMN), central executive network (CEN), salience network (SN), dorsal attention network (DAN), sensorimotor network (SMN), basal ganglia network (BGN), fronto-temporal network (FTN), and the visual network (VN). In examining the topologies of eight RSNs that collectivity cover the entire brain, our goal was to provide more holistic insight into the brain networks that may be vulnerable to heavy alcohol use, capturing both expected and unexpected differences in brain network topology across the brain. For network topological analyses, we examined the global efficiency (GE) and clustering coefficient (CC) of the eight RSNs across all participants, as these network metrics characterize distributed information processing and regional specificity, respectively [14,54,55,56]. Results from this study may provide novel insight into how brain organization differs between adolescents with no/low or hazardous alcohol consumption behaviors, although due to the cross-sectional nature of this analysis, causality cannot be determined in this study. The findings reported could be brain signatures that predispose one to hazardous drinking or could be a consequence of hazardous drinking. Nevertheless, this work will provide neurobiological targets for future studies examining causal relationships.

2. Materials and Methods

2.1. Participants

NCANDA recruited participants across five data collection sites including: University of Pittsburgh Medical Center, University of California at San Diego (UCSD), Duke University Medical Center, SRI International (SRI), and Oregon Health & Science University (OHSU). In total, NCANDA utilized a longitudinal design to recruit 831 participants aged 12-21, with data acquisition occurring at the baseline visit and at the three yearly follow-ups [57]. In this study, we used identical drinking criteria and participant samples to those used previously in a study conducted by Muller-Oehring, with a total of 698 participant’s baseline data included [33]. The same sample of participants was used to compare our whole-brain network analyses with their prior work examining seed-based connectivity. Of this sample, 581 participants met criteria for no/low drinking and 117 were categorized as hazardous drinkers based on the National Institute of Alcohol Abuse and Alcoholism (NIAAA) risky drinking guidelines described in Brown et al. 2015 [57]. The NIAAA risky drinking criteria used in NCANDA were adjusted based on age and sex. For example, adolescents, regardless of sex, ages 12-15 should never have consumed greater than 5 alcoholic beverages in their lifetime, whereas adolescents aged 18-21 should not exceed 51 lifetime alcoholic drinks. These criteria are further limited based on sex; for instance, boys aged 12-13 cannot surpass 3 drinks per occasion, and boys older than 20 cannot have consumed more than 5 drinks per occasion. NIAAA criteria for no/low drinkers is outlined in Table 1. Participants who exceeded the no/low drinking use criteria were required to meet all other entry criteria but were additionally permitted to exceed nicotine and marijuana exposure criteria (Brown et al., 2015). In this current study, we used rs-fMRI data from 234 participants in our analyses comparing brain network topology between no/low and hazardous drinkers. To do this, we used matched groups, as done in Muller-Oerhing et al. 2017, in which the 117 hazardous drinkers were matched with 117 no/low drinkers in order control for potential study site differences in the data while also maintaining the effect size. This matched group design also controlled for age and sex, making it unnecessary to control for these variables in our analyses. For full participant demographics, see Table 2. We were granted access to this uniquely large dataset by NCANDA and the NIAAA; additionally, the Wake Forest University School of Medicine Institutional Review Board (IRB) approved this study as exempt as all participant data was deidentified. The data was accessed through Amazon Web Services (AWS) with specific details provided in the supplement.

2.2. MRI Acquisition and Processing

MRI data were acquired across the five NCANDA data collection sites: three sites used 3T GE Discovery MR750 scanners (UCSD, SRI, and Duke University) and two sites used 3T Siemens TIM TRIO scanners (OHSU, University of Pittsburgh). The data collection sites varied slightly on MRI acquisition protocols based on the scanner used at that site, specifically for T1 structural acquisition [see Supplementary Material of [48] for specific MRI acquisition protocol]. The rs-fMRI protocol was the same across sites (Time of repetition (TR)= 2200 ms, echo time (TE)= 30 ms, 274 volumes, 10 min scan length). For full details on NCANDA MRI acquisition, see (Muller-Oehring et al., 2018). The NCANDA group provided raw participant MRI imaging data. Unless otherwise stated, MRI preprocessing was completed using Statistical Parametric Mapping 12 (SPM 12, Welcome Trust Center, London, UK: {www.fil.ion.ucl.ac.uk/spm/}). For full details on image processing and brain network generation, please reference the supplement.

2.3. Statistical Analysis

We used a mixed regression model [51,52,53], as implemented in the WFU_MMNET toolbox [51] for brain networks, to statistically examine if/how hazardous drinking impacts the studied RSNs. The mixed model allowed examining the differences of each RSN topology between the hazardous and no/low drinking groups. Specifically, we first made a binary variable that separated the hazardous and no/low drinking groups, as our main covariate of interest (COI). We then used the mixed regression model to examine if/how this covariate affects the relationship between the connectivity and topology of each RSN. The mixed regression model is basically a two-part model that quantifies the relationship between the probability (presence/absence) and strength (correlation values) of brain connections, as the outcome (dependent) variables, and network and non-network variables as independent variables. The network variables used in this study were the average global efficiency (GE) and clustering coefficient (CC). As described above, the primary non-network covariate of interest (COI) in this study was drinking group membership (no/low drinkers = 0, hazardous drinkers = 1). Additional non-network covariates were included to minimize confounding effects on our results. To control for any site effects that eluded our quantile normalization procedure (see supplement), the NCANDA data collection site was included as a covariate (with five levels, coding the five MRI collection sites) in the models. In addition, the spatial Euclidean distance and squared distance between network nodes were included to account for spatial bias in connectivity between nodes in close physical proximity [58]. Network topology analyses were conducted on the whole brain as well as within each RSN. To examine the impacts of our COI on both global (i.e., whole brain) and local (RSNs) networks simultaneously, we used additional binary variables (as independent variables) that separated each RSN from the rest of the brain.
In order to examine local group differences in network topology in individual RSNs, we modeled the interactions between network and non-network variables using two-way (GE/CC*COI) and three-way interactions (GE/CC*COI*RSN) for both connection probability and strength models [51,52,53]. These two-way and three-way interactions were modeled for each of the eight RSNs individually (BGN, CEN, DAN, DMN, SMN, SN, FTN, VN) in eight separate analyses (where each analysis included running the two-part mixed-effects model, capturing probability and strength, respectively). The application of these regional and whole-brain interaction analyses allowed for both local and global comparisons of brain topology between drinking groups, as group differences in network topology may not be uniform throughout the brain. The estimates and statistical inferences (i.e., p-values) obtained for appropriate two-way interactions determined if the connectivity/topology in ‘Remainder of the brain’ was different between hazardous and no-to-low drinkers. However, as in [59], to identify the difference within the studied RSN in each analysis (e.g., DMN), we performed post-hoc analyses on already estimated residuals of the two-way and three-way interactions. Contrast statements were applied to the results from the linear regression analyses to identify significant group differences within individual RSNs. For more details on the interactions and contrast statements produced by this modeling framework, please refer to Bahrami et al. 2019 and Bahrami et al. 2022.

3. Results

3.1. Mixed-Effects Results from Connection Probability Models

RSNs of interest (Supplemental Table 3). Furthermore, in RSN analyses, there were no significant group differences for CC or GE in the remainder of the brain, i.e. the brain regions not encompassed by the specific RSNs (Table 3, Supplemental Table 4). Results from the three-way interaction analyses can be found in the supplement. Within-network contrasts revealed significant group differences in the probability- GE and CC relationships within the BGN, CEN, and VN, as well as significant group differences in the connection probability-CC relationship within the FTN. There were no significant group differences within the SMN or DMN (Table 4). There were no significant topological differences between drinking groups for the SN or DAN in any of the probability analyses (Supplemental Table 5).
Figure 1 illustrates the group differences in the relationships between connection probability and GE within the BGN, CEN, VN, and FTN. Within the BGN and CEN (Figure 1A and B, respectively), no/low drinkers (blue line) showed a significantly stronger relationship between GE and connection probability, relative to hazardous drinkers (red line), as indicated by the steeper positive slope. This suggests that within these RSNs, hazardous drinkers are less likely to have connections between nodes with high global efficiency compared to no/low drinkers. The results for the VN (Figure 1C), however, were reversed, with hazardous drinkers demonstrating a stronger positive relationship between GE and connection probability compared to the no/low drinkers. There were no significant group differences observed within the FTN as illustrated in Figure 1D by the similarly sloped lines.
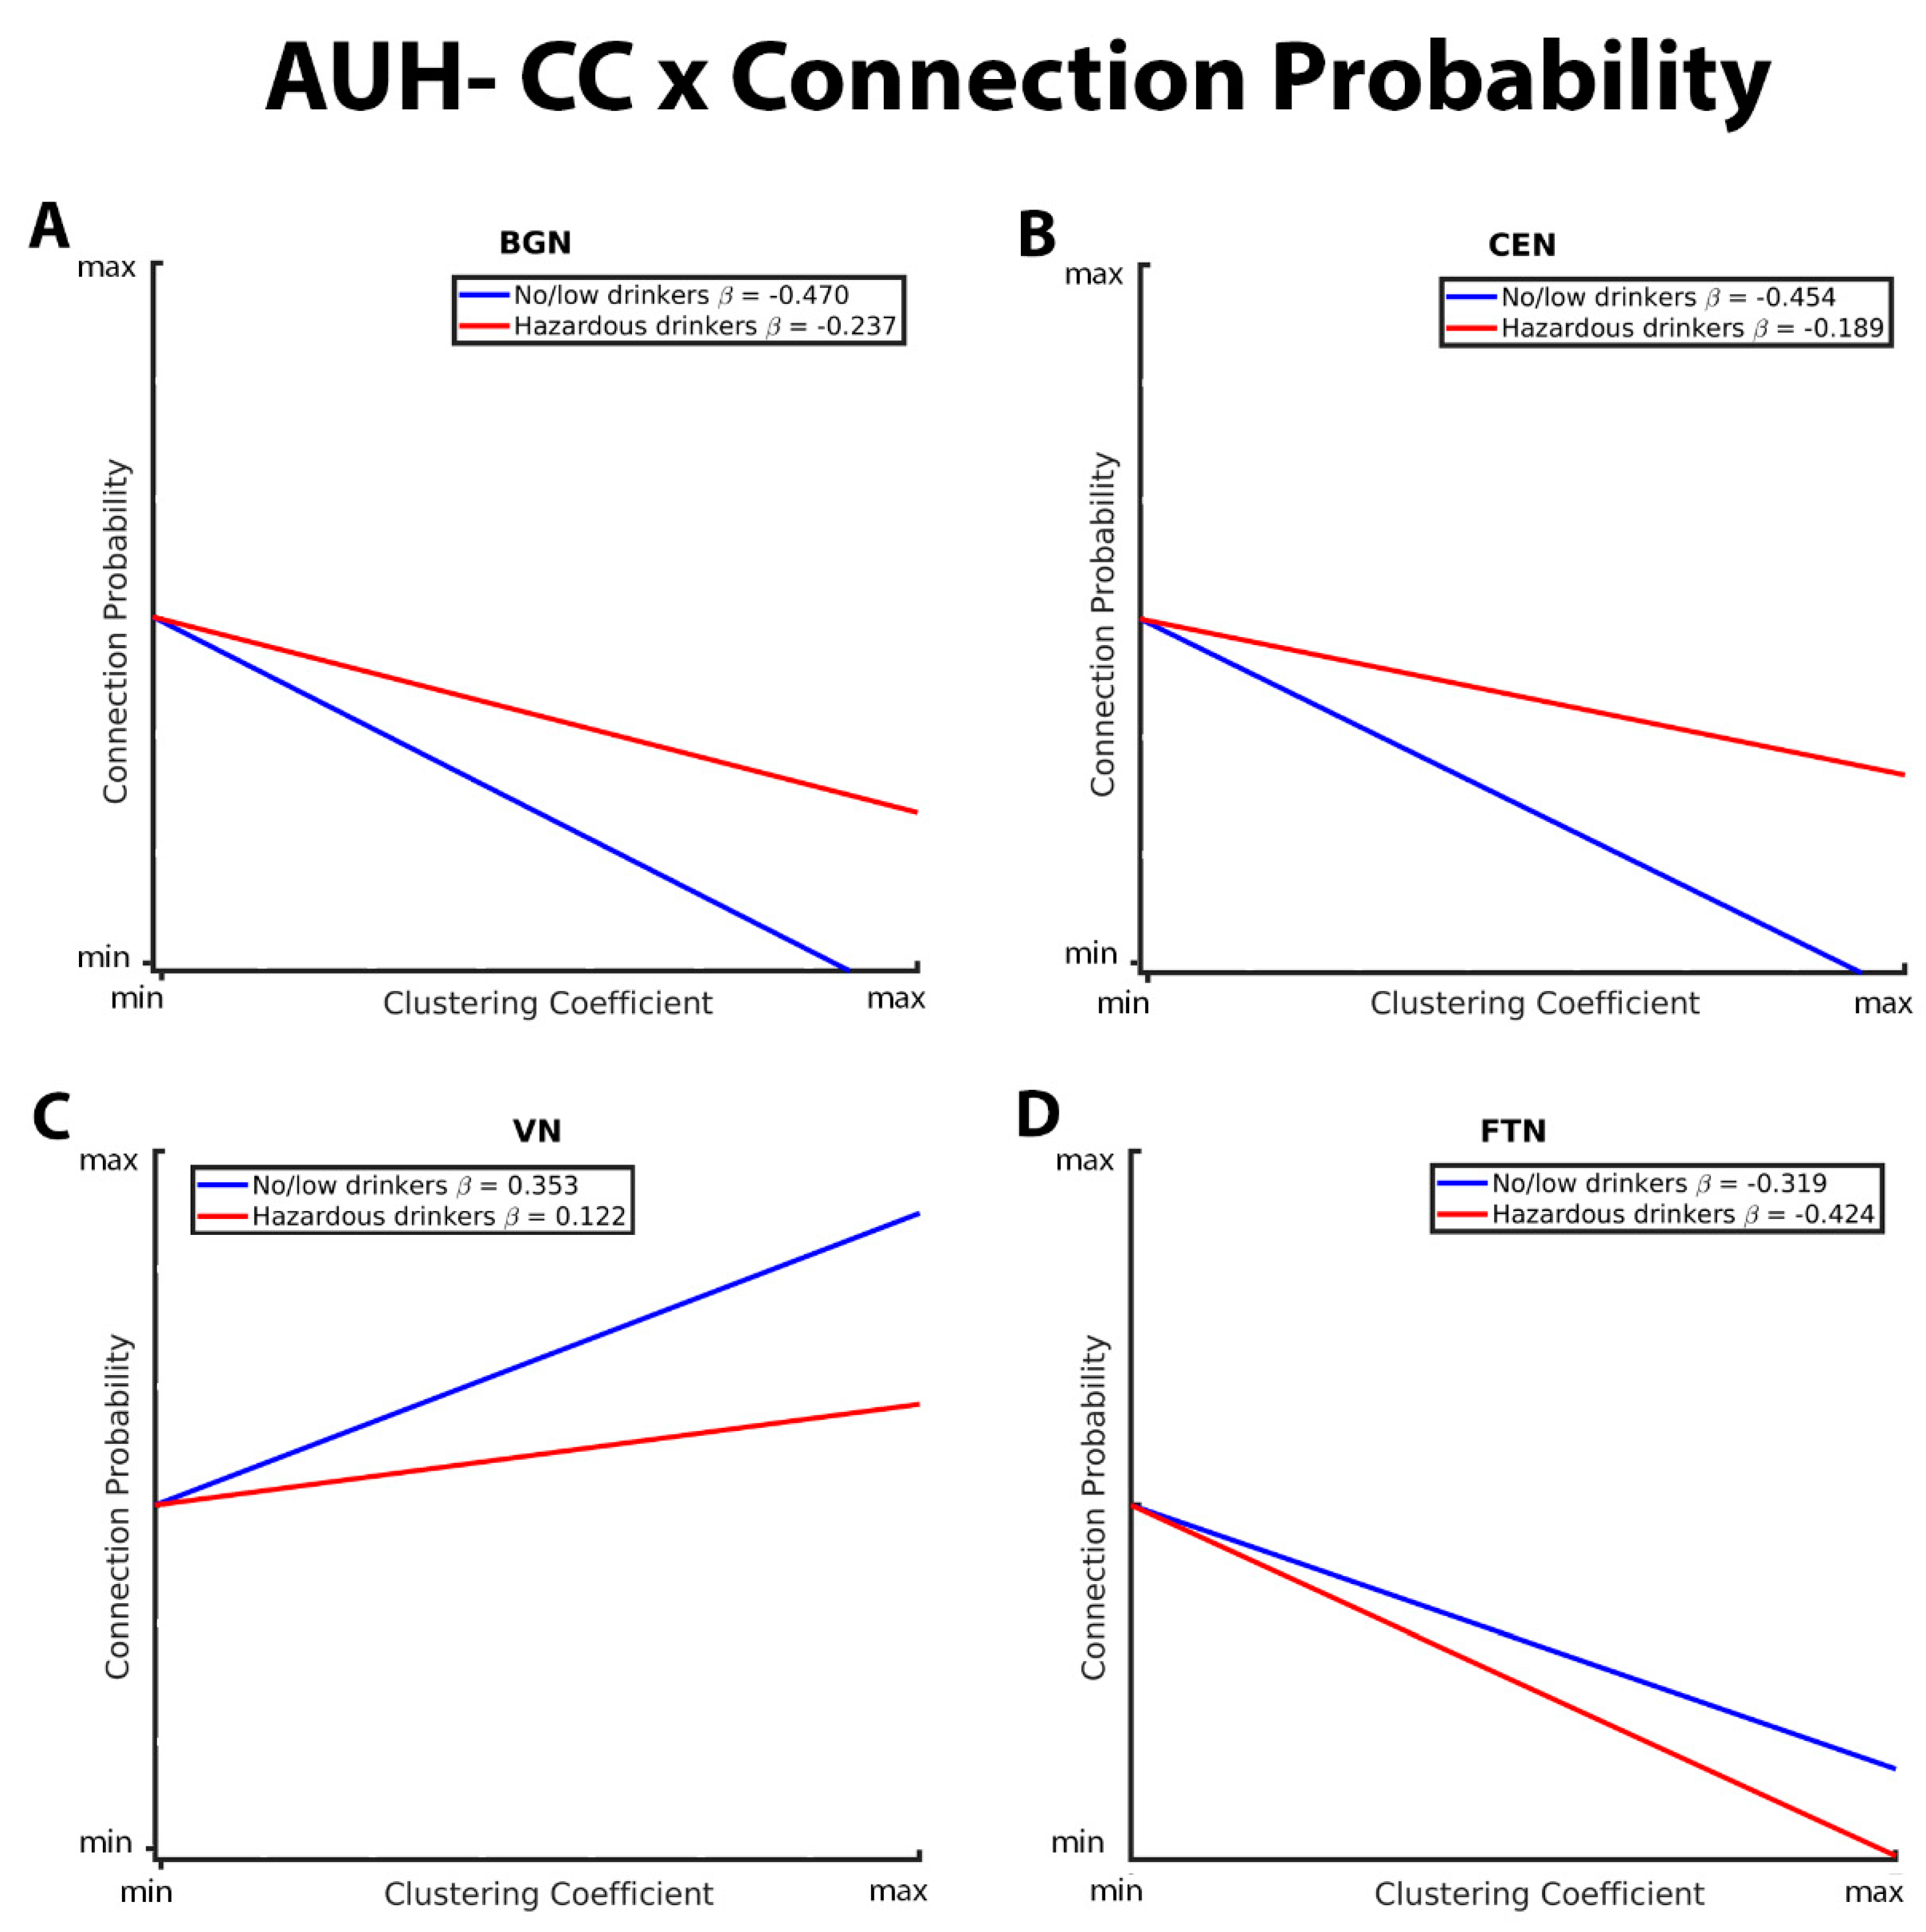
Figure 2 depicts group differences in the relationship between CC and connection probability within the BGN, CEN, VN, and FTN respectively. For the BGN and CEN, there was a significantly stronger negative relationship between CC and connection probability in the no/low drinkers versus the hazardous drinkers. This indicates that the no/low group was less likely to have connections between nodes with high CC compared to the hazardous drinkers (Figure 1A and B). No/low drinkers demonstrated a significantly more positive CC-connection probability relationship within the VN and FTN compared to hazardous drinkers (Figure 1C and D). Contrary to the findings within the BGN, CEN, and FTN, both no/low and hazardous drinkers demonstrated a positive relationship between CC and connection probability within the VN.

3.2. Mixed-Effects Results from Connection Strength Models

As with the connection probability model, there were no significant group differences in whole-brain topology for GE/CC (Supplemental Table 3). However, there were significant differences between hazardous and no/low drinkers for CC in the remainder of the brain for VN analyses (see CC*AUH interaction Table 5). Hazardous drinkers had a significantly more positive relationship between CC and connection strength than no/low drinkers in the remainder of the brain. This indicates significant group differences across the whole brain, excluding the nodes classified in the VN, in which hazardous drinkers were significantly more likely to have strong edges between highly clustered nodes. No other significant group differences were found in the remainder of the brain for other RSN analyses (Table 5, Supplemental Table 4). As with the connection probability model, results from the three-way analyses can be found in the supplement. Within-RSN group differences were observed within the BGN, CEN, SMN, DAN, VN, and FTN for GE, and within the BGN, CEN, SMN, and FTN for CC (Table 6). There were no significant group differences for CC within the DAN or VN. Additionally, no significant interactions were observed for either the CC or GE models in the DMN or SN (Supplemental Table 5).
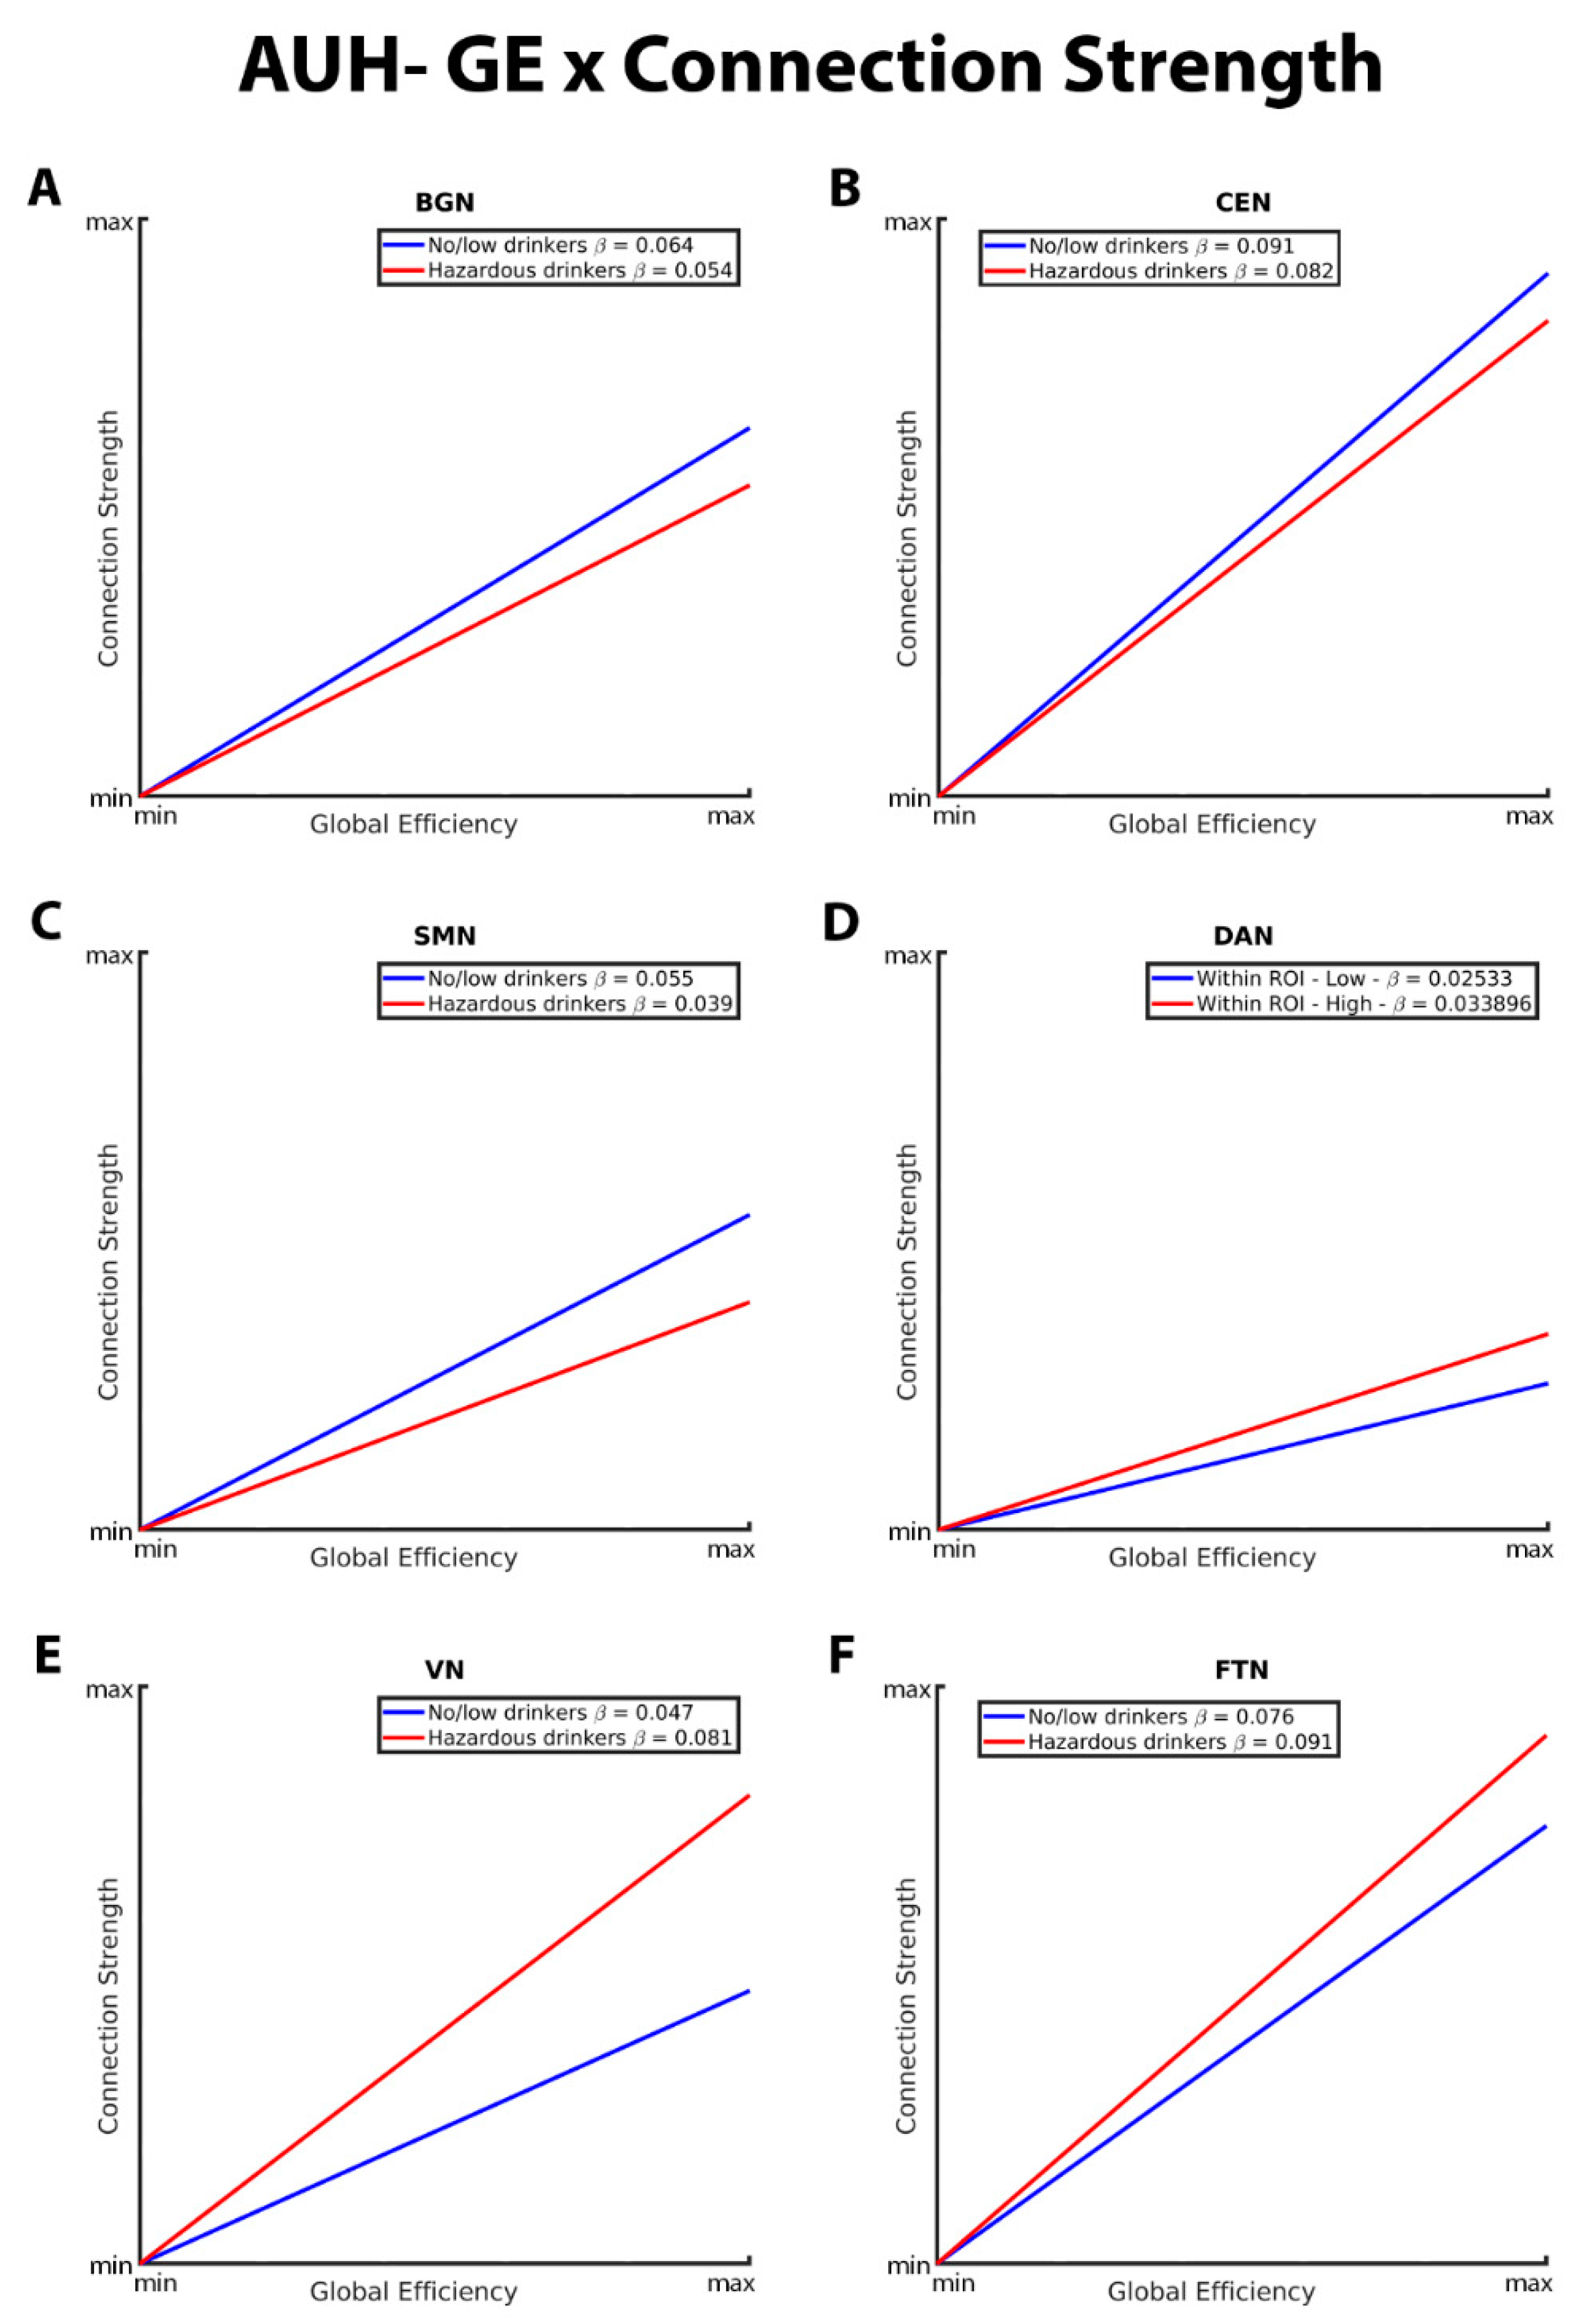
Figure 3 illustrates the group differences in the relationship between GE and connection strength within the BGN, CEN, SMN, DAN, VN, and FTN. Both no/low drinkers and hazardous drinkers had a positive GE-connection strength relationship for all five RSNs. However, within the BGN, CEN, and SMN, the no/low group (blue line) had a significantly stronger positive relationship between GE and connection strength than hazardous drinkers (red line; Figure 3A, B, C). Corresponding from GE analyses in the connection
probability model, these results indicate that hazardous drinkers had weaker functional connections between highly efficient nodes within the BGN, CEN, and SMN. Inverse results were observed within the DAN, VN, and FTN (Figure 3D, E, and F), with hazardous drinkers demonstrating a significantly stronger positive relationship between GE and connection strength than no/low drinkers, signifying that within these RSNs, no/low drinkers instead exhibited weaker functional connections between high GE nodes.
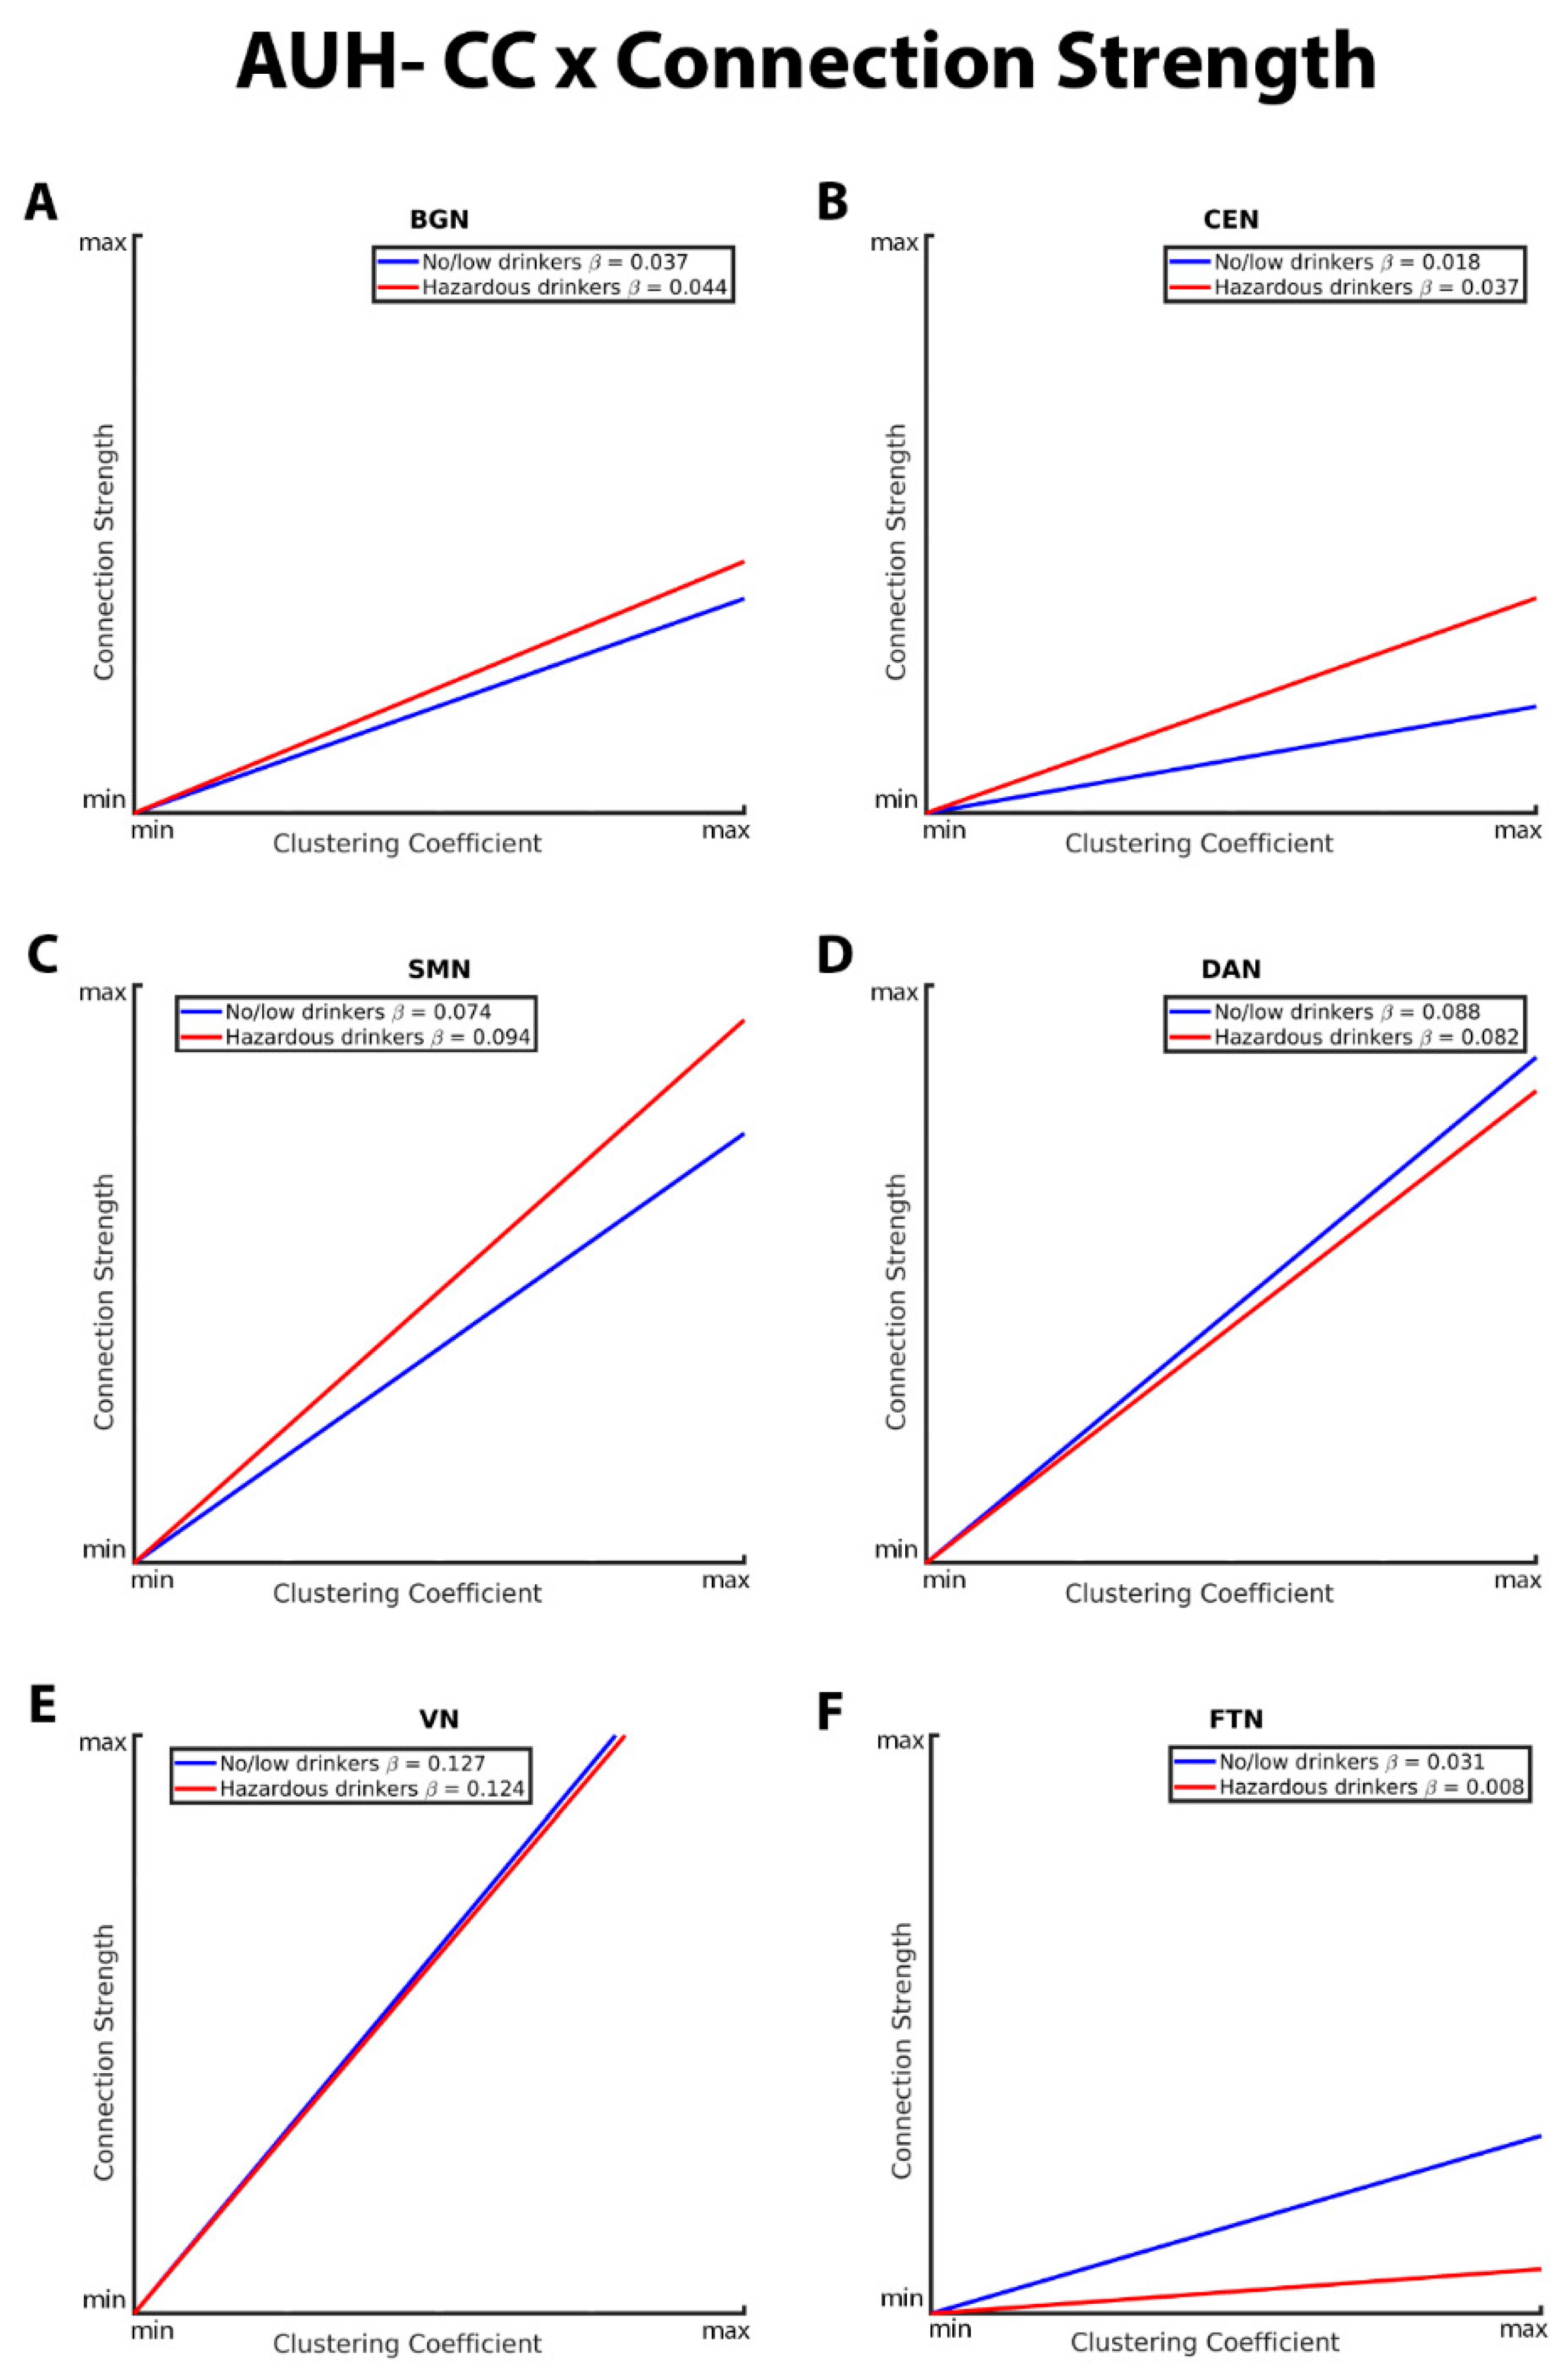
The CC-connection strength relationships for the BGN, CEN, SMN, DAN, VN, and FTN are graphically depicted in Figure 4. As with GE in the connection strength model, both hazardous and no/low drinkers had a positive relationship between CC and connection strength. Within the BGN, CEN, and SMN RSNs, hazardous drinkers demonstrated a significantly stronger positive CC-connection strength relationship compared to no/low
drinkers (Figure 4A, B, and C). Results from FTN analyses demonstrated significant group differences in the connection strength CC relationship in which no/low drinkers exhibited a stronger positive association between strength and CC compared to hazardous drinkers (Figure 3F). The slopes of the CC-strength relationship are nearly the same between the no/low or hazardous drinkers within the DAN and VN consistent with the lack of significance group differences (Figure 4D and E).
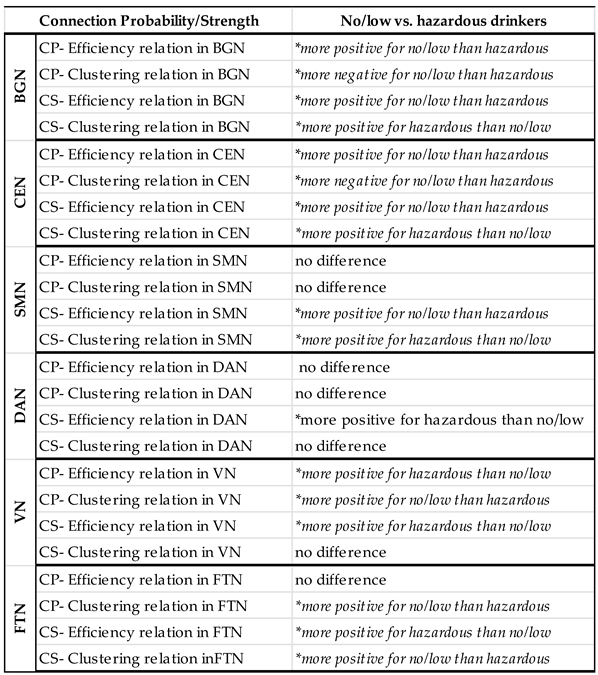
For a table summarizing the major findings evaluating AUH group differences in RSN topology, please see Table 7. Additionally, full interaction results tables are included in the supplement in Supplemental Tables 6-21.

4. Discussion

Using the uniquely large rs-fMRI data from adolescents in the NCANDA project, we examined if/how hazardous drinking is associated with aberrant topology in functional brain networks compared to no/low drinking adolescents. We examined the association between drinking group membership (no/low or hazardous) and the topological organization of functional brain networks. Our goal was to compare brain networks between adolescents with no/low AUH and adolescents with hazardous AUH. The purpose in examining associations between alcohol consumption and brain network topology is that functional brain connectivity is proving to be a key factor underlying cognitive, emotional, and behavioral dysfunction [38,56,60,61]. Results from this study demonstrated significant differences in RSN organization between no/low drinkers and hazardous drinkers within the CEN, BGN, SMN, DAN, and VN. No differences were observed in the SN or the DMN. The significant organizational differences we observed between these groups indicate that differential functional connectivity is associated with hazardous alcohol use. Although causality cannot be determined from this study’s analyses, these results effectively identify significant differences in brain function across the brain that likely either contributed to the onset of hazardous drinking or are a neurological consequence of adolescent hazardous drinking. These findings expand the current limited knowledge base on how hazardous alcohol consumption in adolescence is associated with functional brain organization. The interpretation and implications of the group differences are discussed below for each RSN.
Results from within-network analyses revealed similar differences in group RSN topology within the CEN, BGN, and SMN. In these RSNs, no/low drinkers exhibited a stronger positive association between connection strength and GE compared to hazardous drinkers. No/low drinkers also had a significantly stronger positive GE-connection probability relationship within the CEN and BGN. These results indicate that no/low drinkers are more likely to have edges connecting highly globally efficient nodes within the CEN, BGN, and SMN. GE, which is the inverse of the average shortest path length between two network nodes [2], is a measure of functional integration and how well the brain can efficiently disseminate information across different brain regions and between RSNs. A network with high GE can efficiently distribute information across distinct brain regions, allowing for more economical and diverse information integration and processing [3-5]. The no/low drinkers also had a weaker positive relationship between CC and connection strength compared to hazardous drinkers within the CEN, BGN, and SMN. Additionally, within the CEN and BGN, the no/low drinking group displayed a stronger negative CC-connection strength relationship compared to hazardous drinkers. This indicates that no/low drinkers were less likely to have edges connecting highly clustered nodes within the CEN, BGN, and SMN, and existing edges between high CC nodes in the BGN and CEN were much weaker than hazardous drinkers. CC is a measure of the cliquishness of a network, in which the neighboring nodes of an individual node are highly interconnected [54]. This network variable quantifies modules of functional connectivity within a network, thus conveying information on the functional segregation and information processing within a network. A network with high CC would consist of clusters of brain areas that are heavily interconnected; communication within a cluster would be high, with limited communication with nodes outside of the clusters. Therefore, information processing in a network with high CC would be more functionally segregated, allowing for more regionally specialized processing and creating more isolated and homogenous information processing than a network with low CC [54,62,63]. Communication in networks with high clustering is more homogenous due to infrequent connections outside of the clusters, therefore reducing novel information input from other brain areas not included in the clusters [62]. In addition, the ability to quantify the strength of edges in a network provides additional information on network organization and information. A strong edge between two nodes indicates a high likelihood of synchronization in those nodes, and synchronization within the brain has been demonstrated to be an important aspect of normal neural processing [64]. Overall results from the CEN, BGN, and SMN analyses showed that no/low drinkers exhibited stronger, more frequent connections between highly efficient nodes, as well as weaker and fewer edges between highly clustered nodes, supporting a topology within the CEN, BGN, and SMN that enables efficient, widespread integration of diverse neural inputs from distinct areas of the brain, both within and between networks. On the other hand, the CEN, BGN, and SMN of hazardous drinkers are less efficient and ‘cliquish,’ with highly clustered nodes communicated with each other in isolated groups and little integration between groups. These results are especially robust within the CEN and BGN, as our analyses revealed significant group differences in CC and GE in both connection probability and strength models.
Within-network analyses from the VN, DAN, and FTN revealed the opposite group differences in RSN topology compared to analyses from the CEN, BGN, and SMN. No/low drinkers exhibited weaker edges connecting nodes with higher metrics of GE in the VN, DAN, and FTN, with overall fewer edges between high GE nodes in the VN and FTN than hazardous drinkers. For CC, no/low drinkers had more frequent edges between highly clustered nodes within the VN and FTN, with stronger edges connecting clusters within the FTN compared to hazardous drinkers. These results illustrate VN and FTN topologies for no/low drinkers that are significantly less efficient and more functionally isolated from the remainder of the brain, while hazardous drinkers displayed stronger connections between highly efficient nodes and reduced levels of clustering in these networks, resulting in more efficient and integrated network organizations. Similarly, but less pronounced, no/low drinkers had weaker edges connecting high GE nodes within the DAN, thus resulting in a less efficient DAN topology when compared to the hazardous drinking group. The implications of these results along with a discussion of corresponding literature are discussed for each RSN in the subsequent paragraphs.
The CEN, primarily consisting of the dorsolateral prefrontal cortex and the lateral posterior parietal cortex, has been investigated in numerous studies for its role in a variety of neuro-psychiatric disorders, including alcohol and substance abuse disorders, as well as in non-disordered alcohol use [23,49,65,66,67,68]. Our findings from this study illustrating a more efficient, integrated CEN topology in no/low drinkers are consistent with several other studies that have found altered function of the CEN in various forms of substance use. A prior study found that decreased functional connectivity and integration both within the CEN and between the CEN and the SN was associated with inhibited distress tolerance and increased cocaine use in adults [47]. Segregation of functional connectivity both within the CEN and between the CEN and other brain networks was found to be a key trait of adults with AUD that relapsed 1 month into abstinence, while those who maintained abstinence from alcohol demonstrated stable coupling of the CEN with other distinct networks [65]. Additionally, altered intra- and internetwork CEN connectivity was found in adults after heavy alcohol intake, indicating that the functional connectivity of the CEN differs between sober and intoxicated states [66]. The association between altered CEN connectivity and heavy alcohol use in adolescence is unsurprising, as it is well-known that youth engage in risky alcohol and substance use have a reduction in lateral frontal lobe gray matter volume and overall deceased activation of the frontal lobe [23,67]. Results from these studies along with analyses from this study suggest that dysfunction of CEN connectivity may result in impaired decision-making and the inability to abstain from risky behaviors such as drug and alcohol use.
The BGN and it’s component structures, which have been largely studies of its role in motor function, habit formation, and reward-based learning, have been implicated in heavy alcohol use across multiple animal and human studies [69,70,71]. Aberrant connectivity between the basal ganglia and other brain regions, namely the orbitofrontal cortex and motor regions, has been associated with the development of ethanol consumption behaviors and dependence in mice [70,71]. A study by Rzepecki-Smith et al., found that the basal ganglia is vulnerable to acute alcohol consumption, causing significant decreases in the functional connectivity and correlated activity of the frontal-temporal-basal ganglia circuit, leading to cognitive and motor impairments [72]. Additionally, acute alcohol intake has been shown to weaken inter-network functional connectivity between the BGN-SMN and BGN-CEN in adults [66]. Along with our findings of a less efficient, functionally segregated BGN organization in hazardous drinkers, these studies suggest that irregular connectivity and isolation of brains areas within the BGN are associated with heavy alcohol use, as well as with the negative side effects of risky drinking including working memory deficits, decreased inhibition, motor impairments, and an increased vulnerability of developing alcohol dependence.
While the SMN is primarily known for its role in motor control and execution, it as has also been implicated in inhibitory control and habit regulation [73,74], making it a prime, although uncommon, investigative target in substance abuse research. Altered connectivity strength in the pre- and post-central gyri (important regions in SMN) has been tied to risky drinking in adolescence [75], and disruptions in the motor network were found to impact executive function and decision making in adults [66]. However, there are studies demonstrating conflicting associations between risky behaviors and alcohol use and SMN connectivity. Consistent with the findings from this study, Silveira and colleagues found that weaker connectivity and segregation of motor regions was associated with deficits in executive function and increased vulnerability to high risk drinking in late adolescence [75]. On the contrary, hyperconnectivity within the SMN has been observed in stress-predictive networks in in risky drinkers [49], risky drinking in adolescence [48], and poor inhibitory control in adolescents with ADHD [41]. As it remains, the association between SMN connectivity and alcohol use is still not well-understood; it will be important for future research to assess SMN connectivity to help resolve these discrepancies.
The FTN has major nodes in the orbitofrontal cortex (OFC) and amygdala, regions of the brain commonly studied for their role in reward-processing and addiction, namely, the negative affect and craving aspects of the addiction cycle [76]. The role the amygdala and OFC play in addiction is complex, and much remains to be learned as to how alcohol abuse may affect OFC and amygdala function. Results from this study found that hazardous drinkers displayed and more efficient and integrated FTN; in line with our results, increased resting-state connectivity of the OFC and the nucleus accumbens was found to be positively correlated with alcohol craving in adults [77]. Compared to adults with normal drinking habits, adults with AUD demonstrated increased activity in the left OFC during alcohol viewing tasks. Similar results have been identified in adults using nicotine, opiates, and cocaine [78]. Increased connectivity within the OFC and amygdala has been linked to risky behaviors in adolescence [14], as well as in obsessive-compulsive behaviors in adults and children [79], suggesting that disruption of proper OFC and amygdala function may play a role in compromised decision-making and alcohol abuse. Conversely, task-based imaging studies have found that reduced amygdala-OFC connectivity is associated with alcohol consumption in adolescence [41,80], as well as in adults with alcohol dependence during cognitive tasks [6]. It has been hypothesized that stronger functional connectivity may be a compensatory mechanism in alcohol and substance misuse in order to counteract the negative neurological effects. That is, heavy drug and alcohol use has been shown to decrease efficiency and increase wiring costs of neural functioning, which can be offset through shortening axonal connections within a network to offset higher metabolic costs in other areas of the brain [48,63,68]. This phenomenon may explain the stronger functional connectivity we observed within the FTN for hazardous drinkers in this study.
The VN, which plays a role in visual processes, is not commonly the main focus of neuroimaging addiction studies; nonetheless, a few studies have implicated the VN in substance use, as well as the development of risky behaviors. Increased connectivity of the VN was identified a prominent feature of stress-predictive networks in high-risk drinkers [49]. Perturbations in connectivity strength within the visual cortex was found to affect top-down executive function and served as a predictive measure of high-risk drinking in adolescence [75]. Additionally, augmented connectivity in the VN was identified in resting-state brain networks after one session of heavy alcohol consumption in adults [66]. Combined with results from this study in which no/low drinkers exhibited weaker connections between nodes with high efficiency, it can be inferred that hazardous drinking in adolescence is associated with dysfunction in VN connectivity. Similar to the FTN, compensatory mechanisms in the brain offsetting the degenerative effects of alcohol may be a possible explanation for the observed stronger functional connectivity for hazardous drinkers.
While also uncommonly researched in addiction studies at rest, the DAN plays a role in attention and goal-directed behavior and has been linked to aberrant behaviors and substance use. Weaker long-range connectivity (i.e. fewer/weaker connections between high GE nodes) of the DAN has been associated inattention and impulsivity in children with attention-deficiency/hyperactivity disorder (ADHD) [81]. In addition, increased connectivity of the DAN and VN has been observed in chronic cannabis users, and DAN connectivity was found to be positive correlated with severity of cannabis use in adults [82]. To date, we did not find any literature connecting DAN topology and alcohol use in the context of rs-fMRI analyses; however, the study by Sami and colleagues implicated aberrant DAN connectivity with cannabis misuse, thus identifying the DAN as a target for future substance and alcohol abuse studies. Nonetheless, results from this study suggest that hyperconnectivity of the DAN is associated with heavy alcohol use in adolescence. As with the VN and FTN, the increase in connectivity of the DAN may be a compensatory mechanism to offset the negative functional effects of alcohol in other areas of the brain.
Surprisingly, we did not observe any significant group differences in network topology within the DMN or SN. Part of the triple network model of psychopathology, the SN and the DMN (along with the CEN) have been implicated in a number of neuro-psychiatric disorders, including substance and alcohol abuse [47,60,83]. Muller-Oehring found that weaker internetwork connectivity in the DMN was associated with hazardous alcohol consumption in adolescence, a finding reflected in a number of addition alcohol use studies [33,49,68]. Additionally, abnormal SN and DMN connectivity have been implicated in cocaine use in adults [60,84,85]. Although we did not observe significant within-network drinking group differences in DMN topology, results from our three-way interactions revealed that the topological differences observed in the DMN was opposite of that observed in the rest of the brain, suggesting that that DMN topology may be associated with alcohol consumption in adolescence. Due to the overall lower level of alcohol consumption even within the hazardous drinking group [33], it is possible that group differences in DMN and SN organization are not significant due to relatively low levels of alcohol consumption in adolescence.
This study is not without limitations. NCANDA is a cross-sectional cohort study, and the analyses performed here used only baseline data. Therefore, the true cause and effect of hazardous alcohol use in adolescence on RSN organization and function cannot be determined from these analyses. Additionally, long-term detriments of alcohol use on typical brain function and development cannot be determined from these results. Further analyses on NCANDA rs-fMRI from yearly follow-up visits will provide further insights in determining whether altered connectivity of brain networks underlies pre-existing vulnerability to risky drinking or occurs as a result of alcohol misuse. It should also be acknowledged that the overall use of alcohol in the hazardous drinking group was relatively low [6]. Furthermore, results from this data can only be generalized to otherwise healthy non- or hazardous adolescent drinkers. It is also important to note that the FTN occupies brain regions that have a higher likelihood of artifact in BOLD imaging data and should be interpreted with caution.

5. Conclusions

Alcohol is the most widely used illicit substance amongst youth; however, knowledge on how heavy alcohol consumption in adolescence affects normal function and neuromaturation of the brain remains limited. The main aim of this current study was to investigate differences in resting-state functional brain network topology between adolescents with either no-to-low or hazardous alcohol use. Results from this study identified distinct organizational differences between hazardous and no/low drinkers within the CEN, BGN, SMN, DAN, VN, and FTN, indicating that heavy alcohol use in adolescence is associated deviations in normal RSN function. These topological differences in RSN organization may underlie the behavioral and cognitive deficits associated with hazardous drinking, providing insight into the neurological mechanisms of alcohol misuse and identifying important brain regions to target in future alcohol research and neuromodulatory interventions for alcohol use disorder.

Supplementary Materials

The following supporting information can be downloaded at the website of this paper posted on Preprints.org. Supplemental Table 1: Subnetwork node assignments; Supplemental Figure 1: Quantile normalization procedure; Table 2: Independent variables used for mixed-effects regression analyses; Table 3: Whole-brain regression results for AUH; Table 4: Regression results for AUH; Table 5: Post-hoc contrast statements for AUH; Table 6: Full mixed-effects results for Basal Ganglia Network (BGN) Connection Probability Model; Table 7: Full mixed-effects results for Basal Ganglia Network (BGN) Connection Strength Model; Table 8: Full mixed-effects results for Central Executive Network (CEN) Connection Probability Model; Table 9: Full mixed-effects results for Central Executive Network (CEN) Connection Strength Model; Table 10: Full mixed-effects results for Dorsal Attention Network (DAN) Connection Probability; Table 11: Full mixed-effects results for Dorsal Attention Network (DAN) Connection Strength Model; Table 12: Full mixed-effects results for Default Mode Network (DMN) Connection Probability Model; Table 13: Full mixed-effects results for Default Mode Network (DMN) Connection Strength Model; Table 14: Full mixed-effects results for Fronto-Temporal Network (FTN) Connection Probability Model; Table 15: Full mixed-effects results for Fronto-Temporal Network (FTN) Connection Strength Model; Table 16: Full mixed-effects results for Sensorimotor Network (SMN) Connection Probability Model; Table 17: Full mixed-effects results for Sensorimotor Network (SMN) Connection Strength Model; Table 18: Full mixed-effects results for Salience Network (SN) Connection Probability Model; Table 19: Full mixed-effects results for Salience Network (SN) Connection Strength Model; Table 20: Full mixed-effects results for Visual Network (VN) Connection Probability Model; Table 21: Full mixed-effects results for Visual Network (VN) Connection Strength Model.

Author Contributions

Conceptualization, HAK, PJL, HPS, and MB; formal analysis, HAK, MB, SLS, and RGL; project administration and supervision, PJL; validation, HAK and PJL; visualization, HAK, MB, and RGL; writing- original draft, HAK, MB, and PJL; writing- reviewing and editing, HAK, PJL, HPS, MB, JHB, RGL, and SLS.

Funding

This research was supported by the National Institute on Alcohol Abuse and Alcoholism under Award Number R01 AA029925, Award Number P50 AA026117, and Award Number T32 AA007565 Wake Forest University Alcohol Training Grant.

Institutional Review Board Statement

This study was conducted according to the guidelines of the Declaration of Helsinki, approved by the Institutional Review Board of Wake Forest School of Medicine (IRB00067822).

Data Availability Statement

The data analyzed in this study is publicly available through application at http://www.ncanda.org/datasharing.php. Software used for analysis are available at https://www.nitrc.org/projects/wfu_mmnet.

Acknowledgments

Data collection and sharing for this project was provided by the NIAAA and NCANDA, which is supported by NIH grants A021697, AA021697-04S1, AA021695, AA021692, AA021696, AA021681, AA021690, and AA021691. Deidentified data used here are from the data release NCANDA_RELEASE_BASE_RESTINGSTATE_IMAGES_V03, NCANDA_RELEASE_BASE_STRUCTURAL_IMAGES_V03, NCANDA_PUBLIC_BASE_REDCAP_V02 and, NCANDA_PUBLIC_BASE_RESTINGSTATE_V01. Distributed to the public according to the NCANDA Data Distribution agreement (www.niaaa.nih.gov/research/major-initiatives/nationalconsortium-alcohol-and-neurodevelopment-adolescence/ncandadata).

Conflicts of Interest

The authors declare no conflict of interest. The funders had no role in the design of the study; in the collection, analyses, or interpretation of data; in the writing of the manuscript; or in the decision to publish the results.

References

  1. Giedd, J.N. Structural Magnetic Resonance Imaging of the Adolescent Brain. Ann. New York Acad. Sci. 2004, 1021, 77–85. [Google Scholar] [CrossRef]
  2. Giedd, J.N.; Blumenthal, J.; Jeffries, N.O.; Castellanos, F.X.; Liu, H.; Zijdenbos, A.; Paus, T.; Evans, A.C.; Rapoport, J.L. Brain development during childhood and adolescence: a longitudinal MRI study. Nat. Neurosci. 1999, 2, 861–863. [Google Scholar] [CrossRef]
  3. Sowell, E.R.; Thompson, P.M.; Tessner, K.D.; Toga, A.W. Mapping Continued Brain Growth and Gray Matter Density Reduction in Dorsal Frontal Cortex: Inverse Relationships during Postadolescent Brain Maturation. J. Neurosci. 2001, 21, 8819–8829. [Google Scholar] [CrossRef]
  4. Jernigan, T.L.; Tallal, P. LATE CHILDHOOD CHANGES IN BRAIN MORPHOLOGY OBSERVABLE WITH MRI. Dev. Med. Child Neurol. 1990, 32, 379–385. [Google Scholar] [CrossRef] [PubMed]
  5. Lenroot, R.K.; Giedd, J.N. Brain development in children and adolescents: Insights from anatomical magnetic resonance imaging. Neurosci. Biobehav. Rev. 2006, 30, 718–729. [Google Scholar] [CrossRef]
  6. Moorman, D.E. The role of the orbitofrontal cortex in alcohol use, abuse, and dependence. Prog. Neuro-Psychopharmacology Biol. Psychiatry 2018, 87 Pt A, 85–107. [Google Scholar] [CrossRef]
  7. Blakemore, S.-J. Imaging brain development: The adolescent brain. NeuroImage 2012, 61, 397–406. [Google Scholar] [CrossRef]
  8. Barnea-Goraly, N.; Menon, V.; Eckert, M.; Tamm, L.; Bammer, R.; Karchemskiy, A.; Dant, C.C.; Reiss, A.L. White Matter Development During Childhood and Adolescence: A Cross-sectional Diffusion Tensor Imaging Study. Cereb. Cortex 2005, 15, 1848–1854. [Google Scholar] [CrossRef] [PubMed]
  9. Rakic, P.; Bourgeois, J.P.; Goldman-Rakic, P.S. Synaptic development of the cerebral cortex: implications for learning, memory, and mental illness. Prog Brain Res 1994, 102, 227–243. [Google Scholar]
  10. Bick, J.; Nelson, C.A. Early Adverse Experiences and the Developing Brain. Neuropsychopharmacology 2016, 41, 177–196. [Google Scholar] [CrossRef]
  11. Hart, H.; Rubia, K. Neuroimaging of child abuse: a critical review. Front. Hum. Neurosci. 2012, 6, 52. [Google Scholar] [CrossRef]
  12. Casey, B.J. , Jones, R. M.; Hare, T.A. The adolescent brain. Ann N Y Acad Sci 2008, 1124, 111–126. [Google Scholar] [CrossRef] [PubMed]
  13. Winters, K.C.; Arria, A. Adolescent Brain Development and Drugs. Prev Res 2011, 18, 21–24. [Google Scholar]
  14. DeWitt, S.J.; Aslan, S.; Filbey, F.M. Adolescent risk-taking and resting state functional connectivity. Psychiatry Res. 2014, 222, 157–164. [Google Scholar] [CrossRef]
  15. NIAAA. Underage Drinking. October 2022 [cited 2022; Available from: https://www.niaaa.nih.gov/publications/brochures-and-fact-sheets/underage-drinking.
  16. Mota, N.; Parada, M.; Crego, A.; Doallo, S.; Caamaño-Isorna, F.; Holguín, S.R.; Cadaveira, F.; Corral, M. Binge drinking trajectory and neuropsychological functioning among university students: A longitudinal study. Drug Alcohol Depend. 2013, 133, 108–114. [Google Scholar] [CrossRef] [PubMed]
  17. Hanson, K.L.; Medina, K.L.; Padula, C.B.; Tapert, S.F.; Brown, S.A. Impact of Adolescent Alcohol and Drug Use on Neuropsychological Functioning in Young Adulthood: 10-Year Outcomes. J. Child Adolesc. Subst. Abus. 2011, 20, 135–154. [Google Scholar] [CrossRef] [PubMed]
  18. Hanson, K.L.; Cummins, K.; Tapert, S.F.; Brown, S.A. Changes in neuropsychological functioning over 10 years following adolescent substance abuse treatment. Psychol. Addict. Behav. 2011, 25, 127–142. [Google Scholar] [CrossRef]
  19. Winward, J.L.; Hanson, K.L.; Tapert, S.F.; Brown, S.A. Heavy Alcohol Use, Marijuana Use, and Concomitant Use by Adolescents Are Associated with Unique and Shared Cognitive Decrements. J. Int. Neuropsychol. Soc. 2014, 20, 784–795. [Google Scholar] [CrossRef]
  20. Nguyen-Louie, T.T.; Tracas, A.; Squeglia, L.M.; Matt, G.E.; Eberson-Shumate, S.; Tapert, S.F. Learning and Memory in Adolescent Moderate, Binge, and Extreme-Binge Drinkers. Alcohol. Clin. Exp. Res. 2016, 40, 1895–1904. [Google Scholar] [CrossRef]
  21. Lees, B.; Meredith, L.R.; Kirkland, A.E.; Bryant, B.E.; Squeglia, L.M. Effect of alcohol use on the adolescent brain and behavior. Pharmacol. Biochem. Behav. 2020, 192, 172906. [Google Scholar] [CrossRef]
  22. Squeglia, L.M.; Spadoni, A.D.; Infante, M.A.; Myers, M.G.; Tapert, S.F. Initiating moderate to heavy alcohol use predicts changes in neuropsychological functioning for adolescent girls and boys. Psychol. Addict. Behav. 2009, 23, 715–722. [Google Scholar] [CrossRef] [PubMed]
  23. Squeglia, L.M.; Tapert, S.F.; Sullivan, E.V.; Jacobus, J.; Meloy, M.; Rohlfing, T.; Pfefferbaum, A.; Luby, J.L.; Agrawal, A.; Belden, A.; et al. Brain Development in Heavy-Drinking Adolescents. 2015, 172, 531–542. [Google Scholar] [CrossRef] [PubMed]
  24. Pfefferbaum, A.; Kwon, D.; Brumback, T.; Thompson, W.K.; Cummins, K.; Tapert, S.F.; Brown, S.A.; Colrain, I.M.; Baker, F.C.; Prouty, D.; et al. Altered Brain Developmental Trajectories in Adolescents After Initiating Drinking. Am. J. Psychiatry 2018, 175, 370–380. [Google Scholar] [CrossRef] [PubMed]
  25. De Bellis, M.D.; et al. Hippocampal volume in adolescent-onset alcohol use disorders. Am J Psychiatry 2000, 157, 737–744. [Google Scholar] [CrossRef]
  26. De Bellis, M.D.; et al. Prefrontal cortex, thalamus, and cerebellar volumes in adolescents and young adults with adolescent-onset alcohol use disorders and comorbid mental disorders. Alcohol Clin Exp Res 2005, 29, 1590–1600. [Google Scholar] [CrossRef]
  27. Jacobus, J.; Tapert, S.F. Neurotoxic Effects of Alcohol in Adolescence. Annu. Rev. Clin. Psychol. 2013, 9, 703–721. [Google Scholar] [CrossRef]
  28. Tapert, S.F.; Schweinsburg, A.D.; Barlett, V.C.; Brown, S.A.; Frank, L.R.; Brown, G.G.; Meloy, M.J. Blood Oxygen Level Dependent Response and Spatial Working Memory in Adolescents With Alcohol Use Disorders. Alcohol. Clin. Exp. Res. 2004, 28, 1577–1586. [Google Scholar] [CrossRef]
  29. Tapert, S.F.; Brown, G.G.; Kindermann, S.S.; Cheung, E.H.; Frank, L.R.; A Brown, S. fMRI measurement of brain dysfunction in alcohol-dependent young women. Alcohol Clin Exp Res 2001, 25, 236–45. [Google Scholar] [CrossRef]
  30. Xiao, L.; Bechara, A.; Gong, Q.; Huang, X.; Li, X.; Xue, G.; Wong, S.; Lu, Z.-L.; Palmer, P.; Wei, Y.; et al. Abnormal affective decision making revealed in adolescent binge drinkers using a functional magnetic resonance imaging study. Psychol. Addict. Behav. 2013, 27, 443–454. [Google Scholar] [CrossRef]
  31. Norman, A.L.; Pulido, C.; Squeglia, L.M.; Spadoni, A.D.; Paulus, M.P.; Tapert, S.F. Neural activation during inhibition predicts initiation of substance use in adolescence. Drug Alcohol Depend. 2011, 119, 216–223. [Google Scholar] [CrossRef]
  32. Gonçalves, S.F.; Turpyn, C.C.; Niehaus, C.E.; Mauro, K.L.; Hinagpis, C.L.; Thompson, J.C.; Chaplin, T.M. Neural activation to loss and reward among alcohol naive adolescents who later initiate alcohol use. Dev. Cogn. Neurosci. 2021, 50, 100978. [Google Scholar] [CrossRef]
  33. Müller-Oehring, E.M.; Kwon, D.; Nagel, B.J.; Sullivan, E.V.; Chu, W.; Rohlfing, T.; Prouty, D.; Nichols, B.N.; Poline, J.-B.; Tapert, S.F.; et al. Influences of Age, Sex, and Moderate Alcohol Drinking on the Intrinsic Functional Architecture of Adolescent Brains. Cereb. Cortex 2017, 28, 1049–1063. [Google Scholar] [CrossRef]
  34. Biswal, B.; Yetkin, F.Z.; Haughton, V.M.; Hyde, J.S. Functional connectivity in the motor cortex of resting human brain using echo-planar mri. Magn. Reson. Med. 1995, 34, 537–541. [Google Scholar] [CrossRef] [PubMed]
  35. Ogawa, S.; Lee, T.M.; Kay, A.R.; Tank, D.W. Brain magnetic resonance imaging with contrast dependent on blood oxygenation. Proc Natl Acad Sci U S A 1990, 87, 9868–9872. [Google Scholar] [CrossRef]
  36. Schmidt, A.; Denier, N.; Magon, S.; Radue, E.-W.; Huber, C.G.; Riecher-Rossler, A.; A Wiesbeck, G.; E Lang, U.; Borgwardt, S.; Walter, M. Increased functional connectivity in the resting-state basal ganglia network after acute heroin substitution. Transl. Psychiatry 2015, 5, e533–e533. [Google Scholar] [CrossRef] [PubMed]
  37. Gozdas, E.; Holland, S.K.; Altaye, M. ; CMIND Authorship Consortium Developmental changes in functional brain networks from birth through adolescence. Hum. Brain Mapp. 2019, 40, 1434–1444. [Google Scholar] [CrossRef] [PubMed]
  38. Fair, D.A.; Cohen, A.L.; Power, J.D.; Dosenbach, N.U.F.; Church, J.A.; Miezin, F.M.; Schlaggar, B.L.; Petersen, S.E. Functional Brain Networks Develop from a “Local to Distributed” Organization. PLOS Comput. Biol. 2009, 5, e1000381. [Google Scholar] [CrossRef]
  39. Lebel, C.; Beaulieu, C. Longitudinal development of human brain wiring continues from childhood into adulthood. J Neurosc 2011, 31, 10937–10947. [Google Scholar] [CrossRef]
  40. Power, J.D.; Fair, D.A.; Schlaggar, B.L.; Petersen, S.E. The Development of Human Functional Brain Networks. Neuron 2010, 67, 735–748. [Google Scholar] [CrossRef] [PubMed]
  41. Whelan, R.; Conrod, P.J.; Poline, J.-B.; Lourdusamy, A.; Banaschewski, T.; Barker, G.J.; A Bellgrove, M.; Büchel, C.; Byrne, M.; et al.; the IMAGEN Consortium Adolescent impulsivity phenotypes characterized by distinct brain networks. Nat. Neurosci. 2012, 15, 920–925. [Google Scholar] [CrossRef]
  42. Castellanos, F.X.; Aoki, Y. Intrinsic Functional Connectivity in Attention-Deficit/Hyperactivity Disorder: A Science in Development. Biol. Psychiatry: Cogn. Neurosci. Neuroimaging 2016, 1, 253–261. [Google Scholar] [CrossRef] [PubMed]
  43. Samea, F.; Soluki, S.; Nejati, V.; Zarei, M.; Cortese, S.; Eickhoff, S.B.; Tahmasian, M.; Eickhoff, C.R. Brain alterations in children/adolescents with ADHD revisited: A neuroimaging meta-analysis of 96 structural and functional studies. Neurosci. Biobehav. Rev. 2019, 100, 1–8. [Google Scholar] [CrossRef] [PubMed]
  44. Lawrence, K.E.; Hernandez, L.M.; Bookheimer, S.Y.; Dapretto, M. Atypical longitudinal development of functional connectivity in adolescents with autism spectrum disorder. Autism Res. 2019, 12, 53–65. [Google Scholar] [CrossRef]
  45. Belmonte, M.K.; Allen, G.; Beckel-Mitchener, A.; Boulanger, L.M.; Carper, R.A.; Webb, S.J. Autism and abnormal development of brain connectivity. J. Neurosci. 2004, 24, 9228–9231. [Google Scholar] [CrossRef]
  46. Uddin, L.Q.; Supekar, K.; Menon, V. Reconceptualizing functional brain connectivity in autism from a developmental perspective. Front. Hum. Neurosci. 2013, 7, 458. [Google Scholar] [CrossRef]
  47. Reese, E.D.; Yi, J.Y.; McKay, K.G.; Stein, E.A.; Ross, T.J.; Daughters, S.B. Triple Network Resting State Connectivity Predicts Distress Tolerance and Is Associated with Cocaine Use. J. Clin. Med. 2019, 8, 2135. [Google Scholar] [CrossRef]
  48. Zhao, Q.; Sullivan, E.V.; Műller-Oehring, E.M.; Honnorat, N.; Adeli, E.; Podhajsky, S.; Baker, F.C.; Colrain, I.M.; Prouty, D.; Tapert, S.F.; et al. Adolescent alcohol use disrupts functional neurodevelopment in sensation seeking girls. Addict. Biol. 2020, 26, e12914. [Google Scholar] [CrossRef]
  49. Goldfarb, E.V.; Scheinost, D.; Fogelman, N.; Seo, D.; Sinha, R. High-Risk Drinkers Engage Distinct Stress-Predictive Brain Networks. Biol. Psychiatry: Cogn. Neurosci. Neuroimaging 2022, 7, 805–813. [Google Scholar] [CrossRef]
  50. Holcomb, L.A.; Huang, S.; Cruz, S.M.; Marinkovic, K. Neural oscillatory dynamics of inhibitory control in young adult binge drinkers. Biol. Psychol. 2019, 146, 107732. [Google Scholar] [CrossRef]
  51. Bahrami, M.; Laurienti, P.J.; Simpson, S.L. A MATLAB toolbox for multivariate analysis of brain networks. Hum. Brain Mapp. 2019, 40, 175–186. [Google Scholar] [CrossRef] [PubMed]
  52. Bahrami, M.; Laurienti, P.J.; Simpson, S.L. Analysis of brain subnetworks within the context of their whole-brain networks. Hum. Brain Mapp. 2019, 40, 5123–5141. [Google Scholar] [CrossRef]
  53. Simpson, S.L.; Laurienti, P.J. A two-part mixed-effects modeling framework for analyzing whole-brain network data. NeuroImage 2015, 113, 310–319. [Google Scholar] [CrossRef] [PubMed]
  54. Watts, D.J.; Strogatz, S.H. Collective dynamics of ‘small-world’ networks. Nature 1998, 393, 440–442. [Google Scholar] [CrossRef]
  55. Latora, V.; Marchiori, M. Efficient Behavior of Small-World Networks. Phys. Rev. Lett. 2001, 87, 198701. [Google Scholar] [CrossRef] [PubMed]
  56. Bullmore, E.; Sporns, O. Complex brain networks: graph theoretical analysis of structural and functional systems. Nat Rev Neurosci 2009, 10, 186–198. [Google Scholar] [CrossRef] [PubMed]
  57. Brown, S.A.; Brumback, T.; Tomlinson, K.; Cummins, K.; Thompson, W.K.; Nagel, B.J.; De Bellis, M.D.; Hooper, S.R.; Clark, D.B.; Chung, T.; et al. The National Consortium on Alcohol and NeuroDevelopment in Adolescence (NCANDA): A Multisite Study of Adolescent Development and Substance Use. J. Stud. Alcohol Drugs 2015, 76, 895–908. [Google Scholar] [CrossRef]
  58. Friedman, E.J.; Landsberg, A.S.; Owen, J.P.; Li, Y.-O.; Mukherjee, P. Stochastic geometric network models for groups of functional and structural connectomes. NeuroImage 2014, 101, 473–484. [Google Scholar] [CrossRef]
  59. Bahrami, M.; Simpson, S.L.; Burdette, J.H.; Lyday, R.G.; Quandt, S.A.; Chen, H.; Arcury, T.A.; Laurienti, P.J. Altered default mode network associated with pesticide exposure in Latinx children from rural farmworker families. NeuroImage 2022, 256, 119179–119179. [Google Scholar] [CrossRef]
  60. Menon, V. Large-scale brain networks and psychopathology: a unifying triple network model. Trends Cogn. Sci. 2011, 15, 483–506. [Google Scholar] [CrossRef]
  61. Fair, D.A.; Dosenbach, N.U.F.; Church, J.A.; Cohen, A.L.; Brahmbhatt, S.; Miezin, F.M.; Barch, D.M.; Raichle, M.E.; Petersen, S.E.; Schlaggar, B.L. Development of distinct control networks through segregation and integration. Proc. Natl. Acad. Sci. USA 2007, 104, 13507–13512. [Google Scholar] [CrossRef] [PubMed]
  62. Rubinov, M.; Sporns, O. Complex network measures of brain connectivity: Uses and interpretations. NeuroImage 2010, 52, 1059–1069. [Google Scholar] [CrossRef] [PubMed]
  63. Bullmore, E.; Sporns, O. The economy of brain network organization. Nat. Rev. Neurosci. 2012, 13, 336–349. [Google Scholar] [CrossRef] [PubMed]
  64. Buzsaki, G. Rhythms of the Brain; Oxford University Press, 2006. [Google Scholar]
  65. Muller, A.M.; Meyerhoff, D.J. Maladaptive brain organization at 1 month into abstinence as an indicator for future relapse in patients with alcohol use disorder. Eur. J. Neurosci. 2021, 53, 2923–2938. [Google Scholar] [CrossRef] [PubMed]
  66. Zhang, G.; Li, N.; Liu, H.; Zheng, H.; Zheng, W. Dynamic connectivity patterns of resting-state brain functional networks in healthy individuals after acute alcohol intake. Front. Neurosci. 2022, 16, 974778. [Google Scholar] [CrossRef]
  67. Squeglia, L.M.; Cservenka, A. Adolescence and drug use vulnerability: findings from neuroimaging. Curr. Opin. Behav. Sci. 2017, 13, 164–170. [Google Scholar] [CrossRef] [PubMed]
  68. Maleki, N.; Sawyer, K.S.; Levy, S.; Harris, G.J.; Oscar-Berman, M. Intrinsic brain functional connectivity patterns in alcohol use disorder. Brain Commun. 2022, 4, fcac290. [Google Scholar] [CrossRef]
  69. Lanciego, J.L.; Luquin, N.; Obeso, J.A. Functional Neuroanatomy of the Basal Ganglia. Cold Spring Harb. Perspect. Med. 2012, 2, a009621–a009621. [Google Scholar] [CrossRef]
  70. Renteria, R.; Baltz, E.T.; Gremel, C.M. Chronic alcohol exposure disrupts top-down control over basal ganglia action selection to produce habits. Nat. Commun. 2018, 9, 211. [Google Scholar] [CrossRef]
  71. Sitzia, G.; Lovinger, D.M. Circuit dysfunctions of associative and sensorimotor basal ganglia loops in alcohol use disorder: insights from animal models. Addict. Neurosci. 2023, 5. [Google Scholar] [CrossRef]
  72. Rzepecki-Smith, C.I.; Meda, S.A.; Calhoun, V.D.; Stevens, M.C.; Jafri, M.J.; Astur, R.S.; Pearlson, G.D. Disruptions in Functional Network Connectivity During Alcohol Intoxicated Driving. Alcohol. Clin. Exp. Res. 2010, 34, 479–487. [Google Scholar] [CrossRef]
  73. Ersche, K.D.; Meng, C.; Ziauddeen, H.; Stochl, J.; Williams, G.B.; Bullmore, E.T.; Robbins, T.W. Brain networks underlying vulnerability and resilience to drug addiction. Proc. Natl. Acad. Sci. USA 2020, 117, 15253–15261. [Google Scholar] [CrossRef]
  74. Chenji, S.; Jha, S.; Lee, D.; Brown, M.; Seres, P.; Mah, D.; Kalra, S. Investigating Default Mode and Sensorimotor Network Connectivity in Amyotrophic Lateral Sclerosis. PLOS ONE 2016, 11, e0157443. [Google Scholar] [CrossRef] [PubMed]
  75. Silveira, S.; Shah, R.; Nooner, K.B.; Nagel, B.J.; Tapert, S.F.; de Bellis, M.D.; Mishra, J. Impact of Childhood Trauma on Executive Function in Adolescence—Mediating Functional Brain Networks and Prediction of High-Risk Drinking. Biol. Psychiatry: Cogn. Neurosci. Neuroimaging 2020, 5, 499–509. [Google Scholar] [CrossRef] [PubMed]
  76. Koob, G.F.; Volkow, N.D. Neurocircuitry of addiction. Neuropsychopharmacology 2010, 35, 217–238. [Google Scholar] [CrossRef] [PubMed]
  77. Bracht, T.; Soravia, L.; Moggi, F.; Stein, M.; Grieder, M.; Federspiel, A.; Tschümperlin, R.; Batschelet, H.M.; Wiest, R.; Denier, N. The role of the orbitofrontal cortex and the nucleus accumbens for craving in alcohol use disorder. Transl. Psychiatry 2021, 11, 267. [Google Scholar] [CrossRef]
  78. Myrick, H.; Anton, R.F.; Li, X.; Henderson, S.; Drobes, D.; Voronin, K.; George, M.S. Differential Brain Activity in Alcoholics and Social Drinkers to Alcohol Cues: Relationship to Craving. Neuropsychopharmacology 2003, 29, 393–402. [Google Scholar] [CrossRef]
  79. Maia, T.V.; Cooney, R.E.; Peterson, B.S. The neural bases of obsessive–compulsive disorder in children and adults. Dev. Psychopathol. 2008, 20, 1251–1283. [Google Scholar] [CrossRef]
  80. Peters, S.; Peper, J.S.; Van Duijvenvoorde, A.C.; Braams, B.R.; Crone, E.A. Amygdala–orbitofrontal connectivity predicts alcohol use two years later: a longitudinal neuroimaging study on alcohol use in adolescence. Dev. Sci. 2017, 20. [Google Scholar] [CrossRef]
  81. Tomasi, D.; Volkow, N.D. Abnormal Functional Connectivity in Children with Attention-Deficit/Hyperactivity Disorder. Biol. Psychiatry 2012, 71, 443–450. [Google Scholar] [CrossRef]
  82. Sami, M.B.; A McCutcheon, R.; Ettinger, U.; Williams, S.; Lythgoe, D.; McGuire, P.; Bhattacharyya, S. Cannabis Use Linked to Altered Functional Connectivity of the Visual Attentional Connectivity in Patients With Psychosis and Controls. Schizophr. Bull. Open 2020, 1. [Google Scholar] [CrossRef]
  83. Menon, V. Developmental pathways to functional brain networks: emerging principles. Trends Cogn. Sci. 2013, 17, 627–640. [Google Scholar] [CrossRef]
  84. Canessa, N.; Basso, G.; Carne, I.; Poggi, P.; Gianelli, C. Increased decision latency in alcohol use disorder reflects altered resting-state synchrony in the anterior salience network. Sci. Rep. 2021, 11, 1–11. [Google Scholar] [CrossRef] [PubMed]
  85. Suk, J.-W.; Hwang, S.; Cheong, C. Functional and Structural Alteration of Default Mode, Executive Control, and Salience Networks in Alcohol Use Disorder. Front. Psychiatry 2021, 12. [Google Scholar] [CrossRef] [PubMed]
  86. (NIAAA), N.I.o.A.A.a.A., Alcohol screening and brief intervention for youth: A practitioner's guide, N.I.o.H. (NIH), Editor. 2011: Bethesda, MD.
  87. dministration, S.A.a.M.H.S., Results from the 2011 National Survey on Drug Use and Health: Summary of National Findings, NSDUH, Editor. 2012: Rockville, MD.
  88. Benjamini, Y.; Hochberg, Y. On the Adaptive Control of the False Discovery Rate in Multiple Testing With Independent Statistics. Journal of Educational and Behavioral Statistics 2000, 25, 60–83. [Google Scholar] [CrossRef]
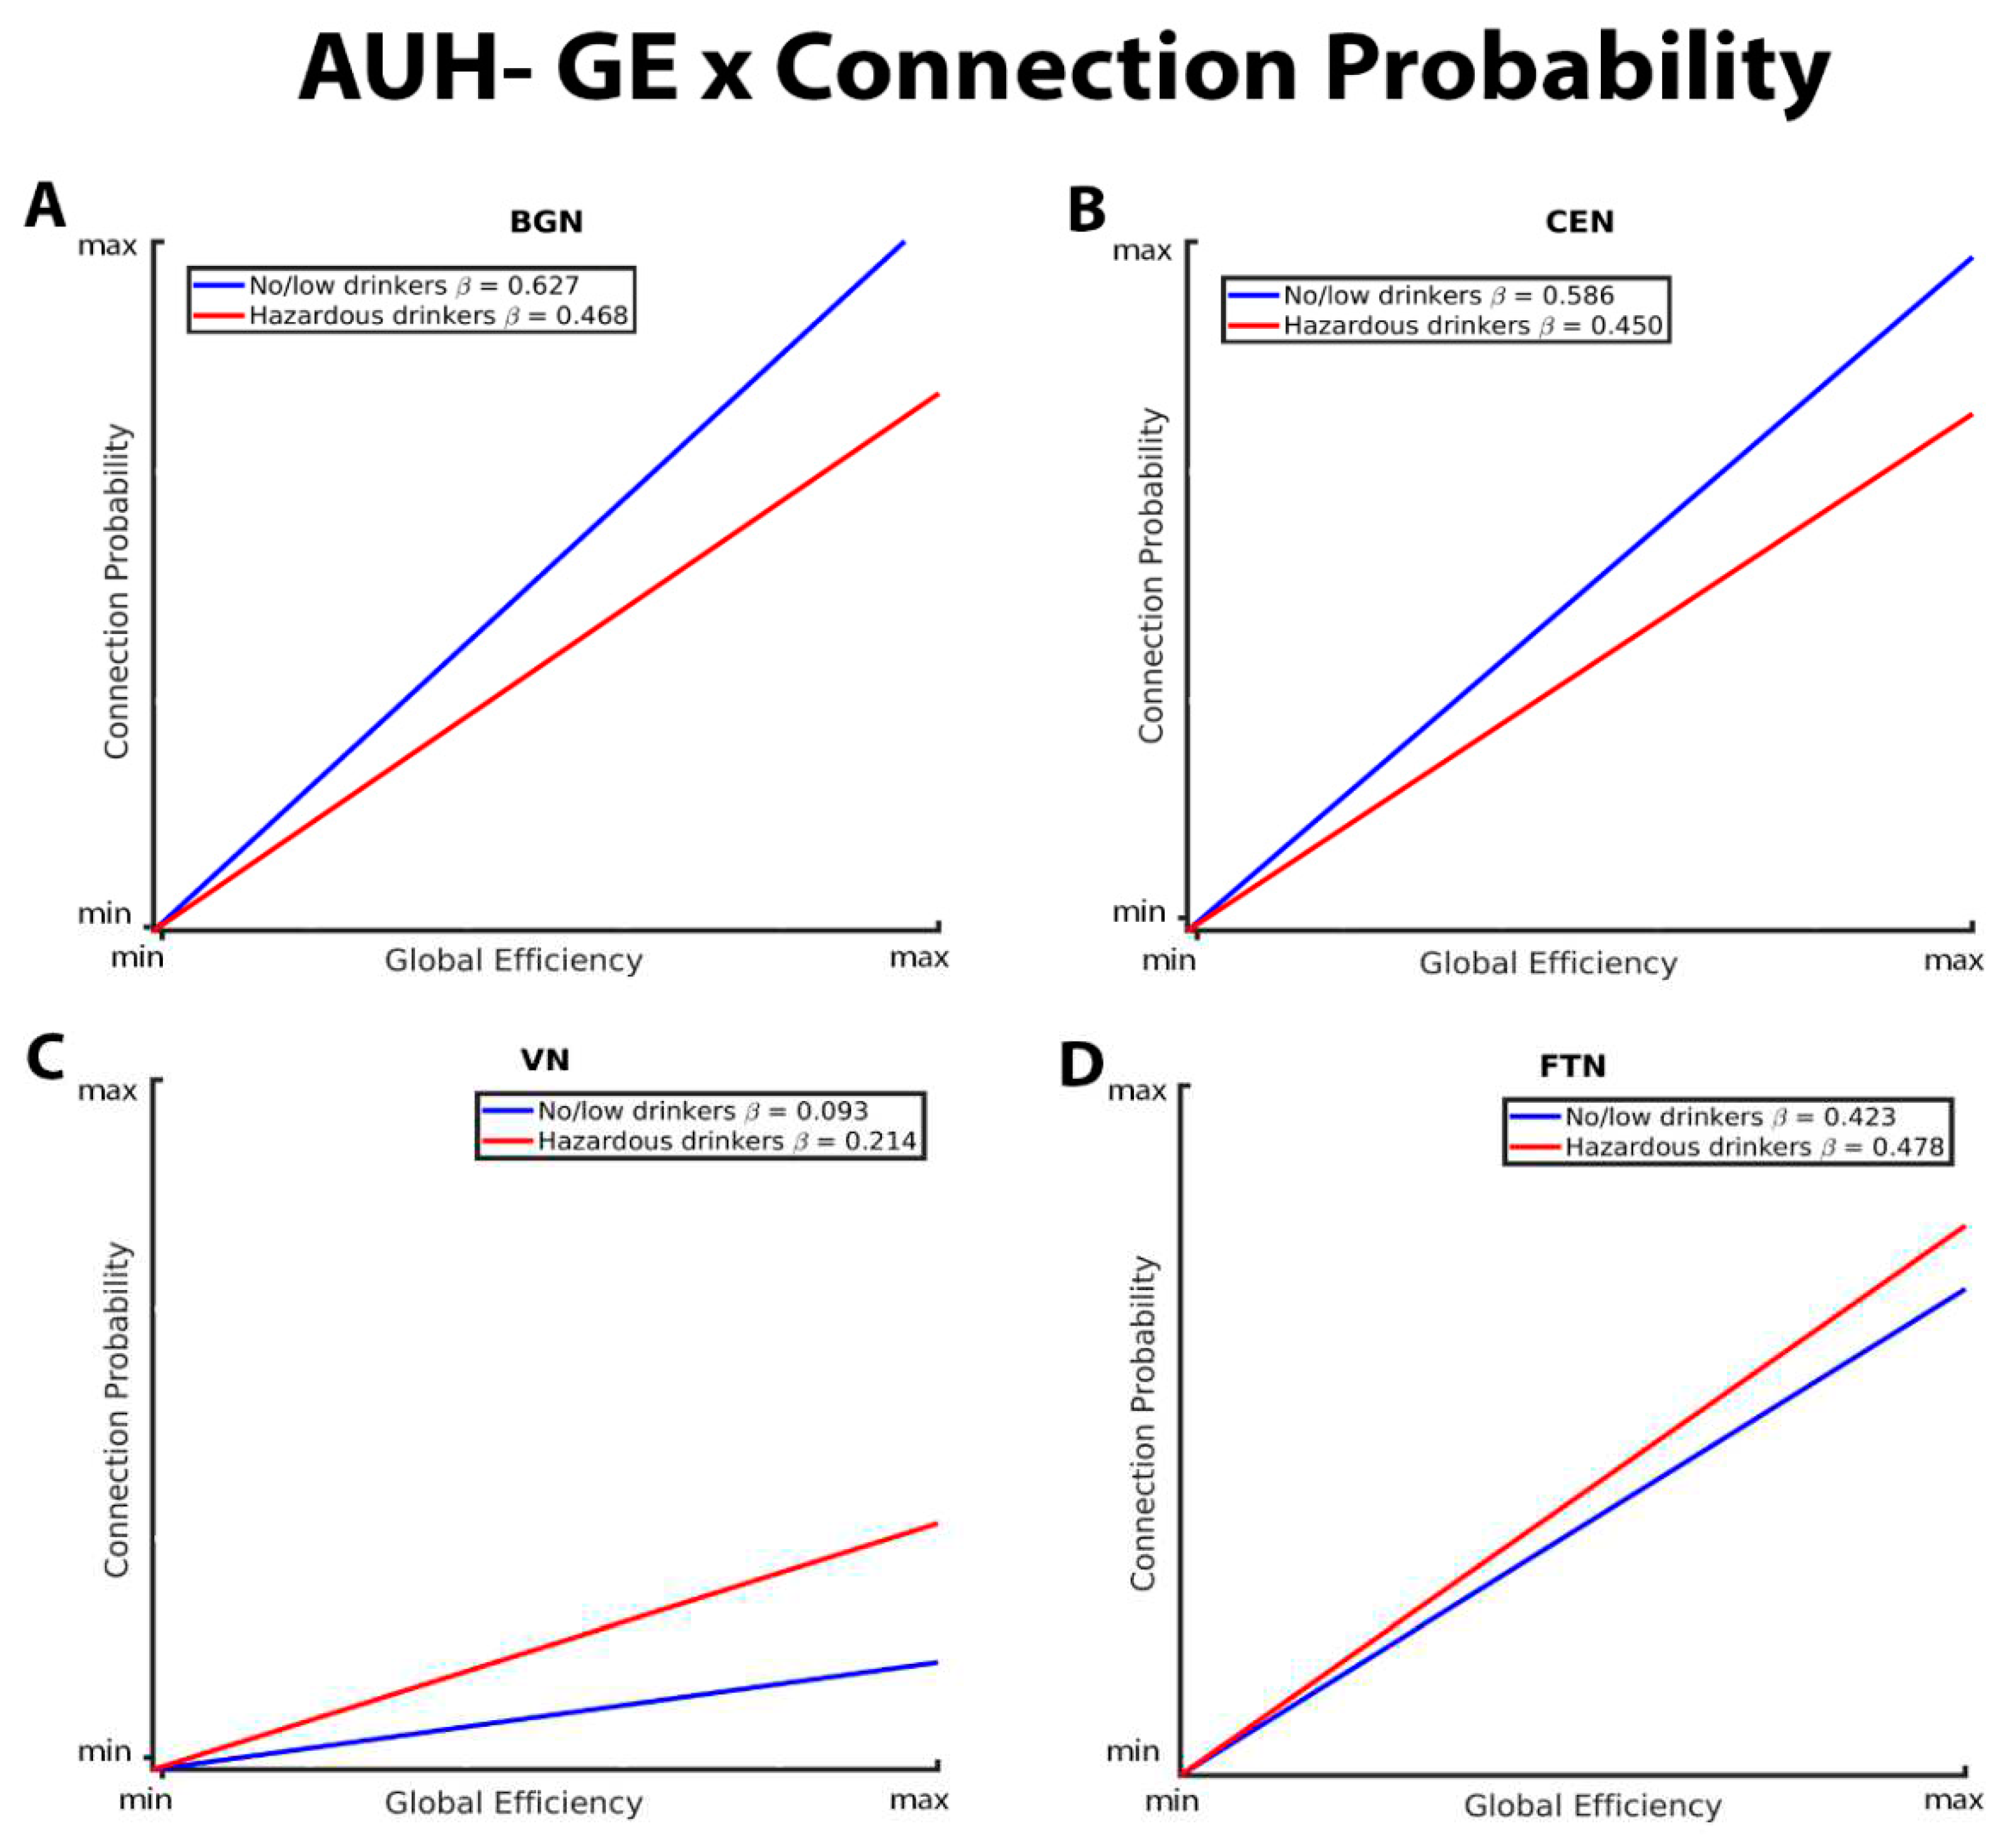
Figure 1. These graphs illustrate the association between global efficiency, connection probability, and alcohol use history (no/low or hazardous), within the (A) basal ganglia network (BGN), (B) central executive network (CEN), (C) visual network (VN), and (D) fronto-temporal network (FTN) individually. Alcohol use history (AUH) is characterized as a binary variable. Both drinking groups, no/low drinkers (blue line) and hazardous drinkers (red line), are represented by a ‘best-fit’ slope to most clearly visualize group disparities in the relationship between GE and connection probability within each network. This figure demonstrates a positive global efficiency (GE)-connection probability for both drinking groups within the BGN, CEN, VN, and FTN. This relationship is significantly more positive within the BGN and CEN for no/low drinkers, whereas hazardous drinkers exhibit a stronger GE-connection probability relationship within the VN. There were no significant group AUH group differences in the GE-connection probability relationship within the FTN.
Preprints 85924 g001
Figure 2. These graphs illustrate the association between clustering coefficient, connection probability, and alcohol use history (no/low or hazardous), within the (A) basal ganglia network (BGN), (B) central executive network (CEN), (C) visual network (VN), and (D) fronto-temporal network (FTN) individually. Alcohol use history (AUH) is characterized as a binary variable. Both drinking groups, no/low drinkers (blue line) and hazardous drinkers (red line), are represented by a ‘best-fit’ slope to most clearly visualize group disparities in the relationship between GE and connection probability within each network. The clustering coefficient (CC)-connection probability relationship is negative in both groups in the BGN, CEN, and FTN, and positive within the VN. No/low drinkers exhibit a significantly stronger negative relationship between CC and connection probability within the BGN and CEN, and a stronger positive relationship between CC and connection probability within the VN. Within the FTN, no/low drinkers demonstrated a weaker negative CC-connection probability relationship compared to hazardous drinkers.
Preprints 85924 g002
Figure 3. These graphs illustrate the association between global efficiency (GE), connection strength, alcohol use history (no/low or hazardous), within the (A) basal ganglia network (BGN), (B) central executive network (CEN), (C) sensorimotor network (DAN), (D) dorsal attention network (DAN), (E) visual network (VN), and (F) fronto-temporal network (FTN) individually. Alcohol use history (AUH) is characterized as a binary variable. Both drinking groups, no/low drinkers (blue line) and hazardous drinkers (red line), are represented by a ‘best-fit’ slope to most clearly visualize group disparities in the relationship between GE and connection strength within each network. This figure illustrates an overall positive association between GE and connection strength, however no/low drinkers show a stronger positive GE-connection strength relationship than hazardous drinkers within the BGN, CEN, and SMN, but a weaker positive GE-connection strength relationship within the DAN, VN, and FTN.
Preprints 85924 g003
Figure 4. These graphs illustrate the association between clustering coefficient (CC), connection strength, alcohol use history (no/low or hazardous), within the (A) basal ganglia network (BGN), (B) central executive network (CEN), (C) sensorimotor network (DAN), (D) dorsal attention network (DAN), (E) visual network (VN), and (F) fronto-temporal network (FTN) individually. Alcohol use history (AUH) is characterized as a binary variable. Both drinking groups, no/low drinkers (blue line) and hazardous drinkers (red line), are represented by a ‘best-fit’ slope to most clearly visualize group disparities in the relationship between CC and connection strength within each network. This figure illustrates an overall positive association between CC and connection strength, however no/low drinkers show a stronger positive CC-connection strength relationship than hazardous drinkers within the BGN, CEN, and SMN. Within the FTN, no/low drinkers had a stronger positive CC-connection strength relationship compared to hazardous drinkers. There were no significant group differences in the CC/connection strength relationship within the VN and DAN.
Preprints 85924 g004
Table 1. Drinking criteria for no/low drinkers.
Age Maximum drinks per occasion: Female Maximum drinks per occasion: Male Total days of drinking in lifetime
12-13.9 ≤ 3 ≤ 3 ≤ 5
14-15.9 ≤ 3 ≤ 4 ≤ 5
16-16.9 ≤ 3 ≤ 4 ≤ 11
17-17.9 ≤ 3 ≤ 4 ≤ 23
18-19.9 ≤ 3 ≤ 4 ≤ 51
≥ 20 ≤ 3 ≤ 5 ≤ 51
Table 1. Drinking criteria for adolescent no/low drinkers based on National Institute on Alcohol Abuse and Alcoholism (NIAAA) guidelines for risky drinking ((NIAAA), 2011). Adolescents who exceed any of these guidelines were categorized as hazardous drinkers in this study. Participants that exceeded these criteria were additionally permitted to exceed the National Survey on Drug Use and Health thresholds for cigarette and marijuana usage only. Use criteria for nicotine, cannabis, and other substances are outlined in Brown et. al 2015.
Table 2. Demographics.
Matched Groups
No/low drinkers Hazardous drinkers No/low drinkers
Total 581 117 117
Girls/Boys 306/275 62/55 62/55
Age Girls 15.9 ± 2.4 18.6 ± 2 18.4 ± 1.9
Boys 15.9 ± 2.3 18.7 ± 1.9 18.4 ± 1.7
GE/Siemens 385/196 80/37 72/45
Pubertal Development Scale Girls 3.4 ± 0.6 3.8 ± 0.2 3.8 ± 0.3
Boys 2.9 ± 0.7 3.5 ± 0.5 3.5 ± 0.4
Alcohol use # days lifetime 1.3 ± 4.1 50.6 ± 75.5 3.1 ± 7.2
# days past year 0.7 ± 2.9 23.2 ± 31.8 1.8 ± 4.8
Nicotine use # cigarettes lifetime 0.3 ± 2.4 11.4 ± 45.3 0.7 ± 4.7
# cigarettes past year 0.1 ± 1.3 6 ± 28.1 0.3 ± 2.3
Marijuana use # days lifetime 0.6 ± 2.5 10.8 ± 17.7 1 ± 3.9
# days past year 0.3 ± 1.6 7.5 ± 16 0.6 ± 2.5
Parental education (years) 16.9 ± 2.4 17.4 ± 2 17 ± 2
Table 2. Participant demographics and measures from the National Consortium on Alcohol and NeuroDevelopment in Adolescence (NCANDA). Data given as n = subject count; mean ± standard deviation (SD).
Table 3. Regression results for AUH Connection Probability.
Estimate SE t Value P-Value
Basal Ganglia Network (BGN)
GE*AUH -0.02109 0.01815 -1.16 0.2453
CC*AUH 0.01752 0.02166 0.81 0.4187
GE*AUH*BGN -0.1386 0.01973 -7.03 <.0001
CC*AUH*BGN 0.2160 0.02256 9.57 <.0001
Central Executive Network (CEN)
GE*AUH -0.02511 0.01873 -1.34 0.1802
CC*AUH 0.02172 0.02240 0.97 0.3323
GE*AUH*CEN -0.1113 0.02654 -4.19 <.0001
CC*AUH*CEN 0.2436 0.02663 9.15 <.0001
Visual Network (VN)
GE*AUH -0.02992 0.01942 -1.54 0.1234
CC*AUH 0.02984 0.02357 1.27 0.2055
GE*AUH*VN 0.1504 0.05072 2.97 0.0030
CC*AUH*VN -0.2611 0.04617 -5.65 <.0001
Fronto-Temporal Network (FTN)
GE*AUH -0.02687 0.01839 -1.46 0.1440
CC*AUH 0.02617 0.02215 1.18 0.2374
GE*AUH*FTN 0.08199 0.03451 2.38 0.0175
CC*AUH*FTN -0.1313 0.03949 -3.33 0.0009
Sensorimotor Network (SMN)
GE*AUH -0.02580 0.01811 -1.42 0.1543
CC*AUH 0.02294 0.02158 1.06 0.2878
GE*AUH*SMN 0.07347 0.02388 3.08 0.0021
CC*AUH*SMN -0.07970 0.02145 -3.72 0.0002
Default Mode Network (DMN)
GE*AUH -0.02346 0.01925 -1.22 0.2229
CC*AUH 0.02431 0.02364 1.03 0.3037
GE*AUH*DMN 0.06644 0.02115 3.14 0.0017
CC*AUH*DMN -0.04831 0.02071 -2.33 0.0196
Table 3. Results are from network analyses for the BGN, CEN, VN, FTN, SMN, and DMN for connection probability. AUH is a binary variable separating no/low and hazardous drinkers. Asterisks represent interactions between variables. Significant effects are bolded. P-values were adjusted using the adaptive false discovery rate procedure [1]. Abbreviations: GE, Global efficiency; CC, clustering coefficient; AUH, alcohol use history; SE, standard error.
Table 4. Post-hoc contrast statements for AUH Connection Probability.
Estimate SE t Value P-Value
GE*AUH within BGN -0.1597 0.02648 -6.03 <.0001
CC*AUH within BGN 0.2335 0.03098 7.54 <.0001
GE*AUH within CEN -0.1364 0.03221 -4.24 <.0001
CC*AUH within CEN 0.2653 0.03452 7.69 <.0001
GE*AUH within VN 0.1205 0.05416 2.23 0.0261
CC*AUH within VN -0.2312 0.05165 -4.48 <.0001
GE*AUH within FTN 0.05511 0.03888 1.42 0.1564
CC*AUH within FTN -0.1051 0.04506 -2.33 0.0196
GE*AUH within SMN 0.04766 0.02970 1.60 0.1085
CC*AUH within SMN -0.05676 0.03014 -1.88 0.0597
GE*AUH within DMN 0.04298 0.02827 1.52 0.1285
CC*AUH within DMN -0.02400 0.03110 -0.77 0.4403
Table 4. Post hoc findings on within-network topological characteristics within the BGN, CEN, VN, FTN, SMN, and DMN driven by alcohol use history (AUH). Asterisks represent interactions between variables. Bolded values denote significant effects within the probability model. P-values were adjusted using the adaptive false discovery rate procedure [1]. Abbreviations: GE, Global efficiency; CC, clustering coefficient; AUH, alcohol use history; SE, standard error. BGN, basal ganglia network; CEN, central executive network; VN, visual network; FTN, fronto-temporal network; SMN, sensorimotor network; DMN, default mode network.
Table 5. Regression results for AUH Connection Strength.
Estimate SE t Value P-Value
Basal Ganglia Network (BGN)
GE*AUH 0.001081 0.001052 1.03 0.3040
CC*AUH 0.000708 0.001478 0.48 0.6319
GE*AUH*BGN -0.01102 0.001897 -5.81 <.0001
CC*AUH*BGN 0.005730 0.002092 2.74 0.0062
Central Executive Network (CEN)
GE*AUH 0.000684 0.001050 0.65 0.5151
CC*AUH 0.000676 0.001487 0.45 0.6496
GE*AUH*CEN -0.00889 0.002535 -3.51 0.0005
CC*AUH*CEN 0.01810 0.002437 7.43 <.0001
Sensorimotor Network (SMN)
GE*AUH 0.001498 0.001131 1.33 0.1850
CC*AUH -0.00025 0.001599 -0.15 0.8776
GE*AUH*SMN -0.01663 0.001929 -8.62 <.0001
CC*AUH*SMN 0.01991 0.001550 12.85 <.0001
Dorsal Attention Network (DAN)
GE*AUH 0.000106 0.001001 0.11 0.9159
CC*AUH 0.001683 0.001420 1.19 0.2359
GE*AUH*DAN 0.008460 0.003021 2.80 0.0051
CC*AUH*DAN -0.00750 0.002712 -2.77 0.0056
Visual Network (VN)
GE*AUH -0.00104 0.000961 -1.08 0.2784
CC*AUH 0.002881 0.001370 2.10 0.0355
GE*AUH*VN 0.03491 0.003501 9.97 <.0001
CC*AUH*VN -0.00537 0.002965 -1.81 0.0700
Fronto-Temporal Network (FTN)
GE*AUH 0.000445 0.001019 0.44 0.6620
CC*AUH 0.001431 0.001422 1.01 0.3142
GE*AUH*FTN 0.01523 0.003358 4.53 <.0001
CC*AUH*FTN -0.02452 0.003820 -6.42 <.0001
Table 5. Results are from connection strength analyses for the BGN, CEN, SMN, DAN, VN, and FTN. AUH is a binary variable separating no/low and hazardous drinkers. Asterisks represent interactions between variables. Significant effects are bolded. P-values were adjusted using the adaptive false discovery rate procedure (Benjamini & Hochberg, 2000). Abbreviations: GE, Global efficiency; CC, clustering coefficient; AUH, alcohol use history; SE, standard error.
Table 6. Post-hoc contrast statements for AUH Connection Strength.
Estimate SE t Value P-Value
GE*AUH within BGN -0.00994 0.002110 -4.71 <.0001
CC*AUH within BGN 0.006438 0.002511 2.56 0.0104
GE*AUH within CEN -0.00821 0.002697 -3.04 0.0023
CC*AUH within CEN 0.01878 0.002807 6.69 <.0001
GE*AUH within SMN -0.01514 0.002187 -6.92 <.0001
CC*AUH within SMN 0.01967 0.002180 9.02 <.0001
GE*AUH within DAN 0.008566 0.003145 2.72 0.0065
CC*AUH within DAN -0.00582 0.003017 -1.93 0.0537
GE*AUH within VN 0.03387 0.003597 9.42 <.0001
CC*AUH within VN -0.00249 0.003226 -0.77 0.4400
GE*AUH within FTN 0.01567 0.003474 4.51 <.0001
CC*AUH within FTN -0.02309 0.004042 -5.71 <.0001
Table 6. Post hoc findings on within-network topological characteristics within the BGN, CEN, SMN, DAN, VN, and FTN driven by alcohol use history (AUH). Asterisks represent interactions between variables. Bolded values denote significant effects within the strength model. P-values were adjusted using the adaptive false discovery rate procedure [1]. Abbreviations: GE, Global efficiency; CC, clustering coefficient; AUH, alcohol use history; SE, standard error. BGN, basal ganglia network; CEN, central executive network; SMN, sensorimotor network; DAN, dorsal attention network; VN, visual network; FTN, fronto-temporal network.
Table 7. Summary of primary findings.
Preprints 85924 i001
Table 7. Abbreviations: BGN, basal ganglia network; CEN, central executive network; SMN, sensorimotor network; DAN, dorsal attention network; VN, visual network; FTN, fronto-temporal network; CP, connection probability; CS, connection strength.
Disclaimer/Publisher’s Note: The statements, opinions and data contained in all publications are solely those of the individual author(s) and contributor(s) and not of MDPI and/or the editor(s). MDPI and/or the editor(s) disclaim responsibility for any injury to people or property resulting from any ideas, methods, instructions or products referred to in the content.
Copyright: This open access article is published under a Creative Commons CC BY 4.0 license, which permit the free download, distribution, and reuse, provided that the author and preprint are cited in any reuse.
Prerpints.org logo

Preprints.org is a free preprint server supported by MDPI in Basel, Switzerland.

Subscribe

© 2024 MDPI (Basel, Switzerland) unless otherwise stated