Preprint
Communication

Super Typhoon Saola (2309) affecting Hong Kong in September 2023–Forecasting Aspect

Altmetrics

Downloads

296

Views

318

Comments

0

This version is not peer-reviewed

Submitted:

22 September 2023

Posted:

25 September 2023

You are already at the latest version

Alerts
Abstract
Hong Kong was under strike from Super Typhoon Saola (2309), necessitating the issuance of the highest tropical cyclone warning signal. Saola skirted past the south-southwest of Hong Kong, bringing hurricane force winds and significant storm surge. Saola had its closest approach to Hong Kong on 1 September 2023, posing a unique challenge in forecasting and early warning for the commencement date of the new school term, where higher impact to traffic and public safety was anticipated. This paper covers the challenges on the forecasting aspect of the super typhoon. The predicted tropical cyclone track, intensity and wind structure are reviewed. Experience in this case showed that while there was not a perfect numerical weather prediction model in terms of the forecast track, intensity and wind structure of Saola, multi-model approach provided very use-ful and crucial information for operational weather warning services.
Keywords: 
Subject: Environmental and Earth Sciences  -   Atmospheric Science and Meteorology

Introduction

Super Typhoon Saola (2309) necessitated the issuance of No. 10 tropical cyclone warning signal in Hong Kong, the first one since Mangkhut in 2018 (Choy et al. 2022a). It brought about high winds and quite significant damages to Hong Kong, including falling of trees and breaking of glass walls of tall buildings. In Chan et al. (2023), an observational study had been made about Saola, including surface and upper air meteorological observations. This is the second paper in the series about Saola and it will concentrate on the forecasting aspect.
Saola was a difficult typhoon to forecast, in terms of the track, intensity and wind structure, and thus posed a great challenge to its warning service. In terms of track, there was uncertainty in its potential interaction with another Super Typhoon Haikui (2311) over the western north Pacific, and a binary typhoon system always led to significant uncertainty in the track forecast (Choi et al. 2017; Peng and Reynolds 2005). For the intensity, the impact of landmass of southern China and the weak northeast monsoon there cast uncertainty about the weakening trend of Saola when it edged closer to Hong Kong. Furthermore, because of its relatively small size and a compact inner core when located near Hong Kong, the structure of Saola was not very well captured by global numerical weather prediction models, which had a spatial resolution as fine as around 10 km only. This limitation brought about great uncertainty about the wind strength that Saola might bring about to Hong Kong as it got closer to the territory.
This short paper attempts to review the forecasting of Saola in the above three aspects. In the Hong Kong Observatory (HKO), for tropical cyclone warning system, references are mainly made to four major global numerical weather prediction models, namely, European Centre for Medium-Range Weather Forecasts (ECMWF), Japan Meteorological Agency (JMA), National Centers for Environmental Prediction (NCEP) of the United States, and the Met Office in the United Kingdom (UKMO). Moreover, in view of the recent developments of artificial intelligence (AI) based forecast, this was the first time at HKO that Pangu-weather global model (Bi et al. 2023) was introduced for operational tropical cyclone forecast on a trial basis, mainly about the forecast track of Saola, due to limitation of Pangu-weather in revealing the intensity and structure of a tropical cyclone.
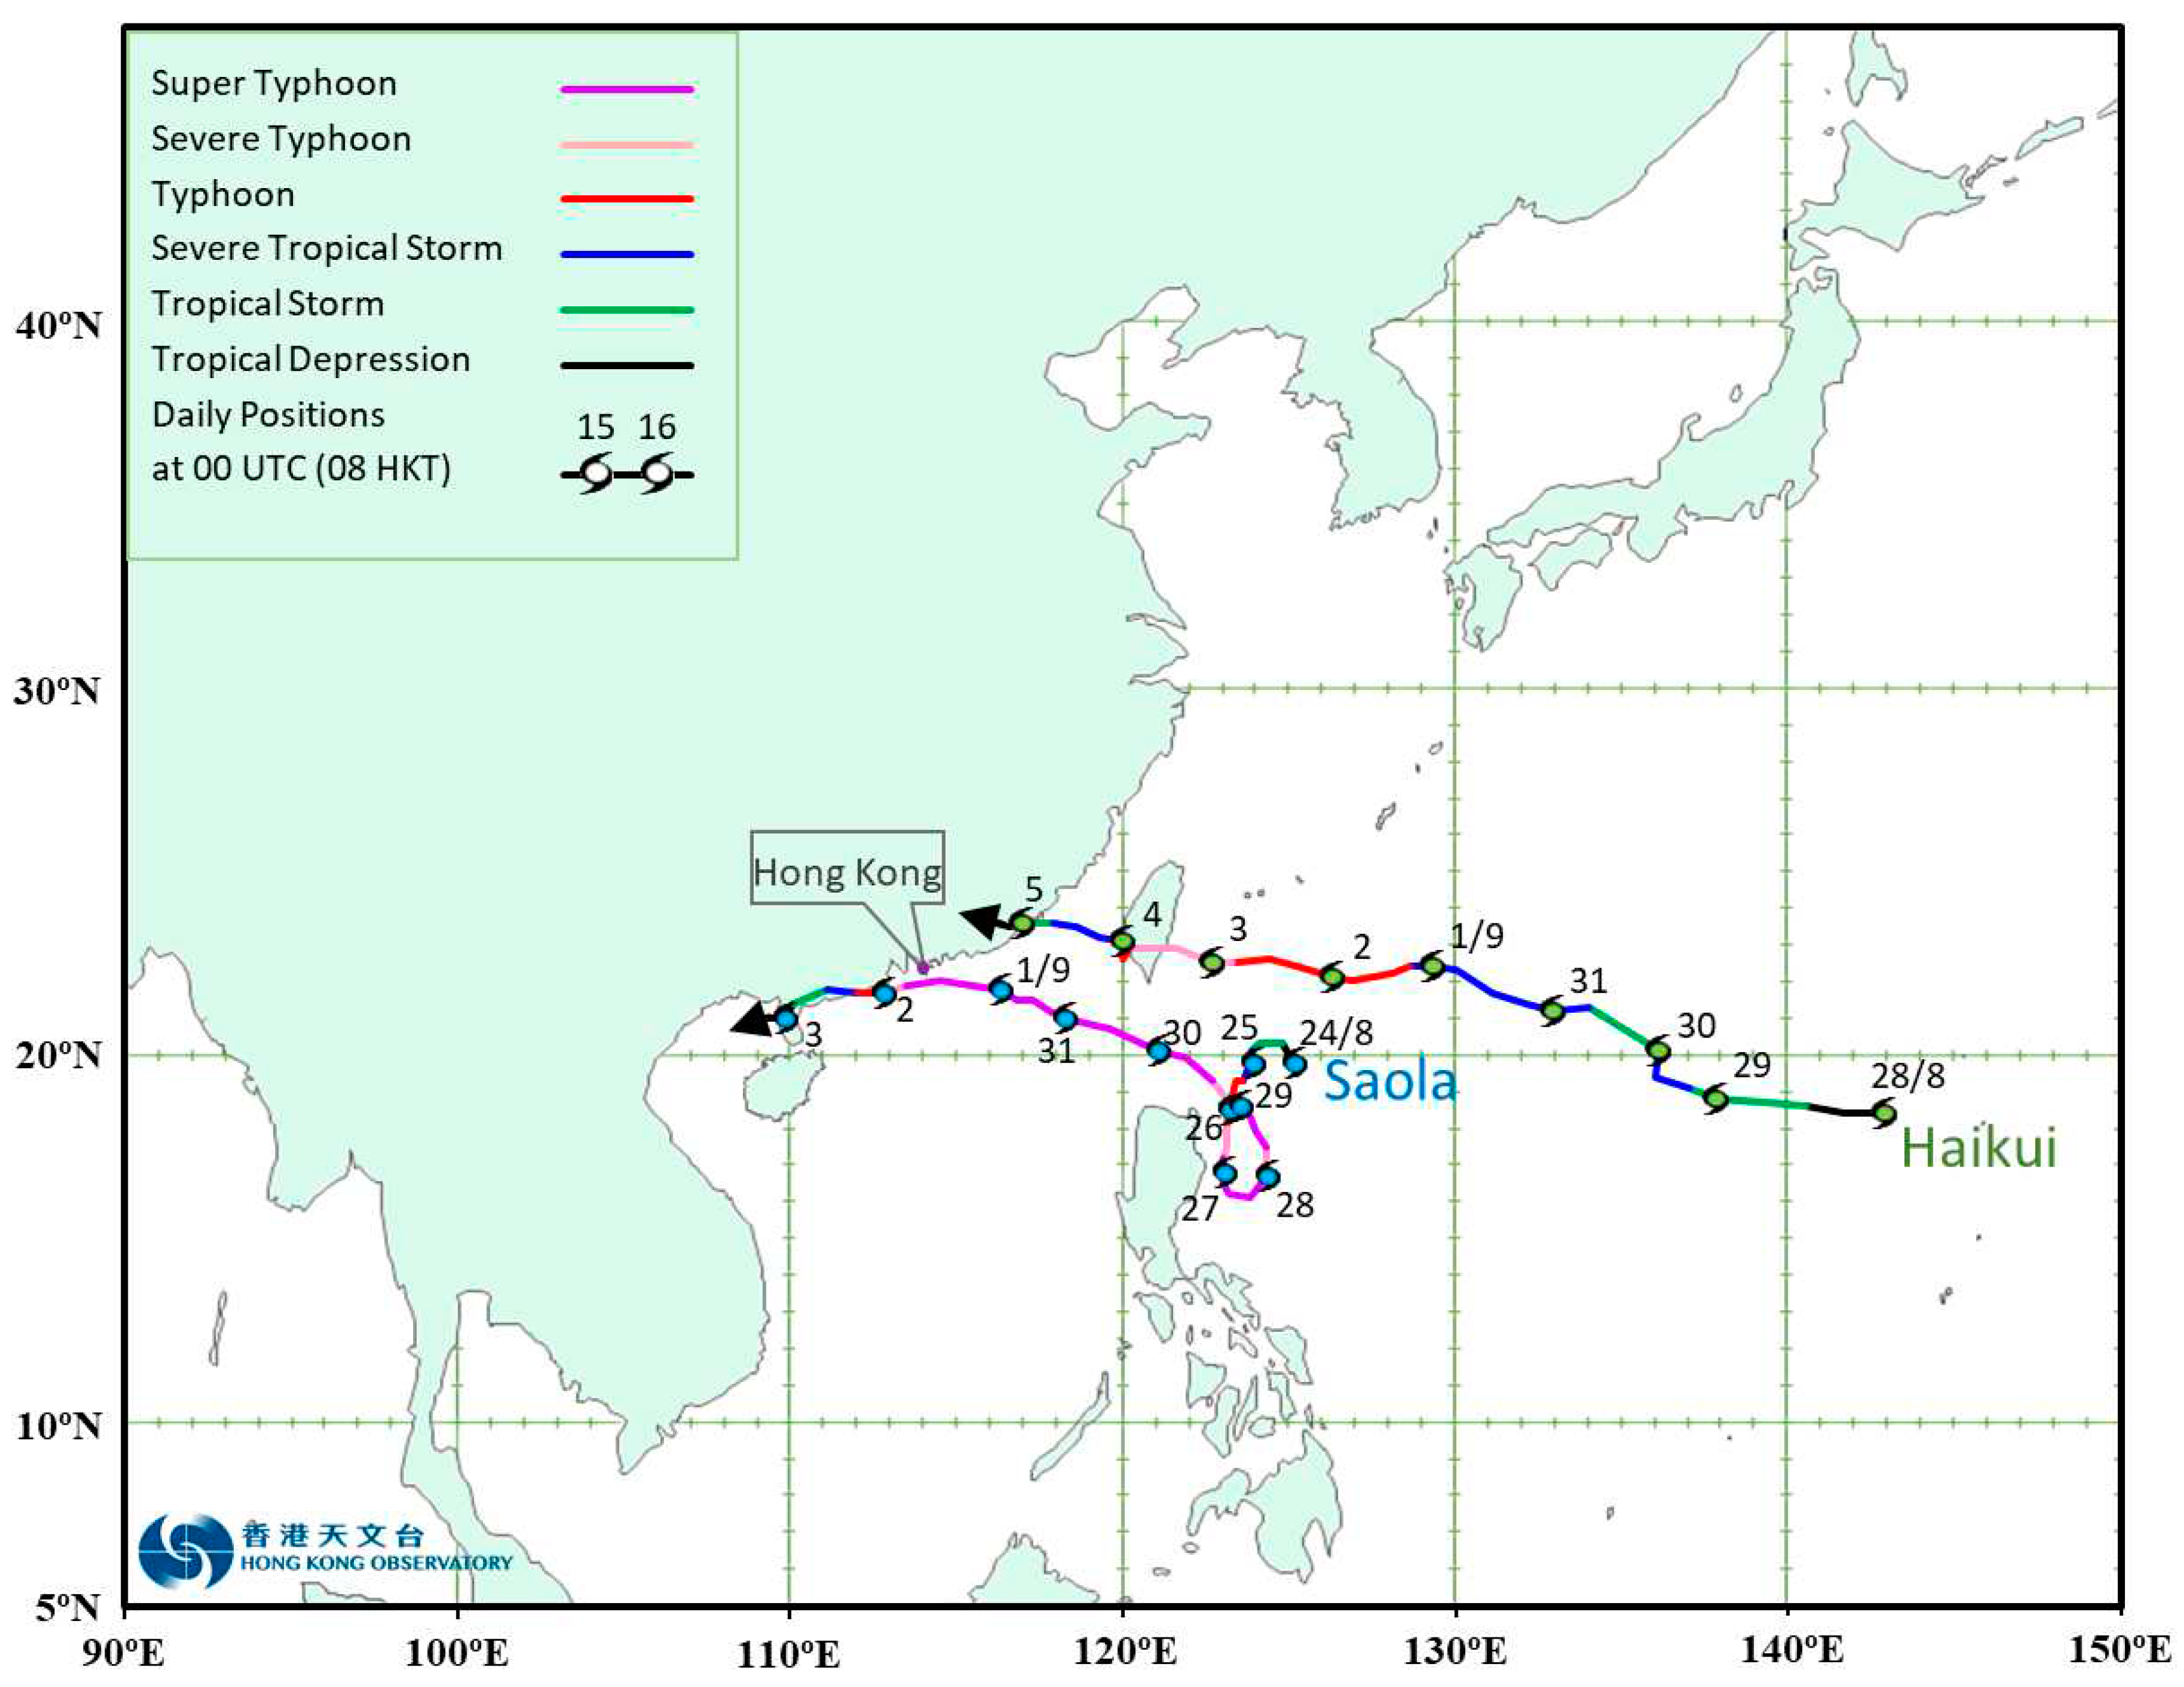
As a reference, the provisional tracks of Saola and Haikui are shown in Figure 1. It turns out that they were never getting together closer than around 1200 km and thus mutual interaction was not materialized at the end. The state-of-the-art numerical models should have the capability of forecasting the tracks and intensities of both tropical cyclones, and this point would be reviewed and discussed in the following section.

Track Forecast

From Figure 1, it could be seen that Saola first moved around in a loop over the seas to the east of Luzon, the Philippines. It then tracked basically west-northwestward towards the Pearl River Estuary. As it got closer to Hong Kong, it gradually took a more westerly track, and later on moved west-southwestwards along the coast of western Guangdong into Beibu Wan before dissipation.
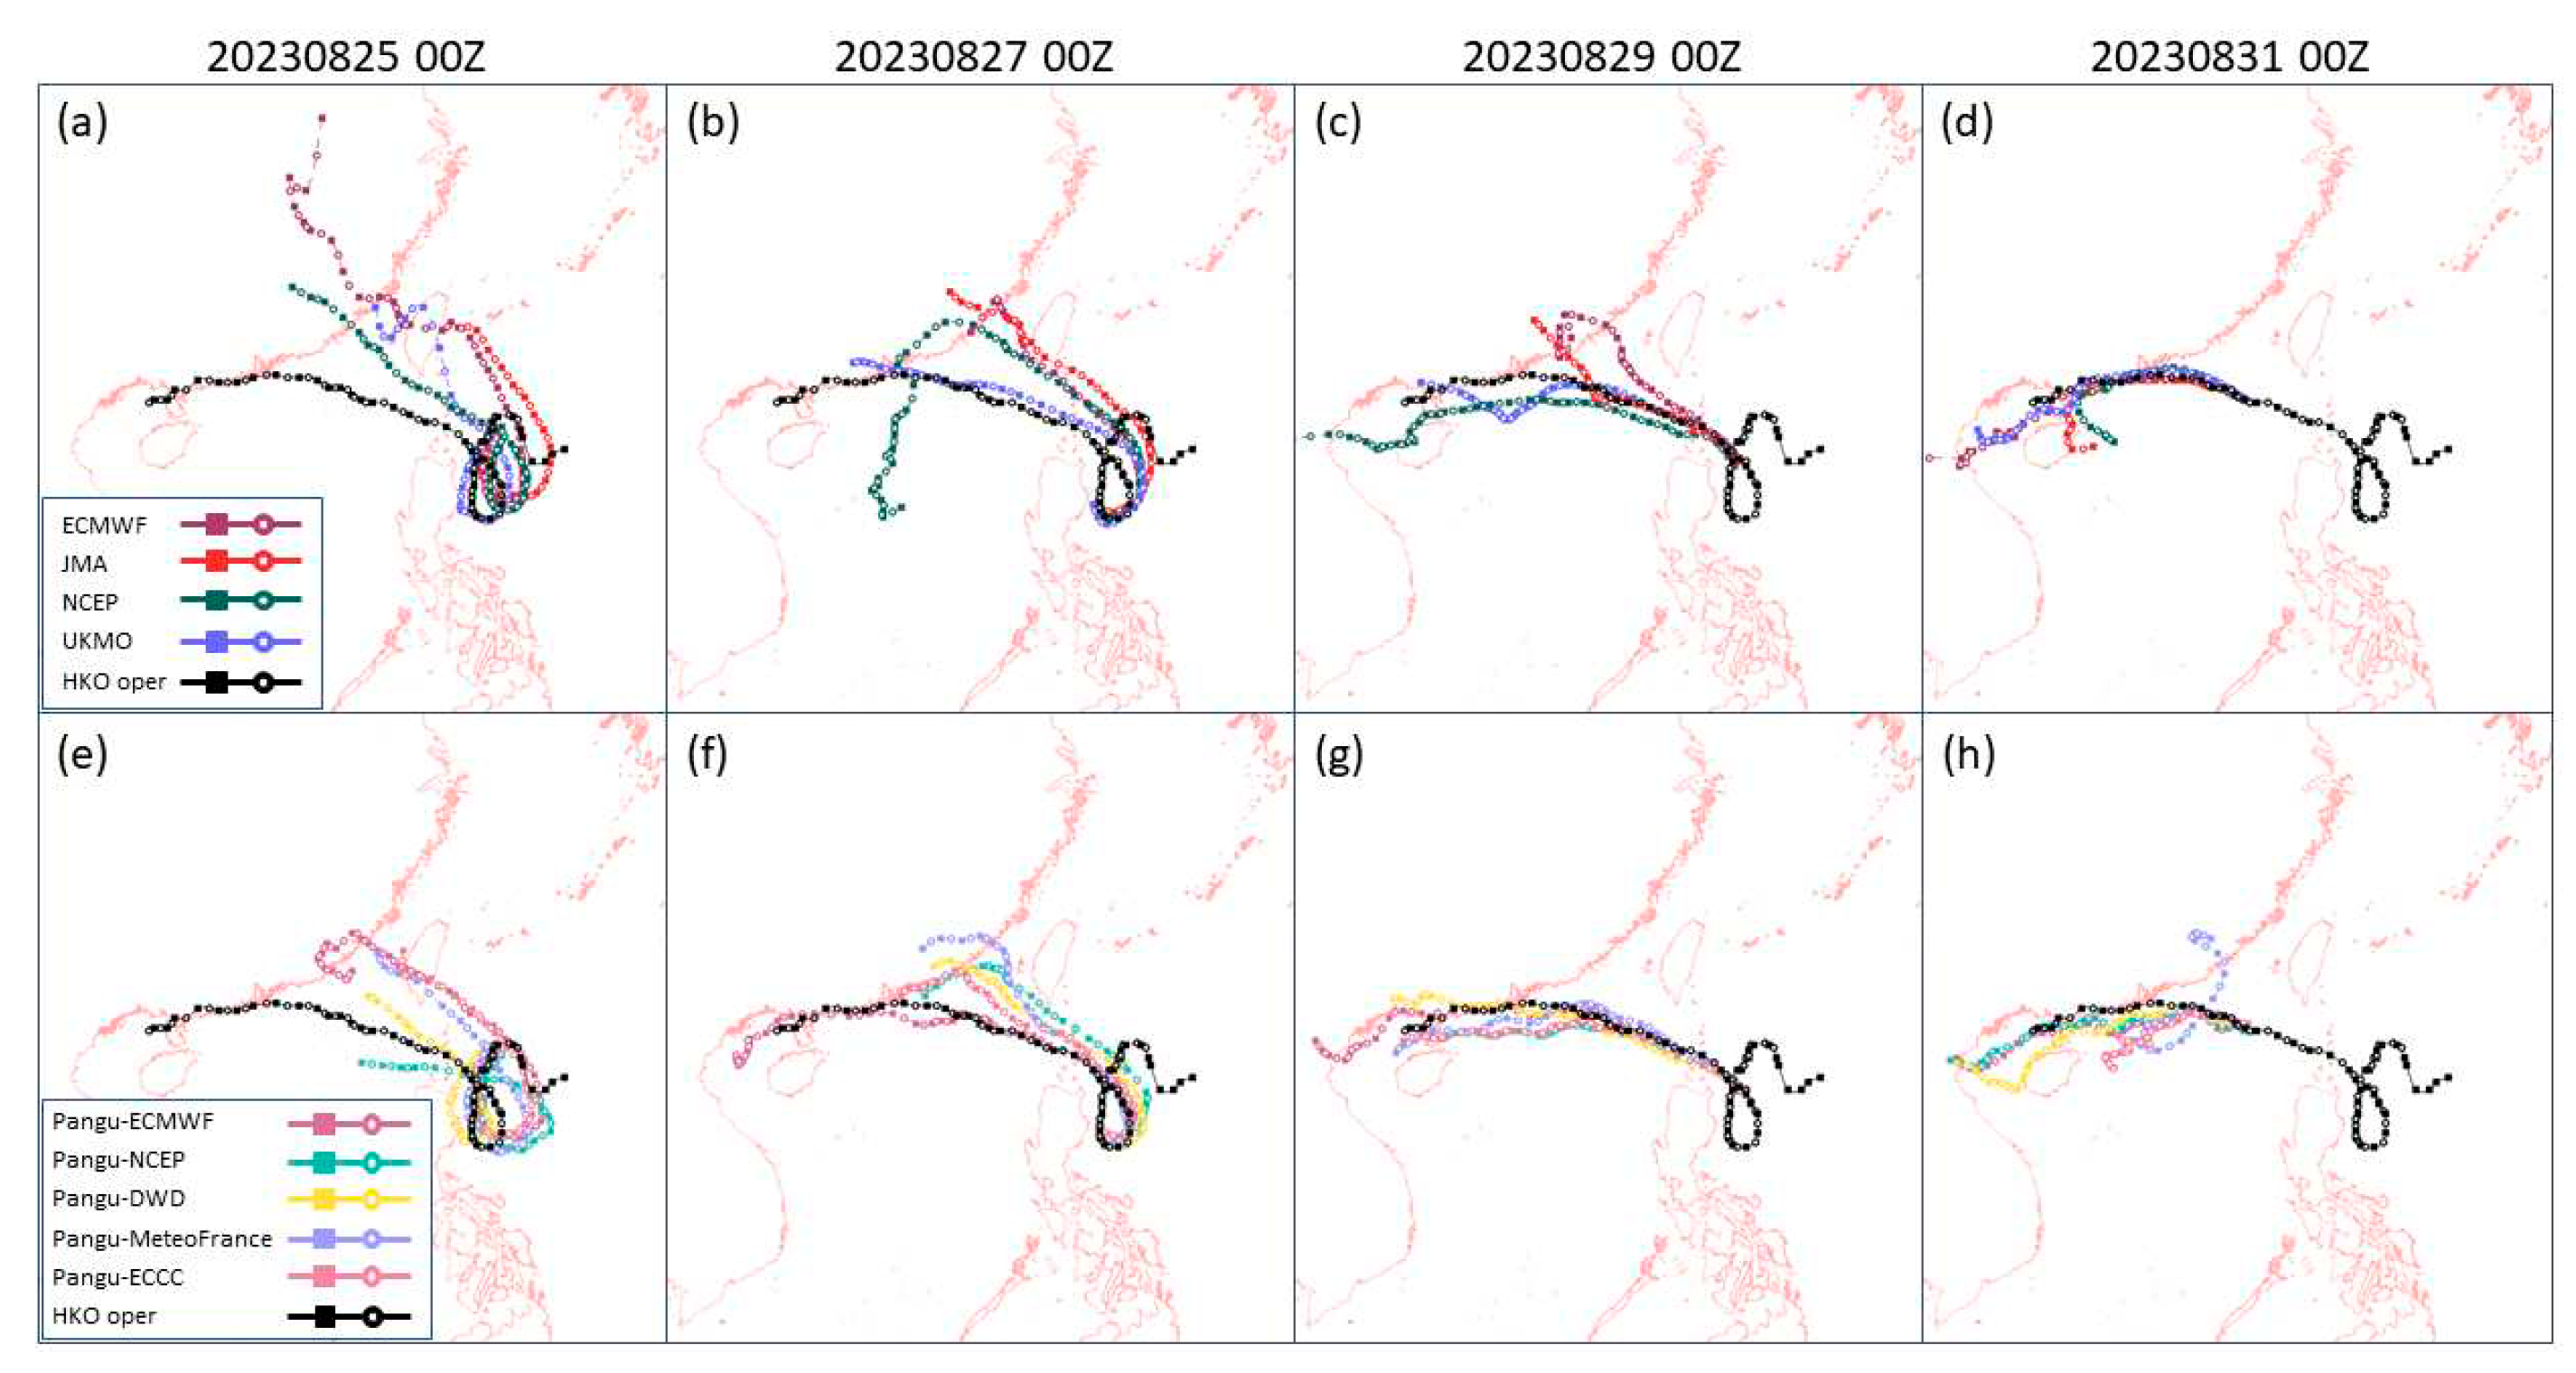
The forecast tracks of the four major global numerical weather prediction models considered in HKO are shown in Figure 2, together with the provisional track of Saola. It could be seen that, when Saola was making the loop to the east of Luzon, all models (Figure 2a) suggested that it would move towards Taiwan and then make landfall over the eastern coast of Guangdong to southern coast of Fujian. Saola would bring little impact to Hong Kong in such scenario. It turns out that all model forecasts differed significantly with the actual track of Saola later. Two days later (Figure 2b), the models basically maintained similar story, in particular paying attention to the track of ECMWF, whereas UKMO started to hint an “alternative” scenario with Saola heading towards the Pearl River Estuary. With 2 more days later (Figure 2c), the models forecast tracks were closer to the Pearl River Estuary, but there were uncertainties about the landfall point, i.e., whether Saola was going to land to the east or to the west of Hong Kong. In the former case, Hong Kong would experience northerly winds, and the impact would be relatively low because Hong Kong’s hilly terrain would reduce the northerly wind strength; the sea fetch would be basically absent for the occurrence of significant storm surge; and Saola would weaken faster due to land interaction. However, in the latter case, local winds would be much stronger (from the sea) and storm surge would be far more significant (long sea fetch). Therefore, with very short lead time of only a few days before Saola getting closer to Hong Kong, its potential impact on the territory was still highly uncertain. Two more days later (Figure 2d), when Saola was located at the northeastern part of the South China Sea, the model forecasts became converging and all pointed towards Hong Kong. The next day, namely, 1 September 2023, would be the first day for the students to go back to school after the summer vacation, and there would be great demand on traffic and considerable concerns of the safety of the young students. Thus the time left for arranging emergency arrangement, just in case Saola would have significant impact on Hong Kong, was extremely limited in this case, as compared with the steadier track and higher confident forecast of Mangkhut several days ahead before affecting Hong Kong Choy et.al (2022b).
The AI based model Pangu-weather was also considered in this case. It had been adopted to run with initial conditions from five numerical weather prediction models’ operational analysis, namely, Pangu-ECMWF, Pangu-NCEP, Pangu-DWD (Deutscher Wetterdienst in Germany), Pangu-MeteoFrance and Pangu-ECCC (Environment and Climate Change Canada). The corresponding Pangu forecasts at the selected days and times are shown in Figure 2e–h. In general, though Pangu models basically forecast landfall of Saola over Taiwan and Fujian at first, it changed story more rapidly so that at 00 UTC, 27 August 2023 (Figure 2f), many Pangu models, in particular the one based on ECMWF analysis, were suggesting Saola’s closer approach to Hong Kong. This piece of information is also critical in the warning strategy for Saola, namely, it gave a heads-up to HKO about the potential movement of Saola to a location rather close to Hong Kong and even making landfall to the west of the territory, which would have much more significant impact to the public safety on 1 September 2023. Two days later (Figure 2g), all Pangu models basically forecasting westward movement of Saola across the south China coastal waters, though they were more southward than the provisional track. Two more days later (Figure 2h), the Pangu models were more divergent, which affected the track accuracy of the Pangu forecast.
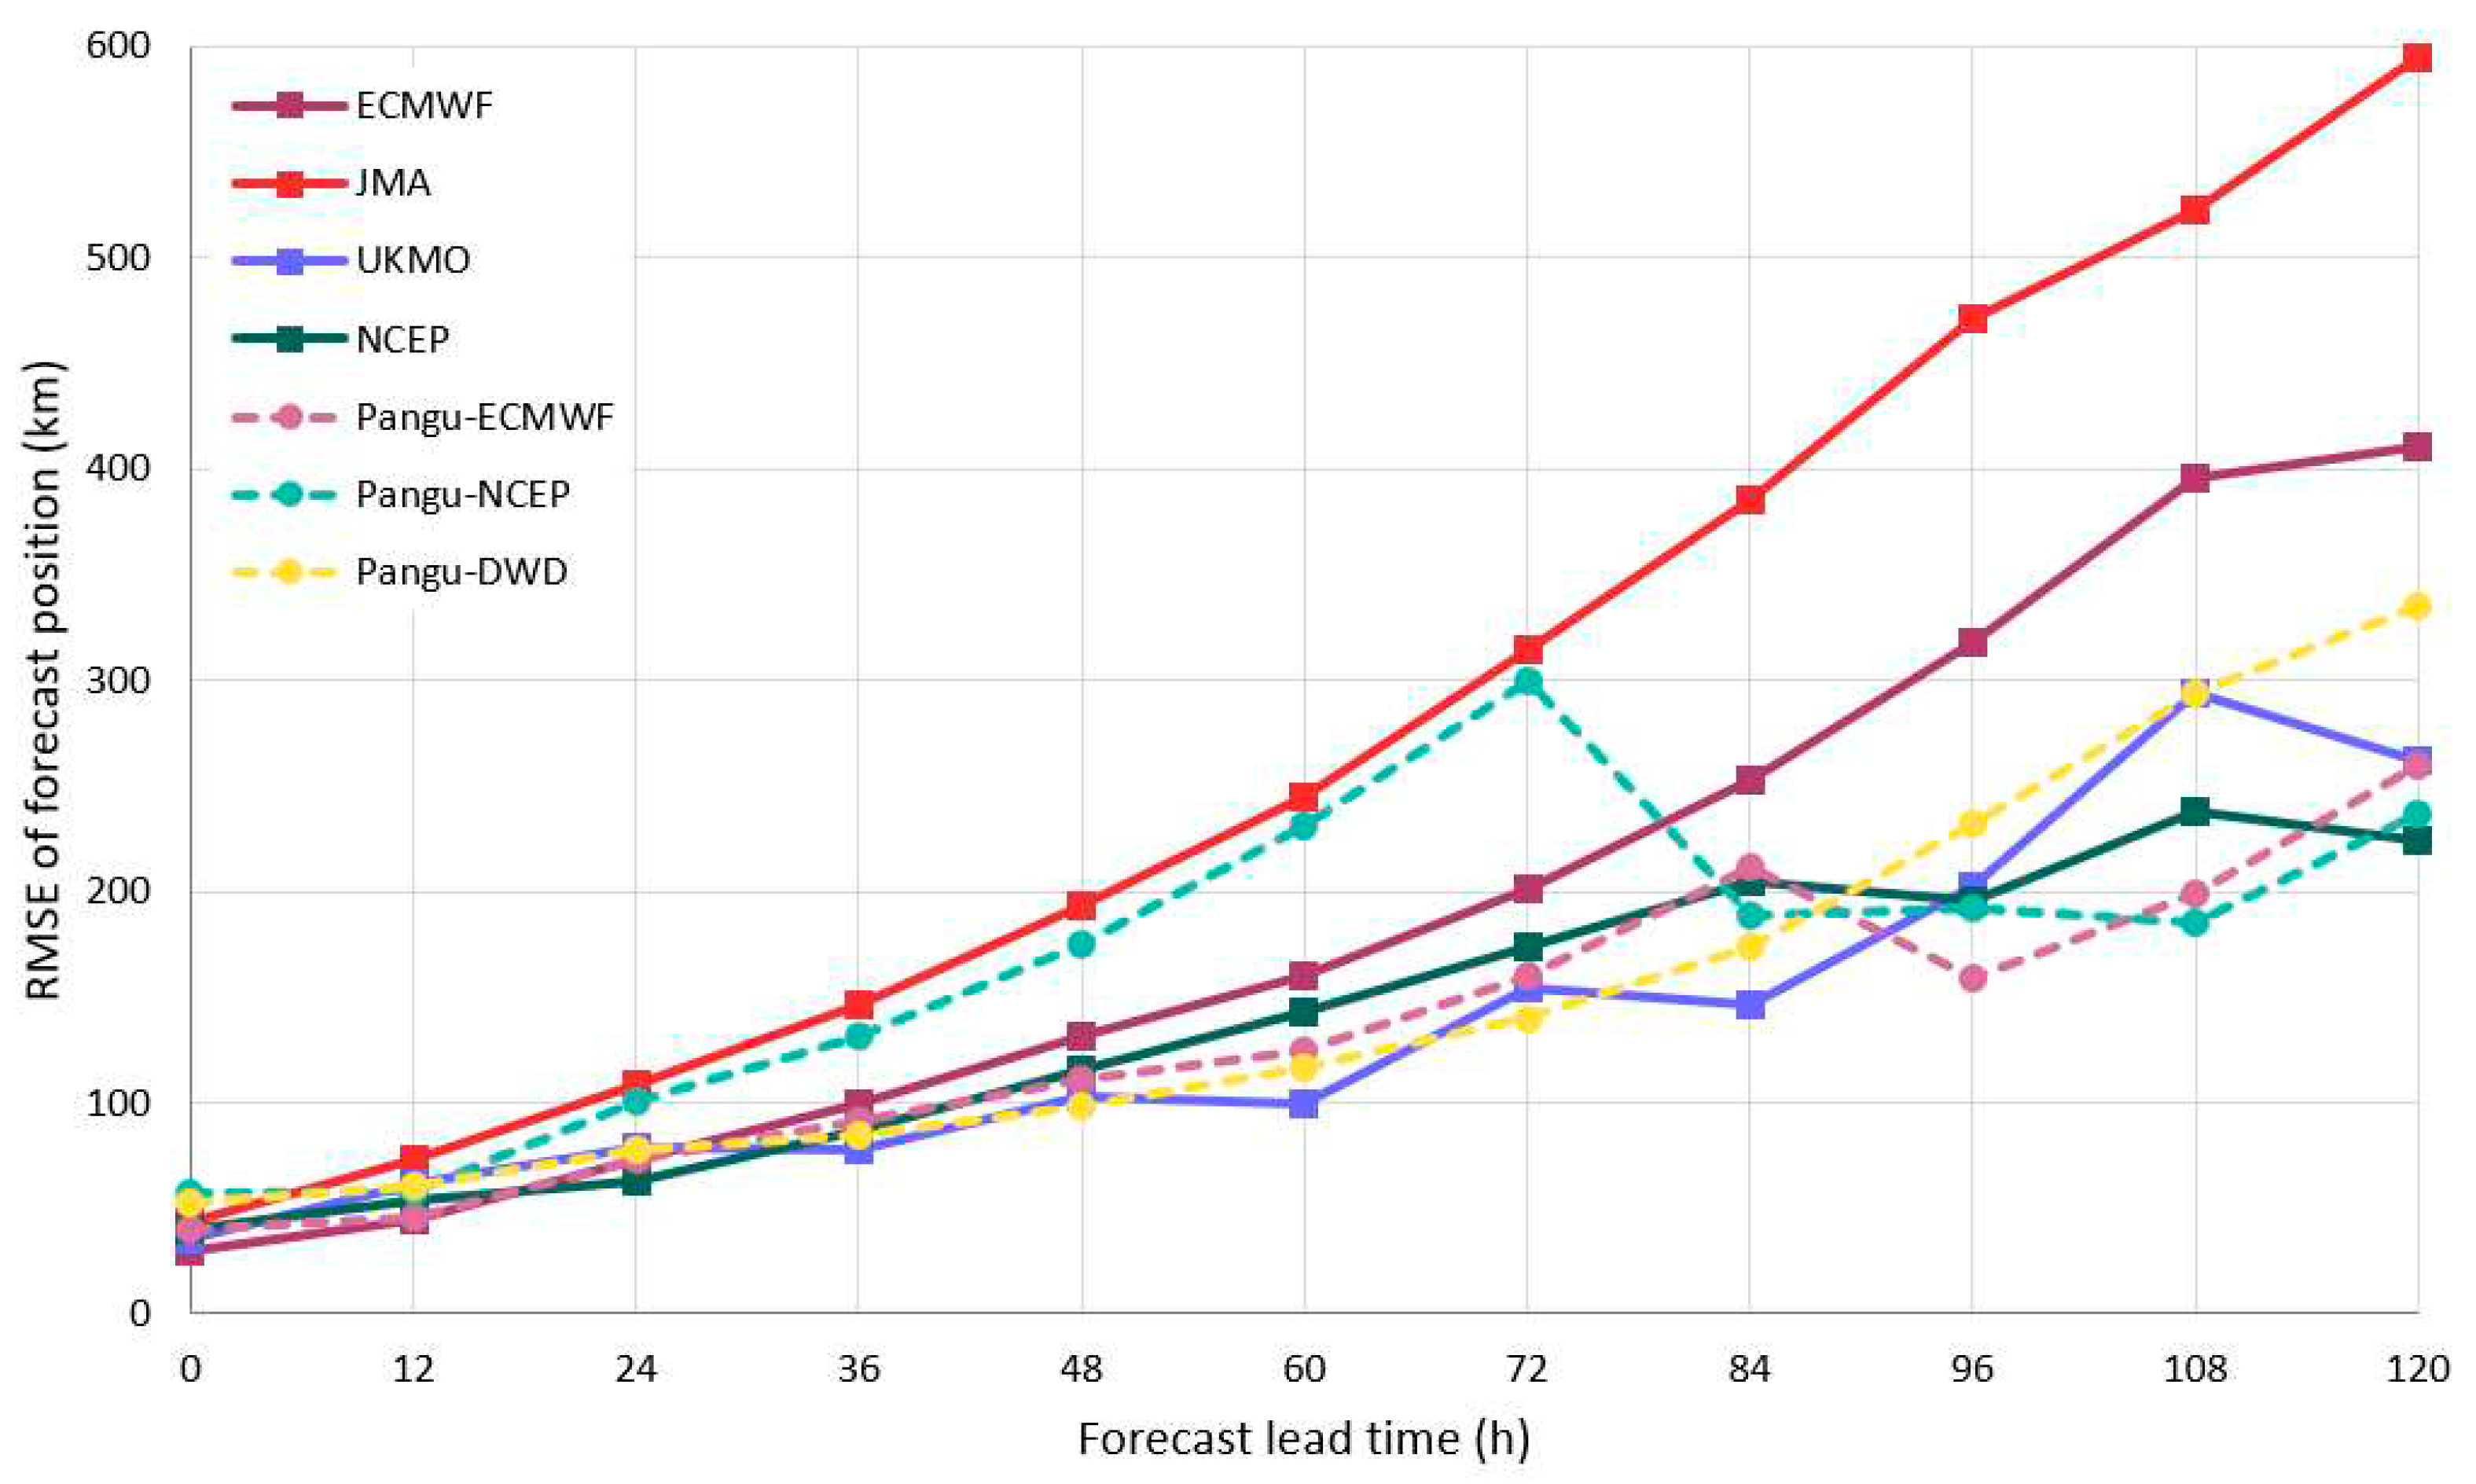
In comparing the deterministic models and Pangu models, in particular for ECMWF, the Pangu model adopted an earlier change of story for Saola heading towards the Pearl River Estuary, so that it had lower track error in the medium range forecast than those of ECMWF, in particular in the medium range from 3 to 5 days. This point is more clearly shown in the time series of forecast track error as given in Figure 3. This result is consistent with the conclusion of Bi et al. (2023) that Pangu-weather could outperform traditional numerical models. Our preliminary hindcast study found that Pangu-weather outperformed traditional numerical models in predicting the track of tropical cyclones in South China Sea and western North Pacific in past couple of years. As shown in Figure 3, among the deterministic models, JMA had the worst performance for Saola while NCEP and UKMO had better performance. ECMWF was sort of in the middle, and had larger error than the corresponding Pangu model initialized by the same analysis.
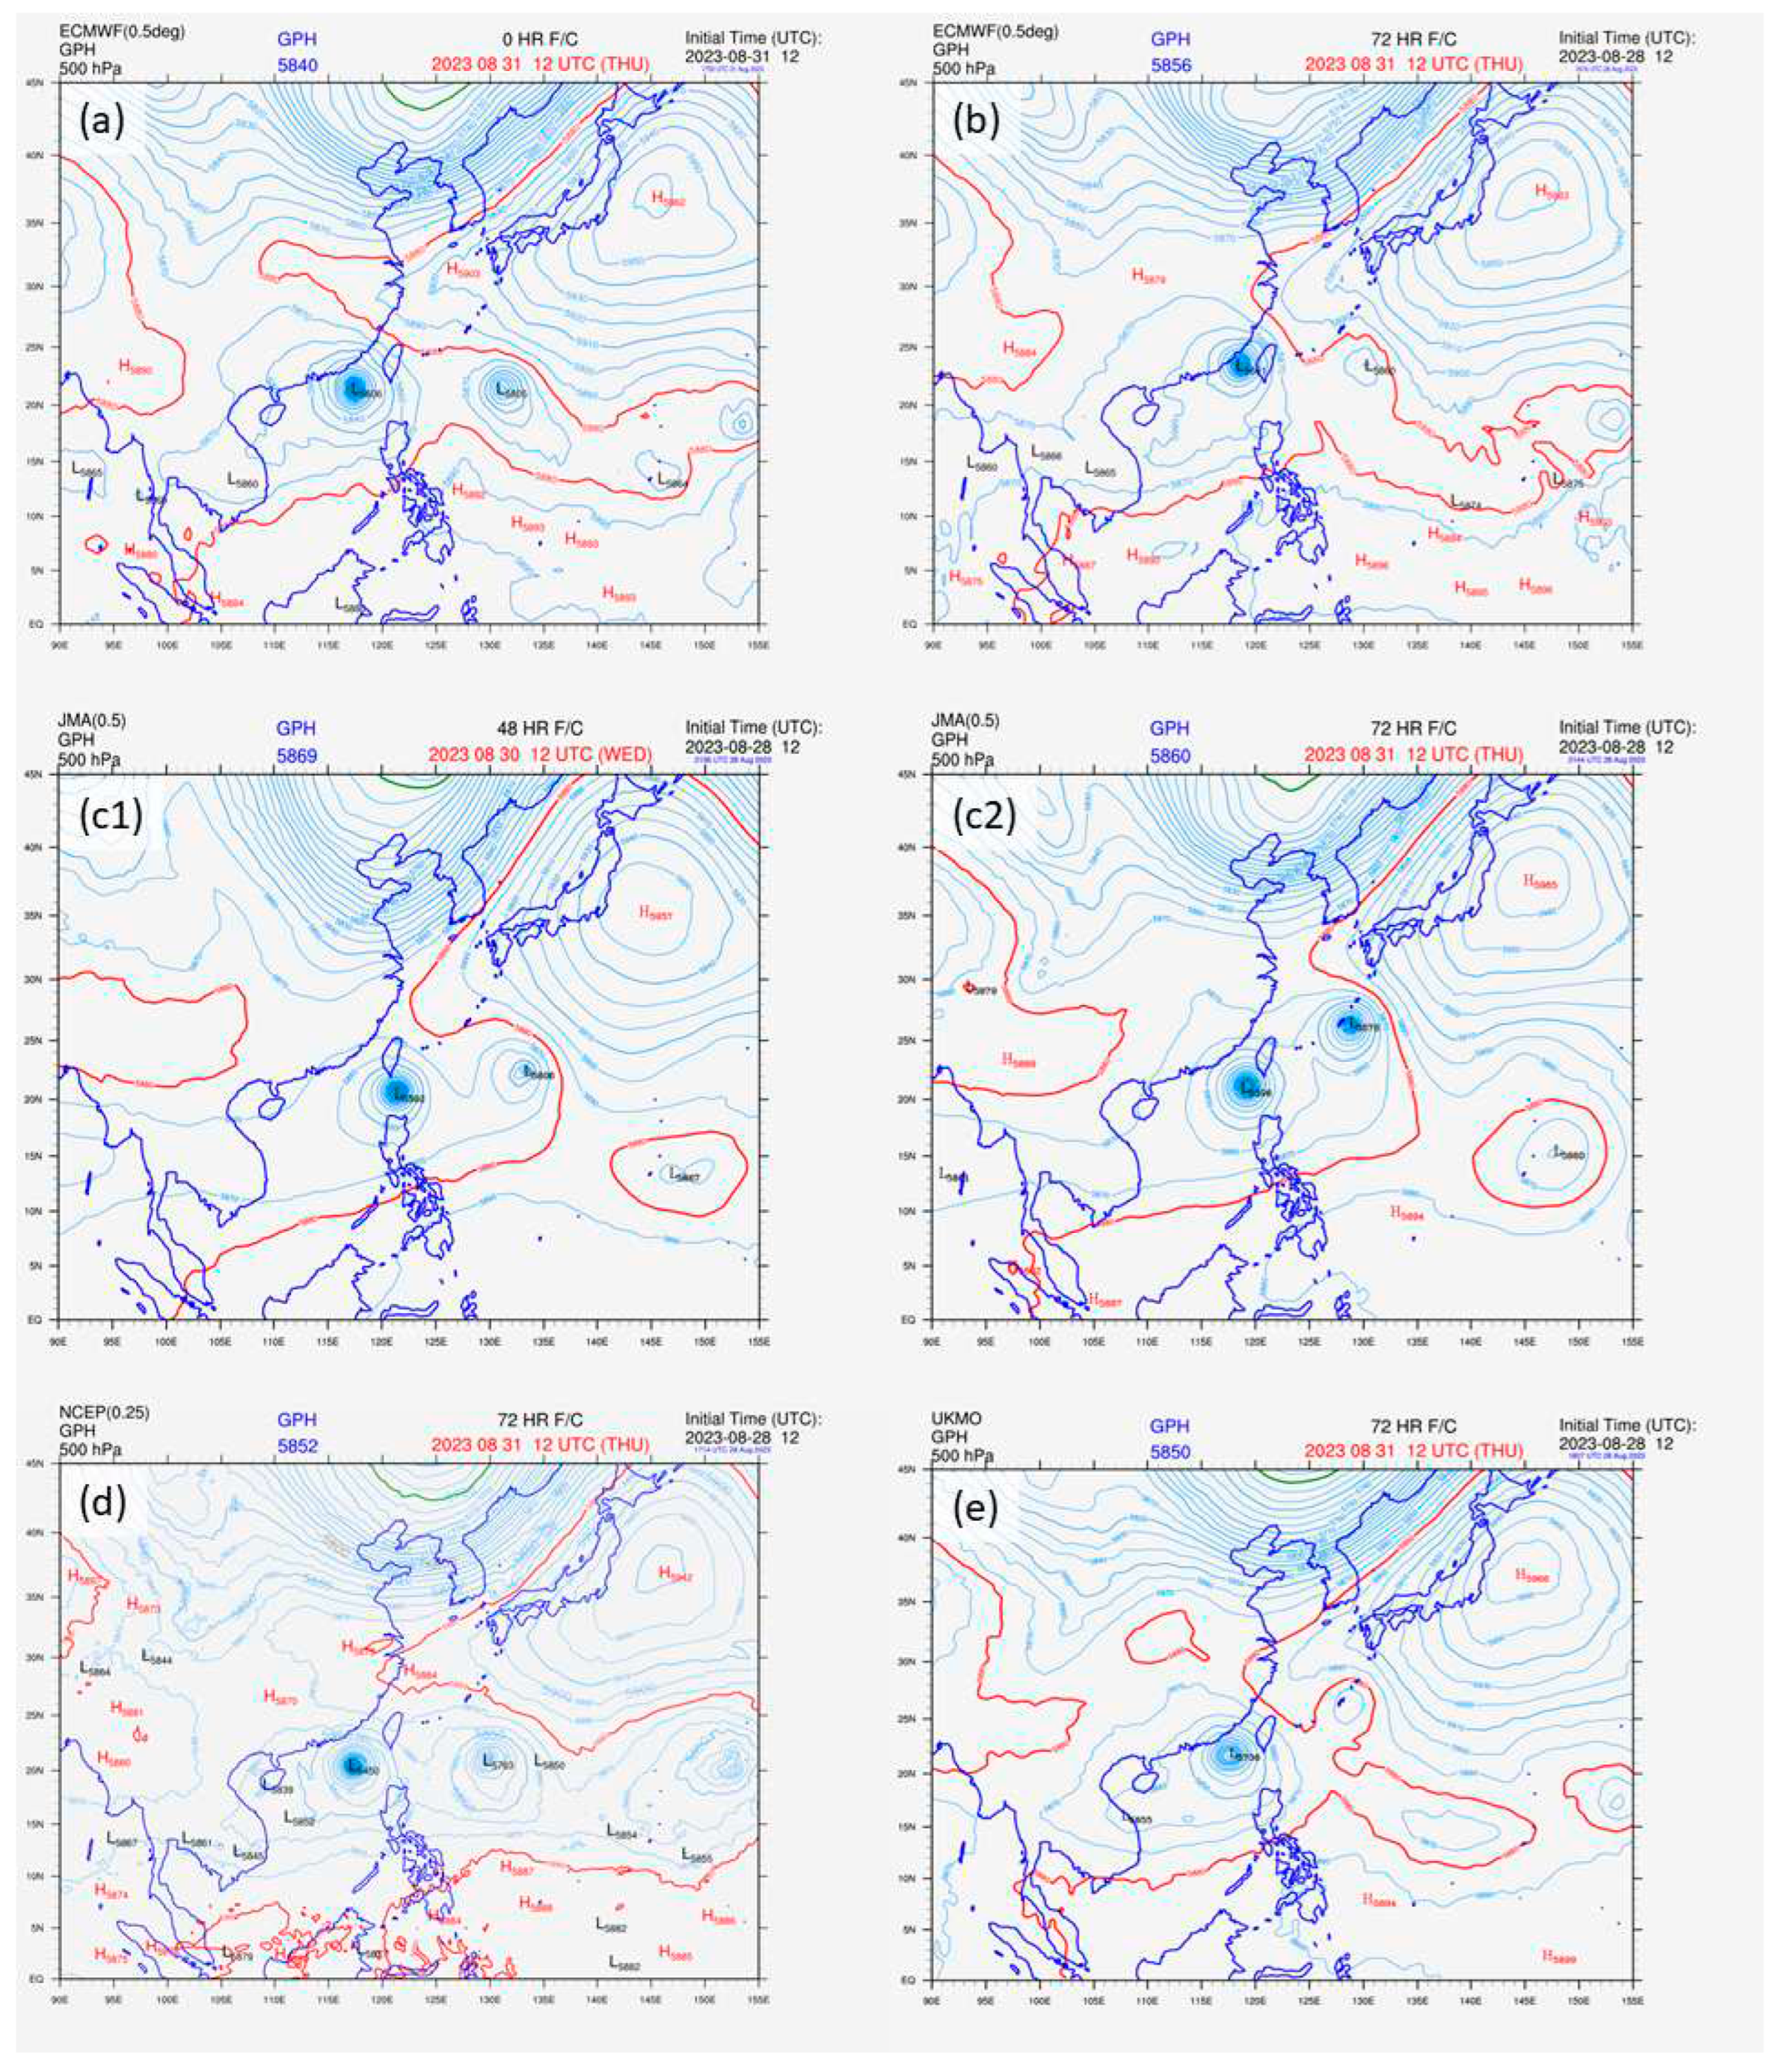
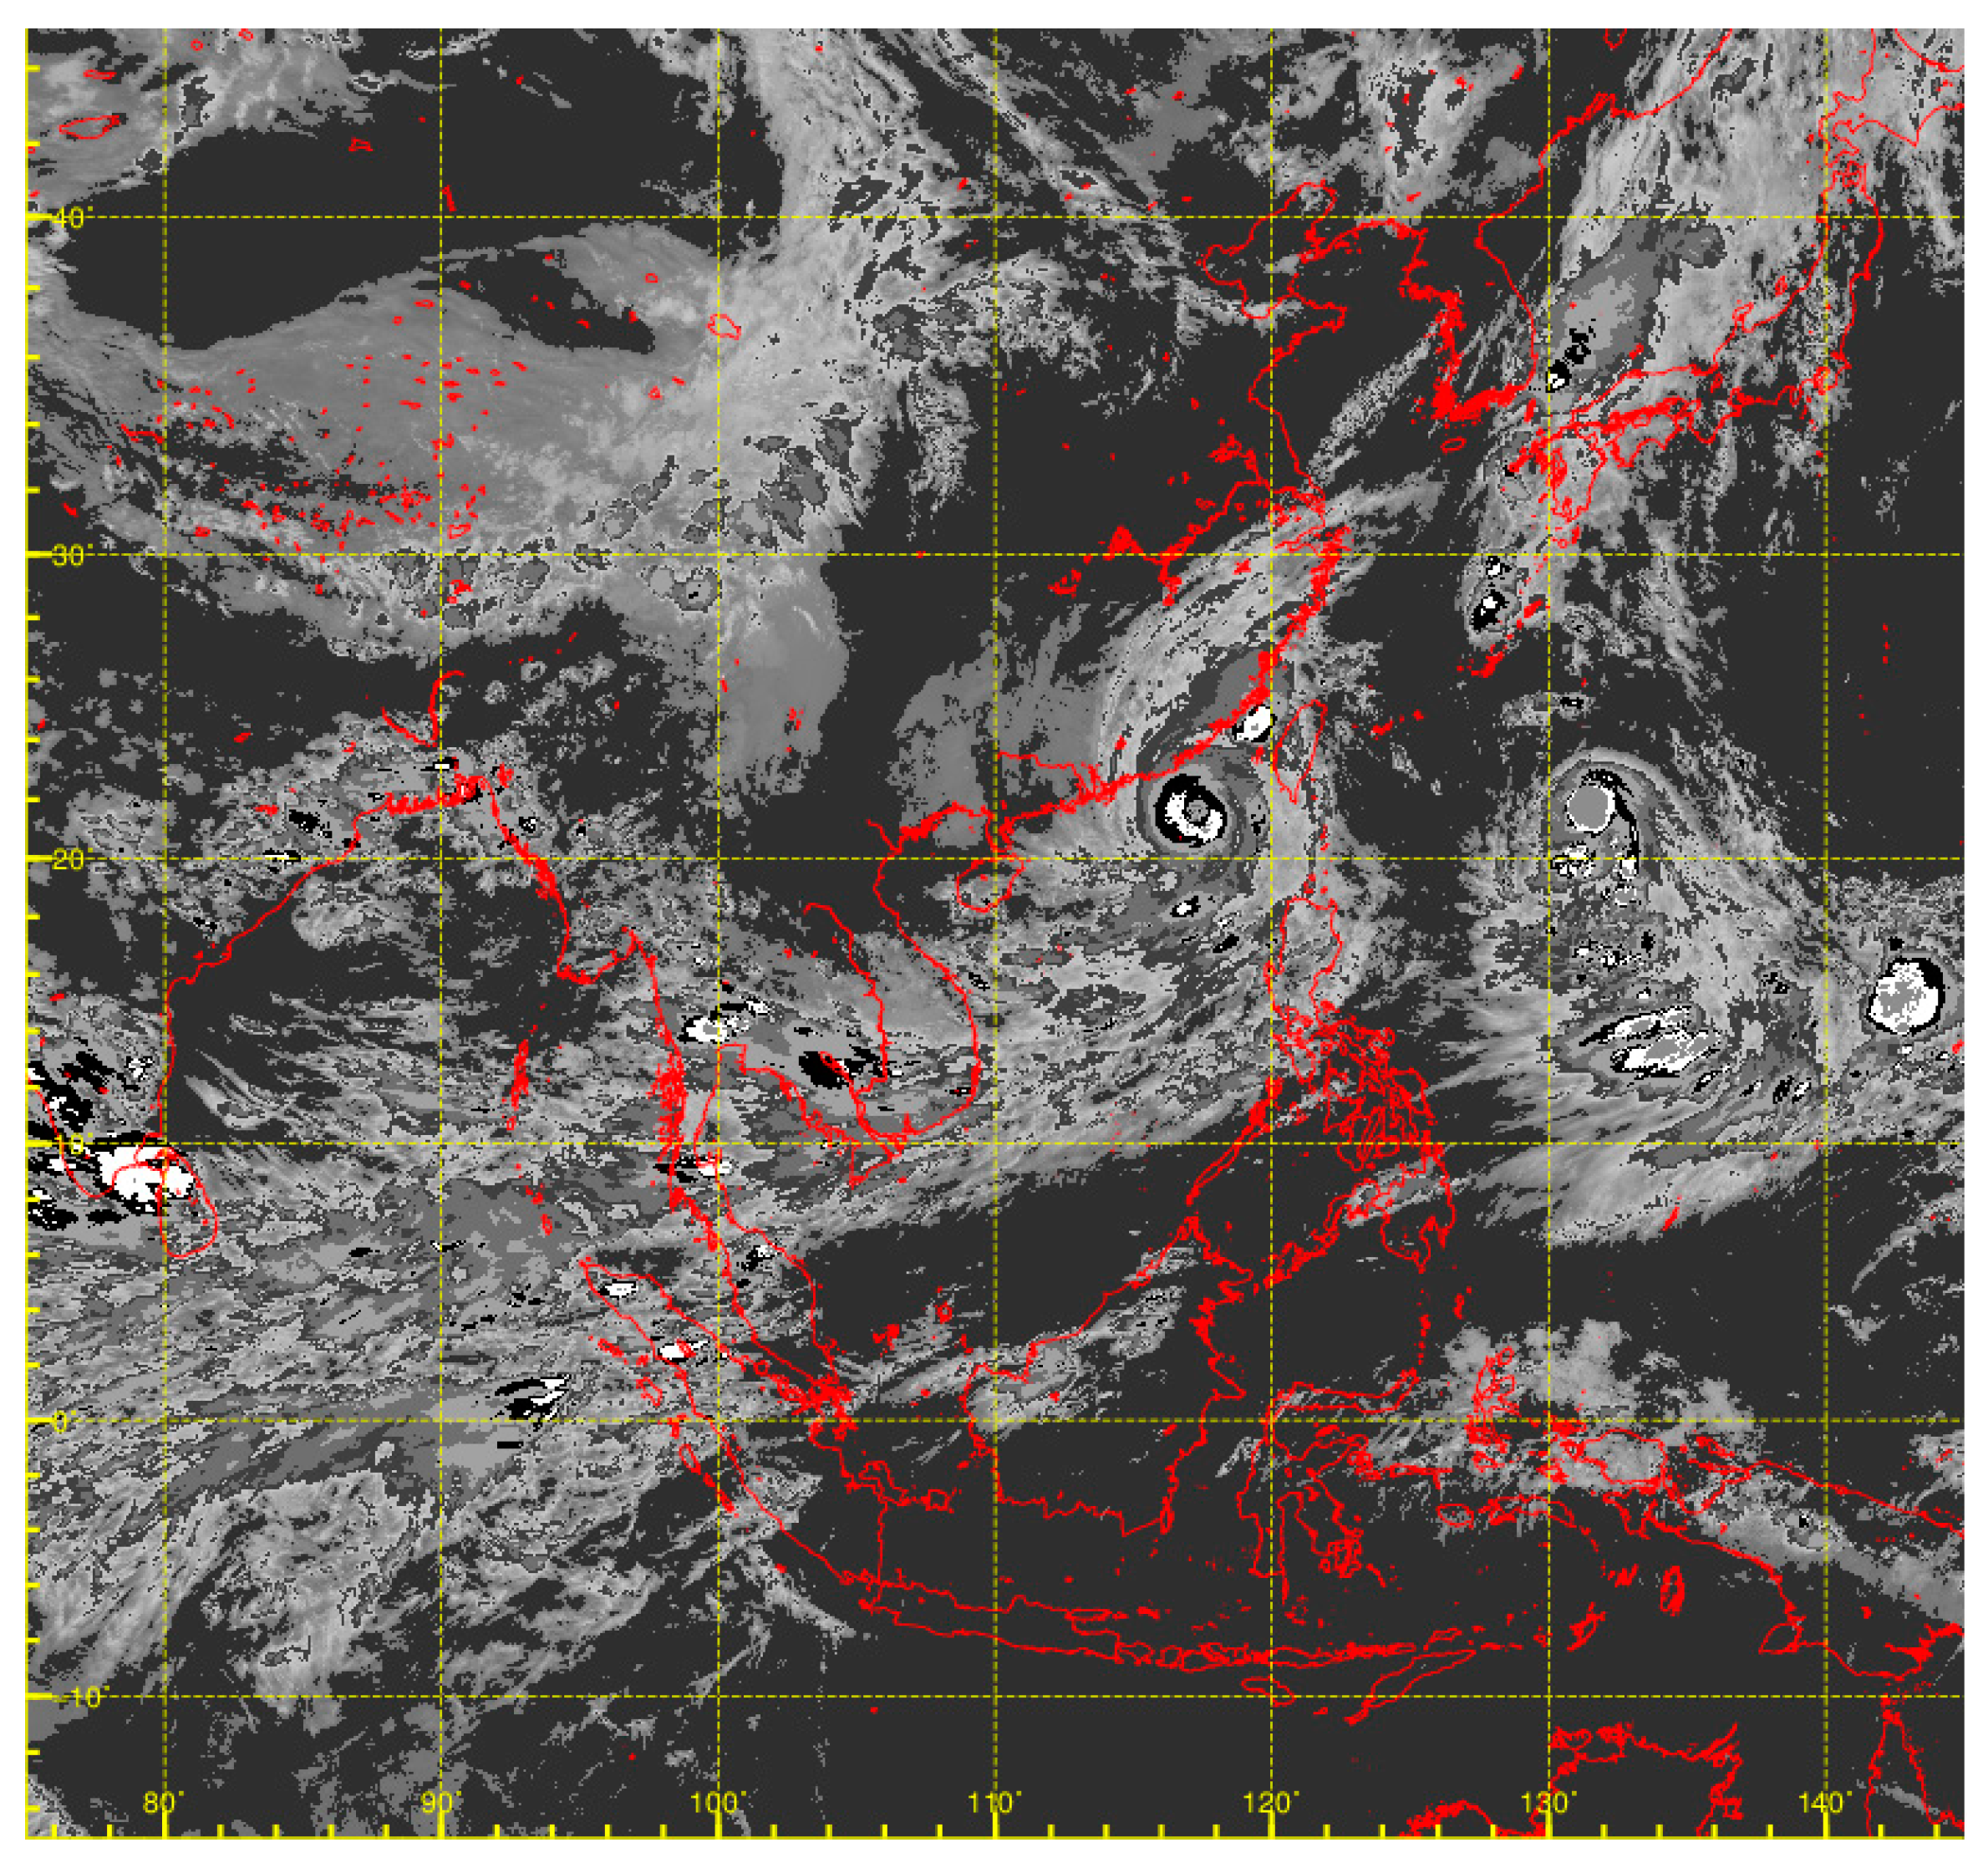
To demonstrate the reasons for the various track errors, the 500 hPa field of the various deterministic models valid for 12 UTC, 31 August 2023 based on 72-hour forecasts initialized at 12 UTC, 28 August 2023 are analyzed. The analysis of 500 hPa geopotential height from operational deterministic ECMWF model is shown in Figure 4a, and the corresponding infrared satellite picture in Dvorak colouring scheme is shown in Figure 5. It could be seen that the subtropical ridge extended into the eastern part of China, with two tropical cyclones, namely, Saola and Haikui, at the southern frank of the ridge without mutual interaction. Considering the 500 hPa field and the satellite imagery, Saola was slightly larger than Haikui in terms of the circulation and the cloud band coverage.
The 72-hour forecast of ECMWF is shown in Figure 4b. It is not doing a good job in the sense that the subtropical ridge is not extending far enough into the inland areas of eastern China and the circulation of Haikui is too weak. As such, Saola is forecast to move northwestward along the southwestern periphery of the subtropical ridge and make landfall over Fujian. For JMA (Figure 4(c1) and (c2), the two cyclones are forecast to get too close together and lead to mutual interaction. This “mutual interaction scenario” persisted in JMA’s subsequent forecast runs up to 31 August 2023, making it a less credible model. For NCEP (Figure 4d), the ridge extension and the two cyclones are forecast rather well as compared with actual observations, and thus NCEP had a much lower forecast track error for Saola in this case. However, the ridge is slightly stronger and has greater spatial coverage than actuality, so that NCEP’s forecast track for Saola was located further south to the southern coast of China, underestimated Saola’s impact on Hong Kong than what actually happened later. UKMO has a more accurate forecast for the location of Saola (Figure 4e), though its forecast of Haikui is a bust. From the above observations, though some numerical models have lower track forecast errors, their 500 hPa patterns have still rather significant difference from the analysis.
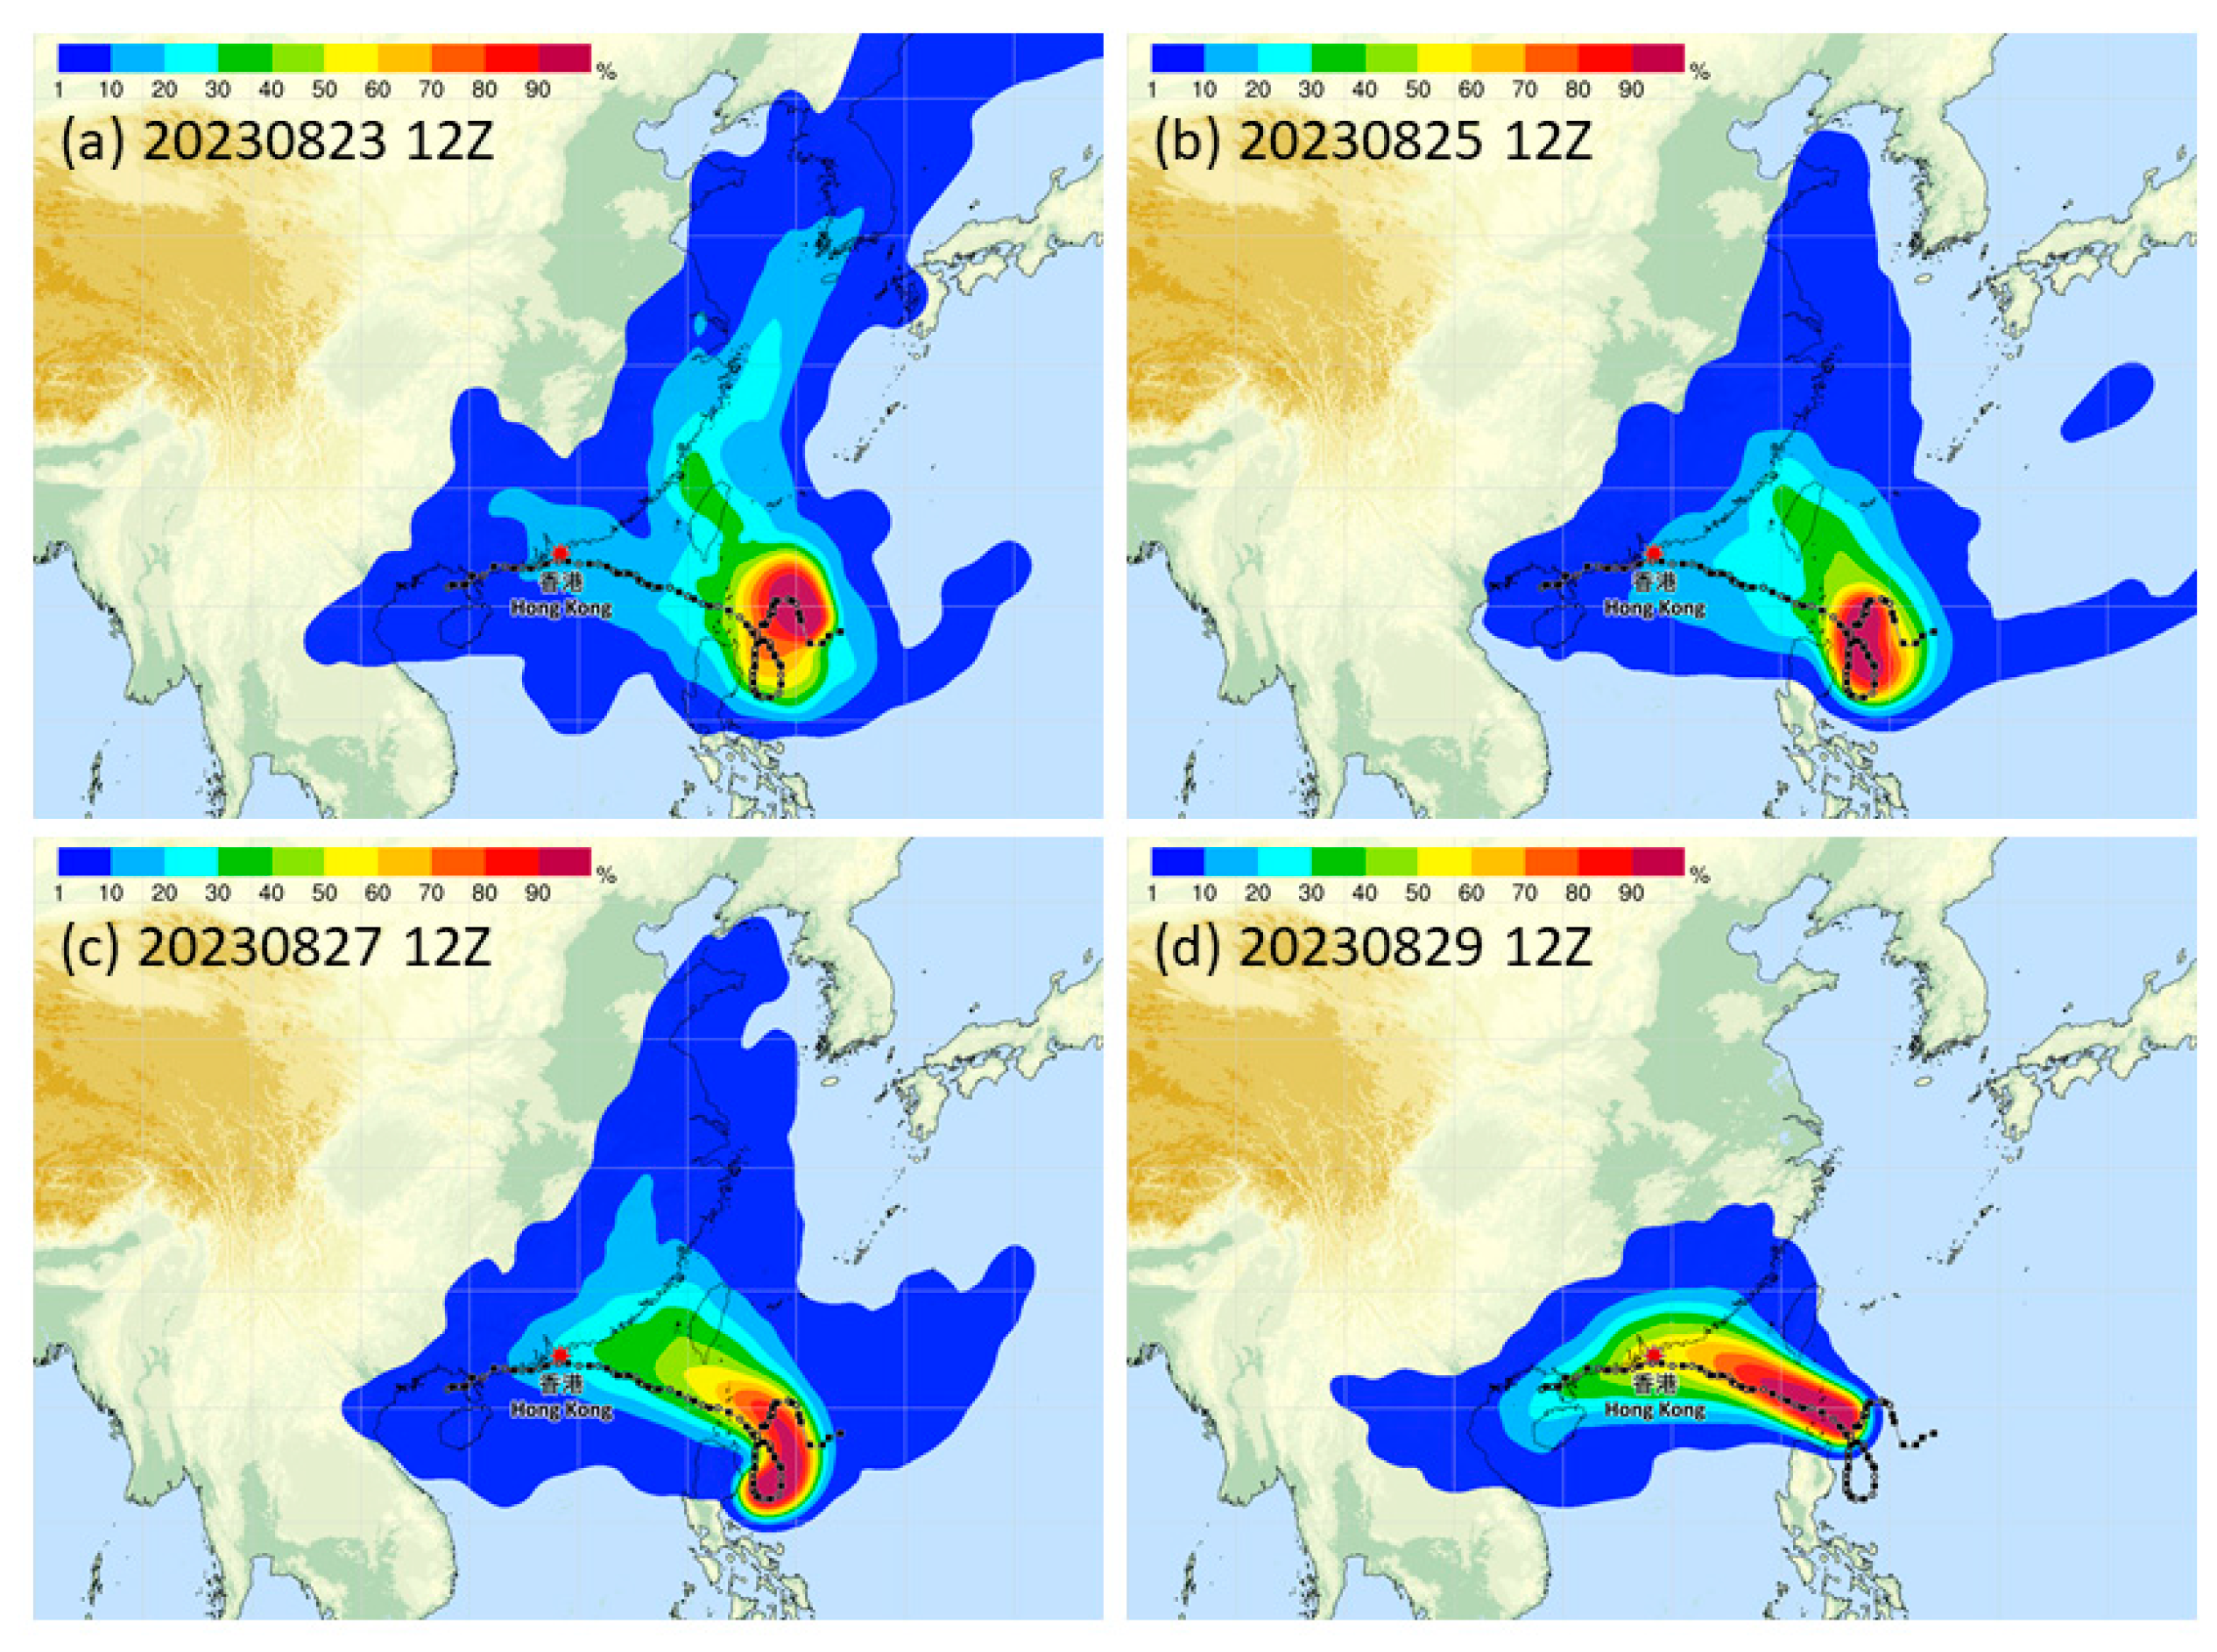
In operational weather forecasting of HKO, the ensemble prediction system (EPS) forecasts of ECMWF, NCEP and UKMO are also considered. They are combined into a strike probabilistic map and examples are shown in Figure 6. The forecasts at four different times are shown. It is interesting to note that, for earlier forecasts (Figure 6a,b), though the “mainstream” forecast is for Saola to head towards Taiwan, the “alternative scenario” for Saola to move towards Hong Kong turns out to be the correct answer. The models are more converging in the latter runs (Figure 6c,d).

Intensity Forecast

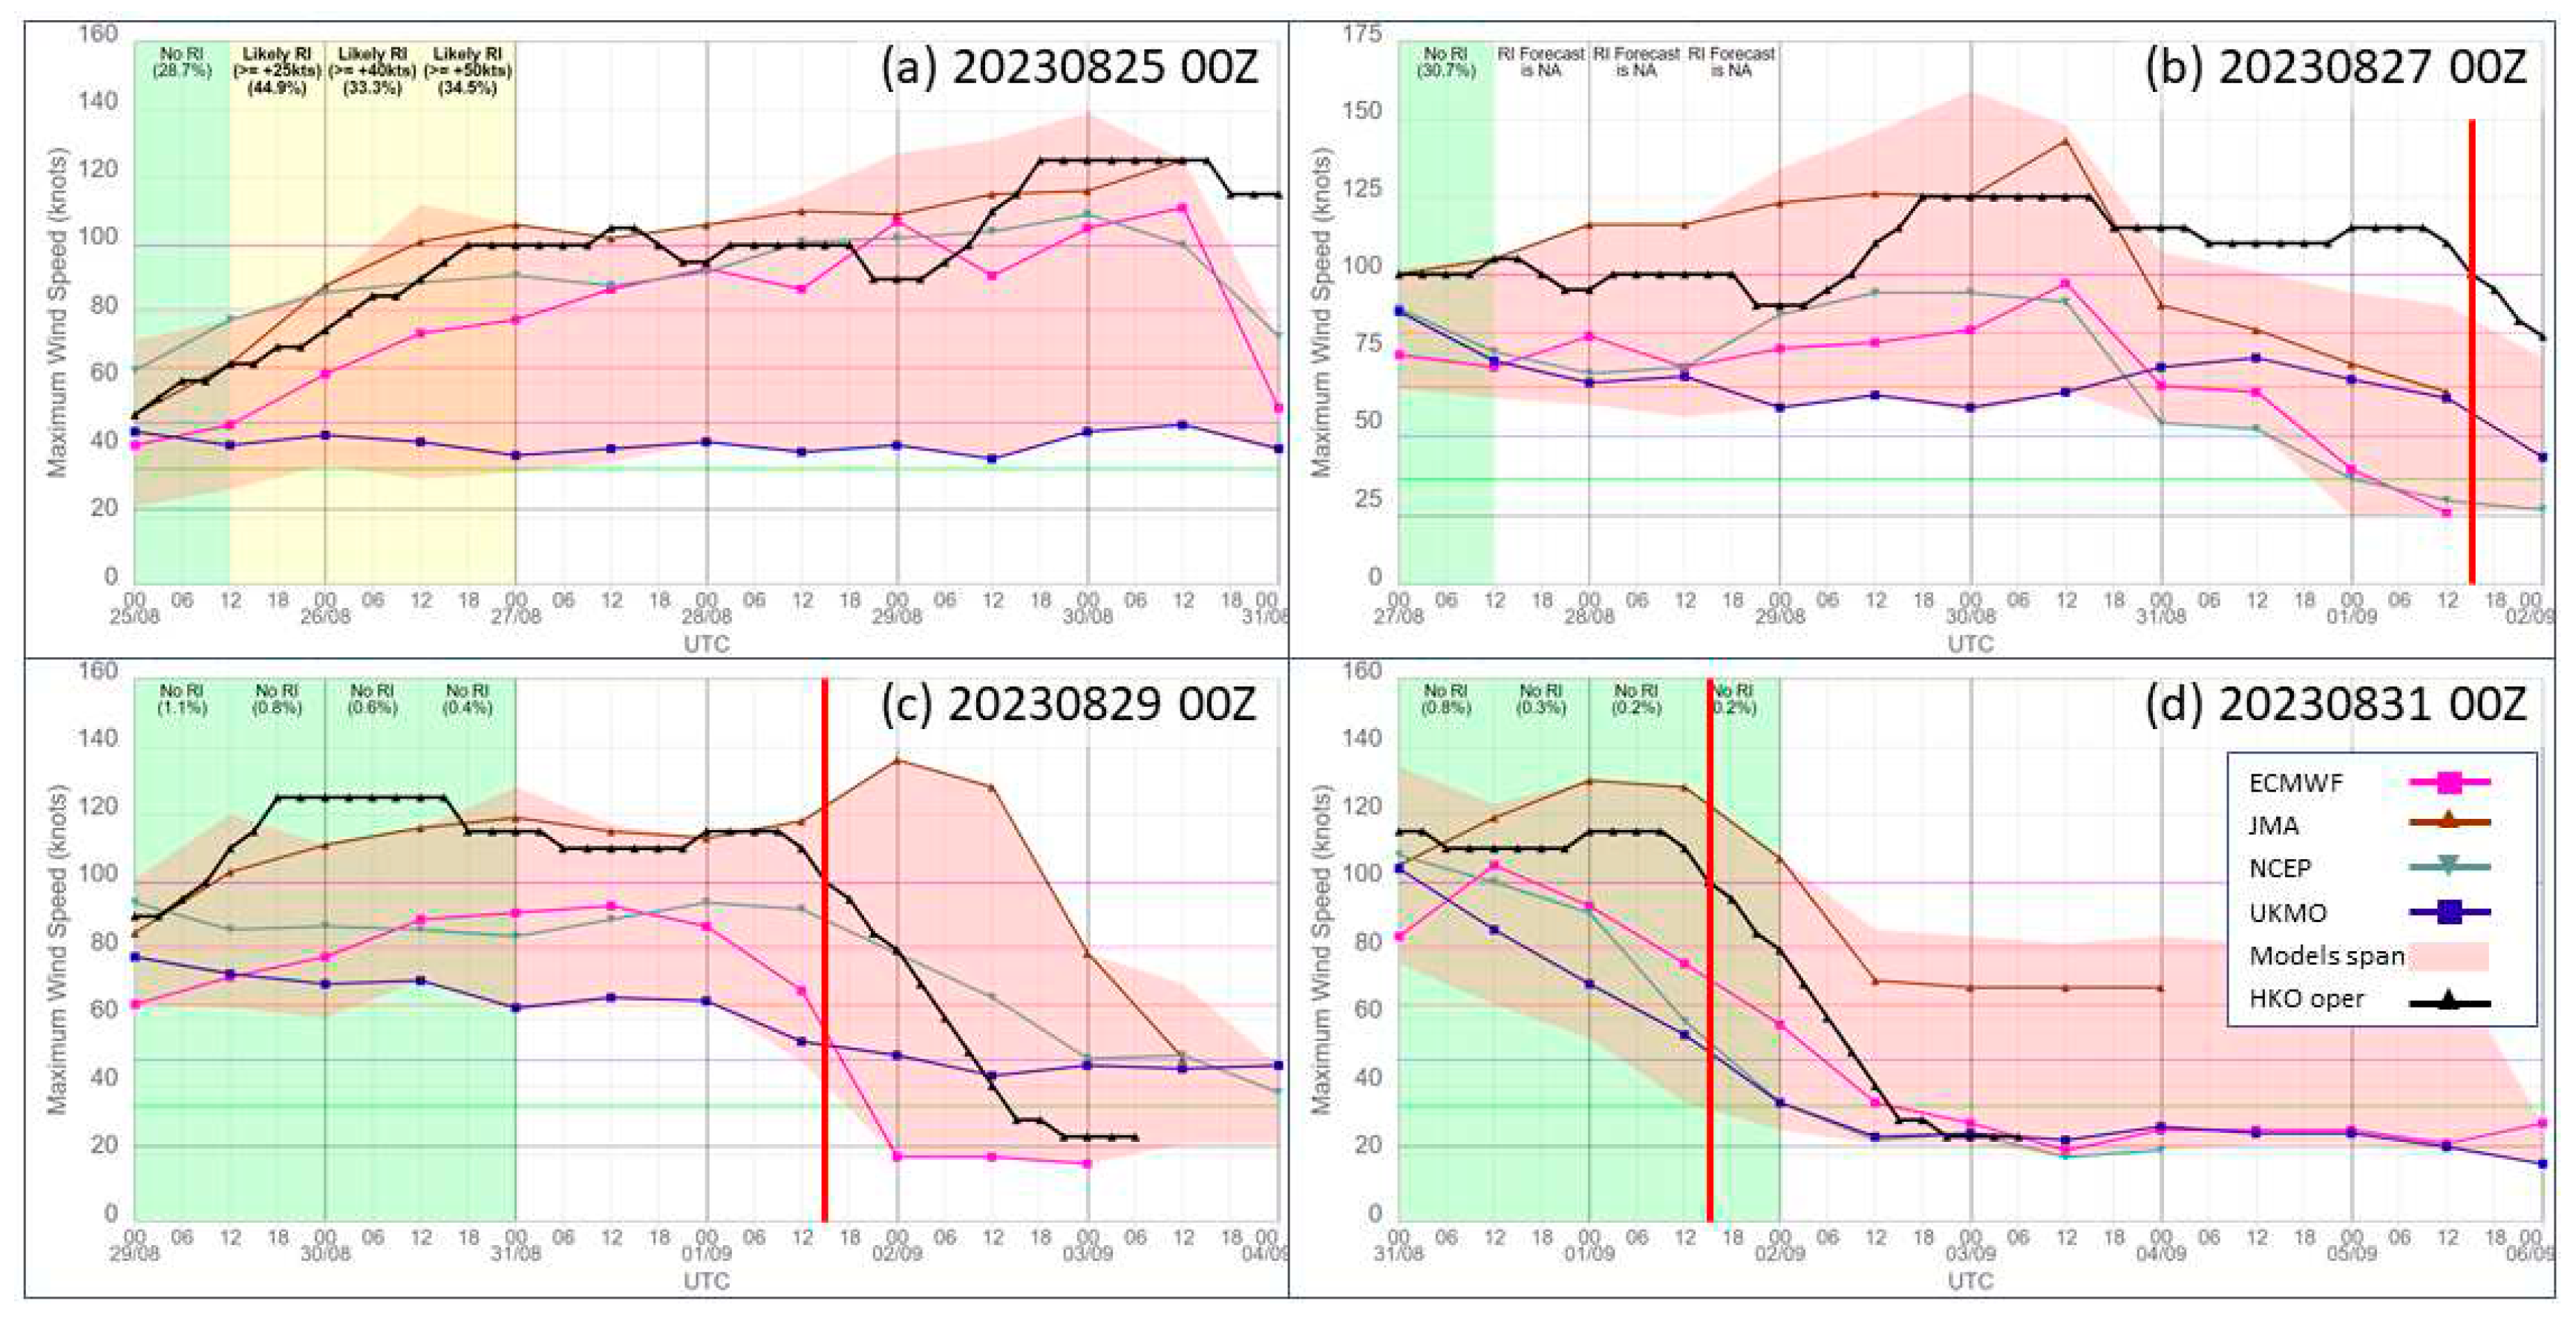
Intensity forecast is another great challenge to the warning service of Saola. In particular, though it was expected and eventually it really turned out that Saola weakened in crossing the seas to the south of Hong Kong, the rate of the decrease of intensity remained to have high uncertainty. The time series of forecast intensity of Saola from the various global models and the actual intensity are shown in Figure 7.
At first (Figure 7a), the models captured quite well the increase of intensity of Saola and HKO’s objective TC intensity guidance on rapid intensification (Tam et al. 2021) also correctly forecast the rapid intensification of Saola. About two days later (Figure 7b) as some models showing an alarming signal on Saola possibly tracking closer to Hong Kong, HKO needed to critically consider the intensity of Saola when it would be close to Hong Kong (red vertical lone), and all models suggested a too low intensity. This poses great challenge to the tropical cyclone warning service. Two days later (Figure 7c), apart from JMA that forecast a rather high intensity after closest approach to Hong Kong, all other models still maintained a significant low bias in intensity, and this trend persisted two days later (Figure 7d) when HKO had to formulate the warning strategy for Saola on the back to school day (1 September 2023) of Hong Kong. As shown in the time series, the models in this case, apart from JMA, tended to under-forecast the intensity of Saola.

Wind Structure Forecast

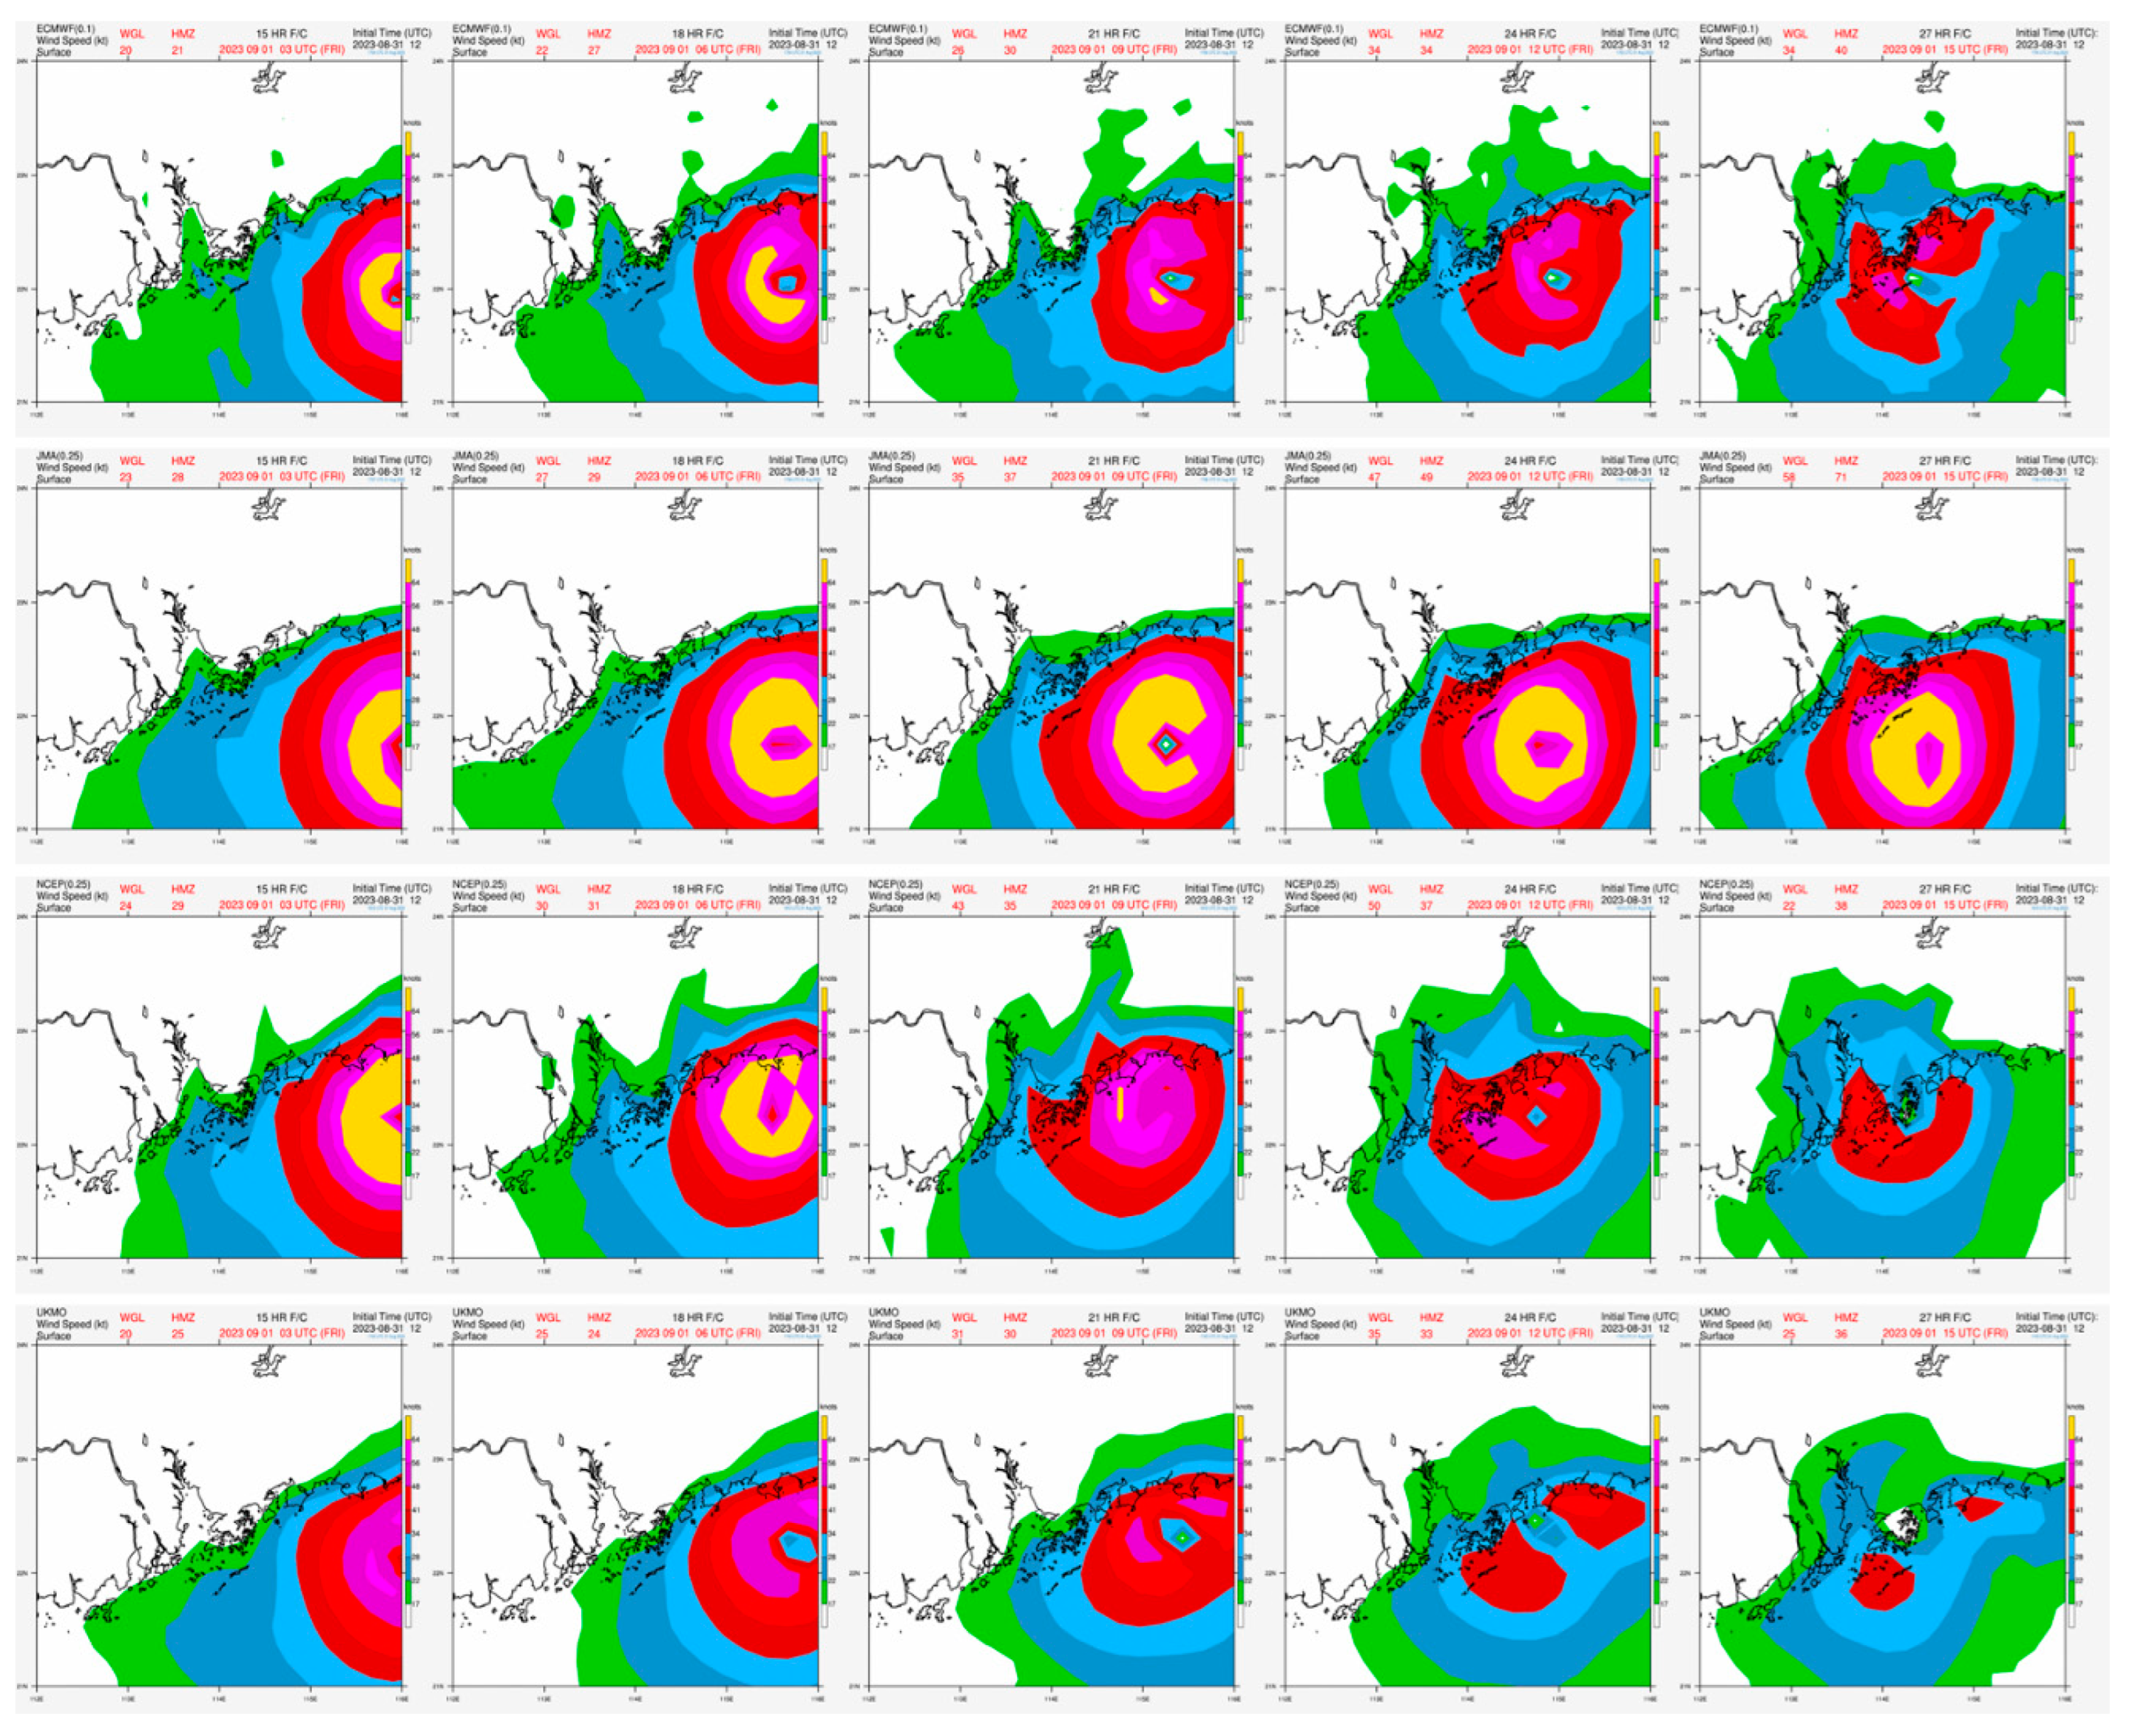
In the nowcasting service of the tropical cyclone warning, namely, the last 24 to 36 hours when Saola was the closest to Hong Kong, the forecast wind structure of Saola became critical, in particular, whether it would bring about hurricane force winds to Hong Kong. The near-term forecast wind structures of the various models are shown in Figure 8.
It turns out that, similar to the intensity forecast, ECMWF (Figure 8 top row) forecast a too rapid weakening of Saola and early disappearance of the hurricane force winds (in yellow). JMA was capable in maintaining the strength of Saola when it was close to Hong Kong (Figure 8 second row) and in that aspect it had the best performance, though it is noted earlier that its overall track error was the largest. NCEP forecast landfall of Saola over Hong Kong (Figure 8 third row), which was not correct, and weakened the storm much too fast similarly to ECMWF. UKMO had the weakest winds (Figure 8 fourth row) and its analyzed and forecast wind structures were basically not useful, though it is noted earlier that it had the lowest track error for Saola over all available runs. In the nowcast process when Soala was on Hong Kong’s doorstep, it is still important to monitor the actual wind structure of Saola from the Doppler weather radar imageries (not shown Chan et al. 2023).

Conclusions

The forecast challenges of Saola are summarized in this short paper. It turns out that none of the models could be correct in all aspects, namely, track, intensity and wind structure. Numerical models are still important references in operational weather warning services, but it is crucial to make reference to multiple models in order to build up the most “accurate” picture through combination with the actual observations. Saola is an interesting case to demonstrate the usefulness of multi-model approach.
Moreover, the Pangu-weather models are found to be useful in helping the formulation of weather forecasts for tropical cyclone situations. It is hoped that this short paper would stimulate researchers in improving models performance for supporting tropical cyclone warning services.

References

  1. Choy, C.W.; Lau, D.S.; He, Y.H. Super typhoons Hato and Mangkhut, part I: analysis of maximum intensity and wind structure. Weather 2022a, 77: 314-320. [CrossRef]
  2. Chan, P.W.; Choy, C.W.; Chiu, Y.Y. Observational study of Super Typhoon Saola in 2023 when it was close to Hong Kong, 2023, Manuscript in preparation.
  3. Choi, Y.; Cha, D.-H.; Lee, M.-I.; Kim, J.; Jin C.-S.; Park, S.-H.; Joh, M.-S. Satellite radiance data assimilation for binary tropical cyclone cases over the western North Pacific. J. Adv. Model. Earth Syst. 2017, 9, 832–853. [CrossRef]
  4. Peng, M. S.; Reynolds, C. A. Double trouble for typhoon forecasters. Geophys. Res. Lett. 2005, 32, L02810. [CrossRef]
  5. Bi, K., Xie, L., Zhang, H. et al. Accurate medium-range global weather forecasting with 3D neural networks. Nature 2023, 619, 533–538. [CrossRef]
  6. Choy, C.W.; Lau, D.S.; He, Y.H. Super typhoons Hato and Mangkhut, part II: challenges in forecasting and early warnings. Weather 2022b, 77: 324-331. [CrossRef]
  7. Tam, H.F.; Choy, C.W.; Wong, W.K. Development of objective forecast guidance on tropical cyclone rapid intensity change. Meteorol Appl. 2021, 28:e1981. [CrossRef]
Figure 1. Provisional tracks of Saola (2309) and Haikui (2311), based on HKO operational warning tracks.
Preprints 85860 g001
Figure 2. Global models’ forecast tracks of Saola from 0000 UTC runs on 25, 27, 29 and 31 August 2023. Also shown on each panel is Saola’s analysis positions (black) based on HKO operational warning track. (Top row) tracks from ECMWF, JMA, NCEP and UKMO. (Bottom row) tracks from Pangu-weather initialized by the operational analyses of DWD, ECCC, ECMWF, MeteoFrance and NCEP.
Preprints 85860 g002
Figure 3. Root-mean-square error of global models’ forecast positions for Saola as a function of lead time. Forecasts are verified against Saola’s analysis positions based on HKO operational warning track and homogenized to have a common data set among models.
Preprints 85860 g003
Figure 4. 500 hPa geopotential height valid for 1200 UTC on 31 August 2023, except for (c1) which is valid for the day before. (a) Analysis and (b) 72-hour forecast form ECMWF deterministic model. (c1) 48-hour forecast and (c2) 72-hour forecast from the same run of JMA model. (d) NCEP and (e) UKMO model forecast.
Preprints 85860 g004
Figure 5. Basic Dvorak enhanced satellite image of Himawari-9 Satellite of the Japan Meteorological Agency at 1200 UTC on 31 August 2023 showing Saola and Haikui.
Preprints 85860 g005
Figure 6. EPS strike probability maps of Saola based on the ensembles of ECMWF, NCEP and UKMO from 1200 UTC runs on 23, 25, 27 and 29 August 2023. Also shown is Saola’s analysis positions (black) based on HKO operational warning track.
Preprints 85860 g006
Figure 7. Intensity of Saola as forecast by global models from 0000 UTC runs on 25, 27, 29 and 31 August 2023. The light-red shading indicates the spread of all available models (not shown here). Also shown is Saola’s analysis intensity (black line) based on HKO operational warning track. The red vertical line indicates the time where Saola at its closest approach to Hong Kong.
Preprints 85860 g007
Figure 8. Forecast surface wind fields over the Pearl River Estuary in 3-hourly intervals from 0300 UTC (leftmost column) to 1500 UTC (rightmost column) on 1 September 2023. Winds of hurricane force are coloured in yellow. (Top row) ECMWF. (Second row) JMA. (Third row) NCEP. (Fourth row) UKMO.
Preprints 85860 g008
Disclaimer/Publisher’s Note: The statements, opinions and data contained in all publications are solely those of the individual author(s) and contributor(s) and not of MDPI and/or the editor(s). MDPI and/or the editor(s) disclaim responsibility for any injury to people or property resulting from any ideas, methods, instructions or products referred to in the content.
Copyright: This open access article is published under a Creative Commons CC BY 4.0 license, which permit the free download, distribution, and reuse, provided that the author and preprint are cited in any reuse.
Prerpints.org logo

Preprints.org is a free preprint server supported by MDPI in Basel, Switzerland.

Subscribe

© 2024 MDPI (Basel, Switzerland) unless otherwise stated