1. Introduction
The Mulberry Mosaic Dwarf-associated Virus (MMDaV), a member of the Geminiviridae family, presents a significant challenge to many crops, resulting in marked economic losses [
1]. Encompassing approximately 360 different viral species, the Geminiviridae family exhibit common characteristics such as circular, single-stranded DNA genomes, which can be monopartite or bipartite, replicating within the nucleus through rolling-circle and recombination mechanisms [
2,
3]. Of the seven recognized genera: Mastrevirus, Curtovirus, Topocuvirus, Becurtovirus, Eragrovirus, Turncurtovirus, and Begomovirus, within the Geminiviridae family, Begomovirus is the most prevalent and encapsulates the majority of known species [
4,
5].
Emerging as grave threats to a range of herbaceous crops, Geminiviruses display diversity in their genomic structure; Masteavirus and Becurtovirus diverge from the others through their dual replication-related proteins (Rep) expression that rely on complementary-sense transcripts' alternative splicing [
5]. Recently, several highly divergent, unclassified Geminiviruses have been identified, including Euphorbia caput-medusae-associated virus (EcmLV) [
6], Citrus Chlorotic Dwarf-Associated Virus (CCDaV) [
7], and Grapevine Red Blotch-Associated Virus (GRBaV) [
8].
The International Committee on Taxonomy of Viruses recently classified MMDaV as an Unclassified Geminiviridae member [
9]. The MMDaV genome is monopartite, circular DNA (2.95 kb), encoding five proteins (V1, V2, V3, C1, C1:C2), and two putative proteins (V4, V5) discovered in the virion-sense and complementary-sense strands, respectively. Although MMDaV is comparable to other Geminiviridae members regarding genome size and conserved origin sequence, it differs in terms of genomic organization, inferred gene count, and the inclusion of five GAAAAA repeats upstream of the inferred coat protein gene [
1]. Codon usage bias in the AV1 and BV1 genes of begomoviruses, which display elevated expression levels, is primarily shaped by mutation bias [
10]. Since MMDaV represents a highly divergent and novel geminivirus, it is critical to understand the factors and patterns that shape its synonymous codon usage. These insights could benefit future research and provide an informed foundation for developing effective strategies to limit this virus's spread within crop populations.
2. Materials and Methods
2.1. Sample Collection, DNA Extraction, and PCR Detection
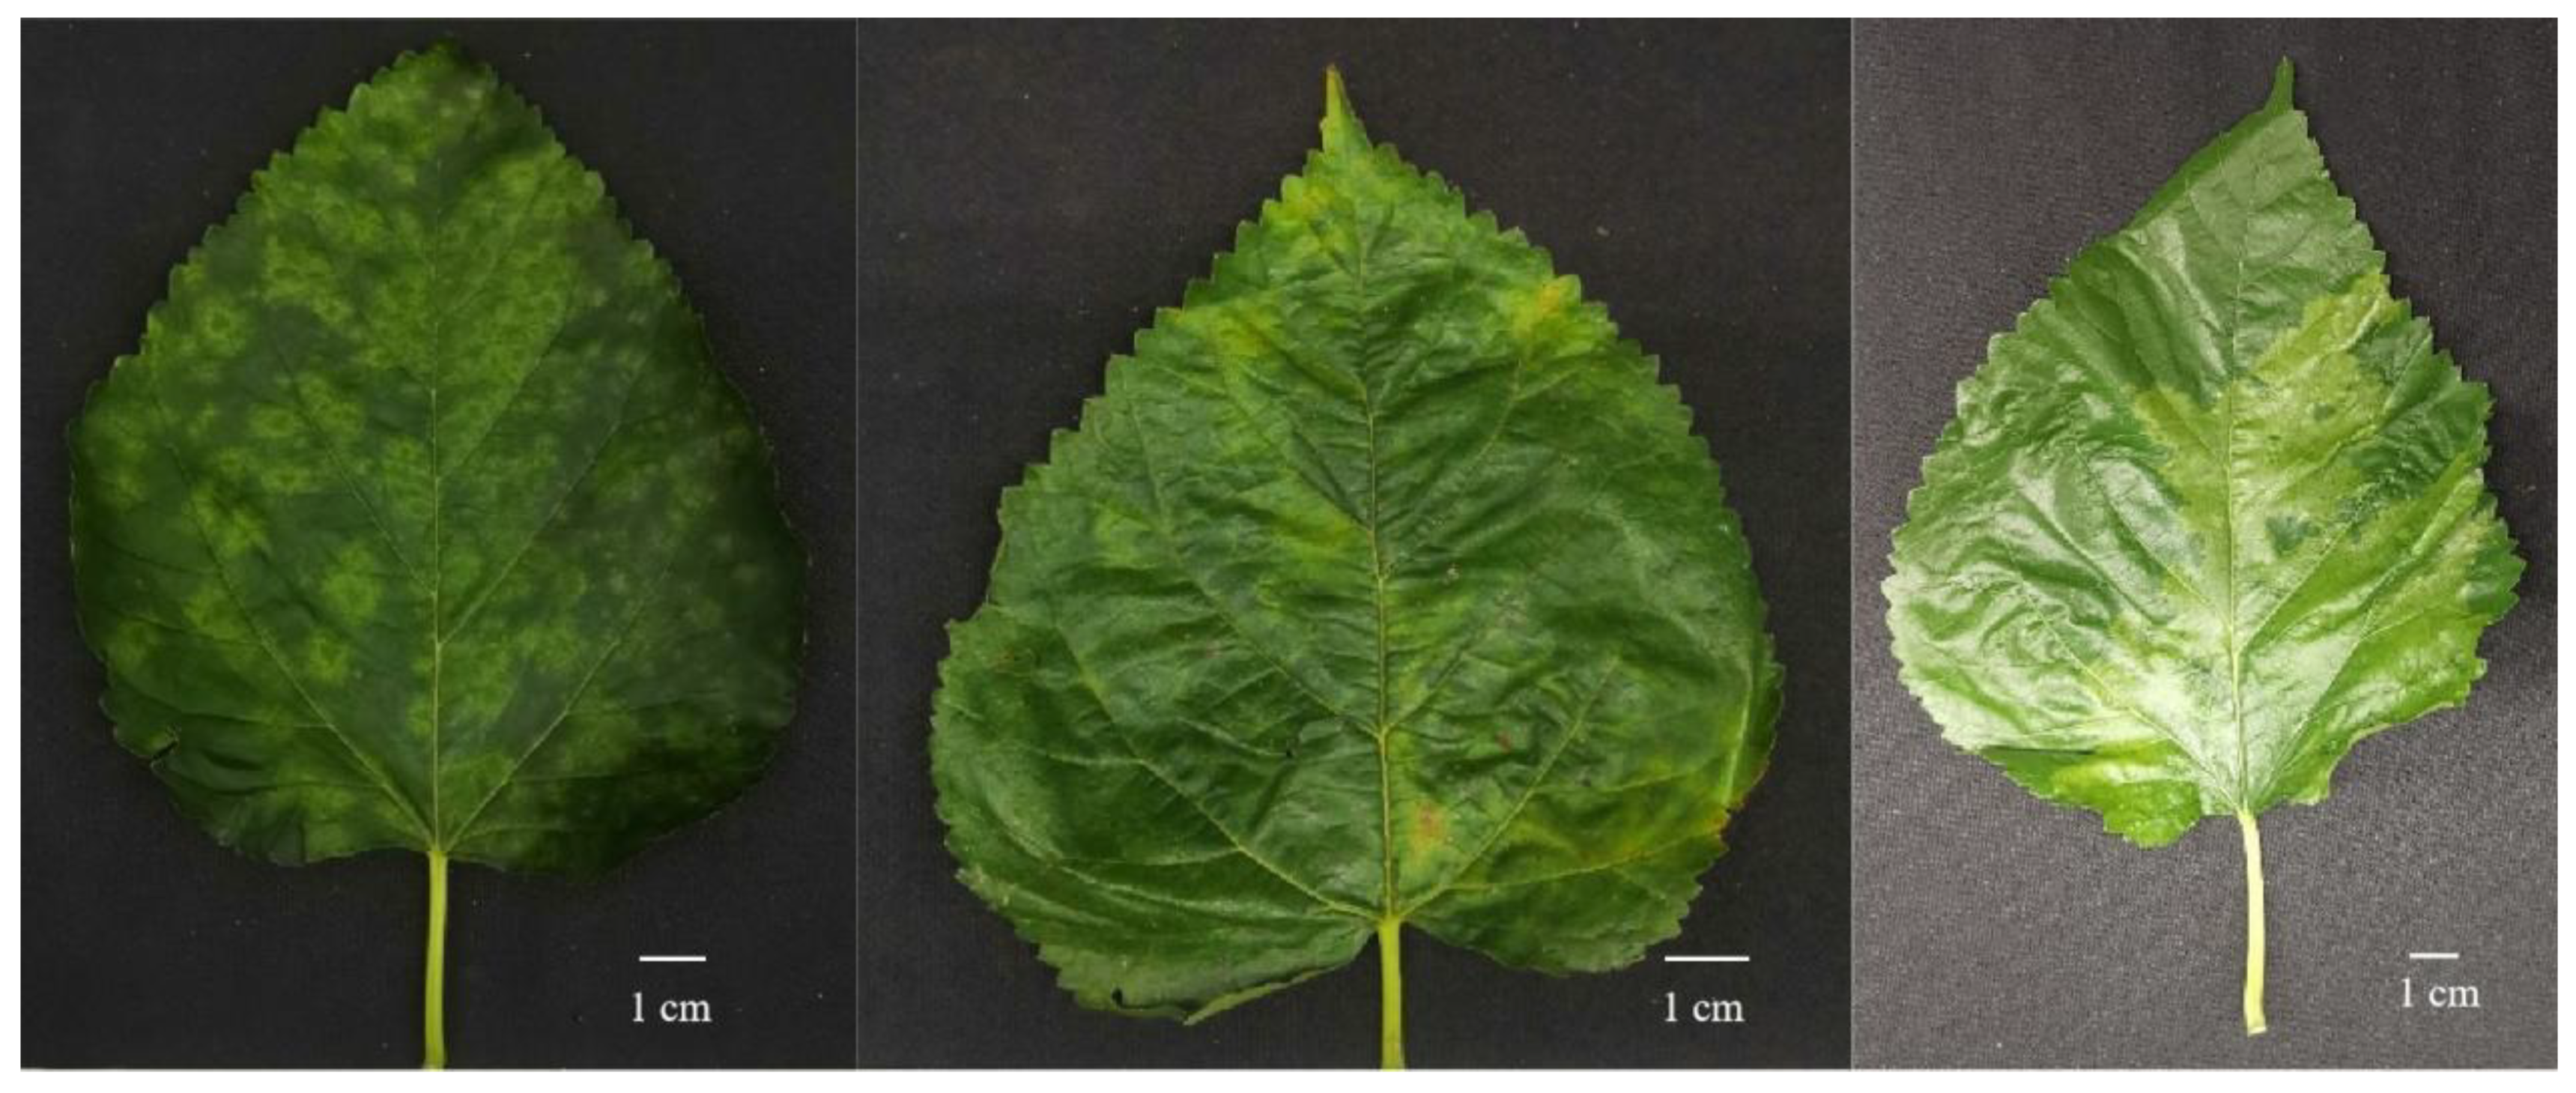
From June to October 2017, we gathered 48 mulberry leaf specimens showing distinct symptoms of puckering and mosaic patterns from four geographical areas in China: Guangdong, Guangxi, Hainan, and Chongqing (
Figure 1). Comprehensive DNA extraction from the mulberry samples was accomplished using the Cetyl Trimethyl Ammonium Bromide (CTAB) method, following the procedure outlined by Murray and Thompson [
11]. We used a specific primer pair, MCP746F/MCP1148R (5’-CGAGTTTGGCAAGAAGGAAGAG-3’/5-TTGGCTCCCACTAAATGAAAGG-3’), for PCR analysis to detect the MMDaV. This primer pair was strategically designed to target specific regions within the MMDaV genome. The PCR experimental conditions consisted of an initial denaturation cycle at 95℃ for 30s, followed by 35 amplification cycles that included denaturation at 95℃ for 30s, annealing at 61℃ for 30s, and extension at 72℃ for 20s. A final elongation step was performed at 72℃ for 10 min.
2.2. Viral Genome Sequencing
MMDaV-positive samples underwent comprehensive genome sequencing, conducted in collaboration with Science Corporation of Gene Technology Co., Ltd. (Guangzhou, China), employing a method that included segmental amplification and Sanger sequencing. Following the Illumina library construction protocol, the total DNA was constructed as a paired-end high-throughput sequencing library with an insert size of 450 bp. The library was then sequenced using an Illumina Hiseq2500/4000 sequencer, employing a sequencing strategy of Pair-End 150 bp. Sequences were assembled through the SOAPdenovo2 (2.01) software.
Table 1 provides comprehensive information about the genome samples. Furthermore, nine complete genomes were sourced from the National Center for Biotechnology Information (
https://www.ncbi.nlm.nih.gov/nuccore). This research involved reviewing a total of 39 complete genomes, which encompass five MMDaV segmented coding sequences.
2.3. Phylogenetic Trees and DNA Polymorphism Analysis
This research investigated the complex interrelation between evolutionary dynamics and codon usage patterns. Initially, we performed the classification and creation of phylogenetic trees for MMDaV. For this purpose, we aligned the 39 genomes (
Table 2) using the Muscle v5.0 software [
12]. Simultaneously, MMDaV's classification was conducted based on sequence pairwise identity using the SDTv1.2 tool [
13]. Following this classification, we constructed the phylogenetic trees using the MEGA X software [
14]. The Ka/Ks ratio [
15] is an invaluable metric for determining the equilibrium between neutral mutations, purifying selection, and advantageous mutations that impact homologous protein-coding genes. Nucleotide diversity serves as a measure of polymorphism within a population [
16]. By employing DnaSP [
17] software, we have comprehensively analyzed the Ka/Ks ratio and nucleotide diversity (Pi and Theta) across the entire MMDaV genome and coding genes.
2.4. Codon Usage Parameter Refinement
The structural properties of the MMDaV genome code sequence were analyzed using the E-CAI tool [
18], and the resulting features were quantified as described below 1, Nucleotide Composition: A complete investigation of the nucleotide structure was carried out, which included parameters such as A%, U%, G%, C%, AU%, and GC%. 2, Codon Usage Frequency: A determination of codon usage regularity was made. 3, Synonymous Codon Third-Site Nucleotide Frequencies: The distribution of nucleotides in the third spot of synonymous codons was analyzed, including A3s%, T3s%, C3s%, and G3s%. 4, Specific Position G + C Nucleotide Frequencies: The G + C nucleotide frequencies were calculated at the first (GC1S), second (GC2S), and third (GC3S) positions. 5, Mean G + C Nucleotide Frequencies at the First and Second Positions: The average frequencies of G + C nucleotides at the first and second positions (represented as GC1,2 (P12)) were identified. It is critical to emphasize that when calculating the base content at each codon location, certain codons, including the sole Methionine codon (UG), the only Tryptophan codon (UGG), and the three termination codons (UAA, UAG, UGA) were exempted from the analysis.
2.5. Relative Synonymous Codon Usage (RSCU) and Effective Number of Codons
The CodonW software (
http://codonw.sourceforge.net/) was utilized to analyze two key aspects: the adequate number of codons (ENC or Nc) and the RSCU in detail. ENC readings illustrate codon usage bias intensity and range from 20 to 61, with lower readings signifying strong codon usage bias. If the ENC value is below 35, this implies significant bias, whereas higher ENC values indicate a lower bias level [
19]. Simultaneously, the analysis of RSCU values can reveal different levels of synonymous codon usage bias: values lesser than 0.6 signify low usage, between 0.6 and 1.6 indicate random use, and higher than 1.6 denote strong preference [
20]. The CodonW software offers an in-depth understanding of codon usage patterns.
2.6. ENC-plot and Neutrality plot analysis
An ENC-plot analysis, also called Effective Number of Codons mapping, was employed to decipher codon usage's intricate composition and preference within gene sequences. This technique plots ENC values against the frequencies of G and C bases at the third codon position (GC3s) on vertical and horizontal axes, respectively. This method provides crucial insights into the effects of selection pressure and mutation on codon preference [
21]. A plot closely paralleling or above the standard curve would suggest the predominance of mutation pressure. In contrast, a property diverging notably below the curve signifies codon preference being shaped by selection exclusively. In addition, a Neutrality plot analysis was also undertaken to indicate the correlation between the average frequencies of G and C bases at the first and second codon positions (GC12) and GC3s [
22]. This plot aids in quantifying the relative contributions of selection and mutation to codon usage. It maps GC12 against GC3 values on the vertical and horizontal axes. The slope of the plot provides valuable information: a slope of 1 indicates a neutral state with codon usage leaning on mutation pressure, whereas a near-zero slope suggests codon preference being dominated by inherent selection.
2.9. Correspondence Analysis (COA)
A multivariate statistical technique known as the Correspondence Analysis (COA) was also invoked in this study. This method unravels the complex relationships among variables in a given dataset. Employing the foundation of Relative Synonymous Codon Usage (RSCU), COA positions all genes into a multidimensional space of 59 dimensions, primarily contingent upon the frequency of codon usage. The dimensions exclude any termination codons, methionine, and colour-related codons, thus providing a comprehensive representation of amino acid codons.
2.10. Parity rule 2 (PR2) analysis
The Parity Rule 2 (PR2) plot analysis was implemented to investigate the interplay between codon selection pressure and mutation rates. The PR2 plot, by mapping the AU bias against the GC bias on the vertical and horizontal axes, respectively, provides insights into codon usage at the third position of amino acids. The centre of the plot, where both coordinates assume a value of 0.5, represents an ideal state where A = U and G = C and the substitution rates are balanced [
23].
3. Results
3.1. Genomic Classification and Phylogenetic Analysis of MMDaV Strains
The complete genome sequences of 39 MMDaV strains showed distinct classification into two clades supported by significant genetic disparities. The phylogenetic tree, constructed using MEGA X software, revealed a two-branch bifurcation aligned seamlessly with the categorization. MMDaV was delineated into two distinct entities, HNDQ and HDDQ, marked by pronounced genomic sequence dissimilarities. Furthermore, the presence of substantial selective pressures resulted in heightened nucleotide diversity in certain areas, illuminating the dynamic nature of the virus's genome composition.
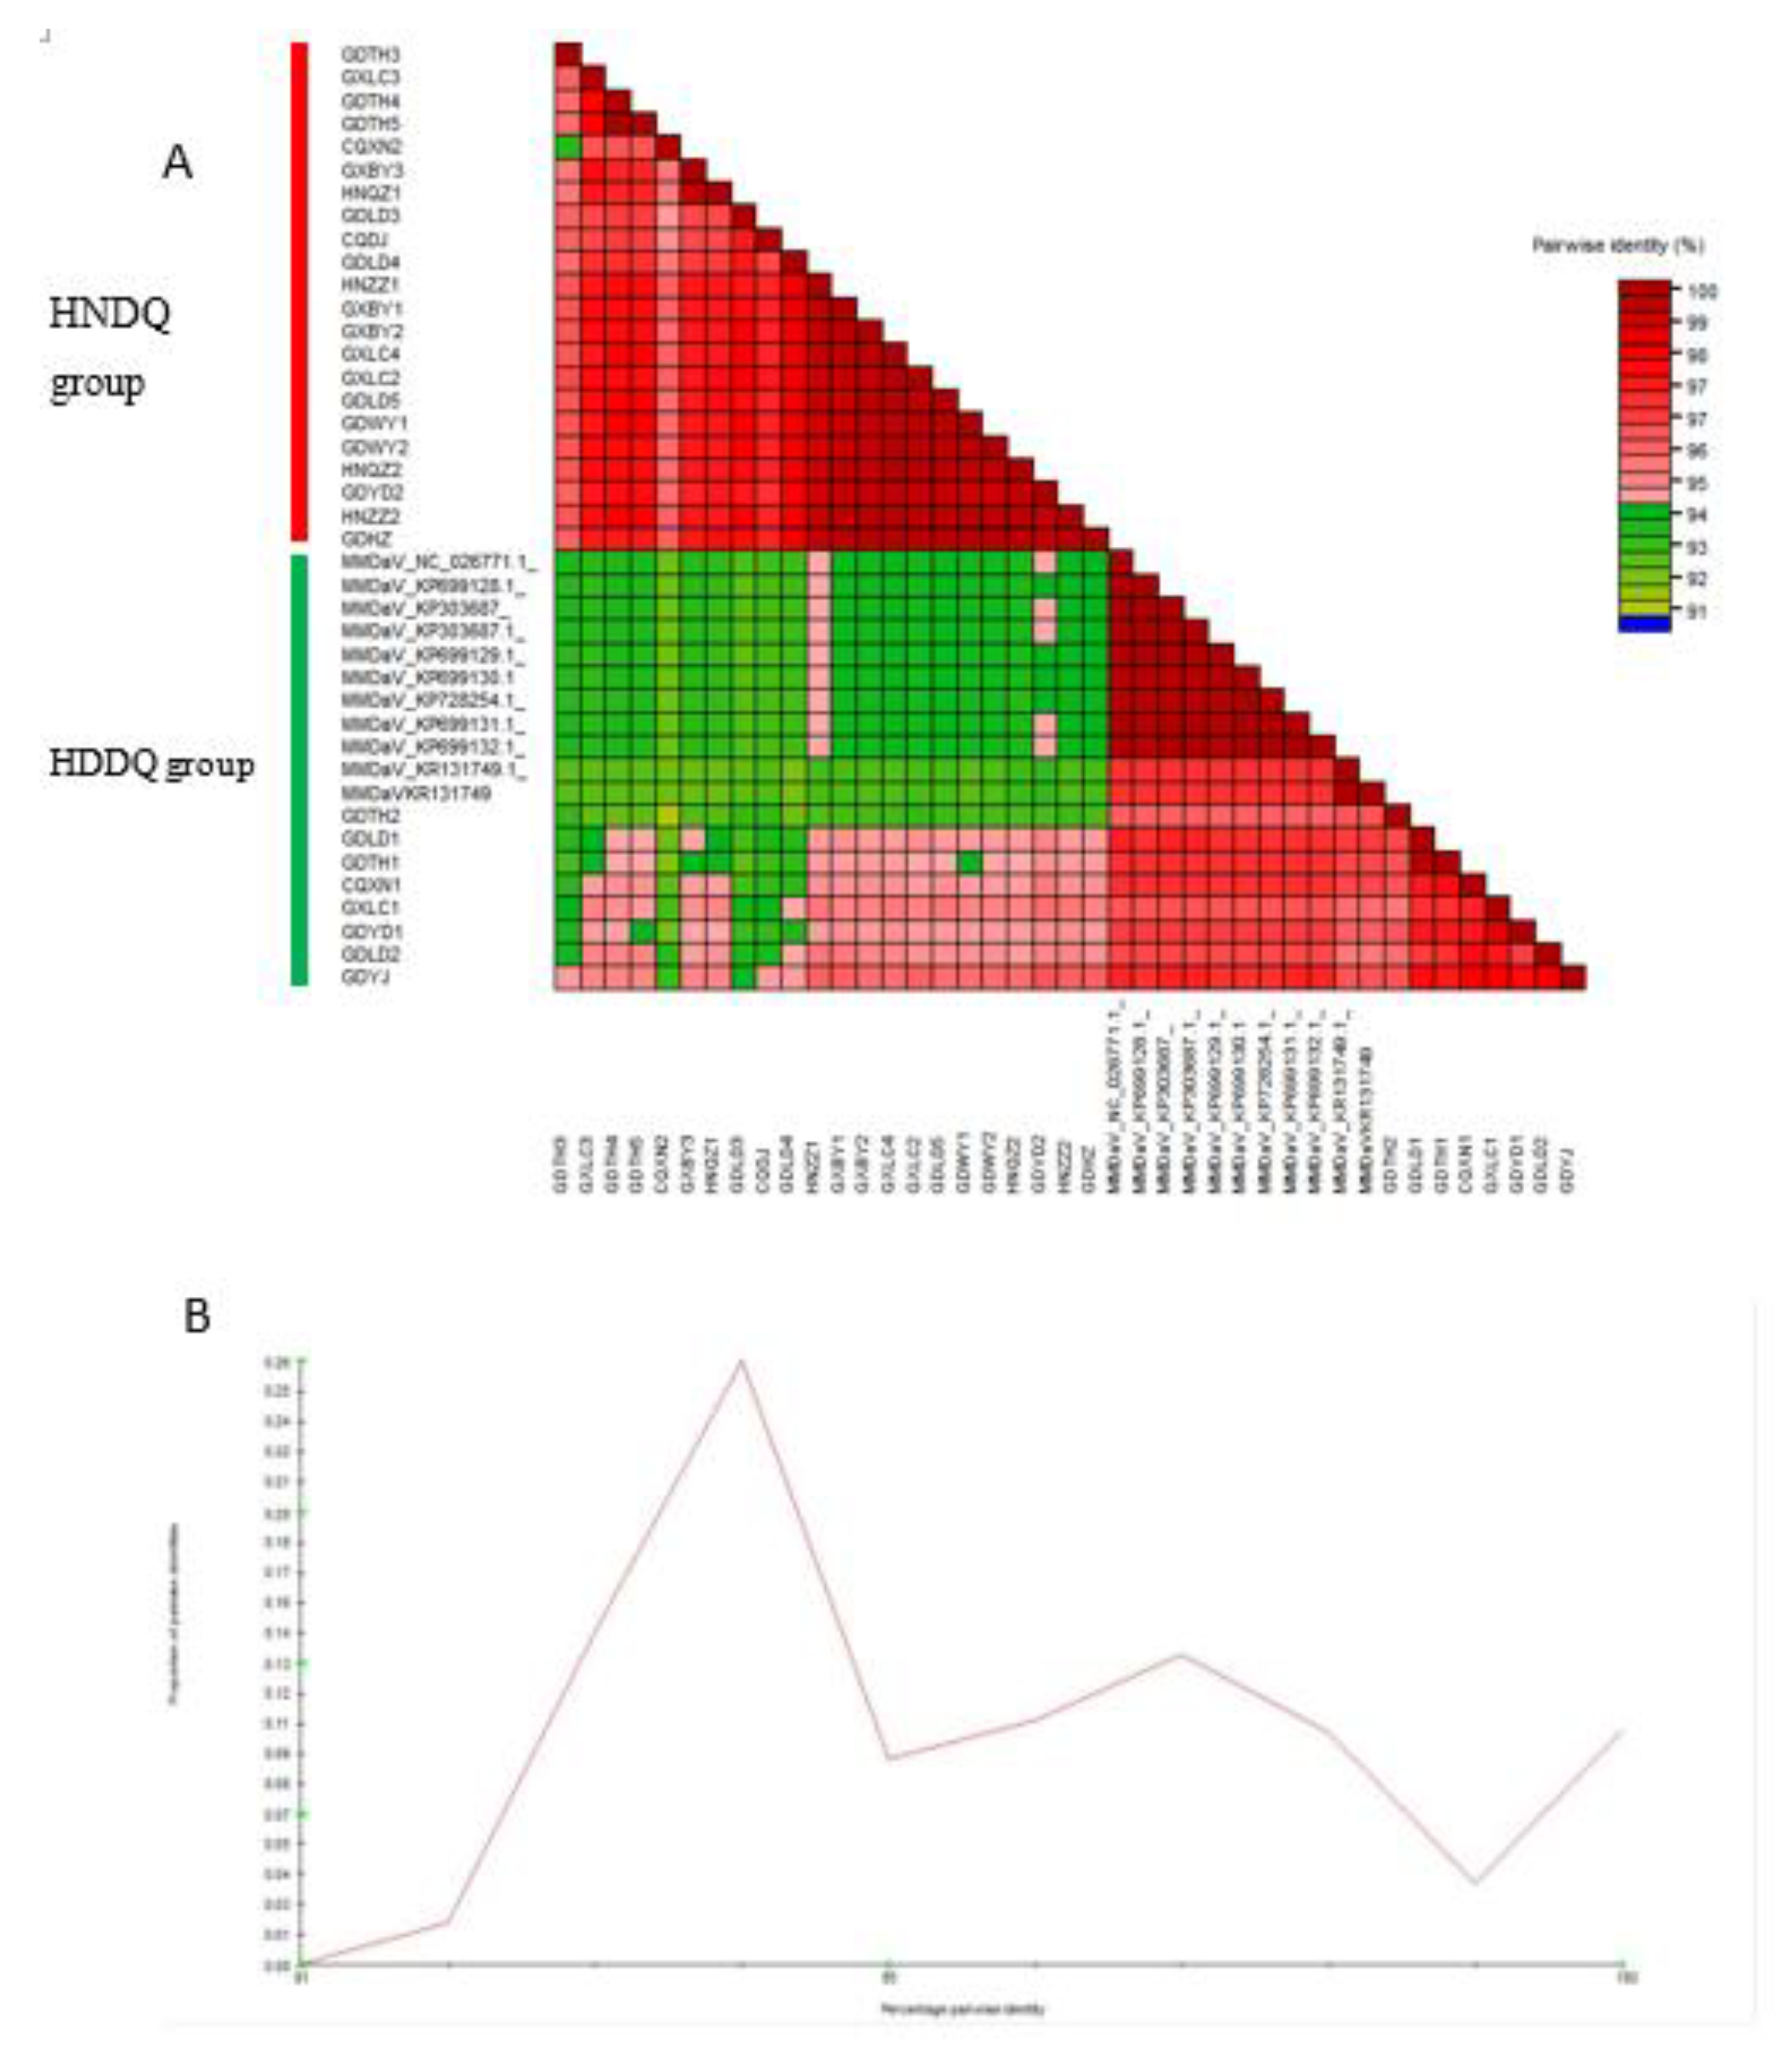
A comparison of the pairwise identity scores for the complete genome sequences of the 39 MMDaV strains reveals discrete categorization into two distinct clades (
Figure 2A). The presence of conspicuous peaks within these categorizations highlights the likelihood of disparate outcomes when making classifications based solely on these thresholds (
Figure 2B). The capacity to delimit these two distinct groups confidently is underscored by the significant genetic disparities evident between them. Accordingly, it is deemed appropriate to delineate MMDaV into two separate entities, HNDQ and HDDQ, a distinction underscored by pronounced genomic sequence dissimilarities.
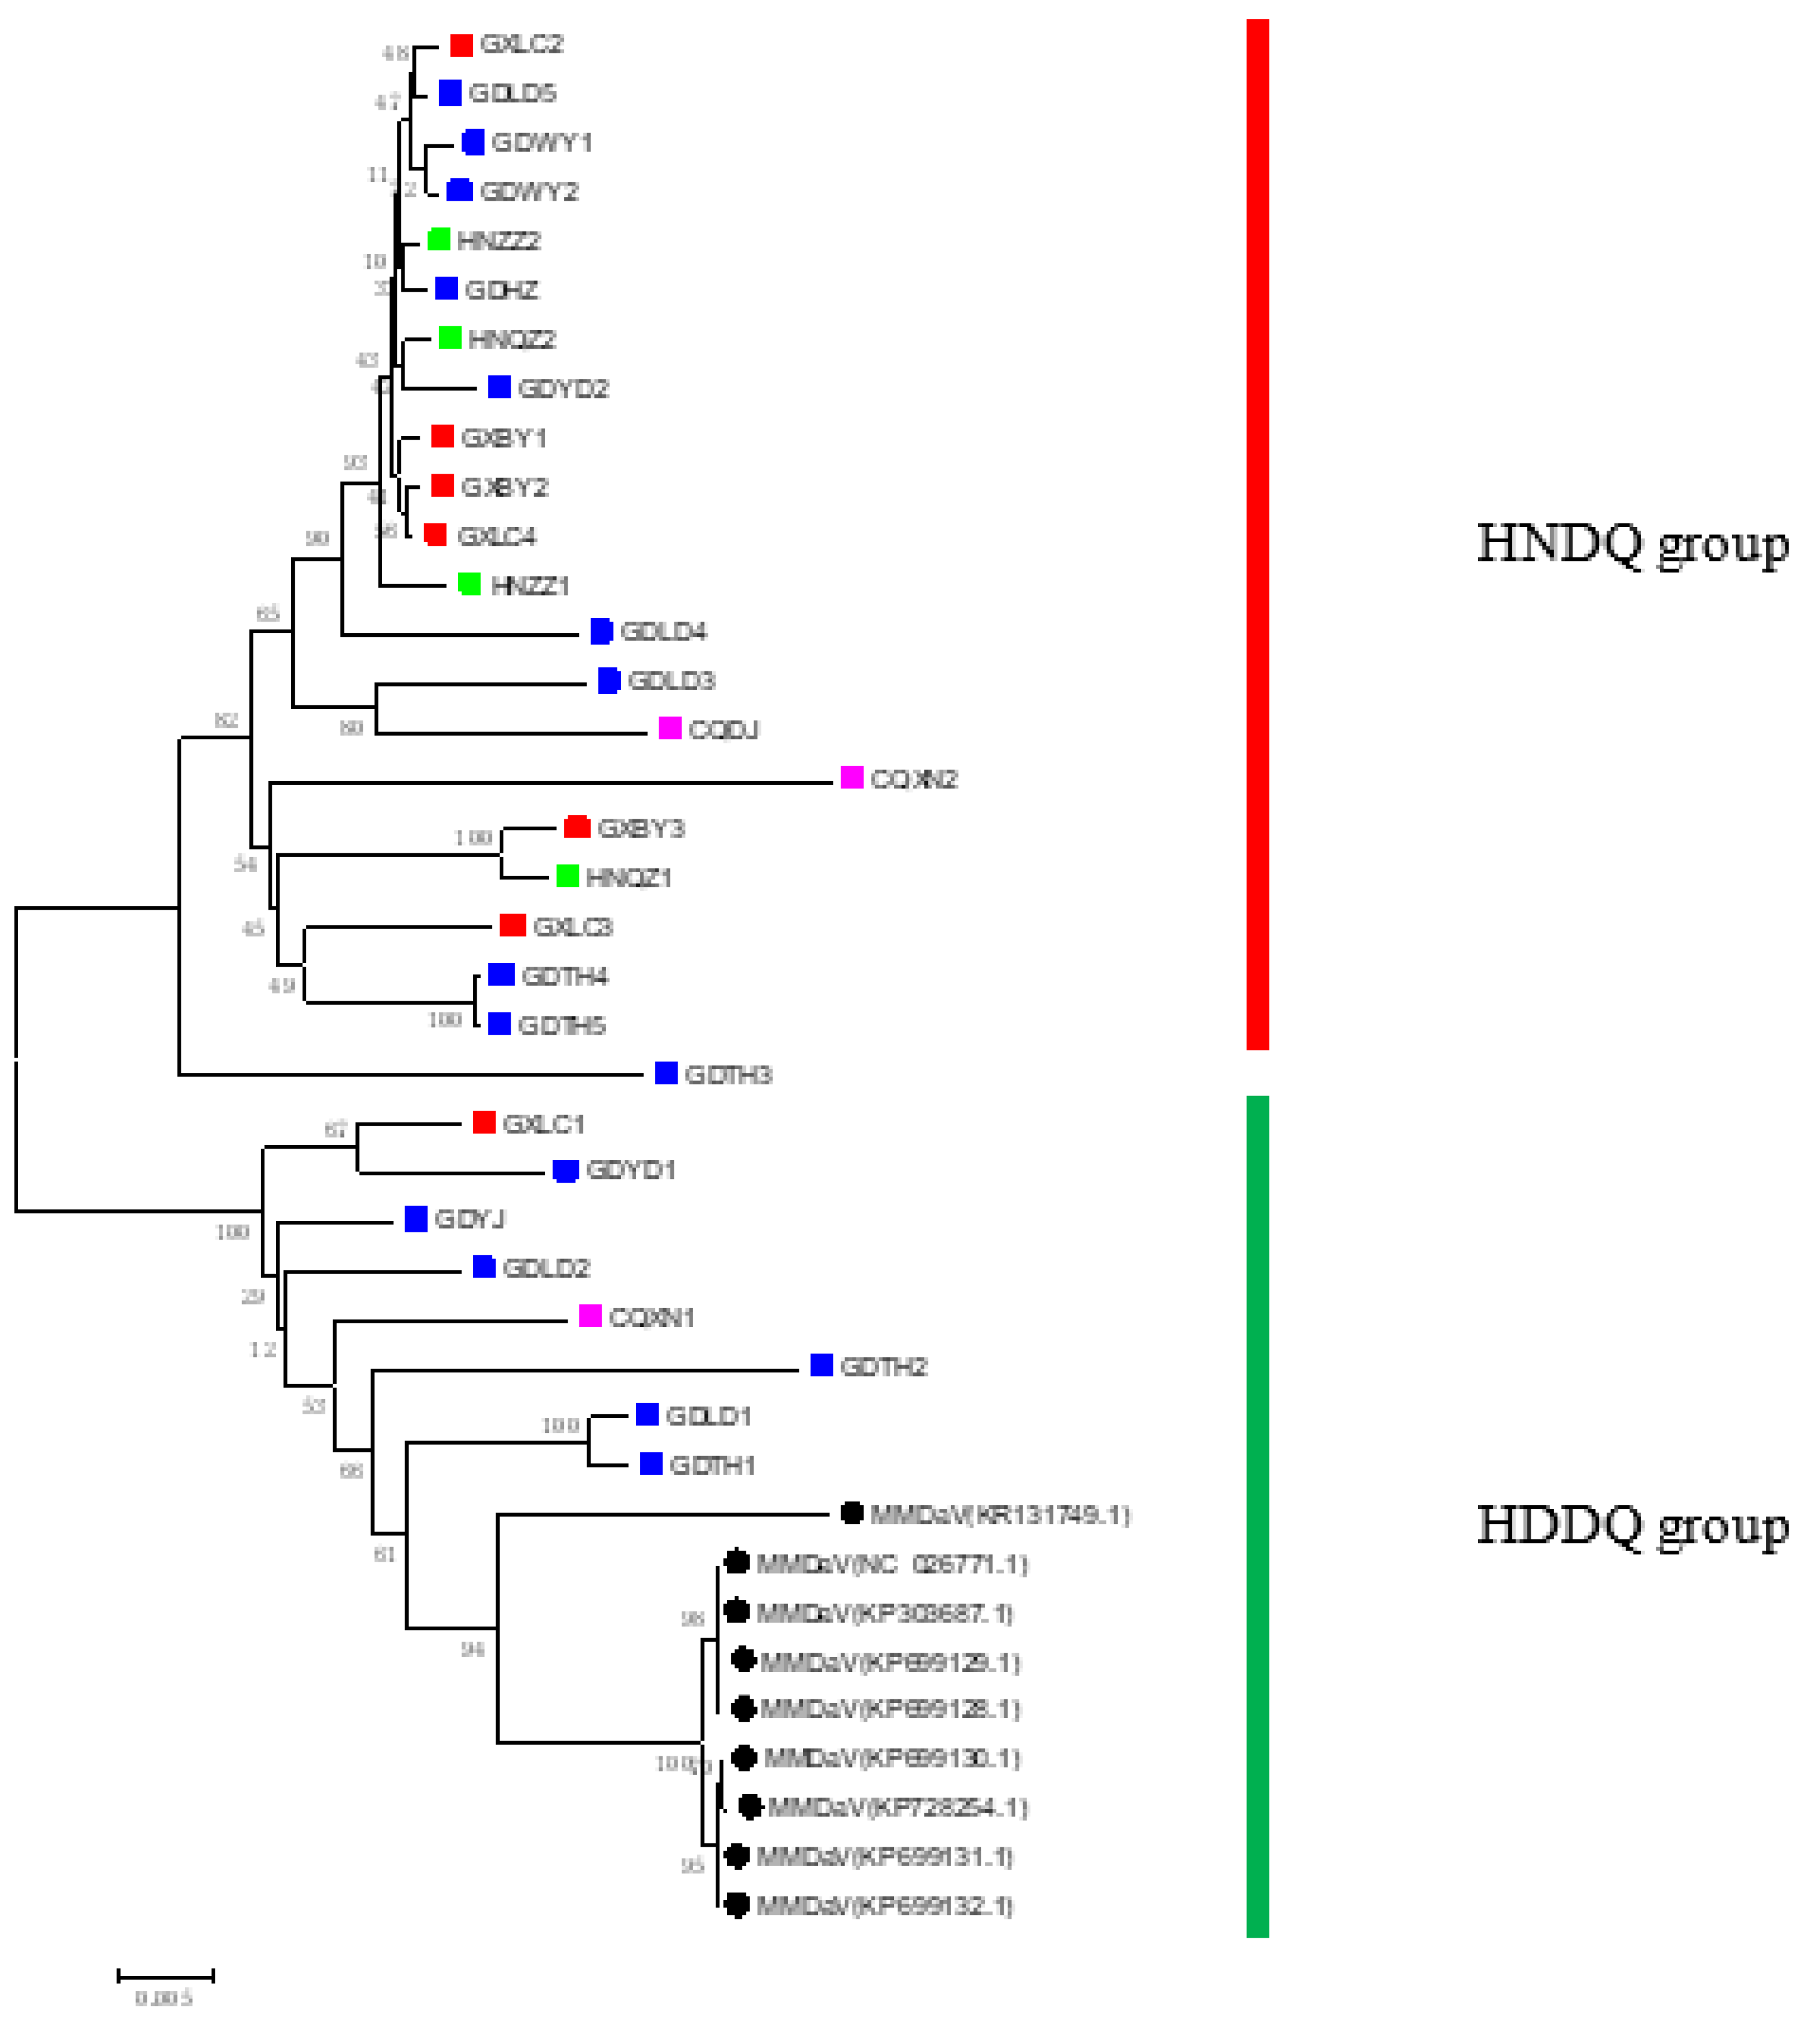
MEGA X software was used to construct an MMDaV genome sequence phylogenetic tree using the Neighbor-Joining method and a predetermined bootstrap value 1000. The resulting phylogeny exhibits a distinct bifurcation into two prevailing branches (
Figure 3). The first clade, supported by bootstrap values up to 82%, encapsulates the following sample sequences: GXBY1, GXBY2, GXLC2, GXLC3 and so forth. Conversely, the second clade, supported by bootstrap values of up to 100%, comprises sequences from sample strains GDLD1, GDLD2, GDYJ, and so forth. This bifurcation aligns seamlessly with the classification of the two strains revealed through pairwise identity analysis, thus reinforcing the robustness of the observed genetic differentiation between MMDaV's HNDQ and HDDQ strains.
3.2. Genomic Analysis of MMDaV: Nucleotide Composition and Codon Usage Patterns
The MMDaV genomes had a significant preponderance of the mononucleotide 'A' and a predilection for codons terminating with U or A. Five coding gene sequences demonstrated low Pi and Theta values, indicating conserved genetic regions. An individual gene-level assessment revealed nuanced patterns of nucleotide compositions and codon usage. Mainly, the V2 gene showed a higher GC content at the third codon position and surpassed the AU content overall. These examinations provided profound insights into possible genomic variability.
Through the application of DnaSP, the nucleotide diversity of the five coding genes of MMDaV was analyzed. The RepA gene exhibited significant genetic variation, as denoted by the high nucleotide diversity measure (0.07207), as seen in
Table 3. The Ka/Ks ratios of all five genes were recorded to be less than 1, indicative of purifying or stabilizing selection and thus pointing to selective pressures favouring the maintenance of genetic functionality. The V3 gene, which demonstrated the highest Ka/Ks ratio of 0.61544 (
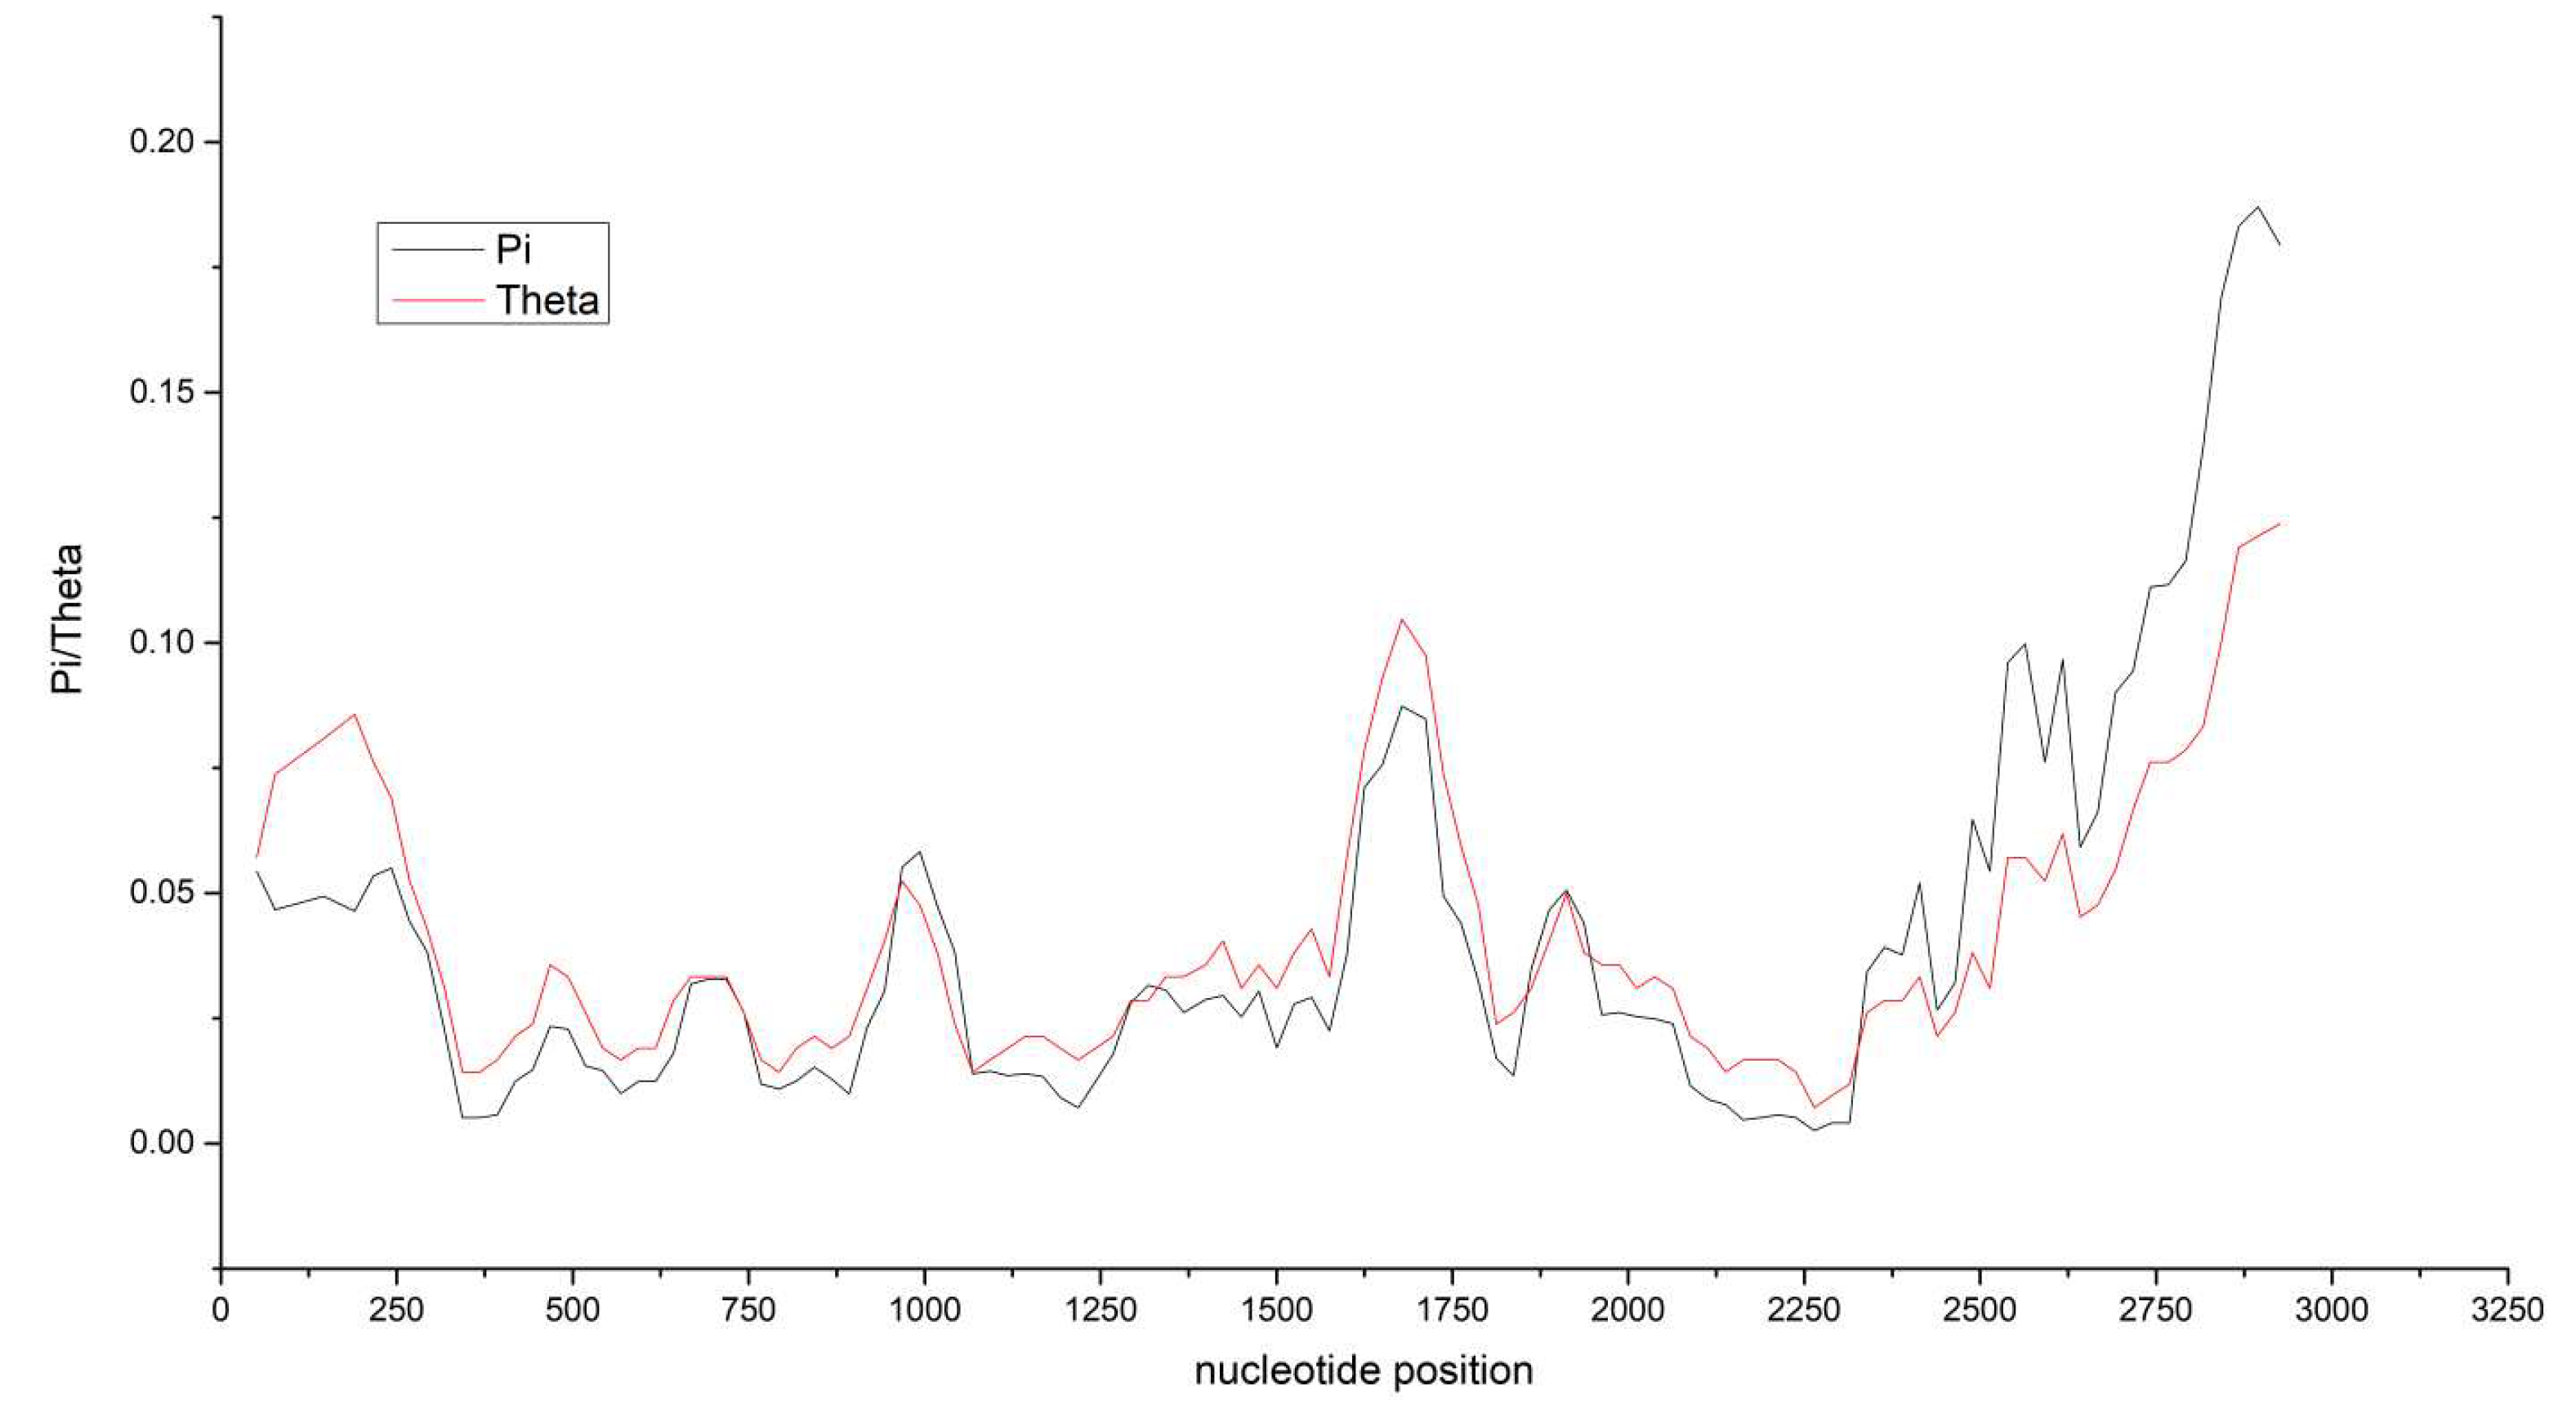
Table 3), suggests this gene has been under substantial selective pressure compared to the other genes, potentially due to its specific functional significance or adaptation within the context of MMDaV. Furthermore, a comprehensive analysis using DnaSP, encompassing MMDaV's nucleotide diversity indices (Pi and Theta), revealed significant genomic variability (
Figure 4). Notably, five coding gene sequences demonstrated low Pi and Theta values, indicative of conserved genetic regions. Consequently, our results illuminate the presence of substantial selective pressures resulting in heightened nucleotide diversity in some areas of MMDaV's genome, whilst others remain well conserved. These findings underline the dynamic nature of the virus's genome composition.
Our meticulous examination of the MMDaV genomes opened avenues to observational revelations focused on the nucleotide composition and codon usage patterns (Refer
Table 4). A striking prominence of the mononucleotide 'A' was denoted, depicting a mean + SD of 29.90% ± 0.24, marking it as the most abundant mononucleotide in the genome. G, U, and C trailed with mean + SD values of 26.46% ± 0.14, 25.13% ± 0.28, and 18.51% ± 0.38, respectively. A compelling preeminence of A and U nucleotides is reflected in the AU% content (55.03% ± 0.39), surpassing the GC% content (44.97% ± 0.39). On examining the preference of codons at the third position, U3s% (31.62% ± 0.76) and A3s% (25.40% ± 0.76) surfaced as more abundant synonymous codons compared to G3s% (24.10% ± 0.45) and C3s% (18.88% ± 0.77). This trend indicates a predilection for codons terminating with U or A over those ending with G or C. Speaking of GC content, a fluctuation was discovered between the first and second codon positions (46.07% ± 0.29 and 46.21% ± 0.27, respectively) compared to the third codon position (42.98% ± 1.06), underlining a relative inclination towards A and U. When assessed at an individual gene level, the V2 gene emerged with a distinct codon usage pattern marked by a considerably higher content at the third codon position (GC3s%: 61.25% ± 0.90) and an overall GC content surpassing the AU content. These findings provide profound insights into the nuanced nucleotide compositions and codon usage patterns within the MMDaV genomes, unveiling possible variability within the genome and amongst individual genes.
3.3. Analyzing Codon Usage Bias and Its Influences in MMDaV Genomes
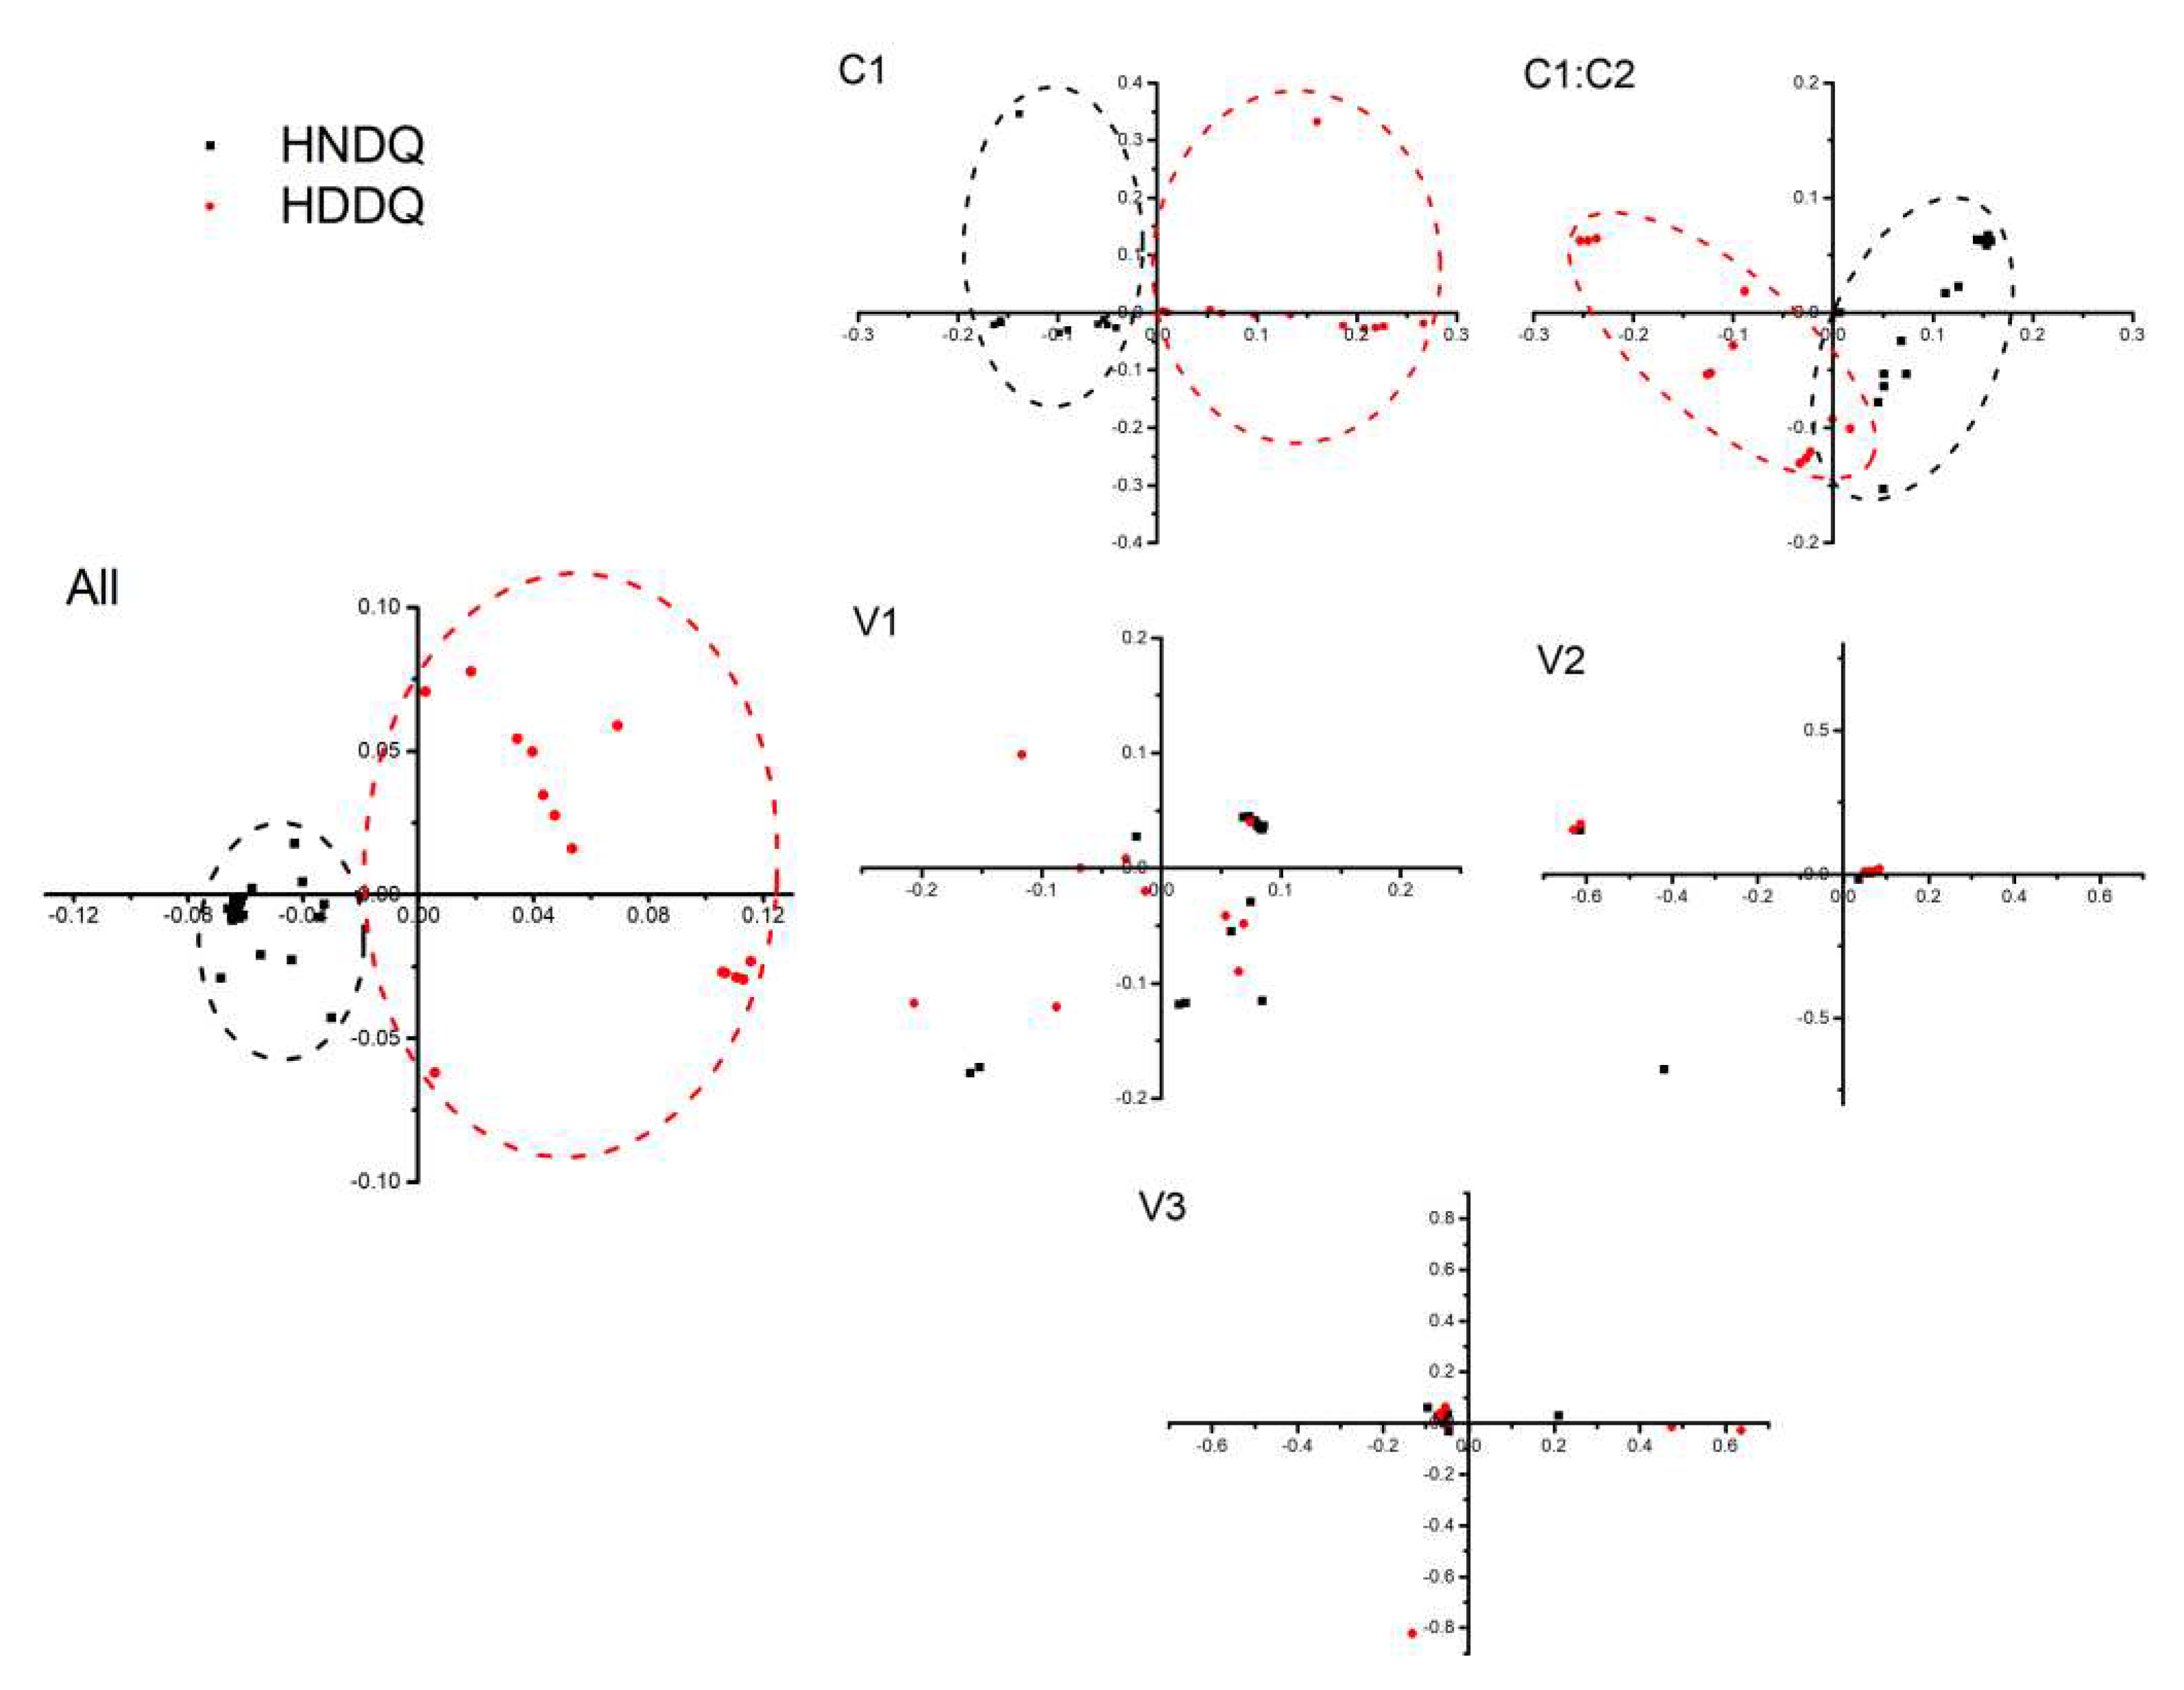
The Effective Number of Codons (ENC) analysis suggested significantly reducing codon usage bias. Examining synonymous codon usage variation via Correspondence Analysis (CA) applied to Relative Synonymous Codon Usage (RSCU) values revealed discernible clustering patterns. Synonymous codon usage favoured A/U bases. Variation studies conducted using ENC-GC3s analysis and Neutral analysis asserted that natural selection and mutational pressure were key influencers of codon bias. PR2 analysis further emphasized mutational pressure as a principal agent for codon preference without discounting the influential role of natural selection.
The consolidated analysis postulating the Effective Number of Codons (ENC) value for all coding gene sequences approximated to 55.82 ± 0.57. The ENC values were elucidated as follows across various genes: V2 (58.18 ± 0.99), C1 (55.93 ± 1.03), V3 (55.10 ± 1.62), C1:C2 (53.49 ± 1.20), and V1 (51.97 ± 1.74). Each value exceeding 35 indicated a significant diminution in codon usage bias. A deeper perusal into Relative Synonymous Codon Usage (RSCU), a prevalent methodology for synonymous codon usage pattern study, shed light on intriguing trends (Refer
Table 4). Among the identified 19 most frequently invoked synonymous codons, 12 were concluded to conclude with U/A bases, with eight culminating in U. The codons ended predominantly in U, followed by G, and least in C. Of trustworthy note were three codons: AGU (Ser), AAU (Ile), and AGA (Arg), with RSCU values surpassing 1.6, indicating a bias towards them. Nevertheless, RSCU values for Cys and Glu reflected no apparent bias. The analysis imparted a distinct preference for synonymous codon usage favouring A/U bases. This predilection persisted consistently across HN and HD regions with few exceptions, such as UUA (Leu) and GGC (Gly) in the HD region, which showcased a vehement preference in both areas (Refer
Table 5).
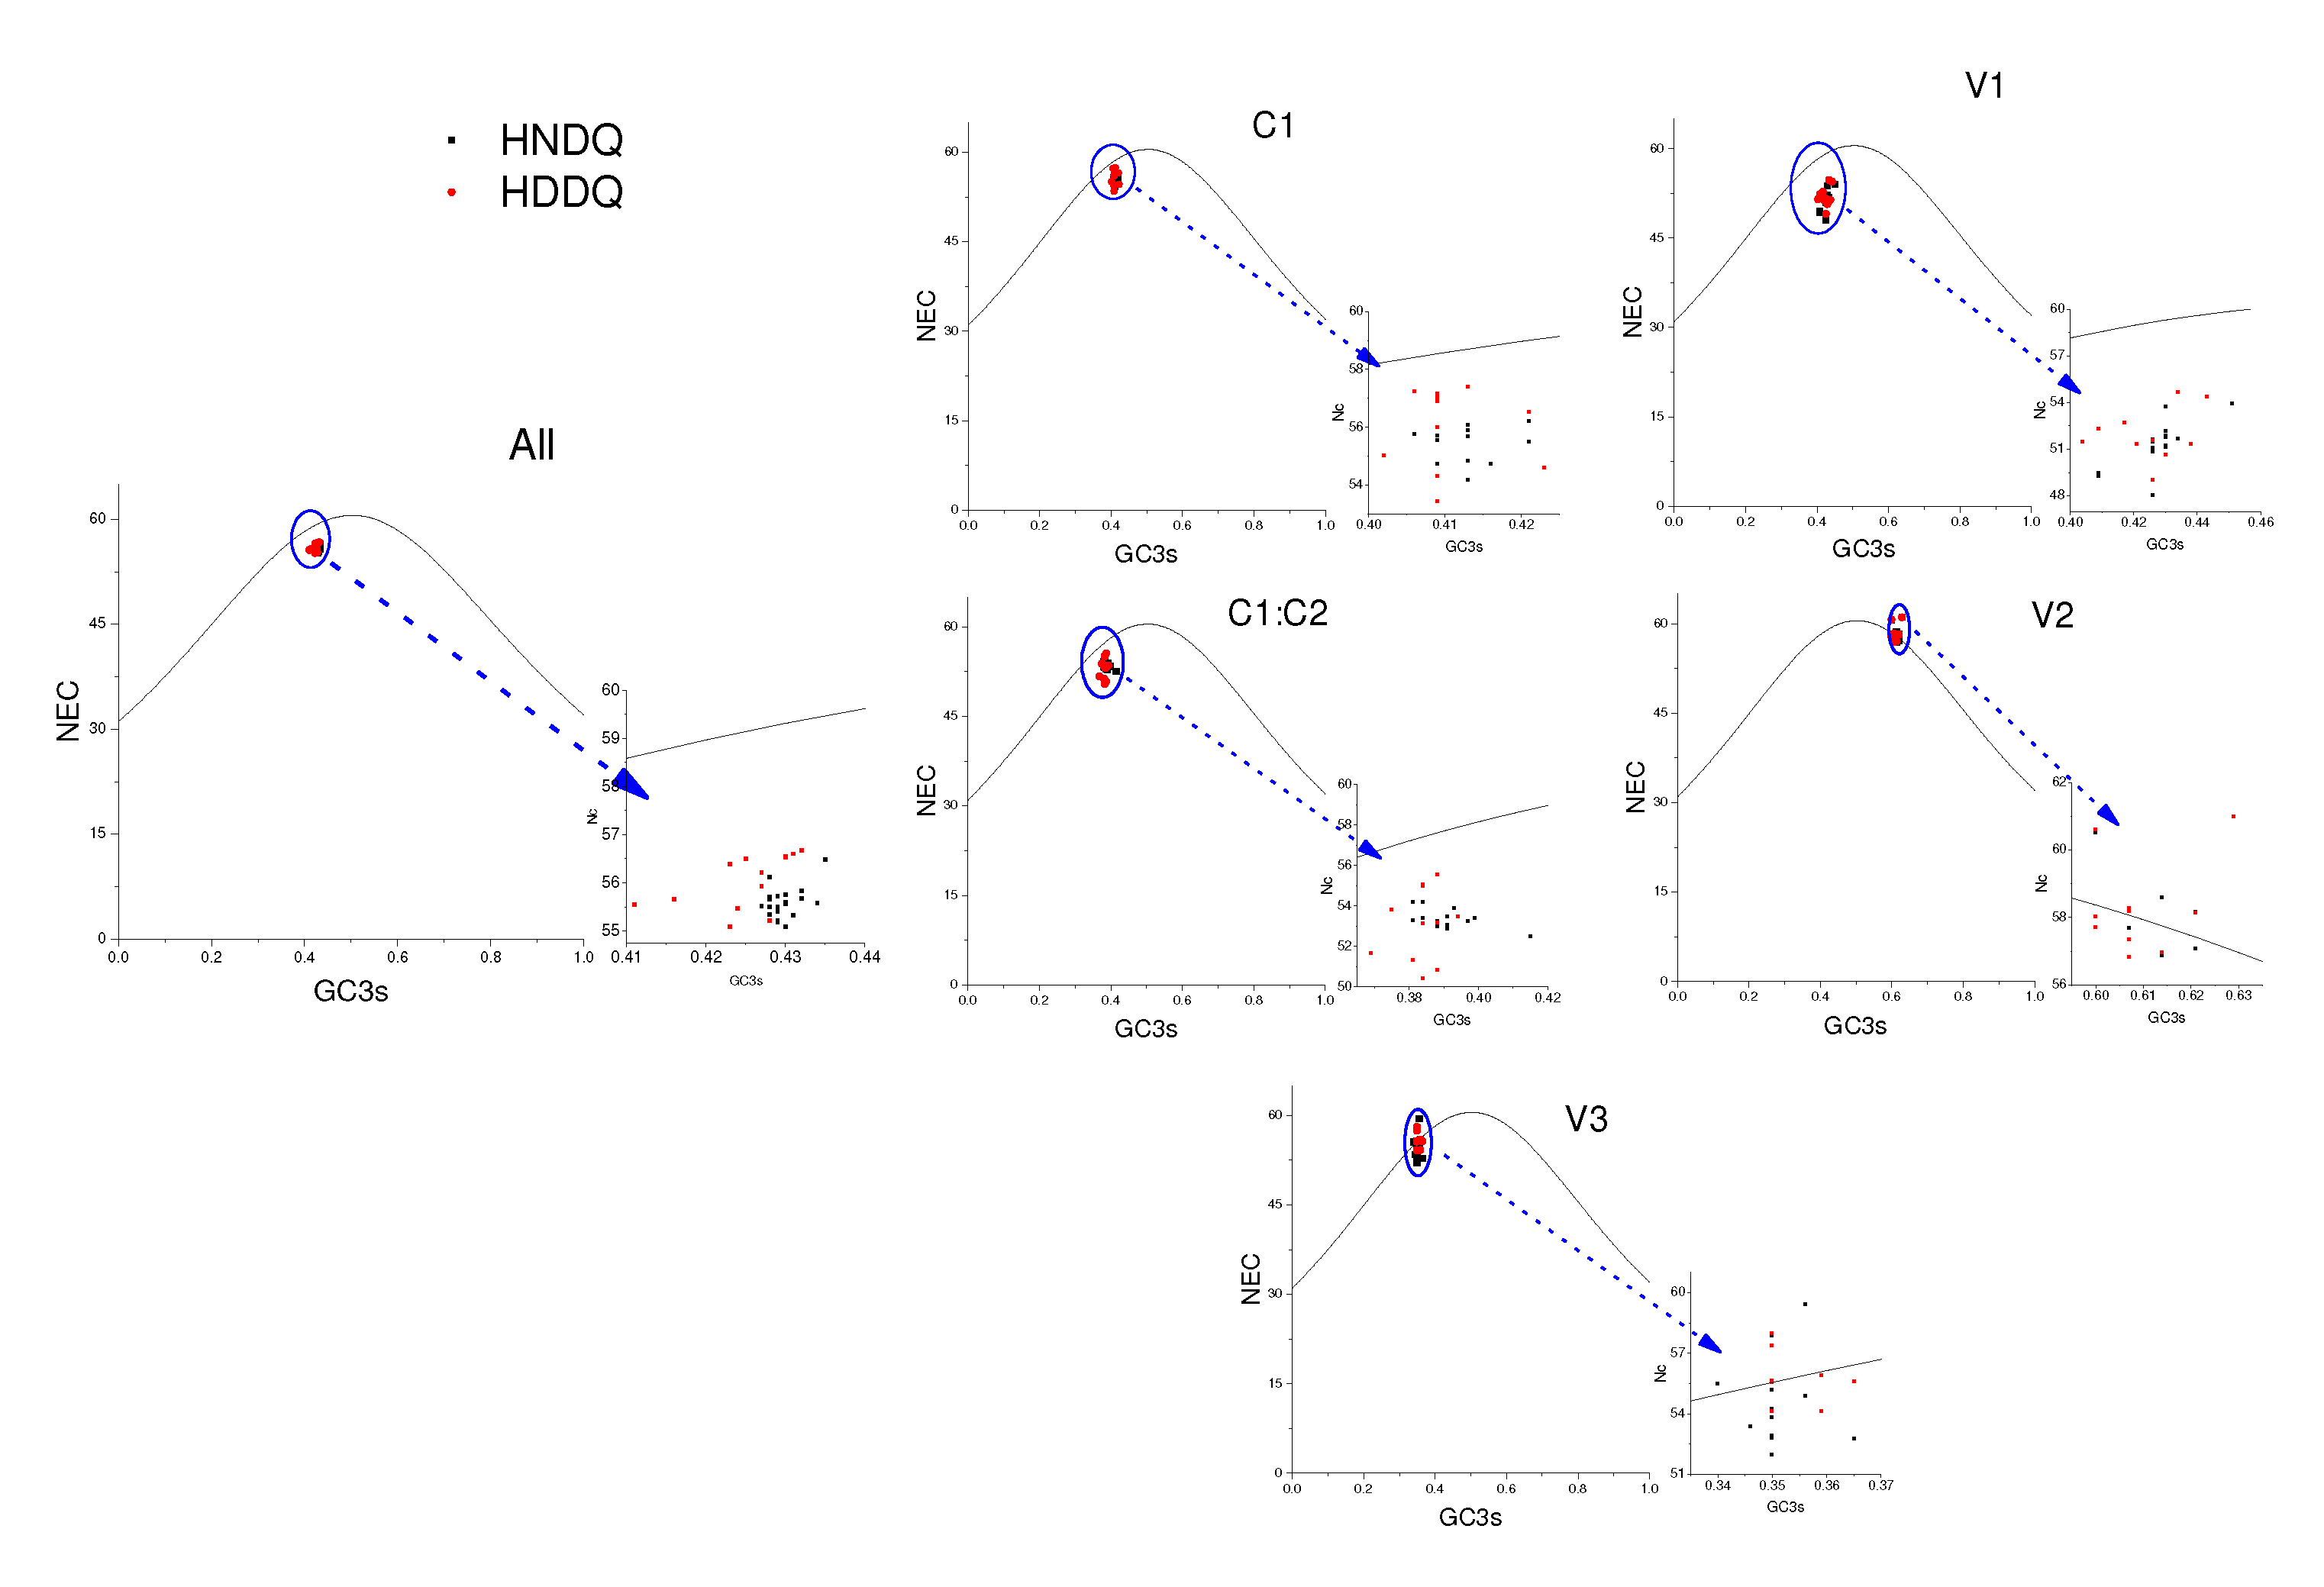
Mutational stress and natural selection heavily influence codon preference among genes and genomes. In this study, the codon usage in the MMDaV coding gene was subjected to the effective number of codons (ENC) analysis across a sequence inclusive of AV2-AV3-AV1-C1/C2-AC1, as well as exclusively on the coding gene. Observations from the resulting ENC-GC3s dot plot (
Figure 6) revealed that the ENC values for all coding genes tested were situated below the expected curve value, reflecting significant influence exerted by mutation pressure and natural selection. Indeed, specific genes, AV1, C1/C2, and AC1, deviate below the standard curve, pointing to mutational pressure and natural selection as key regulators of codon bias. Contrarily, genes AV2 and AV3 appear purely mutation-driven in their codon preference.
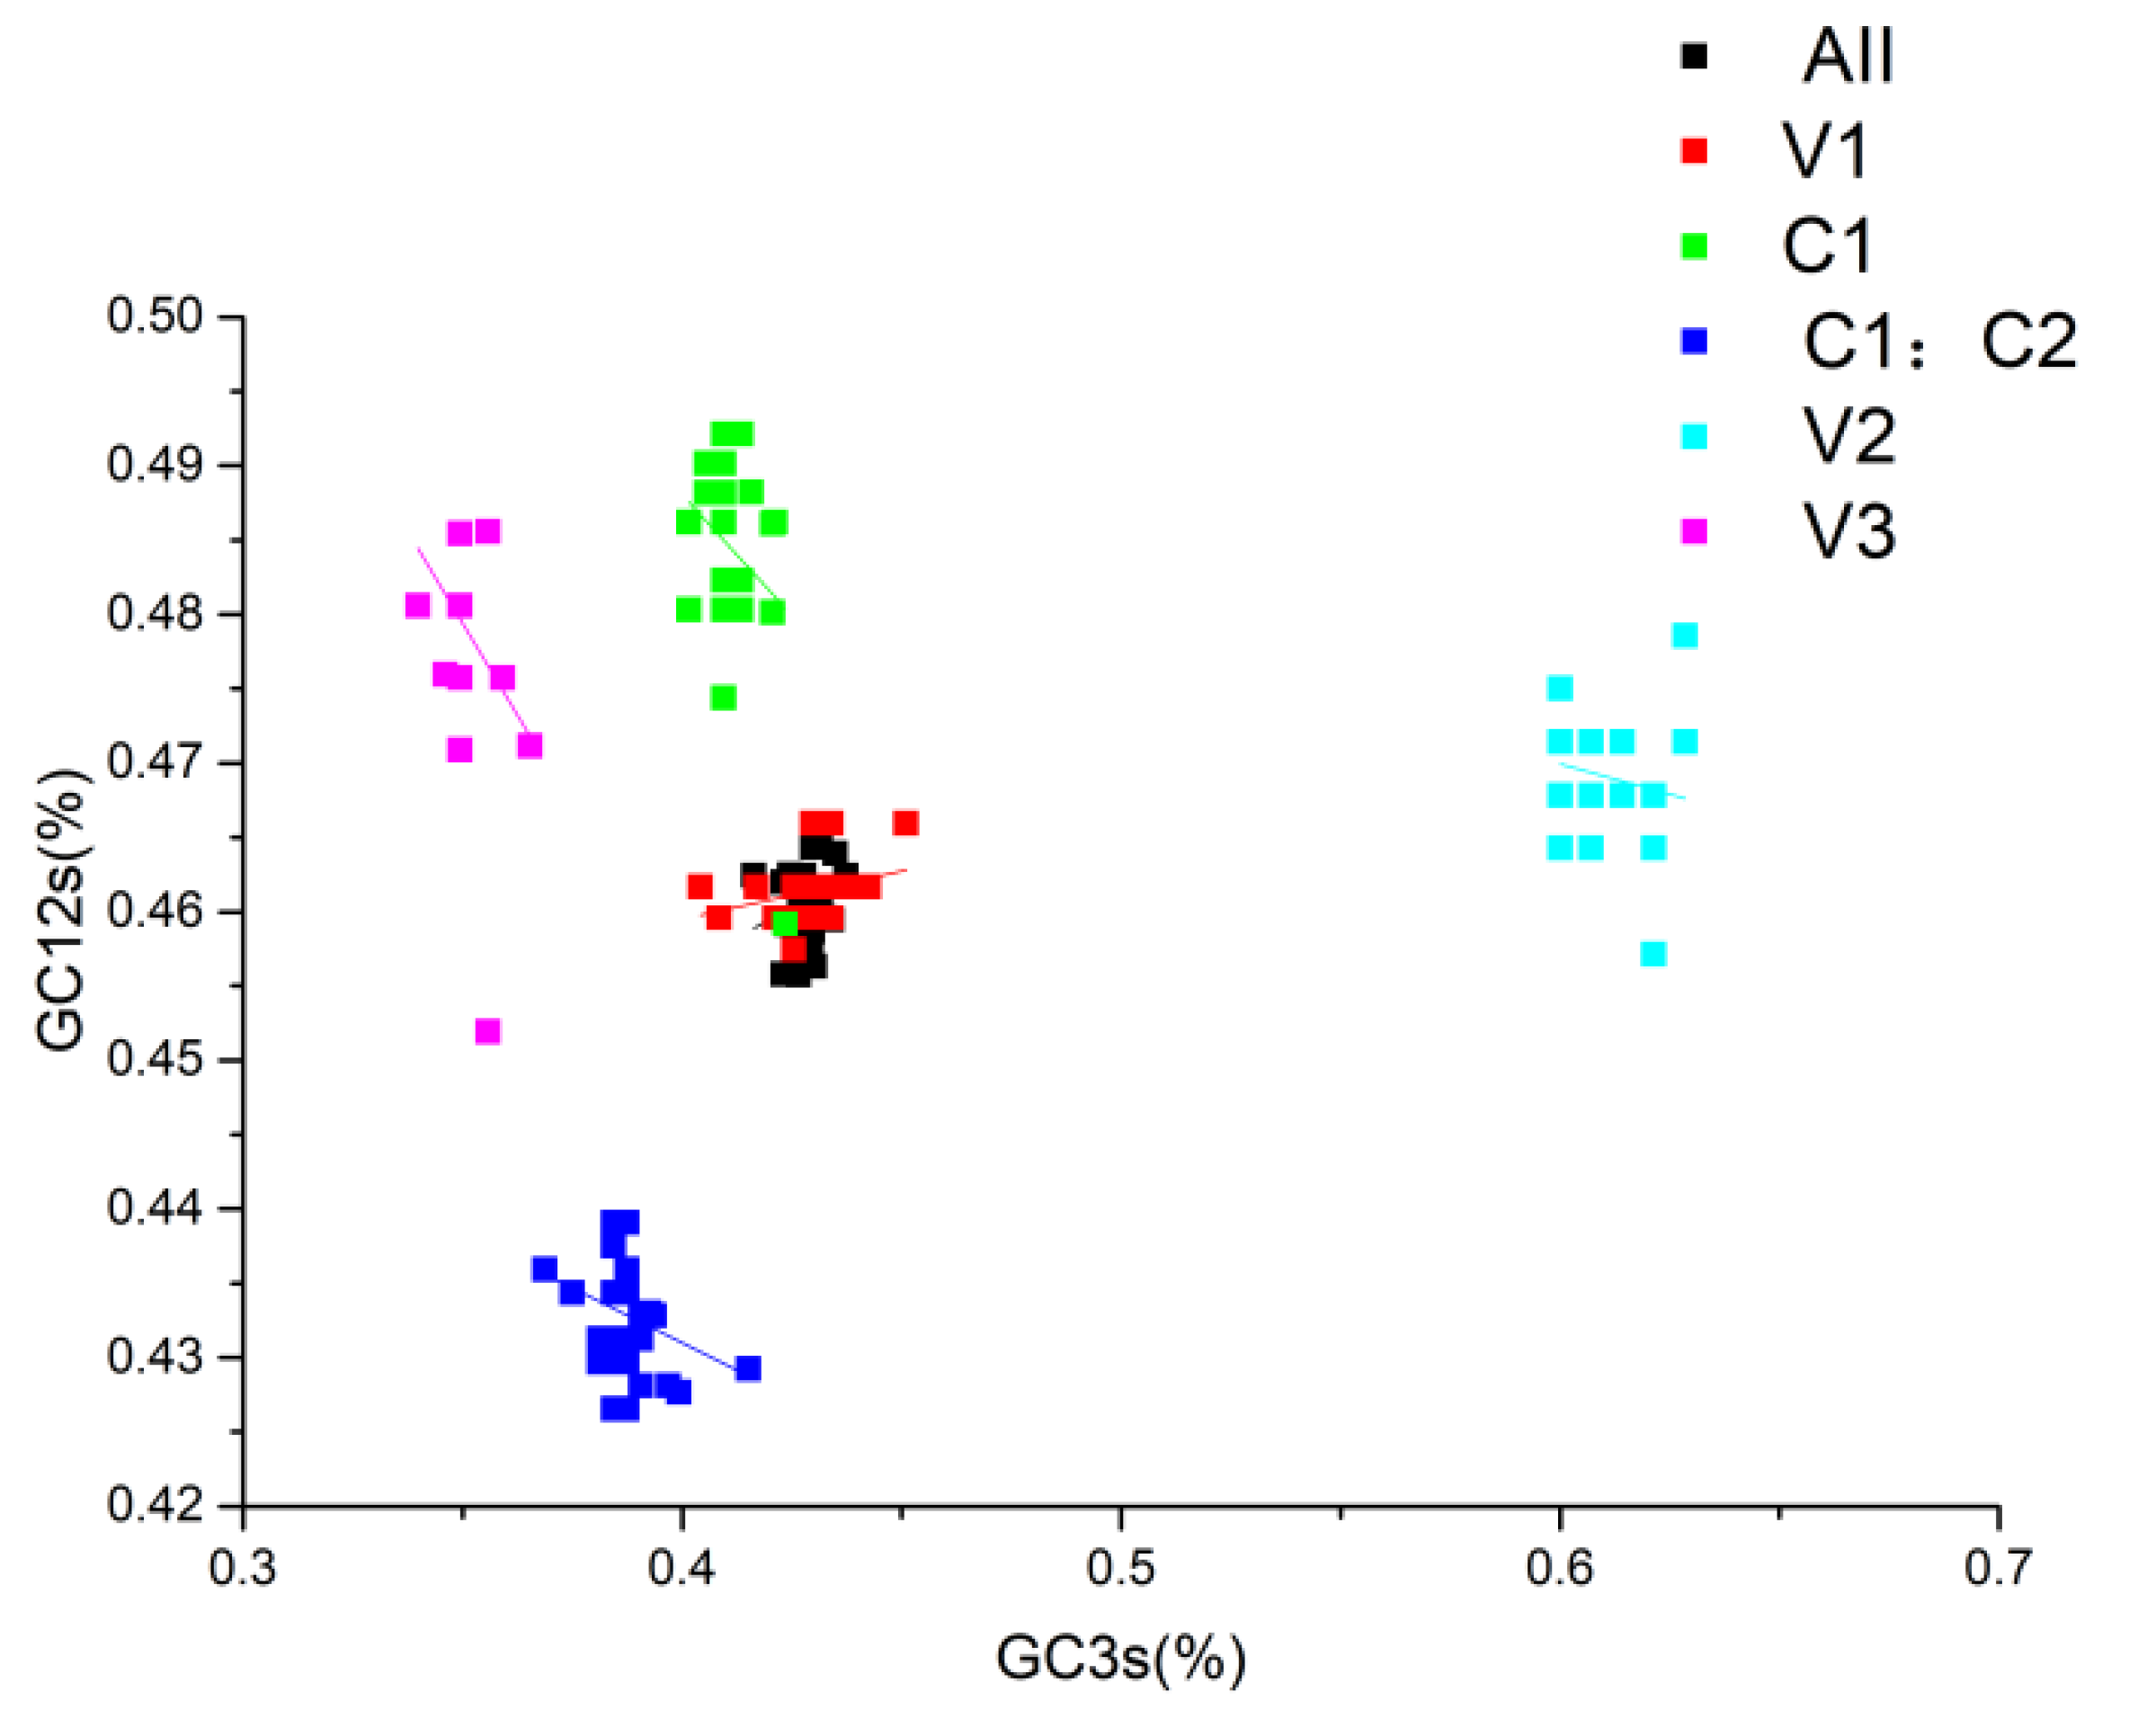
Continued exploration via Neutral analysis demonstrated that directional mutation pressure (P3) and averaged mutation pressure (P12) lack significant correlation (p=0.083), as shown in
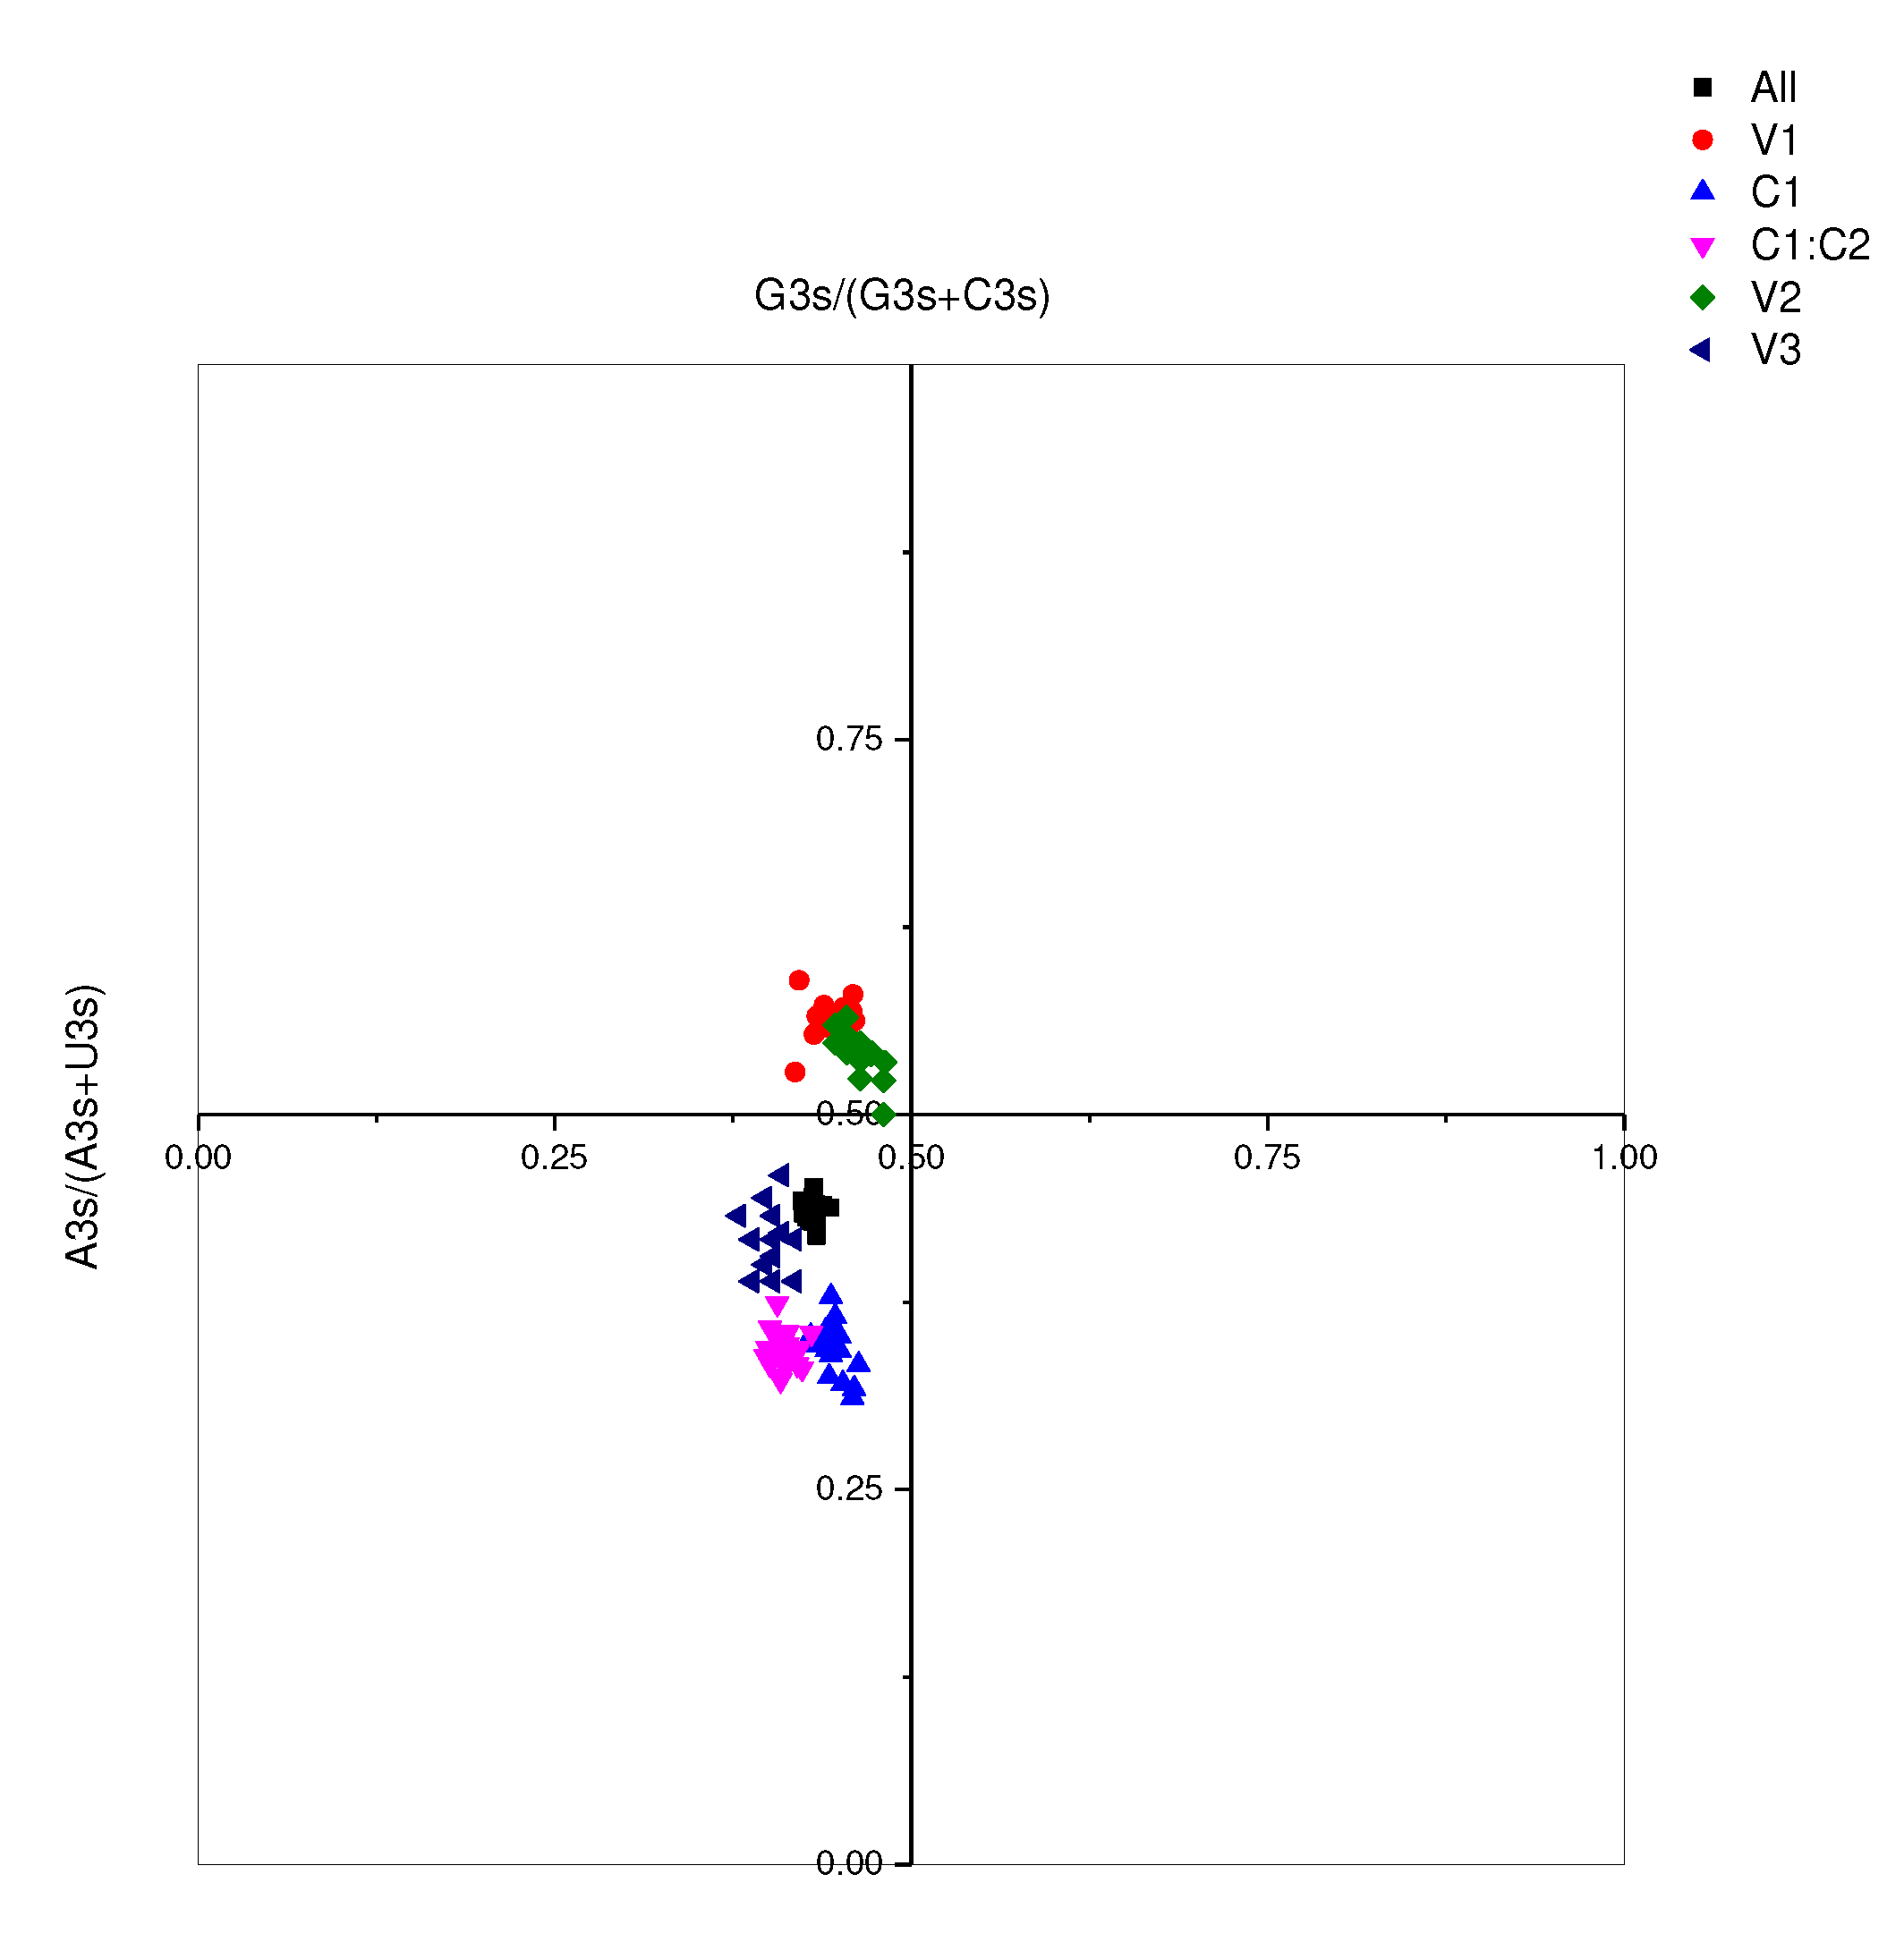
Figure 7. This is discernibly indicated by a graph slope of 0.1741, denoting that despite a sizable proportion (81.59%) of the variation being attributed to natural selection, 17.41% is influenced by abrupt pressure. Such governance of codon preference in MMDaV reasserts the prominence of natural selection. De-codonization analysis, or PR2 analysis, using G3s%/(G3s%+C3s%) and A3s%/(A3s%+T3s%) as variables, indicated clusters underscoring G3s% and A3s% as lower than their counter values C3s% and T3s% respectively, except in genes V1 and V2 where the A3s% values were higher than T3s% (
Figure 8). This suggests an apparent prevalence of codons in the A/U tail. It also emphasizes that mutational pressure is a vital driving factor for codon preference. Nevertheless, the role of other factors, notably natural selection, cannot be disregarded.
4. Discussion and conclusion
In light of our investigation into the novel Mulberry mosaic dwarf-associated virus (MMDaV) first identified in 2015, we have evaluated the genetic and genomic structure of the virus, its evolutionary relationship to existing genus viruses, and the implications for its classification within the realm of geminiviruses [
1,
24]. Even though MMDaV exhibits significant nucleic acid sequence differences from known geminiviruses, suggesting a distant evolutionary relationship, the current classification can only temporarily place it within an undetermined geminivirus family genus. The application of critical classification approaches such as nucleotide identity and phylogenetic tree analysis greatly informed the establishment of this classification. It was intriguing to note the distinct strains of MMDaV: HNDQ and HDDQ, highlighted by their divergent pairwise identity and phylogenetic positions. In alignment with this, geographical influences appear to manifest in the distribution profile of MMDaV, with virus circulation potentially influenced by the distribution of Chinese mulberry wood in geographically specific areas [
25].
Moreover, our exploration of the virus population's genetic stability revealed lower genetic diversity, potentially attributable to a bottleneck effect following the virus's proliferation within a new host or region. However, the conservation of protein-coding sequences, coupled with recombination events, appear to be contributing factors to the limited genetic diversity and evolution of geminiviruses[
26,
27,
28,
29]. Crucially, our analysis of the genetic diversity of 40 MMDaV genomes leveraging DnaSP software underlined fluctuations in genetic diversity across the MMDaV genome. The codon usage in MMDaV incites significant intrigue. While base composition mutation was identified as a critical determinant, it is clear that a more intricate blend of mutational effects and natural selection characterizes the unique codon usage profile of MMDaV. Furthermore, the assessment of codon preference divulged a weak codon usage bias in the virus symptomatic of the influence of both mutational stress and natural selection. However, conclusive findings suggest that natural selection is the primary driving force in shaping MMDaV's codon preference; the lack of a salient correlation between P12 and P3 points to the potential effect of other unknown factors.
Defining the codon usage profiles and their unique preferences in MMDaV offers valuable revelations on the virus's evolution and genetic diversity. Such insights deepen our understanding of the virus-host interactions and open viable pathways for future virus control strategies. However, supplementary research is necessary to thoroughly decipher the ecological significance and impact of the unique features of MMDaV.
References
- Ma, Y.; Navarro, B.; Zhang, Z.; Lu, M.; Zhou, X.; Chi, S.; Di Serio, F.; Li, S. Identification and molecular characterization of a novel monopartite geminivirus associated with mulberry mosaic dwarf disease. J Gen Virol. 2015, 96, 2421–2434. [Google Scholar] [CrossRef] [PubMed]
- Gutierrez, C. Geminivirus DNA replication. Cell Mol Life Sci. 1999, 56, 313–329. [Google Scholar] [CrossRef] [PubMed]
- Preiss, W.; Jeske, H. Multitasking in replication is common among geminiviruses. J Virol. 2003, 77, 2972–2980. [Google Scholar] [CrossRef]
- Fauquet, C.M.; Briddon, R.W.; Brown, J.K.; Moriones, E.; Stanley, J.; Zerbini, M.; Zhou, X. Geminivirus strain demarcation and nomenclature. Arch Virol. 2008, 153, 783–821. [Google Scholar] [CrossRef] [PubMed]
- Varsani, A.; Navas-Castillo, J.; Moriones, E.; Hernández-Zepeda, C.; Idris, A.; Brown, J.K.; Murilo Zerbini, F.; Martin, D.P. Establishment of three new genera in the family Geminiviridae: Becurtovirus, Eragrovirus and Turncurtovirus. Arch Virol. 2014, 159, 2193–2203. [Google Scholar] [CrossRef]
- Bernardo, P.; Golden, M.; Akram, M.; Naimuddin; Nadarajan, N.; Fernandez, E.; Granier, M.; Rebelo, A.G.; Peterschmitt, M.; Martin, D.P.; Roumagnac, P. Identification and characterization of a highly divergent geminivirus: evolutionary and taxonomic implications. Virus Res. 2013, 177, 35–45. [Google Scholar] [CrossRef]
- Loconsole, G.; Saldarelli, P.; Doddapaneni, H.; Savino, V.; Martelli, G.P.; Saponari, M. Identification of a single-stranded DNA virus associated with citrus chlorotic dwarf disease, a new member in the family Geminiviridae. Virology. 2012, 432, 162–172. [Google Scholar] [CrossRef]
- Al Rwahnih, M.; Dave, A.; Anderson, M.M.; Rowhani, A.; Uyemoto, J.K.; Sudarshana, M.R. Association of a DNA virus with grapevines affected by red blotch disease in California. Phytopathology. 2013, 103, 1069–1076. [Google Scholar] [CrossRef]
- Lefkowitz, E.J.; Dempsey, D.M.; Hendrickson, R.C.; Orton, R.J.; Siddell, S.G.; Smith, D.B. Virus taxonomy: the database of the International Committee on Taxonomy of Viruses (ICTV). Nucleic Acids Res. 2018, 46, D708–D717. [Google Scholar] [CrossRef]
- Xu, X.Z.; Liu, Q.P.; Fan, L.J.; Cui, X.F.; Zhou, X.P. Analysis of synonymous codon usage and evolution of begomoviruses. J Zhejiang Univ Sci B. 2008, 9, 667–674. [Google Scholar] [CrossRef]
- Murray, M.G.; Thompson, W.F. Rapid isolation of high molecular weight plant DNA. Nucleic Acids Res. 1980, 8, 4321–4325. [Google Scholar] [CrossRef] [PubMed]
- Edgar; Robert, C. MUSCLE v5 enables improved estimates of phylogenetic tree confidence by ensemble bootstrapping. BioRxiv 2021. [Google Scholar] [CrossRef]
- Muhire, B.M.; Varsani, A.; Martin, D.P. SDT: A Virus Classification Tool Based on Pairwise Sequence Alignment and Identity Calculation. PLoS ONE. 2014, 9, e108277. [Google Scholar] [CrossRef]
- Kumar, S.; Stecher, G.; Li, M.; Knyaz, C.; Tamura, K. MEGA X: Molecular Evolutionary Genetics Analysis across Computing Platforms. Mol Biol Evol. 2019, 35, 1547–1549. [Google Scholar] [CrossRef]
- Del Amparo, R.; Branco, C.; Arenas, J.; Vicens, A.; Arenas, M. Analysis of selection in protein-coding sequences accounting for common biases. Brief Bioinform. 2021, 22, 431. [Google Scholar] [CrossRef]
- Nei, M.; Li, W.H. Mathematical model for studying genetic variation in terms of restriction endonucleases. Proc Natl Acad Sci U S A. 1979, 76, 5269–5273. [Google Scholar] [CrossRef]
- Rozas, J.; Ferrer-Mata, A.; Sánchez-DelBarrio, J.C.; Guirao-Rico, S.; Librado, P.; Ramos-Onsins, S.E.; Sánchez-Gracia, A. DnaSP 6: DNA Sequence Polymorphism Analysis of Large Datasets. Mol. Biol. Evol. 2017, 34, 3299–3302. [Google Scholar] [CrossRef]
- Puigbo, P.; Bravo, I.G.; Garcia-Vallve, S. E-CAI: a novel server to estimate an expected value of Codon Adaptation Index (eCAI). BMC Bioinformatics, 2008, 9, 65. [Google Scholar] [CrossRef]
- Comeron, J.M.; Aguadé, M. An evaluation of measures of synonymous codon usage bias. J Mol Evol. 1998, 47, 268–274. [Google Scholar] [CrossRef]
- Paulet, D.; David, A.; Rivals, E. Ribo-seq enlightens codon usage bias. DNA Res. 2017, 4, 303–210. [Google Scholar] [CrossRef]
- Wright, F. The 'effective number of codons' used in a gene. Gene. 1990, 87, 23–29. [Google Scholar] [CrossRef] [PubMed]
- Sueoka, N. Directional mutation pressure and neutral molecular evolution. Proc Natl Acad Sci U S A. 1988, 85, 2653–2657. [Google Scholar] [CrossRef] [PubMed]
- Sueoka, N. Translation-coupled violation of Parity Rule 2 in human genes is not the cause of heterogeneity of the DNA G+C content of third codon position. Gene. 1999, 238, 53–58. [Google Scholar] [CrossRef] [PubMed]
- Lu, Q.Y.; Wu, Z.J.; Xia, Z.S.; Xie, L.H. Complete genome sequence of a novel monopartite geminivirus identified in mulberry (Morus alba L.). Arch Virol. 2015, 160, 2135–2138. [Google Scholar] [CrossRef] [PubMed]
- Tsompana, M.; Abad, J.; Purugganan, M.; Moyer, J.W. The molecular population genetics of the Tomato spotted wilt virus (TSWV) genome. Mol Ecol. 2005, 14, 53–66. [Google Scholar] [CrossRef]
- Faria, J.C.; Maxwell, D.P. Variability in Geminivirus Isolates Associated with Phaseolus spp. in Brazil. Phytopathology. 1999, 89, 262–268. [Google Scholar] [CrossRef]
- Gilbertson, R.L.; Rojas, M.R.; Russell, D.R.; Maxwell, D.P. Use of the asymmetric polymerase chain reaction and DNA sequencing to determine genetic variability of bean golden mosaic geminivirus in the Dominican Republic. J Gen Virol. 1991, 72, 2843–2848. [Google Scholar] [CrossRef]
- Sanz, A.I.; Fraile, A.; Gallego, J.M.; Malpica, J.M.; Garcia-Arenal, F. Genetic variability of natural populations of cotton leaf curl geminivirus, a single-stranded DNA virus. J Mol Evol. 1999, 49, 672–681. [Google Scholar] [CrossRef]
- Stenger, D.C.; McMahon, C.L. Genotypic diversity of beet curly top virus populations in the Western United States. Phytopathology. 1997, 87, 737–744. [Google Scholar] [CrossRef]
Figure 1.
Mulberry leaves infected with MMDaV.
Figure 1.
Mulberry leaves infected with MMDaV.
Figure 2.
The SDT interface. (A) Colour-coded matrix generated from 39 MMDaV. Each coloured cell represents a percentage identity score between two sequences (one indicated horizontally to the left and the other vertically at the bottom). (B) Pairwise identity frequency distribution plot. The horizontal axis indicates the percentage of pairwise identities, and the vertical axis shows the proportions of these identities within the distribution. While peaks on the graph indicate pairwise sequence identity thresholds that would yield the most ambiguous classifications, troughs indicate thresholds that would generate the least ambiguous varieties and could, therefore, be tentatively used as relatively conflict-free operational taxonomic unit demarcation cut-offs—distribution plots of pairwise identity scores. The peaks (94%) indicate demarcation thresholds that would likely yield classifications with high degrees of conflict.
Figure 3.
Comparative analysis of MMD aV (NJ method) (bootStrap=1000). Black dots represent genome nucleic acid sequences from Zhejiang or Shanxi Shaanxi Ankang. Red dots represent genome nucleic acid sequences from Hainan (numbered the first two digits HN). Green dots represent genomic nucleic acid sequences from Guangxi(the first two digits are GX). Blue dots represent genome nucleic acid sequences from Guangdong (the first two digits are GD). Purple dots represent genome nucleic acid sequences from Chongqing (the first two digits are CQ). The sample number is shown in
Table 1.
Figure 4.
Pi and theta of MMDaV. The horizontal axis indicates nucleotide position, and the vertical axis indicates Pi and Theta. The statistics are based on 100 bases and 25 bases in steps. Theta represents the Watterson estimate, and pi represents the average of the paired nucleotide differences. The V1 nucleotide position is from 607 to 1344; the V2 nucleotide position is from 369 to 818; the V3 nucleotide position is from 236 to 553; the C1:C2 nucleotide position is from 2048 to 2842; the C1 nucleotide position is from 1737 to 2135 and 2237 to 2842.
Figure 5.
Correspondence analysis plots. HNDQ and HDDQ are two strains, All indicating all coding gene sequences, and C1, C1: C2, V1, V2, and V3 are five coding genes.
Figure 5.
Correspondence analysis plots. HNDQ and HDDQ are two strains, All indicating all coding gene sequences, and C1, C1: C2, V1, V2, and V3 are five coding genes.
Figure 6.
The dot-like analysis of ENC-GC3s genome and gene of MMDaV. HN indicates the local strain in South China, HD indicates the local strain in East China, All indicates the corresponding analysis and mapping of all coding gene sequences, and C1, C1: C2, V1, V2, and V3 are the corresponding analytical plots of five coding genes.
Figure 7.
Neutral plot analysis of GC3s(%) and GC12s(%). Various colours correspond to distinct genes and are indicated in the figure.
Figure 7.
Neutral plot analysis of GC3s(%) and GC12s(%). Various colours correspond to distinct genes and are indicated in the figure.
Figure 8.
PR2 drawing analysis. Various colours correspond to distinct genes and are indicated in the figure.
Figure 8.
PR2 drawing analysis. Various colours correspond to distinct genes and are indicated in the figure.
Table 1.
Sample Collection Information.
Table 1.
Sample Collection Information.
| Time/year-month-day |
Location |
Coordinate |
Samples serial number |
| 2017 06 15 |
Wengyuan City, Guangdong |
24.34° N, 114.13° E |
GDWY1 GDWY2 |
| 2017 07 10 |
Yingde City, Guangdong |
24.17° N, 113.46° E |
GDYD1 GDYD2 |
| 2017 07 17 |
Binyang City, Guangxi |
24.17° N, 113.46° E |
GXBY1 GXBY2 GXBY3 |
| 2017 07 18 |
Liucheng City, Guangxi |
24.60° N, 108.98° E |
GXLC1 GXLC2 |
| 2017 07 19 |
Liucheng City, Guangxi |
24.52° N, 109.26° E |
GXLC3 GXLC4 |
| 2017 08 03 |
Qiongzhong City, Hainan |
19.02° N, 109.73° E |
HNQZ1 HNQZ2 |
| 2017 08 05 |
zhanzhou City, Hainan |
19.51° N, 109.53° E |
HNZZ1 HNZZ2 |
| 2017 08 14 |
Luoding City, Guangdong |
22.72° N, 111.52° E |
GDLD1 |
| 2017 08 14 |
22.62° N, 111.55° E |
GDLD2 |
| 2017 08 14 |
22.72° N, 111.46° E |
GDLD3 |
| 2017 08 14 |
22.82° N, 111.39° E |
GDLD4 |
| 2017 08 14 |
22.72° N, 111.60° E |
GDLD5 |
| 2017 08 15 |
Huazhou City, Guangdong |
22.00° N, 110.60° E |
GDHZ |
| 2017 08 16 |
Yangjiang City, Guangdong |
22.31° N, 111.87° E |
GDYJ |
| 2017 09 18 |
Tianhe City Guangdong |
23.16° N, 113.36° E |
GDTH1 GDTH2 GDTH3 GDTH4 |
| 2017 10 27 |
Dinjiang City, Chongqing |
30.32N, 107.36E |
CQDJ |
| 2017 10 29 |
Chongqing Southwest University |
29.82N, 106.43E |
CQXN1 CQXN2 CQXN3 |
Table 2.
Descriptions and sequences obtained from GenBank of the MMDaV used in the phylogenetic analysis.
Table 2.
Descriptions and sequences obtained from GenBank of the MMDaV used in the phylogenetic analysis.
| No. |
Name |
Strains |
length(bp) |
GC% |
Accession Numbers |
| 1 |
Mulberry mosaic dwarf associated virus |
AK1-3 |
2952 |
43.4 |
KP699128 |
| 2 |
Mulberry mosaic dwarf associated virus |
AK1-4 |
2952 |
43.4 |
KP699129 |
| 3 |
Mulberry mosaic dwarf associated virus |
AK1-8 |
2952 |
43.4 |
KP303687 |
| 4 |
Mulberry mosaic dwarf associated virus |
AK2-14 |
2952 |
43.4 |
KP699130 |
| 5 |
Mulberry mosaic dwarf associated virus |
AK2-18 |
2952 |
43.4 |
KP728254 |
| 6 |
Mulberry mosaic dwarf associated virus |
AK2-38 |
2952 |
43.7 |
KP699131 |
| 7 |
Mulberry mosaic dwarf associated virus |
JS |
2952 |
43.5 |
KR131749 |
| 8 |
Mulberry mosaic dwarf associated virus |
AK3-54 |
2952 |
41.9 |
KP699132 |
| 9 |
Mulberry mosaic dwarf associated virus |
AK1-8 |
2952 |
43.4 |
NC_026771.1 |
| 10 |
Mulberry mosaic dwarf associated virus |
GDTH1 |
2938 |
43.4 |
This work |
| 11 |
Mulberry mosaic dwarf associated virus |
GDTH2 |
2942 |
43.0 |
This work |
| 12 |
Mulberry mosaic dwarf associated virus |
GDTH3 |
2956 |
43.1 |
This work |
| 13 |
Mulberry mosaic dwarf associated virus |
GDTH4 |
2935 |
43.0 |
This work |
| 14 |
Mulberry mosaic dwarf associated virus |
GDTH5 |
2947 |
43.3 |
This work |
| 15 |
Mulberry mosaic dwarf associated virus |
GDLD1 |
2908 |
43.5 |
This work |
| 16 |
Mulberry mosaic dwarf associated virus |
GDLD2 |
2929 |
43.1 |
This work |
| 17 |
Mulberry mosaic dwarf associated virus |
GDLD3 |
2953 |
43.4 |
This work |
| 18 |
Mulberry mosaic dwarf associated virus |
GDLD4 |
2954 |
43.2 |
This work |
| 19 |
Mulberry mosaic dwarf associated virus |
GDLD5 |
2953 |
43.4 |
This work |
| 20 |
Mulberry mosaic dwarf associated virus |
GDYD1 |
2942 |
43.4 |
This work |
| 21 |
Mulberry mosaic dwarf associated virus |
GDYD2 |
2955 |
43.2 |
This work |
| 22 |
Mulberry mosaic dwarf associated virus |
GDWY1 |
2953 |
43.2 |
This work |
| 23 |
Mulberry mosaic dwarf associated virus |
GDWY2 |
2952 |
43.1 |
This work |
| 24 |
Mulberry mosaic dwarf associated virus |
GDYJ1 |
2952 |
43.2 |
This work |
| 25 |
Mulberry mosaic dwarf associated virus |
GDHZ1 |
2941 |
43.2 |
This work |
| 26 |
Mulberry mosaic dwarf associated virus |
GXLC1 |
2940 |
43.0 |
This work |
| 27 |
Mulberry mosaic dwarf associated virus |
GXLC2 |
2960 |
43.2 |
This work |
| 28 |
Mulberry mosaic dwarf associated virus |
GXLC3 |
2933 |
43.3 |
This work |
| 29 |
Mulberry mosaic dwarf associated virus |
GXLC4 |
2953 |
43.3 |
This work |
| 30 |
Mulberry mosaic dwarf associated virus |
GXBY1 |
2960 |
43.3 |
This work |
| 31 |
Mulberry mosaic dwarf associated virus |
GXBY2 |
2956 |
43.2 |
This work |
| 32 |
Mulberry mosaic dwarf associated virus |
GXBY3 |
2953 |
43.1 |
This work |
| 33 |
Mulberry mosaic dwarf associated virus |
HNQZ1 |
2952 |
43.2 |
This work |
| 34 |
Mulberry mosaic dwarf associated virus |
HNQZ2 |
2954 |
43.2 |
This work |
| 35 |
Mulberry mosaic dwarf associated virus |
HNZZ1 |
2954 |
43.2 |
This work |
| 36 |
Mulberry mosaic dwarf associated virus |
HNZZ2 |
2953 |
43.5 |
This work |
| 37 |
Mulberry mosaic dwarf associated virus |
CQDJ1 |
2952 |
43.6 |
This work |
| 38 |
Mulberry mosaic dwarf associated virus |
CQXN1 |
2941 |
43.3 |
This work |
| 39 |
Mulberry mosaic dwarf associated virus |
CQXN2 |
2959 |
43.4 |
This work |
Table 3.
Table of nucleotide diversity and ka/ks.
Table 3.
Table of nucleotide diversity and ka/ks.
| Gene |
Nucleotide diversity |
ka/ks |
| C1:C2 |
0.05414±0.00214 |
0.17256 |
| C1 |
0.07207±0.00320 |
0.20587 |
| V1 |
0.02313±0.00205 |
0.07880 |
| V3 |
0.01782±0.01821 |
0.61544 |
| V2 |
0.01765±0.01808 |
0.2323 |
Table 4.
Analysis of the corresponding parameters of all MMDaV coding genes and individual genes.
Table 4.
Analysis of the corresponding parameters of all MMDaV coding genes and individual genes.
| |
All(mean±SD) |
V1(mean±SD) |
C1(mean±SD) |
C1:C2(mean±SD) |
V2(mean±SD) |
V3(mean±SD) |
| A3s% |
24.59%±0.23 |
25.40%±0.76 |
26.21%±0.42 |
25.10%±0.46 |
17.98%± 0.27 |
26.11%±0.60 |
| G3s% |
18.74%±0.23 |
24.10%±0.47 |
14.35%±0.47 |
13.39%±0.39 |
33.30%±0.60 |
14.08%±0.79 |
| C3s% |
24.14%±0.38 |
18.88%±0.77 |
26.77%±0.75 |
25.29%±0.67 |
27.95%±1.00 |
20.99%±0.58 |
| U3s% |
32.53%±0.33 |
31.62%±0.76 |
32.66%±0.52 |
36.22%±0.66 |
20.77%±0.82 |
38.81%±0.63 |
| GC3s% |
42.88%±0.35 |
42.98%±1.06 |
41.13%±0.46 |
38.68%±0.72 |
61.25%±0.90 |
35.08%±0.51 |
| GC2s% |
56.67%±0.31 |
46.21%±0.27 |
42.43%±0.75 |
61.51%+0.52 |
41.71%±0.42 |
42.40%±0.64 |
| GC1s% |
50.44%±0.30 |
46.07%±0.29 |
54.45%±0.59 |
48.81%±0.42 |
52.07%±0.51 |
53.41%±0.87 |
| GC12s% |
46.10%±0.28 |
46.14%±0.17 |
48.44%±0.63 |
43.30%±0.38 |
46.89%±0.35 |
47.90%±0.63 |
| A% |
28.93%±0.23 |
29.90%±0.24 |
28.02%±0.33 |
29.30%±0.23 |
28.11%±0.26 |
28.64%±0.27 |
| C% |
21.55%±0.24 |
18.51%±0.38 |
24.97%±0.28 |
21.28%±0.22 |
21.39%±0.41 |
21.60%±0.42 |
| U% |
26.01%±0.13 |
25.13%±0.26 |
25.63%±0.20 |
28.58%±0.21 |
20.99%±0.34 |
28.01%±0.39 |
| G% |
23.52%±0.17 |
26.46%±0.14 |
21.38%±0.34 |
20.84%±0.15 |
29.51%±0.29 |
21.75%±0.24 |
| GC% |
45.07%±0.23 |
44.97%±0.39 |
46.35%±0.43 |
42.11%±0.27 |
50.90%±0.32 |
43.35%±0.37 |
| AU% |
54.93%±0.23 |
55.03%±0.39 |
53.65%±0.43 |
57.89%±0.27 |
49.10%±0.32 |
56.65%±0.37 |
Table 5.
Relative Synonymous Codon Usage (RSCU) for each codon.
Table 5.
Relative Synonymous Codon Usage (RSCU) for each codon.
| AA. |
codon |
All |
HN. |
HD |
AA. |
codon |
All |
HN. |
HD. |
| Phe |
UUU |
1.04 |
1.22 |
1.04 |
Ser |
UCU |
1.33 |
1.09 |
1.21 |
| |
UUC |
0.96 |
0.78 |
0.96 |
|
UCC |
0.93 |
1.02 |
0.88 |
| Leu |
UUA |
1.17 |
1.21 |
1.5 |
|
UCA |
0.86 |
0.89 |
0.61 |
| |
UUG |
1.46 |
1.5 |
1.42 |
|
UCG |
0.53 |
0.89 |
0.88 |
| |
CUU |
1.17 |
1.29 |
1.2 |
|
AGU |
1.69 |
1.5 |
1.69 |
| |
CUC |
0.73 |
0.57 |
0.75 |
|
AGC |
0.66 |
0.61 |
0.74 |
| |
CUA |
0.8 |
0.79 |
0.52 |
Pro |
CCU |
1.1 |
0.81 |
1.17 |
| |
CUG |
0.66 |
0.64 |
0.6 |
|
CCC |
0.73 |
0.88 |
0.86 |
| Ile |
AUU |
2.03 |
1.86 |
1.97 |
|
CCA |
1.25 |
1.56 |
1.11 |
| |
AUC |
0.51 |
0.83 |
0.62 |
|
CCG |
0.92 |
0.75 |
0.86 |
| |
AUA |
0.46 |
0.31 |
0.41 |
Thr |
ACU |
1.01 |
1.19 |
0.98 |
| Val |
GUU |
1.4 |
1.6 |
1.53 |
|
ACC |
1.3 |
1.48 |
1.43 |
| |
GUC |
1.25 |
1.05 |
1 |
|
ACA |
1.26 |
0.89 |
1.21 |
| |
GUA |
0.55 |
0.55 |
0.65 |
|
ACG |
0.43 |
0.44 |
0.38 |
| |
GUG |
0.79 |
0.8 |
0.82 |
Ala |
GCU |
1.2 |
0.85 |
1.05 |
| Tyr |
UAU |
1.02 |
1 |
1.07 |
|
GCC |
1.35 |
1.57 |
1.35 |
| |
UAC |
0.98 |
1 |
0.93 |
|
GCA |
0.96 |
1.25 |
1.29 |
| His |
CAU |
1.24 |
1.37 |
1.24 |
|
GCG |
0.48 |
0.33 |
0.31 |
| |
CAC |
0.76 |
0.63 |
0.76 |
Cys |
UGU |
1 |
1.13 |
1.27 |
| Gln |
CAA |
1.11 |
1.1 |
1.11 |
|
UGC |
1 |
0.87 |
0.73 |
| |
CAG |
0.89 |
0.9 |
0.89 |
Arg |
CGU |
0.56 |
0.7 |
0.62 |
| Asn |
AAU |
1.5 |
1.37 |
1.37 |
|
CGC |
0.21 |
0.21 |
0.14 |
| |
AAC |
0.5 |
0.63 |
0.63 |
|
CGA |
1.12 |
0.98 |
0.83 |
| Lys |
AAA |
0.86 |
1.08 |
1.03 |
|
CGG |
0.63 |
0.63 |
0.55 |
| |
AAG |
1.14 |
0.92 |
0.97 |
|
AGA |
2 |
2.16 |
2.55 |
| Asp |
GAU |
0.93 |
0.97 |
0.9 |
|
AGG |
1.47 |
1.33 |
1.31 |
| |
GAC |
1.07 |
1.03 |
1.1 |
Gly |
GGU |
0.83 |
1.1 |
0.71 |
| Glu |
GAA |
1 |
1 |
0.94 |
|
GGC |
1.17 |
1.23 |
1.36 |
| |
GAG |
1 |
1 |
1.06 |
|
GGA |
1.38 |
1.03 |
1.29 |
| |
|
|
|
|
|
GGG |
0.62 |
0.65 |
0.64 |
|
Disclaimer/Publisher’s Note: The statements, opinions and data contained in all publications are solely those of the individual author(s) and contributor(s) and not of MDPI and/or the editor(s). MDPI and/or the editor(s) disclaim responsibility for any injury to people or property resulting from any ideas, methods, instructions or products referred to in the content. |
© 2023 by the authors. Licensee MDPI, Basel, Switzerland. This article is an open access article distributed under the terms and conditions of the Creative Commons Attribution (CC BY) license (http://creativecommons.org/licenses/by/4.0/).
