Preprint
Article

Analysis of Price Influencing Factors of Small-Scale Agricultural Products Based on Network Perspective

Altmetrics

Downloads

119

Views

48

Comments

0

A peer-reviewed article of this preprint also exists.

This version is not peer-reviewed

Submitted:

22 September 2023

Posted:

26 September 2023

You are already at the latest version

Alerts
Abstract
In recent years, the high-frequency abnormal price fluctuations of small-scale agricultural products have been detrimental to market stability. The traditional method based on statistical data of production factors can no longer accurately predict abnormal price fluctuations. Taking scallions as a case, the paper identifies price influencing factors from massive network information, and analyzes the causes and changing characteristics of price fluctuations from four perspectives: market supply, economic environment and market sentiment, and attention. Initially, the study employs an LDA topic model to extract factors from online sentiment data over the past four years, including market supply and demand, economic conditions, related agricultural prices, and market attention. Subsequently, using the SO-PMI algorithm to expand domain-specific lexicons and employing semantic and sentiment analysis with syntactic parsing, the study aims to improve the accuracy of sentiment quantification in text analysis. Furthermore, cointegration and Granger causality tests validate the significant impact of these factors on scallion price fluctuations, mitigating spurious regression issues. Finally, by employing a TVP-VAR model, the study compares the impulse responses and shock magnitudes of various factors in different time and spatial dimensions. It also delves into the mechanisms of heterogeneous impacts and trends in scallion prices, considering the corresponding socio-economic context and public sentiment events within specific time windows, thereby providing valuable decision-making insights for the healthy development of agricultural markets.
Keywords: 
Subject: Business, Economics and Management  -   Econometrics and Statistics

1. Introduction

As a large agricultural country, China 's agricultural economy is extremely important in the national economy. In recent years, although the national income and consumption level have been steadily improved, the emergence of COVID-19 has seriously impacted China 's agricultural market, and the price fluctuation of agricultural products in China has become increasingly intensified [1]. These situations have affected the daily life of the people, damaged the income of each subject in the market, and also limited the development of related industries. Studies have shown that small-scale agricultural products are different from large-scale agricultural products due to their small total output, concentrated production areas, and large changes in demand elasticity. Their prices are highly susceptible to factors such as market sentiment, sudden social events (such as epidemic diseases) and climate change caused by online public opinion. Therefore, there will be frequent fluctuations in prices in the short term, with the most obvious fluctuations in scallion, ginger, garlic [2], and this situation is only based on historical price data or conventional supply and demand and meteorological factors, It is difficult to find and define other influencing factors that affect market conditions and price changes in time, Therefore, in recent years, online public opinion analysis has become an effective way to solve this problem.
In recent years, social platforms are the most direct channels for people to release and obtain information. Network public opinion also reflects the concerns, subjective attitudes, and opinions of the general public. The relevant information of agricultural product prices and market expectations has attracted more and more attention. Therefore, the emotional tendencies and expectations greatly affect the specific production and operation, consumption decision-making and behavior of various market players in the industrial chain, such as growers, intermediaries, and consumers, thus affecting the market. In the research on the analysis of the influencing factors of agricultural product prices and price forecasting, the analysis of network public opinion has also been paid more and more attention. [3] Therefore, the research of network public opinion can explore the various influencing factors that affect the future market price, but the network public opinion has a certain degree of ' conduction effect ' [6], ' conformity effect ' [7] and ' opinion leader effect ' [8]. When the price of agricultural products rises significantly, people 's negative emotions for higher prices will form a trend of accepting ' popularity ' according to the consistency of individuals. Because the herd mentality inhibits the subjective initiative of the hearer to understand the information, it is easy to make the relevant public opinion present a ' one-sided ' situation; at the same time, opinion leaders in social media constitute an important source of information and influence, which affects the emotional tendencies of most people, thus affecting the expectations and behavioral decisions of market players. Therefore, how to extract and quantify key influencing factors from complex networks has become an important and challenging research direction.
The price of agricultural products is closely related to people 's lives. When the market fluctuates greatly, it will attract more people 's attention and participate in the discussion. Especially during the epidemic period, the uncertainty and risks faced by production and market sales highlight the panic and anxiety of the people. [5] Therefore, in order to ensure the sustainable development of agriculture, China 's government departments and institutions respond in a timely manner and formulate effective policies to alleviate the negative effects of the epidemic on the premise of fully understanding the public opinion. Scallion is a typical small-scale agricultural product, and China is the largest producer, consumer and exporter of scallion. Scallion industry is very important in China 's agriculture. In recent years, the abnormal fluctuation of scallion price is particularly obvious, and the frequent social events in recent years are more likely to spread and ferment through network public opinion, which also indirectly damages the credibility of the government 's social security.
This paper takes scallion as the research object, combines public opinion analysis to conduct in-depth research on the key influencing factors of scallion price and their influencing effects, from the national macro policy orientation, the overall market situation, the impact and impact of the new coronavirus epidemic, the expectations and emotional tendencies of market players, and the market hot money speculation. The key influencing factors of scallion price are deeply explored and refined, and the TVP-VAR model is used to analyze the pulse of each factor.
The remaining structure of this article is as follows: The second section is the relevant research literature on the factors affecting the price of small agricultural products, the relationship between network public opinion and market price, and the method of network public opinion; the third section describes the data acquisition and preprocessing process and qualitatively analyzes the network public opinion factors affecting the price of scallion. The fourth section optimizes the text sentiment analysis method and completes the quantitative analysis; in the fifth section, through the space-time pulse analysis of TVP-VAR model, the corresponding mechanism of action is studied and some suggestions are put forward for the stability of the price of small-scale agricultural products. The sixth section is the research limitations and prospects.

2. Related Research

Currently, research on agricultural sentiment issues has garnered attention and discussion from scholars across various fields both domestically and internationally. This paper primarily provides a concise overview of the current research status in four aspects related to small-scale agricultural product price influencing factors, the relationship between online public sentiment and market prices, sentiment hotspots discovery and topic extraction, and clustering and sentiment analysis.

2.1. Influencing Factors of the Price

Scallions fall under the category of small-scale agricultural products, characterized by small-scale production and market scales. The price fluctuations of scallions exhibit significant seasonality, cyclicality, trends, and clustering [9]. This renders small-scale agricultural product prices highly susceptible to frequent abnormal fluctuations due to endogenous factors, macroeconomic influences, and external uncertainties [10]. Such fluctuations not only harm the interests of various market participants but also disrupt the smooth operation of the agricultural economy. Liu, Liu, and Zhe L [11,12,13] argue that factors like supply, intrinsic characteristics, and inventory control strategies contribute to the intense price volatility of small-scale agricultural products. Yao [14] suggests meteorological factors, production costs, and export quantities as reasons influencing garlic prices. Lian, Zhang, and Liu [15,16] respectively highlight the interplay of internal price differentiation among small-scale agricultural products like scallions, ginger, and garlic and the impact of monetary factors on price fluctuations. Balcilar M, Sertoglu K [17] conducted sentiment analysis based on news sentiment indices, demonstrating the Granger causal relationship between the societal events of the COVID-19 pandemic and substantial fluctuations in agricultural product prices, underscoring their influence. Liu Y, Liu S, Zheng, Ma [18,19] utilized internet big data and the TVP-VAR model to empirically analyze the impact of negative online sentiment during the COVID-19 period on agricultural product prices. They discovered variations in price responses across different agricultural products and risk zones.
In the era of information, numerous factors contribute to shifts in market trends and economic conditions. Among these, the attitudes, expectations, and ensuing behaviors of various market participants hold a significant sway over future fluctuations in agricultural product prices. Consequently, by integrating online sentiment analysis, it becomes possible to promptly identify latent influencing factors affecting market trends and price volatility in different contexts. This enables an advanced anticipation of their impact and magnitude, thereby enhancing the effectiveness and accuracy of price fluctuation predictions.

2.2. Analyzing the Factors Influencing Price from the Perspective of Online Public Opinion

Research on the relationship between online public sentiment and market prices has predominantly manifested within the realm of finance. Notably, studies have explored how sentiment factors such as online discourse, public emotions, and attention affect stocks, futures, and other financial instruments. Pasupulety U, Anees A [20] and Li B, Chan K [21], for instance, utilized Word2Vec and SMeDA-SA to conduct sentiment analysis on public discourse on Twitter. They combined these insights with stock features to predict trends in companies listed on the National Stock Exchange of India and the NASDAQ or New York Stock Exchange. Gurdgiev C, O'Loughlin D [22] employed sentiment analysis to simulate the impact of four distinct emotions on the cryptocurrency market to forecast price directions. However, comparatively fewer studies have explored the impact of online sentiment on physical product prices as opposed to financial markets. Jia, Xia et al. [23] demonstrated that the COVID-19 pandemic acted as a unidirectional Granger cause of pork price fluctuations, further triggering a "butterfly effect" on the development of the pork and related industries. Yang [24], from the perspective of online sentiment, delved into the formation of price expectations, the degree of influence, and symmetry issues concerning market participants' price expectations for e-commerce products based on sales behavior and strategies.
The aforementioned literature reveals certain limitations and shortcomings in the current research on the relationship between online public sentiment and market prices. Firstly, many of the cited works employ pandemic-related indices (such as reading volume, Baidu Index, etc.) for sentiment analysis, rather than constructing analysis based on actual public discourse. As a result, they may not fully reflect genuine public attitudes and relevant sentiment factors. Secondly, relying solely on sentiment analysis to infer public emotional attitudes overlooks the significance of public attention, which has been confirmed as a factor causing price fluctuations. Lastly, most of the information extracted from the network public opinion is relatively single, focusing on the emotional analysis of a factor, and the analysis of the market supply and demand relationship, the price change of related agricultural products and the macroeconomic information and its influence is not deep enough.

2.3. Opinion Analysis Method of Network Public

With the continuous advancement of natural language processing (NLP) technology, the realm of online sentiment is consistently integrating and incorporating new theoretical approaches. Text analysis plays a pivotal role in sentiment analysis, encompassing a multitude of emerging techniques. This paper primarily focuses on introducing three aspects of sentiment analysis: sentiment hotspot discovery, topic extraction and clustering, and sentiment analysis methods.

2.3.1. Hot Spot Discovery, Topic Extraction and Clustering of Public Opinion

The initial method for sentiment topic classification was the word frequency analysis approach. Gradually, clustering algorithms and machine learning have also been employed in research on sentiment hotspot discovery, topic extraction, and clustering. For instance: Kumar G K et al. [26] introduced a word frequency algorithm and NLTK to create a novel paragraph summarization method that simplifies complex reading comprehension; Mourisse D et al. [27] used machine learning classifiers based on word frequency and text features such as phonemes to address cross-lingual word sense disambiguation problems; Wang et al. [28] optimized the K-means clustering algorithm using the Isodata algorithm for mining hot topics on Weibo; Zhang [29] utilized DL-NLP technology to mine association rules for topic classification and data mining; Yi [30] proposed a text topic classification model based on BERT and VAE for feature reconstruction; Sun, Huang [31] introduced a news text classification model that integrates LSTM and attention mechanisms; Deng Lujuan [32] used the Word2vec-GRU and CNN model to extract key semantic information features for news topic classification, constructing a method through the Softmax layer; Varsha Mittal [33] introduced a deep graph-long short-term memory (DG-LSTM) model for multi-label text classification, applied to categorize themes in Indian judicial cases.
With the maturation of Web 2.0 technology, addressing the characteristics of large-scale, structurally complex, dynamically changing, and sparse social network text has remained a challenge. Current text analysis methods are insufficient to unveil intricate topics that encompass various user social behaviors. Research in this area is relatively limited and lacks a comprehensive framework. The exploration of hot topic discovery, topic extraction, and clustering within massive datasets is gradually shifting towards a multimodal trend.

2.3.2. Research on Sentiment Analysis Methods

Sentiment analysis involves the analysis, processing, summarization, and inference of subjective texts imbued with emotions. It employs sentiment score metrics to quantify qualitative data. With the evolution of the internet and social media, sentiment analysis has become an effective quantitative solution for various fields, such as finance, education, management, and e-commerce. Researchers have made significant contributions to this domain: Dybowski T P, Rao Y [34,35] identified social emotions related to certain entities and news events using sentiment lexicons; Wei, Pei, Deng H, Ergu D [36,37] designed sentiment analysis models based on sentiment word extraction, information enhancement, and CNN-Bi-LSTM models with attention mechanisms, effectively enhancing emotion classification accuracy; Zhou, Zhong [38] utilized rough data inference and Word2Vec-FastText to address polysemy and recognize contextual emotional features; Liu, Gu [39] proposed the M2BERT-BiLSTM model, which effectively performs sentiment analysis on unbalanced textual sentiment; Song [40] developed an optimization method for deep learning-based multi-task models to overcome traditional language model transferability limitations; Yucel Ahmeteta [41] conducted emotion classification on customer reviews of four different types of products/services using a classifier framework.
Mainstream sentiment analysis relies on existing lexicon-based methods that involve rule formulation, text deconstruction, keyword extraction, and sentiment score calculation. This approach is highly effective for quantifying issues within smaller datasets. However, in specialized domains, improving the accuracy of sentiment analysis requires the introduction or expansion of new words based on domain characteristics. This task necessitates a thorough analysis of the expression features of emotions within that particular domain, which can be time-consuming and demanding. Additionally, sentiment analysis methods based on tokenization often overlook semantic associations between preceding and succeeding words. This omission reduces the accuracy and reliability of sentiment analysis, as it fails to capture the complete context and intricacies of language.
Research shows that the analysis of factors influencing the prices of small-scale agricultural products based on web information mining is a novel and effective research perspective. Unlike previous studies that were limited to sentiment analysis, this paper will comprehensively analyze the factors and mechanisms of price fluctuations in small-scale agricultural products from multiple perspectives, including market environment, supply and demand relationship, market sentiment, and attention. The primary focus lies in designing a technical framework encompassing topic extraction and clustering analysis through the utilization of the Latent Dirichlet Allocation (LDA) topic model, sentiment analysis facilitated by the Significance Over POS-Tagged Mutual Information (SO-PMI) algorithm to expand the domain-specific lexicon, and a Time-Varying Parameter Vector Autoregressive (TVP-VAR) model integrated with Natural Language Processing (NLP). This approach is aimed at comprehensively delving into and dissecting the key factors influencing the price fluctuations of small-scale agricultural products, exemplified by scallions, from the perspective of online sentiment, thereby uncovering the underlying mechanisms.

3. Materials and Qualitative Analysis Method

3.1. Overview

This study delves into the factors influencing scallion prices through the utilization of LDA topic modeling, natural language processing, and time series analysis. Firstly, it employs web scraping to collect online sentiment data related to scallion prices over the past three years. After data preprocessing, an LDA topic model is constructed for topic extraction and cluster analysis. Secondly, utilizing the domain dictionary expanded by the SO-PMI algorithm, the study quantifies sentiment in the text, constructs an attention index, and tests its feasibility through experiments. Lastly, after verifying the relevance of online sentiment factors to scallion prices through stationarity, cointegration, and Granger causality tests, the TVP-VAR model is used to analyze the time-varying impact of public sentiment on scallion price fluctuations. Figure 1 illustrates the conceptual flow of this study. The next section will introduce various methods.
Among them, the innovation points of this article are as follows:
(1) In contrast to previous literature using methods like Baidu Index or search popularity, this study employs LDA model for textual analysis and topic classification of online sentiment over the past three years, the factors extracted are more comprehensive than the relevant literature. From four dimensions - market supply and demand, overall economic environment, related agricultural product prices, and market attention - it summarizes and defines key factors significantly impacting scallion price fluctuations. It comprehensively depicts the effects of various factors on prices, considering both macro and micro perspectives.
(2) This study expands the domain dictionary appropriately using the SO-PMI algorithm, integrating syntactic analysis into sentiment analysis of texts. It focuses on analyzing the influence of negation words and adverbs of degree on sentiment orientation, the accuracy and reliability of emotion quantification can be improved based on text meaning. Additionally, through cointegration tests and Granger causality analysis, the correlations between factors are verified.
(3) The application of TVP-VAR model analysis can adopt a unique perspective, such as different time and space dimensions and special time nodes, to compare the impact of various factors on the price of scallion. Based on their changing characteristics, the study contrasts and analyzes the pulse effects of different factors in various periods, including specific time points, short-term, and long-term perspectives. The study concludes with fundamental market patterns of scallion price fluctuations and delves into the underlying reasons behind abnormal price fluctuations during specific periods.

3.2. Data Acquisition

3.2.1. Price Data Acquisition

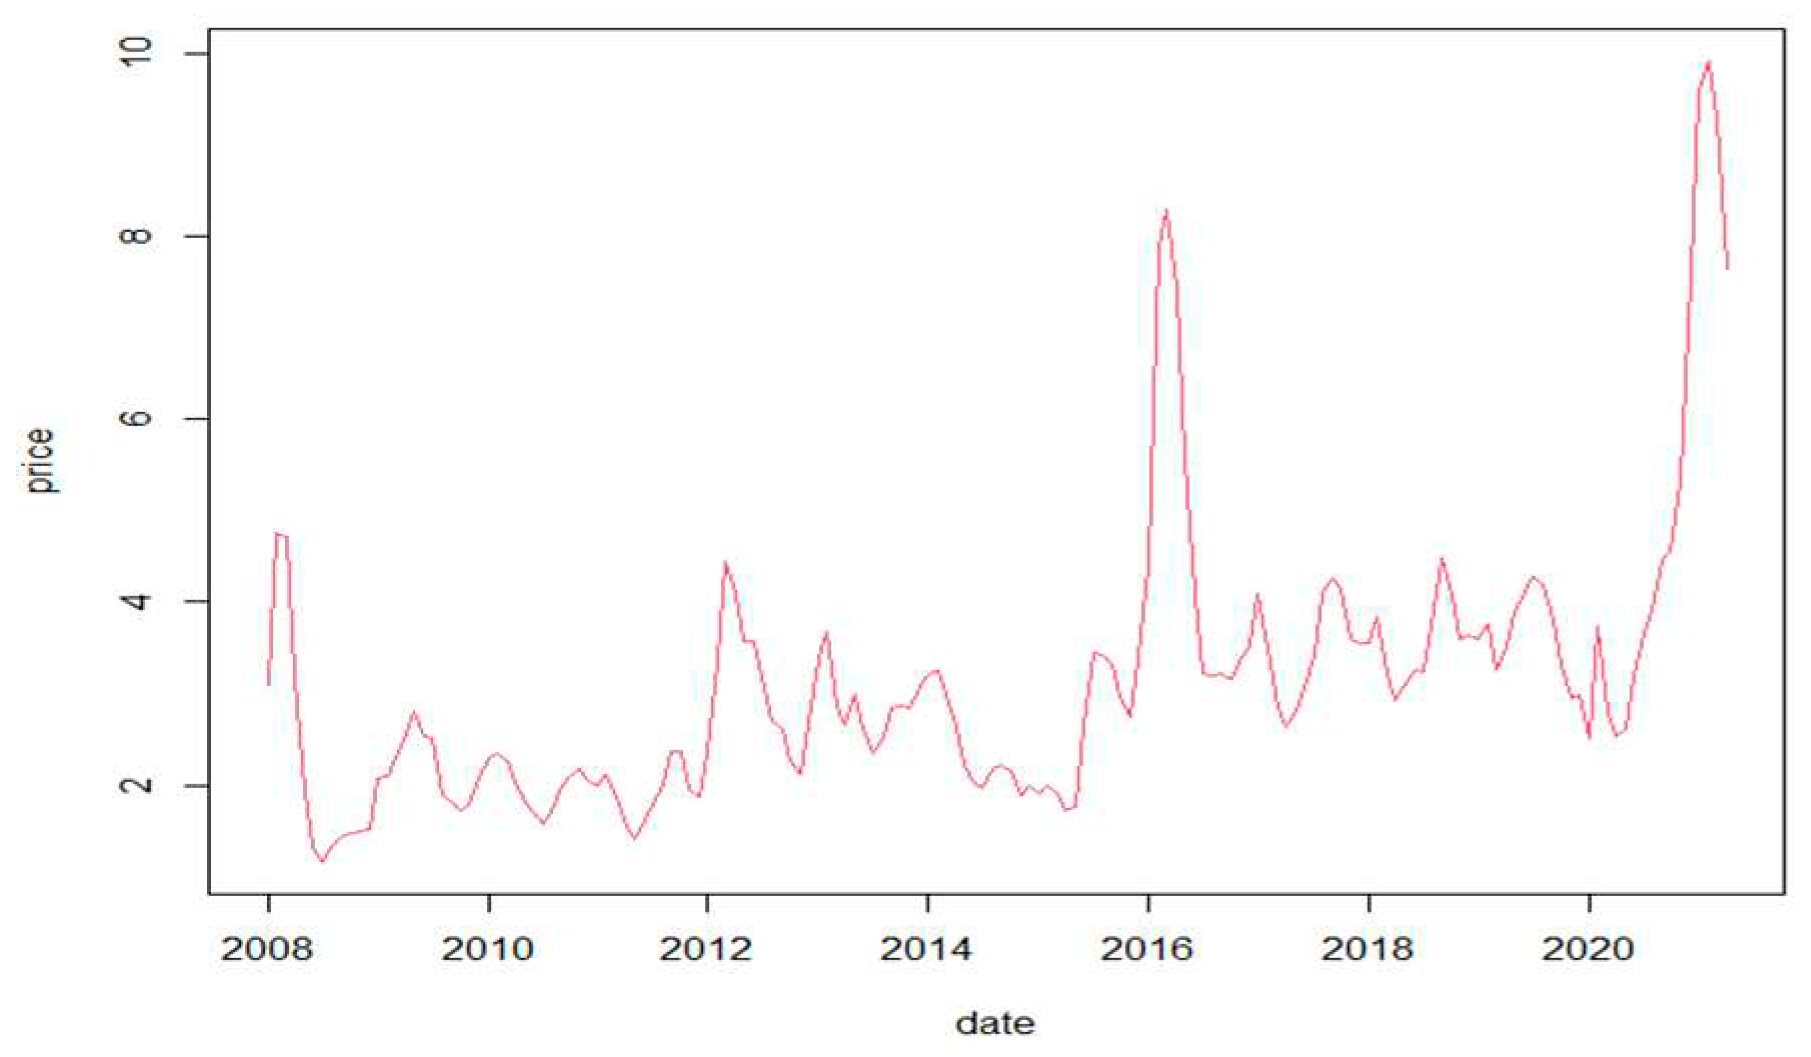
The research data come from the authoritative websites of the Ministry of Commerce of the People 's Republic of China (http://www.mofcom.gov.cn/) and the Ministry of Agriculture and Rural Affairs (http://www.moa.gov.cn/), to ensure data accuracy and timeliness. Limited by the availability of data, the monthly price data of scallion from January 2008 to April 2021 are selected as the research scope. As shown in the following Figure 2, the highest price of scallion in the research interval is 9.9133 yuan / kg in February 2021, and the lowest is 1.326 yuan / kg in August 2008, the fluctuation is obvious and there are abnormalities in some intervals. It is difficult to predict with traditional time series analysis and influencing factors.

3.2.2. Public Opinion Data Acquisition

In view of the analysis of the correlation between public opinion factors and the price of scallion, this topic is based on Python to write a focused web crawler to obtain relevant public opinion information. The main source of information is Weibo. The search scope includes three keywords: scallion, scallion price and small-scale agricultural products. The specific content includes release time, terminal, link, user name, comment or news subject, likes, forwards, comments and pictures contained in the content. The crawling time range is from January 2019 to July 2022. Because some public opinion data are not strongly correlated with the price of scallion, a total of 4757 public opinion information with strong correlation with the price of scallion were extracted, 36 invalid information were eliminated, and the remaining 4721 valid public opinion information.

3.3. Public Opinion Data Preprocessing

3.3.1. Chinese Word Segmentation Processing

This experiment is based on the Jieba module of the R language to realize the Chinese word segmentation of the public opinion information data set. The word segmentation principle follows the Hidden Markov Model (HMM), because it comes with a corpus that covers more than 20,000 entries and their occurrence times and part of speech, and supports operations such as custom dictionary introduction and part of speech tagging, so that most public opinion information can be effectively segmented according to Chinese language habits.

3.3.2. Construction of Deactivated Lexicon and Text Vectorization

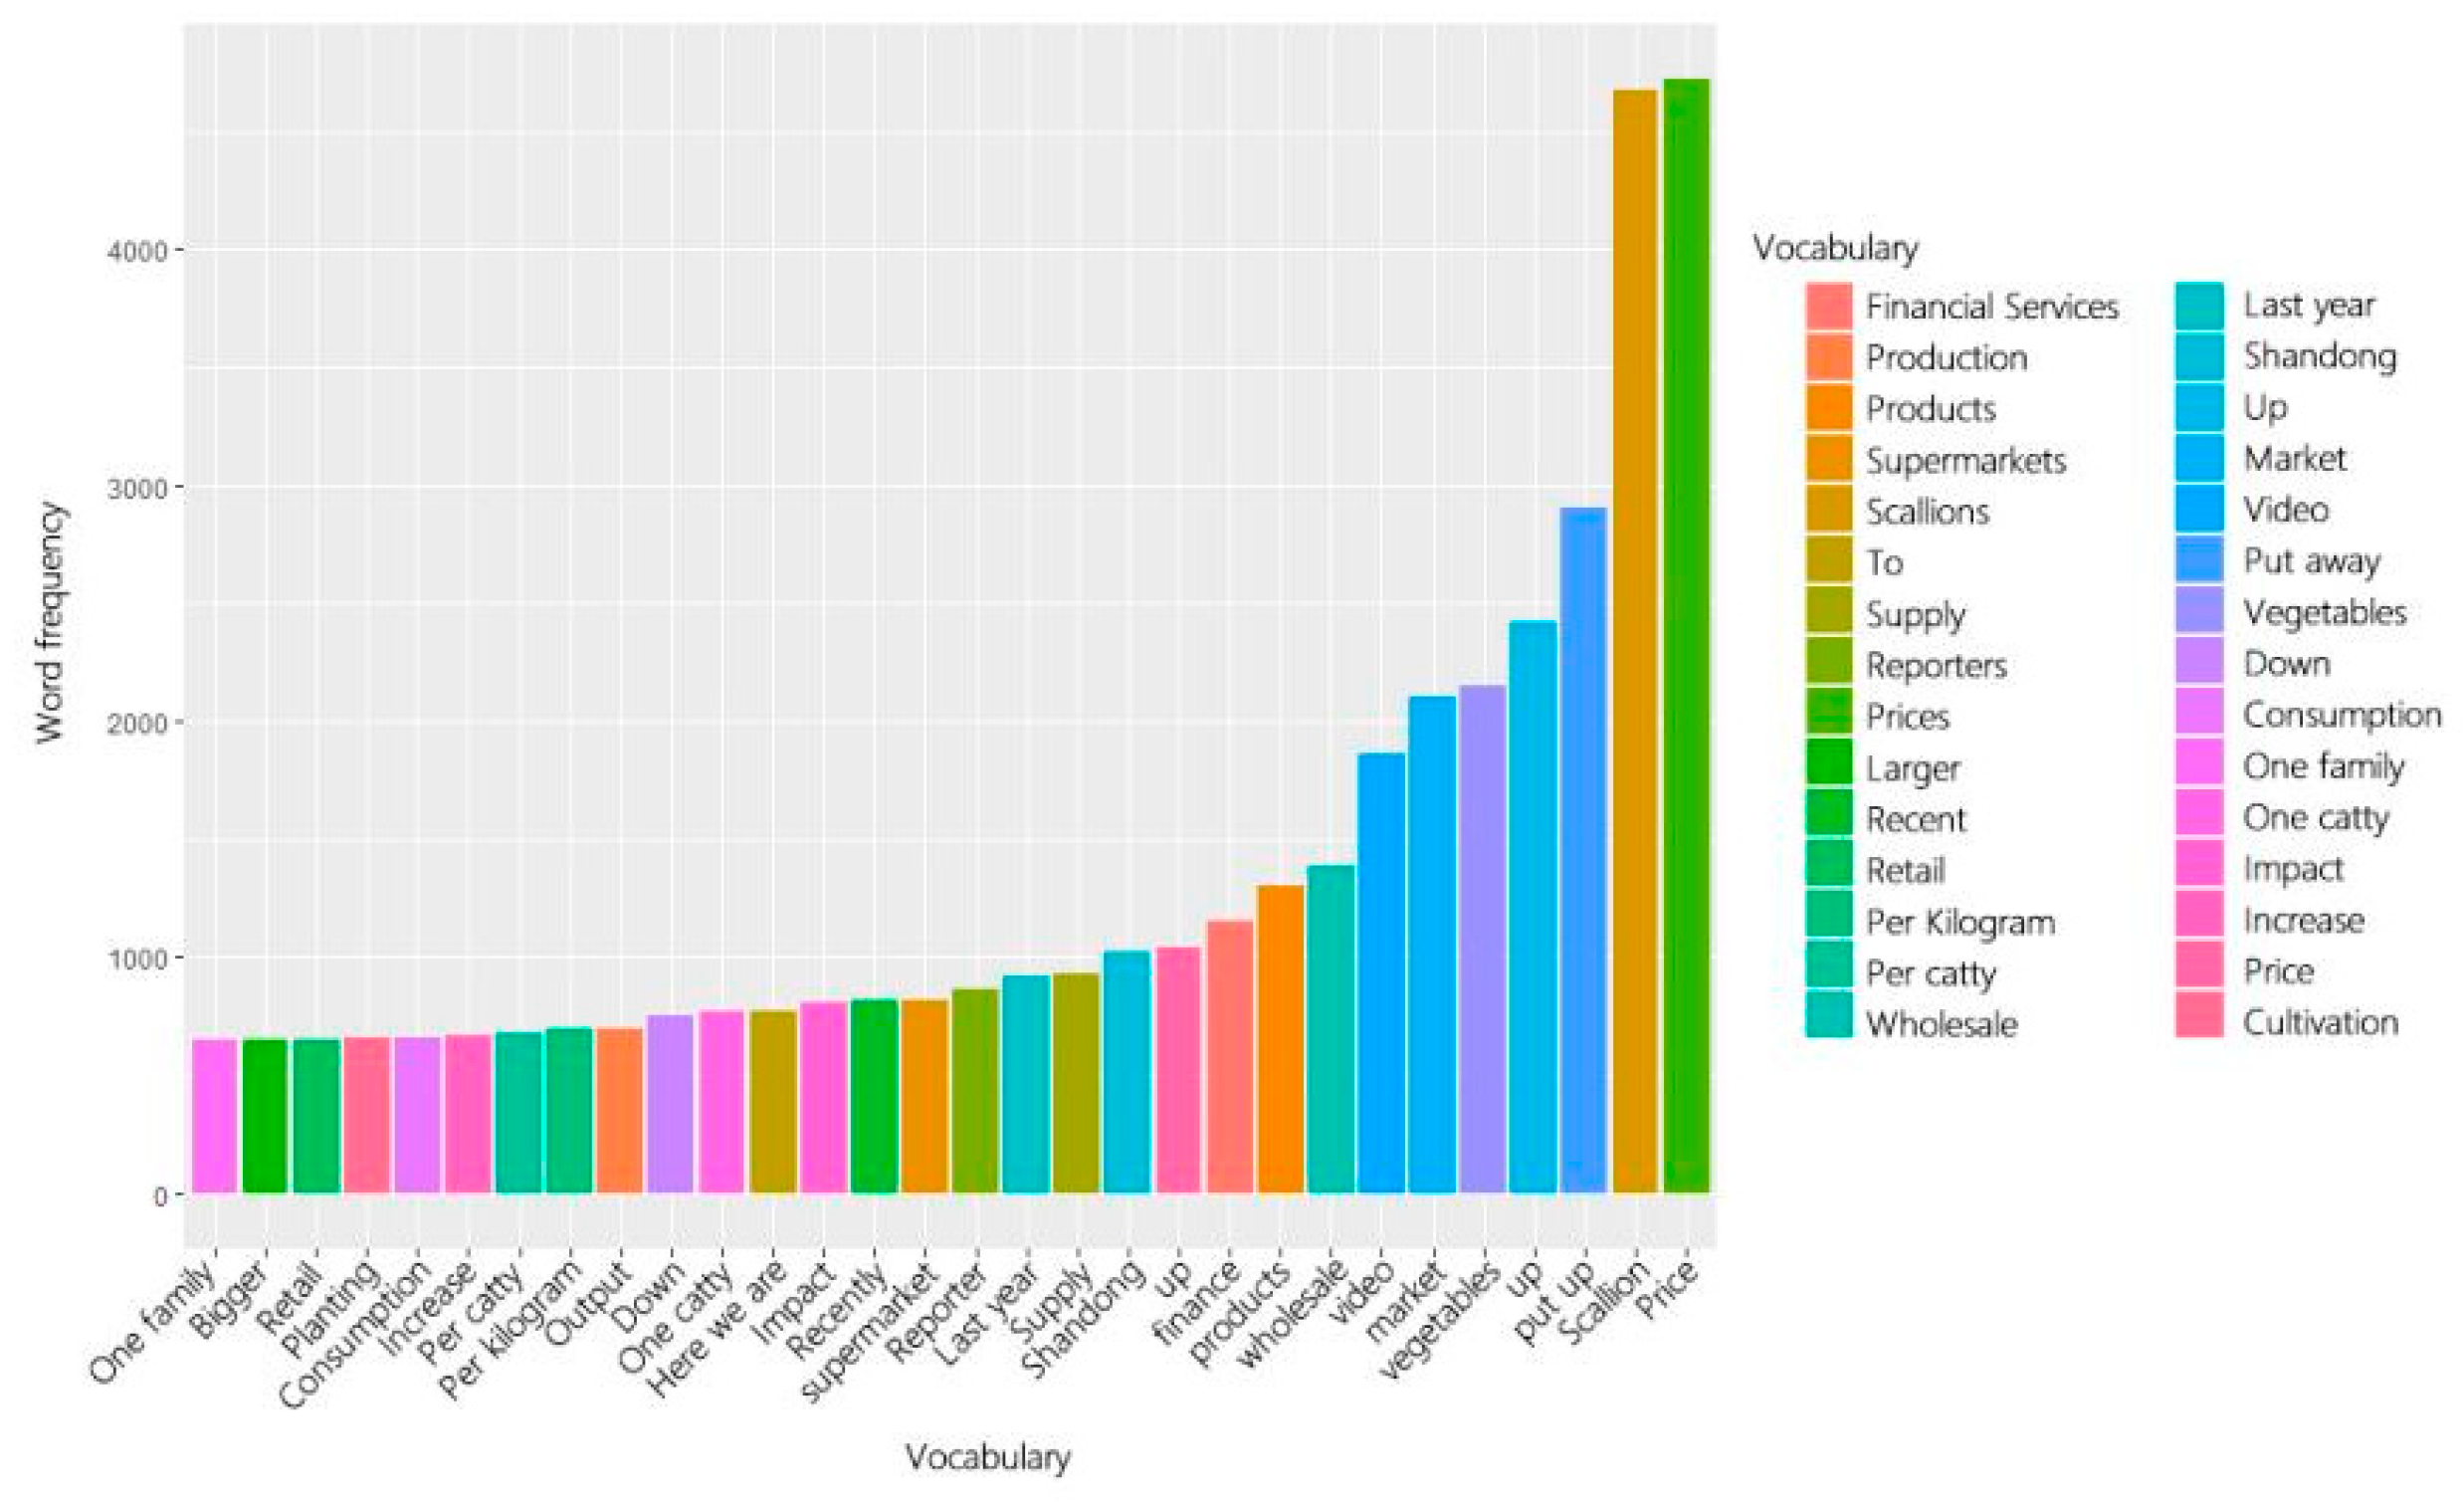
This paper uses Baidu stop word lexicon, which contains 1857 stop word strings. In order to enhance the effect of topic extraction and cluster analysis, the word frequency statistics of the corpus are carried out and the new stop words and strings are introduced manually according to the distribution. Based on the Ggplot2 drawing package in R language, the visual design of word frequency is carried out. The following Figure 3 shows the top 30 words in the corpus:
This paper selects words or characters that do not appear in the existing deactivated lexicon, such as ' pick up, expand (both are the operation of the web page after crawling the data and the comment page in the APP), jump, underline, micro-blog, a catty, a ', etc., interactive information such as ' @ user, # topic #, web link ', etc., and introduces the two into the existing deactivated lexicon (a total of 1890 kinds), and eliminates punctuation marks and word segmentation with a length of less than 1. The preprocessed text is vectorized using the Purrr package in Tidyverse.

3.3. Analysis of Price Influencing Factors Based on Topic Classification

3.3.1. LDA Model Construction

After preprocessing the sentiment data, this study employed the LDA method from the Rstudio machine learning library to construct a topic model. During the model construction process, we manually set the number of topics to three (K=3), and the hyperparameters α and β were kept at their default values. This configuration aimed to extract factors related to price from the sentiment data about scallions. The input and output parameters of the model are presented in Appendix Table A1. Through this approach, our goal is to identify distinct topics from the sentiment data and further analyze the information related to prices.

3.3.2. Agricultural Public Opinion Theme Discovery
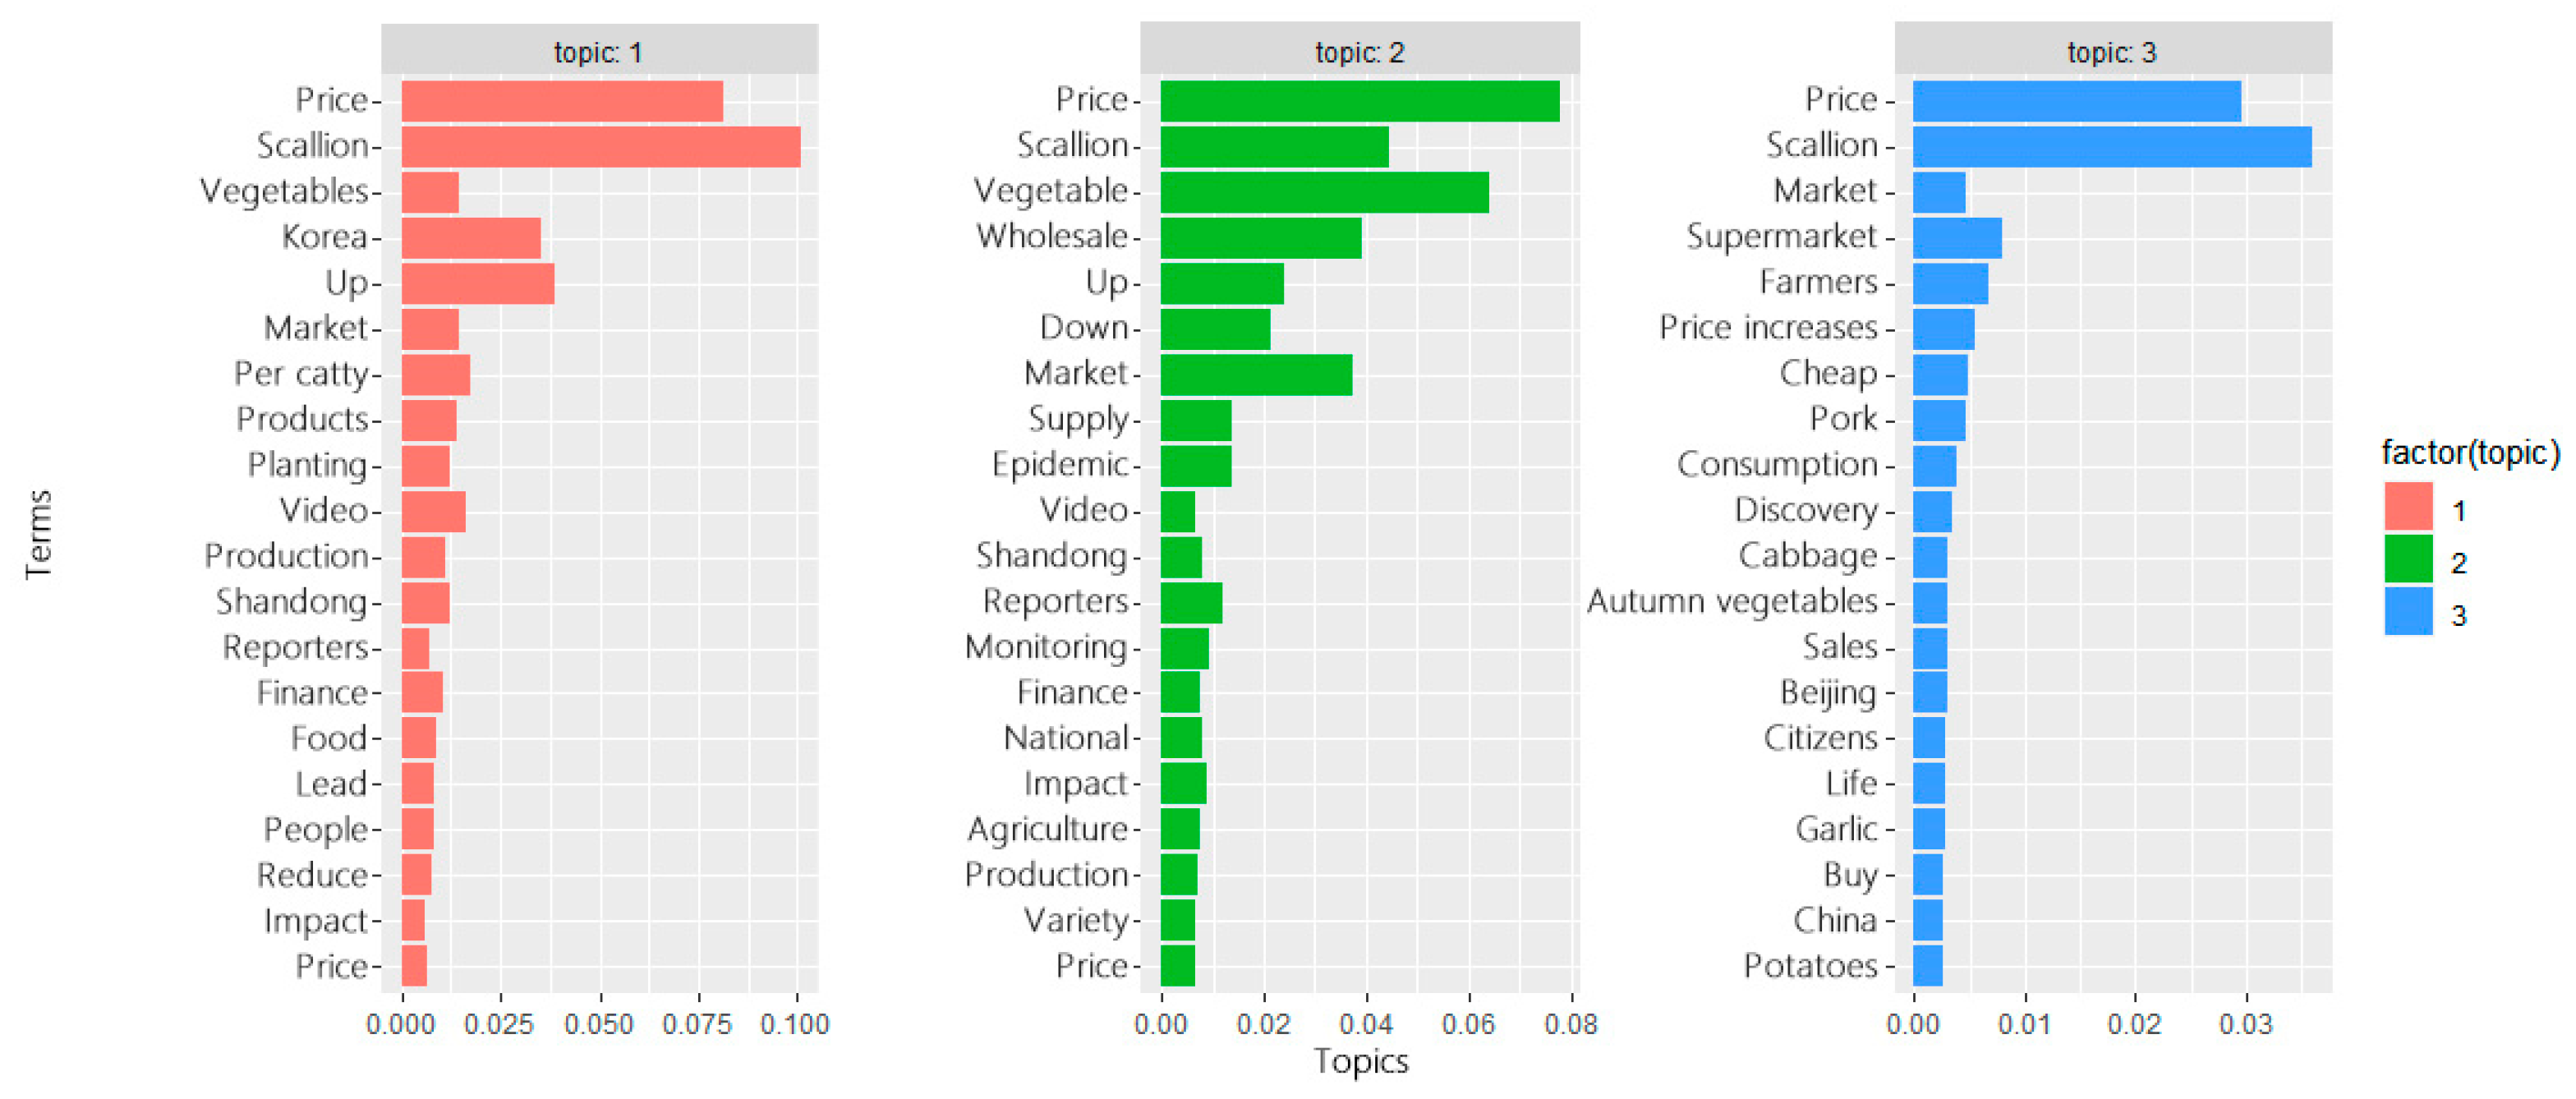
Utilizing the input and output parameters mentioned earlier, the model was constructed. With the help of the R language and the Ggplot2 package, we designed visualizations to showcase the top twenty topic words and their corresponding probabilities for each of the three topics. The results are presented below:
Figure 4. Three themes and their keywords extraction.
Preprints 85875 g004
All of them contain repeated keywords such as scallion, price, vegetable, rise, fall, market and so on. It shows that the three themes extracted are related to the fluctuation of scallion price, which is consistent with the research direction of this paper. Now remove the keywords that are repetitive and have little significance to the theme extraction, filter the top 30 and unique keywords under each theme for further analysis, it aims to summarize the factors related to price in public opinion information and explain them, as shown in the following table:

3.3.3. Topic Division and Index Classification

Based on the Gamma function and the Beta probability, a topic cluster discrimination method was employed to associate factors with topics and topics with indices. In this manner, we extracted all the comments from the corpus that correspond to the three identified topics. After undergoing text processing, these comments were integrated into three distinct new datasets. These datasets contained 1430, 2097, and 1194 comments, accounting for proportions of 30.2966%, 44.4279%, and 25.2754%, respectively. Notably, the second factor had the highest proportion, while the third factor had the lowest. This distribution indicates that discussions about prices by internet users are primarily linked to macroscopic factors. For instance, they are more interested in understanding how scallion prices fluctuate under the influence of the pandemic and how the agricultural market evolves. On the other hand, there is comparatively less focus on the attributes of scallion themselves and their associated products.
Table 1. Three themes unique subject word display.
Subjects Special key subject words Summary of theme content
No 1 Korea, planting, yield, Shandong, people, area, security, production, weather, Henan, nature, news, etc. Market factors: including market supply and demand relationship, weather changes and natural disasters (main producing areas), total output of scallion (planting area of scallion, farming situation of farmers), import and export trade (Japan and South Korea are the main exporters of scallion) and other factors.
No 2 Supply, epidemic situation, Shandong, monitoring, national, agriculture, Spring Festival, trade, personnel, environment, country, delivery, etc. Macro factors: including the mutual influence between various consumer entities and the market environment under COVID-19, the national macro-policy regulation and control, the overall national economic situation and holiday conditions.
No 3 Supermarkets, farmers, pork, cabbage, autumn vegetables, garlic, potatoes, food, condiments, restaurants, chili, ginger, etc. Agricultural products themselves and their associated product factors: As the main condiment, the price of scallion is also affected by the prices of pork, cabbage and other related agricultural products and substitutes such as garlic, pepper and ginger.

3.4. Hypothesis of the Price Fluctuation Factors

3.4.1. Qualitative Analysis of the Influence of Different Factors

To comprehensively reflect the public's level of interest in online information related to scallion, a fourth influencing factor, market attention, is introduced. The definition and calculation formula for this factor are provided in section 4.5.6. The following qualitative analysis is conducted from four aspects, examining the impact of different sentiment factors on scallion prices. Based on this analysis, four research hypotheses are proposed for verification:
Market Factors: These factors provide a comprehensive reflection of market supply and demand dynamics, as well as variations in climate and environmental conditions. Small-scale agricultural products, such as scallion, often have fixed cultivation areas and dense planting, making them susceptible to climate changes and natural disasters that can lead to substantial yield reductions. This imbalance in market supply and demand can trigger significant short-term fluctuations in scallion prices.
Macroeconomic Factors: These factors reflect the overall economic environment and market development status. In recent years, China's agriculture has maintained stable growth, with positive market development. However, due to the widespread outbreak and continued spread of the global COVID-19 pandemic, agricultural production and market conditions have been severely impacted. As the pandemic gradually comes under control and national macroeconomic policies are implemented, the influence of COVID-19 on agricultural product prices diminishes rapidly.
Relevant Agricultural Product Prices: These factors primarily reflect the price fluctuations and market conditions of substitutes for scallion s, such as garlic, chili peppers, and ginger. Overall, the price trends of these agricultural products exhibit a certain degree of convergence. In the short term, the prices of these substitutes tend to mutually constrain each other.
Market Attention Factor: This factor indicates the level of attention and the attitude of various market participants toward information related to scallion price fluctuations. It also indirectly reflects the market expectations and investment behaviors of market speculators and distributors. When scallion prices experience fluctuations, it may trigger some investors to hoard or sell, further promoting price increases or decreases. This behavior can lead to short-term supply exceeding demand, causing rapid price fluctuations. Such market actions negatively impact the stability of scallion prices.

3.4.2. The Proposed Hypothesis

Based on the above considerations, this paper presents the following four hypotheses:
H1: 
The influence of market factors on the price stability of scallion shows a trend of negative higher than positive in the whole range.
H2: 
The stability of environmental factors on the price of scallion showed a trend of positive higher than negative effects in the early stage (the period when the epidemic did not spread), and a trend of negative effects higher than positive effects after the spread of the epidemic in the middle and late stages.
H3: 
The factors of agricultural products and their related products have a negative impact on the stability of the price of scallion, which is higher than the positive impact.
H4: 
In the short term, the attention factor has a positive trend higher than the negative impact on the stability of the price of scallion, while in the long term, it will show a negative trend higher than the positive impact.

4. Quantitative Process of Influencing Factors Based on Emotional Analysis
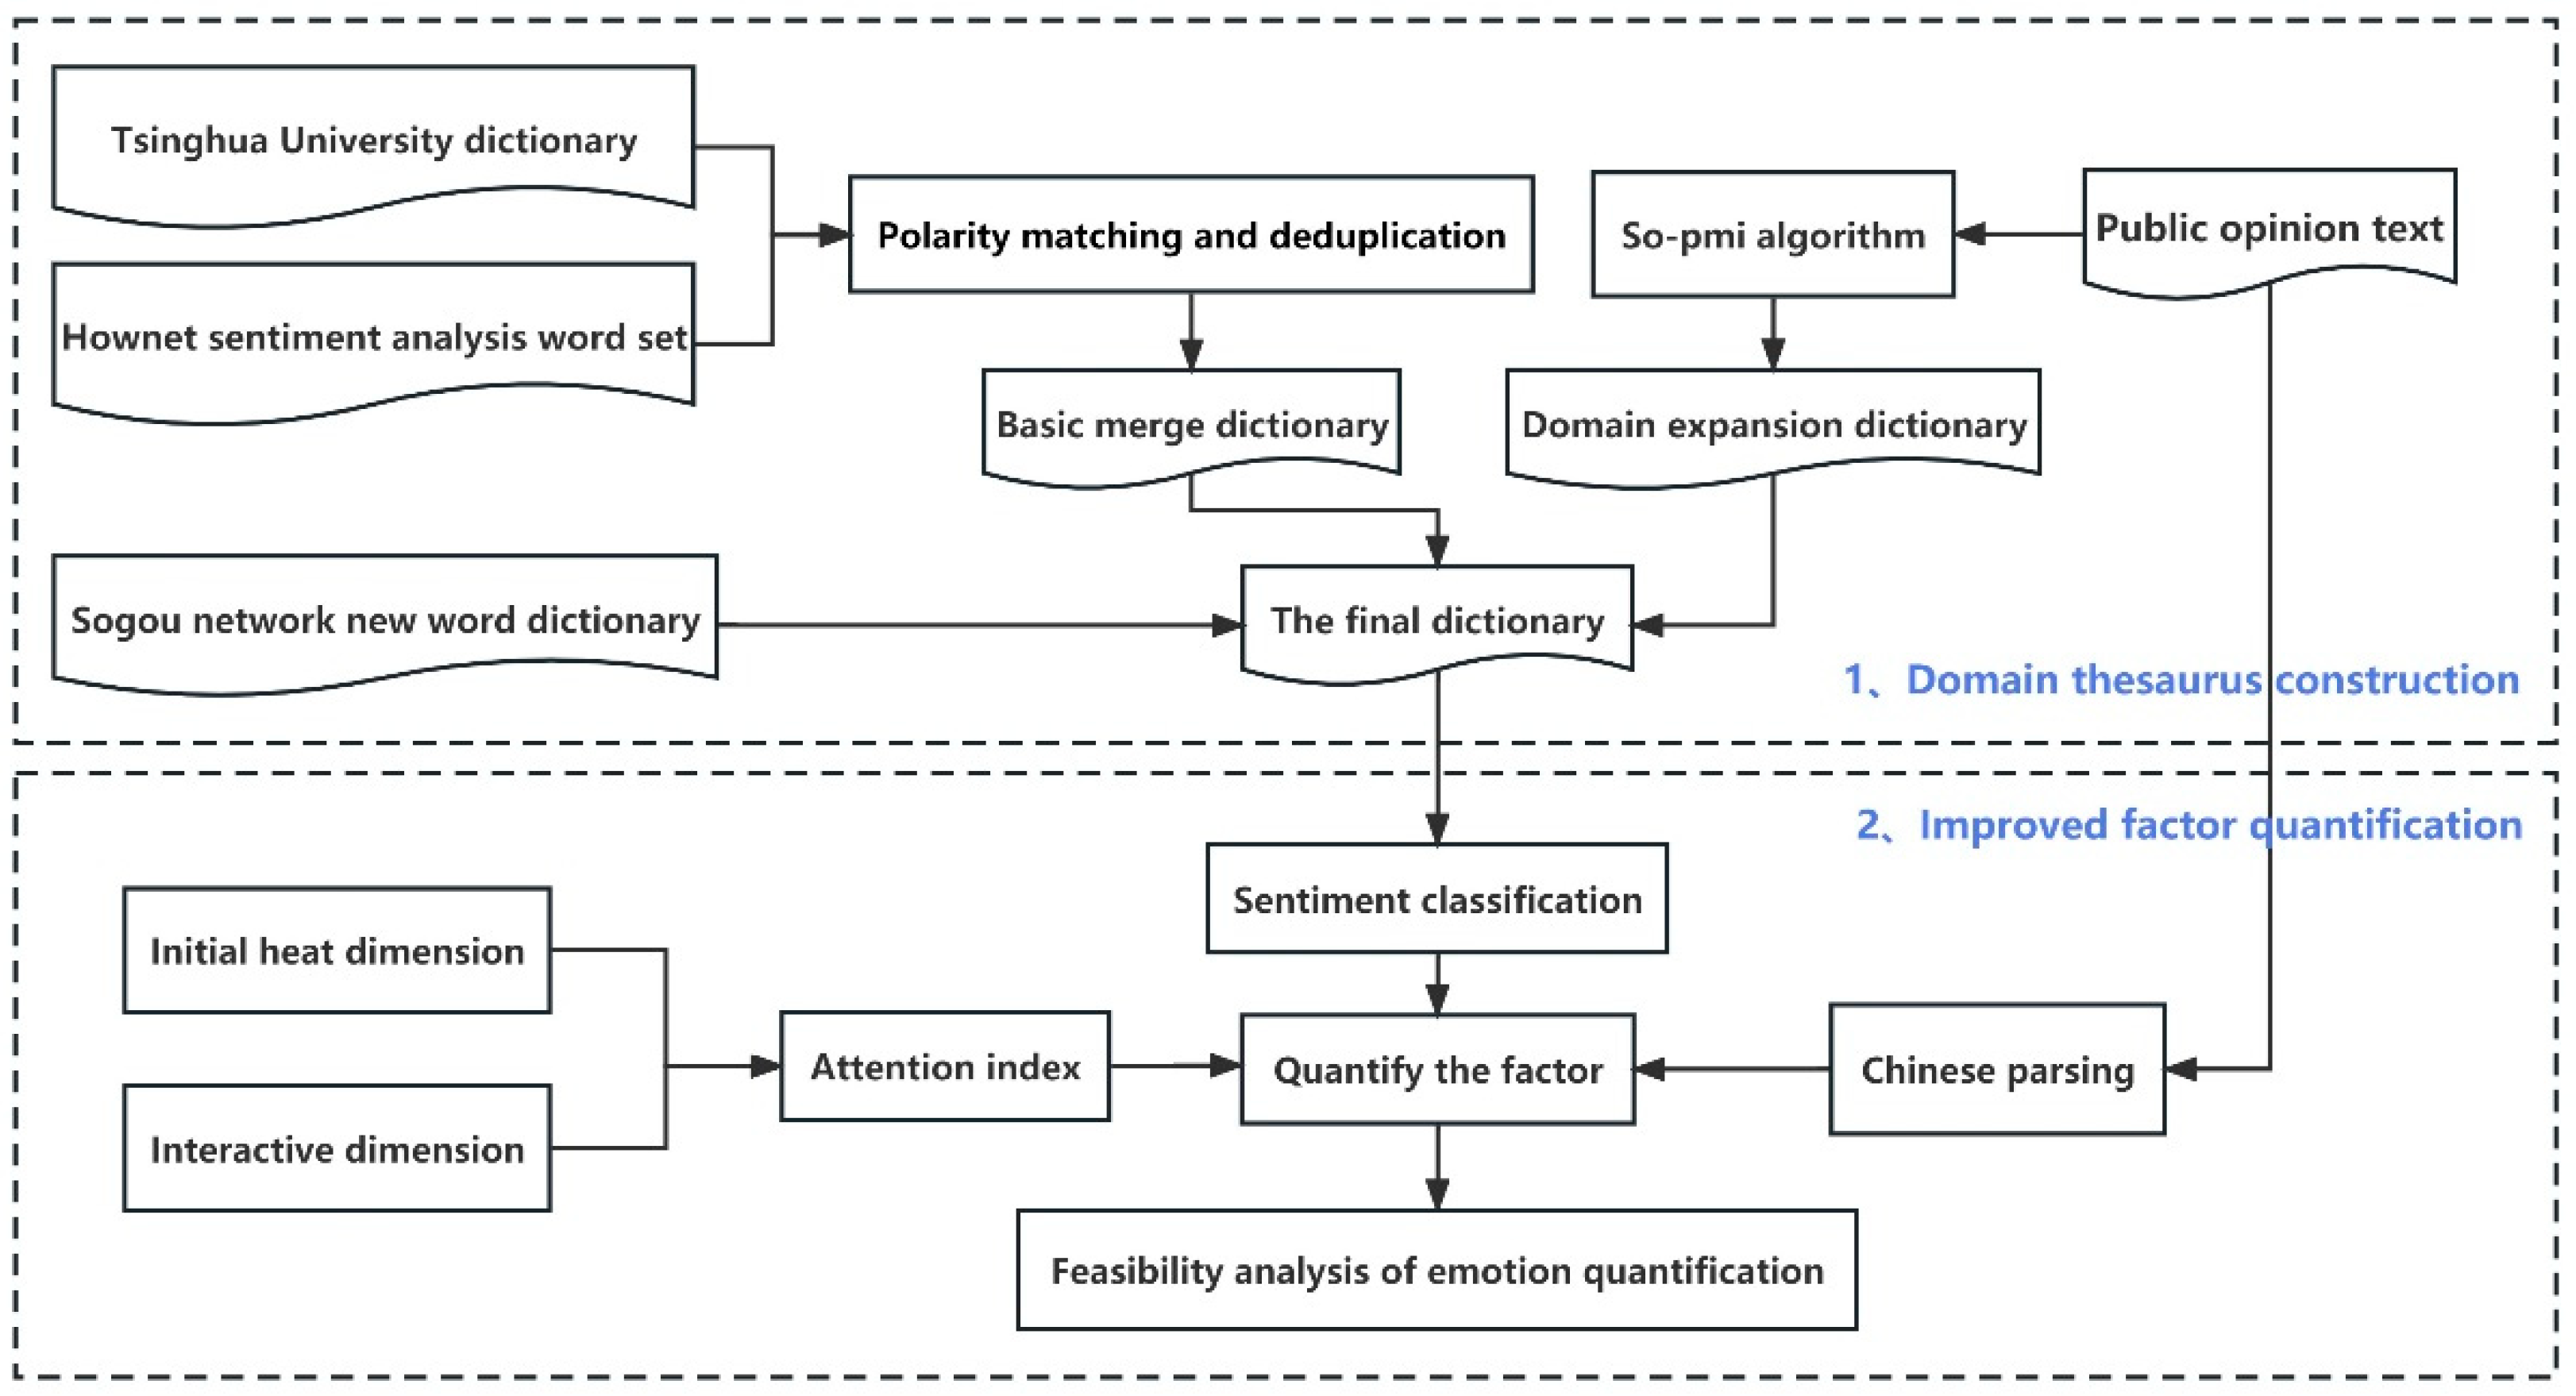
The above completed the qualitative analysis of public opinion factors, and then carried out the quantitative design of public opinion factors through natural language processing. The following diagram is the thinking flow chart of this chapter. The first part is the construction of basic dictionary, and the second part is the quantitative design of factors.
Figure 5. Flow chart of Chapter 4.
Preprints 85875 g005

4.1. Quantitative Analysis of the Influence of Public Opinion Factors

The above completed the qualitative analysis of public opinion factors, and then carried out the quantitative design of public opinion factors through natural language processing, aiming to study the direction and intensity of the influence of various public opinion factors on the price of scallion.

4.1.1. Basic Emotional Dictionary Construction

The dictionary-based sentiment analysis method is an effective approach for quantifying emotions in text data. However, the calculation of sentiment expectation values largely depends on the effectiveness and accuracy of the sentiment lexicon. In practical applications, words like "上涨" (rise), "翻番" (double), "回落" (fall) may have different emotional polarities in different domains. Hence, relying solely on a general sentiment lexicon for analysis may not yield optimal results. It becomes necessary to construct and expand sentiment lexicons specific to particular domains.
To begin with, this study is built upon the resources of "Hownet Sentiment Analysis Lexicon" from CNKI (China National Knowledge Infrastructure) and "Tsinghua University Chinese Positive and Negative Sentiment Lexicon." The positive sentiment words from the former and the positive words from the latter are deduplicated, followed by merging and reorganizing, resulting in the positive sentiment lexicon. Similarly, by mapping corresponding relationships, a negative sentiment lexicon is constructed. After merging and organizing these two lexicons, an expanded basic sentiment lexicon is obtained. Furthermore, this study introduces popular new words from Sogou's network to further enrich the sentiment vocabulary resources.

4.1.2. Domain Dictionary Expansion Based on SO-PMI Algorithm

In this paper, the public opinion data contains market-specific words, so the domain words are further expanded based on the SO-PMI algorithm. The algorithm consists of two parts, which are the PMI algorithm ontology and the SO sentiment analysis prefix.
(1)
Pointwise Mutual Information (PMI) is used to determine the probability of two words appearing at the same time in the corpus. The formula is as follows:
P M I ( s w α , a w β ) = log 2 ( p ( s w α , a w β ) p ( s w α ) p ( a w β ) )
P (swα, awβ) is the joint probability, that is, the probability that swα and awβ appear in the corpus at the same time. P (swα) and P (awβ) represent the probability that the two words appear in the sample respectively. The interpretability of the final result of PMI (swα, awβ) is: if PMI > 0, there is a certain correlation between the two words, and the greater the value, the stronger the correlation; if PMI = 0, the two words are independent and unrelated; if PMI < 0, the two words are mutually exclusive.
(2)
The emotional tendency point mutual information algorithm uses the PMI algorithm to extract emotional words in the corpus, and then performs word-level semantic orientation (SO). The SO algorithm formula is as follows:
s o ( ω ) = P M I ( ω , ω + ) P M I ( ω , ω )
The SO-PMI algorithm is derived from the above two. Based on the algorithm, the words with known emotional polarity are selected as the benchmark discriminant words (emotional seed words). The emotional polarity is judged by judging the degree of association between strange words and emotional seed words in the corpus. The formula is as follows:
P M I ( p s w α , a w β ) = log 2 ( p ( p s w α , a w β ) p ( p s w α ) p ( a w β ) )
P M I ( n s w α , a w β ) = log 2 ( p ( n s w α , a w β ) p ( n s w α ) p ( a w β ) )
S O P M I ( a w β ) = P M I ( p s w α , a w β ) P M I ( n s w α , a w β )
Here, pswα and nswα represent the selected positive and negative sentiment seed words, respectively, while awβ stands for the unknown sentiment polarity words to be determined from the corpus. For each unfamiliar word, the SOPMI (Sentiment-oriented Pointwise Mutual Information) output result determines the sentiment polarity: if it's a positive value, the sentiment is positive; if it's 0, it's neutral; if it's a negative value, the sentiment is negative. The specific word occurrence probability p is determined through the document frequency method. Building upon the SO-PMI algorithm, this paper further expands the domain-specific vocabulary. Some of the expanded words are presented in Appendix Table A2.

4.1.3. Descriptive Statistics of Final Domain Dictionary

After manually eliminating output words with unknown meaning or no effect on sentiment analysis, the expanded domain words in the previous two sections are summarized into the basic dictionary, and the weight design is carried out. The final domain dictionary is shown in the appendix A3.

4.2. Quantitative Analysis of Influencing Factors
Based on the above dictionary, the three-factor quantitative design is carried out. The specific steps are as follows:
(1) Each segmented sentiment text, resulting from the tokenization process, serves as the focus of this study. Using the R language's Readxl package, the data is read and stored in lists. The final sentiment lexicon and the corpus are input, with the sentiment words from the lexicon merged based on their four different parts of speech categories. These merged words are then matched with indices in the text. Priority is given to annotating positive and negative sentiment words in each sentiment text, with respective sentiment polarities being assigned corresponding weights.
(2) To ensure more accurate sentiment analysis, syntactic analysis is introduced based on the rules of Chinese language usage. The process involves two steps: first, each sentiment text is examined to determine if it matches with any degree adverbs; second, considering the detected sentiment word as the center, the analysis checks if the word's preceding and following words match with the negation words found in a negation lexicon. The positive and negative sentiment expectation values (Spos, Sneg) for each sentiment text are then calculated based on whether the sentiment words' preceding words are negation words or not, in addition to the weighted contribution of degree adverbs. The formula is as follows:
W = j = 1 i W j
S p o s = W D e c
S n e g = ( 1 ) W D e c
where Wj is the weight of the jth degree adverb, i is the total number of degree adverb matching in each public opinion information, and W is the product of all degree adverb weights in each public opinion data.
(3) According to the dictionary and index matching principle, the positive emotional expectation value S pos and the negative emotional expectation value S neg are output one by one to sum, and the final emotional score (emotional expectation value) corresponding to each public opinion data under each factor is calculated and output according to the factor classification result.
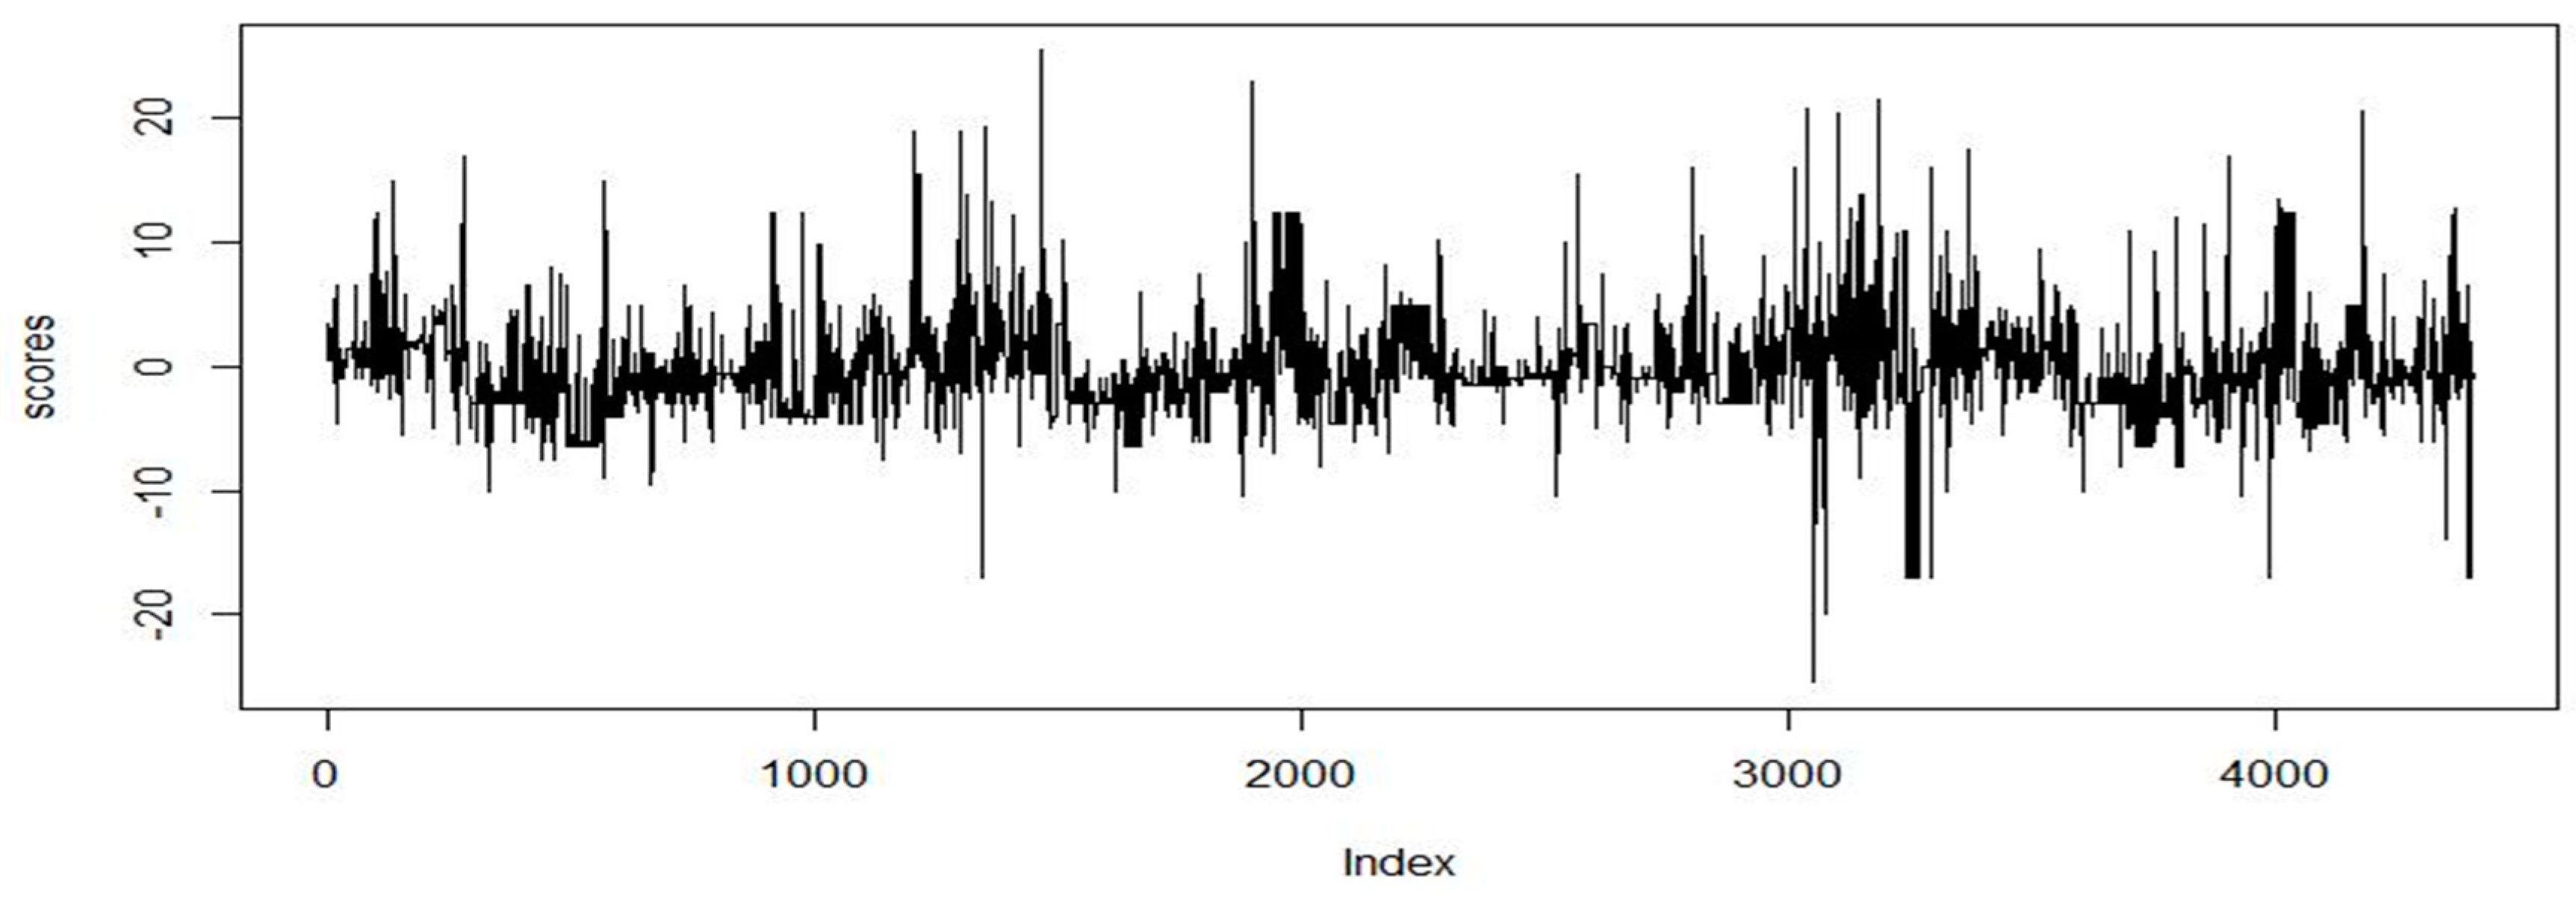
(4) Combine the three-factor emotional expectation results into a whole, take the final emotional expectation value as the standard, and the text emotion is positive when it is positive. The larger the value, the stronger the positive emotion; when is zero, the output text emotion is neutral; when it is negative, the text emotion is negative. The smaller the value is, the stronger the negative emotion is. The expected values of the three factors are shown in the appendix. The overall corpus output emotional score expectation is visualized as follows:
Figure 6. Visualization of emotional expectation.
Preprints 85875 g006

4.3. Evaluation of Sentiment Analysis

(1) The validity of the dictionary is tested, and the validity of its construction is verified based on the dictionary matching degree, that is, the sum of the proportion of positive and negative text emotions is counted. The visualization of the emotional expectation value in the corpus of this paper is shown in the following figure. The dictionary matching rate is 88.9995 % (positive 35.12 %, negative 53.87 %, neutral 11.01 %).
(2) This paper will use performance metrics as a benchmark to test the rationality of the dictionary, including precision (P), recall (R) and accuracy (Acc). The calculation formulas of each performance metric are as follows:
p = T P T P + F P
R = T P T P + F N
A c c = T P + T N T P + T N + F P + F N
Among them, the corpus is divided into True Positive (TP) according to the combination of the actual category and the sentiment dictionary analysis category, which represents the total number of samples correctly classified by the positive samples. True Negative (TN), represents the sample size of the counterexample sample correctly classified, False Positive (FP), represents the sample size of the counterexample sample misclassified as positive, False Negative (FN), represents the sample size of the positive sample misclassified as counterexample, so that TP, FP, TN, FN represent the corresponding sample size, the sum of the four is the total sample size, and the Confusion Matrix structure is constructed as shown in Table 5:
Table 3. confusion matrix representation.
Real category Sentiment analysis output category
Positive example Negative example
True example TP FN
False example FP TN
The sentiment analysis in this paper can be regarded as a two-classification problem, which is the positive and negative emotional attitude of netizens to the price of scallion. From the final output results, 472 public opinion data (about 10 % of the total data) and their emotional classification results are randomly sampled, including 155 positive samples and 317 negative samples. Artificial verification screens out 7 FN (false negative examples) and 3 FP (false positive examples), so the confusion matrix is obtained: A = 152 7 3 310 ,Combined with the accuracy measurement formula of the above model, the precision rate P = 98.065 %, the recall rate R = 95.597 %, and the accuracy rate Acc = 97.881 % are calculated. The results show that the three evaluation indicators all meet the standards, and the precision rate and accuracy rate reach the ' double high ' level, which proves that the domain dictionary constructed in this paper is accurate, reasonable and effective in sentiment analysis.

4.4. The fourth influencing factor (attention) index conversion

This paper designs indicators for the attention factor from two dimensions: initial popularity and interaction volume. The final attention index is obtained by multiplying the initial popularity dimension by the interaction volume dimension. The explanations and details of these two dimensions are provided below:
(1) Initial Popularity Dimension (H initial): Each topic is assigned an initial popularity value, which is positively correlated with the number of documents containing that topic within a specific time window. After obtaining the distribution of topic probabilities, a sliding average method is applied to segment the sentiment information data for each corresponding topic into time windows. This is used to calculate the topic strength values for different topics within each time window. The formula for the calculation is as follows:
H k T = d = 1 D T θ k d D T
θ k d represents the probability that the d-th document belongs to the topic k, DT represents the number of documents in the time window T, and takes the month as the time unit to output the initial heat dimension.
(2) Interaction Volume Dimension (H interaction): Interaction volume is the most straightforward indicator for measuring content engagement. Generally, it is calculated by assigning different weighted values to various data metrics. Since page views have relatively low objectivity, they are not considered in this study. Instead, metrics like likes, comments, and shares are given importance based on their relevance to the research topic. Given the focus of this study on the content of discussions, higher weights are assigned to likes and shares, with a weighting ratio of 1.2:1:1.2. Based on this, the formula for calculating the interaction volume dimension, H interaction, is as follows:
H i n t e r a c t i o n = Ln 1 + 1.2 N l i k e + N c o m m e n t + 1.2 N f o r w a r d
In summary, the fourth chapter has completed the quantitative analysis of the improvement of four different factors, and the fifth chapter will carry out empirical analysis.

5. Empirical Analysis and Results

5.1. Time Series Analysis and Testing

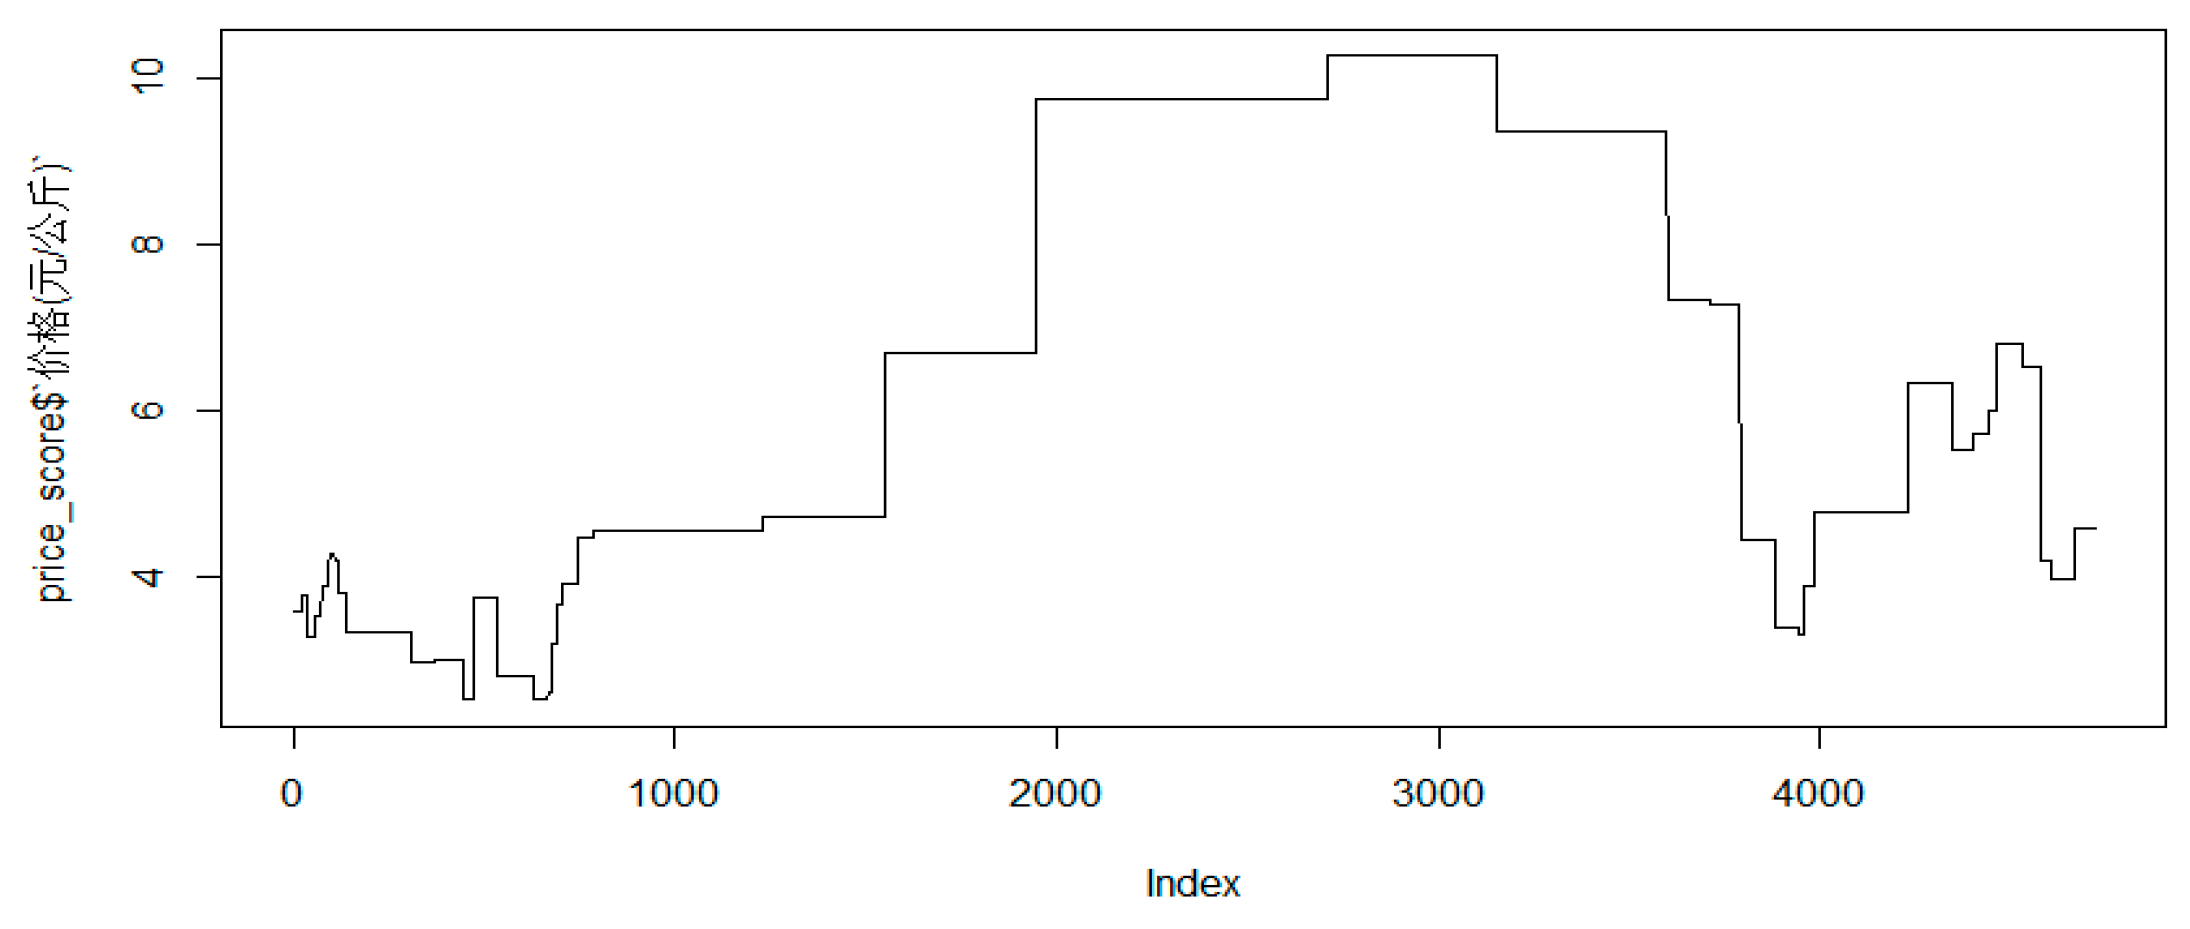
Finally, based on the comments in the corpus, the total number of output variables is 4721, and the period and price of each comment are unified, as shown in the following Figure 7:
As depicted in the graph, discussions among internet users regarding scallion prices increase as the scallion prices rise. There are thousands of comments during the peak period of scallion prices, and this high level of discussion continues for an extended period. Conversely, when scallion prices are low, there are fewer comments from internet users, indicating lower levels of attention.
For monthly aggregated sentiment expectation values, the time unit is used. The dependent variable is denoted as scallion price (Y), and the independent variables are market factors (X1), macroeconomic factors (X2), and agricultural product-related factors (X3). In the following discussion, variable names will be abbreviated. Pre-tests for each dataset were conducted using Eviews, and the results indicate that all datasets pass the stationarity test, as shown in Appendix Table A4.

5.2. Cointegration Test

To avoid the issue of "spurious regression," this study employs cointegration tests to determine whether there exists a stable equilibrium relationship among several sets of data. Initially, the optimal lag order is determined, as indicated in Appendix Table A5. By considering five criteria, namely LR, FPE, AIC, SC, and HQ, marked with an asterisk (*) under each criterion. Subsequently, the Johansen cointegration test is performed using the determined optimal lag order of "3." The results are presented in the table below.
Table 5. Johansen cointegration test results.
Unrestricted Cointegration Rank Test (Trace)
HypothesizedNo.of CE(s) Eigenvalue Trace Statistic 0.05 Critical Value Prob.**
None * 0.598301 83.20350 47.85613 0.0000
At most 1* 0.520643 45.80937 29.79707 0.0003
At most 2* 0.238634 15.66168 15.49471 0.0472
At most 3* 0.103584 4.483380 3.841466 0.0342
At most 4* 0.096926 4.078019 3.531465 0.0434
The experimental results indicate that under all four hypothesis scenarios: "None," "At most 1," "At most 2," and "At most 3," the null hypothesis is rejected. This suggests that there exist cointegration relationships among the five sets of factors, not just one to four sets. In other words, there is a stable equilibrium relationship and mutual influence between the explanatory variables (market factors, macroeconomic factors, agricultural product-specific factors, attention factors) and the explained variable (scallion prices).

5.3. Granger Causality Test

Variables having cointegration relationships do not necessarily possess causal relationships, and it is difficult to determine the direction of causality between them. Therefore, conducting the Granger causality test further analyzes the causal relationships between variables. The results are presented in the table below:
Table 6. Granger causality test results.
Null Hypothesis: F-Statistic Prob. Verdict
X1 does not Granger Cause Y 6.05255 0.0007 Refuse
Y does not Granger Cause X1 0.13908 0.9816 Accept
X2 does not Granger Cause Y 3.73956 0.0106 Refuse
Y does not Granger Cause X2 1.26245 0.3086 Accept
X3 does not Granger Cause Y 5.43636 0.0014 Refuse
Y does not Granger Cause X3 0.42273 0.8287 Accept
X4 does not Granger Cause Y 5.29149 0.0016 Refuse
Y does not Granger Cause X4 0.49052 0.7804 Accept
Based on the table above, it can be observed that in the context of Granger causality relationships between the four factors and scallion prices, X1, X2, X3, and X4 are considered Granger-causing factors for the variation in Y. However, in terms of the Granger causality relationships between scallion prices and the four factors, the Prob. values are all greater than the significance level of 0.05. Therefore, the null hypothesis is accepted, indicating that Y is not a Granger-causing factor for the changes in X1, X2, X3, and X4. In other words, all four groups of factors are considered one-way Granger-causing factors for scallion prices.

5.4. Empirical Analysis Based on TVP-VAR Model

In various periodic evolution processes, the driving effects and effects of variables that follow the time series and have correlation are different in different stages, that is, they have time-varying and nonlinear relationships. The time-varying coefficient in the TVP-VAR model can more accurately express the characteristics of the lag structure of the model over time and the possible nonlinear characteristics. At the same time, considering that the price of small-scale agricultural products is affected by a variety of external shocks, the economic structure and public opinion characteristics will change accordingly. The fixed parameter model is difficult to express this structural change, so the time-varying parameter model is selected for measurement analysis. The TVP-VAR model is based on the structural VAR model, which is in the form of:
  A y t = F t y t 1 + + F S y t s + μ t , t = s + 1 , , n
In Equation (2), yt is a k × 1-dimensional observation vector, A is a k × k-dimensional simultaneous parameter matrix F1,…, Fs is a k × 1-dimensional coefficient matrix, and the disturbance term μt is a k × 1-dimensional structural shock. μ t ~ N ( 0 , ) , = σ 1 0 0 0 0 0 0 σ k ,The structural impact of the contemporaneous relationship is judged by the recursive method, and the simultaneous parameter matrix is a lower triangular matrix. A= 1 0 0 a 21 0 a k 1 a k , k 1 1 The simplified structural VAR model is obtained:
  y t = B 1 y t 1 + + B s y t s + A 1 ε t , ε t ~ N ( 0 , I k )
In (3). B i = A 1 F i , i = 1 , . . . , s .Stacks the row elements in constitute k 2 s × 1 dimension vector β and define X t = I s ( y t 1 , , y t s ) , where denotes the Kronecker score, and the model can be simplified as:
y t = X t β + A 1 ε t
Relax the assumptions of the parameters in the above formula, that is, all the parameters conform to the time series characteristics. The model expression is:
y t = X t β + A 1 ε t , t = s + 1 , . . . , n
In (5), the coefficient β i Simultaneous parameter matrix A i ,Cvariance matrix with random fluctuations i ,All have time-varying.
According to the research of Primiceri and Nakajima, the elements of non-0 and 1 in the lower triangular matrix A i are stacked into a column of vectors, that is at=(a 21, a 31, a 32, a 41, ..., a k, k-1),ream h t=(h 1t, ..., h kt),quorum h i t = log σ i t 2 , i = 1 , , k ; t = s + 1 , , n . Similarly, it can be assumed that the parameters in Equation (4) follow the following random walk process:
β t + 1 = β t + μ β t , α t + 1 = α t + μ α t , h t + 1 = h t + μ h t
ε t μ β t μ α t μ h t ~ N 0 , 1 0 0 0 0 β 0 0 0 0 α 0 0 0 0 h , t = s + 1 , . . . , n
In which, β s + 1 ~ N ( μ β 0 , Σ β 0 ) , α s + 1 ~ N ( μ α 0 , Σ α 0 ) , h s + 1 ~ N ( μ h 0 , Σ h 0 )

5.4.1. Estimation of time-varying parameters based on MCMC algorithm

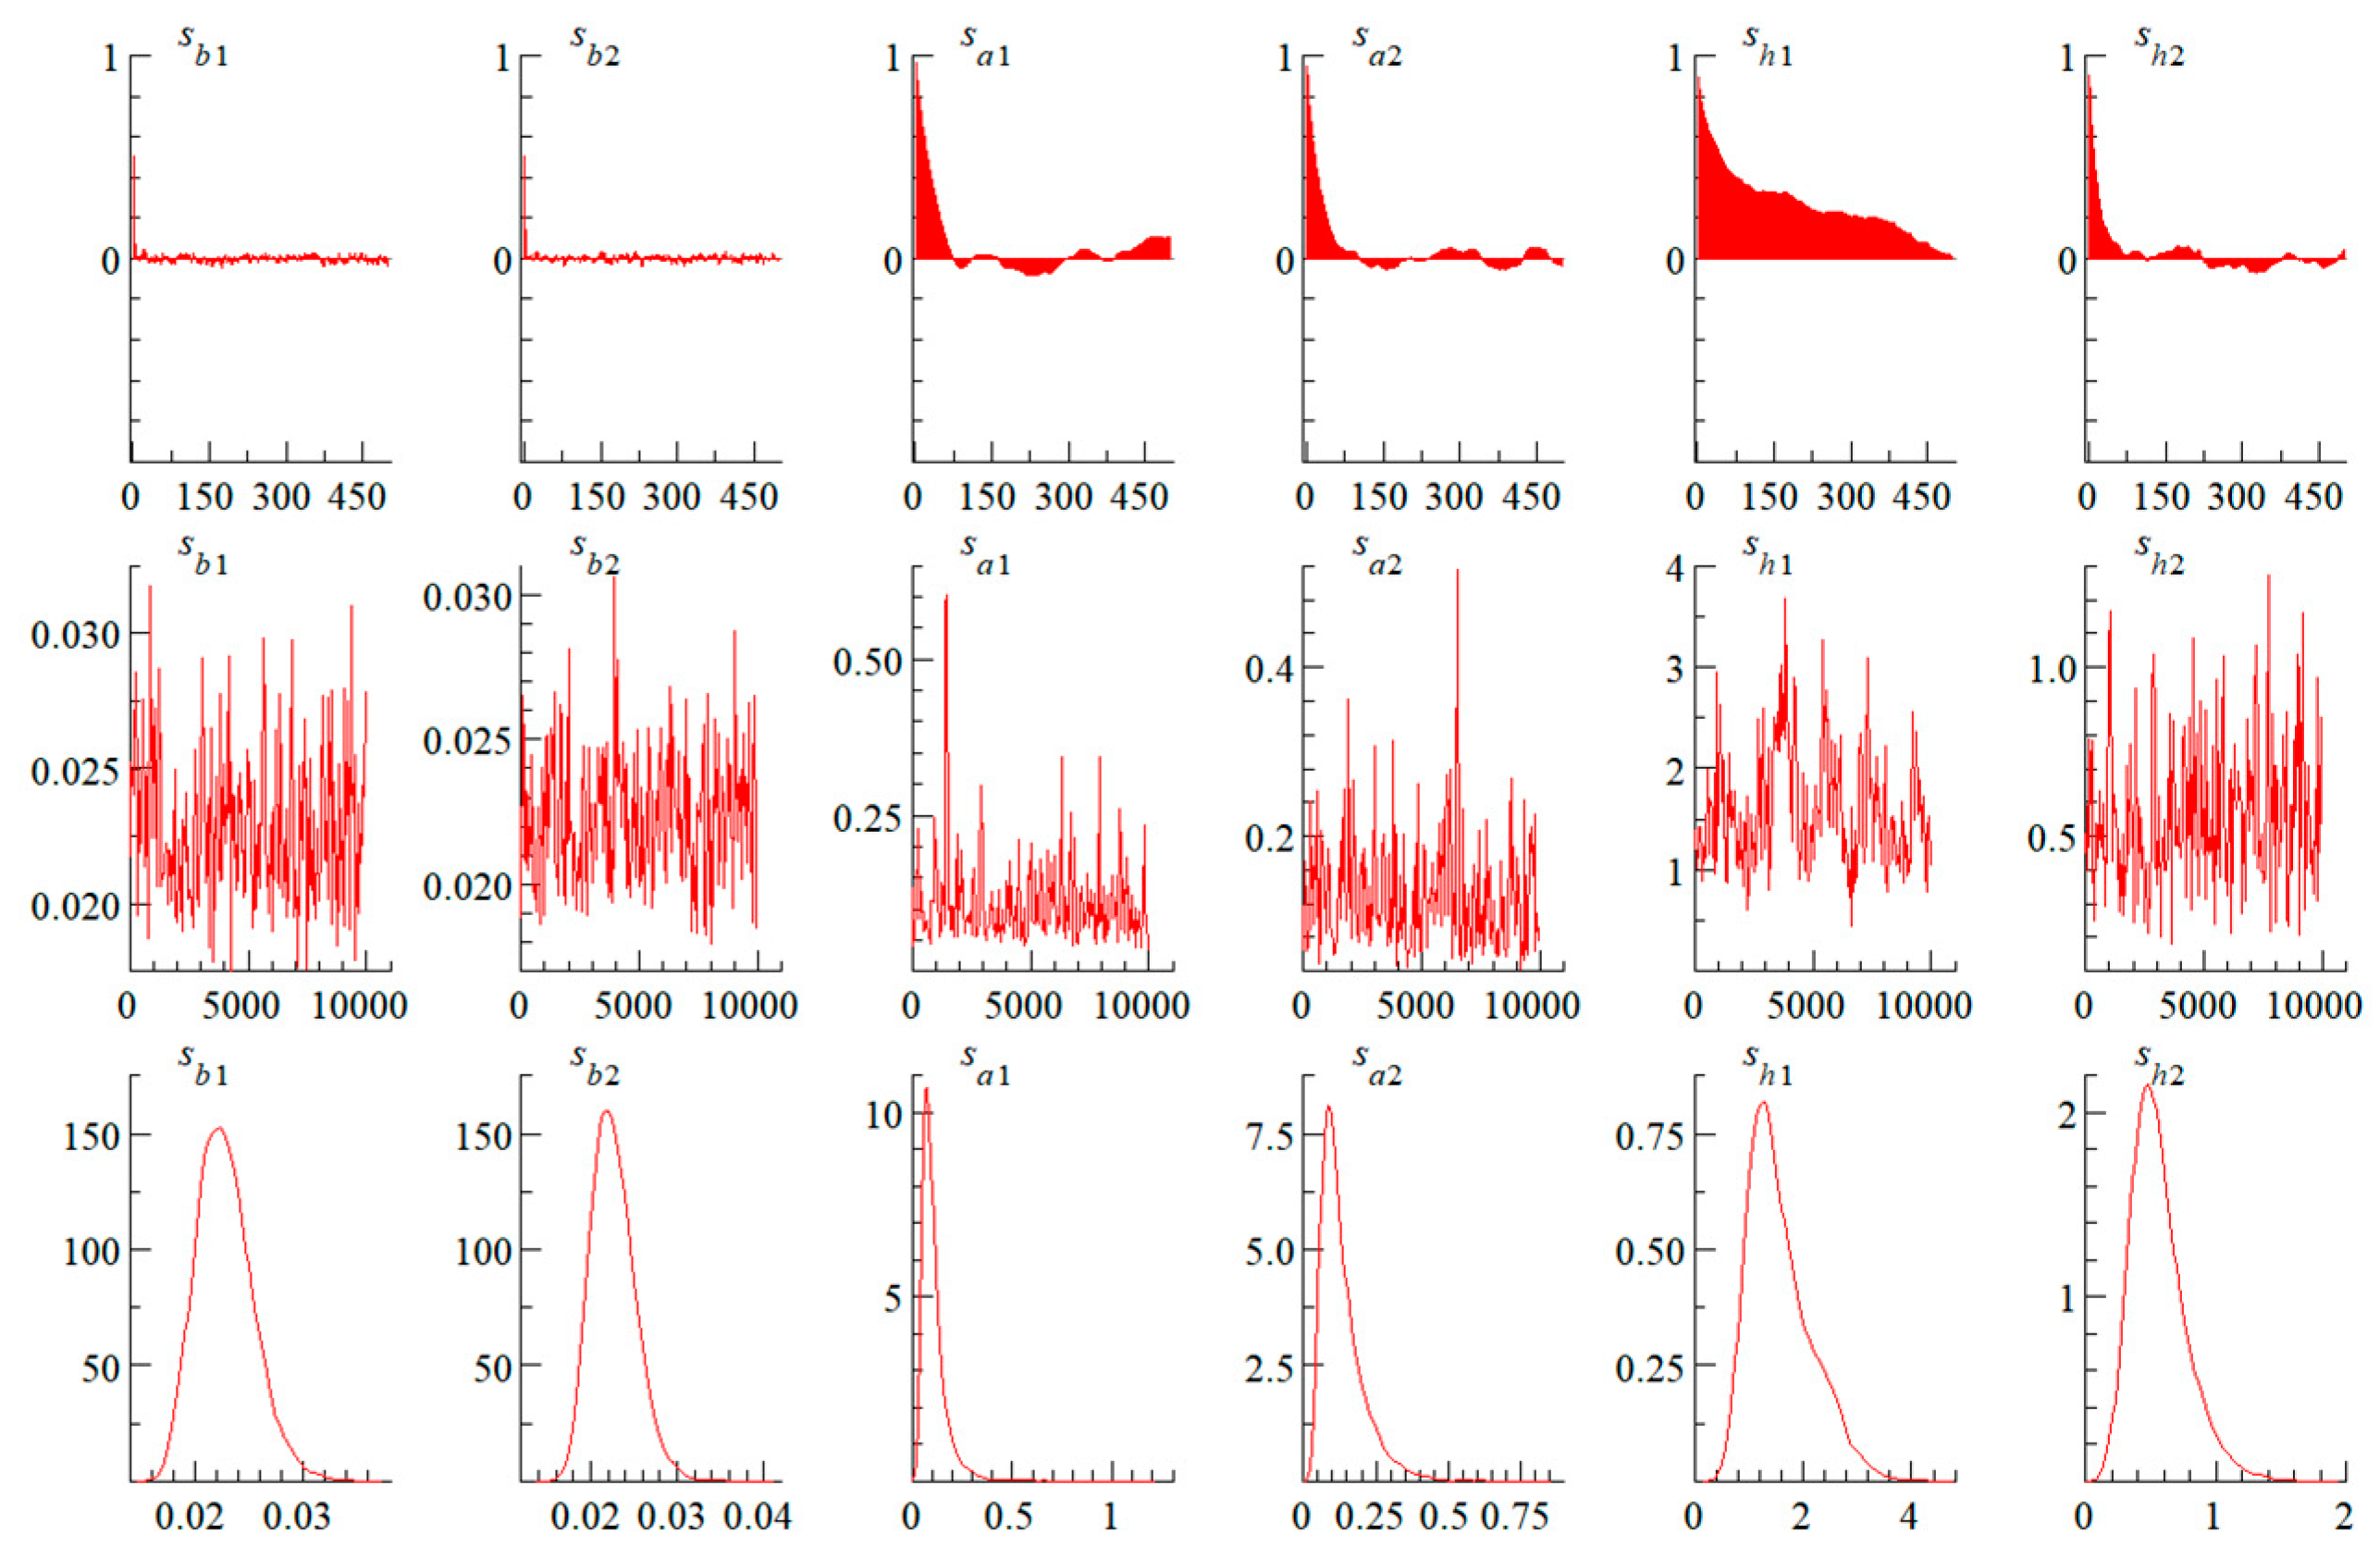
This study conducted empirical analysis using the TVP-VAR model through OxMetrics. Initially, the MCMC algorithm was employed for estimating time-varying parameters in unobserved latent variables. The number of samples was set at 10000. To ensure the obtained samples were independent of the initial values and to achieve more robust estimation results, the first 1000 samples were discarded to obtain effective samples. As shown in Appendix Table A6, the standard deviations, upper and lower 95% credible intervals, and posterior means of the selected parameters based on MCMC estimation of the TVP-VAR model are presented. The posterior means of all parameters fall within the 95% confidence interval. Additionally, Geweke statistics are all below 1.96, indicating that at the 5% significance level, the null hypothesis of parameter convergence to the posterior distribution is not rejected. The pre-sampling during the iteration cycles effectively led the Markov chain to concentrate. The maximum value of ineffective factors is within an acceptable range, suggesting that the posterior distribution of various parameters was effectively sampled.
As depicted in Figure 8, the top row displays that the first six parameters gradually descend towards zero with small-scale fluctuations, indicating the presence of autocorrelation in the data. The second row illustrates the value paths of the model samples, revealing that the data fluctuates within a certain range and remains relatively stable. The bottom row showcases the density functions of the posterior distribution. Observing that each parameter adheres to a normal or quasi-normal distribution, it demonstrates that the values are well-behaved. Thus, these observations collectively suggest that the experimental simulation generated stable and uncorrelated samples. The time-varying parameters exhibit convergence, validating the effectiveness of using MCMC for estimation.

5.4.2. Factor Stochastic Volatility Analysis

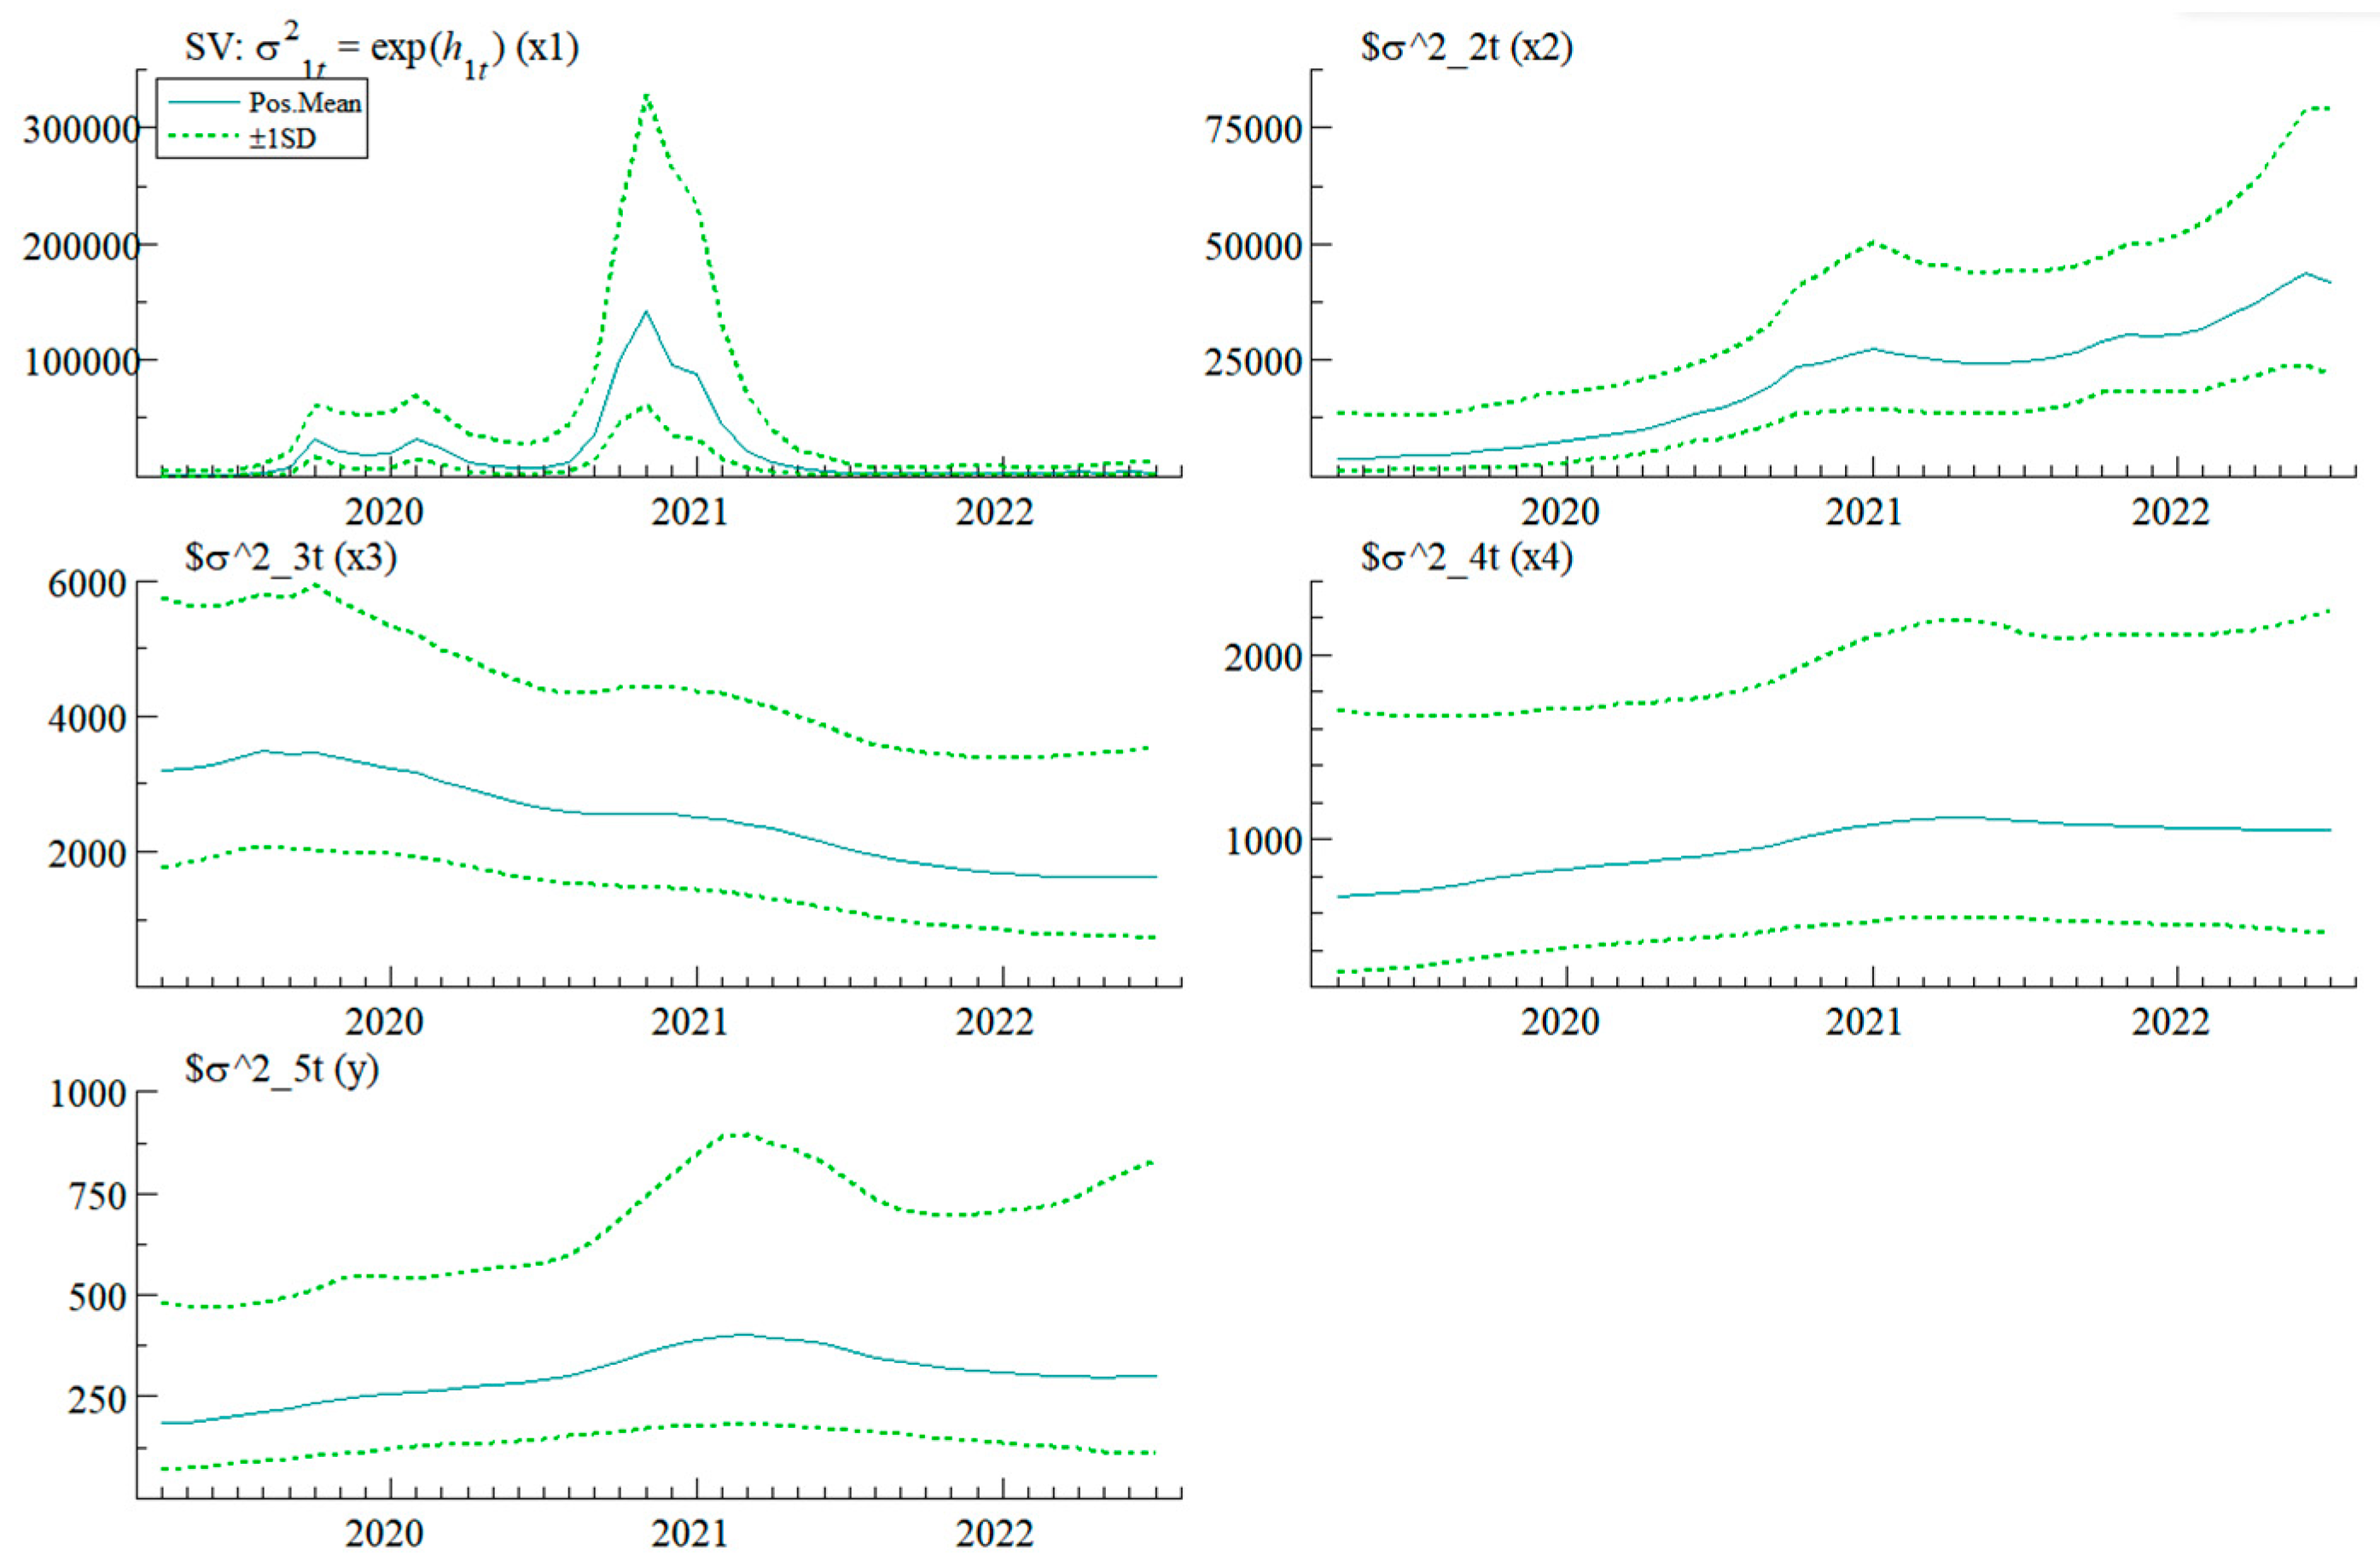
Figure 9 presents the posterior estimates of the corresponding random volatility of the four factor-price pairs under structural shocks. The individual line plots exhibit distinct characteristics. The random volatility of X1 experiences minor fluctuations after the end of 2019, reaching its peak in November 2020, followed by a gradual decline until maintaining relative stability. The random volatility of X2 shows an overall increasing trend, reaching peaks in early 2021 and mid-2022. On the other hand, X3 and X4 both exhibit decreasing and increasing trends respectively, with relatively small fluctuations. The random volatility of Y reaches its peak in early 2021. Notably, each of the five factors exhibits unique patterns in random volatility within the same time window. Therefore, it becomes essential to analyze the dynamic spatiotemporal response of these factors to the fluctuations in scallion prices across different time periods, lag periods, and time points.

5.4.3. Spatio-Temporal Impact Analysis

5.4.3.1. Test Results for Four Hypotheses

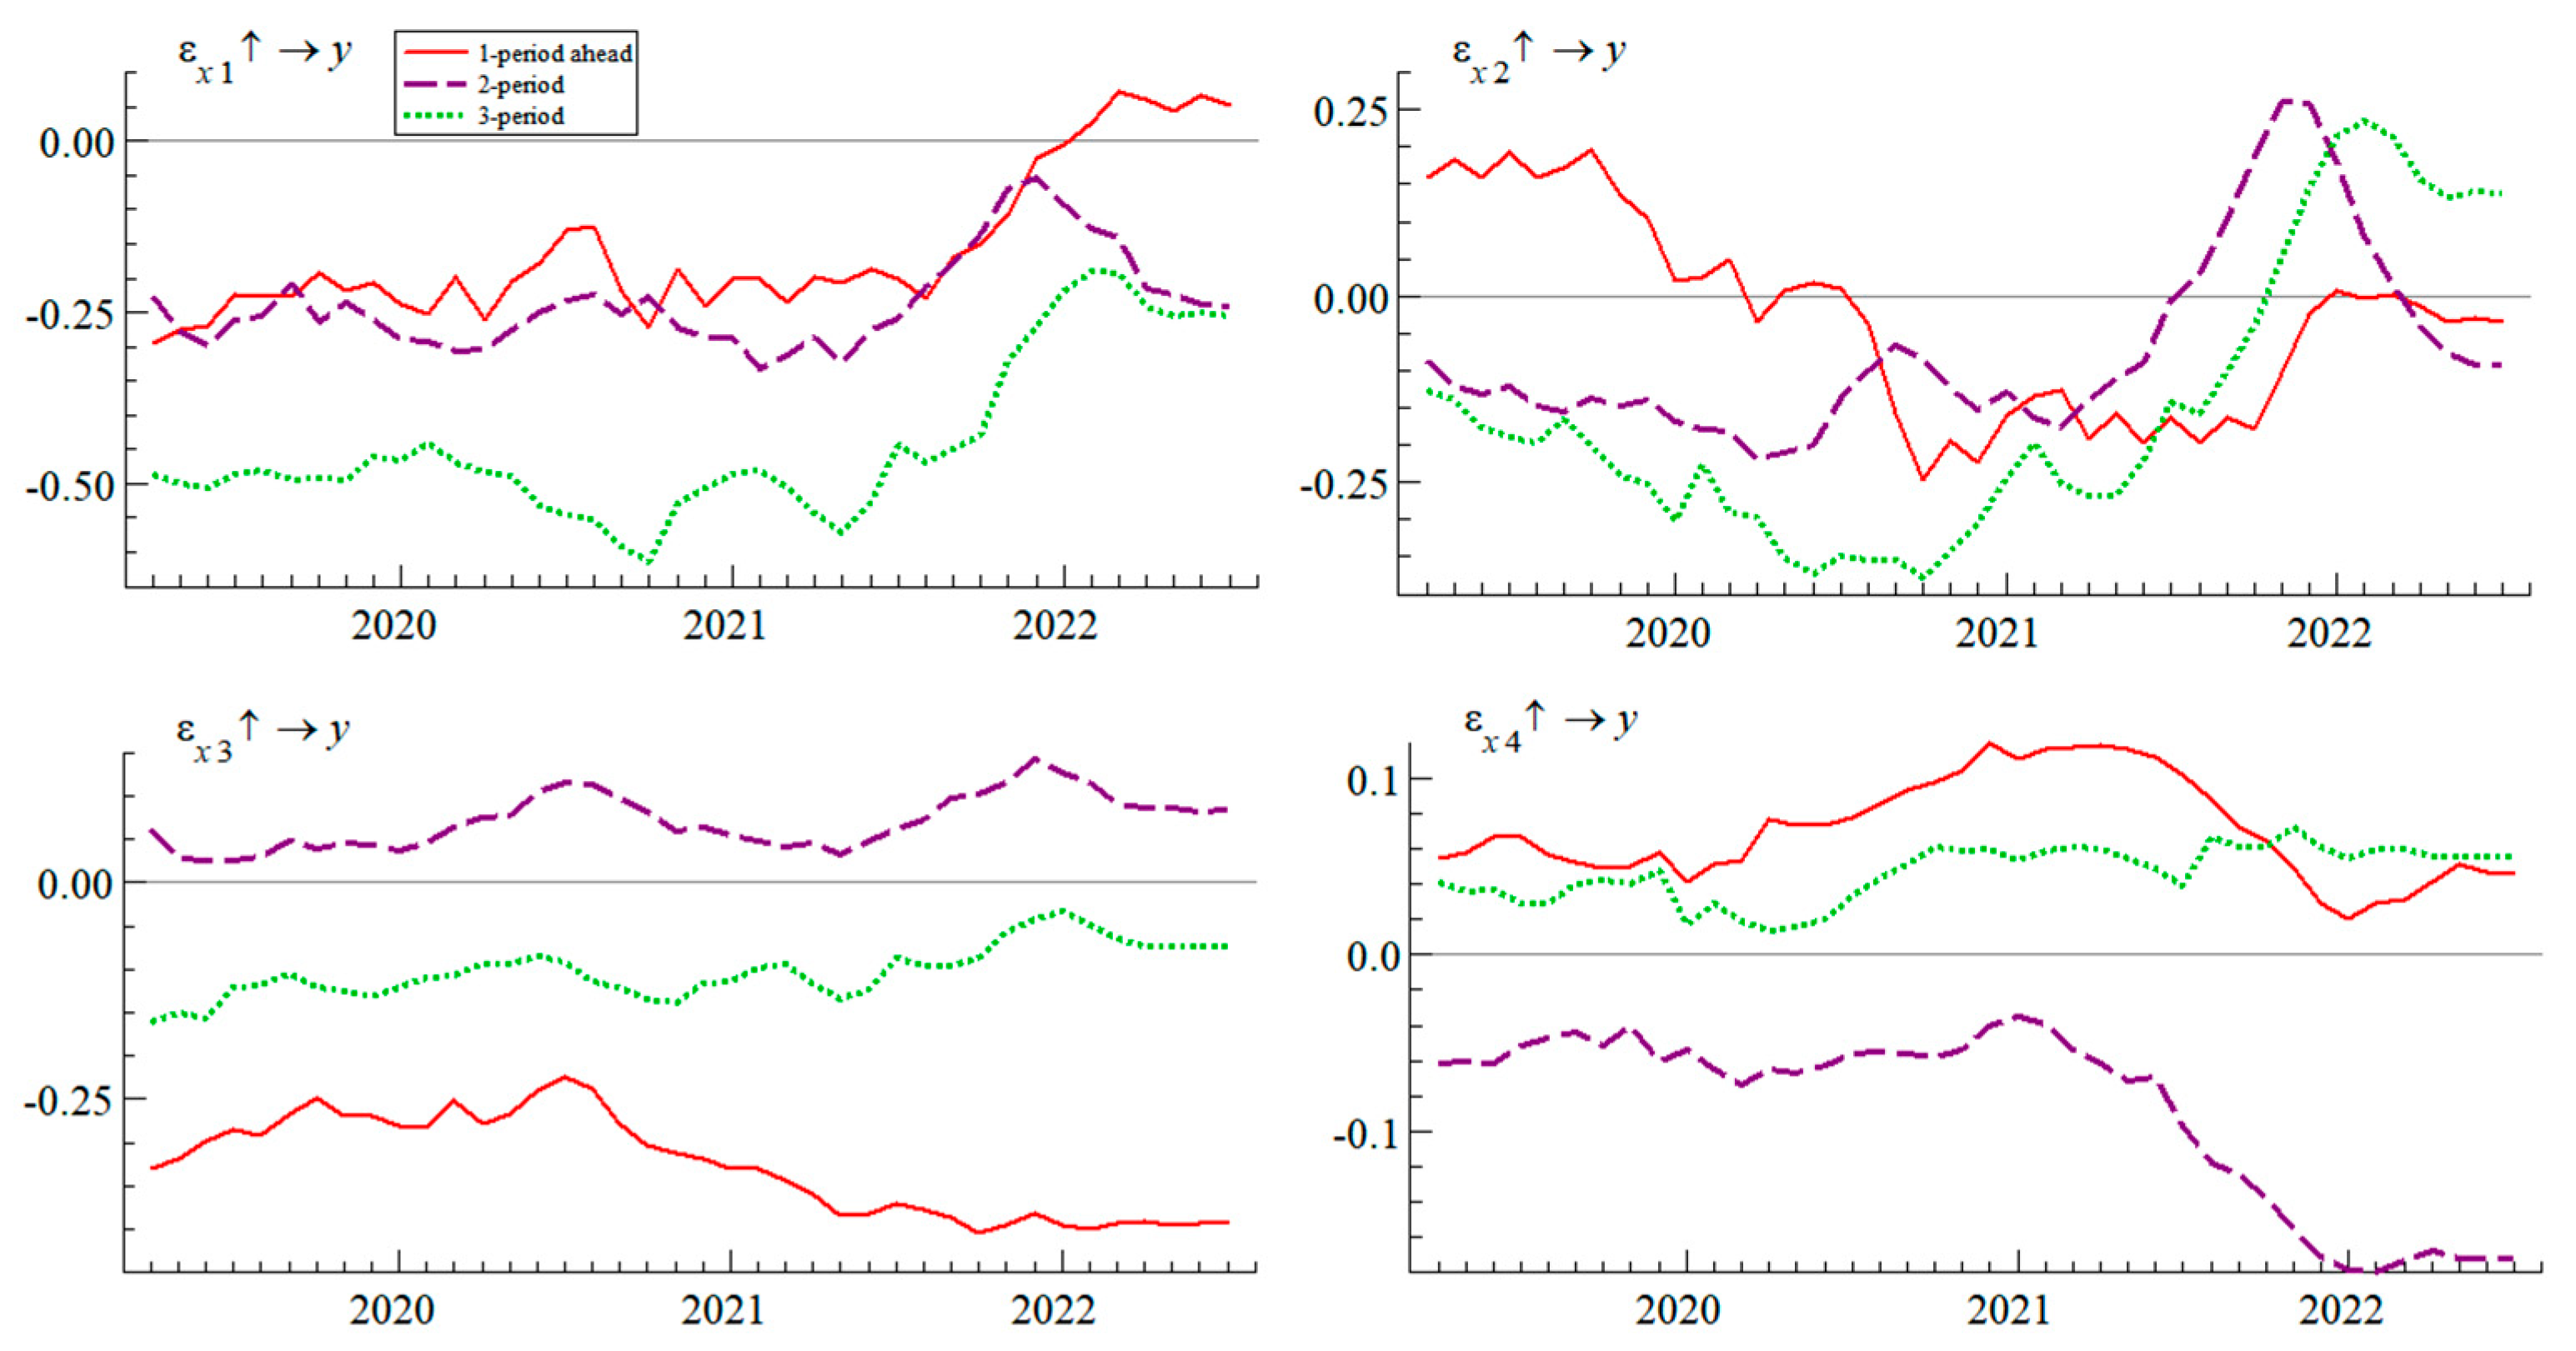
Figure 10 illustrates the dynamic impulse response of the four factors on Y, considering three different lag periods corresponding to short-term, medium-term, and long-term effects, represented by one month, two months, and one quarter, respectively. The study reveals that the impact of the four factor groups on Y is subject to time variation, indicating that as the trends of these factors evolve over their lifecycle, Y experiences continuous fluctuations. Furthermore, the effects of each factor on Y vary across different lag periods. In the case of X1 and X2, their influence on Y is not notably evident within a one-month lag, but becomes more significant over the span of one quarter. This phenomenon can be attributed to the fact that the growth cycle of scallion is typically around three to five months. As a small-scale agricultural product highly sensitive to market conditions, its price often displays quarterly fluctuations, leading to a similar pattern of lagged effects driven by market and environmental factors. Conversely, the influence of X3 and X4 on Y is most pronounced within a one-month lag period and weakest within one quarter. This could be attributed to the short-term attention people pay to scallion prices, often spanning one month.
Compared to X1 and X2, the influence of X3 on Y is relatively more pronounced, yet the differences among these three factors are relatively small, with X4 having the least impact. Specifically, due to the low household consumption of scallions and weak price transmission to other agricultural products, the internal prices of small-scale agricultural products tend to mutually influence each other. In contrast to market and environmental factors, the significant impact of scallions' intrinsic characteristics, such as their role as a seasoning and their attributes, as well as substitute products like ginger and garlic, becomes more evident.
For the four sets of assumptions in 3.4.2, the empirical analysis of the results has a certain degree of verification. Among them, H2 and H3 have the highest conformity, while H1 and H4 have found more directions for analysis and interpretation:
(1) X1 has a stabilizing negative impact on Y in the early and middle terms, confirming the hypothesis H1. This can be attributed to two factors: firstly, the impact of the prolonged depressed scallion prices in 2018 on scallion growers led them to reduce scallion cultivation areas in the early months of 2019, resulting in tighter market supply; secondly, increased rainfall and adverse weather conditions in 2020-2021, particularly in major scallion -producing regions like Shandong and Liaoning, resulted in lower scallion yields due to frost and flooding, negatively affecting scallion prices in the short term. However, a turning point occurs in January 2022. The previous deep winter led to reduced scallion market supply and circulation. Nevertheless, increased buying and selling intentions due to traditional festivals and holiday-related consumer behavior, combined with the circulation of scallions from overwintering greenhouses, balanced the supply-demand situation and maintained a healthier fluctuation in scallion prices during this period.
(2) X2 has a positive impact on Y in the early stages and a negative impact in the later stages, confirming hypothesis H2. This could be attributed to two main factors: Firstly, from 2019 to 2020, China's GDP saw an overall increase, leading to a favorable economic environment and a gradual rise in consumer spending. Secondly, in an effort to address the scarcity of agricultural products, the government initiated a vegetable reserve program in thirteen provinces from February to April 2019, including scallions. Then, in December 2019, the outbreak of the COVID-19 pandemic occurred. However, the impact of the pandemic on the market did not take immediate effect; it had a delayed impact. The turning point came in February 2020 when the pandemic spread nationwide. The impact of COVID-19 on scallion prices manifested in several ways: Due to the majority of scallion production being in the northern regions while consumption was distributed across the country, the strict implementation of epidemic prevention policies in various regions affected logistics, supply chains, and transportation of goods, leading to difficulties in inter-regional transportation. In April 2020, the Chinese government implemented macro policies to regulate the negative impact on the agricultural market, ensuring stable supply chains and transportation efficiency for various agricultural products, which resulted in most agricultural prices stabilizing and returning to pre-pandemic levels. However, due to limited control measures, a second turning point occurred in June 2020. The pandemic escalated, particularly in major scallion -producing regions. The worsening situation and inability to improve the overall environment in the short term led to the spread of negative sentiments through internet channels, triggering panic buying and other behaviors. As a result, the impact shifted to increasing negativity until reaching a peak in October 2020. After October 2020, the impact turned positive as the pandemic situation was effectively controlled, and the environment gradually improved, resulting in relative stability in scallion prices. These factors collectively explain the shifting impacts of X2 on Y and its connection to the complex dynamics of the scallion market in response to economic and pandemic-related fluctuations.
(3) X3 generally has a negative impact on Y's stability, confirming hypothesis H3. This can be attributed to the impact of the pandemic on the agricultural market. The planting, cultivation, and transplanting of most vegetables were affected by the pandemic, resulting in decreased vegetable planting areas, particularly in colder regions. When the overall supply and demand become imbalanced due to either oversupply leading to price drops or undersupply leading to price increases, agricultural product prices can experience significant fluctuations. The pandemic-induced disruptions led to substantial volatility in agricultural product prices, causing prices to surge and plummet. Among the 28 major vegetables, the average price increased over time. During periods of price surges, vegetable prices reached their highest point in nearly a decade, at 4.66 yuan per kilogram. This price volatility extended to related products as well, leading to sustained high prices across the board. These fluctuations consequently had a spillover effect on scallion prices, contributing to prolonged negative impacts on scallion prices.
(4) X4's impact on Y's stability in the short term is generally positive, turns negative in the medium term, and then returns to positive in the long term, confirming hypothesis H4. This pattern could be attributed to various factors. In the short term, people's attention to scallion prices might mitigate market failure risks to some extent. As prices rise, stakeholders may perceive opportunities to profit by stockpiling scallion s during price drops or selling them during price increases. This behavior could lead to an increase in scallion cultivation across different regions, resulting in an imbalanced supply and demand in the market. Moreover, the activities of dealers such as price manipulation and speculative trading can contribute to negative price fluctuations. These factors combined can contribute to short-term positive effects on scallion prices. In the medium term, the surge in scallion cultivation driven by profit motives can lead to an oversupply situation, driving prices down. During this period, the interests of various stakeholders might lead to market imbalances and price volatility, which could explain the observed negative impact. However, in the long term, sustained attention and intervention from government authorities or relevant organizations could help correct market imbalances and abnormal price fluctuations. Their actions might aim to balance the interests of growers and dealers and address market failures. This long-term perspective could contribute to the observed positive impact. Overall, the complex interplay of factors including market behavior, stakeholder interests, and regulatory interventions could account for the shifting impact of X4 on scallion prices over different time periods.

5.4.3.2. Analysis of Time-Varying Characteristics of Impulse Response

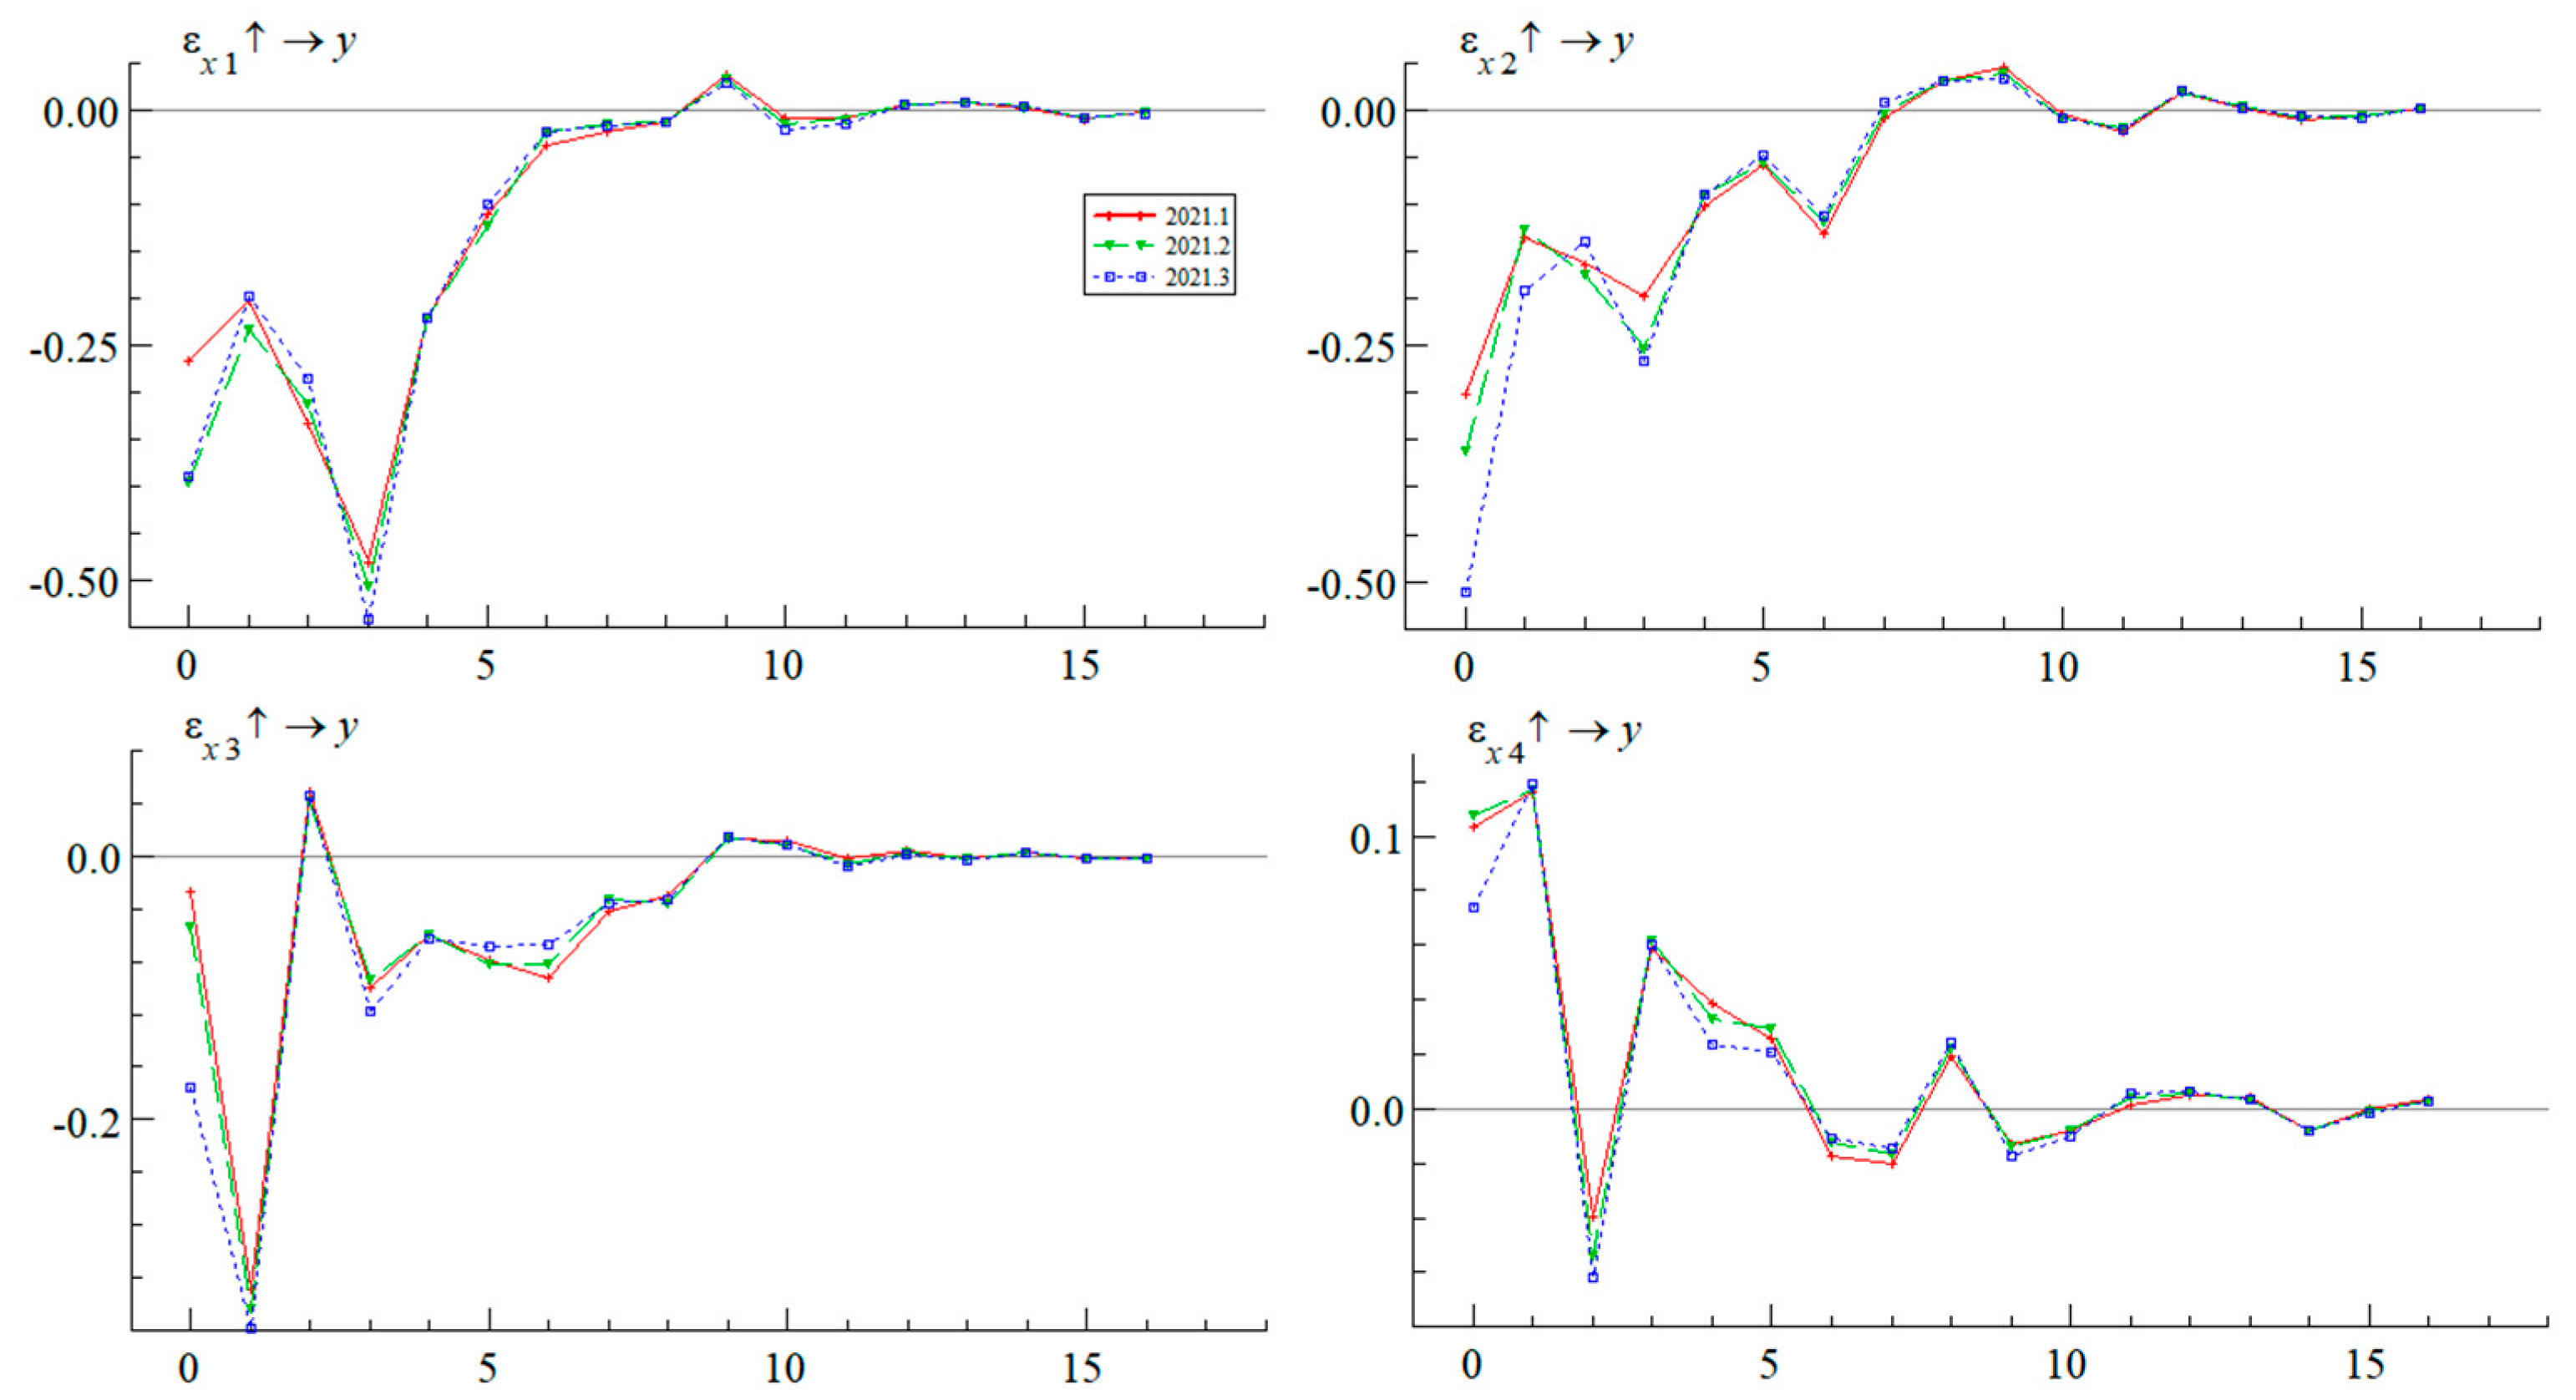
We initially selected the adjacent time points of January, February, and March 2021, corresponding to the peak of random fluctuations in Y. This allowed us to examine the effects of the four factors during periods of more pronounced scallion price volatility. The results of the impulse response analysis at these specific time points are presented in Figure 11. The impulse response trends of Y at different time points are influenced to varying extents by the four factors. There is a consistent pattern of convergence in the impulse responses at adjacent time points, yet the strength of the responses varies over time.
Regarding the impulse response trends, under the influence of X1, the impulse response of scallion prices initially rises, turns downward in the first period, reaches a peak around the third period, and then gradually converges to a small fluctuation around zero. The impulse response influenced by X2 exhibits an abrupt increase initially, followed by turning points at the first, third, sixth, and ninth periods, and eventually converges to zero around the seventh period. On the X3 side, the impulse response sharply drops, peaks at the first period, undergoes a substantial transformation, and then gradually converges to a small fluctuation around zero near the ninth period. In the case of X4, the impulse response experiences a slight rise, reaches a peak at the first period, followed by a sharp decline to the second period's peak, an abrupt increase to the third period, and finally a gradual decline to a moderate fluctuation around zero. It's noteworthy that, except for X4, the impulse responses to Y converge to zero around the eighth period, indicating that the impacts of the three factors don't extend beyond eight months. This implies that unusual fluctuations in scallion prices are more pronounced during this period. On the other hand, the impact of X4 on Y's exceptional fluctuations remains substantial even up to the twelfth period, suggesting that X4's influence on the unusual volatility of Y persists for a year or even longer. This can be attributed primarily to the rapid growth of the internet and the increasing influence of social media on people's lives.
In terms of impulse response intensity, both X1 and X2 exhibit maximum negative impacts on Y at the third period, consistently leaning towards negativity throughout the sample interval. This suggests that during periods of relatively strong price fluctuations, X1 and X2 tend to exert negative effects on Y. On the other hand, X3 reaches its maximum negative impact at the first period, briefly shifts to a positive influence at the second period, and then primarily maintains a negative influence. This indicates that during this timeframe, X3 mostly imposes negative stability on Y. As for X4, it achieves its maximum impact at the first and second periods, with only two negative impacts within the first six periods. Beyond the sixth period, a pattern of alternating positive and negative impacts emerges. This indicates that X4 has a short-term positive effect on Y, while its long-term influence varies depending on the public's attitudes and the specific actions of stakeholders.
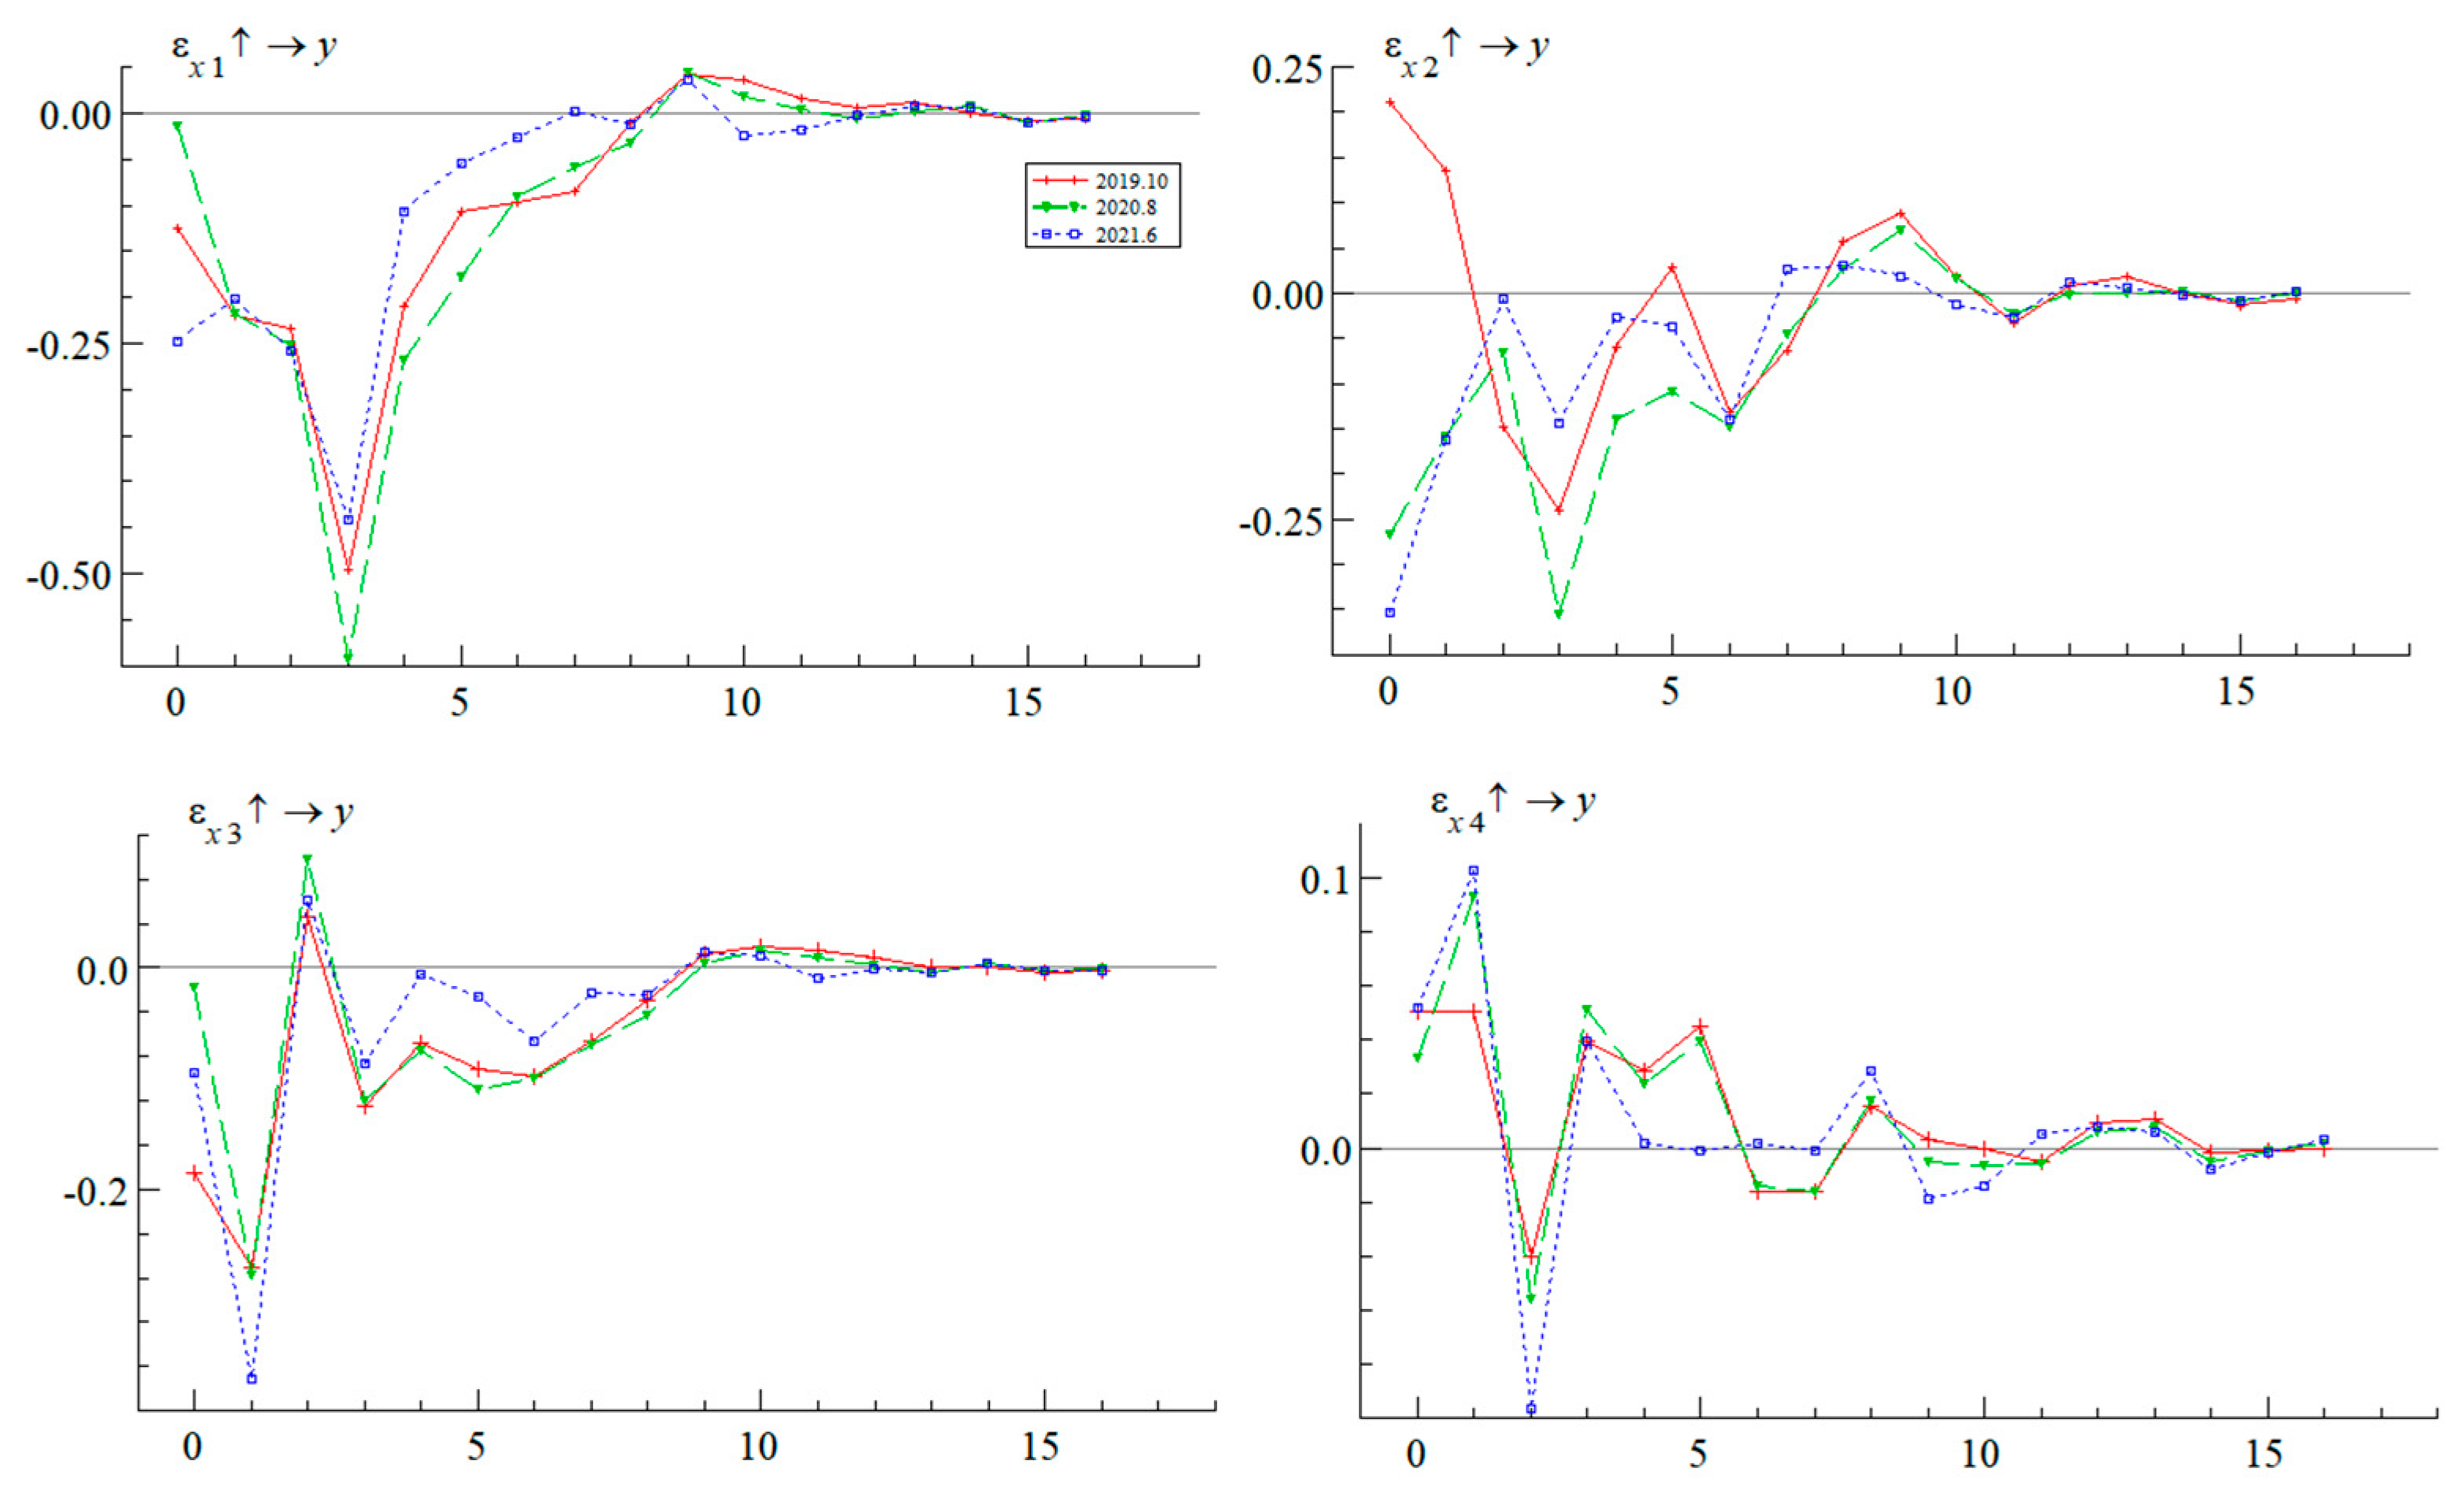
Furthermore, based on Y being higher, lower, or near its mean value, three distinctive time points were selected: October 2019, August 2020, and June 2021. As depicted in Figure 12, the factors exhibiting the strongest heterogeneity across different time points are X1 and X2. This suggests that these two factors vary in response to changes in online sentiment, and the differences generated over time will continue to expand. Taking the impulse response at the X2 time point in the upper-right corner of the graph as an example, it is positive at the end of 2019, shifting to negative as the COVID-19 pandemic began to spread in early 2020, indirectly influencing price fluctuations. Notably, for the time point when prices are slightly higher, the impact of X2 is slightly more pronounced compared to the time points with prices near or below the mean value. On the other hand, the influence of X4 varies due to market trends, unforeseen events, or shifts in public attitudes driven by news, resulting in uncertain effects across different time points. Meanwhile, the variations in the effects of X1 and X3 are relatively minor across the selected time points. This is attributed to the market's inherent self-regulatory capacity, including interventions from relevant authorities and policy adjustments, contributing to a similar trend in direction and intensity as observed in Figure 10. Throughout these shifts in time points, the influence of market factors consistently remains the strongest, followed by environmental factors and the influence of the agricultural product itself and related products, which are roughly balanced. The impact of attention-related factors remains the smallest regardless of the changes in time points.

6. Conclusion and Suggestions

This study employs the example of scallions to delve into the underlying mechanisms and changing trends of key factors influencing abnormal price fluctuations in small-scale agricultural products from the network perspective. Firstly, the LDA topic model is applied to extract and cluster topics from online sentiment data related to scallion prices over the past three years. Four dimensions are identified—market environment, overall economic context, related agricultural product prices, and market attention—to categorize and define the crucial factors within online sentiment that significantly impact scallion price fluctuations. Subsequently, leveraging the specific characteristics of agricultural price-related textual information, an enhanced SO-PMI algorithm is utilized to appropriately expand the domain-specific lexicon. This incorporates syntactic analysis into sentiment analysis, with a focus on the influence of negation words and adverbs of degree on the sentiment orientation of the text. This enhancement improves the accuracy of quantifying sentiment for various factors. Through cointegration tests and Granger causality analysis, the significant impact of the aforementioned factors on scallion price fluctuations is validated. Lastly, considering different lag periods and time points, the TVP-VAR model is employed to contrast the impulse responses of the various factors to fluctuations in scallion prices. This analysis is complemented by socio-economic context and sentiment events within the corresponding time windows. This comprehensive approach deeply explores the mechanisms behind diverse impact effects and the changing trends of scallion prices. Moreover, the four hypotheses proposed in this study are examined and reasonably assessed. In summary, the specific analytical conclusions are as follows:
(1)
Over the past three years, in the context of longer cycles, the four factors exhibit distinct overall changing trends and varying magnitudes of influence on scallion prices. Market factors, which reflect supply-demand relationships and production elements, continue to be the primary drivers of agricultural product prices, reaffirming the fundamental dynamics of agricultural markets. However, the period from 2019 to 2022 is unique due to the global impact of the COVID-19 pandemic on the economy. During this time, the fluctuations in scallion prices were significantly influenced by both social and economic environmental factors. As the pandemic gradually stabilized and was brought under control after 2021, the influence of the socio-economic environment on price fluctuations rapidly diminished.
(2)
The effects of market factors, environmental factors, related agricultural product prices, and market attention on scallion prices are characterized by time-varying and lagged features, reflecting certain lifecycle characteristics. On one hand, these four factors exhibit significant variations in their impact on scallion prices during different periods, with notable differences in the lagged effects. Market factors and environmental factors show the most significant lagged effects within a quarterly lag period, suggesting that these factors have longer-lasting delayed impacts on price fluctuations. On the other hand, the factors related to prices of other agricultural products and market attention exhibit the most significant lagged effects within a monthly lag period, indicating that these two factors have more pronounced short-term lagged effects on scallion prices. Additionally, according to the lifecycle theory, it's observed that the dynamic pulse responses are more pronounced at time points when scallion prices exhibit high levels of random volatility.
(3)
At different time points and time periods, there are evident characteristics of heterogeneity in the impact of the four factors. During the phase from mid-2019 to early 2020 when the COVID-19 pandemic was spreading and erupting, the influence of environmental factors reflecting the socio-economic conditions and the factor of market attention was relatively significant. As the pandemic transitioned from rapid spread to gradual control, the influence of these two factors experienced corresponding fluctuations, but overall, they exhibited a decreasing trend. On the other hand, the impact of market factors gradually intensified over time. This pattern reflects that short-term fluctuations in scallion prices are more influenced by socio-economic conditions and specific events, while the influence of market factors becomes more pronounced over longer time periods.
These factors not only objectively reflect the influence of market supply and demand, overall economic conditions, and macroeconomic policies on scallion prices but also capture the expectations and subjective attitudes of various market participants, including speculators, producers, and consumers, towards price changes. This comprehensive approach considers both macro and micro dimensions, as well as subjective and objective factors, to reflect the various key factors that contribute to fluctuations in scallion prices. The analysis results outlined above demonstrate the objective patterns of how different market factors affect agricultural product price fluctuations and also shed light on the socio-economic characteristics of specific periods. These insights provide valuable references for stabilizing the prices of small-scale agricultural products. Building upon the analysis presented, we propose the following strategies and recommendations:
(1)
Establishing a Comprehensive Small-Scale Agricultural Product Market Information Dissemination Mechanism and Sharing Platform
Improving and maintaining an effective market information dissemination and sharing system is a crucial step in ensuring the stability of prices for small-scale agricultural products. Governments at all levels should encourage relevant departments to establish a robust mechanism for disseminating and sharing information about small-scale agricultural products. This should include timely collection and publication of data related to cultivation areas, yields, prices, market demand, and other relevant aspects. By efficiently offering comprehensive agricultural information services, this system would provide farmers with the necessary insights to make informed decisions. This approach would facilitate a balanced supply-demand relationship in the market and foster a healthy market environment.
(2)
Enhancing Public Sentiment Monitoring and Regulation, and Guiding Positive Public Discourse
Online public sentiment holds significant influence over the attitudes and decisions of market participants. In cases where social sentiment events or abnormal price fluctuations of agricultural products occur, relevant authorities should promptly monitor public sentiment trends. They should conduct objective analyses of the fundamental reasons behind price fluctuations and provide accurate and effective information to all market participants. Proactive engagement in steering public discourse in a positive direction can effectively prevent the accumulation of negative sentiment and the spread of panic psychology. Additionally, through effective public sentiment monitoring, authorities can stay attuned to public concerns and market sentiment. This would allow for scientifically sound anticipation and effective prevention of potential market turbulence caused by various influencing factors.

7. Limitations and Prospects

This paper mainly explores the influencing factors of the price fluctuation of small-scale agricultural products from the perspective of network public opinion analysis. To a certain extent, these factors can reflect the relationship between market supply and demand, the overall economic environment, the emotions of market players and the impact of market expectations on future prices, but they are still not comprehensive enough. The production and sales of different small-scale agricultural products will also be affected by other factors such as geographical environment, climatic conditions and consumption habits. Future research will further explore the influencing factors and their mechanism of action from a more comprehensive and in-depth perspective, and build a suitable model to scientifically predict and warn the price fluctuation of small-scale agricultural products.

Author Contributions

Conceptualization, Lifang Fu; methodology, Lifang Fu and Hua xu Zhang; software, Hua xu Zhang.; validation, Hua xu Zhang; formal analysis, Lifang Fu and Hua xu Zhang; investigation, Lifang Fu and Hua xu Zhang; resources, Lifang Fu; data curation, Hua xu Zhang.; writing—original draft preparation, Hua xu Zhang.

Funding

This research was funded by General Project of Philosophy and Social Science of Heilongjiang Province, grant number: 20SHB080.

Institutional Review Board Statement

Not applicable.

Informed Consent Statement

Not applicable.

Data Availability Statement

The data that support the finding soft his study are available from the Correspond author up on reasonable request.

Conflicts of Interest

The authors declare no conflict of interest.

Appendix A

Table A1. Input and output of key parameters of LDA topic model.
Key parameter Implication Input or output content
df Define input public opinion data 4721 obs.of 13 variables
Stop Define input stop word library data 1890 obs.of 1 variables
Word Define the number of all word segmentation results 628238 obs.of 15 variables
Word.lda Import R Machine Learning Component Package Large LDA-VEM (4.2 MB)
Word.dtm Define the input data format and attributes Large Document Term Matrix
Word.frq Output text word frequency total statistics 423867 obs.of 3 variables
Word.frq1 Output word frequency statistics after removing stop words 308938 obs.of 3 variables
Word.frq2 Output word frequency statistics after further data cleaning 174990 obs.of 3 variables
Word.label Test gamma distribution, output word belongs to label 14160 obs.of 3 variables
Word.comments Test the gamma distribution and output the class cluster of the comment topic 14160 obs.of 3 variables
Word.topics Test the beta distribution and output the probability of each word corresponding to the topic 32814 obs.of 3 variables
Word.terms Test the beta distribution and output the top keywords of each topic 40 obs.of 3 variables
Topicwords Output the first n representative words in the topic Chr [1:150]“价格”“大葱”“蔬菜”“上涨”...
Table A2. Expand domain vocabulary display.
pawβ-Judged nawβ-Judged
Word PMI Length Part-of-speech Word PMI Length Part-of-speech
投放
储备
稳定
物流
回落
推荐
支持
发展
协调
保障
98.4349
92.0971
84.0112
82.4268
76.8883
76.2915
72.5271
72.4991
75.2731
74.2025
2
2
2
2
2
2
2
2
2
2
v
v/n
v/ad
n
v
v
v/n
v
v
v/n
翻倍
吃不起
涨到
涨价
涨幅
高达
疯狂
暴涨
翻番
买不起
96.0905
87.1588
86.9920
84.2206
83.7222
79.1152
71.2544
70.7319
65.7654
64.1543
2
3
2
2
2
2
2
2
2
3
v
v
v
n
n
ad
ad
v
v
v
Table A3. Final expansion dictionary description.
Attribute/polarity Quantity Instantiation Weight
Part-of-speech Positive emotional words 10217 好转、回落、给力、实惠、平稳、惠民、稳定、缓解、回落、小康等 1
Negative emotional words 8952 坑人、上涨、走高、垃圾、可恶、疫情、暴涨、弊端、向前葱、哄抬物价等 -1
Negation 45 不、未曾、无须、不要、请勿、休想、绝不、绝非、禁止、从未有过等 -2
Degree adverbs over 30 忒、过度、过猛、过于、太强、何止、超额、何啻、过了头等 2
extreme/most 69 倍加、极度、极端、极其、绝对、最为、百分之百、彻头彻尾等 1.8
very 42 颇为、实在、不少、分外、格外、何等、特别、尤其、尤为等 1.5
more 37 较为、更为、更加、愈发、愈加、越加、越是、越来越、越...越等 1.2
-ish 29 略微、略加、稍稍、稍微、一些、一点、有点、有些、一丢丢、多多少少等 0.8
insufficiently 12 弱、微、微小、轻微、轻度、不甚、不大、不怎么、不丁点儿等 0.5

Appendix B

Table A4. Price and factor variable ADF test.
1% level 5% level 10% level T-Statistic P-Value verdict
Price -4.018748 -3.439267 -3.143999 -5.687067 0.0000 stable
Factor 1 -2.622585 -1.949097 -1.611824 -2.831748 0.0057 stable
Factor 2 -3.596616 -2.933158 -2.604867 -3.996649 0.0034 stable
Factor 3 -2.621185 -1.948886 -1.611932 -4.045642 0.0002 stable
Factor 4 -3.596616 -2.933158 -2.604867 -3.354618 0.0185 stable
Table A5. Statistics of lag order.
Lag LogL LR FPE AIC SC HQ
0 -1043.097 NA 3.95e+16 52.40483 52.61594 52.48116
1 -989.3681 91.33837 9.50e+15 50.96840 52.23506* 51.42639*
2 -963.2682 37.84473 9.56e+15 50.91341 53.23562 51.75305
3 -930.8227 38.93465* 7.76e+12* 50.54114* 53.91889 51.76243
4 -919.9629 42.35847 8.48e+12 51.86989 53.97046 51.91059
Table A6. shows the test results of the selected parameters of TVP-VAR model.
Parameter Mean Stdev 95%L 95%U Geweke Inef.
sb1 0.0228 0.0026 0.0184 0.0286 0.753 2.14
sb2 0.0229 0.0027 0.0184 0.0288 0.414 2.97
sa1 0.1082 0.0648 0.0442 0.2911 0.165 49.17
sa2 0.1116 0.0626 0.0470 0.2833 0.440 25.03
sh1 1.0015 0.4084 0.1582 1.8642 0.410 83.42
sh2 0.2696 0.1666 0.0668 0.6841 0.798 66.96

References

  1. Fan, S. Agriculture, Food and Nutrition Security Under Covid-19: Lessons from China[J]. Journal, 2020, 10.
  2. Zhang Youwang, Xu Yuanyan, Liu Jiaojiao. Study on Price Risk Identification and Mitigation Strategies of Small-Scale Agricultural Products: A Case Study of Scallion, Ginger, and Garlic[J]. Price: Theory & Practice, 2022, 10: 5.
  3. Pan D, Yang J, Zhou G, et al. The influence of COVID-19 on agricultural economy and emergency mitigation measures in China: A text mining analysis[J]. PLoS ONE, 2020, 15(10): e0241167.
  4. Xu Pan. Study on Prediction of Pork Price Using Sentiment Analysis and Prophet-BP Model[D]. Anhui Agricultural University, 2020. [CrossRef]
  5. Yang Y, Zhang Y, Zhang X, et al. Spatial evolution patterns of public panic on Chinese social networks amidst the COVID-19 pandemic[J]. International journal of disaster risk reduction: IJDRR, 2022, 70: 102762.
  6. Cabezas Javier et al. Detecting Emotional Evolution on Twitter during the COVID-19 Pandemic Using Text Analysis[J]. International journal of environmental research and public health, 2021, 18(13): 6981-6981.
  7. Chen F, Huang J. Herd Instinct of the Transmission of Network Public Opinion Based on Evolutionary Game[J]. Journal of Intelligence, 2013.
  8. Raviraja, S. Reference Groups and Opinion Leadership Effect on Purchase Decision of Consumer Durables[J]. Bioscience Biotechnology Research Communications, 2020.
  9. Meng Jun, Lü Xingchen. Study on the Characteristics and Patterns of Price Fluctuations of Small Agricultural Products in China: An Analysis Based on ARCH Models[J]. Price: Theory & Practice, 2021, 11: 87-90.
  10. Gao Xiaodan. Analysis of the Patterns and Causes of Price Fluctuations in China's Small Agricultural Products[J]. Agricultural Economics, 2017, No.356(01): 133-135.
  11. Liu H, Li N. Empirical Analysis of the Reasons for Price Fluctuations of Small Variety Agricultural Products: Based on the Investigation of Mung Bean Farmers in Baicheng City, Jilin Province[J]. Agricultural Technology Economy, 2014, (02): 76-84. 2014.02.008.
  12. Liu, Z. Simulation Study on the Price Fluctuation Mechanism and Influence Factors of Small-scale Agricultural Products: A Case Study of Garlic[J]. Price: Theory & Practice, 2018, (01): 94-97. 2018.01.024.
  13. Zhe, L. Simulation Analysis on the Price Fluctuation Mechanism and Influence Factors of Small-scale Agricultural Products By the Case Study of Garlic[J]. Price: Theory & Practice, 2018.
  14. Yao, S. Study on the Characteristics and Influencing Factors of Price Fluctuations of Small Variety Agricultural Products: A Case Study of Garlic-like Storage-resistant Agricultural Products[J]. Price: Theory & Practice, 2021, (08): 100-103+186. 2021.08.25.
  15. Lian H B. Research on the Price Fluctuation Characteristics and Correlation of Scallion, Ginger and Garlic[J]. Hebei Agricultural University, 2019.
  16. Zhang S Z, Liu L. Study on Price Fluctuation of Small-scale Agricultural Products and the Impact of Money Supply: Based on the Mathematical and Empirical Research of Cobweb Model and VAR Model[J]. Financial Theory & Practice, 2012, (11): 5.
  17. Balcilar M, Sertoglu K, Agan B. The COVID-19 effects on agricultural commodity markets[J]. Agrekon, 2022, 61.
  18. Liu Y, Liu S, Ye D, et al. Dynamic impact of negative public sentiment on agricultural product prices during COVID-19[J]. Journal of Retailing and Consumer Services, 2022, 64.
  19. Zheng Y, Ma J. Research on the Dynamic Impact of Avian Influenza Epidemic Changes on Livestock and Poultry Product Prices: Based on Time-varying Parameter Vector Autoregressive (TVP-VAR) Model[J]. Agricultural Modernization Research, 2018, 39(5): 10.
  20. Pasupulety U, Anees A A, Anmol S, et al. Predicting Stock Prices using Ensemble Learning and Sentiment Analysis[C]// 2019 IEEE Second International Conference on Artificial Intelligence and Knowledge Engineering (AIKE). IEEE, 2019.
  21. Li B, Chan K, Ou C, et al. Discovering public sentiment in social media for predicting stock movement of publicly listed companies[J]. Information Systems, 2017, 69: 81-92.
  22. Gurdgiev C, O'Loughlin D, Chlebowski B. Behavioral Basis Of Cryptocurrencies Markets: Examining Effects Of Public Sentiment, Fear, And Uncertainty On Price Formation[J]. Journal of Financial Transformation, 2019, 49.
  23. Jia C, Xia C P, Qin Q X. Impact of COVID-19 Pandemic on China's Pork Prices[J]. Journal of China Agricultural University, 2021, 26(7): 13.
  24. Yang M B. E-commerce Product Price Prediction Model Based on Network Public Opinion Analysis[J]. Cooperative Economy and Technology, 2018(11): 3.
  25. Yang S, Yang Y T, Wen Z Y, et al. Extraction-based Single Document Summary Method Based on Semantic Space[J]. Journal of Xiamen University: Natural Science, 2019, 58(2): 6.
  26. Kumar G K, Rani D M. Paragraph summarization based on word frequency using NLP techniques[C]// PROCEEDINGS OF THE 14TH ASIA-PACIFIC PHYSICS CONFERENCE. 2021.
  27. Mourisse D, Lefever E, Verbiest N, et al. SBFC: An Efficient Feature Frequency-Based Approach to Tackle Cross-Lingual Word Sense Disambiguation[J]. Springer, 2012.
  28. Wang L, Xu J M. Application of Distributed K-means Clustering in Weibo Hot Topic Discovery[J]. Computer Simulation, 2020, 37(08): 121-125.
  29. Zhang J R. Research on Association Rule Mining Based on Multi-topic Classification and Named Entity Recognition[D]. Chongqing University of Technology, 2022.000169.
  30. Yi J W. News Text Topic Classification Based on BERT Pre-trained Model and VAE Feature Reconstruction[D]. Lanzhou University, 2021.001547.[30] Yi J W. News Text Topic Classification Based on BERT Pre-trained Model and VAE Feature Reconstruction[D]. Lanzhou University, 2021.001547.
  31. Sun L C, Huang R C. News Text Classification Model with LSTM and Attention Mechanism[J]. Sensors & Microsystems, 2022, 41(09): 38-41.
  32. Deng L, Lujuan et al. News Text Classification Method Based on the GRU_CNN Model[J]. International Transactions on Electrical Energy Systems, 2022.
  33. Varsha Mittal, Duraprasad Gangodkar, Bhaskar Pant. Deep Graph-Long Short-Term Memory: A Deep Learning Based Approach for Text Classification[J]. Wireless Personal Communications, 2021: 1-15.
  34. Dybowski T P, Admmer P. The economic effects of U.S. presidential tax communication: Evidence from a correlated topic model[J]. European Journal of Political Economy, 2018: S0176268017302355.
  35. Rao Y, Lei J, Liu W, et al. Building emotional dictionary for sentiment analysis of online news[J]. World Wide Web, 2014, 17(4): 723-742.
  36. Wei G, Pei G J, Zhang Y, Zhang Q. Chinese Sentiment Analysis of Online Public Opinion Texts Based on Information Enhancement[J]. Communications Technology, 2022, 55(07): 859-864.
  37. Deng H, Ergu D, Liu F, et al. Text sentiment analysis of fusion model based on attention mechanism[J]. Procedia Computer Science, 2022, 199: 741-748.
  38. Zhou N, Zhong N, Jin G Y, Liu B. Chinese Text Sentiment Analysis based on Dual-channel Attention Network with Mixed Word Embeddings[J/OL]. Data Analysis and Knowledge Discovery: 1-14 [2022-08-29].
  39. Liu J, Gu F Y. Sentiment Analysis of Unbalanced Texts in Online Public Opinion Based on BERT and BiLSTM Hybrid Method[J]. Journal of Intelligence, 2022, 41(04): 104-110.
  40. Song G Y. Research on Multi-task Text Analysis Based on BERT[D]. Shandong University, 2021.003951.
  41. Yucel Ahmet et al. A novel text analytic methodology for classification of product and service reviews[J]. Journal of Business Research, 2022, 151: 287-297.ss).
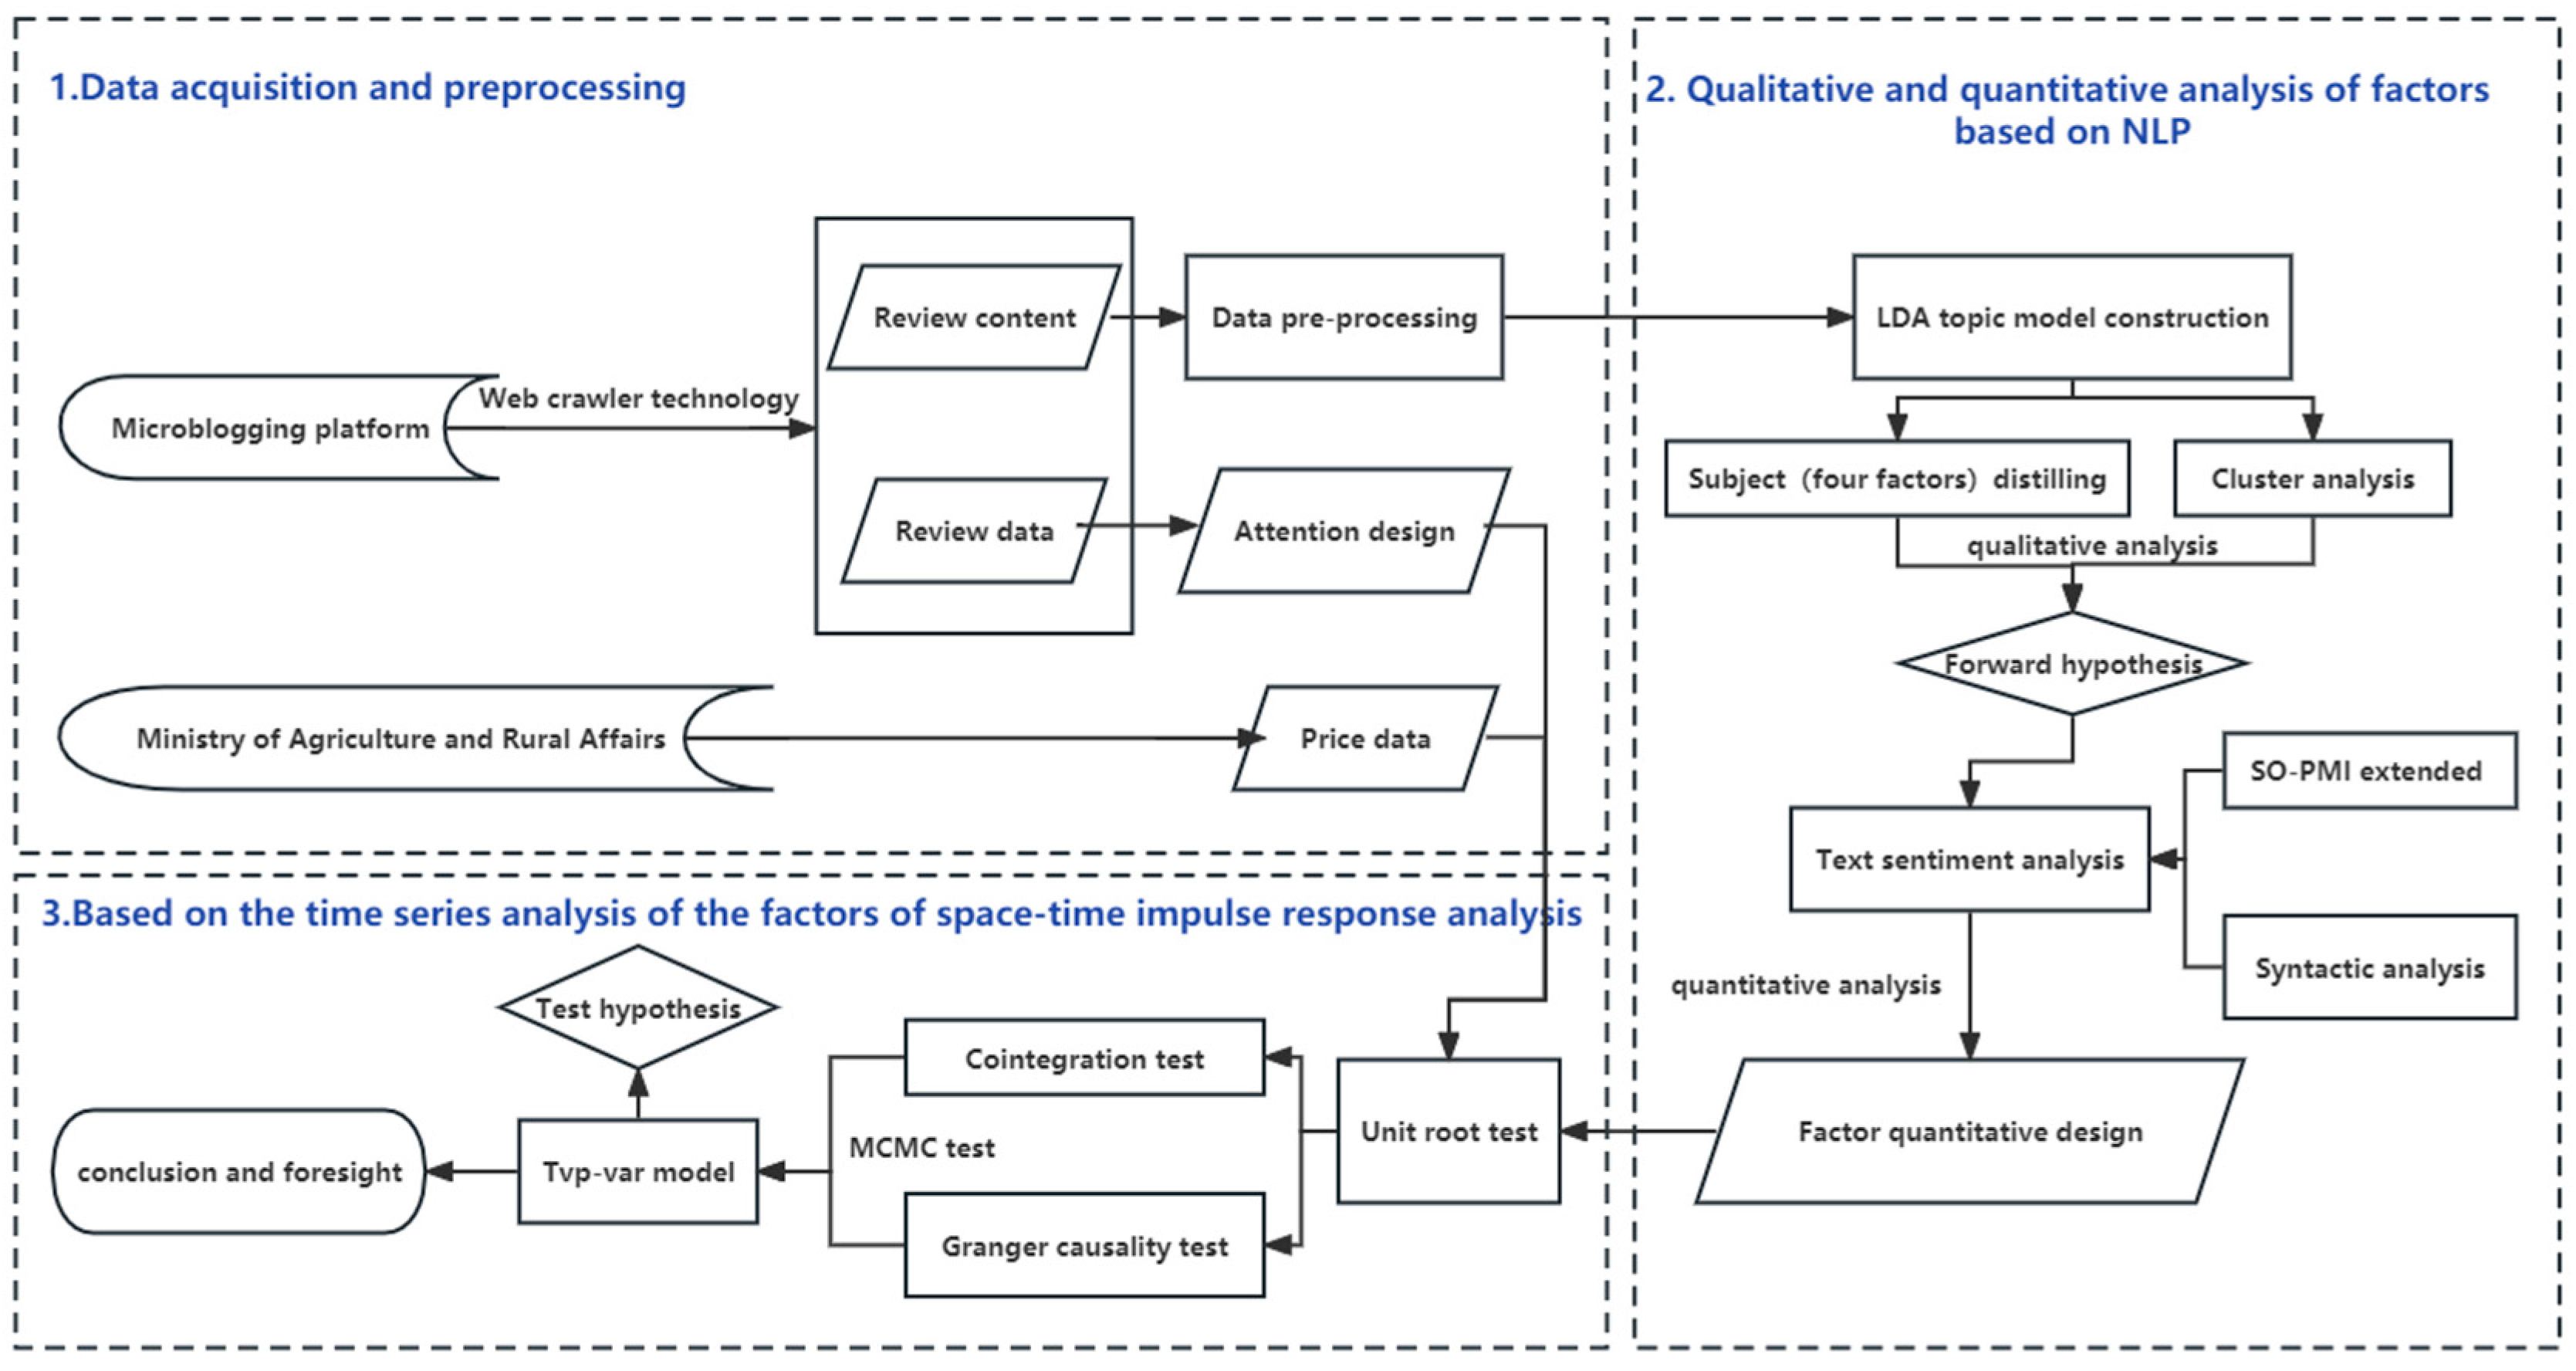
Figure 1. Thinking flow chart.
Preprints 85875 g001
Figure 2. Timing Chart of Scallion Price.
Preprints 85875 g002
Figure 3. Word frequency statistics of public opinion information data.
Preprints 85875 g003
Figure 7. Price and index matching distribution visualization.
Preprints 85875 g007
Figure 8. The graphical representation of MCMC algorithm estimation results.
Preprints 85875 g008
Figure 9. A posteriori estimation of stochastic volatility for structural shocks.
Preprints 85875 g009
Figure 10. Analysis of time-varying characteristics of equal pulse response with different lead times.
Preprints 85875 g010
Figure 11. Time-varying characteristics of impulse response at different time points (adjacent).
Preprints 85875 g011
Figure 12. Time-varying characteristics of impulse response at different time points (feature points).
Preprints 85875 g012
Disclaimer/Publisher’s Note: The statements, opinions and data contained in all publications are solely those of the individual author(s) and contributor(s) and not of MDPI and/or the editor(s). MDPI and/or the editor(s) disclaim responsibility for any injury to people or property resulting from any ideas, methods, instructions or products referred to in the content.
Copyright: This open access article is published under a Creative Commons CC BY 4.0 license, which permit the free download, distribution, and reuse, provided that the author and preprint are cited in any reuse.
Prerpints.org logo

Preprints.org is a free preprint server supported by MDPI in Basel, Switzerland.

Subscribe

© 2024 MDPI (Basel, Switzerland) unless otherwise stated