1. Introduction
The Department of Caquetá, located in the northwestern Colombian Amazon, has a cattle population of 2,175,065 head of cattle distributed across 20,512 cattle farms [
1]. This livestock system relies on 3,761,400 ha of pastureland [
2], These pastures are predominantly composed of naturalized grasses such as
Paspalum sp. and
Homolepis aturensis, as well as introduced grasses from the
Urochloa genus. In the region, deforestation and conversion of Amazon forests to pasture and cropland, leading to adverse impacts on soil quality. Excessive livestock stocking has transformed grazing areas into severely degraded pastures, primarily due to suboptimal grassland management practices [
3].
In the humid tropical region, an important part of cattle farming relies on grazing activities, which occur on soils characterized by acidic pH levels [
4]. When pastures serve as a primary source of cattle feed, nutrient replenishment in the soil typically occurs naturally through leaf litter produced by the pasture and the excrement of grazing animals. However, high grazing intensities can diminish litter accumulation, leading to nutrient recycling primarily through animal excreta, often in a suboptimal manner [
5]. Like all other crops, grasses require nutrients and minerals for their establishment, maintenance, and production [
6].
Pasture fertilization plays a fundamental role in cattle farming since grass is considered the most cost-effective feed source for meat and milk production [
7]. It has been suggested as a viable option to enhance pasture productivity and quality, recognizing that productivity hinges on water availability and the presence of essential nutrients in the soil [
8].
In this context, if sustainability and environmental impact aspects of cattle production are taken into account, organic fertilization could be considered as a possible strategy [
9]. Organic fertilizers can be either naturally occurring, such as manure and slurry, or processed, including compost, blood meal, humic acid, natural enzyme-digested proteins, fish meal, and feather meal [
10]. These organic fertilizers supply a significant portion of essential plant nutrients and have a positive impact on crop productivity [
11], and also could influence the physical, chemical and biological properties of the soil [
12].
We hypothesized that the use of organic fertilizers from solid and liquids organic residues from farms, would improve Urochloa spp. the biomass production and the soil physical and biological properties induced by two main mechanisms: i) the increased nutrient input to the soil assimilated by the pastures at the end of the forage production cycle, and ii) the increase in soil macrofauna density and richness, coupled with soil compaction reduction. To test this hypothesis, we conducted a field study to assess the changes in Urochloa spp. biomass, soil macroinvertebrate diversity, and soil physical properties induced by the application of organic fertilizers on Urochloa spp. cover crops in the northwestern Colombian Amazon region.
2. Materials and Methods
2.1. Study area
The study was carried out at La Esperanza farm, in the Las Acacias rural settlement, located 10 km from the road connecting the Municipality of Morelia (1°29′09″ north and 75°43′28″ west, and altitude of 258 meters above sea level) and the Municipality of Valparaíso (1°11′36″ north and 75°42′23″west, and altitude of 211 meters above sea level) in the Department of Caquetá (northwestern Colombian Amazon). This site is in the Tropical Humid Forest (THF) ecosystem [
13]. This zone has an average annual rainfall of 3759 mm yr
-1, an average annual temperatures of 25.8°C and a relative humidity of 81%. These climatic conditions categorize it as climate type A: : Tropical (Tropical Rainforest - Equatorial - Af) according to Köppen climate classification for Colombia [
14].
2.2. Selection of Experimental Area
Three paddocks and three cover crops (Urochloa decumbens, Urochloa humidicola and Urochloa brizantha) with 5-year-old were individually selected within hill landscape under traditional pasture management. Within each of the cover crops, a designated area of 5,005 m2 were delimited for the implementation of a randomized complete block design with four fertilization treatments and three replications. Each sampling unit covered an area of 300 m2, with a one-meter gap between units to minimize edge effects.
2.3. Organic Fertilizers
Liquid and solid organic fertilizers derived from cattle urine and manure were used in this study. The solid fertilizer employed was Bokashi Biofertilizer (BB), which is produced by drying cattle manure, blending it with forest soil, rice husks, rice bran, charcoal, and moistening it with a mixture of yeast and molasses dissolved in water. It is then fermented aerobically for a period of 14 days [
15].
Three liquid fertilizers were used: (
i) Simple Biofertilizer (SB), a liquid fertilizer crafted from fresh bovine manure dissolved in water, combined with milk, molasses, and wood ash. It was fermented anaerobically in a plastic container for 20 days. (
ii) Biofertilizer for the fertilizer production, which is also a liquid fertilizer made from fresh bovine manure, dissolved in water mixed with milk, molasses, and wood ash, and subjected to anaerobic fermentation in a plastic container for 20 days [
15].
(ii) Super Lean Biofertilizer (SLB) is a liquid fertilizer prepared from fresh bovine manure dissolved in water, blended with milk, molasses, and enriched with mineral salts such as Sulfates (Zn, Mg, Mn, Cu and Fe), phosphate rock, sodium molybdate, borax, cobalt chloride, and wood ash. It was left to ferment for 50 days in plastic tanks under an anaerobic system [
15]. (iii) Cow Urine Biofertilizer (CUB) is a liquid fertilizer derived from cow urine and fermented anaerobically in 2-liter plastic bottles for five days. The bottle was uncorked every morning to release the gas produced during fermentation. The chemical characteristics of these organic fertilizers are detailed in
Table 1.
2.4. Treatments
Four treatments were established as follows: (T1) a control treatment (TGO), representing the farmer's traditional management with no fertilization applied. The other treatments involved combinations of organic fertilizers (both solid and liquid): (T2) Bokashi Biofertilizer + Simple Biofertilizer (BB+SB), (T3) Bokashi Biofertilizer + Cow Urine Biofertilizer (BB+CUB), and (T4) Bokashi Biofertilizer + Super Lean Biofertilizer (BB+SLB).
Prior to implementing the treatments, a uniform cut was carried out on the experimental units to simulate cattle grazing. The BB was initially applied to the soil in all three organic treatments, and after two months of the study, the fertilizer was again applied to the soil. Likewise, liquid fertilizers were sprayed onto the pasture at the beginning of the experiment and repeated every 30 days throughout the four-month study period.
2.5. Evaluation of Biomass Production, and the Soil Biological and Physical Properties
We assessed biomass production and the impact of different treatments on the biological and physical properties of the soil. To measure biomass production in each cover crop, at each treatment, random points were selected where a 50 x 50 cm plastic frame was placed. We used the botanal technique proposed by [
16]. At each point, forage was harvested from a 0.25 m
2 area, cut at a height of 10 cm, and weighed in the field. The harvested forage was the carefully packed into labeled paper bags and transported to the to the “Macagual” Research Center's laboratory for forage and animal nutrition evaluation. In the laboratory, subsamples of 200 g were taken and dried in an oven at 70°C until a constant weight was achieved.
For the biological soil characterization, we evaluated the soil macrofauna in two stages:
(i) at the Initial Moment (IM) of the research for each cover crop (
U. decumbens, U. humidicola and
U. brizantha), at the three different sites within each cover, and
(ii) at the Final Moment (FM) of the investigation for each cover crop among the sampling units per treatment. For ISO 23611-5 standard [
17] was followed for macrofauna collection. A soil monolith measuring 25 x 25 cm at a depth of 30 cm was extracted using a metal angle frame of the same dimensions as the monolith. Faunal samples collected were preserved in plastic bottles with 97% alcohol, and subsequently, a morphological description and taxonomic classification at the Order level were conducted for the individuals found.
For the physical properties of the soil, bulk density was determined using the known volume method [
18]. A 50 x 50 x 50 cm test pit was dug in each cover crop, at each sampling unit per each treatment, in three positions (North, West, and East) at depths of 0 - 10, 10 - 20, and 20 - 30 cm. Additionally, the soil penetration resistance was evaluated using a manual pressure penetrometer model 0601 (Eijkelkamp Agrisearch Equipment, Giesbeek, The Netherlands). Two sets of measurements were taken, the first at the beginning of the experiment (day 0, initial time) and the second at the end of the study (day 120, final time).
2.6. Statistical Analysis
Three datasets were organized: i) soil macrofauna; ii) forage biomass; and iii) physical properties. To assess the effects of treatment and time, as well as their interaction on forage biomass, a Linear Mixed-Effects (LME) model was fitted. The nested blocks within the forage species and the plots associated with treatment within the blocks were included as random effects. LME models were adjusted to analyze the fixed effects: treatment, time, soil depth and their interactions on physical properties, where the forage species, blocks, plots and sub-plots (i.e, soil depth within the treatment within each block) were included as random effects.
The normality and variances homogeneity were evaluated by exploratory analyses of model residuals. Macrofauna density was analyzed using Generalized Linear Mixed-Effects (GLME) models with a negative binomial distribution and Poisson for taxonomic categories (richness) [
19]. Mean separation was performed with a LSD Fisher test at a 5% significance level. The LME and GLME models were fitted with the nlme [
20] and lme4 packages [
21] in R v.4.0.3 language [
22] using the InfoStat v.2020 interface [
23], respectively.
For analyzing relationships between variables, we conducted a Pearson correlation analysis. Visualization of the Pearson correlation matrix was performed with the package circlize [
24] in R. Additionally, Principal Component Analysis (PCA) was performed, along with a Monte-Carlo test (999 permutations), to assess the significance (α = 0.05) of the relationships between all variables and fixed effects. The PCA and Monte-Carlo test were carried out using the ade4 [
25] and factoextra [
26] packages in R.
3. Results
3.1. Biomass Production
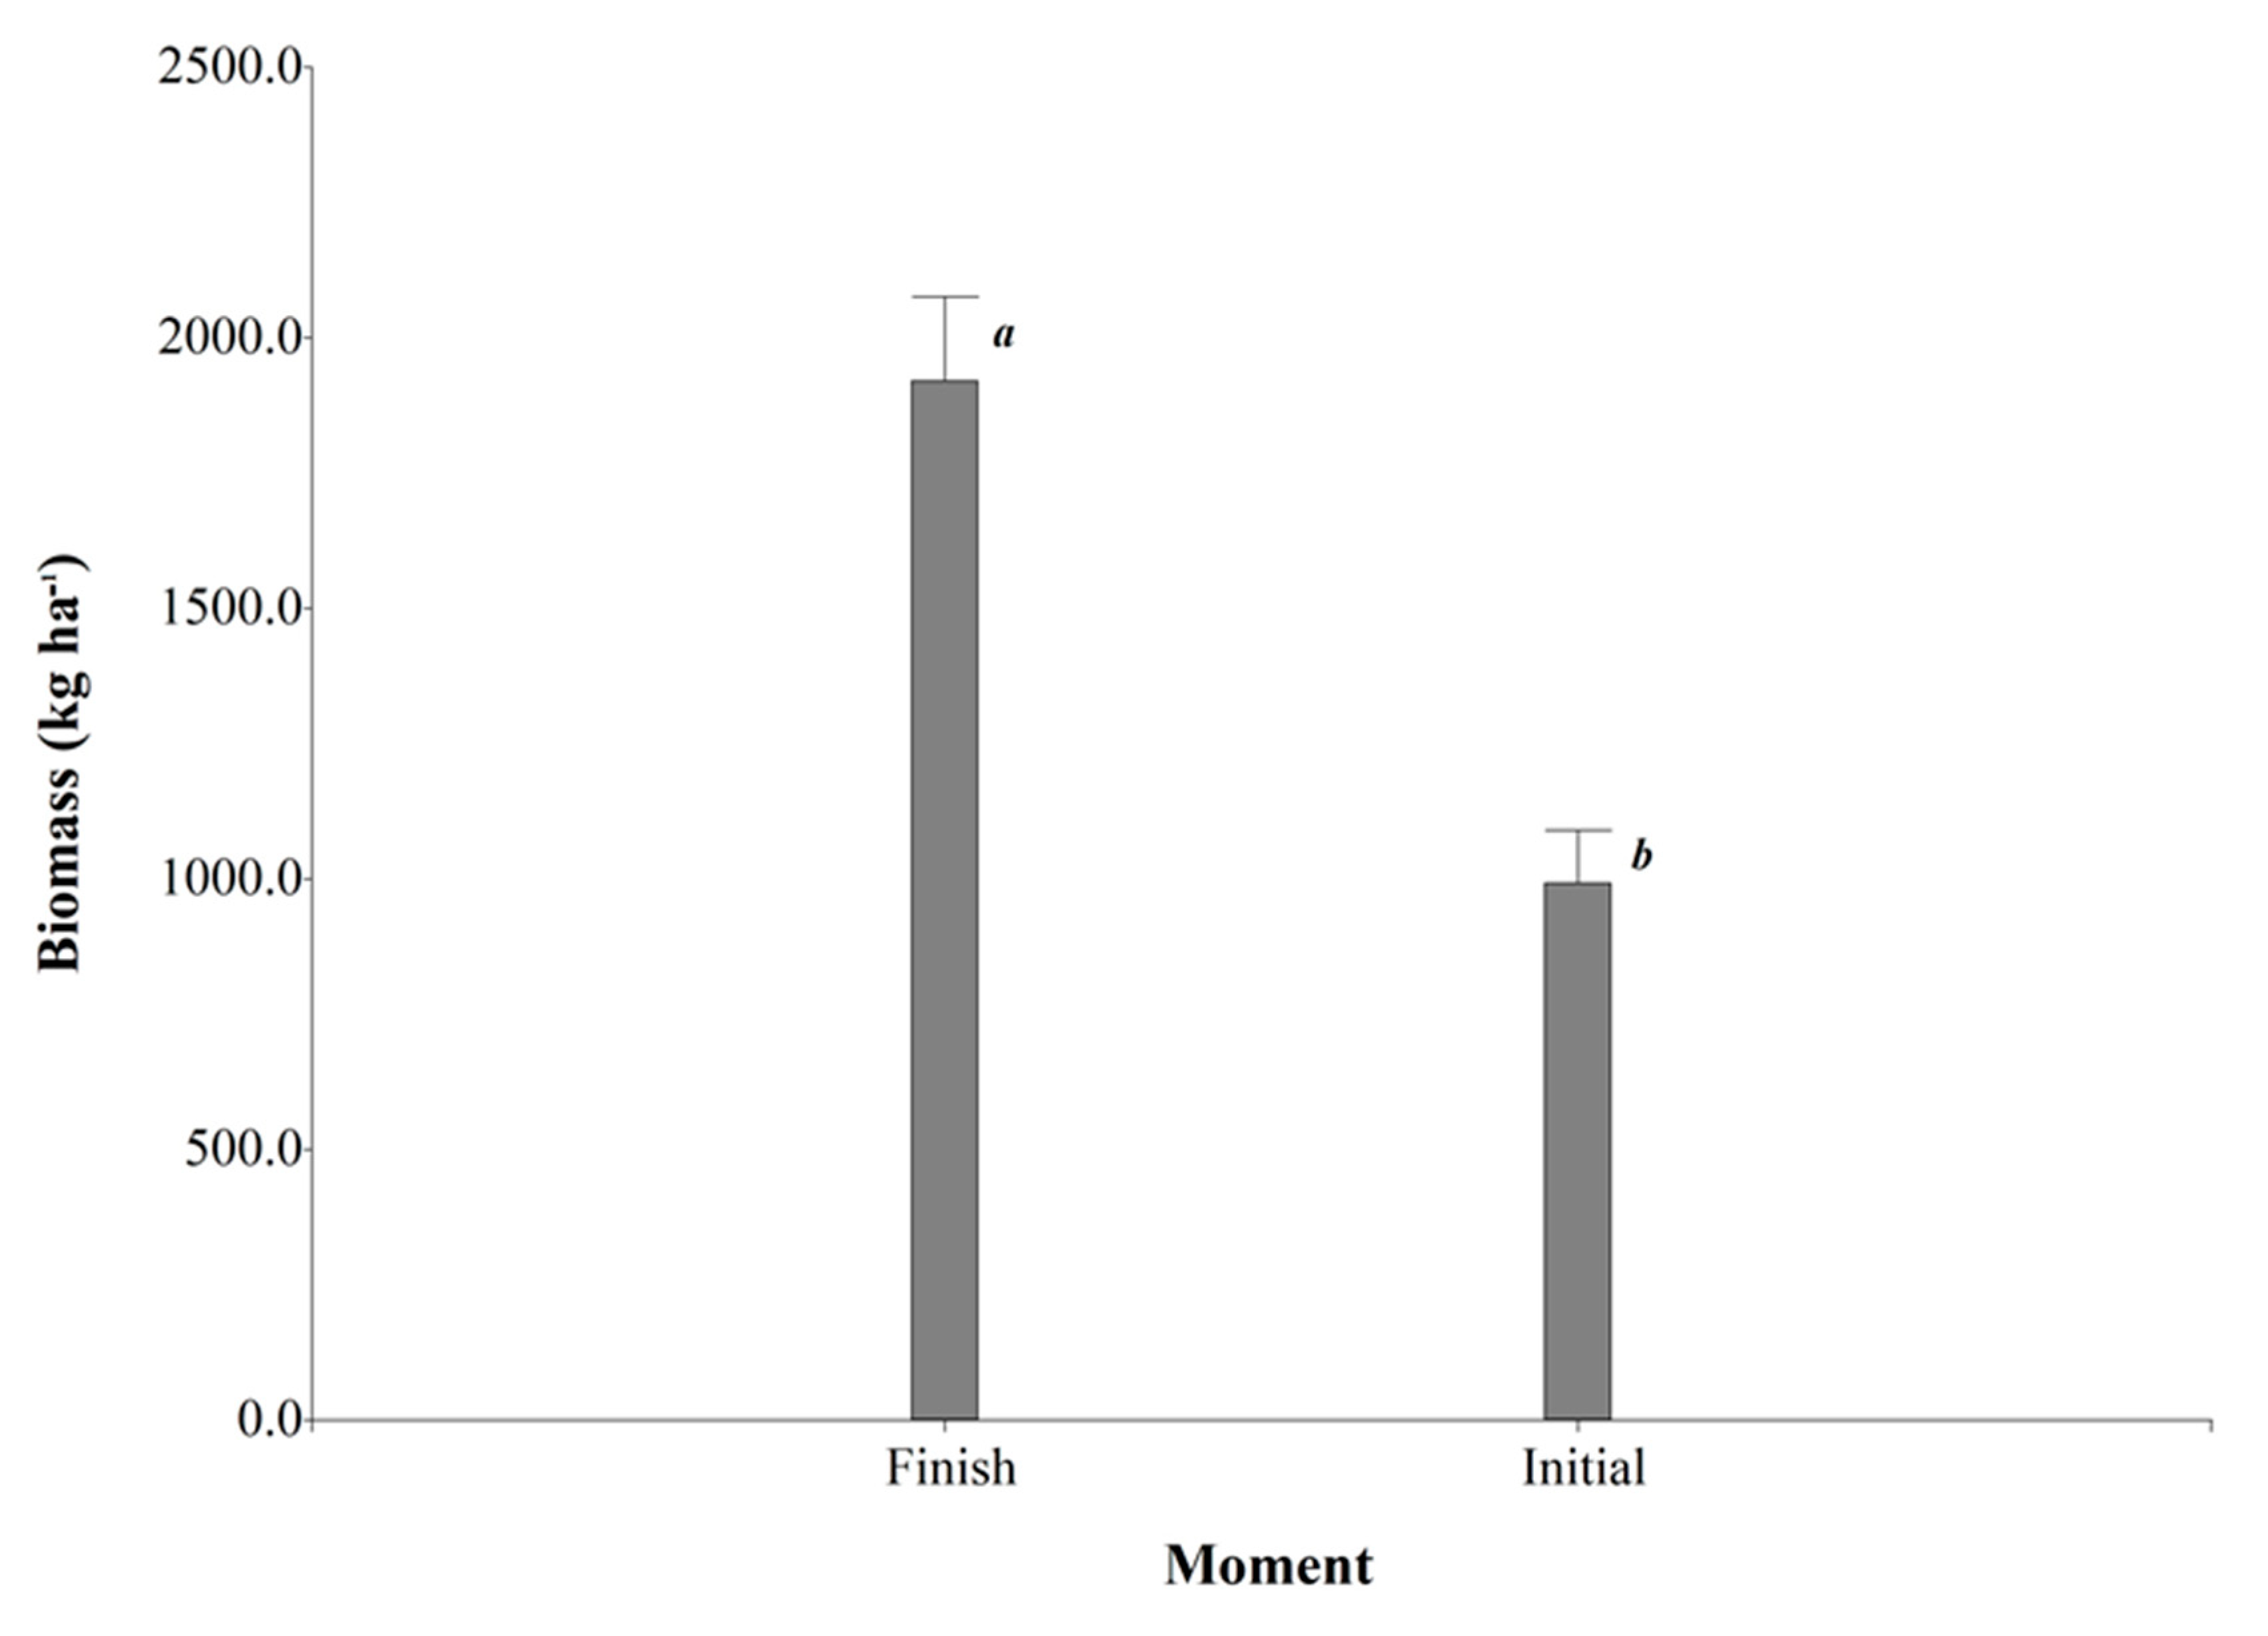
In the LME models, when comparing the moments of fertilization, significant differences in biomass production were observed (
p < 0.0001). It was found that the combined averages of the three
Urochloa species yielded 1,920.94±155.44 kg DM ha-1 of forage at the end of the experiment, compared to 992.19±97.66 kg DM ha-1 of forage at the beginning of the organic fertilizations (
Figure 1).
3.2. Soil Biological Changes
When comparing the two evaluation times, significant differences were observed for Coleoptera (
p=0.0187), which had the highest number of individuals at the initial moment (IM) of the experiment compared to the final moment (FM), with average counts of 5.33±2.42 and 2.37±2.42, respectively. Similarly, Isoptera showed statistical differences
(p=0.0158), with the highest number of individuals at the FM of the experiment that at the IM, averaging 2.67±1.27 and 0.15±1.27, respectively (
Table 2).
When performing statistical analysis for the different soil depths evaluated, the model showed significant differences (p<0.05) for four invertebrate taxa (Coleoptera, Haplotaxida, Hymenoptera, and Isoptera).
Hymenoptera (ants) had the highest number of individuals in the 0 - 10 cm depth, followed by 10 - 20 and 20 – 30 cm depths, with average counts of 312.67±159.93, 194.89±159.93 and 88.22±159.93 individuals, respectively. Haplotaxida (earthworm) was another invertebrate taxon that showed a high number of individuals in the 0 - 10 cm depth, followed by 10 - 20 and 20 – 30 depths, with average counts of 93.33±13.39, 9.33±6.75 and 0.44±0.44 individuals, respectively. Both of these invertebrate taxa are part of the soil engineer group (
Table 2).
The total density per m2 was 51,808 individuals, and a total of 12 invertebrate groups were identified, defining the richness in the study (
Table 3). The GLME models showed significant difference (
p<0.05) in the interaction between treatments and time for total density (
p=0.0300) and richness (
p=0.0300). It was observed that the combined averages for total density at T4 for FM was 539.26±180.65 individuals, whereas at IM, it was 169.48±180.65 individuals. Richness showed that the averages were higher at T3 and T4 for FM, with 1.30±0.16 and 1.26±0.16 invertebrate taxa, respectively, compared to IM, where it was 0.93±0.16 and 0.81±0.16 invertebrate taxa, respectively (
Table 3).
Statistical analysis also revealed significant differences (
p<0.05) for depth in total density (
p<0.0001) and richness (
p<0.0001). The total density was higher at the 0 - 10 cm depth than at the 10 - 20 and 20 - 30 cm depths, with average counts of 4.62±0.48, 2.97±0.48 and 1.52±0.48, respectively. Richness of invertebrate taxa was also higher at the 0 - 10 cm depth compared to the 10 - 20 and 20 - 30 cm depths, with average counts of 1.45±0.04, 1.10±0.04 and 0.90±0.04, respectively (
Table 3).
3.3. Soil Physical Properties Changes
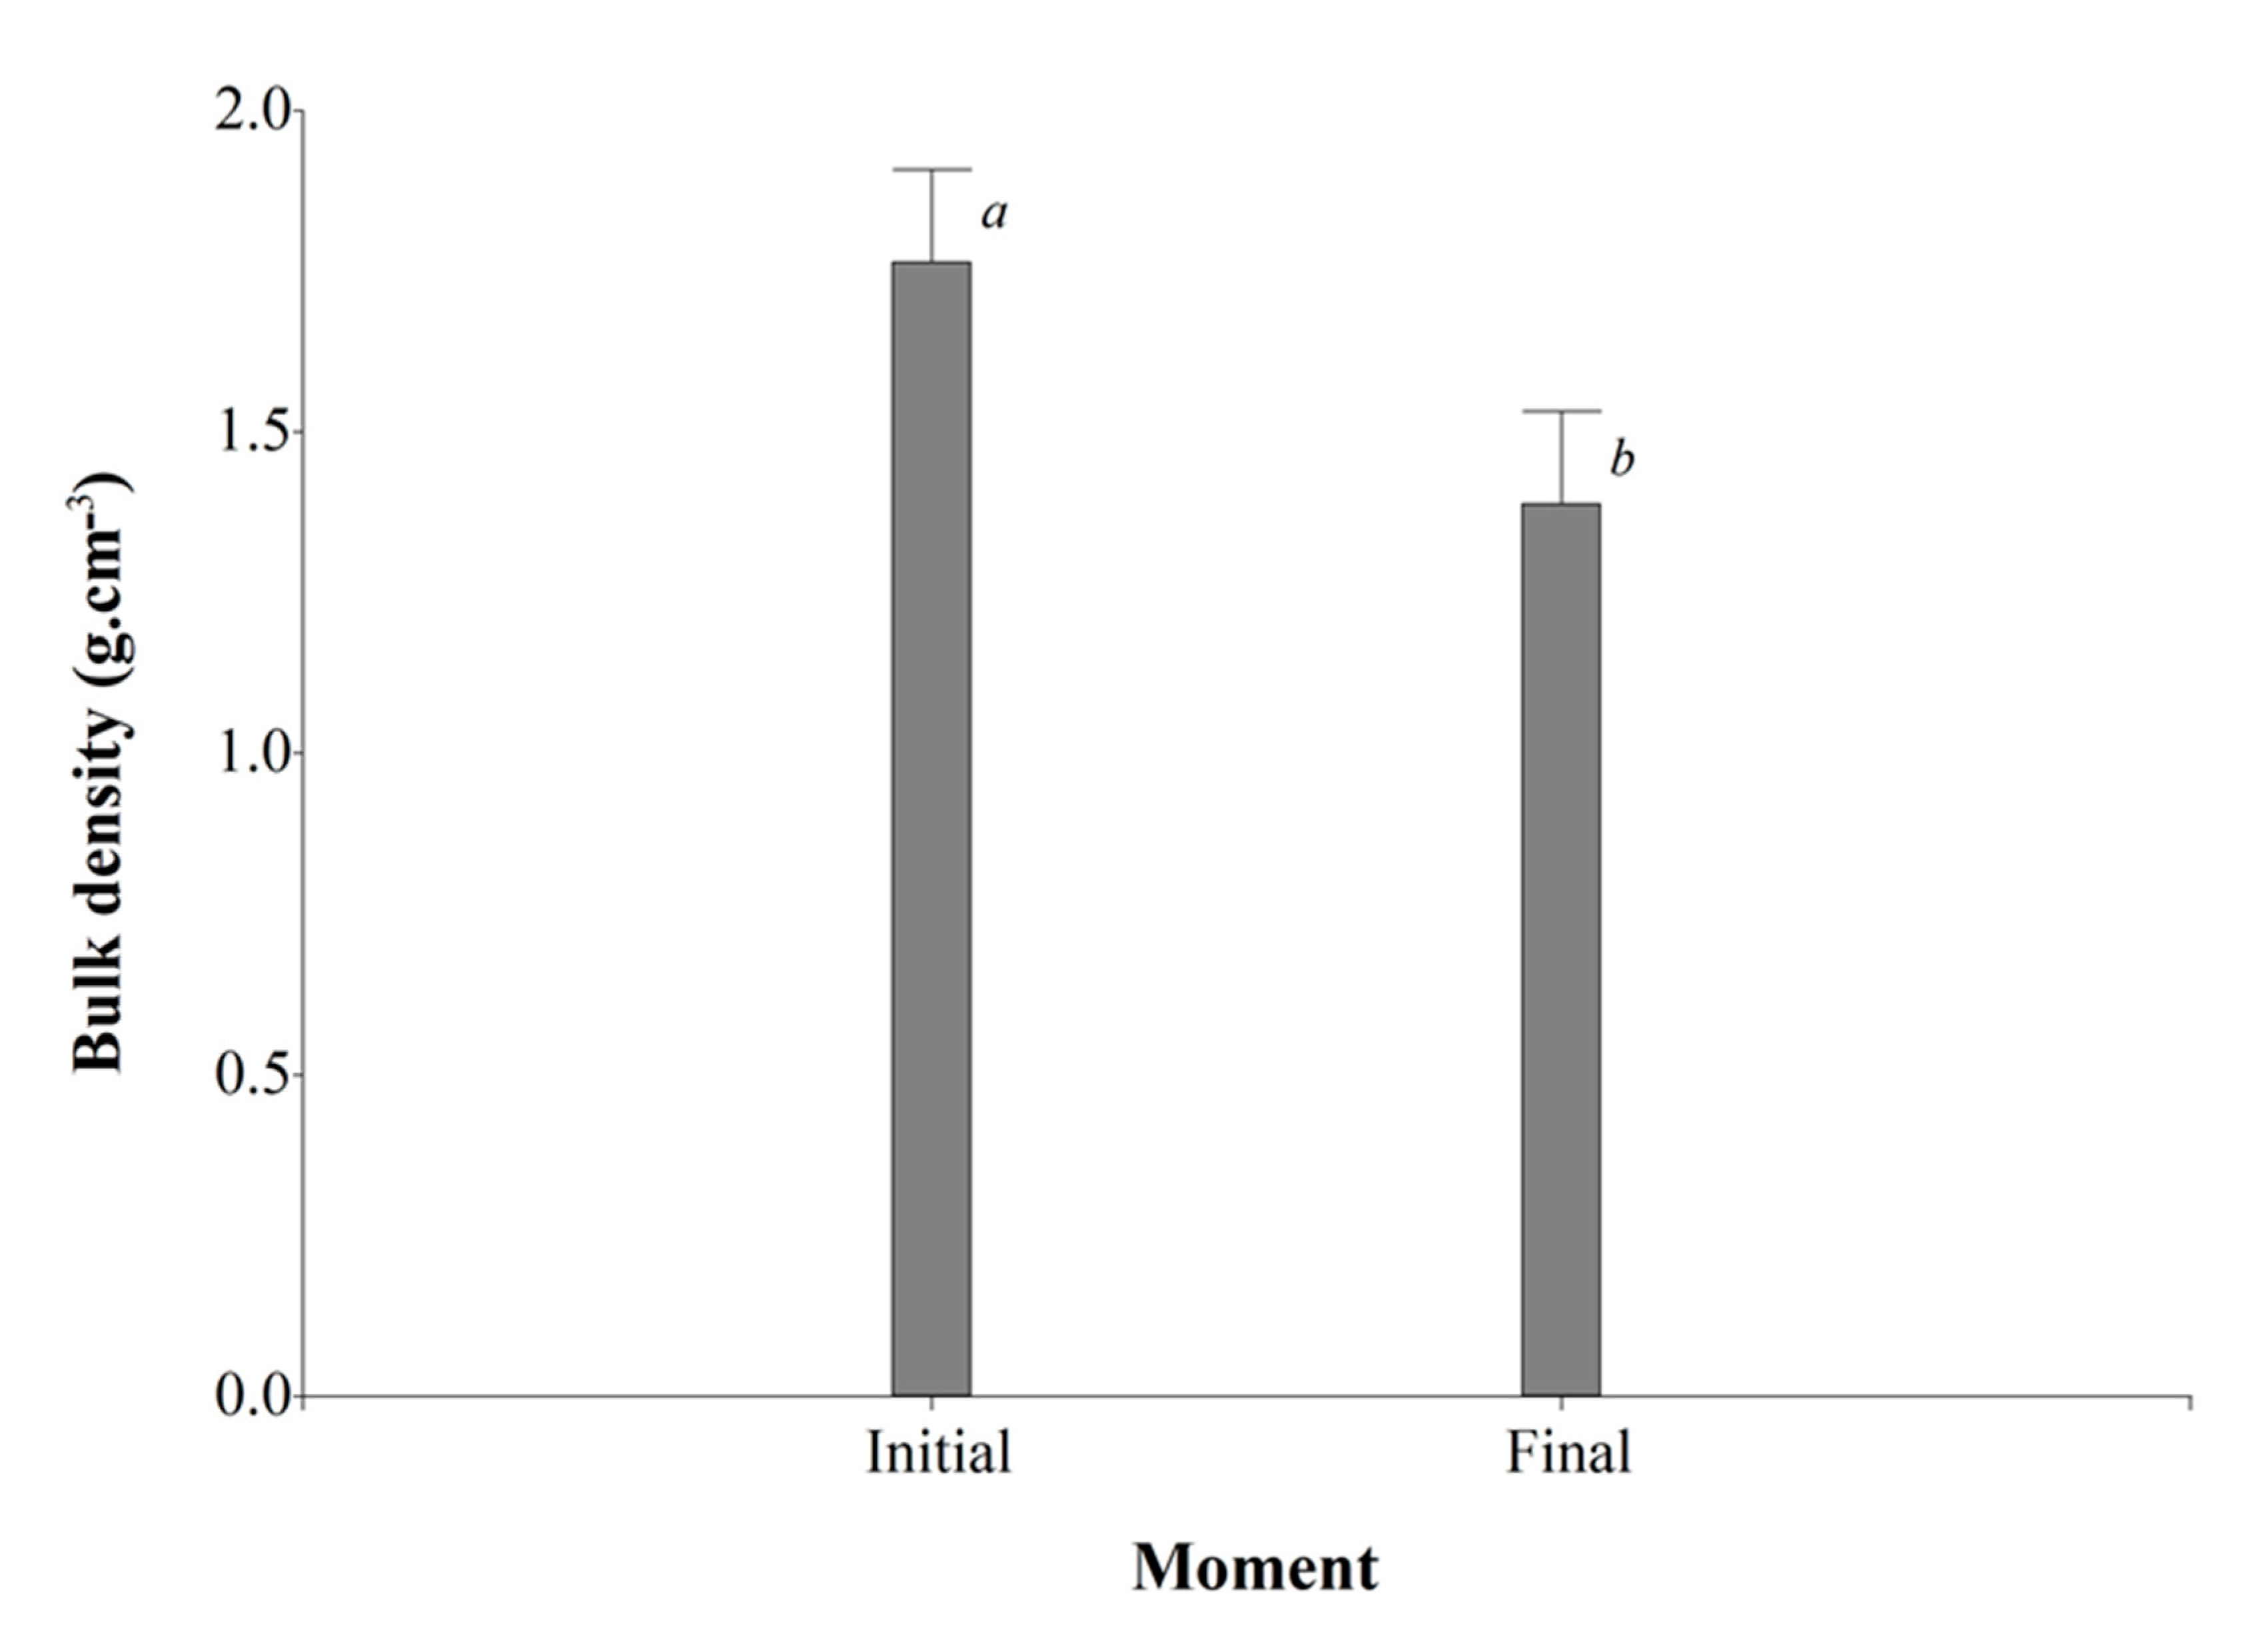
The LME models showed significant differences for depth, evaluation time (p<0.0001), and the interaction between treatment and depth (p=0.0187). Across the three depths assessed, the model indicated that bulk density was lower in the 0 - 10 cm depth compared to the 10 - 20 cm and 20 - 30 cm depths, with average values of 1.51±0.14 g cm-3, 1.59±0.14 g cm-3, and 1.62±0.14 g cm-3, respectively.
Additionally, it was observed that the average bulk density was lower at the FM compared to the IM with average values of 1.39±0.14 g cm
-3 and 1.76±0.14 g cm
-3, respectively (
Figure 2).
Table 4 shows the average bulk density (g cm-3) in the interaction between treatment and depth, highlighting that treatments T4 and T1 at a depth of 0 - 10 cm had the lowest results, with values of 1.51±0.14 g cm
-3 and 1.45±0.14 g cm
-3, respectively.
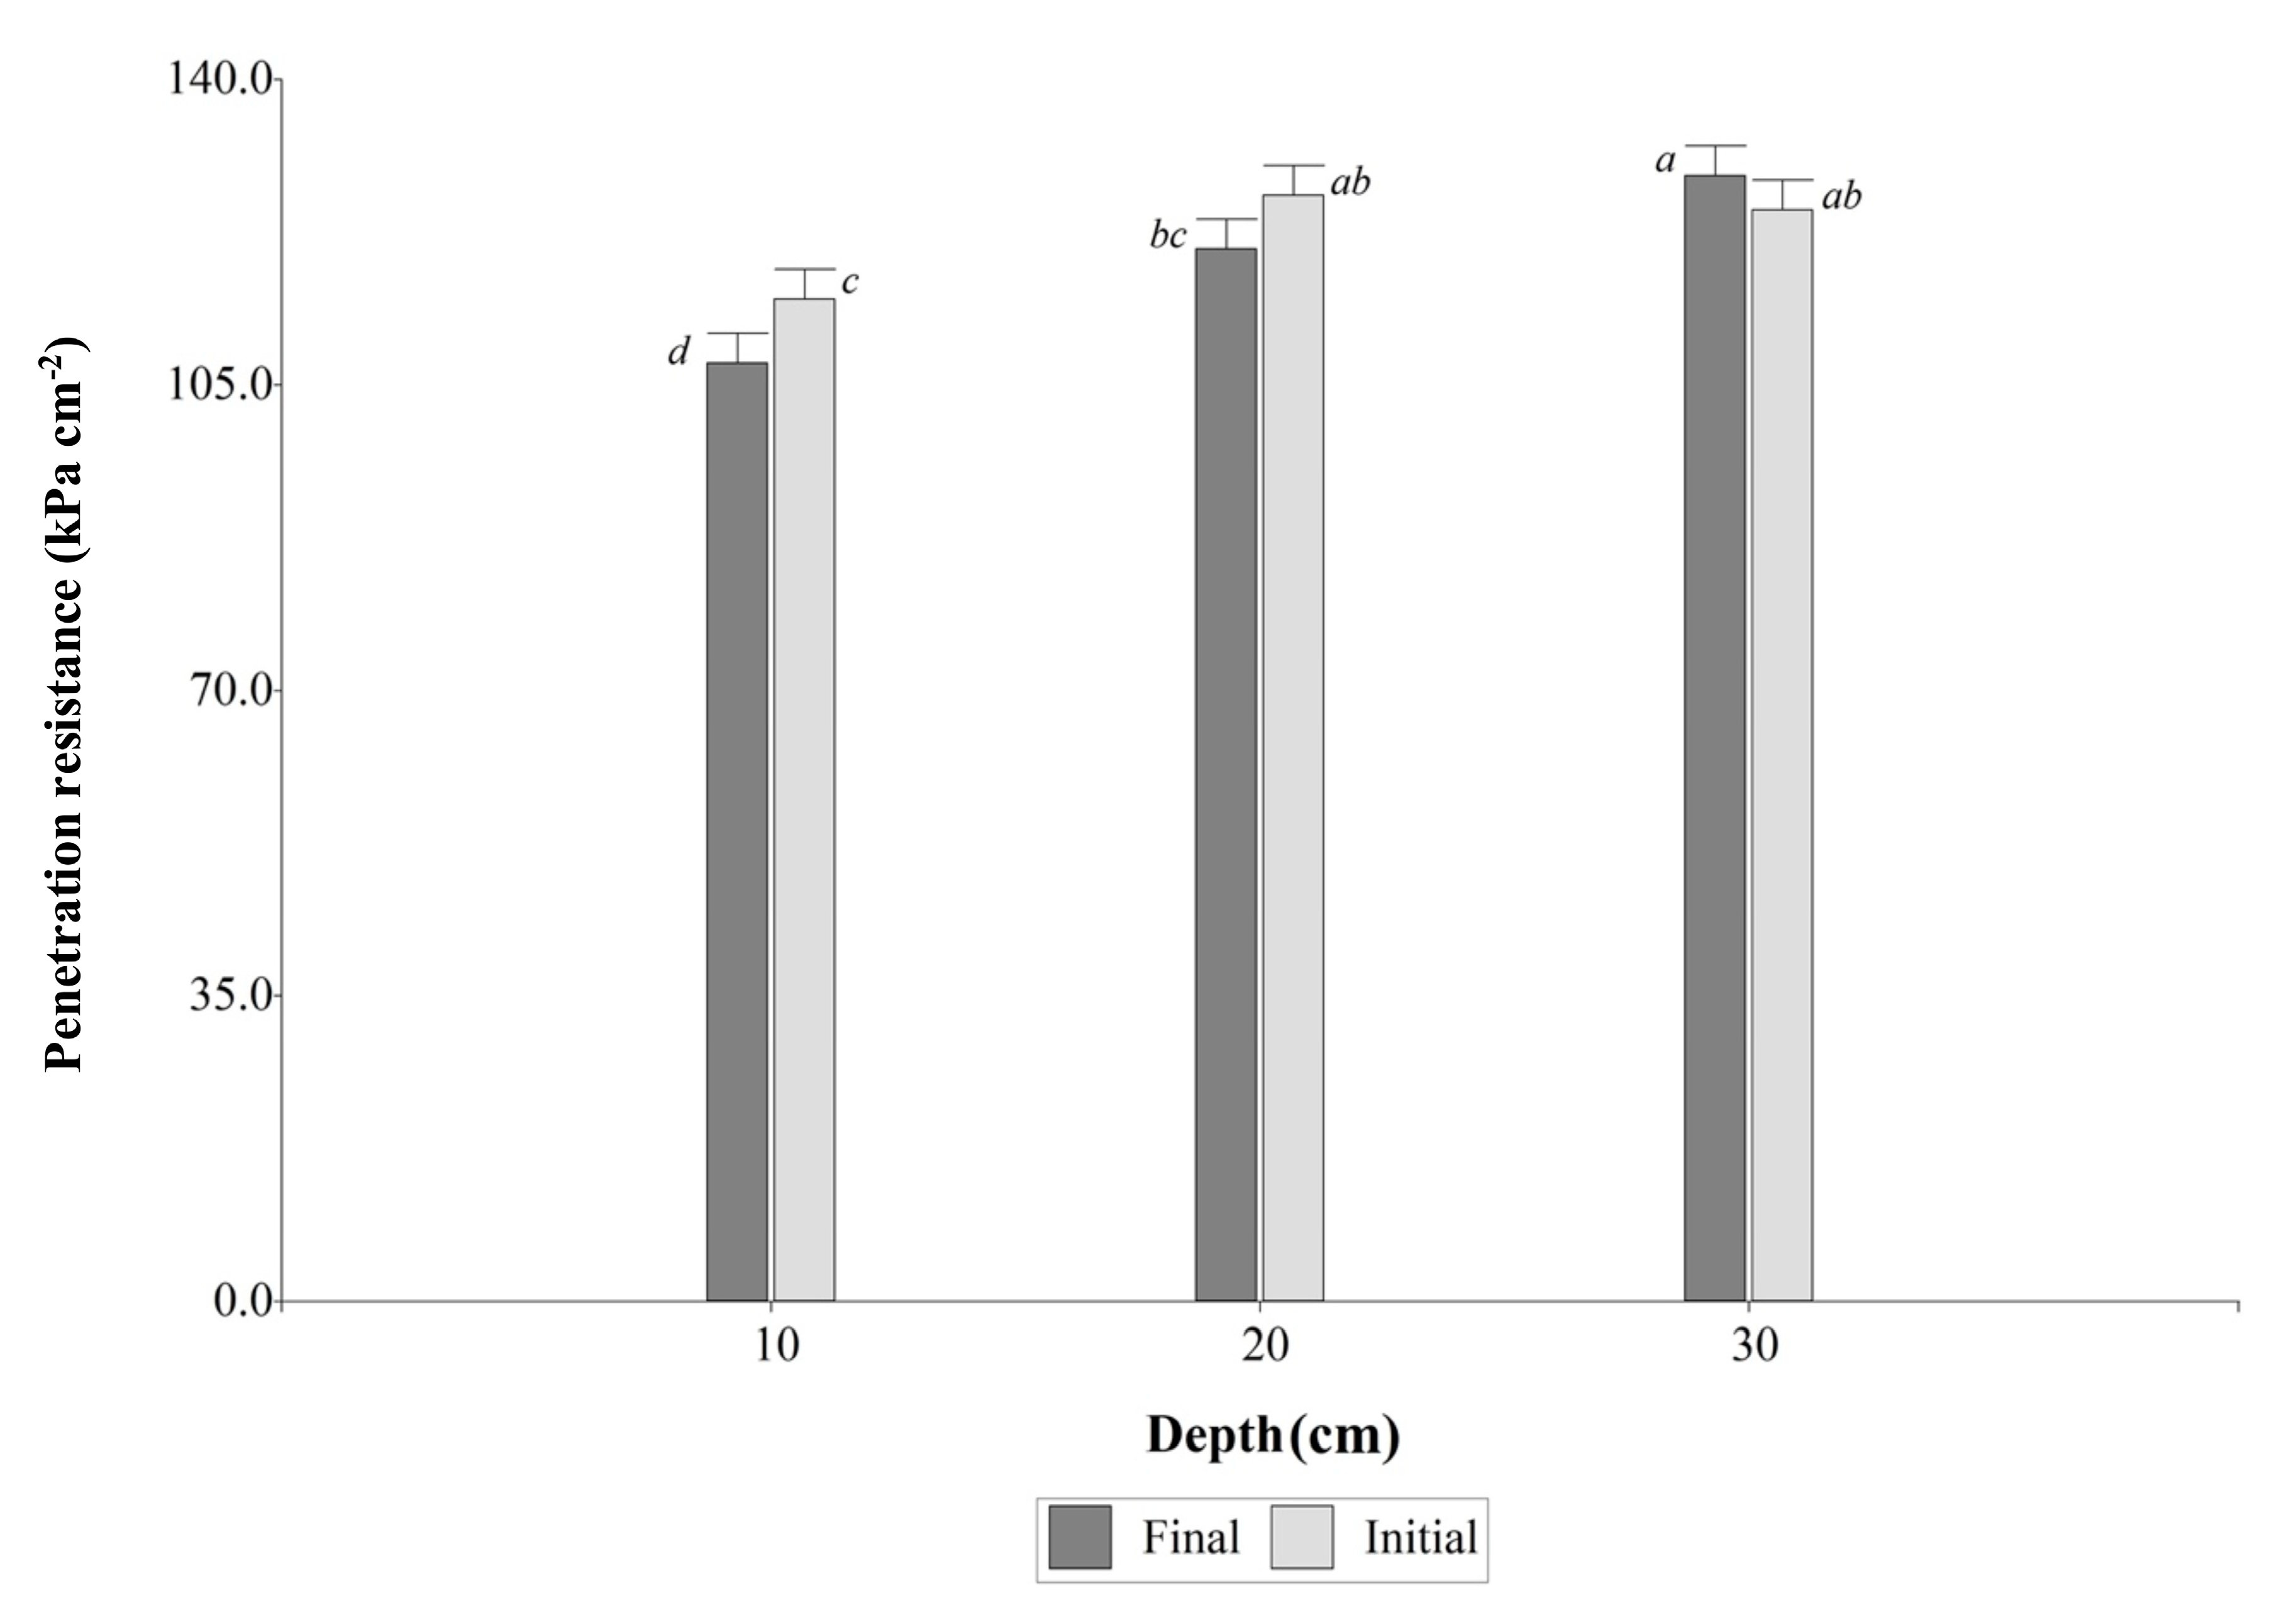
For the soil penetration resistance, the LME model revealed significant differences in depth (
p<0.0001), and also in the interaction between depth and evaluation time (
p=0.0466). The results indicated that at the 0 - 10 cm depth, soil penetration resistance was lower compared to the 10 - 20 cm and 20 - 30 cm depths, with average values of 111.17±2.95 kPa cm
-2, 123.63±2.95 kPa cm
-2 and 127.01±2.95 kPa cm
-2, respectively. Furthermore, the combined averages for penetration resistance at the 0 - 10 cm depth during the FM were lower, with an average of 107.50±3.85 kPa cm
-2, while at the IM, it exhibited an average of 114.84±3.85 kPa cm
-2 (
Figure 3).
3.4. Multivariate analysis of relationships between studied variables
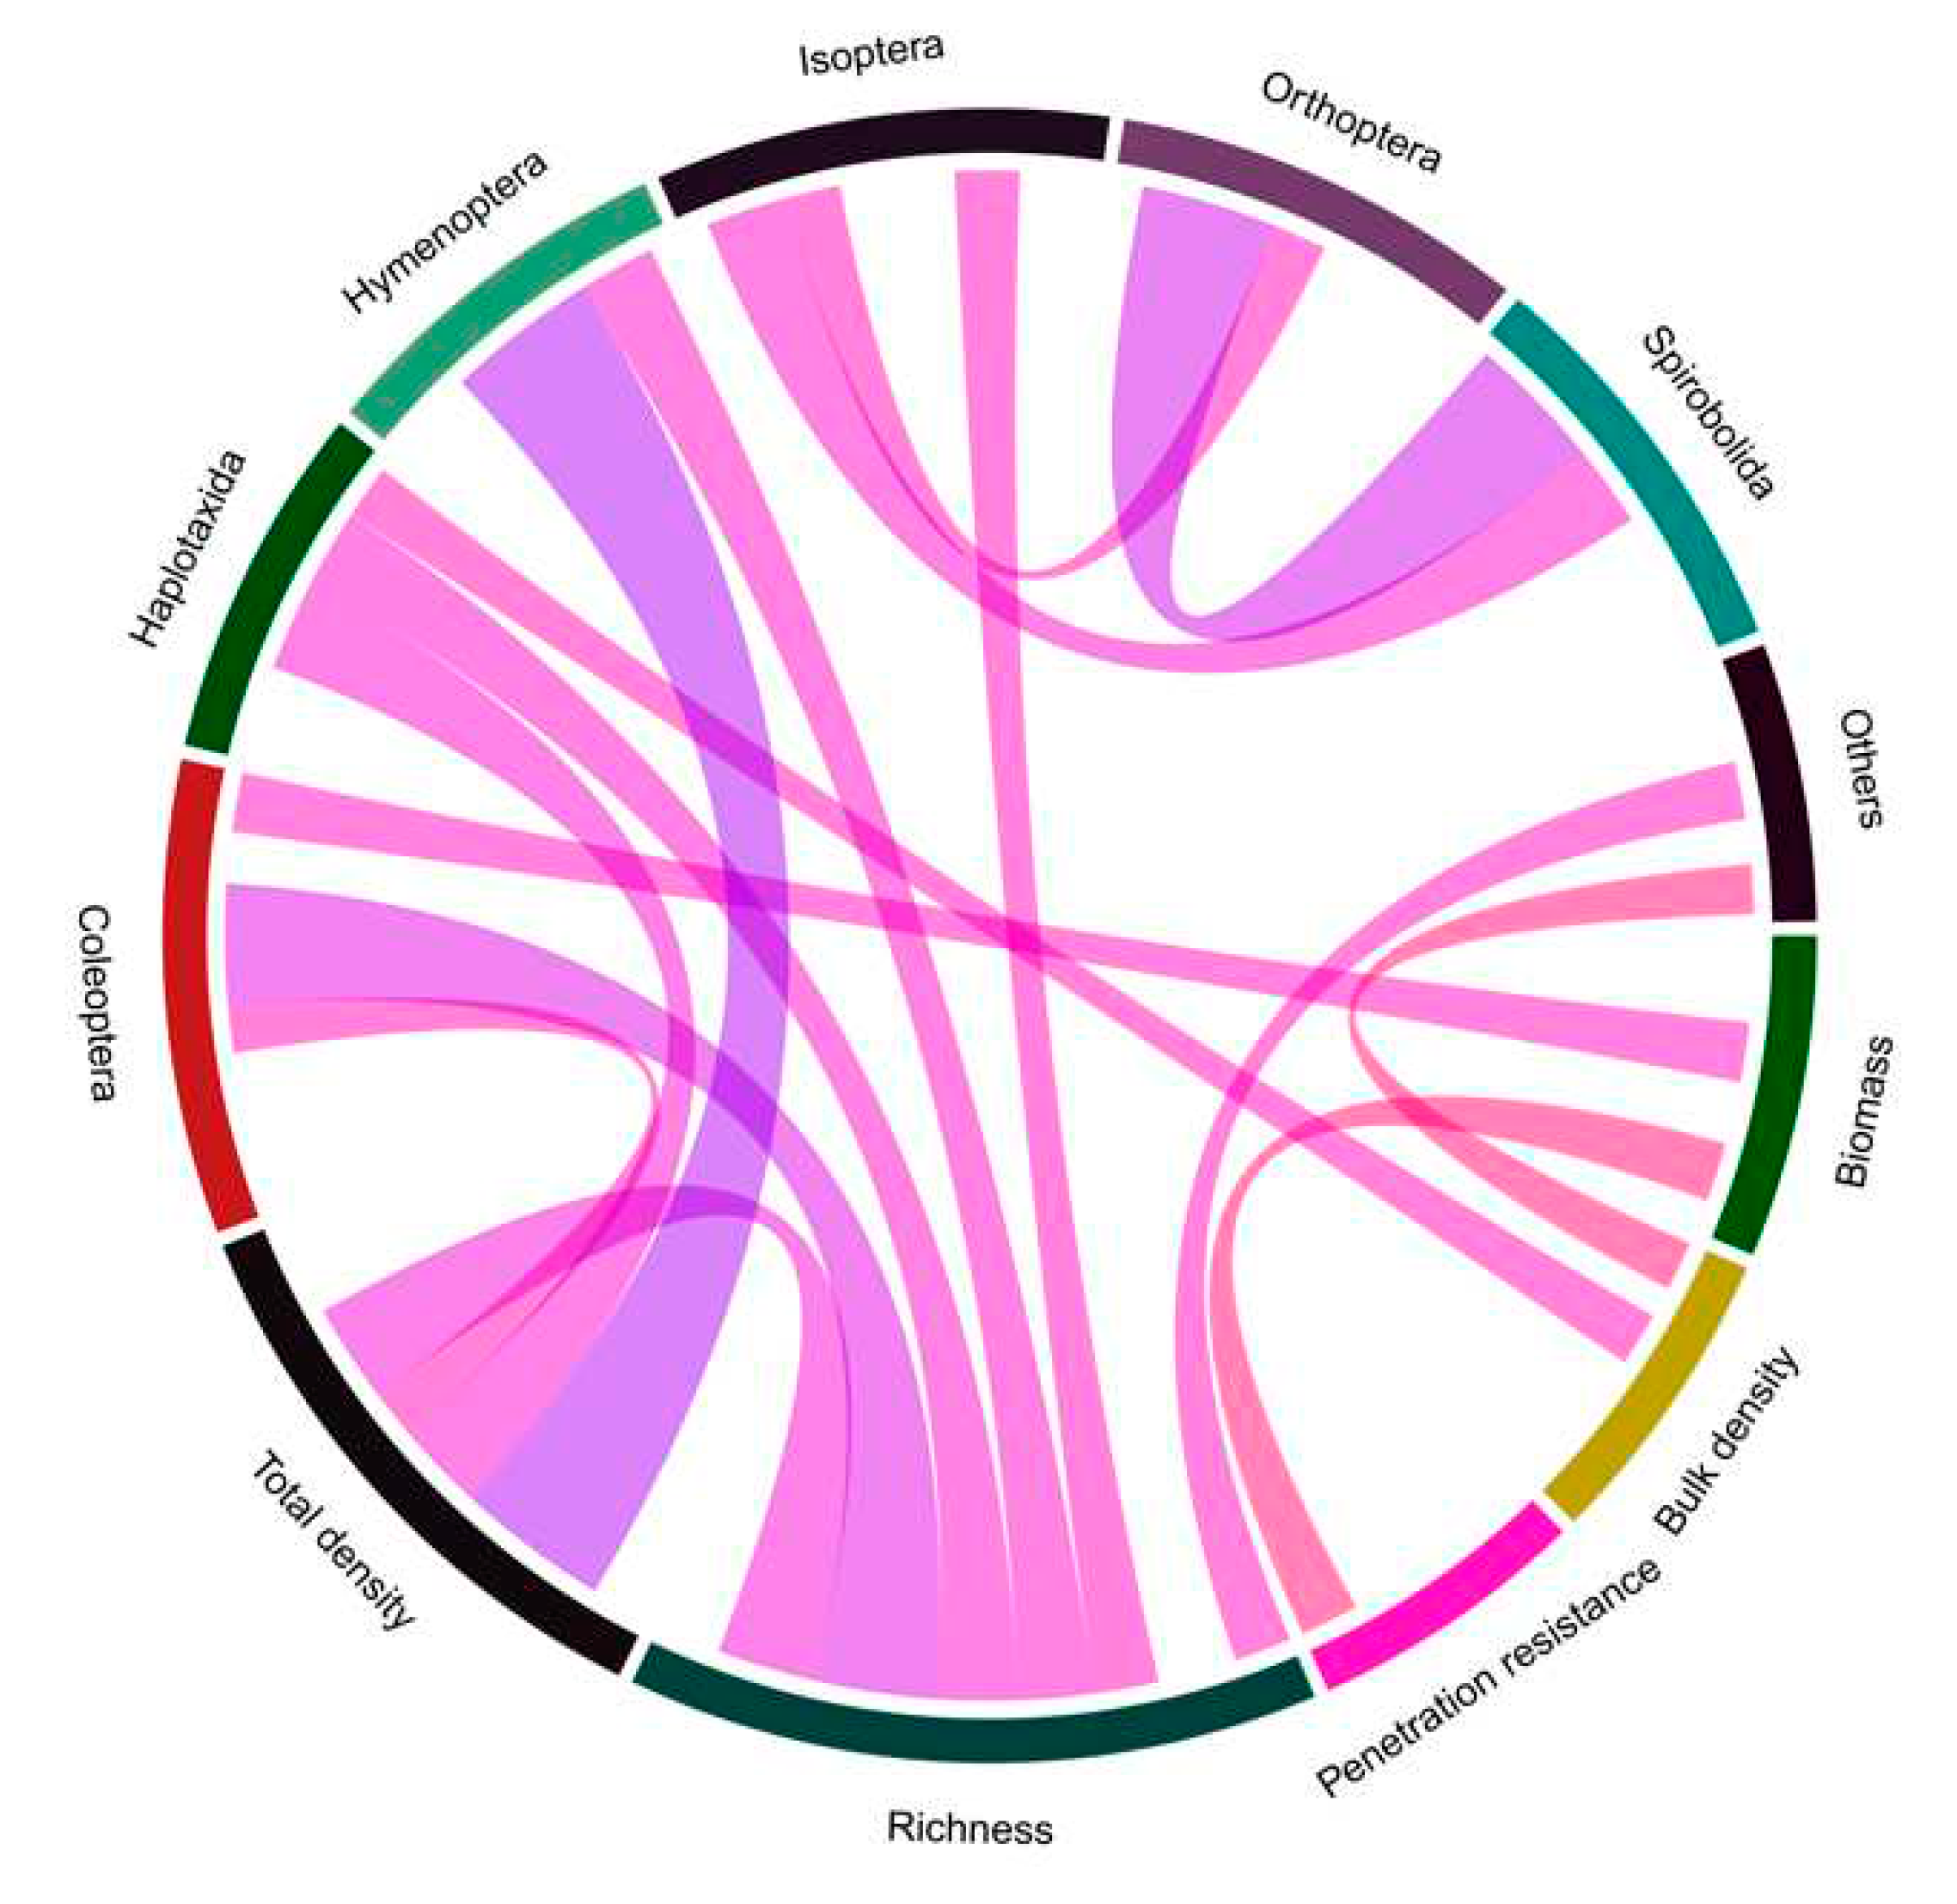
The 24.2% of the correlations were statistically significant (
p < 0.05) with a
r > 0.2. Of these, 87.5% were positive correlations, while the remaining 12.5% were negative correlations (
Figure 4). The highest positive correlations (
r > 0.5) were observed between Total density and Hymenoptera, Orthoptera and Spirobolida, and richness with Coleoptera and total density. As for the negative correlations, the most relevant (
r < -0.2) were observed between biomass and penetration resistance, as well as and bulk density and others taxonomic groups.
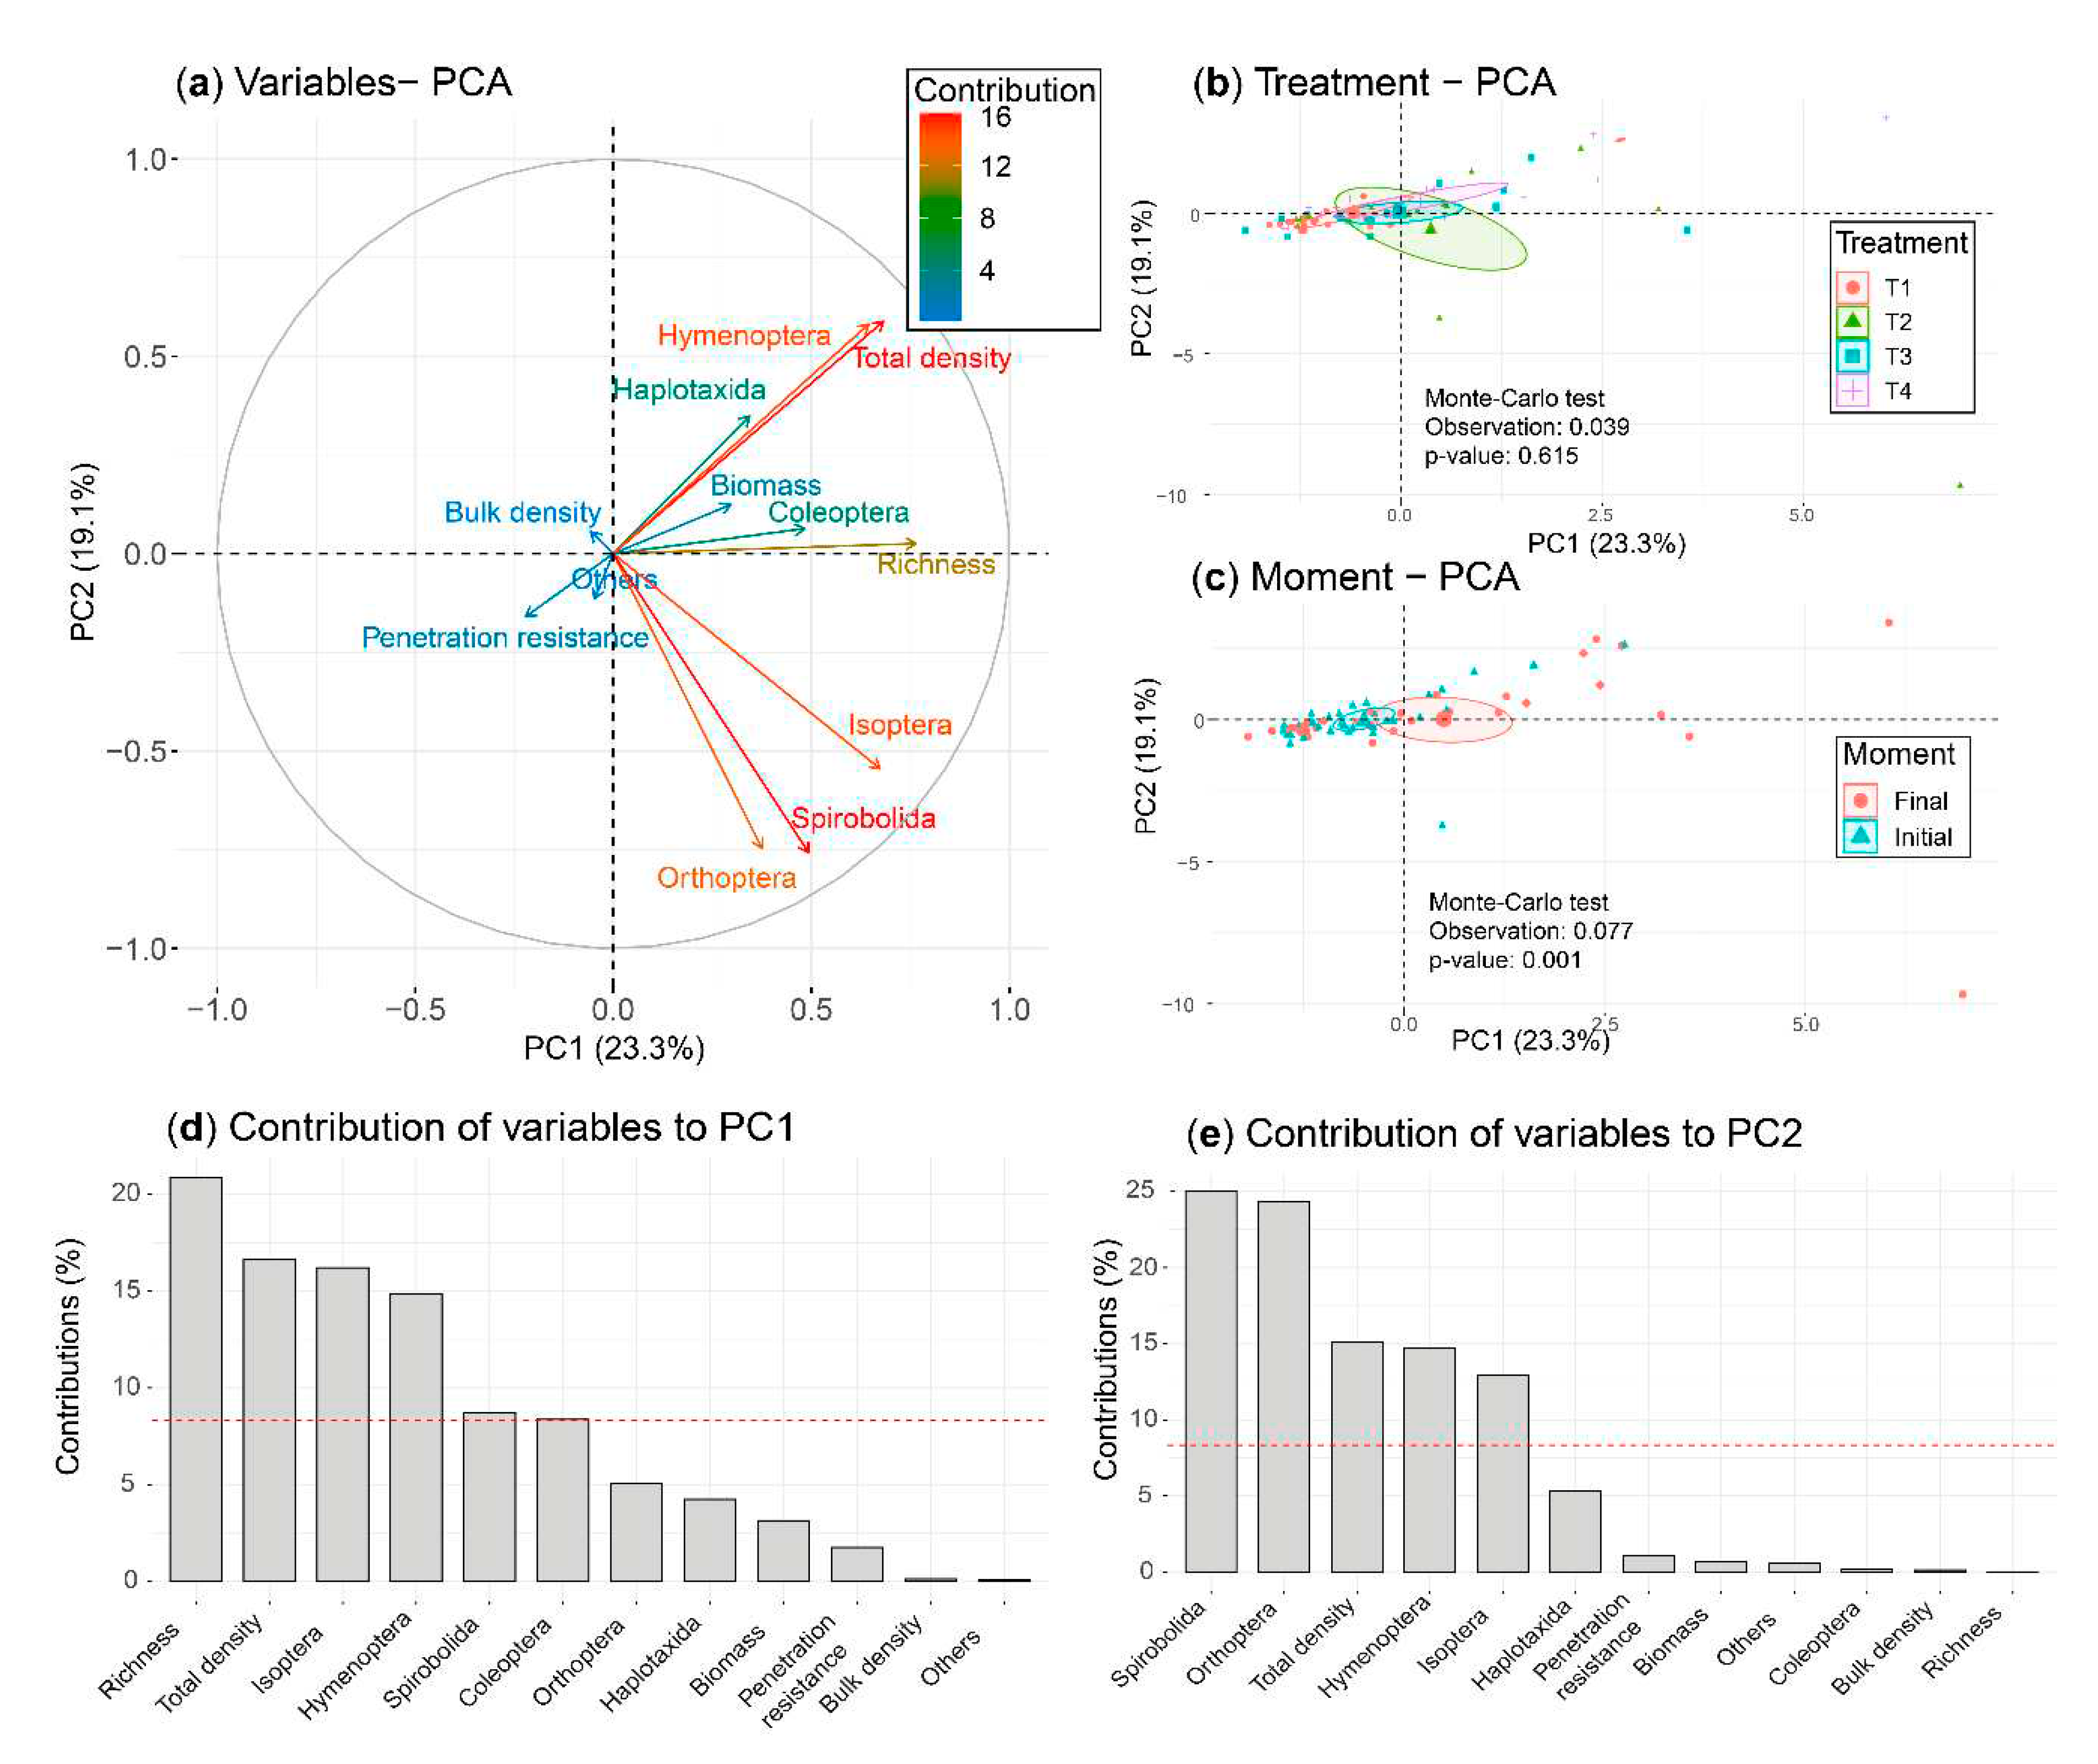
Principal component analysis (PCA) was performed using the parameters treatment and evaluation time, along with invertebrate taxa, and correlated with bulk density, forage biomass and penetration resistance. The first two components, explained 42.4% of the total variability (
Figure 5). The first principal component, accounting for 23.3% of the variability, and separated taxonomic groups (Isoptera and Hymenoptera) with the highest richness and biomass production associated with T2 and T4 during the FM.
The second component, explained 19.1% of the variability, and separated the Orthoptera and Spirobolida groups linked to T2 and T4. Taxonomic groups Orthoptera, Spirobolida, and Isoptera were negatively correlated with soil bulk density. The Monte Carlo test indicated a significant difference in the three groups of variables studied (soil macrofauna, forage biomass and soil physical properties) between the two evaluation moments (p< 0.01; 7.7%), but not between the four treatments (p> 0.05; 3.9%).
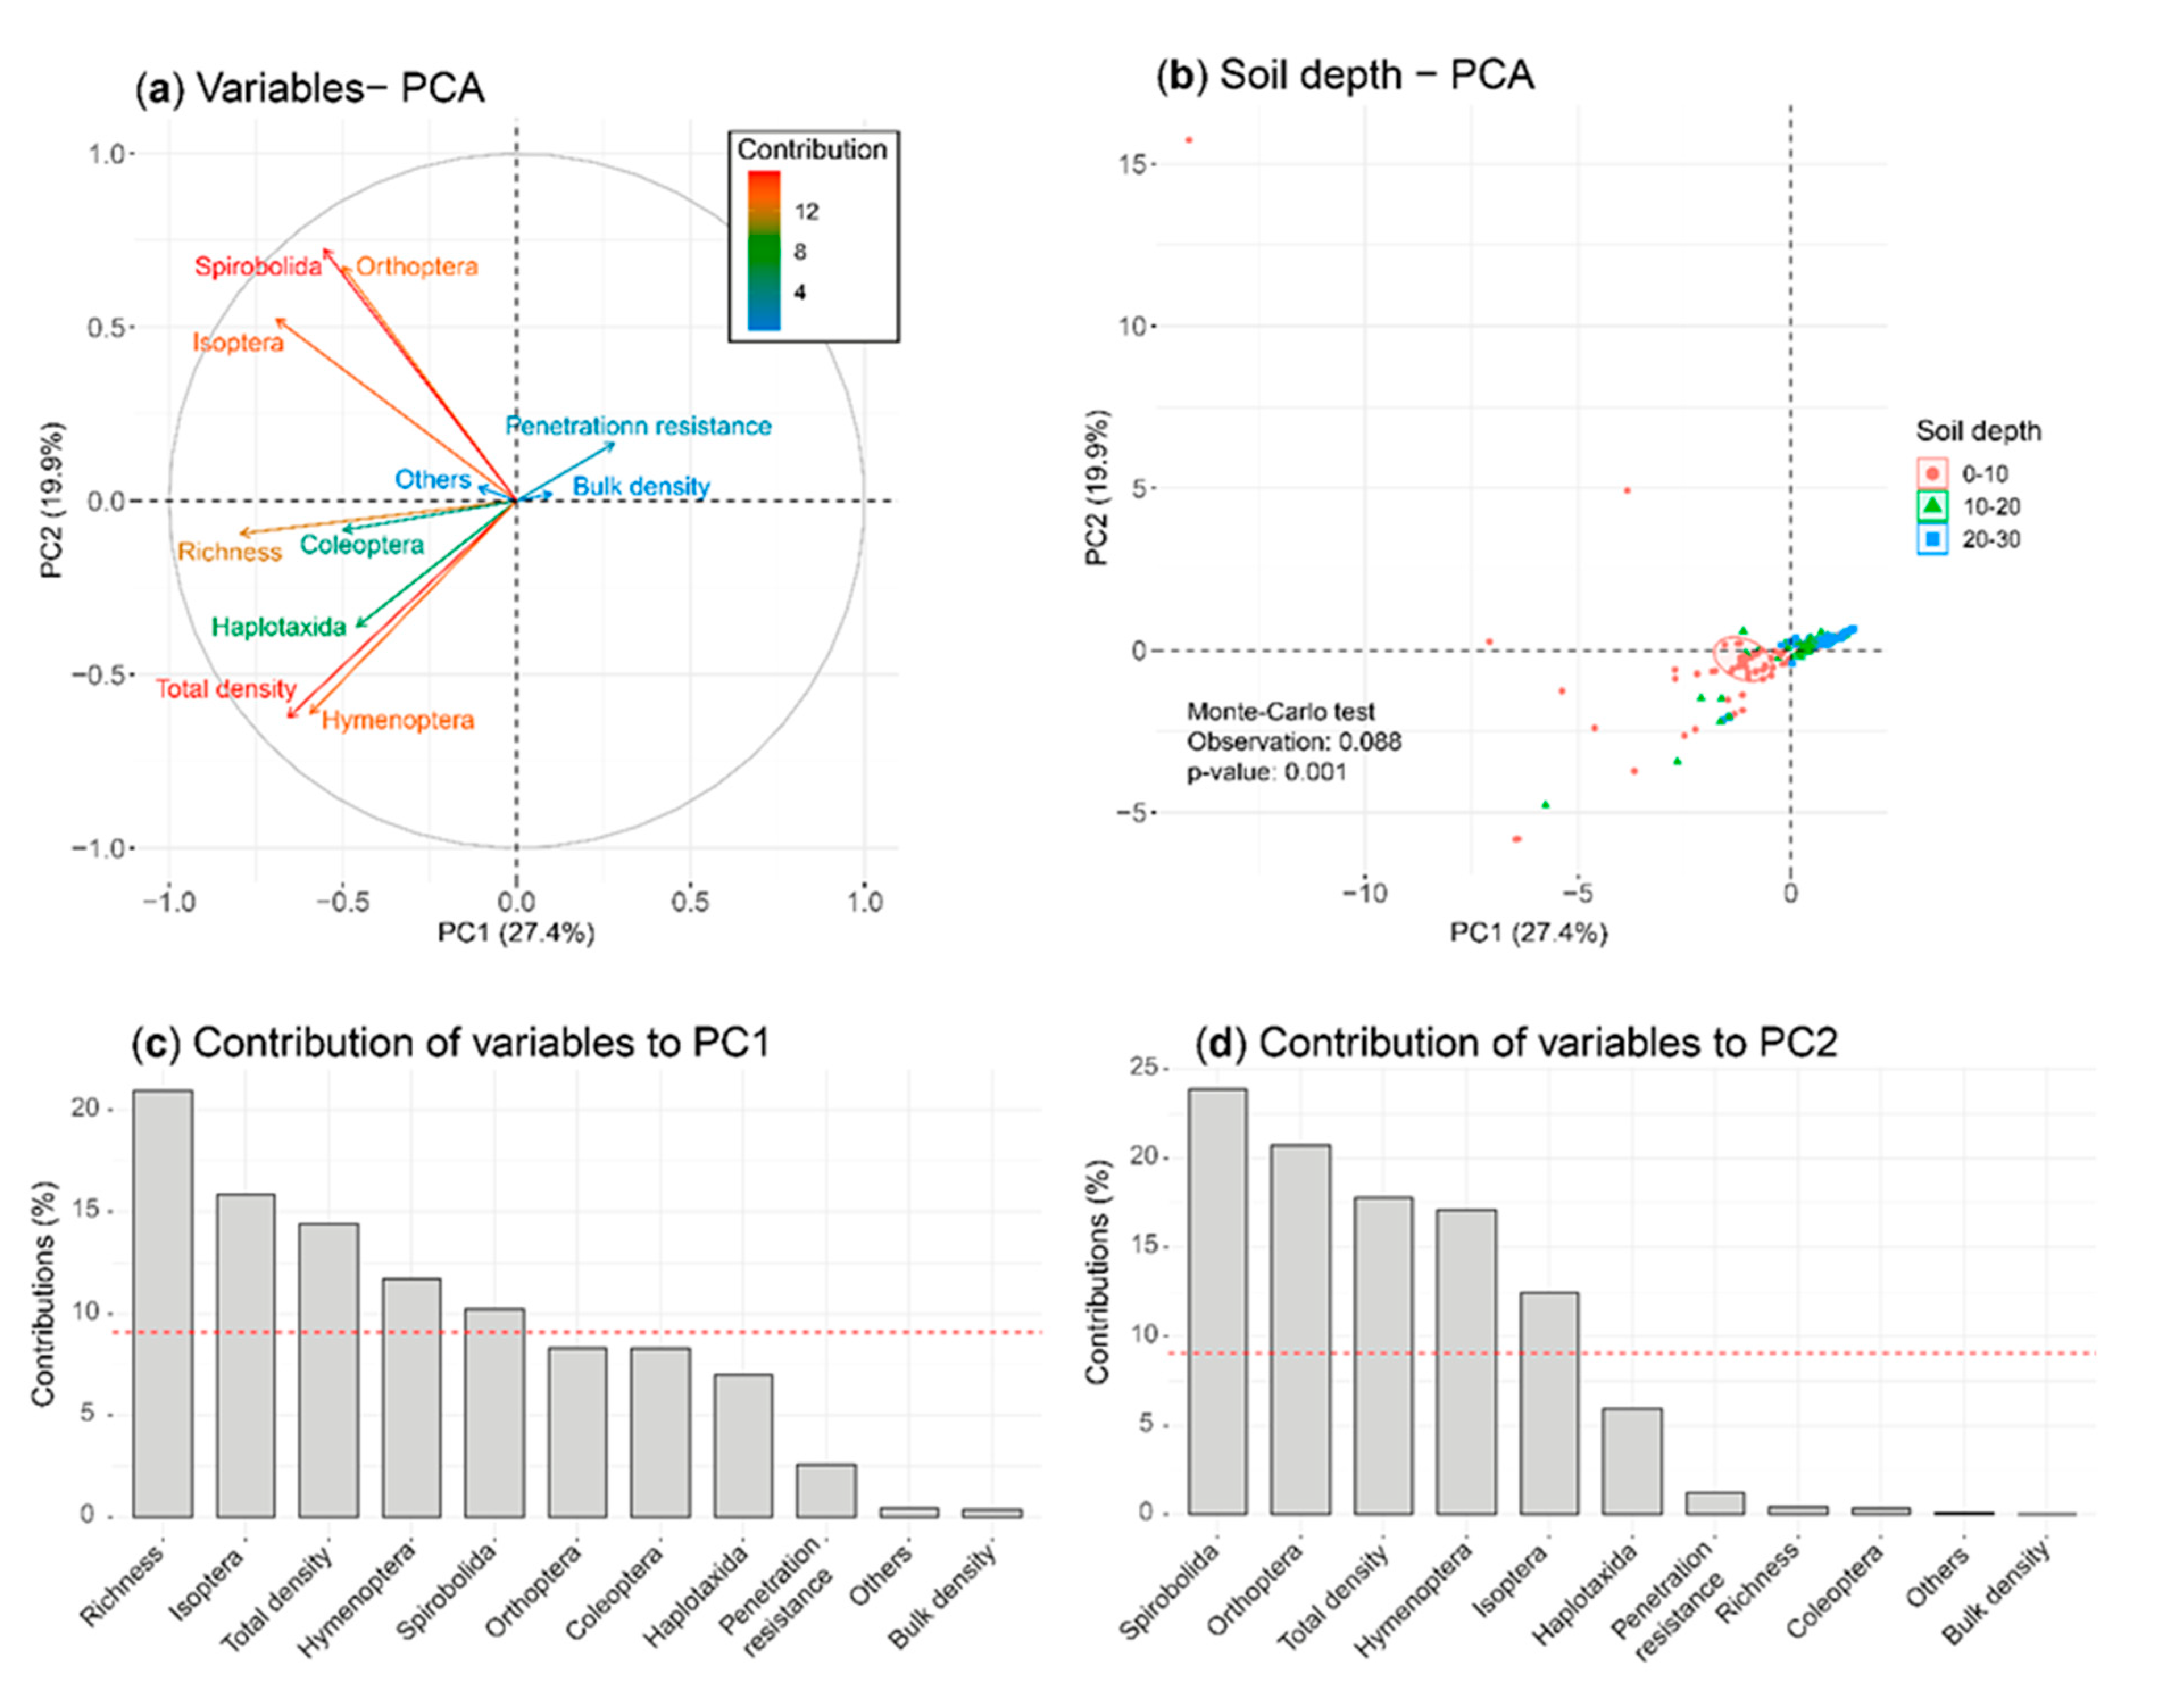
The PCA of physical properties explained 47.3% of the total variability, with the first two axes distinguishing between different soil depths (
p < 0.01; 8.8%) (
Figure 6). PC1 (27.4%) separated the 20-30 cm depth, characterized by higher bulk density and penetration resistance, from the shallower soil depths (0-10 and 10-20 cm), which had greater richness and density of soil macrofauna. Taxonomic groups such as Coleoptera, Isoptera and, Haplotaxida were predominantly found in the shallower soil layers. PC2 (19.9%) separated groups such as Spirobolida and Hymenoptera, mainly concentrated in the 0-10 cm depth.
4. Discussion
4.1. Biomass Production
The biomass production of
Urochloa showed a positive response to the application of organic fertilizers. These increases in biomass are in line with findings from other studies on various grasses that have been subjected to organic fertilization [
27,
28]. The augmentation in biomass can be attributed to the effectiveness of organic fertilization, which is influenced by factors such as the quality and application rate of organic fertilizers, rainfall patterns, and the decomposition patterns of organic matter [
29]. Moreover, organic fertilizers have a favorable impact on forage quality and the nutritional composition of grasses. They increase protein percentages and other essential nutrients for cattle (e.g., Crude Protein PC and Dry Matter DM), thereby directly influencing meat and milk production in livestock systems [
30].
The application of organic fertilizers also contributes to the improvement of soil properties [
31,
32], by increasing the nutrient composition of the soil through the processes like nitrogen fixation and mineral ion solubilization. This stimulates plant growth through synthesis of substandard growth promoters [
33]. The genus
Urochloa reveals positive characteristics related to soil quality and health in agroecosystems. These include higher nutrient use efficiency, reduced erosion risk, enhanced soil structure, increased organic matter levels, and greater biological activity [
34]. These characteristics are clearly demonstrated through the application of organic fertilizers in our study.
In this context, the large biomass production combined with relatively high nutrient concentrations in
Urochloa spp. plant tissues results in a significant accumulation of nutrients in the plant shoots [
35]. This accumulation enhances livestock performance and health. Efficient nutrient utilization in agriculture is crucial for system sustainability and is closely linked to nutrient cycling, which can be optimized through the adoption of management practices aimed at maintaining soil fertility, biodiversity, increasing soil carbon sequestration, and minimizing adverse climatic effects [
36]. The effects of organic fertilizers on plant production align with the principles of sustainable agriculture, which seek to meet economic, social, and environmental standards [
37].
4.2. Soil Biological Characteristics
The viability of an agroecosystem hinges on the synergy among its components, particularly the soil biodiversity, which governs ecological processes related to biotic regulation, nutrient recycling, and productivity [
38]. Within this framework, the utilization of organic fertilizers in pastures serves to fortify and enhance both the macrofauna and microbial populations responsible for decomposing organic matter. This decomposition process releases nutrients into the soil, subsequently benefiting plant growth [
39].
In this study, various taxonomic groups were identified under the U. brizantha cover, with a total density of 51,808 individuals m
-2. The distribution pattern of the soil macrofauna primarily occurred within the first 10 cm of soil depth. The Hymenoptera taxon predominated, accounting for 42,896 individuals m
-2. This result contrasts with Noguera et al. [
40] that reported 5296 individuals. Furthermore, by the end of our experiment, the population increased to 9856 individuals with the application of organic fertilizers.
According to Lopez [
41], the identified taxa are differentiated based on their ecosystem functions. For instance, Haplotaxide organisms play a role in soil transformation, regulating soil dynamics and structure [
38]. Others, such as Hymenoptera and Isoptera, contribute to pore formation, while Coleoptera, Blattodea, Spirobolida, and Orthoptera participate in plant residue shredding and the transformation of organic matter. They use their specialized mouthparts to shred leaves [
42,
43]. These organisms also act as epigean species, aiding in the decomposition process by consuming leaf litter, which increases the surface area for microbial attack [
44].
This observed increase in soil macrofauna can be attributed to the contributions of organic fertilizers. These fertilizers help retain water and nutrients, thus promoting plant health and resilience during dry periods. [
45] suggested that changes in the quality and quantity of soil organic matter and immediate chemical properties following fertilizer application can lead to an increase in soil microarthropod abundance. However, they may have limited influence on microarthropod diversity in alkaline coastal soils of eastern China.
Thus, soil macrofauna is considered an indicator of soil condition, serving both to assess the impact of human activities on the soil and to describe ecosystem functioning [
46]. Consequently, organic fertilization emerges as an effective and sustainable alternative for maintaining and enhancing the presence of this vital biological component in pasture-covered agricultural systems, as opposed to conventional chemical fertilizers [
44].
4.3. Soil Physical Properties Changes
The soil physical variables assessed, including bulk density and penetration resistance, had lower values at a depth of 0 to 10 cm when compared to the other depths (10-20 and 20-30 cm). This effect is attributed to the application of organic fertilizers and the subsequent accumulation of organic matter on the soil surface. This accumulation significantly increases the population of soil macrofauna and taxonomic richness in Urochloa spp. pastures.
The functional group with the highest population representation was soil engineers, followed by herbivores and detritivores. According to Lavelle et al. [
44], soil engineers comprise groups that consume organic matter, such as earthworms and termites, as well as omnivorous organisms like ants, which have a specific impact on the soil's physical properties.
The application of organic fertilizers induces transformations in the physical properties of the soil, leading to improvements in soil aggregation, reduced compaction, and prevention of crusting. It also enhances water retention and transmission characteristics on the proportion of macroaggregates [
47,
48].
This positive effect is consistent with findings that show an increase in the proportion of macroaggregates, and a rise in the percentage of aggregates within different size ranges [
49]. These changes benefit physical properties and subsequently improve crop yields. Thus, the use of organic fertilizers offers a sustainable and effective approach to enhancing soil health and crop productivity [
50].
The physical improvement process of the soil resulting from the applied treatments results in porous soils with excellent aeration, good drainage, and enhanced root penetration. This outcome aligns with the findings of [
51] who observed lower bulk density than 2.30 g cm-³, indicating improved soil quality attributed to the effectiveness of organic fertilizers. Bulk density is commonly used as a measure of soil structure, indicative of increased porosity, aggregate stability, reduced compaction, and higher moisture content [
52].
In this regard, [
53] found that organic fertilizers lead to an increase in organic carbon, enhance soil physical quality, and result in lower bulk density, distinguishing them from traditional fertilizers.
In this context, organic fertilizers bolster soil structure by promoting biological activity within the soil, consequently facilitating the formation of aggregates. Simultaneously, they enrich the soil with humus, thereby enhancing its water retention capacity, as that observed by [
54]. Furthermore, this aeration effect improves air circulation, activating the microorganisms residing in the soil, which are essential for plant growth and overall health. These combined benefits contribute positively to plant growth by aiding in nutrient retention and reducing the leaching process.
5. Conclusions
The application of organic fertilizers had a beneficial impact on the pasture agroecosystem, enhancing forage production at the plant level and positively influencing the soil's physical and biological properties, confirming our hypothesis. Thus, there was a significant increase in the biomass of Urochloa spp. forage at the end of the production cycle, in response to the increased nutritional input induced by organic fertilizers. Additionally, there was an increase in soil macrofauna richness and density, accompanied by a reduction in soil compaction, especially at the 0-10 cm depth.
Our study offers valuable insights into the utilization of on-farm organic resources within the Amazon region. It sheds light on their potential for pasture restoration in livestock systems within the productive landscapes with high levels of deforestation such as the Caquetá department, promoting the sustainability of agroecosystems and the conservation of natural resources.
Author Contributions
Conceptualization, F.A. and P.R.; methodology, F.A., and P.R.; software, F.A. and A.S.; validation, F.A. and A.S.; formal analysis, A.S.; investigation, F.A. and P.R.; resources, F.A.; data curation, F.A., P.R. and A.S.; writing—original draft preparation, F.A., P.R. and A.S.; writing—review and editing, F.A., P.R. and A.S.; visualization, F.A. and A.S.; supervision, F.A. and A.S.; project administration, F.A.; funding acquisition, F.A. All authors have read and agreed to the published version of the manuscript.
Funding
This research was supported by the Vicerrectoría de Investigaciones y Posgrados de la Universidad de la Amazonia, Florencia, Caquetá (Colombia).
Institutional Review Board Statement
Not applicable.
Informed Consent Statement
Not applicable.
Data Availability Statement
Data are available from the authors upon request.
Acknowledgments
The authors thank to the Universidad de la Amazonía that made this research possible.
Conflicts of Interest
The authors declare no conflict of interest. The funders had no role in the design of the study; in the collection, analyses, or interpretation of data; in the writing of the manuscript, or in the decision to publish the results.
References
- Torrijos, R. Cifras de Contexto Ganadero Caquetá 2022 by Rafael Torrijos - Issuu. Available online: https://issuu.com/rafaeltorrijos/docs/contexto_2022_imp (accessed on 31 May 2023).
- Armenteras, D.; Murcia, U.; González, T.M.; Barón, O.J.; Arias, J.E. Scenarios of Land Use and Land Cover Change for NW Amazonia: Impact on Forest Intactness. Glob Ecol Conserv 2019, 17. [Google Scholar] [CrossRef]
- Hernández, Á.S. Agricultural Law and Development of Rural Areas: Food Challenges, Natural Resources and Climate Change. 2017. [CrossRef]
- Jimenez, O.; Granados, L.; Oliva, J.; Quiroz, J.; Barrón, M. Calidad Nutritiva de Brachiaria Humidicola Con Fertilización Orgánica e Inorgánica En Suelos Ácidos. Available online: https://scielo.isciii.es/scielo.php?pid=S0004-05922010000400009&script=sci_arttext&tlng=en (accessed on 29 May 2023).
- Rodríguez-León, C.H.; Peña-Venegas, C.P.; Sterling, A.; Castro, D.; Mahecha-Virguez, L.K.; Virguez-Díaz, Y.R.; Silva-Olaya, A.M. Soil Quality Restoration during the Natural Succession of Abandoned Cattle Pastures in Deforested Landscapes in the Colombian Amazon. Agronomy 2021, 11, 2484. [Google Scholar] [CrossRef]
- Finch, S. ; A., Samuel.; P, L.G. Lockhart and Wiseman’s Crop Husbandry Including Grassland - Steve Finch, Alison Samuel, Gerry P. Lane - Google Libros. In Lockhart and wiseman’s crop husbandry including grassland.; 2014.
- Borges, J.A.; Barrios, M.; Escalona, O. Efecto de La Fertilizaci??N Org??Nica e Inorg??Nica Sobre Variables Agroproductivas y Composici??N Qu??Mica Del Pasto Estrella (Cynodon Nlemfuensis). Zootec Trop 2012, 30, 17–25. [Google Scholar]
- Gastal, F.; Durand, J.L. Effects of Nitrogen and Water Supply on N and C Fluxes and Partitioning in Defoliated Swards. Grassland ecophysiology and grazing ecology 2000, 15–39. [Google Scholar] [CrossRef]
- Patiño, P.; Perez, C. Patiño P.R., Pérez C.R., & Pérez P.J. (2013).... - Google Académico. Available online: https://scholar.google.es/scholar?hl=es&as_sdt=0%2C5&q=Patiño+P.R.%2C+Pérez+C.R.%2C+%26+Pérez+P.J.+%282013%29.+Efecto+de+la+aplicación+de+diferentes+tipos+de+abono+sobre+la+producción+y+calidad+nutricional+del+pasto+colosuana+Bothriochloa+pertusa+%28L%29+ (accessed on 29 May 2023).
- Ciesielczuk, T.; Rosik-Dulewska, C.; Wiśniewska, E. Possibilities of Coffee Spent Ground Use as a Slow Action Organo-Ineral Fertilizer. Rocznik Ochrona Srodowiska 2015, 17, 422–437. [Google Scholar]
- Ghosh, P.K.; Ramesh, P.; Bandyopadhyay, K.K.; Tripathi, A.K.; Hati, K.M.; Misra, A.K.; Acharya, C.L. Comparative Effectiveness of Cattle Manure, Poultry Manure, Phosphocompost and Fertilizer-NPK on Three Cropping Systems in Vertisols of Semi-Arid Tropics. I. Crop Yields and System Performance. Bioresour Technol 2004, 95, 77–83. [Google Scholar] [CrossRef] [PubMed]
- Hernández-Rodríguez, O.A.; Ojeda-Barrios, D.L.; López-Díaz, J.C.; Arras-Vota, A.M. Abonos Orgánicos y Su Efecto En Las Propiedades Físicas, Químicas y Biológicas Del Suelo: TECNOCIENCIA Chihuahua 2010, 4, 1–6. 4. [CrossRef]
- Holdridge, L. Ecología Basada En Zonas de Vida. 1987.
- IDEAM SANDRA SUÁREZ PÉREZ Ministra de Ambiente, Vivienda y Desarrollo Territorial. 2017.
- Restrepo, J.; Hensel, J. MANUAL PRACTICO DE AGRICULTURA ORGÁNICA Y PANES DE PIEDRA Contenido General. 2009.
- Tothill, J.; Hargreaves, J.; Jones, R.; McDonald, C. BOTANAL: A Comprehensive Sampling Procedure for Estimating Pasture Yield and Composition. I. Field Sampling. 1992. [Google Scholar]
- ISO ISO 23611-5:2011(En), Soil Quality — Sampling of Soil Invertebrates — Part 5: Sampling and Extraction of Soil Macro-Invertebrates. Available online: https://www.iso.org/obp/ui/#iso:std:iso:23611:-5:ed-1:v1:en (accessed on 1 June 2023).
- Blake, G.; Hartge, K. Particle Densityl. 1986, 9, 377–382.
- Rodríguez-León, C.H.; Peña-Venegas, C.P.; Sterling, A.; Castro, D.; Mahecha-Virguez, L.K.; Virguez-Díaz, Y.R.; Silva-Olaya, A.M. Soil Quality Restoration during the Natural Succession of Abandoned Cattle Pastures in Deforested Landscapes in the Colombian Amazon. Agronomy 2021, 11. [Google Scholar] [CrossRef]
- Pinheiro, J.; Bates, D.; DebRoy, S.; Sarkar, D. Nlme: Linear and Nonlinear Mixed Effects Models. R Package Version 3.1-131. 2018. [Google Scholar]
- Bates, D.; Maechler, M.; Bolker, B.; Walker, S.; Bojesen, R.H.; Singmann, H.; Dai, B.; Scheipl, F.; Grothendieck, G.; Green, P.; et al. Paquete Lme4: Modelos Lineales de Efectos Mixtos Usando “Eigen... - Google Académico. Available online: https://scholar.google.es/scholar?hl=es&as_sdt=0%2C5&q=Package+lme4%3A+Linear+Mixed-Effects+Models+using+“Eigen”+and+S4+Package+Version%3A+&btnG=#d=gs_cit&t=1685373982077&u=%2Fscholar%3Fq%3Dinfo%3AXgInXfB9ob8J%3Ascholar.google.com%2F%26output%3Dcite%26sci (accessed on 29 May 2023).
- R. Core Team R: A Language and Environment for Statistical Computing 2020.
- Di Rienzo, J.A.; Casanoves, F.; Balzarini, M.G.; Gonzalez, L.; Tablada, M.; Robledo, C.W. InfoStat 2020.
- Gu, Z.; Gu, L.; Eils, R.; Schlesner, M.; Brors, B. Circular Visualization [R Package Circlize Version 0.4.15]. Bioinformatics 2022, 30, 2811–2812. [Google Scholar] [CrossRef] [PubMed]
- Dray, S.; Dufour, A.-B.; Thioulouse, J. Ade4: Analysis of Ecological Data: Exploratory and Euclidean Methods in Environmental Sciences. R Package Version 1.7-16. 2020, 403.
- Kassambara, A.; Mund, F. Factoextra: Extract and Visualize the Results of Multivariate Data Analyses. cir.nii.ac.jp 2020. [Google Scholar]
- Ryals, R.; Silver, W.L. Effects of Organic Matter Amendments on Net Primary Productivity and Greenhouse Gas Emissions in Annual Grasslands. Ecological Applications 2013, 23, 46–59. [Google Scholar] [CrossRef]
- Ahmad, A.A.; Radovich, T.J.K.; Nguyen, H. V.; Uyeda, J.; Arakaki, A.; Cadby, J.; Paull, R.; Sugano, J.; Teves, G. Use of Organic Fertilizers to Enhance Soil Fertility, Plant Growth, and Yield in a Tropical Environment. Organic Fertilizers - From Basic Concepts to Applied Outcomes. [CrossRef]
- Peinetti, H.R.; Menezes, R.S.C.; Tiessen, H.; Perez Marin, A.M. Simulating Plant Productivity under Different Organic Fertilization Practices in a Maize/Native Pasture Rotation System in Semi-Arid NE Brazil. Comput Electron Agric 2008, 62, 204–222. [Google Scholar] [CrossRef]
- Štýbnarová, M.; Mičová, P.; Fiala, K.; Karabcová, H.; Látal, O.; Pozdíšek, J. Effect of Organic Fertilizers on Botanical Composition of Grassland, Herbage Yield and Quality. Agriculture (Pol’nohospodarstvo) 2014, 60, 87–97. [Google Scholar] [CrossRef]
- Dinesh, R.; Srinivasan, V.; Hamza, S.; Manjusha, A. Short-Term Incorporation of Organic Manures and Biofertilizers Influences Biochemical and Microbial Characteristics of Soils under an Annual Crop [Turmeric (Curcuma Longa L.)]. Bioresour Technol 2010, 101, 4697–4702. [Google Scholar] [CrossRef] [PubMed]
- Singh, T.B.; Ali, A.; Prasad, M.; Yadav, A.; Shrivastav, P.; Goyal, D.; Dantu, P.K. Role of Organic Fertilizers in Improving Soil Fertility. Contaminants in Agriculture: Sources, Impacts and Management. [CrossRef]
- Shaji, H.; Chandran, V.; For, L.M.-C. release fertilizers; 2021, U. Organic Fertilizers as a Route to Controlled Release of Nutrients. Elsevier 2021. [Google Scholar]
- Boddey, R.; Rao, I.; Thomas, R. Brachiaria: Biology, Agronomy, and Improvement - Google Libros; Brachiaria: Biollogy, Agronomy and Improvement, 1996. [Google Scholar]
- Baptistella, J.L.C.; de Andrade, S.A.L.; Favarin, J.L.; Mazzafera, P. Urochloa in Tropical Agroecosystems. Front Sustain Food Syst 2020, 4, 1–17. [Google Scholar] [CrossRef]
- Power, A.G. Ecosystem Services and Agriculture: Tradeoffs and Synergies. Philosophical Transactions of the Royal Society B: Biological Sciences 2010, 365, 2959–2971. [Google Scholar] [CrossRef]
- Lal, R. Beyond Copenhagen: Mitigating Climate Change and Achieving Food Security through Soil Carbon Sequestration. Food Secur 2010, 2, 169–177. [Google Scholar] [CrossRef]
- Gutierrez-Bermudez, C.; Mendieta, B.; Noguera, A. Trophic Composition of Edaphic Macrofauna in Animal Husbandry Systems in the Dry Corridor of Nicaragua. Pastos y … 2020, 43, 30–37. [Google Scholar]
- Masin, C.E.; Cruz, M.S.; Rodríguez, A.R.; Demonte, M.J.; Vuizot, L.A.; Maitre, M.I.; Godoy, J.L.; Almada, M.S. Macrofauna Edáfica Asociada a Diferentes Ambientes de Un Vivero Forestal (Santa Fe, Argentina). Ciencia del suelo 2017, 35, 21–33. [Google Scholar]
- Noguera-Talavera, A.; Reyes-Sánchez, N.; Mendieta-Araica, B. Diversidad y Distribución de La Macrofauna Edáfica En Dos Sistemas de Manejo de Moringa Oleifera (Lam.): Relación Con Las Propiedades Del Suelo. La Calera 2017, 17, 78–86. [Google Scholar] [CrossRef]
- López, G. Macrofauna y Microbiología Edáfica: Relación Con Servicios Ecosistémicos Y Físicoquímicos Del Suelo En Dos Con Café, San Ramón, Matagalpa, 2016. 2022.
- Sanz-Lázaro, C.; Marín, A. Diversity Patterns of Benthic Macrofauna Caused by Marine Fish Farming. Diversity 2011, 3, 176–199. [Google Scholar] [CrossRef]
- McGlynn, T.P.; Poirson, E.K. Ants Accelerate Litter Decomposition in a Costa Rican Lowland Tropical Rain Forest. J Trop Ecol 2012, 28, 437–443. [Google Scholar] [CrossRef]
- Lavelle, P.; Mathieu, J.; Spain, A.; Brown, G.; Fragoso, C.; Lapied, E.; De Aquino, A.; Barois, I.; Barrios, E.; Barros, M.E.; et al. Soil Macroinvertebrate Communities: A World-Wide Assessment. Global Ecology and Biogeography 2022, 31, 1261–1276. [Google Scholar] [CrossRef]
- Wang, S.; Tan, Y.; Fan, H.; Ruan, H.; Zheng, A. Responses of Soil Microarthropods to Inorganic and Organic Fertilizers in a Poplar Plantation in a Coastal Area of Eastern China. Applied Soil Ecology 2015, 89, 69–75. [Google Scholar] [CrossRef]
- Watson-Zink, V. Making the Grade: Physiological Adaptations to Terrestrial Environments in Decapod Crabs. Elsevier 2021. [Google Scholar] [CrossRef] [PubMed]
- Hati, K.; Bandyoopadhay, K. Soil-Plant-Atmosphere Continuum. In Encyclopedia of Agrophysics; Gliński, J., Horabik, J., Lipiec, J., Eds.; Encyclopedia of Earth Sciences; Springer Netherlands: Dordrecht, 2011; ISBN 978-90-481-3584-4. [Google Scholar]
- Du, S.; Ma, Z.; Chen, J.; Xue, L.; Tang, C.; Shareef, T.M.E.; Siddique, K.H.M. Effects of Organic Fertilizer Proportion on the Distribution of Soil Aggregates and Their Associated Organic Carbon in a Field Mulched with Gravel. Sci Rep 2022, 12, 1–12. [Google Scholar] [CrossRef]
- García, Y.; Ramírez, W.; Sánchez, S. Indicadores de La Calidad de Los Suelos: Una Nueva Manera de Evaluar Este Recurso. Pastos y Forrajes 2012, 35, 125–138. [Google Scholar]
- Villanueva, C.; Ibrahim, M. Evaluacion_del_impacto. Agroforestería en las Américas 2019, 9, 35–36. [Google Scholar]
- Ramírez, J.; Fernandez, Y.; González, P. Influencia de La Fertilización En Las Propiedades Físico-Químicas de Un Suelo Dedicado a La Producción de Semilla de Megathyrsus Maximus. scielo.sld.cuJF Ramírez, Y Fernandez, PJ González, X Salazar, JM Iglesias, Y OliveraPastos y forrajes, 2015•scielo.sld.cu.
- Doran, D. Doran, D. C. Guía Para La Evaluación de Calidad... - Google Académico. Available online: https://scholar.google.es/scholar?hl=es&as_sdt=0%2C5&q=Doran%2C+D.+C.+Gu%C3%ADa+para+la+evaluaci%C3%B3n+de+calidad+y+salud+del+suelo.+EUA%3A+USDA%2C+1999.&btnG= (accessed on 17 July 2023).
- García-Ruiz; Lana, R. Hydrological and Erosive Consequences of Farmland Abandonment in Europe, with Special Reference to the Mediterranean Region–A Review. Elsevier 2011, 140, 317–338.
- González-Salas, U.; Gallegos-Robles, M.Á.; Cirilo Vázquez-Vazquez, §; Luis García-Hernandez, J.; Fortis-Hernández, M.; Shesareli Mendoza-Retana, S. Productividad de Genotipos de Maíz Forrajero Bajo Fertilización Orgánica y Propiedades Físico-Químicas Del Suelo. scielo.org.mxU González-Salas, MÁ Gallegos-Robles, C Vázquez-Vazquez, JL García-HernandezRevista mexicana de ciencias agrícolas, 2018•scielo.org.mx 2018, 9.
|
Disclaimer/Publisher’s Note: The statements, opinions and data contained in all publications are solely those of the individual author(s) and contributor(s) and not of MDPI and/or the editor(s). MDPI and/or the editor(s) disclaim responsibility for any injury to people or property resulting from any ideas, methods, instructions or products referred to in the content. |
© 2023 by the authors. Licensee MDPI, Basel, Switzerland. This article is an open access article distributed under the terms and conditions of the Creative Commons Attribution (CC BY) license (http://creativecommons.org/licenses/by/4.0/).
