Submitted:
24 September 2023
Posted:
26 September 2023
You are already at the latest version
Abstract
Keywords:
1. Introduction
2. Materials and Methods
3. Construction and Analysis of the First Model
3.1. Mathematical Model Formulation
3.2. Equilibrium Points
4. Construction and Analysis of the Second Model
4.1. Mathematical Model Formulation
4.2. Equilibrium Points
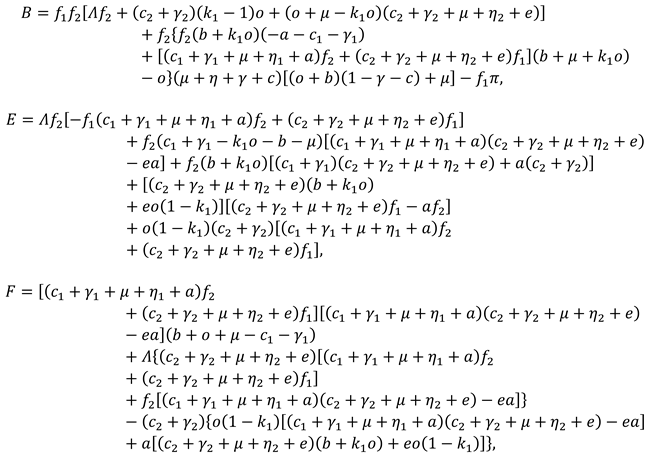


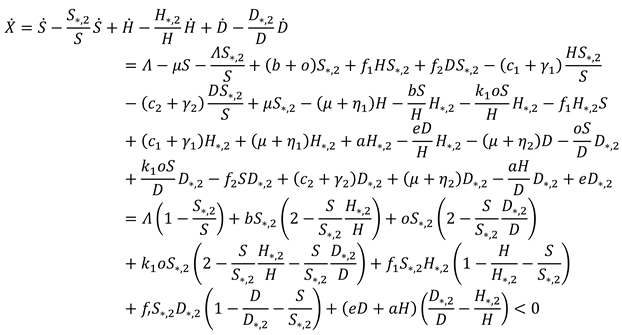
5. Sensitivity Analysis and Numerical Simulations
5.1. Sensitivity Analysis of the First Model
5.2. Sensitivity Analysis of the Second Model
6. Results and Discussion
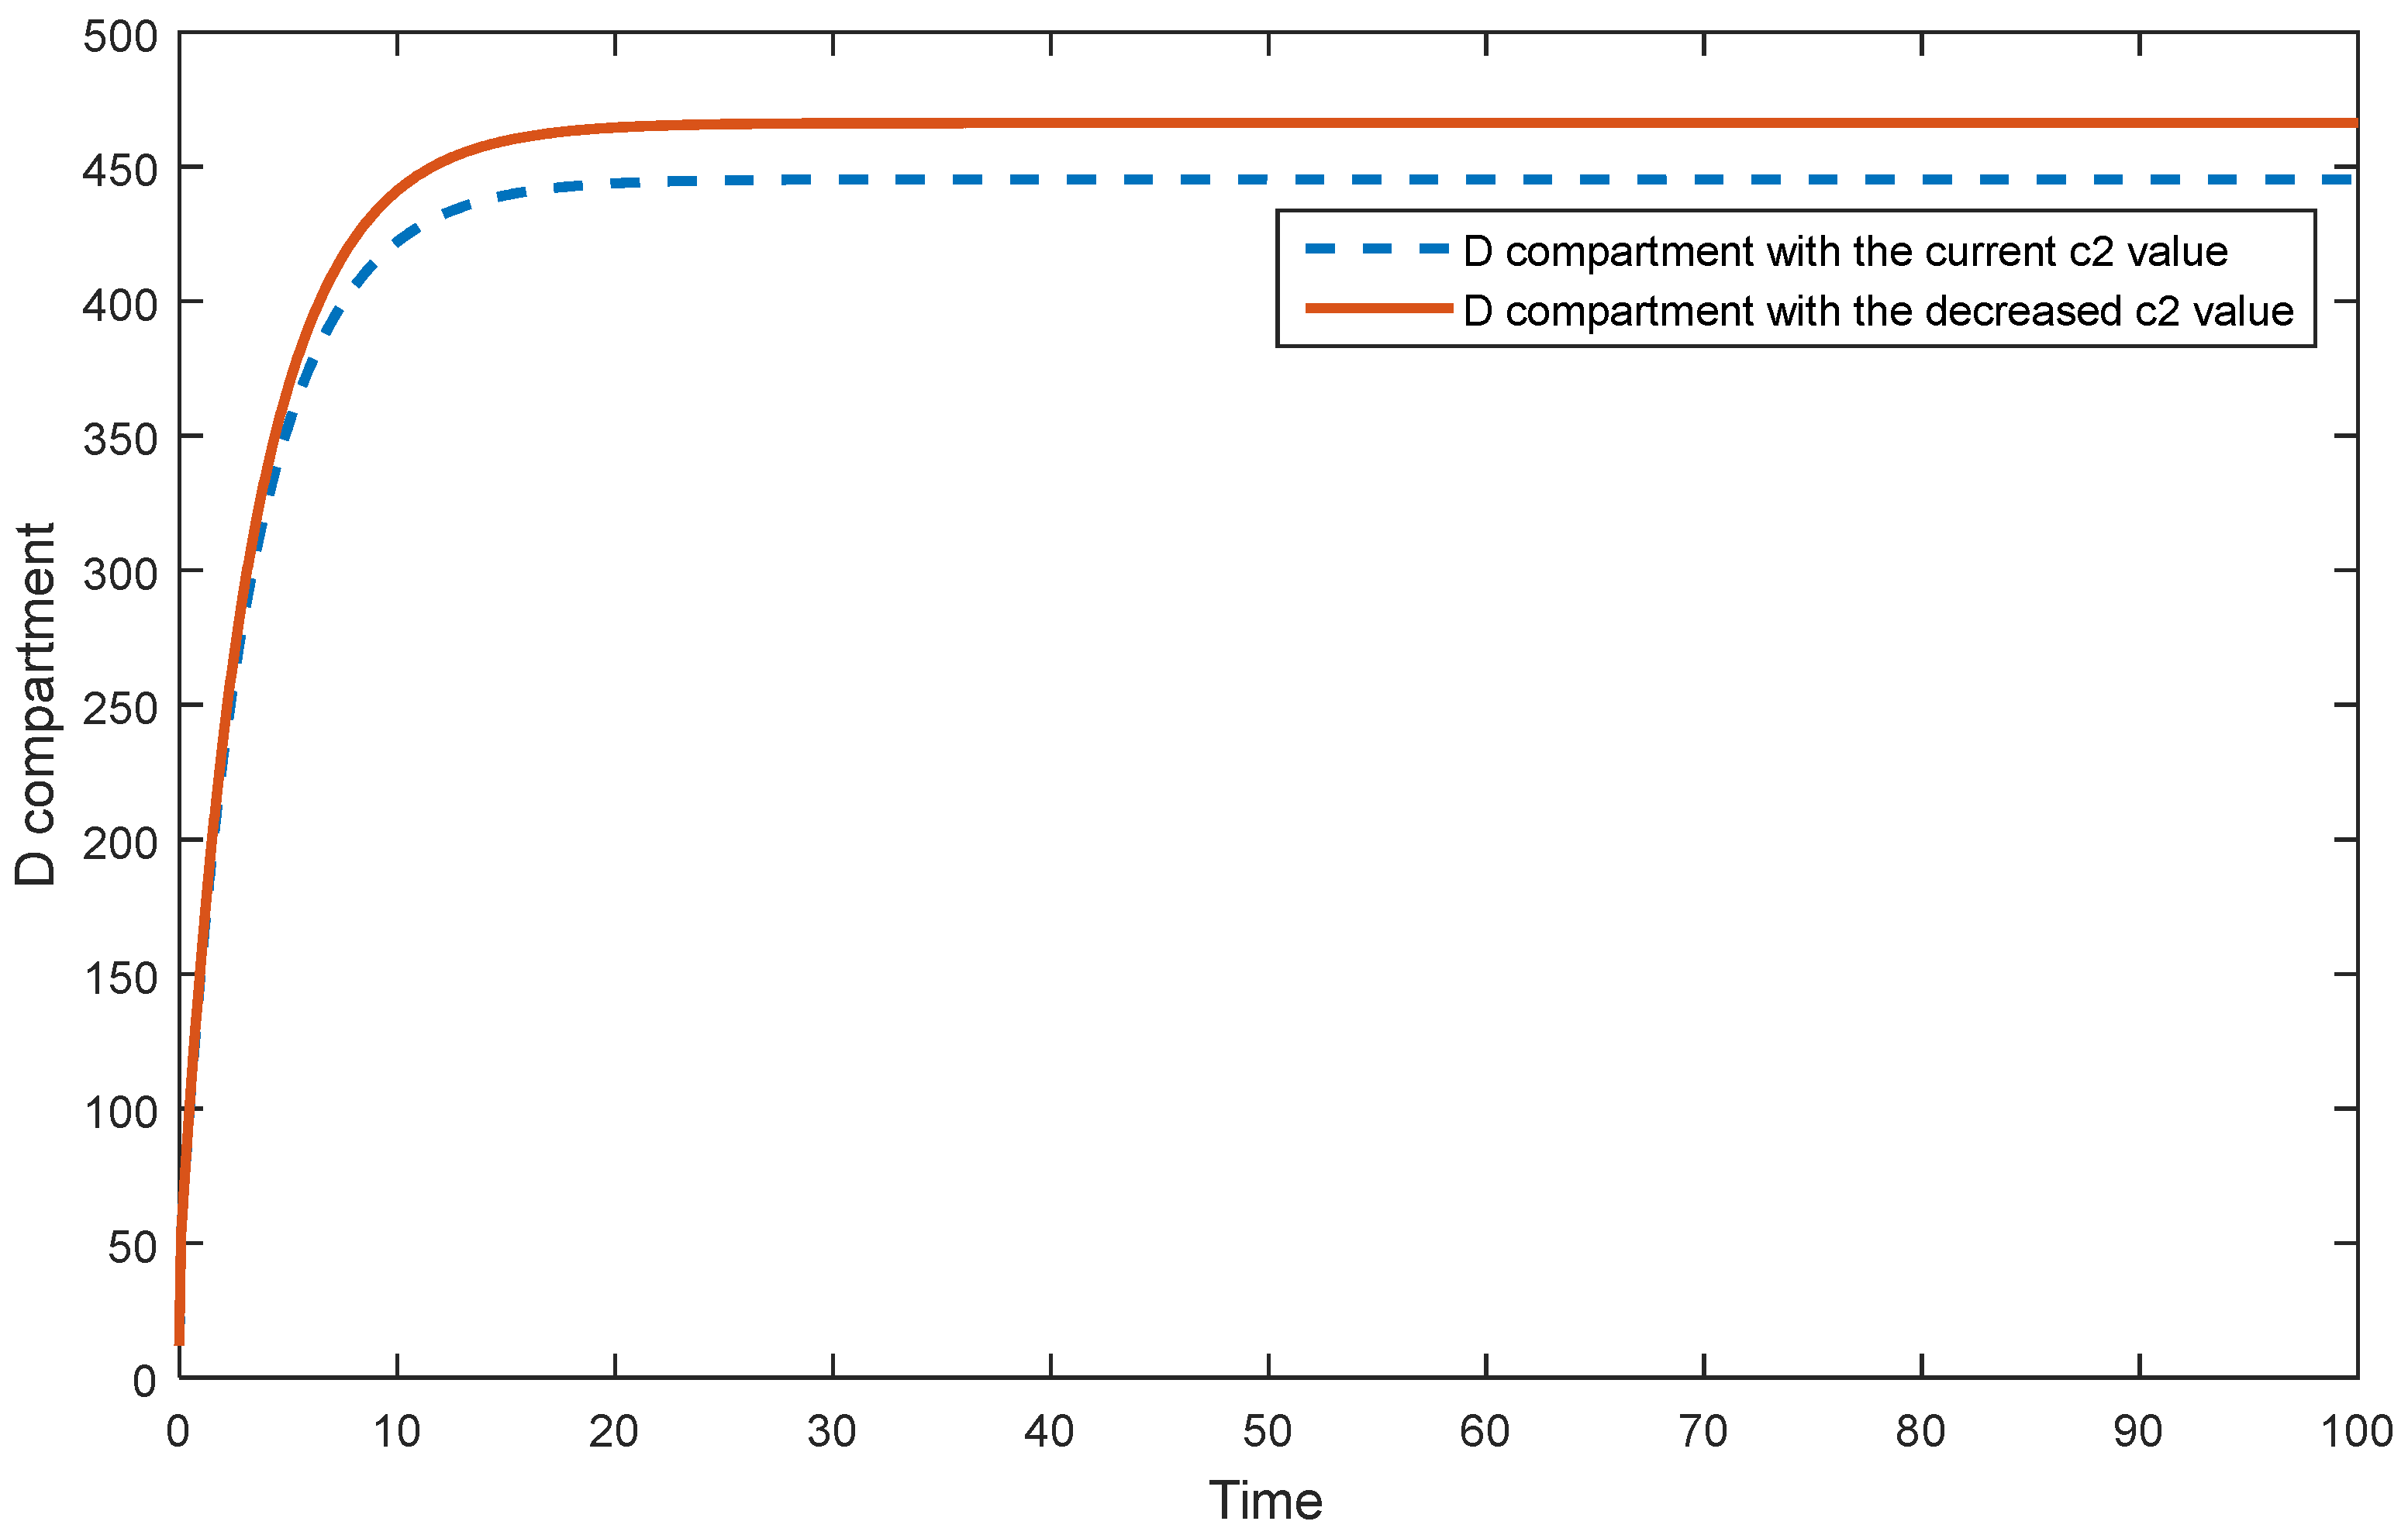
7. Conclusions
Author Contributions
Funding
Data Availability Statement
Acknowledgments
Conflicts of Interest
References
- Martcheva, M. Introduction. In An Introduction to Mathematical Epidemiology, 1st ed.; Springer: New York, 2015; pp. 1–8. [Google Scholar]
- Khoury, M.J.; Beaty, T.H.; Cohen, B.H. Scope and strategies of genetic epidemiology. In Fundamentals of Genetic Epidemiology, 1st ed.; Oxford University Press: New York, 1993; Volume 19. [Google Scholar]
- Gan, W.Q.; Buxton, J.A.; Scheuermeyer, F.X.; Palis, H.; Zhao, B.; Desai, R.; Janjua, N.Z.; Slaunwhite, A.K. Risk of cardiovascular diseases in relation to substance use disorders. Drug Alcohol Depend. 2021, 229, 109132. [Google Scholar] [CrossRef] [PubMed]
- World Health Organization. Cardiovascular diseases (CVDs). Available online: https://www.who.int/news-room/fact-sheets/detail/cardiovascular-diseases-(cvds) (accessed on 29 August 2023).
- United Kingdom National Health Service. Cardiovascular disease. Available online: https://www.nhs.uk/conditions/cardiovascular-disease/ (accessed on 29 August 2023).
- National Cancer Institute. Cancer Statistics. Available online: https://www.cancer.gov/about-cancer/understanding/statistics (accessed on 29 August 2023).
- Imran Khan Cancer Appeal. What is Cancer? Available online: https://www.ikca.org.uk/cancer-information/what-is-cancer/ (accessed on 29 August 2023).
- American Cancer Society. Soft Tissue Sarcoma. Available online: https://www.cancer.org/cancer/types/soft-tissue-sarcoma.html (accessed on 29 August 2023).
- WHO, International Agency for Research on Cancer. Cancer Today. Available online: https://gco.iarc.fr/today/home (accessed on 29 August 2023).
- World Health Organization. Cancer. Available online: https://www.who.int/news-room/fact-sheets/detail/cancer (accessed on 29 August 2023).
- American Cancer Society. Available online: https://www.cancer.org/content/dam/cancer-org/research/cancer-facts-and-statistics/annual-cancer-facts-and-figures/2022/2022-cancer-facts-and-figures.pdf (accessed on 29 August 2023).
- Kalra, S.; Zargar, A.H.; Jain, S.M.; Sethi, B.; Chowdhury, S.; Singh, A. K.; Thomas, N.; Unnikrishnan, A.G.; Thakkar, P.B.; Malve, H. Diabetes insipidus: The other diabetes. Indian J. Endocrinol. Metab. 2016, 20, 9–21. [Google Scholar] [PubMed]
- Chaudhary, N.; Tyagi, N. Diabetes mellitus: An Overview. Int. J. Res. Dev. Pharm. Life Sci. 2018, 7, 3030–3033. [Google Scholar] [CrossRef]
- World Health Organization. Diabetes. Available online: https://www.who.int/news-room/fact-sheets/detail/diabetes (accessed on 29 August 2023).
- Keeling, M.J.; Danon, L. Mathematical modelling of infectious diseases. Br. Med. Bull. 2009, 92, 33–42. [Google Scholar] [CrossRef] [PubMed]
- Alridha, A.H.; Al-Jilawi, A.S.; Alsharify, F.H.S. Review of Mathematical Modelling Techniques with Applications in Biosciences. IJCSM 2022, 3, 135–144. [Google Scholar] [CrossRef]
- White, P.J.; Enright, M.C. Mathematical models in infectious disease epidemiology. Infectious Diseases 2010, 70–75. [Google Scholar] [CrossRef]
- Columbia University Irving Medical Center. Responding to the COVID-19 Pandemic. Available online: https://www.publichealth.columbia.edu/news/responding-covid-19-pandemic (accessed on 29 August 2023).
- Our World in Data. Available online: https://ourworldindata.org/coronavirus (accessed on 29 August 2023).
- Yang, Z.; Zeng, Z.; Wang, K.; Wong, S.S.; Liang, W.; Zanin, M.; Liu, P.; Cao, X.; Gao, Z.; Mai, Z.; Liang, J.; Liu, X.; Li, S.; Li, Y.; Ye, F.; Guan, W.; Yang, Y.; Li, F.; Luo, S.; Xie, Y.; Liu, B.; Wang, Z.; Zhang, S.; Wang, Y.; Zhong, N.; He, J. Modified SEIR and AI prediction of the epidemics trend of COVID-19 in China under public health interventions. J. Thorac. Dis. 2020, 12, 165–174. [Google Scholar] [CrossRef] [PubMed]
- Mwalili, S.; Kimathi, M.; Ojiambo, V.; Gathungu, D.; Mbogo, R. SEIR model for COVID-19 dynamics incorporating the environment and social distancing. BMC Res. Notes 2020, 13, 352. [Google Scholar] [CrossRef] [PubMed]
- Jentsch, P.C.; Anand, M.; Bauch, C.T. Prioritising COVID-19 vaccination in changing social and epidemiological landscapes: a mathematical modelling study. Lancet Infect. Dis. 2021, 21, 1097–1106. [Google Scholar] [CrossRef] [PubMed]
- Matrajt, L.; Eaton, J.; Leung, T.; Brown, E.R. Vaccine optimization for COVID-19: who to vaccinate first? Sci. Adv. 2021, 7, eabf1374. [Google Scholar] [CrossRef] [PubMed]
- Kaymakamzade, B.; Hincal, E.; Gokbulut, N.; Sanlidag, T. Analyzing the Relationship Between Covid-19 and Proportions of Vaccine & Mobility. In Decision Analysis Applied to the Field of Environmental Health. Professional Practice in Earth Sciences; Uzun Ozsahin, D., Uzun, B., Sanlidag, T., LaMoreaux, J., Eds.; Springer: Cham, 2022; pp. 65–76. [Google Scholar]
- Naughton, F.; Ward, E.; Khondoker, M.; Belderson, P.; Minihane, A.M.; Dainty, J.; Hanson, S.; Holland, R.; Brown, T.; Notley, C. Health behaviour change during the UK COVID-19 lockdown: Findings from the first wave of the C-19 health behaviour and well-being daily tracker study. Br. J. Health Psychol. 2021, 26, 624–643. [Google Scholar] [CrossRef] [PubMed]
- Albahri, O.S.; Al-Obaidi, J.R.; Zaidan, A.A.; Albahri, A.S.; Zaidan, B.B.; Salih, M.M.; Qays, A.; Dawood, K.A.; Mohammed, R.T.; Abdulkareem, K.H.; Aleesa, A.M.; Alamoodi, A.H.; Chyad, M.A.; Zulkifli, C.Z. Helping doctors hasten COVID-19 treatment: Towards a rescue framework for the transfusion of best convalescent plasma to the most critical patients based on biological requirements via ml and novel MCDM methods. Comput. Methods Programs Biomed. 2020, 196, 105617. [Google Scholar] [CrossRef] [PubMed]
- Albahri, O.S; Zaidan, A.A.; Albahri, A.S.; Zaidan, B.B.; Abdulkareem, K.H.; Al-qaysi, Z.T.; Alamoodi, A.H.; Aleesa, A.M.; Chyad, M.A.; Alesa, R.M.; Kem, L.C.; Lakulu, M.M.; Ibrahim, A.B.; Rashid, N.A. Systematic review of artificial intelligence techniques in the detection and classification of COVID-19 medical images in terms of evaluation and benchmarking: Taxonomy analysis, challenges, future solutions and methodological aspects. J. Infect. Public Health 2020, 13, 1381–1396. [Google Scholar] [CrossRef] [PubMed]
- Panetta, J.C.; Chaplain, M.A.J.; Adam, J.A. The mathematical modelling of cancer: a review: Mathematical models in medical and health science. In Mathematical models in medical and health science; Webb, G.F. (eds); Vanderbilt University Press, 1998; pp. 281–309. [Google Scholar]
- World Health Organization. Cardiovascular diseases (CVDs). Available online: https://www.who.int/news-room/fact-sheets/detail/cardiovascular-diseases-(cvds) (accessed on 29 August 2023).
- Cancer Research, UK. Worldwide cancer statistics. Available online: https://www.cancerresearchuk.org/health-professional/cancer-statistics/worldwide-cancer#heading-Zero (accessed on 29 August 2023).
- Taylor, C.J.; Ordonez-Mena, J.M.; Roalfe, A.K.; Lay-Flurrie, S.; Jones, N.R.; Marshall, T.; Hobbs, F.D.R. Trends in survival after a diagnosis of heart failure in the United Kingdom 2000-2017: population based cohort study. BMJ 2019, 364, l223. [Google Scholar] [CrossRef] [PubMed]
- Cardiovascular disease. Available online: https://fingertips.phe.org.uk/profile-group/cardiovascular-disease-diabetes-kidney-disease/profile/cardiovascular/data#page/4/gid/1938133107/pat/159/par/K02000001/ati/15/are/E92000001/iid/241/age/187/sex/4/cat/-1/ctp/-1/yrr/1/cid/4/tbm/1 (accessed on 29 August 2023).
- Salehidoost, R.; Mansouri, A.; Amini, M.; Yamini, S.A.; Aminorroaya,A. Diabetes and all-cause mortality, a 18-year follow-up study. Sci. Rep. 2020, 10, 3183. [Google Scholar] [CrossRef] [PubMed]
- Endemic (epidemiology). Available online: https://www.wikidoc.org/index.php/Endemic_(epidemiology) (accessed on 29 August 2023).
| Variables | Descriptions |
|---|---|
| Susceptible Individuals | |
| Cancer Patients |
| Parameters | Descriptions |
|---|---|
| Recruitment rate | |
| Transmission rate of hereditary | |
| Rate of obese individuals being cancer | |
| Rate of smokers being cancer | |
| Recovery rate | |
| Negative effect of Covid-19 | |
| Disease-caused death rate | |
| Natural death rate |
| Variables | Descriptions |
|---|---|
| Susceptible Individuals | |
| Heart disease patients | |
| Diabetes patients |
| Parameters | Descriptions |
|---|---|
| Recruitment rate | |
| Rate of smokers being a heart patient | |
| Rate of obese individuals being a heart patient | |
| Rate of obese individuals being diabetes | |
| Transmission rate of hereditary | |
| Negative effect of Covid-19 | |
| Survival rate of diseases | |
| Natural death rate | |
| Heart-disease caused death rates | |
| Diabetes caused death rates | |
| Transmission rate from to | |
| Transmission rate from to |
Disclaimer/Publisher’s Note: The statements, opinions and data contained in all publications are solely those of the individual author(s) and contributor(s) and not of MDPI and/or the editor(s). MDPI and/or the editor(s) disclaim responsibility for any injury to people or property resulting from any ideas, methods, instructions or products referred to in the content. |
© 2023 by the authors. Licensee MDPI, Basel, Switzerland. This article is an open access article distributed under the terms and conditions of the Creative Commons Attribution (CC BY) license (http://creativecommons.org/licenses/by/4.0/).


