Preprint
Article

Camphor Sulfonimine Compounds: Bottom-Up Design of MOF’s from Organic Frameworks Based on X-rayS and DFT-D3

Altmetrics

Downloads

96

Views

35

Comments

0

A peer-reviewed article of this preprint also exists.

Submitted:

25 September 2023

Posted:

26 September 2023

You are already at the latest version

Alerts
Abstract
DFT-D3 calculations based on structural X-ray diffraction data obtained for 3-oxo-camphorsulfonyl imine (1), camphorsulfonyl chloride (2) and seven camphor sulfonimines (O2SNC10H13NR, L1-L7) from which L2 (R=4-OHC6H4), L4 (R=4-ClC6H4) and L6 (R=3,5-(CH3)2C6H3) are new, provide information into the intra and inter molecular interactions with concomitant elucidation of the supramolecular arrangement of the compounds. The DFT D3 calculations performed in small clusters of 2 or 3 molecular units reproduce the interactions observed by X-ray analyses showing that as a general trend the structural arrangement of the molecules is driven by electronic rather than by packing parameters. In all compounds the self-assembly of 3D structures involves the sulfonyl imine group ( NSO2) either to establish hydrogen bonds, through the oxygen atoms or non-classic oxygen-aliphatic hydrogen or non-bonding interactions (NBI) which also involve the sulfonyl oxygens. Interestingly, the camphor sulfonimine compounds (L2, L3) having protic groups (R=C6H4X: X=OH, L2 or X=NH2, L3) at the aromatic imine substituents (=NR) present an extra π-π stacking which is absent in the other compounds aromatic derivatives. The X-ray analysis shows that all the reported camphor sulfonimine compounds display the E configuration with respect to the imine substituent (R). The study of the redox behavior of the compounds by cyclic voltammetry allows an insight into the solution properties of the compounds and the rationalization of the molecular interactions that stand in the solid and solution states. Camphor sulfonimine compounds (L) display appropriate binding atoms to coordinate transition metals. The herein results show that monodentate coordination through the nitrogen atom of the sulfonimine 5-membered ring to the {Ag(NO3)} metal center is favored. When this imine nitrogen atom is not itself involved in the Organic Framework DFT-D3 calculations shows that the complexation does not affect the non-covalent interactions that are reproduced in the MOF structure.
Keywords: 
Subject: Chemistry and Materials Science  -   Theoretical Chemistry

1. Introduction

The molecular structure of coordination compounds is formed by organic and inorganic moieties that combine to form new metal-ligand interactions. The formation of the new compounds can involve a major change into the pre-existing structural arrangement of the ligand or the metal precursors or, be shaped through binding of one of them, into the pre-organized structures of the other without a major reorganization.
In the case of complexes based on neutral ligands, covalent dative bonds are established involving the ligand heteroatoms lone pair (e.g. N, O, S) without change in the metal oxidation state or modification of the ligand composition. That is the case of camphor sulfonimines (RNC10H13NSO2) that typically bind the metal through the nitrogen lone pair (=NSO2) forming dative bonds that in some cases are reinforced by Van der Waals interactions (non-bonding interactions, NBI) involving the imine nitrogen atom (=NR) [1,2,3].
Pre-existing intermolecular NBI in the organic or inorganic scaffolds can be maintained or be broken within the formation of the coordination compound. If the NBI remain, the coordination compound eventually acquires a polymeric character. NBI play a significant role in the structural, reactivity and selectivity of the coordination compounds [4,5] and are referred as being the primary transport mechanism by which thermal conductivity is increased in cross-linked polymers [6].
In some cases a structure/reactivity relationship can be established in complexes [7,8] allowing properties prediction based on the structure, e.g. biological and/or catalytic properties of camphor sulfonimine coordination compounds. [3,9] Unfortunately, the structural analysis of coordination compounds based on X-ray diffraction is sometimes impossible due to no suitable crystal are obtained. However, if X-ray data on the organic moieties exists, it is possible to predict through computational calculations the structure of the derived coordination compounds. Based on the structural arrangement of a set of camphor sulfonimines, some insights into the structural arrangement of several coordination compounds frameworks as well as the electronic or packing effects being predominant in the camphor sulfonimines.

2. Results and discussion

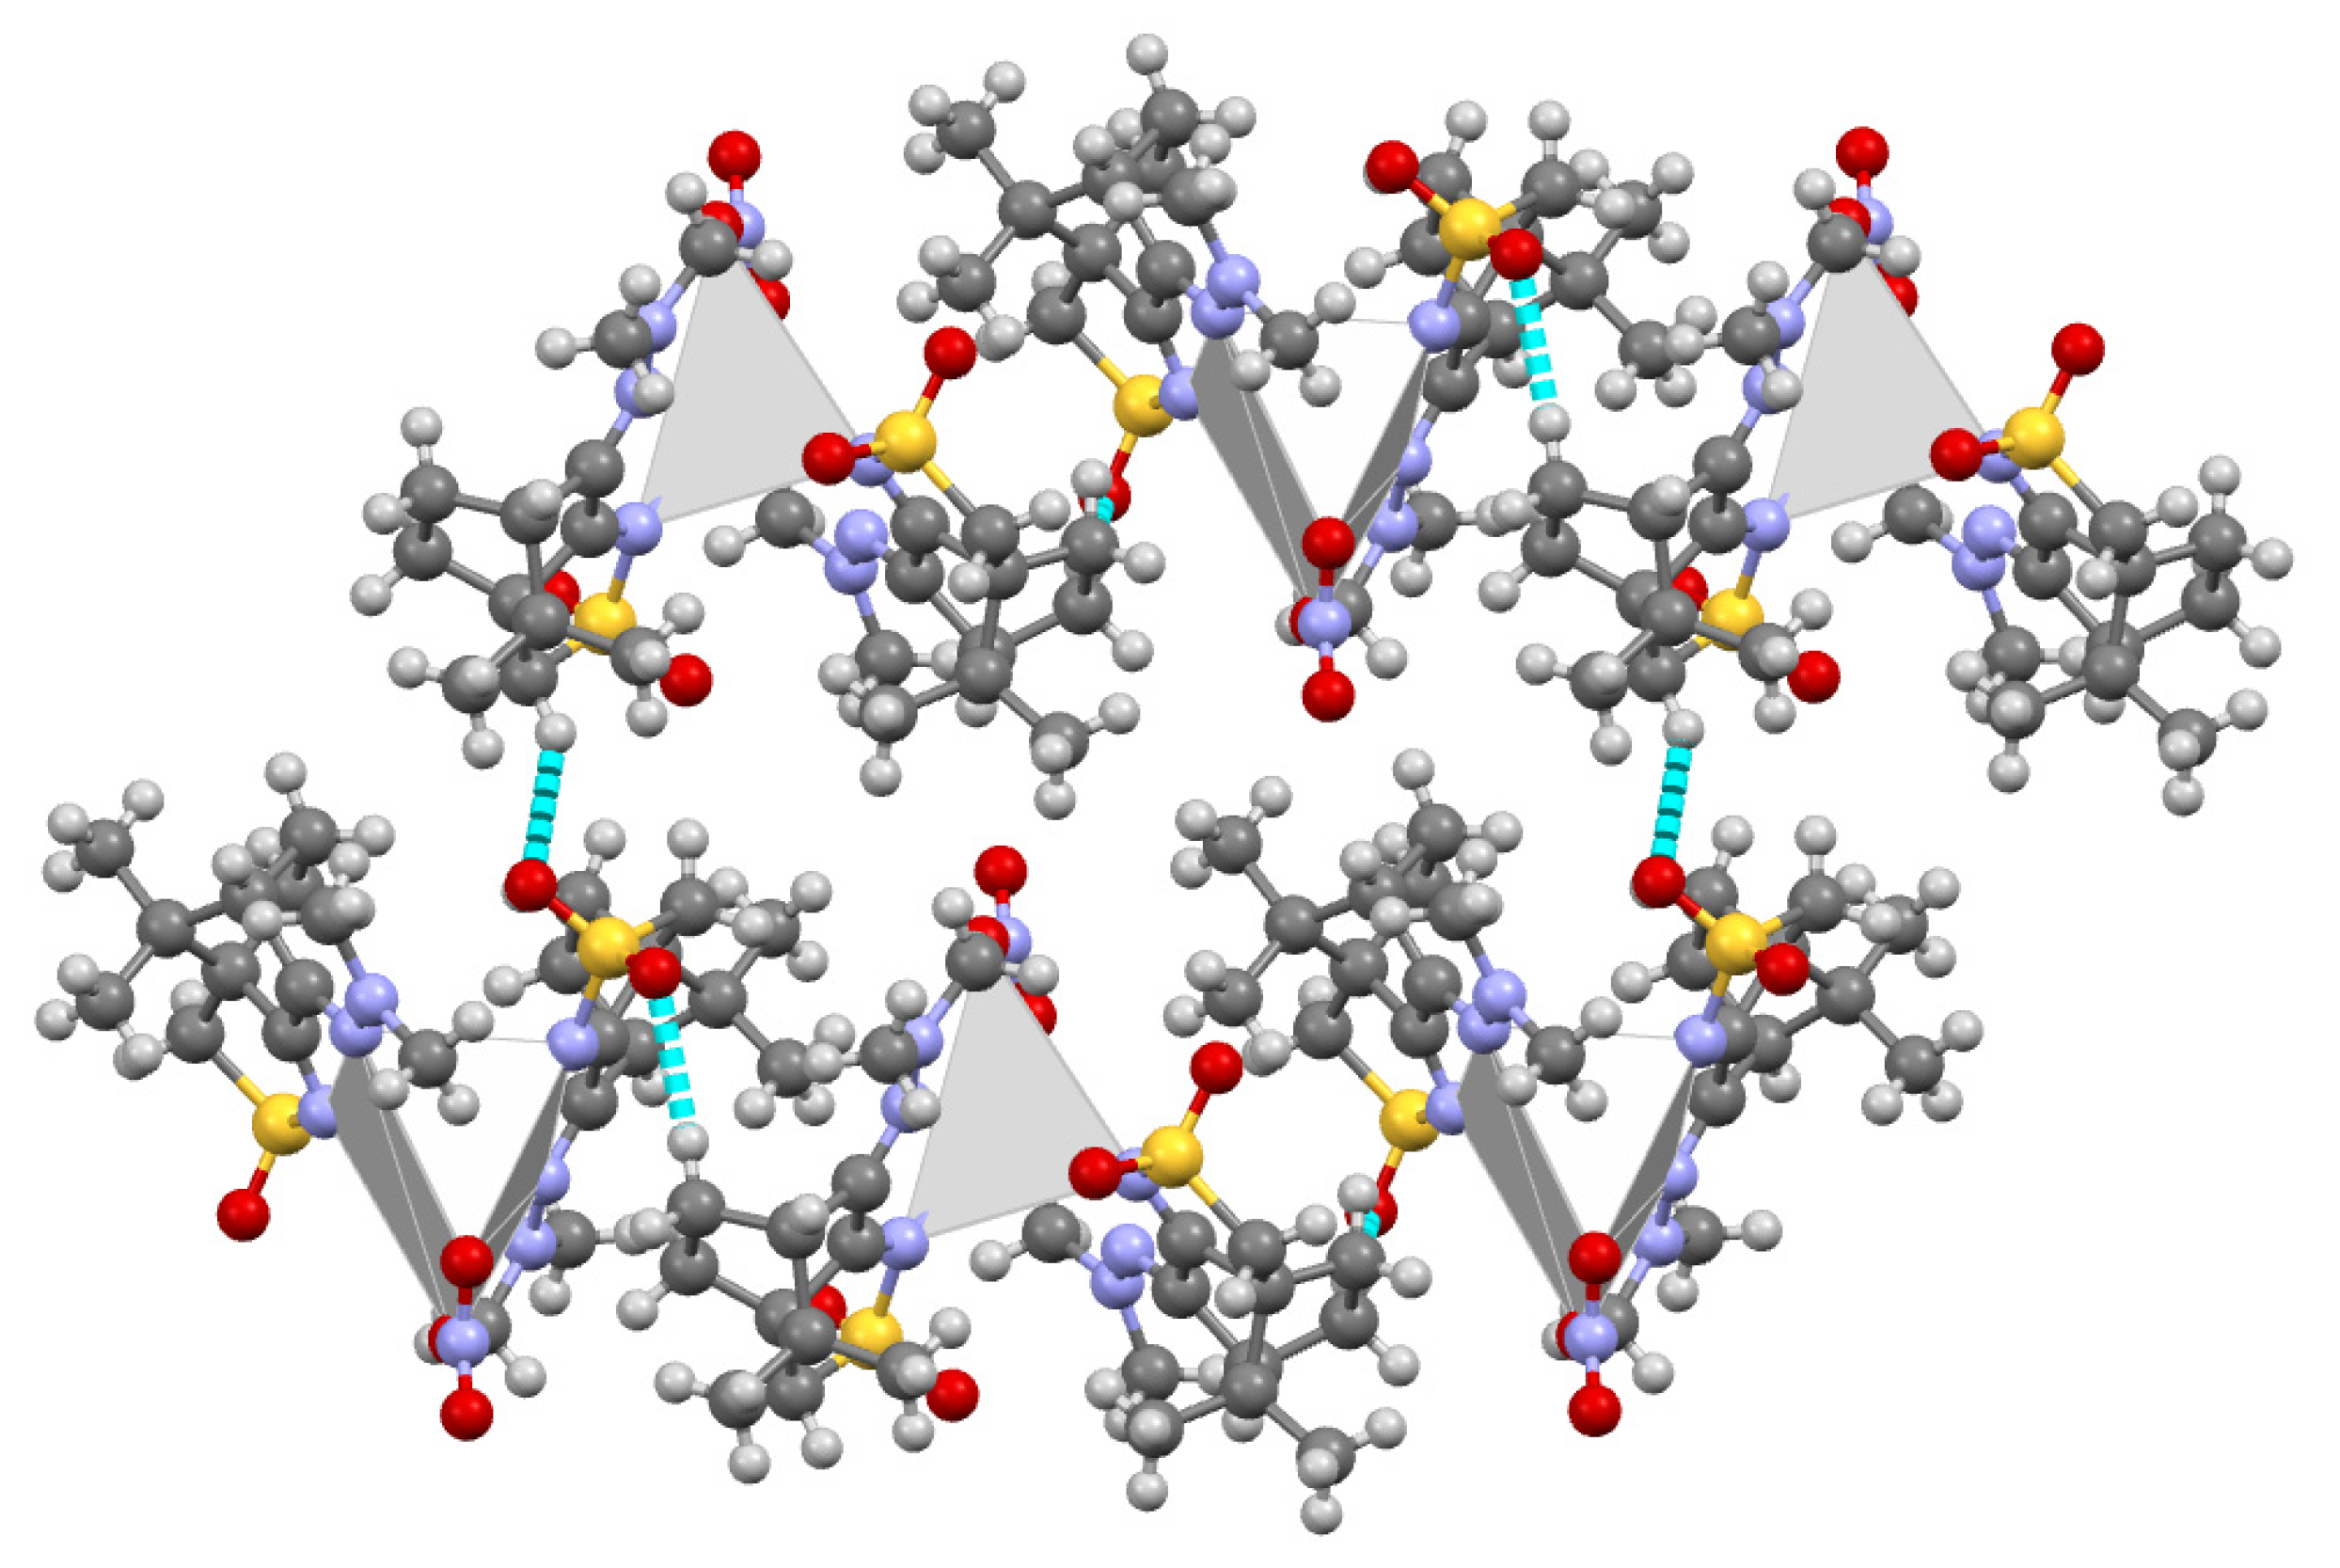
Two new coordination compounds [Ag(NO3)L2] (C1: L6 and C2: L7) were synthesized (see experimental) from reaction of AgNO3 with camphor sulfonimines: 3,5-Me2C6H3C10H13SO2 (L6) and C6H5C10H13SO2 (L7) which enlarge the pool of [Ag(NO3)Ln] (n=1, 2) camphor sulfonimine complexes with potential biological applications as anticancer or antimicrobial agents.[3,10] Unfortunately, the structure of these two camphor sulfonimine Ag(I) complexes such as that of many others could not be confirmed by X-ray diffraction analysis since no suitable crystals could be obtained. Therefore, calculations based on X-ray data obtained for the ligands can help to get insight into the structural arrangement of the complexes. In one case, data obtained by X-rays showed that [Ag(NO3)L2] (R=NMe2) arranges as a calix (Scheme 1).[3]

2.1. Synthesis of camphor sulfonimines

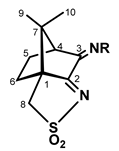
The camphor sulfonimine compounds (RNC10H13NSO2: L1, R=OH; L2, R=4-OHC6H4; L3, R=4-NH2C6H4; L4, R=4-ClC6H4; L5, R=4-CH3C6H4; L6, R=3,5-(CH3)2C6H3; L7, R=C6H5) were obtained by condensation (Scheme 2, right) of the convenient primary amine (H2NR) with (1S)-3-oxo-camphorsulfonyl imine (1). Precursor 1 was obtained from camphor sulfonic acid through a sequential process that involves formation of compound 2 (Scheme 2, left) and ends on the oxidative annulation of a third ring the bicyclic camphor precursor.
From the camphorimine species under study (L1- L7), four are new (L1, L2, L4 and L6) and were characterized by conventional analytical and spectroscopic techniques (FT-IR, 1H NMR, 13C NMR and 2D NMR). The remaining compounds were just recrystallized to obtain single crystals. The structural arrangement of all compounds was then studied by X-ray diffraction analysis. Based on the X-ray data, the intra and inter molecular NBI were predicted by DFT-D3. Therefore, the supramolecular arrangement of compounds 1, 2 and the camphor sulfonimines L1- L7 was elucidated.

2.2. Structural arrangement predicted by DFT-D3

Compounds 1 and 2

The X-ray data obtained for compound 1 indicates that a 3D helicoidal packing exists around the 31 crystallographic axes due to non-conventional oxygen∙∙∙hydrogen (aliphatic) NBI (Figure 1a). DFT-D3 calculations, performed in a subset dimer of 1, confirm the observed NBI and predict them as even stronger than those experimentally observed by X-ray analysis, as illustrated by shorter distances (Figure 2b).
For 2, calculations were based on the X-ray data reported by others.[11] The X-ray shows a zig-zag 1D structural arrangement due to chloride-oxygen intermolecular NBI established by the pendant sulphonyl chloride (SO2Cl) groups in adjacent molecules (Figure 3). Such type of cooperative intermolecular S-Cl∙∙∙O interaction was previously discussed[12] on the basis of the S-Cl∙∙∙O and S-O∙∙∙Cl angles (θ) and classified (Figure 3, insert) as type I (θ12) or type II (θ1=180ᵒ, θ2=90ᵒ).[13]
Such as for 1, DFT-D3 calculations for 2 were carried out in a subset dimer of the structural arrangement found by X-ray diffraction analysis. Once more, the output data shows good agreement between experimental and calculated values (Table 1), in agreement with the electrostatic directionality of the interactions.

2.3. Camphor sulfonimines (L1-L7)

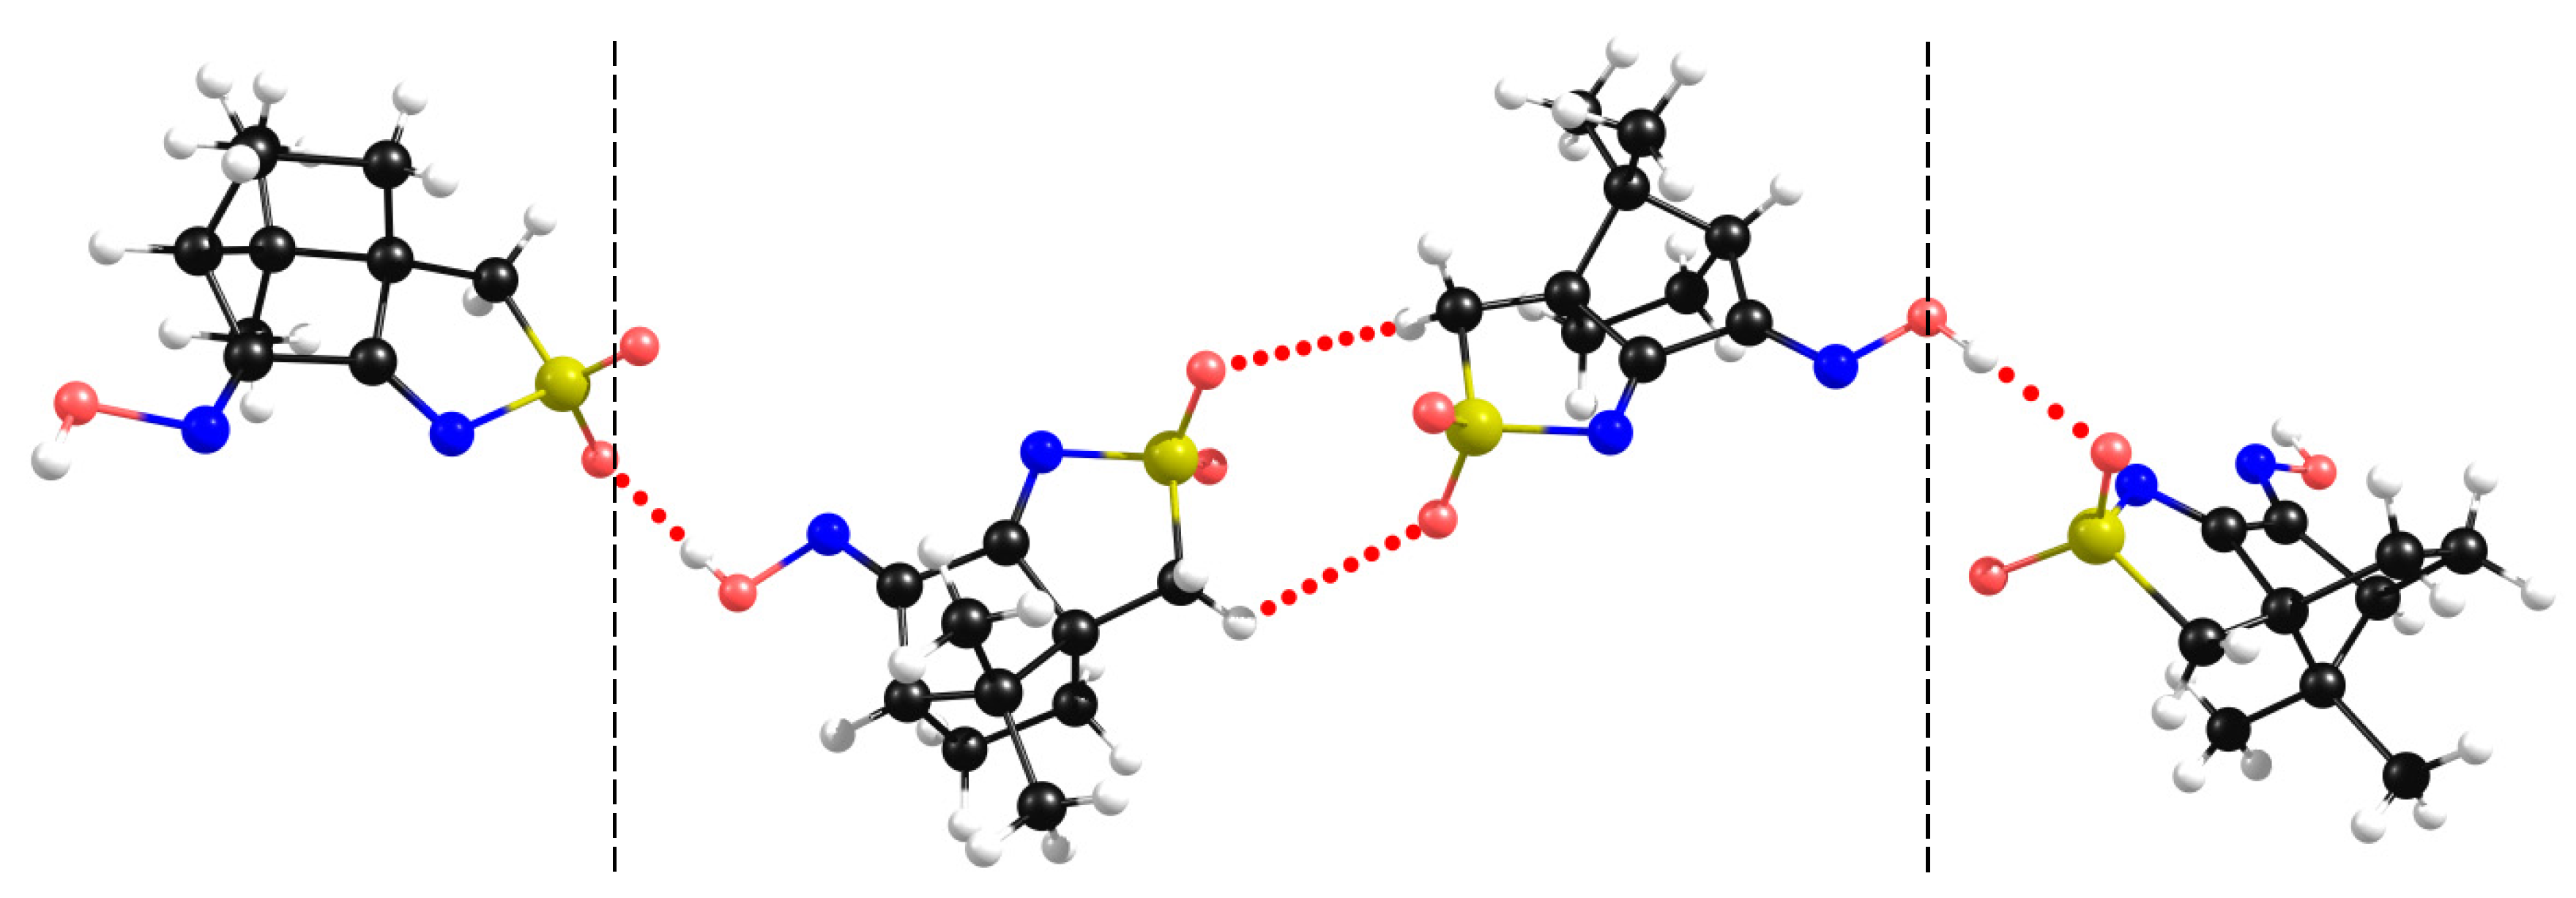
The X-ray data collected for the sulfonimine compounds L1 to L7 show different packing motives according to the imine substituent (R). In L1 (R=OH) the asymmetric unit is formed by two structurally different molecules as shown in Figure 4 (center) since chirality prevents the existence of an inversion center.
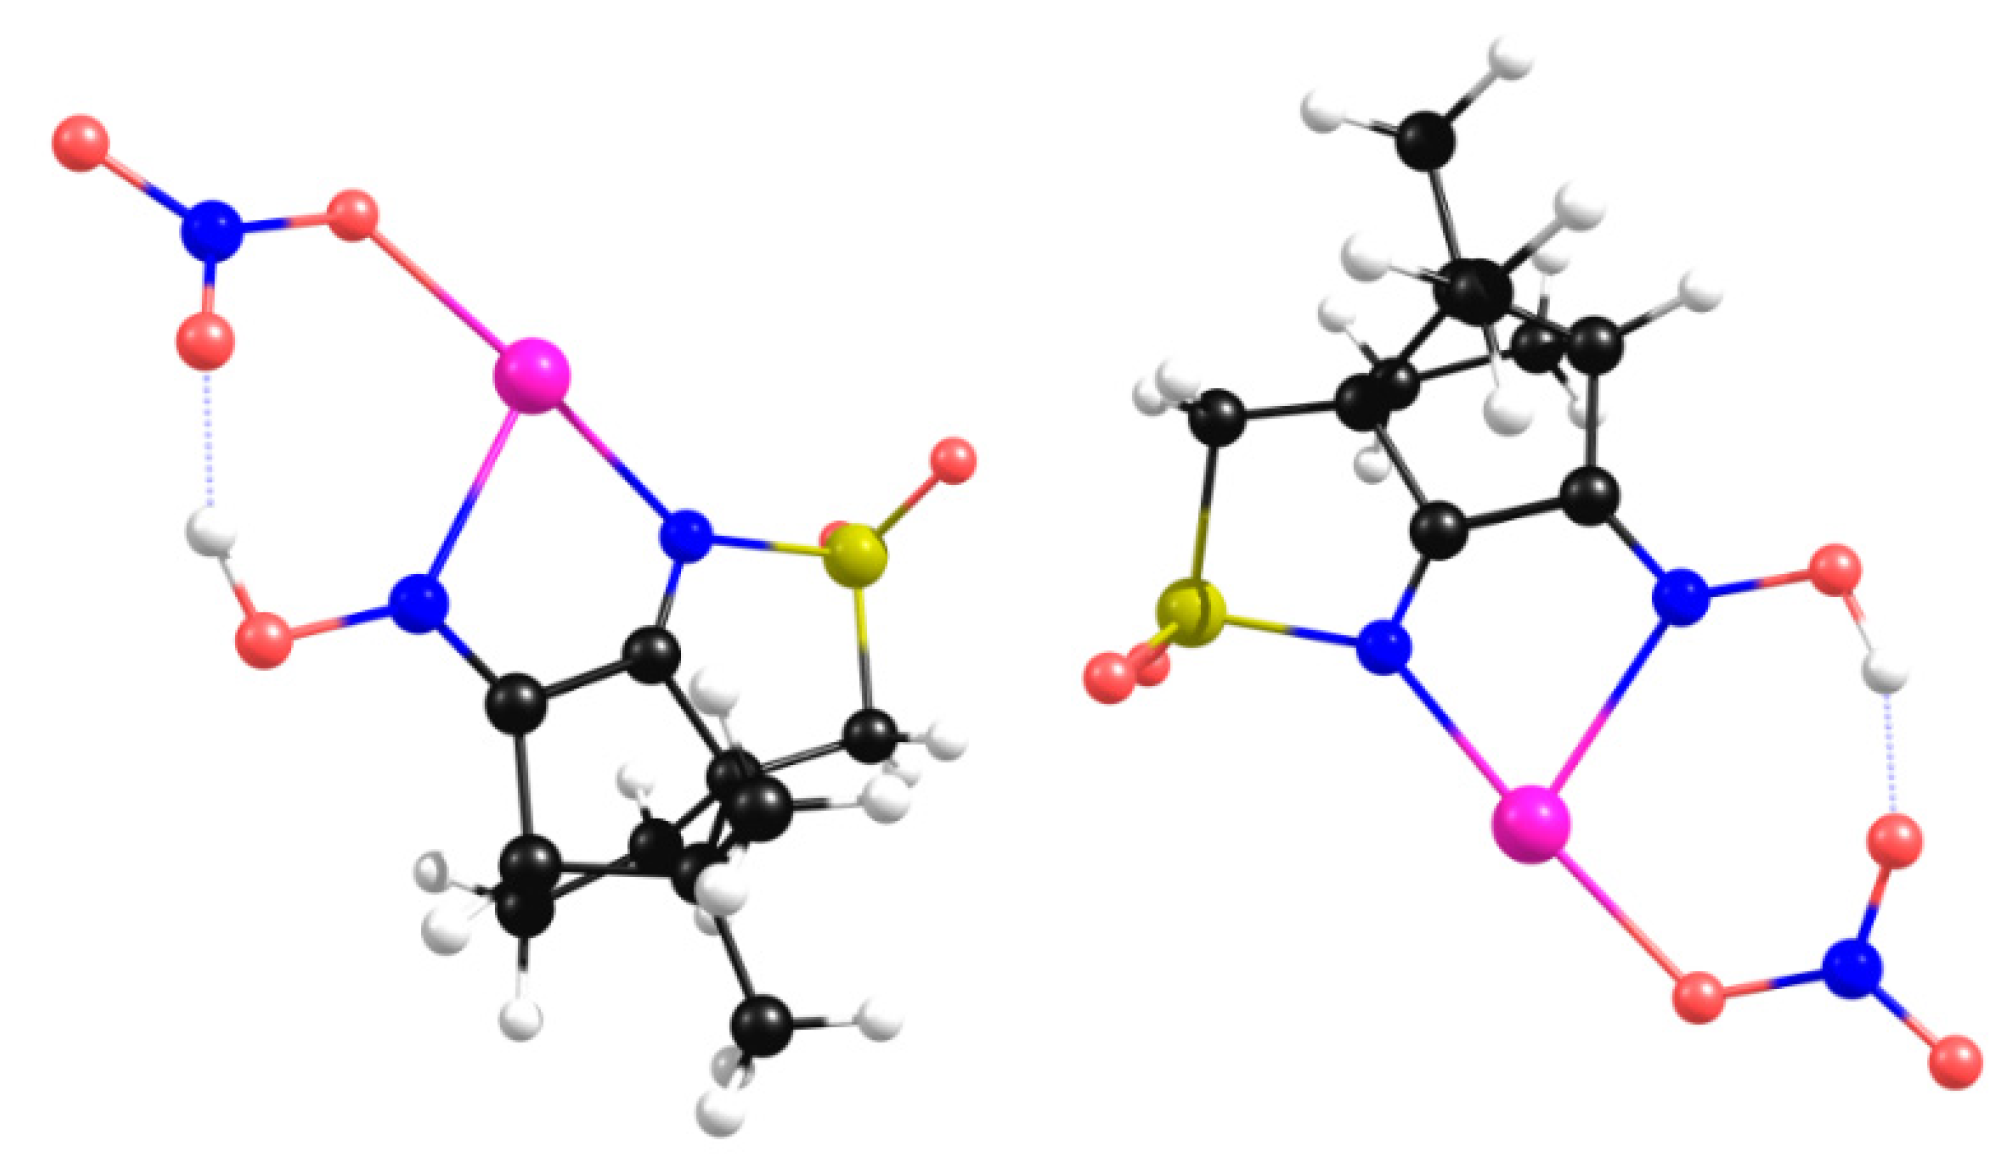
The X-ray data, shows that at the “dimeric” asymmetric unit, the NBI are type I (θ12, i.e. S-O∙∙∙H=C-H∙∙∙O = 108ᵒ) while the NBI established between neighbor asymmetric units (involving the sulfonimine oxygen atom and the hydrogen hydroxyl atom) are of type II (θ1≠ θ2, i.e. S-O∙∙∙H=109ᵒ and O-H∙∙∙O=171ᵒ). The DFT-D3 calculations corroborate the type II nature of this NBI (Figure 5, left) but in what concerns the asymmetric unit DFT-D3 calculations predict type II NBI (Figure 5, right) in contrast with experimentally observed by X-ray diffraction. Such results indicate that NBI type I experimentally observed are due to packing constraints rather than to electrostatic effects.
From Figure 4 and Figure 5, it comes out that the asymmetric unit remains unchanged both experimental and in DFT-D3 calculations with the two nitrogen atoms not involved in NBI and thus available for complexation with the metal center AgNO3. The introduction of the metal center in the calculations (Figure 6) confirms that a MOF can form through coordination of the cyclic imine nitrogen atom to the metal, keeping the 1D chain of the organic framework (OF).
Camphor sulfonimine compounds with aromatic substituents (R, Scheme 2) at the imine group (L2 to L7), display self-assembly behaviors quite different from L1 (R=OH).
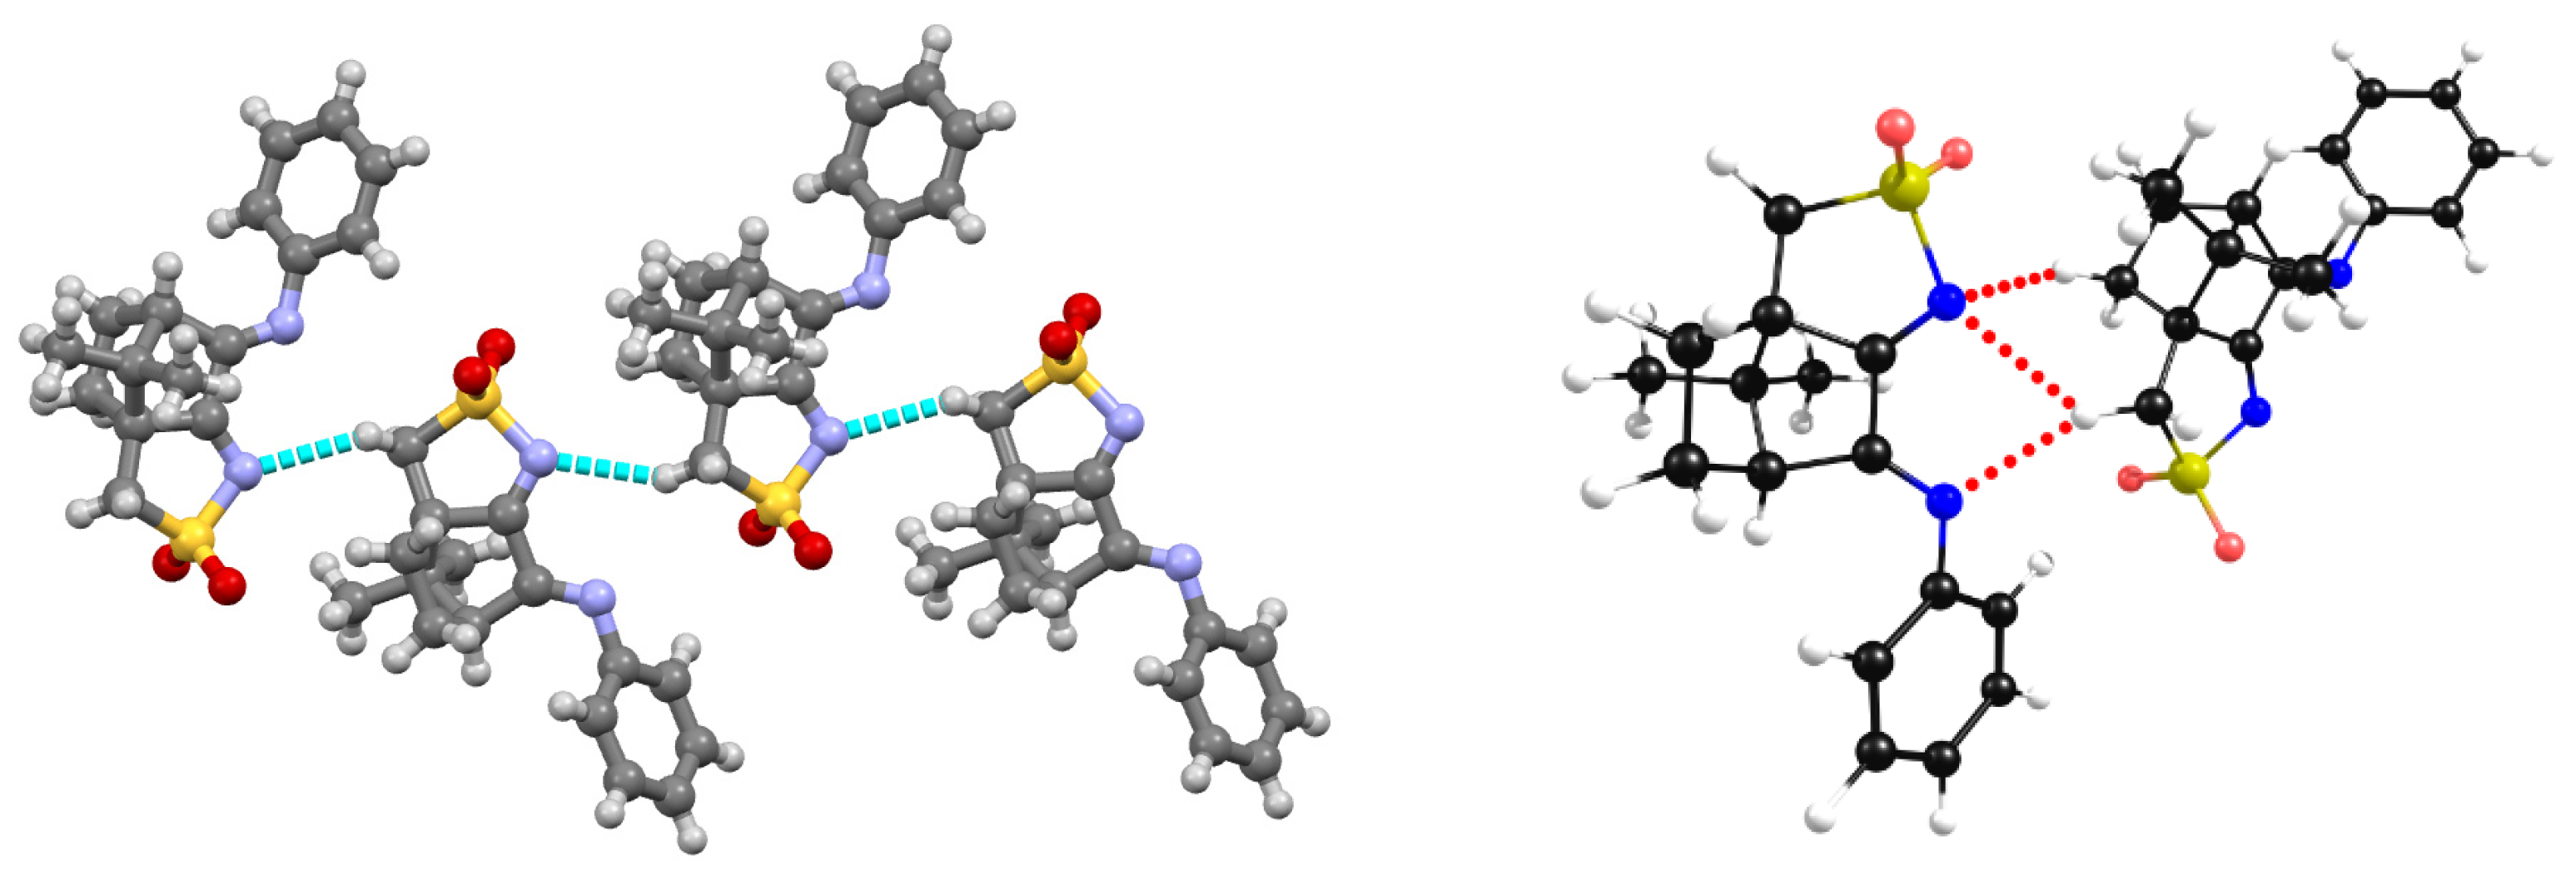
A 1D assembly exists in L4 (R=4-ClC6H4), L5 (R=4-CH3C6H4), L6 (3,5-(CH3)2C6H4) and L7 (R=C6H5) which is formed by non-conventional NBI established between the nitrogen atom of the -SO2N- group and one of the hydrogen atoms of the methylene (CH2) group of the five membered sulfonimine ring of a neighbor molecule. As a representative example, the X-ray diffraction data is displayed for L7 (Figure 7, left). The results from the DFT-D3 calculations agree well with the experimental obtained X-rays data (Figure 7, right). Such as for 1 the predicted NBI distances are shorter than the experimentally measured pointing to stronger electronic interactions.
In the aromatic substituted camphor sulfonimines (L4 to L7) the cyclic nitrogen imine atom of the 1D organic framework is involved in NBI which means that complexation would break down the self-assembly trends observed in the OF. So, MOFs are expected to have different frameworks than those observed in the ligands L4 to L7.
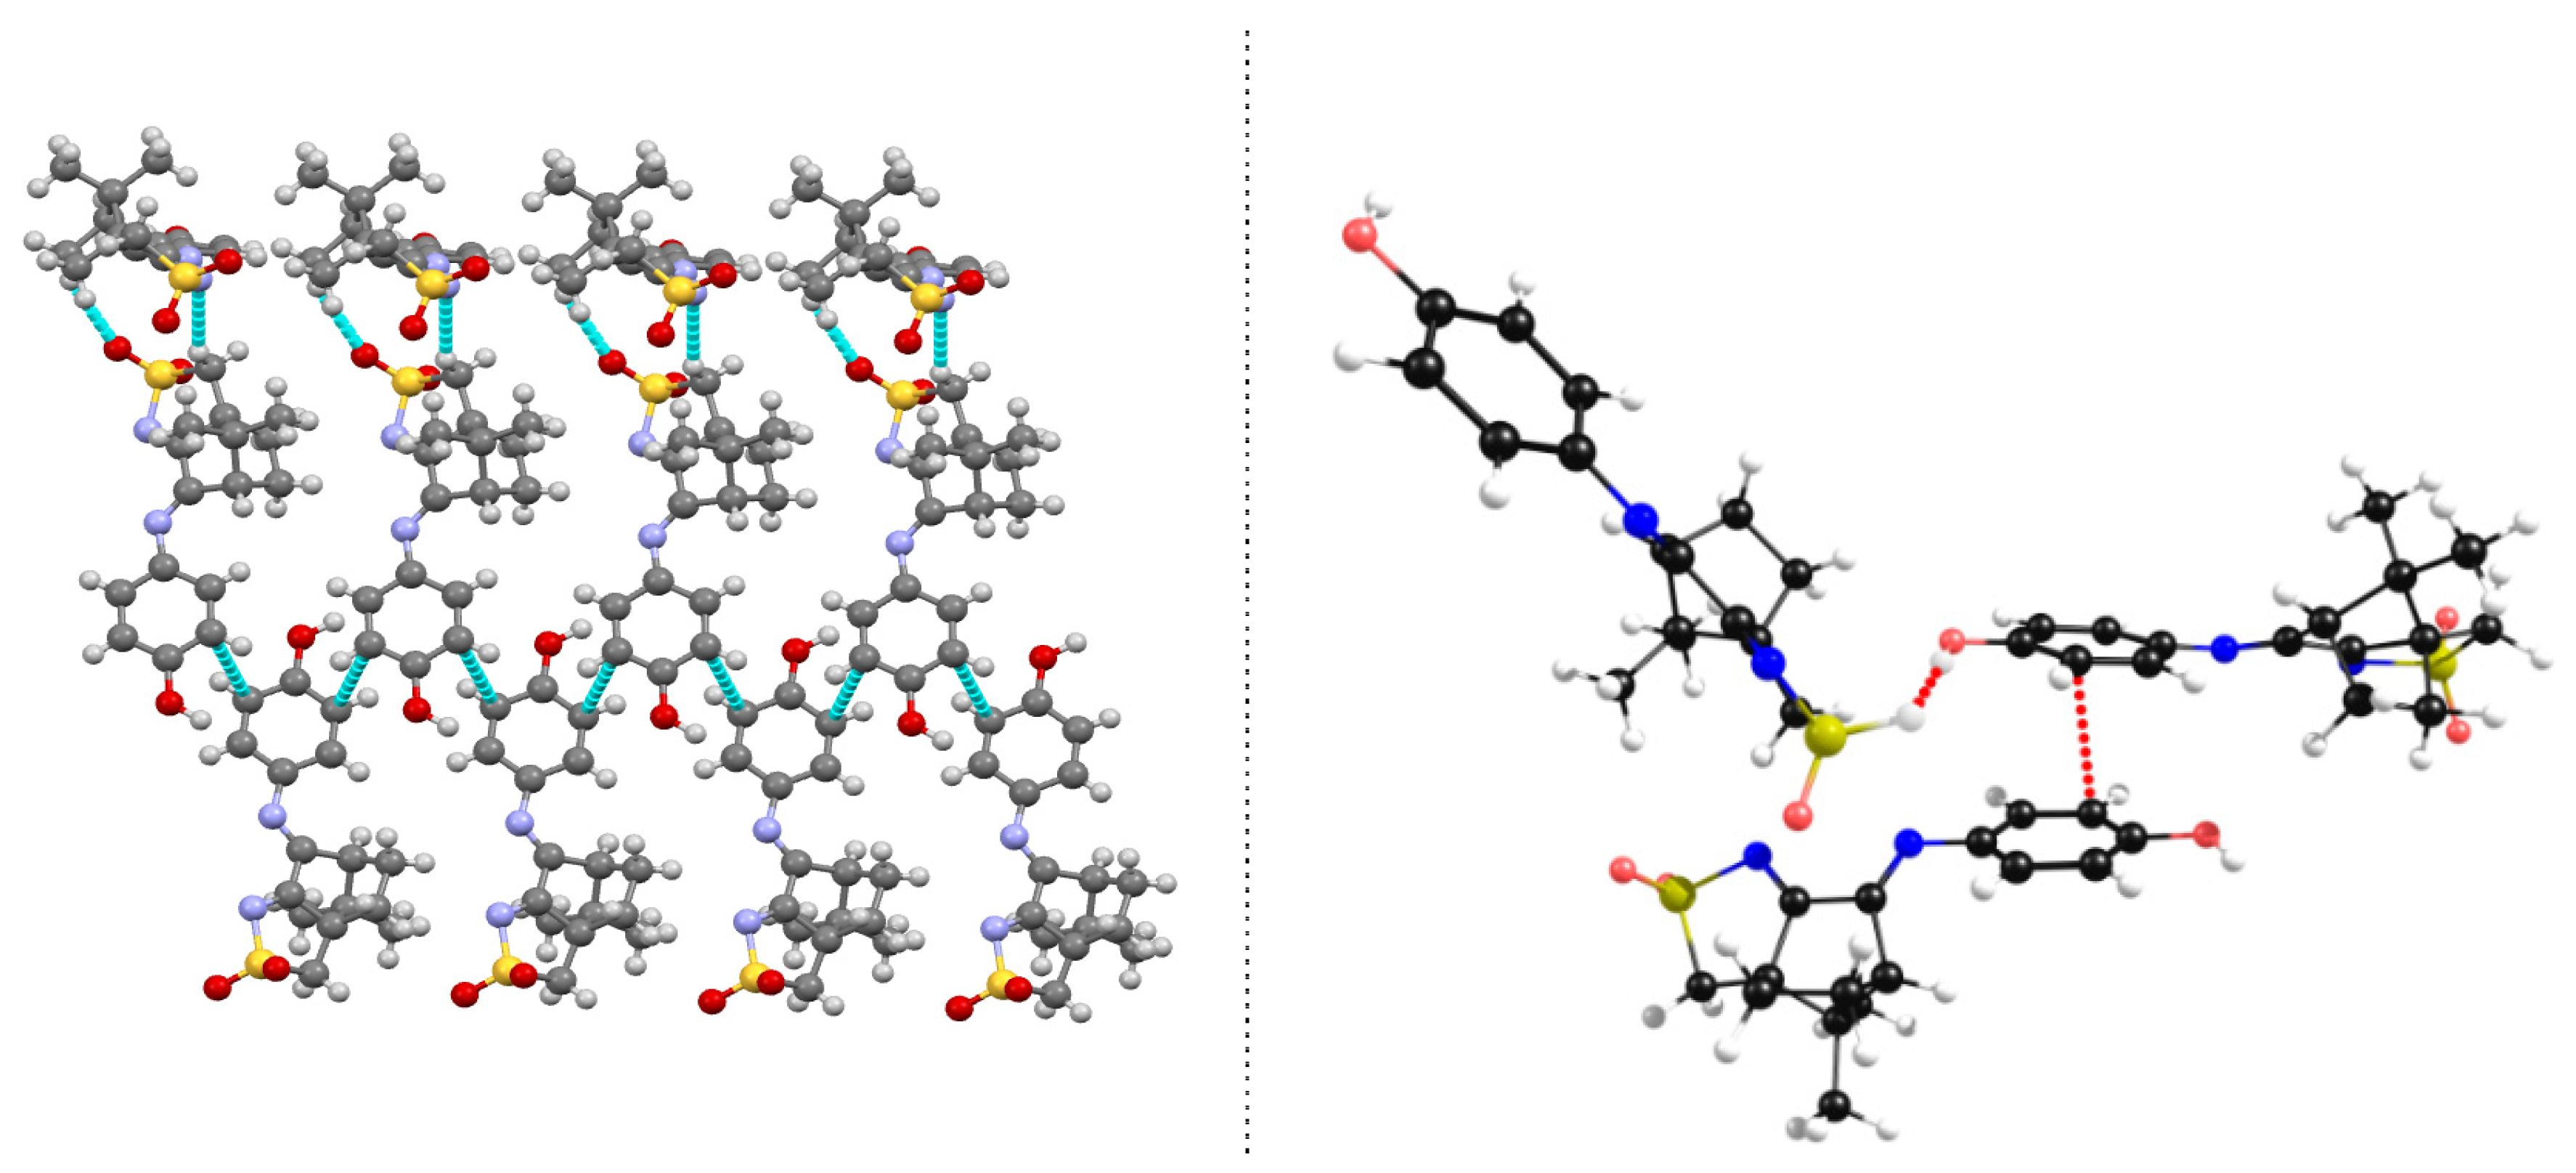
At the camphor sulfonimines bearing a protic substituent (R=OH in L2 or R=NH2 in L3) at the -NR imine group (Scheme 2), the characteristics of the NBI differ from those observed for L4-L7. In L2 and L3 the NBI are of the stacking π-π type, established between the aromatic carbon atoms of two distinct asymmetric units occupying the ortho positions relative to the heterogeneous (N or O) atoms, as depicted for L2 (Figure 8, left). In L2 and L3 NBI involving the sulfonyl imine group (not observed for L4-L7) are established by a symmetry related chain of molecules (Figure 8, left). These additional interactions were included in the DFT-D3 calculations (Figure 8, right) to get consistency between X-ray and calculated structures. Here again, such as for L1 the two nitrogen imine atoms are free to complex the AgNO3 metal center to form a MOF mimicking the self-assembly characteristics of the corresponding OF.

2.4. Redox properties

Packing and electronic parameters have distinct effects on the properties of the molecules. While the electronic characteristics persist no matter the physical state (solid or solution), packing essentially drives the solid-state properties.
The above results show that the structural arrangement in camphor sulfonimines (L2 - L7) and in compounds 1 and 2 is essentially directed by electronic parameters. In contrast, packing plays an important role in the supramolecular arrangement of L1, by imposing a type I NBI geometry (see above).
In order, to get insights whether a correlation exists between the structural parameters and the redox potentials and try to ascertain whether NBI interactions remain in solution, the electrochemical behavior of the L1-L7 compounds was studied by cyclic voltammetry.
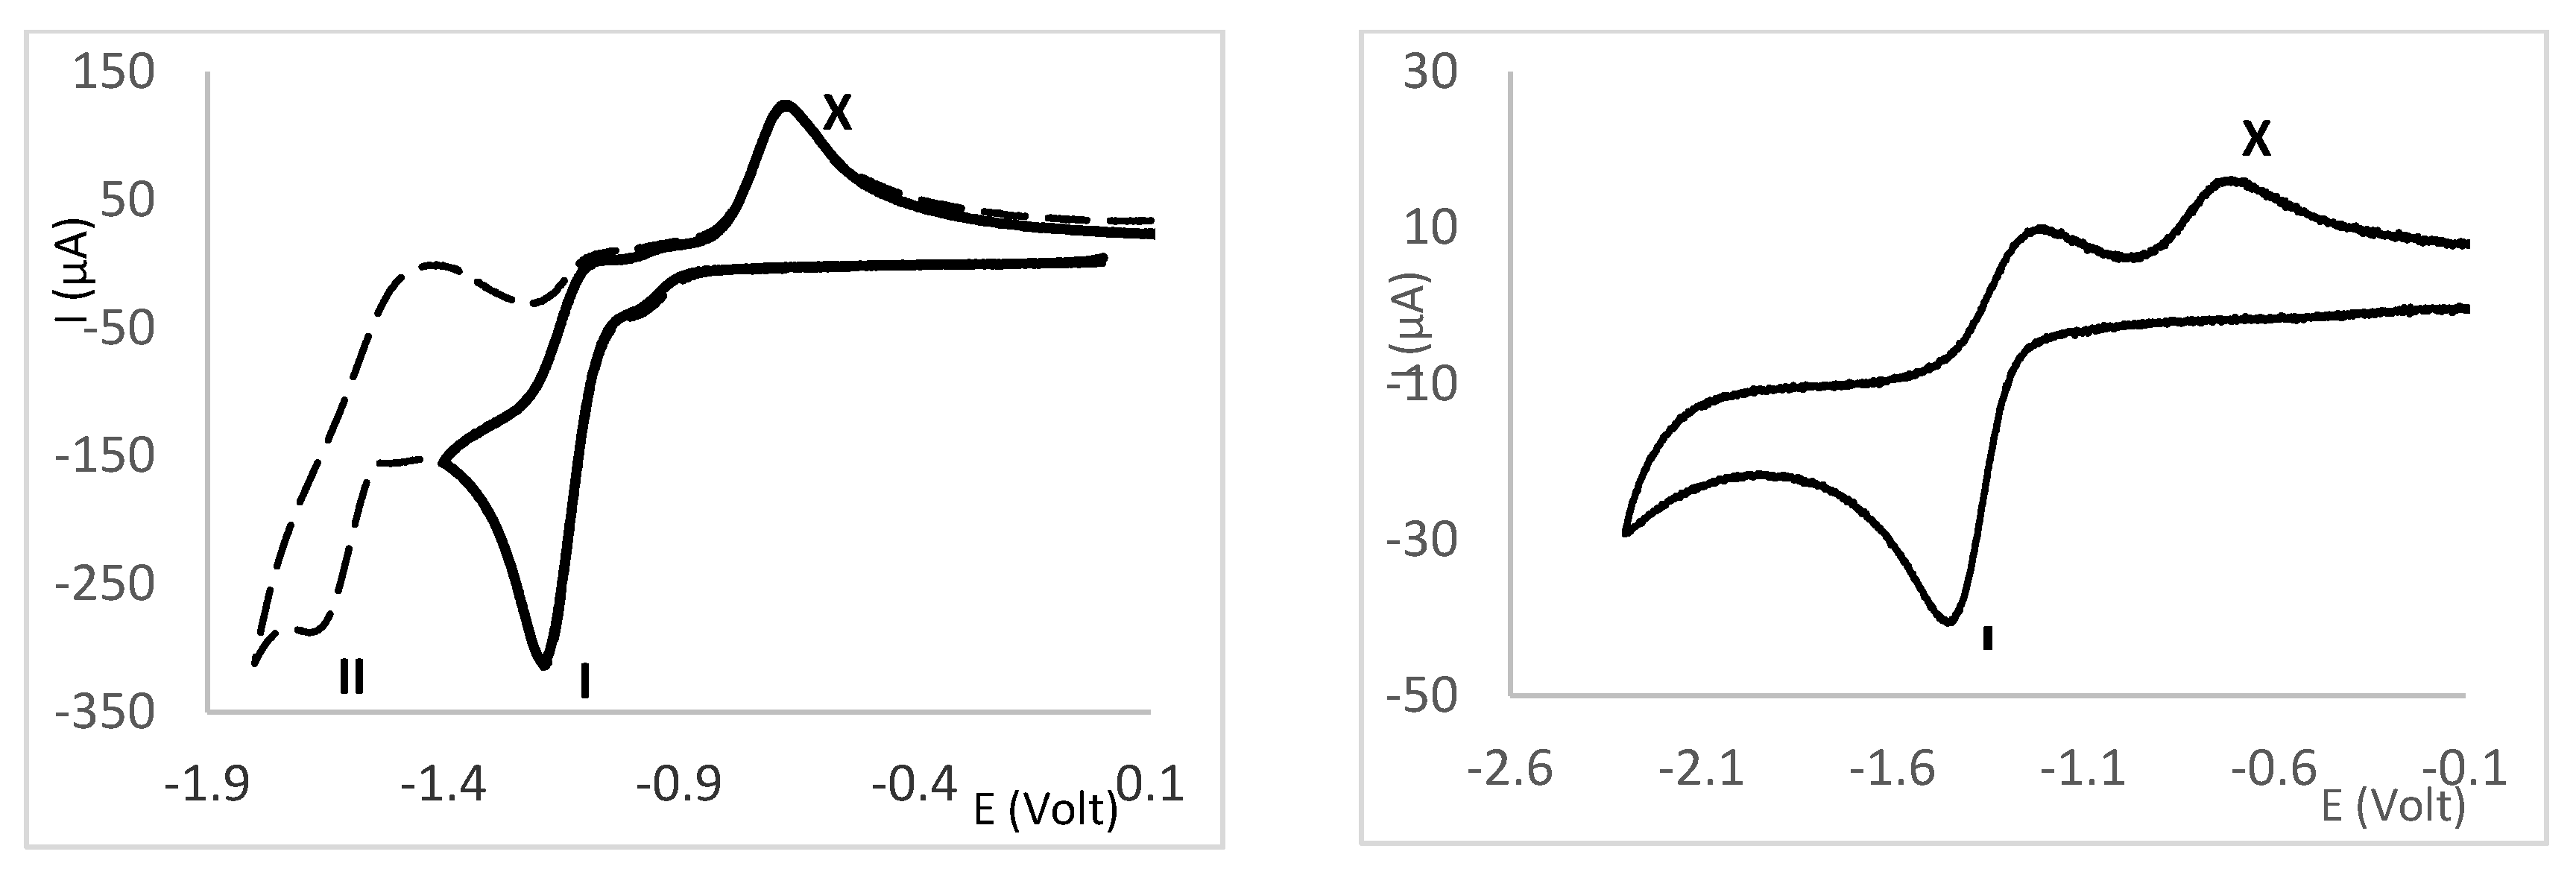
In acetonitrile, compounds L1-L7 display one irreversible anodic wave and one (L1, L2, L5, L6, L7) or two (L3, L4) cathodic waves (Figure 9). In the case there are two cathodic waves, the higher potential wave (I) typically displays a higher intensity than the lower potential one (wave II). The reversibility of wave I decreases upon scan at the potential of wave II as shown (Figure 9, left). The loss of reversibility and emergence of the anodic wave X is consistent with chemical reactivity being induce by electron transfer.
The anodic and cathodic potentials measured for L1 - L7 are displayed in Table 2.
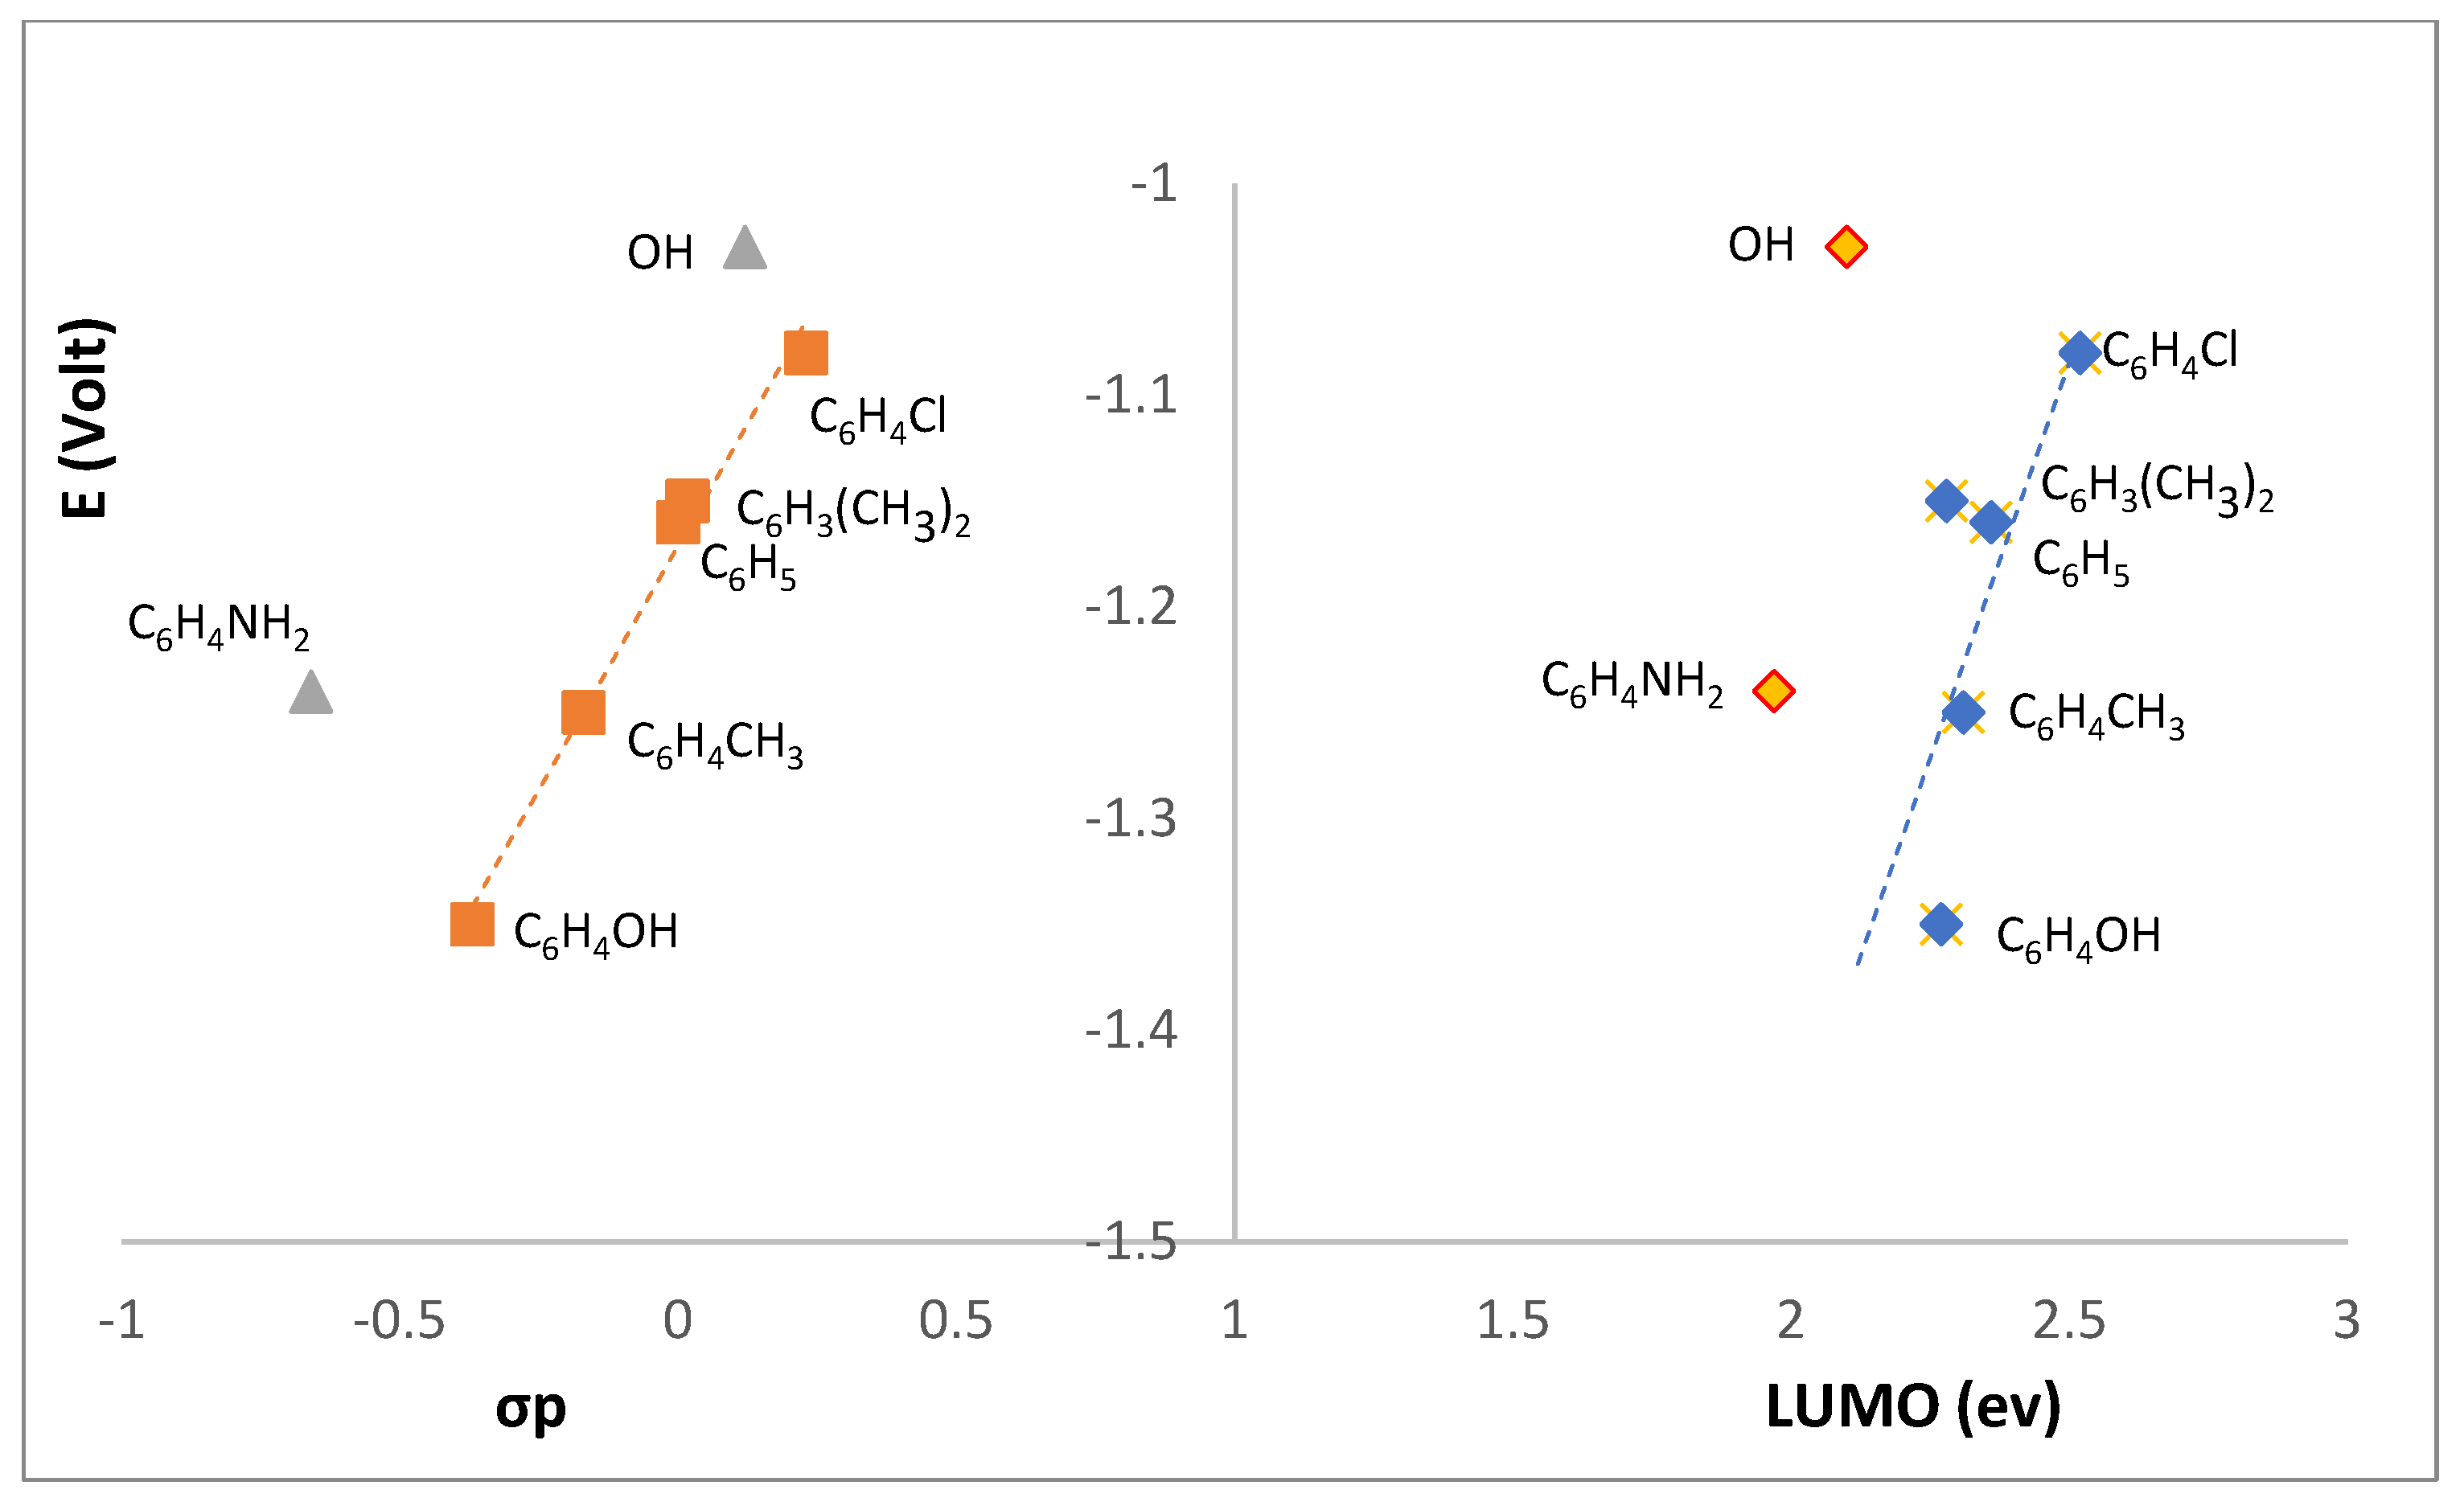
The potential trend observed for wave I (Table 2) suggests that reduction involves the imine >C=N-R group. In fact, an excellent correlation exists (Figure 10, left) between the redox potential and the Hammett sigma parameter (σp)[14] which accounts for the electronic characteristics of the R group driving the cathodic process. Compounds L1 (R=OH) and L3 (4-NH2C6H4) are aside from the linear correlation (R2=0.987) established by the other compounds showing that other than electronic parameters operate.
In what concerns L1 such behavior was somehow expected due to the non-aromatic character of the R group (unlike the R groups at L2-L7) and the distinct type of NBI (see DFT-D3 discussion, above) compared to the other compounds.
In what concerns the relationship between I E 1 / 2 r e d and the LUMO (Figure 10, right) the energy calculations for L1 show that there is a decrease by 0.11 eV in the absolute value of the energy in the H-bonded dimer. Such energy shift may account for the non-fitting of the potential (FIGURE 10, right) pointing to L1 keeping some dimer character in the electrolyte solution.
L3 is the other compound that does not fit the I E 1 / 2 r e d  versus σp (Figure 10, left) neither fits the I E 1 / 2 r e d  versus LUMO (Figure 10, right) correlations. The two compounds (L1, R=OH and L3, R=C6H4NH2) have in common the protic character of the R imine substituent which induces formation of H-bonded dimers (see above).
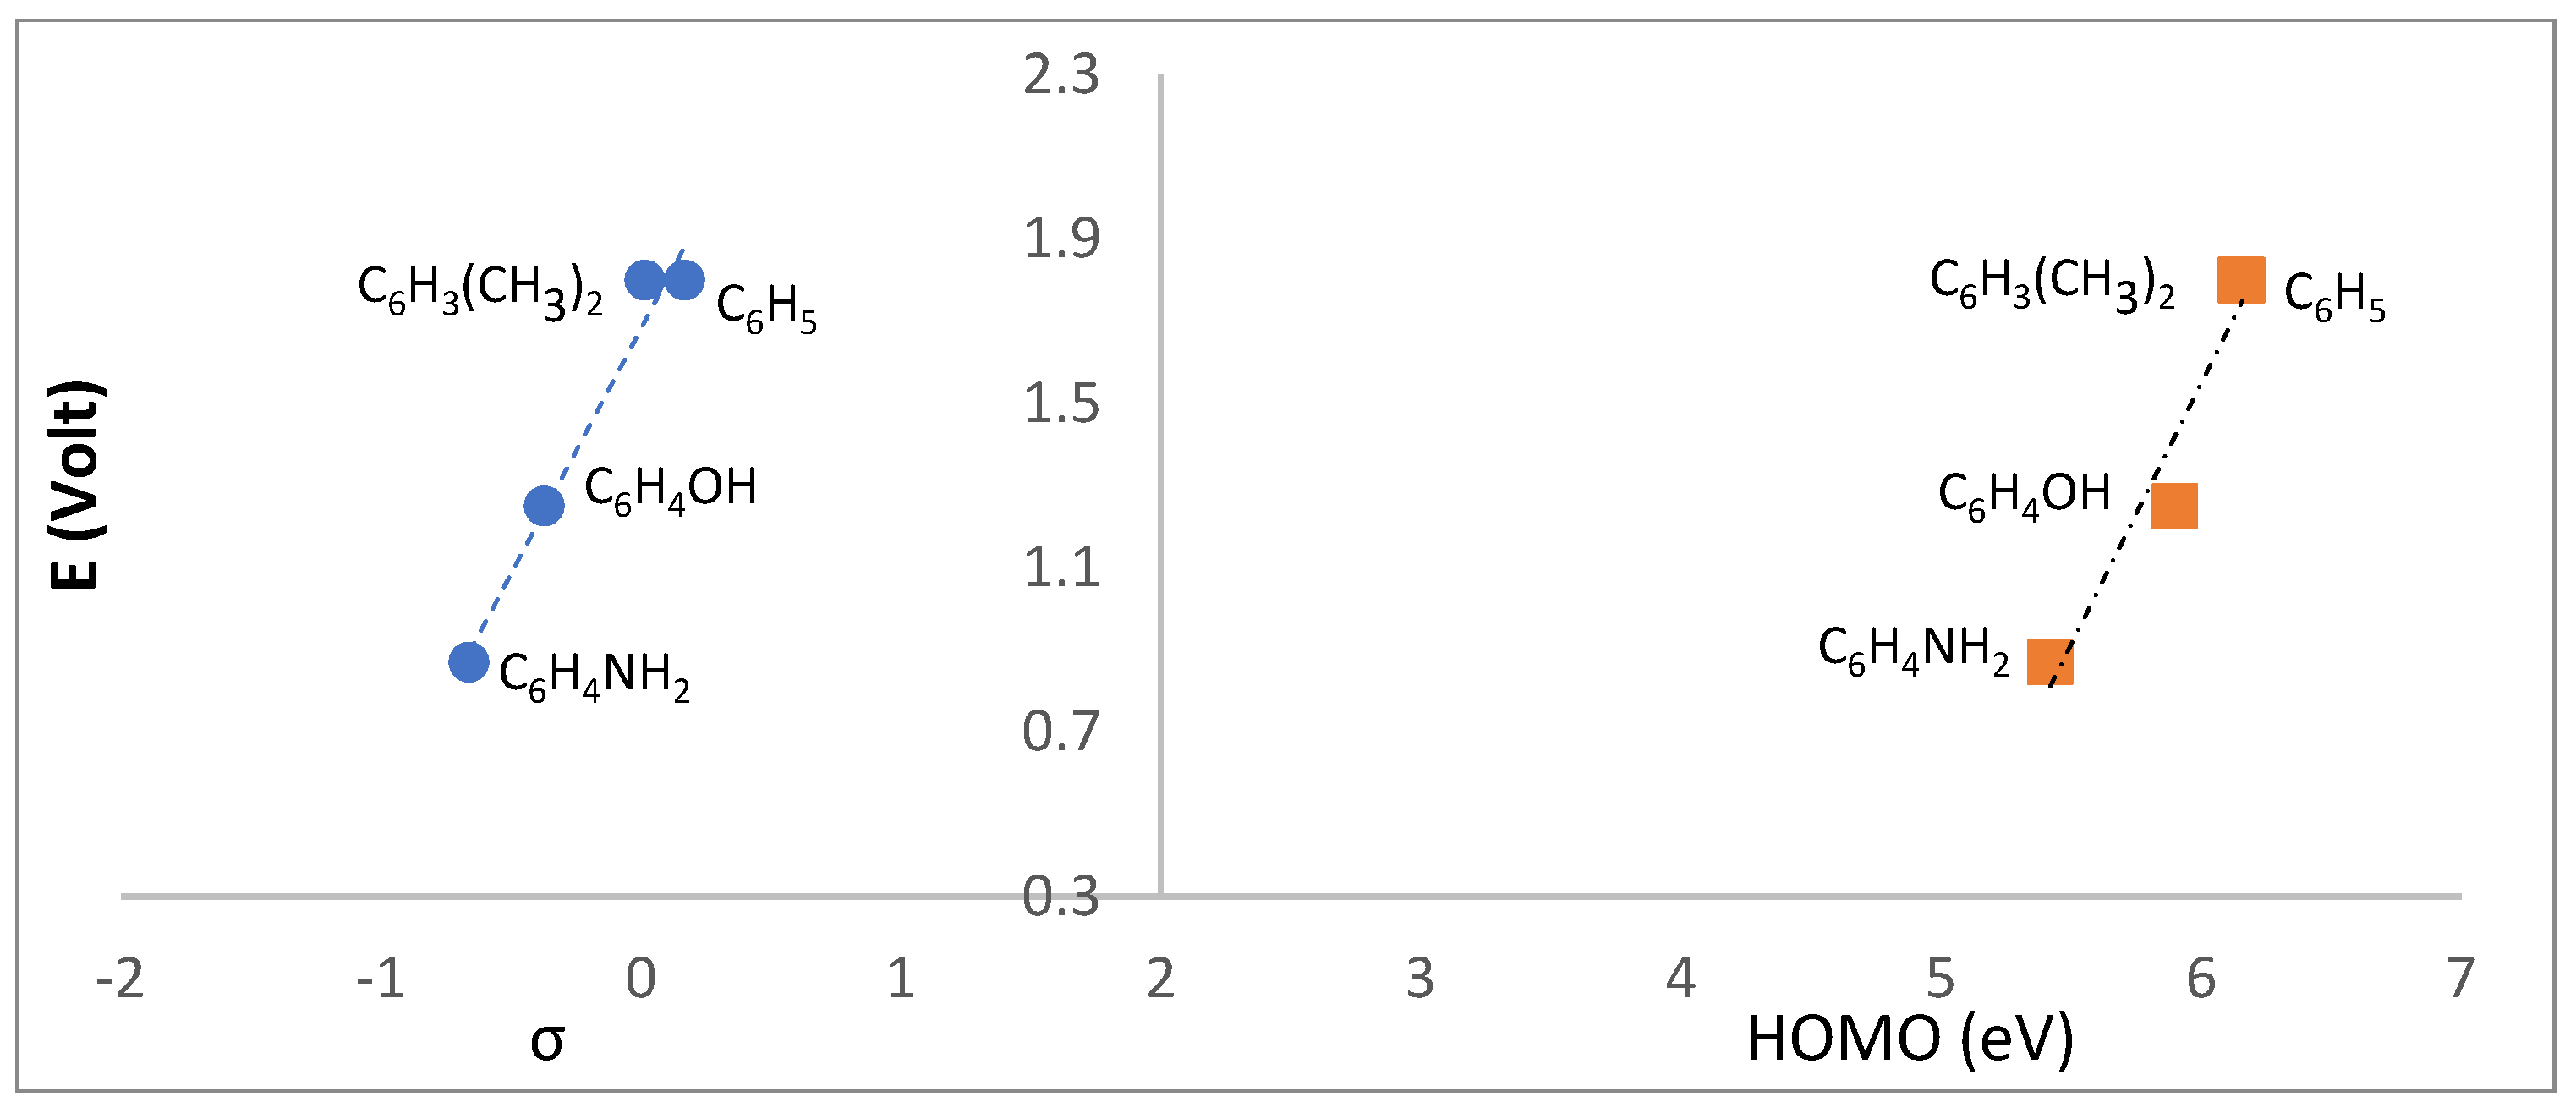
In what concerns the anodic behavior, just L2, L3, L5 and L6 show oxidation processes. L2 and L3 display the lowest oxidation potentials in agreement with the electron releasing characteristics of the aromatic R groups as corroborated through the linear correlation with Hammett σp parameters (Figure 11, left). A good correlation with the HOMO was found (Figure 11, right).
The calculated HOMO and LUMO contours for compound L7 show that the HOMO is mostly localized at the aromatic ring (all carbons) while the LUMO is localized at the camphor skeleton with an important contribution from the 2, 4 and 6 ring carbon atoms (Figure 12).
The electrochemical behavior of [Ag(NO3)L2] (C1, C2) complexes studied by cyclic voltammetry show that a cathodic process exists at a potential ( E p r e d =-1.18 V, C1 and E p r e d =-1.17 V, C2) similar to that measured for the organic precursors L6 and L7, respectively (Table 2). Such pattern indicate that the electronic properties of the sulfonimine ligands remain essentially identical in the complexes. As expected, the cyclic voltammograms of C1 and C2 display a cathodic wave attributed to the Ag(I)→Ag(0) reduction at a potential ( E p r e d =0.16 V) that does not differ much of that reported for related complexes.[3]
The redox behavior of 1 was also studied by cyclic voltammetry showing a quasi-reversible cathodic wave ( E 1 / 2 r e d = -0.92 V; ipc/ipa=1, Epa-Epc= 133 mV) but no anodic process. According to the cathodic potential value, reduction of 1 is easier than any of the sulfonimine compounds (L1-L7, Table 1). Therefore, sulfonimines are more electron rich than 1 and consequently better ligands for metal sites. In fact, no Ag(I) complex based on 1 could be experimentally obtained, in contrast with several complexes derived from sulfonimine ligands as for example the new [Ag(NO3)L2] (C1 and C2) now reported (see experimental).

3. Conclusions

DFT-D3 calculations based on X-ray data obtained for a series of camphor sulfonimine compounds corroborate that NBI are responsible for their organic framework. On 2L-7L the NBI are essentially electrostatic, in contrast with 1L where packing plays a relevant role in the solid-state arrangement observed by X-rays analysis.
The characteristics of the sulfonimine substituent (R) fine drives the NBI established and direct the ability of the L compounds to bind the Ag(I) metal center forming MOFs such as detected for [Ag(NO3)(O2SNC10H13NNMe2)2] whose X-ray structure was formerly reported.
It was found that complexation of the metal center always occurs in a monodentate fashion through the imine nitrogen atom in the sulphonyl 5-membered ring. It was predicted by DFT-D3 calculations that the NBI interactions not involving this atom remain after complexation being transferred to the MOF. The conjugation of the x-ray structures of the organic ligands with DFT-D3 calculations proved to be a powerful tool to predict the self-assembly trends of the corresponding MOF structures of the complexes.
The correlation between the redox potentials of 1L-7L (studied by cyclic voltammetry), the Hammett σ-parameter and calculated HOMO and LUMO energies are in excellent agreement with different types of NBI being established by 1L and 2L compared to the other camphor sulfonimine compounds.

4. Experimental

The camphor sulfonimines L1, L3, L5 and L7 were synthesized according to published procedures.[15] The complexes were synthesized under nitrogen using Schlenk and vacuum techniques. The FT-IR spectra were obtained from KBr pellets using a JASCO FT/IR 4100 spectrometer. The NMR spectra (1H, 13C, DEPT, HSQC, and HMBC) were obtained from CDCl3¸ CD3CN or DMSO solutions using Bruker Avance II+ (300 or 400 MHz) spectrometers. The NMR chemical shifts are referred to TMS (δ=0 ppm).
The redox properties were studied by cyclic voltammetry using a three compartments cell equipped with Pt wire electrodes (work and secondary) and interfaced with a VoltaLab PST050 equipment. The cyclic voltammograms were obtained from NBu4BF4 / CH3CN (0.10 M) solutions used as electrolyte. The potentials were measured in Volts (±10 mV) versus SCE at 200 mV/s using [Fe(η5-C5H5)2]0/+ ( E 1 / 2 o x = 0.382 V; CH3CN) as internal reference. The window of potential was established by scanning a fresh solution of the electrolyte to the limits.

4.1. Synthesis

4.1.1. Camphor sulfonimines

(E)-7-(hydroxyimino)-8,8-dimethyl-4,5,6,7-tetrahydro-3H-3a,6-ethanobenzo[c] isothiazole 2,2-dioxide (L1) - Compound 1 (682 mg; 3 mmol) was dissolved in ethanol (10 mL) acidified with acid acetic (0,4 mL) and the mixture was stirred for ca. 15 minutes before the hydroxylamine (99 mg, 3 mmol) was added. The reaction was stopped after 24 hours stirring by addition of 5 mL of water. The organic phase was then extracted with dichloromethane (3x5 mL) and dried over MgSO4 for a couple of hours. After filtration the solvent was allowed to evaporate slowly in the exhaust hood. Yield 71%. Elem. Anal. (%) for C10H14N2O3S: Found: C, 49.8; N, 11.3; H, 6.0; S, 13.7. Calc.: C, 49.6; N, 11.6; H, 5.8; S, 13.2. FTIR (KBr, cm-1): 3367, 1668, 1633, 1327, 1158. 1H NMR (DMSO, δ ppm): 12.8 (s, 1H); 3.59, 3.36 (2d, J=14.0 Hz, 2H); 3.25 (d, J=4.2 Hz, 1H); 2.22 – 2.01 (m, 2H); 1.63 – 1.40 (m, 2H); 1.01 (s, 3H); 0.78 (s, 3H). 13C NMR (DMSO, δ ppm): 184.7, 155.3, 64.2, 49.0, 47.9, 47.1, 28.8, 23.6, 19.5, 18.1.
(E)-7-((4-hydroxyphenyl)imino)-8,8-dimethyl-4,5,6,7-tetrahydro-3H-3a,6-methanobenzo[c]isothiazole 2,2-dioxide (L2) - 3-oxo-camphorsulfonimide (1, 682 mg; 3 mmol) was dissolved in ethanol (10 mL) acidified with CH3COOH (0.4 mL). The mixture was stirred for 15 minutes before adding the 4-aminophenol (329 mg; 3 mmol). A light brown compound was formed upon overnight stirring at 50°C that was filtered off the solution and dried. Yield 81%. Elem. Anal. (%) for C16H18N2O3S·H2O: Found: C, 56.9; N, 8.0; H, 6.2; S, 11.1. Calc.: C, 57.1; N, 8.3; H, 6.0; S, 9.5. FTIR (KBr, cm-1): 3567, 1653, 1633, 1330, 1160. 1HNMR (CD3CN, δppm): 7.35 (s, 1H, OH), 7.00 (d, J= 7.8 Hz, 2H), 6.88 (d, J=7.8 Hz, 2H), 3.48, 3.25 (2d, J= 13.9 Hz, 2H), 3.10 (d, J= 2.6 Hz, 1H), 2.34–2.23 (m, 2H), 1.89–1.75 (m, 2H), 1.06 (s, 3H), 0.84 (s, 3H). 13C NMR (CD3CN, δppm): 187.9, 166.0, 157.3, 141.9, 124.9, 116.7, 64.1, 52.6, 50.5, 47.8, 29.4, 24.4, 19.9, 18.3.
(E)-7-((4-chlorophenyl)imino)-8,8-dimethyl-4,5,6,7-tetrahydro-3H-3a,6-methanobenzo[c]isothiazole 2,2-dioxide (L4) - Compound 1 (682 mg; 3 mmol) was dissolved in acidified (acid acetic, 0.4 mL) ethanol (10 mL) and stirred for ca. 15 minutes. Upon addition of 4-chloroaniline (384 mg, 3 mmol) the reaction was stirred overnight at 40°C. A yellow precipitate formed that was filtered off solution and dried. Yield 76%. Elem. Anal. (%) for C16H17ClN2O21/5H2O: Found: C, 56.5; N, 8.1; H, 5.3; S, 10.1. Calc.: C, 56.5; N, 8.2; H, 5.2; S, 9.4. FTIR (KBr, cm-1): 1664, 1636, 1340, 1161. 1H NMR (CDCl3, δ ppm): 7.39 (d, J=8.6 Hz, 2H); 6.93 (d, J=8.6 Hz, 2H); 3.42, 3.21 (2d, J=13.4 Hz, 2H); 2.99 (d, J=8.6 Hz, 1H); 2.29 – 2.21 (m, 2H); 2.10 – 2.00 (m, 1H); 1.82 – 1.74 (m, 1H); 1.11 (s, 3H); 0.95 (s, 3H). 13C NMR (CDCl3, δppm): 185.0, 167.5, 147.2, 132.1, 129.4, 122.0, 62.7, 51.4, 50.0, 46.8, 28.4, 24.1, 20.0, 18.4.
(E)-7-((3,5-dimethylphenyl)imino)-8,8-dimethyl-4,5,6,7-tetrahydro-3H-3a,6-methanobenzo[c]isothiazole 2,2-dioxide (L6) - Compound 1 (454 mg; 2 mmol) was dissolved in ethanol (7 mL) acidified with acid acetic (0.2 mL) and the mixture stirred for ca. 15 minutes. Then, 3,5-dimethylaniline (0.25 mL, 2 mmol) was added and the reaction stirred for 24 hours at RT. A brown precipitate formed that was filtered off solution and dried. Yield 86%. Elem. Anal. (%) for C18H22N2O2S: Found: C, 65.3; N, 8.4; H, 6.7; S, 9.5. Calc.: C, 65.4; N, 8.5; H, 6.7; S, 9.7. FTIR (KBr, cm-1): 1665, 1636, 1339, 1161. 1H NMR (CDCl3, δ ppm): 6.87 (s, 1H); 6.56 (s, 2H); 3.39, 3.18 (2d, J= 13.4 Hz, 1H); 3.01 (d, J= 4.0 Hz, 1H); 2.34 (s, 6H); 2.24 – 2.19 (m, 2H); 2.05 – 1.98 (m, 1H); 1.82 – 1.75 (m, 1H); 1.09 (s, 3H); 0.94 (s. 3H). 13C NMR (CDCl3, δppm): 185.4, 166.5, 149.1, 139.1, 128.1, 118.2, 113.6, 62.9, 51.5, 50.1, 46.8, 28.6, 24.3, 21.5, 21.4, 20.1, 18.5.

4.1.2. Complexes

[Ag(NO3){(3,5-Me2C6H3)NC10H13NSO2}2] (C1) – AgNO3 (42.5 mg; 0.25 mmol) was added to a solution of L6 (165 mg; 0.50 mmol) in CH3CN (5 mL) and the mixture was stirred for 2 hours. A light suspension formed that was filtered to separate silver residues. The filtered solution was evaporated and dried under vacuum to afford CB as a dark yellow compound. Yield 72%. Elemental analysis for AgC36H44N5O7S2·1/5HNO3 Exp.: C, 51.2; N, 8.4; H, 5.5; S, 8.8. Calc.: C, 51.3; N, 8.6; H, 5.3; S, 7.6. FTIR (KBr, cm-1): 1666, 1644, 1384, 1338, 1161. 1H NMR (400 MHz, CD3CN, δ ppm): 6.91 (s, 1H); 6.59 (s, 2H); 3.51, 3.28 (2d, J=14 Hz, 2H); 2.96 (d, J=4.8 Hz, 1H); 2.31 (s, 6H); 2.24 – 2.30 (m, 1H); 1.71 – 1.88 (m, 3H); 1.05 (s, 3H); 0.87 (s, 3H). 13C NMR (400 MHz, CD3CN, δ ppm): 186.5, 167.7, 149.2, 139.2, 127.6, 117.8, 63.2, 51.4, 49.7, 46.5, 28.0, 23.6, 20.3, 19.1, 17.1.
[Ag(NO3)(C6H5NC10H13NSO2)2] (C2) - Silver nitrate (42.5 mg; 0.25 mmol) was added to a solution of L7 (151 mg; 0.50 mmol) in CH3CN (3 mL) and the mixture stirred for 2 hours.
The suspension was then filtered to remove silver residues. Upon solvent evaporation and drying under vacuum the compound was obtained as a yellow powder. Yield 62%. Elemental analysis for AgC32H36N5O7S2·H2O Exp.: C, 48.6; N, 9.0; H, 4.7; S, 7.6. Calc.: C, 48.5; N, 8.8; H, 4.8; S, 8.1. FTIR (KBr, cm-1): 1664, 1635, 1384, 1346, 1165. 1H NMR (400 MHz, DMSO, δ ppm): 7.46 (t, J=15.7 Hz, 2H); 7.25 (t, J=7.4 Hz, 1H); 7.00 (d, J=8.4 Hz, 2H); 3.74, 3.52 (2d, J=14 Hz , 2H); 2.88 (d, J=4.8 Hz, 1H); 2.34–2.25 (m, 1H); 2.19–2.10 (m, 1H); 1.80–1.70 (m, 2H); 1.01 (s, 3H); 0.84 (s, 3H). 13C NMR (400 MHz, DMSO, δ ppm): 186.0, 167.8, 148.8, 129.3, 126.0, 120.1, 63.0, 51.0, 49.3, 46.3, 27.7, 23.4, 19.2, 17.5.

4.2. Computational methods

All theoretical calculations were of the DFT type, carried out using GAMESS-US version R3,[16] using the implemented version of the B3LYP functional and a 6-31G** basis set for organic molecules and SBKJC basis set/ECP in metal complexes. DFT-D3[17] with the standard parametrization of GAMESS-US, was used in all computational work. Optimized geometries were confirmed to be minima by checking for absence of imaginary frequencies in the Hessian.

4.3. X-ray diffraction analysis

X-ray diffraction analysis was performed on mono crystals of 1,3 and L1 to L7. Data was collected on a Bruker AXS-KAPPA APEX II area detector apparatus using graphite-monochromated Mo Kα (λ=0.71073 Å) and were corrected for Lorentz, polarization and empirically for absorption effects. The structure was solved by direct methods using SHELX97[18] and refined by full matrix least squares against F2 using SHELX97 all included in the suit of programs WinGX v1.70.01 for Windows.[19] Non-hydrogen atoms were refined anisotropically and H atoms were inserted in idealized positions and allowed to refine riding on the parent carbon atom. Crystal data and refinement parameters are summarized in Table 3. Illustrations of the molecular structures were made with Chemcraft[20] or Mercury.[21]
CCDC 2252538 to 2252543 and CCDC 2252556 contain the supplementary crystallographic data for this paper which can be obtained free of charge via www.ccdc.cam.ac.uk/conts/retrieving.html (or from the Cambridge Crystallographic Data Centre, 12, Union Road, Cambridge, CB2 1EZ, UK; fax: +44 1223 336033; or deposit@ccdc.cam.ac.uk).

Acknowledgments

FCT - Fundação para a Ciência e a Tecnologia, for financial support through projects CQE (UIDB/00100/2020, UIDP/00100/2020) and Institute of Molecular Sciences (LA/P/0056/2020) and a PhD Grant to Joana Costa (UI/BD/152244/2021). The Portuguese NMR IST–UL Centers for facilities.

References

  1. M.F.N.N. Carvalho, A.C. Consiglieri, M.T. Duarte, A.M. Galvão, A.J.L. Pombeiro, R. Herrmann. Transition metal complexes of (1S,2S,3S)-3-hidroxy-camphorsultam, Inorg.Chem. 1993, 32, 5160–5164. [Google Scholar] [CrossRef]
  2. M.F.N.N. Carvalho, L.M.G. Costa, A.J.L. Pombeiro, A. Schier, W. Scherer, S.K. Harbi, U. Verfürth, R. Herrmann, Synthesis, structure and electrochemistry of palladium complexes with camphor-derived chiral ligands. Inorg. Chem. 1994, 33, 6270–77. [CrossRef]
  3. J.M.S. Cardoso, I. Correia, A.M. Galvão, F. Marques, M.F.N.N. Carvalho. J. Inorg. Biochem. 2017, 166, 55–63. [CrossRef] [PubMed]
  4. Y.-N. Wang, L.-Q. Lu, W.-J. Xiao. Chem. Asian J. 2018, 13, 2174–2183. [CrossRef]
  5. L. Wang, S. Gou, Y. Chen, Y. Liu. Bioorg. Med. Chem. Lett. 2005, 15, 3417–3422. [CrossRef]
  6. V. Rashidi, E.J. Coyle, K. Sebeck, J. Kieffer, K.P. Pipe. J. Phys. Chem. B 2017, 121, 4600–4609. [CrossRef] [PubMed]
  7. M.F.N.N. Carvalho, S. Leite, J.P. Costa, A.M. Galvão, J.H. Leitão. J. Inorg. Biochem 2019, 199, 110791.
  8. T.A. Fernandes, F. Mendes, A.P.S. Roseiro, I. Santos, M.F.N.N. Carvalho. Polyhedron 2015, 87, 215–219. [CrossRef]
  9. T.A. Fernandes, A.M. Ferraria, A.M. Galvão, A.M. Botelho do Rego, A.C.M. Suárez, M.F.N.N. Carvalho. J. Organometal. Chem. 2014, 760, 186–196. [CrossRef]
  10. J.H. Leitão, S.A. Sousa, S.A. Leite, M.F.N. N. Carvalho. Antibiotics 2018, 7, 65. [CrossRef]
  11. H.E. Armstrong, T.M. Lowry. J. Chem. Soc. 1902, 81, 1441. [CrossRef]
  12. X. Liu, Colin D. McMillen, Joseph S. Thrasher. New J. Chem. 2018, 42, 1–4. [CrossRef]
  13. Mukherjee, S. Tothadi. G. R. Desiraju. Acc. Chem. Res. 2014, 47, 2514–2524.
  14. Hansch, A. Leo, R. W. Taft. Chem. Rev. 1991, 97, 165–195.
  15. J.P. Costa, S.A. Sousa, A.M. Galvão, J.M. Mata, J.H. Leitão, M.F.N.N. Carvalho. Antibiotics 2021, 10, 135. [CrossRef]
  16. M.W. Schmidt, K.K. Baldridge, J.A. Boatz, S.T. Elbert, M.S. Gordon, J.H. Jensen, S. Koseki, N. Matsunaga, K.A. Nguyen, S. Su, T.L. Windus, M. Dupuis, J.A. Montgomery. J. Comput. Chem. 1993, 14, 1347–1363. [CrossRef]
  17. S. Grimme, J. Antony, S. Ehrlich, H. Krieg. J. Chem. Phys. 2010, 132, 154104. [CrossRef] [PubMed]
  18. G. M. Sheldrick SHELX-97- Programs for Crystal Structure Analysis (release 97-2), Institüt für Anorganische Chemie der Universität, Tammanstrasse 4, D-3400 Göttingen, Germany, 1998.
  19. L. J. Farrugia, WINGX. J. Appl. Crystallogr. 1999, 32, 837. [CrossRef]
  20. Chemcraft - graphical software for visualization of quantum chemistry computations. https://www.chemcraftprog.com.
  21. F. Macrae, I. Sovago, S. J. Cottrell, P. T. A. Galek, P. McCabe, E. Pidcock, M. Platings, G. P. Shields, J. S. Stevens, M. Towler and P. A. Wood. J. Appl. Cryst., 2020, 53, 226–235. [CrossRef] [PubMed]
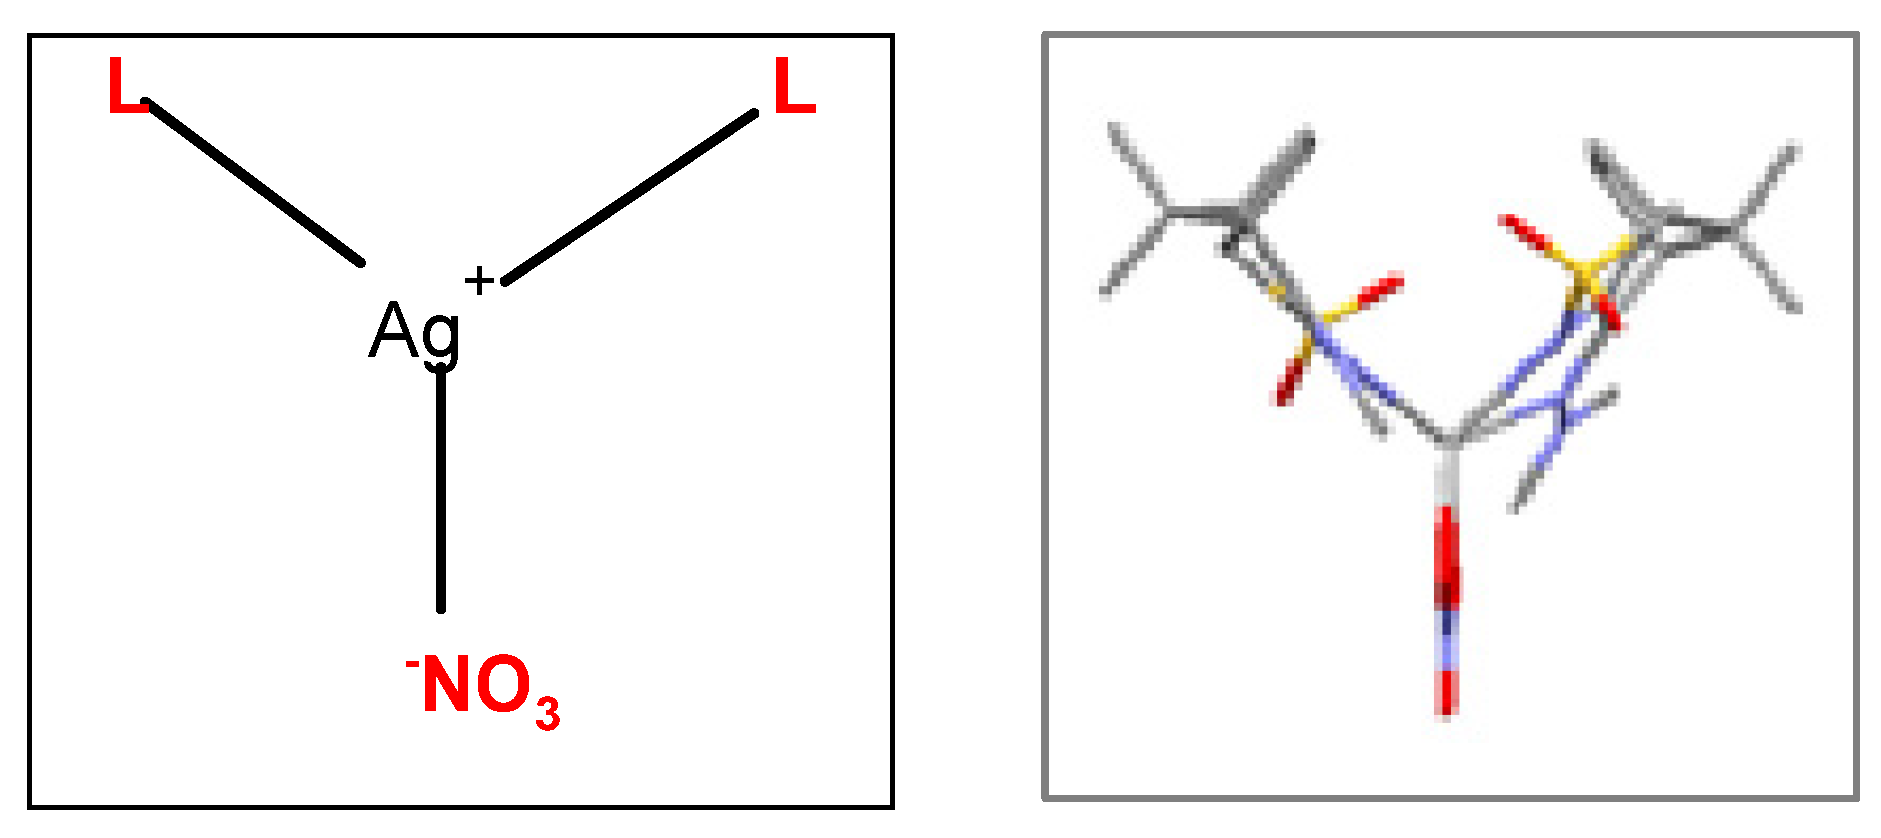
Scheme 1. The packing structure of this complex (Figure 1) shows that the silver atom occupies essentially the empty space (grey polyhedral in Figure 1) in the packing imposed by the Non-Bonding Interactions (NBI) established between the organic fragments. Such observation prompts the prediction of other MOFs through superimposition of Ag(I) metal centres in the camphor sulfonimines organic frameworks whose structures are available from X-ray diffraction data and/or are calculated by DFT-D3.
Preprints 86066 sch001
Figure 1. MOF for [Ag(NO3)L2] (L=RNC10H13NSO2; R=NMe2). Grey polyhedral represents the volume occupied by the silver atom.
Preprints 86066 g001
Scheme 2. R=OH, L1; R=4-OHC6H4, L2; R=4-NH2C6H4, L3; R=4-ClC6H4, L4; R=4-CH3C6H4, L5; R=3,5-(CH3)2C6H3, L6; R= C6H5, L7.
Preprints 86066 sch002
Figure 2. (a) X-ray diffraction data showing the helicoidal packing for 1; (b) - NBI lengths according to X-ray data (above) and DFT-D3 calculations on a subset dimer of 1.
Preprints 86066 g002
Figure 3. Drawing evidencing the bi-dimensional intermolecular interactions in 2.
Preprints 86066 g003
Figure 4. X-Ray packing for L1. The central dimer is the asymmetric unit composed by two different molecules.
Preprints 86066 g004
Figure 5. Data obtained by DFT-D3 for the NBI´s in the hydroxyl (left) and central dimer (right) in L1.
Preprints 86066 g005
Figure 6. Prediction by DFT-D3 of the structural arrangement of [AgNO3L1].
Preprints 86066 g006
Figure 7. Structural arrangement for L7: X-Ray data (left) showing 1D assembly through a N…H-C NBI and DFT-D3 optimized structure (right).
Preprints 86066 g007
Figure 8. X-Ray data (left) showing the π-π stacking in L2; strucure optimization made by DFT-D3 (right).
Preprints 86066 g008
Figure 9. –Cyclic voltammograms obtained in Bu4NBF4/CH3CN at 200 mV/s: L4(left) - - - full cathodic scan; partial scan reversed after wave I; L5 (right).
Preprints 86066 g009
Figure 10. Correlation between the reduction potential (I E 1 / 2 r e d ) of L1-L7 and the Hammett parameter (σp) or LUMO (right).
Preprints 86066 g010
Figure 11. Relationship between the Hammett parameters (σp) and the oxidation potentials measured for the camphor sulfonimines.
Preprints 86066 g011
Figure 12. Wavefunction contours for HOMO (left) and LUMO (right) for L7.
Preprints 86066 g012
Table 1. Intermolecular interactions in 2 (distances pm; angles deg).
Parameter X-Ray DFT-D3
Cl∙∙∙O 300 311
S-Cl∙∙∙O 169.4 176.4 NBI quasi-Type II
S-O∙∙∙Cl 131.5 128.2
Table 2. - Cyclic voltammetry dataa for camphor sulfonimine compounds L1 L7.
R I E 1 / 2 r e d II E p r e d E p o x σpb
Volt
Preprints 86066 i001 OH L1 -1.03 0.12
4-OHC6H4 L2 -1.35 1.25 -0.37
4-NH2C6H4 L3 -1.24 -1.69 0.87 -0.66
4-ClC6H4 L4 -1.08 -1.61 0.23
4-CH3C6H4 L5 -1.25 1.80 -0.17
3,5-(CH3)2C6H3 L6 -1.15 1.80 0.017
C6H5 L7 -1.16 0
a Values in Volt ±10 mV, versus SCE using ferrocene as internal reference.
Table 3. Crystallographic data for 1 and L1 to L4, L6, L7.
1. L1 L4 L6 L7
Empirical formula
Formula weight
Crystal system
Space group
Unit cell dim.
a/ Å
b/ Å
c/ Å
α/ deg
β/ deg
γ/ deg
Volume (Å-3)
Z, Dcal (g/cm3)
Abs. coeff. (mm-1)
F(000)
Crystal size (mm3)
θ range (deg)
Refl. Collect./ uni.

Data/restr./par.
Final R (observed)
C10H13NO3S
227.27
Tetragonal
P43212

7.6255(5)
7.6255(5)
36.400(2)
90
90
90
2116.6(2)
8, 1.426
0.292
960
0.3 x 0.3 x 0.3
2.24 to 29.85
12072 / 3022
[R(int) = 0.0486]
3022 / 0 / 138
R1 = 0.0342,
wR2 = 0.0896
C20H28N4O6S2
484.58
Monoclinic
P21

6.9975(4)
13.9378(9)
11.3550(7)
90
95.520(3)
90
1102.3(1)
2, 1.460
0.288
512
0.3 x 0.3 x 0.3
2.32 to 32.71
16791 / 7667
[R(int) = 0.0347]
7667 / 1 / 301
R1 = 0.0334,
wR2 = 0.0865
C16H17ClN2O2S
336.83
Orthorhombic
P212121

8.8877(6)
12.0522(7)
14.9100(6)
90
90
90
1597.1(2)
4, 1.401
0.378
704
0.2 x 0.1 x 0.1
2.17 to 26.37
7174 / 3253
[R(int) = 0.0349]
3253 / 0 / 199
R1 = 0.0409,
wR2 = 0.1026
C18H22N2O2S
330.43
Orthorhombic
P212121

9.121(2)
11.174(2)
35.256(6)
90
90
90
3593(1)
8, 1.222
0.191
1408
0.4 x 0.3 x 0.2
1.912 to 32.016
220676 / 12299
[R(int) = 0.5558]
12299 / 0 / 423
R1 = 0.0756,
wR2 = 0.1551
C16H18N2O2S
302.38
Orthorhombic
P212121

9.375(1)
11.724(1)
14.130(2)
90
90
90
1553.1(3)
4, 1.293
0.214
640
0.2 x 0.2 x 0.3
2.257 to 32.178
12152 / 5275
[R(int) = 0.0361]
5275 / 0 / 192
R1 = 0.0438,
wR2 = 0.1055
Disclaimer/Publisher’s Note: The statements, opinions and data contained in all publications are solely those of the individual author(s) and contributor(s) and not of MDPI and/or the editor(s). MDPI and/or the editor(s) disclaim responsibility for any injury to people or property resulting from any ideas, methods, instructions or products referred to in the content.
Copyright: This open access article is published under a Creative Commons CC BY 4.0 license, which permit the free download, distribution, and reuse, provided that the author and preprint are cited in any reuse.
Prerpints.org logo

Preprints.org is a free preprint server supported by MDPI in Basel, Switzerland.

Subscribe

© 2024 MDPI (Basel, Switzerland) unless otherwise stated