
Submitted:
25 September 2023
Posted:
27 September 2023
You are already at the latest version
Abstract
In this study, we investigated the effects of three surface treatment techniques on 316L stainless steel, low-temperature immersion corrosion, shot peening followed by immersion corrosion, and electrochemical corrosion. Surface alterations were analyzed using scanning electron microscopy, Raman spectroscopy, and α-step thin-film thickness profiling. Human osteoblast adhesion was evaluated using Liu’s stain and metallographic optical microscopy. The results revealed weak cell adhesion after low-temperature immersion and shot peening followed by immersion corrosion. By contrast, electrochemical corrosion, particularly with a high current density and low corrosive solution concentration, resulted in a uniformly corroded surface, thus promoting dense cell adhesion. All three techniques resulted in porous oxide layers. Overall, our experimental findings highlighted shot peening (1 kg/cm2 for 20 s) and electrochemical corrosion (0.5 M HCl) as effective processes. Electrochemical corrosion produced uniformly dense corrosion pits, whereas shot peening produced semicircular grooves with small corrosion pits, both favorable for cell adhesion. Electrochemical corrosion also yielded excellent cell adhesion, emphasizing its suitability for biomedical activity. We developed a process for creating a porous surface layer and thereby enhancing the cell adhesion to 316L stainless steel for potential biomedical implant applications.
Keywords:
316L stainless steel
; immersion corrosion
; shot peening
; electrochemical corrosion
; cell adhesion
1. Introduction
Artificial biomaterials play a critical role in modern health care by serving as substitutes for damaged organs or tissues, thus enabling the restoration of physiological function and extending lifespans [1,2]. Therefore, these materials are held to high standards of quality. Biomaterials in a variety of medical devices, surgical instruments, and artificial organs come into contact with body fluids, either intermittently or continuously [3]. Over the past few decades, remarkable advancements have been achieved in the development and implementation of prosthetic devices for human body implantation [4]. Among the various options currently available for orthopedic joint replacement, hip prosthesis implantation has substantially increased in popularity [5,6]. Although the failure rate of hip prostheses remains low, a small percentage of failures may result in a considerable number of cases of implant loosening, which often necessitates revision surgery. In replacement procedures for load-bearing joints, such as the hip or knee, metallic materials are favored because of their mechanical stability [7,8,9,10]. Among the most commonly used metallic materials are stainless steel [11,12], titanium alloys [13,14], and cobalt–chrome alloys [15,16]. Because of their excellent biocompatibility and unique mechanical properties, titanium and its alloys have emerged as highly suitable materials for orthopedic and dental implants. The presence of a thin titanium oxide film on the surface of these materials confers biocompatibility and corrosion resistance [17,18]. However, alloys including elements such as nickel, vanadium, and aluminum may pose certain risks because they may release allergens, carcinogens, or toxins [19,20]. Therefore, as an alternative biomaterial, 316L stainless steel has been extensively used because of its excellent mechanical properties and corrosion resistance [21,22,23,24]. Nevertheless, optimizing the surface characteristics of 316L stainless steel is crucial to maximizing its biocompatibility and promoting desirable cellular responses.
Surface treatment is the most suitable and widely used technique for enhancing the cell adhesion properties of 316L stainless steel [25,26]. Promoting cell adhesion and proliferation on the surface of a material is essential both for successful integration with host tissues and for optimal clinical outcomes. Various surface treatment techniques, such as surface coating and electrochemical treatment [27,28,29,30,31,32], have been used to enhance the cell adhesion properties of 316L stainless steel. Surface coating involves depositing a thin film onto the surface of 316L stainless steel to modify its properties. Coatings can be composed of biocompatible materials, such as hydroxyapatite, or bioactive molecules. Coating treatment enhances the cell adhesion properties of surfaces and allows coating thickness and composition to be regulated. However, challenges remain in achieving coating adhesion and long-term stability. Electrochemical treatment of 316L stainless steel involves applying an electrical current to the surface in an electrolytic solution. This type of treatment modifies the morphology, composition, and topography of the surface in a controlled manner over a large area. However, it requires complex equipment and procedures and may lead to surface contamination and localized electrochemical effects. Various nanotechnology-based techniques, such as nanopatterning and surface functionalization, have been used to improve cell adhesion to 316L stainless steel [33,34,35,36]. These techniques involve creating nanoscale features and introducing functional groups on the surface. Nanopatterning with nanoporous structures and nanotube arrays enhances cell adhesion by mimicking a natural extracellular matrix [37]. Surface functionalization with biomolecules or peptides provides specific ligands for cell adhesion receptors [38]. Nevertheless, precisely controlling the aforementioned nanoscale features and functionalization process remains a challenge [39]. Surface roughening is a common technique for enhancing cell adhesion to 316L stainless steel [35]. Techniques such as shot-peening [40,41], acid etching [42,43], and laser ablation [44,45] have been used to control surface roughness. In shot-peening, abrasive particles are projected at a high speed to roughen the surface and create a large surface area. In acid etching, chemical agents are used to selectively remove certain materials, thus roughening the surface. In laser ablation, laser pulses are used to create microstructures on the surface. Although these techniques improve cell adhesion by providing a favorable substrate for cell adhesion and proliferation, they may introduce surface contaminants and alter surface chemistry.
In this study, we examined the effects of three techniques for treating 316L stainless-steel plates, low-temperature immersion corrosion, shot-peening followed by immersion corrosion, and electrochemical corrosion. After corrosion treatment, the surface morphology of 316L stainless-steel was observed and analyzed through scanning electron microscopy (SEM), Raman spectroscopy, and α-step thin-film thickness profiling. Subsequently, a cell adhesion test with human osteoblasts was conducted through staining with Liu’s stain, followed by metallographic optical microscopy (OM). The results revealed weak cell adhesion after low-temperature immersion corrosion and after shot-peening followed by immersion corrosion. By contrast, electrochemical corrosion, particularly at a high current density and low concentration of the corrosive solution, yielded a uniformly corroded surface. The results of the cell adhesion test also revealed dense cell adhesion with the optimal parameter setting.
2. Materials and Methods
2.1. Preparation of 316L stainless-steel samples
316L stainless-steel sheets with dimensions of 25 × 25 × 1 mm3 were selected as the study materials. To enhance the cell adhesion properties of the stainless-steel sheets, their surface morphology was modified through corrosion under various conditions. To ensure consistent surface quality, the samples were prepared meticulously as follows: The samples were ground using 1500-grit sandpaper to achieve a smooth surface. To achieve a pristine surface free from residual contamination, careful polishing was conducted using 0.3-μm alumina powder suspended in acetone under ultrasonic agitation for approximately 10 min. To prevent any contamination from the alumina powder and human oils, the polished samples were placed in beakers containing acetone and subjected to further ultrasonic cleaning. Subsequently, the samples were thoroughly rinsed with deionized water and completely dried. Zirconia beads were used as a medium for surface shot peening. These spherical beads with a diameter of 0.25 mm were selected to ensure a uniform effect on the surface. The shot-peening parameters were carefully selected to ensure uniform and controlled effects. During the shot-peening process, a nozzle with a 4-mm opening was positioned 100 mm from the sample surface. The trajectory of the zirconia beads was maintained perpendicular to the plane of the sample surface. This process was designed to induce plastic deformation and work hardening on the metal surface, thereby enhancing its fatigue resistance. Multiple chemical corrosion techniques were used to modify the surface characteristics of the samples. A stable mixed acid solution of HNO3 and HCl was used as the primary corrosive medium. To ensure reagent stability, all mixed acid solutions were prepared under subambient conditions. Initial HNO3 and HCl concentrations of 70 and 37 vol%, respectively, were translated into molar concentrations of 16.78 and 12 M. Two ratios of mixed acids were prepared, namely, 6 M HNO3:6 M HCl and 3 M HNO3: 6 M HCl. Other corrosive media, such as HCl and CH3COOH with NaCl, were also prepared for experimentation. For electrochemical corrosion treatment, polished 316L stainless-steel samples were positioned as an anode in contact with the positive terminal of a pulsed potentiostat. A platinum electrode connected to the negative terminal of the potentiostat was used as the cathode. Stirring was facilitated by a magnetic stirrer to ensure an even distribution of ions within the corrosive medium. Initially, the anodic reaction between the 316L stainless steel and chloride ions in the corrosive medium resulted in corrosion. However, over time, a self-protective mechanism was observed as the Cr in the stainless steel formed a passive Cr3+ layer on the surface, hindering further corrosion. Therefore, to promote further corrosion, a positive-to-negative potential alternation approach was employed. This sample transformation from an anode to a cathode triggered reactions between H+ and the passive oxide layer (Cr2O3), thus generating OH− and H2O on the surface and intensifying the corrosion process.
2.2. Surface characteristics of 316L stainless-steel samples
In this study, SEM (JSM 5600) was used to examine the surface morphology of the fabricated samples. SEM operates on the principle of secondary electron emission, in which weakly bonded (<50 eV) electrons are emitted by sample atoms when bombarded by accelerated electrons. Secondary electrons generated at a depth of approximately 50–500 Å from the sample surface are detected. In this study, Raman spectroscopy was conducted using a Renishaw inVia Raman microscope. A 633-nm He–Ne laser with a scanning range of 200–1500 cm−1 and a constant power output of 10 mW was used as the light source. Raman spectroscopy is used to investigate vibrational spectra. Each material has a unique vibrational line. As such, Raman spectroscopy provides valuable information regarding crystalline properties and atomic bonding. In this study, the surface roughness of the samples was evaluated by moving a probe linearly along the sample surface and recording the resulting deviations. A Veeco Dektak profiler with the following parameter settings was used for this purpose: a scanning distance of 1000 μm, a scanning time of 10 s, and a stylus force of 10 mg. After the samples were polished to achieve a mirror-like finish, appropriate chemical etchants, namely, Marble’s reagent (2 g of CuSO4 + 10 mL of H2O + 10 mL of H2SO4) and aqua regia (HCl/HNO3 = 3:1), were for controlled chemical corrosion. The resulting microstructural features were observed using metallographic OM (Olympus BHM) to obtain insights into the metallographic characteristics of the specimens.
2.3. Cell culture
Human osteoblast adhesion to 316L stainless-steel specimens subjected to various surface treatments was evaluated. Initially, 316L stainless-steel samples were sterilized and autoclaved to ensure aseptic conditions. The samples were subsequently coated with fetal bovine serum and placed in a cell culture incubator at 37°C for 30 min to promote cell adhesion. Human osteoblasts were seeded onto the samples at a of 5 × 10⁵/cm2 and cultured at 37°C for 2 h to facilitate cell adhesion. Subsequently, 2 mL of culture medium was added to each specimen-containing culture dish, and the samples were cultured for 1 week at 37°C to promote cell growth. After 1 week, the specimens were retrieved, the excess culture medium was aspirated, and the samples were fixed using 3.5–4.0 vol% formalin solution for 30 min. Finally, Liu’s stain was used to stain the specimens, and cell adhesion was evaluated using OM. Overall, this comprehensive experimental procedure ensured aseptic conditions for evaluating cell adhesion to 316L stainless-steel samples subjected to diverse surface treatments.
3. Results and discussion
3.1. Surface morphology and roughness of polished 316L stainless steel after immersion corrosion
SEM imaging can reveal the dynamic nature of corrosion and its effect on the surface morphology of 316L stainless steel. Changes in surface structure and roughness may have implications for material performance and long-term durability. Figure 1a shows the surface morphology of a 316L stainless-steel sample after grinding and polishing. This treatment resulted in a smooth and polished surface, which is desirable for many applications. Figure 1b,c depict the surface morphology of 316L stainless-steel samples after corrosion by a mixture of 6 M HNO3 and 6 M HCl for 3 and 6 min, respectively, at room temperature. These corrosion conditions simulated a more aggressively acidic environment. The images reveal the formation of corrosion products, including pits, etch patterns, and surface roughening. Because of the uniform and comprehensive corrosion observable in the SEM images, the corrosion process that occurred at ambient temperature did not result in well-defined pits or cavities on the surface. In addition, the corrosion reaction that occurred at room temperature was excessively aggressive, hindering the precise assessment of sample conditions. Therefore, to overcome these limitations and improve control over the corrosion process, corrosion experiments were conducted at lower temperatures. By lowering the temperature to −5°C, we achieved a more controlled and manageable corrosion reaction. Figure 1d shows the surface morphology of a 316L stainless-steel sample after corrosion by a mixture of 3 M HNO3 and 6 M HCl for 6 min at −5°C. This low temperature affected the kinetics of corrosion. The image further depicts the different surface morphology, including more pronounced features, suggesting of the formation of corrosion products different from those formed at room temperature.
Generally, α-step thin-film thickness profiling is a nondestructive surface analysis technique used to measure the thickness of thin films or corroded surfaces. This step-principle-based technique involves moving a probe across the surface and recording the corresponding height variations to determine the thickness profile of a film. To examine the electrochemical corrosion of 316L stainless steel, α-step thin-film thickness profiling can be used to observe the morphological changes and thickness variations of the material surface after corrosion. The distribution of thin-film thickness on the corroded material surface can be obtained by recording probe movement and height variations. This technique aids in understanding the changes that occur in 316L stainless-steel thin films during electrochemical corrosion, thereby clarifying the corrosion behavior and performance of various materials. Average roughness (Ra) and root-mean-square roughness (Rq) are parameters commonly used for characterizing surface roughness. Average roughness (Ra) is the arithmetic average of a surface’s height deviations and is calculated by dividing the sum of the absolute values of all height deviations by the measured length of the surface. A larger Ra value indicates a rougher surface. Root-mean-square roughness (Rq) is the average amplitude of height deviations on a surface and reflects the average magnitude of surface height variations. It is obtained by calculating the square root of the average of the squared sum of all height deviations. A larger Rq value indicates greater height variations on the surface. Both Ra and Rq are widely used as indicators of surface roughness, providing a quantitative description of the overall roughness of a surface. In α-step thin-film thickness profiling, Ra and Rq can be used to evaluate changes in surface roughness in 316L stainless steel after electrochemical corrosion. Table 1 presents the measured surface roughness values of our samples, revealing severe corrosion of the 316L stainless steel.
In chloride-rich environments, because stainless steel typically undergoes localized pitting corrosion as a result of the breakdown of the passive film protecting the substrate, the absence of localized pits can be attributed to the high concentration of HNO3. However, at high concentrations of H+, the overall corrosion rate is faster than the rate of pit formation, thus resulting in the absence of pits on the surface. Furthermore, when the samples were cooled to −5°C and the mixed acid solution was modified, the surface morphology was considerably improved. This improvement can be attributed to the reduced concentration of nitric acid, which slowed down the reaction. Overall, this procedure provided a preliminary understanding of the surface morphology of the samples.
3.2. Surface morphology and roughness of hydrogen-charged 316L stainless steel after immersion corrosion
316L stainless steel has a passive film composed of Cr2O3 on its surface which makes it resistant to reactions and corrosion. In this study, to enhance the surface morphology of 316L stainless steel, we employed a low-temperature approach while adjusting the composition of the corrosive solution. Although the formation of pores was not as expected, the reduced temperature and modified corrosive solution concentration reduced the protective ability of the passive film on the 316L stainless-steel substrate. Therefore, we conducted hydrogen-charging experiments, with or without corrosion. After introducing hydrogen ions to induce uniform stress on the surface of steel, we examined the corrosion behavior and sample surface morphology. Table 2 presents the surface roughness measurements of the samples. After hydrogen charging, the surface roughness of the 316L stainless steel increased, indicating a slight deformation of steel surface during hydrogen charging. Initially, we expected that the diffusion of hydrogen into the sample surface would lead to surface delamination and pore formation. However, SEM analysis (Figure 2a,b) indicated the presence of cracks, which resulted from the diffusion of hydrogen atoms into the samples. These results indicated that hydrogen charging was not suitable for the intended purpose. As shown in Figure 2c,d, the hydrogen-charged samples underwent additional corrosion resulting in a surface morphology similar to that achieved with low-temperature treatment. The surface roughness of these samples closely resembled that of samples treated at low temperatures. The extended corrosion time presumably completely corroded the surface layer containing hydrogen atoms, resulting in an extremely thin hydrogenated layer. Hence, even with the breakdown of the passive film, 316L stainless steel remains challenging to hydrogen charge.
3.3. Surface morphology and roughness of 316L stainless steel after shot peening and subsequent immersion corrosion
To determine the effects of pretreatment through surface peening on the surface corrosion of 316L stainless steel, we applied the same immersion corrosion conditions. Figure 3a shows an SEM image of a sample that underwent peening at a force of 0.5 kg/cm2 for 20 s followed by immersion corrosion. Under these peening conditions, the expected surface pores were not observed, presumably because of the insufficient peening force leading to a thin stress layer on the stainless-steel surface. Additionally, the subsequent prolonged immersion corrosion may have depleted the stress layer, thus preventing the formation of surface pores. Figure 3b depicts the SEM image of a sample that underwent peening with a force of 0.5 kg/cm2 for 40 s followed by immersion corrosion. In this scenario, surface pores were evident, presumably because of the extended peening time, which resulted in a thicker stress layer. Immersion corrosion yielded recessed bowl-shaped pores with a diameter of approximately 10 μm on the surface, with three-dimensionally undulating topography. Comparing the surface morphologies depicted in Figure 3a,b reveals that longer peening times resulted in the accumulation or uneven distribution of internal stresses, thus affecting the corrosion of the metal material. Simultaneously, these internal stresses presumably caused minor surface defects, such as small cracks or depressions, which served as the initiation sites for localized corrosion, potentially accelerating the corrosion process, especially because localized corrosion often proceeds more rapidly and severely than general corrosion. Peening time also presumably affected the microstructure of the stainless-steel, with longer times rendering the surfaces rougher or less even. These structural alterations presumably increased the surface area, thus exposing additional metal to the corrosive environment and consequently accelerating the corrosion process. Similarly, stronger peening forces presumably yielded outcomes similar to those achieved with longer peening times. Figure 3c depicts the results obtained when the same short peening time (20 s) was used but with a greater force of 1 kg/cm2. This configuration revealed numerous small pores within large recesses, unlike the peening results shown in Figure 3b, presumably contributing to a surface morphology conducive to cell adhesion. We also increased the peening force while shortening the peening time to obtain different samples and observe their surface morphologies (Figure 3d). However, despite fairly uniform corrosion, no surface pores were observed. As shown in Table 3, increasing the peening force (1 kg/cm2) and shortening the peening time (10 s) resulted in excessive surface roughness. According to the literature, the optimal range for surface roughness is 1–10 μm, with a diameter of 1–4 μm and a depth of 1.5 μm for hemispherical pores. In this study, when a peening force of 0.5 kg/cm2 was used for 40 s or when a peening force of 1.0 kg/cm2 was used for 20 s, the pore characteristics approximated these optimal values.
3.3. Surface morphology and roughness of polished 316L stainless steel after electrochemical corrosion
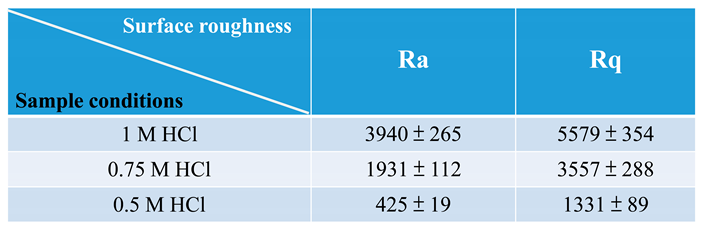
Figure 4 shows SEM images of 316L stainless-steel surfaces after electrochemical corrosion with various concentrations of corrosive solution at the same current density, anodic and cathodic times, and period of alternating anodic and cathodic cycles. According to the results of previous experiments, at a low current density, localized pitting corrosion occurs on the surface of 316L stainless steel. However, increasing the current density to ±30 mA/cm2 results in uniform and comprehensive surface corrosion. As shown in Figure 4a, the surface exhibited numerous bowl-shaped recesses after corrosion, but both the aperture and depth of the pores exceeded the optimal values. Figure 4b depicts densely distributed irregularly shaped pores with interconnecting features and nonuniform dimensions unsuitable for cell adhesion. Figure 4c shows an ideal surface morphology with uniform corrosion, sparse localized pitting, and pores with apertures and depths smaller than 4 μm, which promote cell adhesion and growth. In the enlarged view, numerous small recesses are observable within the hemispherical pores, creating favorable three-dimensional surface topography. By varying the concentration of HCl for electrochemical corrosion with all other conditions fixed, we observed that the highest acid concentration (1 M) did not induce pore formation on the stainless-steel surface. By contrast, reducing the concentration of HCl to 0.75 M resulted in numerous pores. This phenomenon is presumably linked to the effect of HCl concentration on the corrosion of stainless steel. In HCl solutions, an acidic environment may initiate metal corrosion, particularly that of stainless steel.
Under such conditions, a higher acid concentration (1 M) may induce a more vigorous acidic attack, potentially resulting in less pronounced corrosion on the surface of stainless steel. However, reducing the concentration of HCl to 0.75 M may intensify the corrosion process, resulting in more noticeable pore formation. Changes in the concentration of HCl may also affect the rate and nature of electrochemical reactions. A higher concentration of HCl may restrict certain corrosion reactions, whereas a lower concentration may stimulate more extensive corrosion reactions, thus contributing to pore formation. Under certain conditions, a higher concentration of HCl may facilitate the formation of a protective oxide film or a hydrochloric acid passivation layer, thus effectively reducing the rate of metal corrosion. However, reducing the concentration of HCl may inhibit the formation of such a protective film, thus enhancing the corrosion process. As shown in Table 4, reducing the concentration of HCl to 0.5 M resulted in pores on the surface of the 316L stainless-steel samples. The drawbacks were that the pore aperture and depth were smaller than the optimal values and the effect thereof on cell adhesion remains uncertain.
3.4. Raman analysis of 316L stainless steel after various surface treatments
Stainless-steel alloys such as 316L are renowned for their corrosion resistance. On the surface of these alloys, an oxide layer forms as a common response to corrosion, bolstering the overall corrosion resistance of the material. Raman spectroscopy is a powerful tool for analyzing the composition and structure of these oxide layers. It provides valuable insights into the corrosion mechanism and protective properties of oxide films. In this study, the Raman spectra obtained for the surface of corroded 316L stainless steel exhibited characteristic shifts in the peaks associated with oxide components. Specifically, two Fe2O3 peaks were detected at 226 and 292 cm−1, and a single CrO peak was detected at 972 cm−1. Notably, the signal intensity of these peaks was weak, indicating that the oxide films were thin. This observation is consistent with the fact that the strength of a Raman signal is correlated with the abundance of molecules present within the probed volume. As shown in Figure 5a, Raman spectroscopy of chemically immersed corrosion-treated 316L stainless steel revealed prominent shifts in the Raman peaks corresponding to alloy element oxide constituents. Specifically, distinctive peaks associated with Fe2O3 (226 and 292 cm−1) and CrO (972 cm−1) were detected. These peaks had moderate intensity, suggesting that the oxide film layer was thin. This observation is consistent with the fact that the strength of a Raman signal reflects the concentration of molecules within the probed region. As shown in Figure 5b, comparative Raman spectroscopy of hydrogen-permeation-treated 316L stainless steel revealed that the treatment did not result in the formation of alloy hydrides on the surface. Instead, shifts in Raman peaks corresponding to Fe2O3 and CrO were detected. The signal intensities of these peaks were moderate, consistent with the nature of thin oxide film layers. As shown in Figure 5c, the Raman spectra of 316L stainless-steel samples subjected to shot-peening pretreatment and subsequent immersion corrosion exhibited distinctive shifts in peaks. This finding suggest that the peening pretreatment disrupted the corrosion-resistant passivation films, potentially including CrO, on the surface. Notably, the signal intensities of the Raman peaks were considerably stronger than those of the samples that did not undergo shot-peening pretreatment. This discrepancy can be attributed to thicker oxide film layers resulting from the interaction between the bead-blasted surface and the corrosive environment. As shown in Figure 5d, comparative Raman spectroscopy of 316L stainless steel treated with varying HCl concentrations revealed distinct shifts in Raman peaks. These shifts suggested the presence of alloy element oxide constituents, including Fe2O3 and CrO, on the surface. These observed shifts are indicative of corrosion-induced oxidation reactions that lead to the formation of oxide components.
3.5. Spreading and surface morphology of osteoblasts on 316L stainless steel that underwent various surface treatments
Figure 6 depicts OM images showing the results of cell adhesion tests conducted on 316L stainless-steel surfaces. To determine how surface modifications affected the adherence of osteoblasts, we subject these surfaces to distinct shot-peening pretreatments before low-temperature corrosion. Figure 6a,d show sections of surfaces stained with a blue dye after cell adhesion. The figures show sporadic staining but show the attached cells. This lack of distinct cell morphology raises questions regarding the success of cell adhesion under these conditions. By contrast, Figure 6b is promising. Within certain regions, purple-stained nuclei are evident, indicating the robust adhesion of osteoblasts to the surface. The well-defined cell nuclei and their intact shapes provide strong evidence of successful cellular adhesion. This observation indicates that the specific shot-peening pretreatment and subsequent corrosion treatment conditions contributed to an environment conducive to osteoblast adhesion. Moreover, the OM image of the surface in Figure 6c appears dark red. This peculiarity can be attributed to the substantial surface roughness causing light scattering and diffraction, which in turn result in reduced optical brightness. Consequently, the purple dye used for staining had a dark red appearance. Despite this phenomenon, definitive determination of cell adhesion is challenging because of the lack of a well-defined cellular structure in the image. This limitation highlights the complexity of optical analysis, particularly of surfaces with uneven topography.
Figure 7 shows OM images of cell adhesion tests conducted on 316L stainless-steel surfaces. These surfaces underwent electrochemical corrosion with different concentrations of HCl before cell adhesion. Figure 7a provides intriguing insights. Despite minor scratches, osteoblasts adhered to the pristine 316L stainless-steel surface. Regardless of the direction of these scratches, the adhesion pattern of the cells remained uniform. This uniform and directional cell adhesion suggested that the original surface topography played a key role in guiding and influencing cellular adhesion. Figure 7c reveals a considerable improvement in cell adhesion on an electrochemically modified surface. Compared with untreated 316L stainless steel, the electrochemically corroded surface exhibited denser and more well-defined cell adhesion. This distinct cellular morphology indicated enhanced adhesion, presumably attributable to the altered surface topography resulting from electrochemical treatment. This finding is consistent with a previous observation of optimal cell adhesion on surfaces featuring specific pore sizes obtained through electrochemical corrosion. Figure 7b depicts an opposite scenario. The presence of numerous pores on the surface of 316L stainless steel resulted in nonuniform cell adhesion and indistinct cellular shapes. Some purple staining within the pores indicated partial cell entrapment. Overall, although cell adhesion was evident, the unevenness, excessive number and depth of pores, and lack of distinct cellular morphology of the surface are suboptimal for fostering strong adhesion. In addition, the pronounced disparities in surface height and the presence of extensive and deep pores raise concerns regarding the practicality of the surface for cleaning, sterilization, and use.
4. Conclusions
In this study, we examined how porous oxide layers form on 316L stainless-steel surfaces through low-temperature immersion corrosion, shot peening, and electrochemical corrosion. Comprehensive analysis of the resulting surface properties revealed the effects on surface morphology. Our experimental results highlight shot peening (1 kg/cm2 shot peening for 20 s) and electrochemical corrosion (0.5 M HCl) as effective processes. Shot peening resulted in semicircular grooves with numerous small corrosion pits conducive to cell adhesion and growth. Electrochemical corrosion yielded uniformly dense corrosion pits with pore sizes ranging from 1 to 4 μm, closely resembling the optimal surface conditions described in the literature. Cell adhesion tests corroborated the hypothesized superiority of electrochemical corrosion (0.5 M HCl) to peening followed by immersion corrosion. Compared with shot peening, electrochemical corrosion exhibited more advantages, such as more even and denser cell adhesion, a more well-defined osteoblast morphology, and more organized cell adhesion. These findings collectively underscore the suitability of electrochemical corrosion for achieving surfaces more conductive to cell adhesion and favorable for subsequent biomedical applications.
Author Contributions
Conceptualization, T.-I W.; methodology, Y.-C. L.; validation, V.K.S.H. and T.-I W.; formal analysis, V.K.S.H., T.-I W. and H.-C. W.; investigation, Y.-C. L. and T.-I W.; resources, T.-I W. and H.-C. W; data curation, Y.-C. L. and V.K.S.H.; writing—original draft preparation, V.K.S.H.; writing—review and editing, V.K.S.H., T.-I W. and H.-C. W. ; funding acquisition, T.-I W. and H.-C. W All authors have read and agreed to the published version of the manuscript.
Funding
This research was funded by Ministry of Science and Technology (MOST) of Taiwan under the project number MOST110-2221-E-260-008-MY3
Conflicts of Interest
The authors declare no conflict of interest.
References
- Li, Z.; Kawashita, M. Current progress in inorganic artificial biomaterials. J. Artif. Organs 2011, 14, 163–170. [Google Scholar] [CrossRef] [PubMed]
- Prasad, K.; Bazaka, O.; Chua, M.; Rochford, M.; Fedrick, L.; Spoor, J.; Symes, R.; Tieppo, M.; Collins, C.; Cao, A.; et al. Metallic Biomaterials: Current Challenges and Opportunities. Materials 2017, 10, 884. [Google Scholar] [CrossRef]
- Agrawal, C. M. Reconstructing the human body using biomaterials. JOM 1998, 50, 31–35. [Google Scholar] [CrossRef]
- Patel, N. R.; Gohil, P. P. A review on biomaterials: scope, applications & human anatomy significance. Int. J. Emerg. Technol. Adv. Eng 2012, 2, 91–101. [Google Scholar]
- Merola, M.; Affatato, S. Materials for Hip Prostheses: A Review of Wear and Loading Considerations. Materials 2019, 12, 495. [Google Scholar] [CrossRef]
- Colic, K.; Sedmak, A. The current approach to research and design of the artificial hip prosthesis: a review. Rheumatol. Orthop. Med. 2016, 1, 1–7. [Google Scholar] [CrossRef]
- Zaman, H. A.; Sharif, S.; Idris, M. H.; Kamarudin, A. Metallic biomaterials for medical implant applications: a review. Appl. Mechan. Mater. 2015, 735, 19–25. [Google Scholar] [CrossRef]
- Nasab, M. B.; Hassan, M. R.; Sahari, B. B. Metallic biomaterials of knee and hip-a review. Trends Biomater. Artif. Organs 2010, 24, 69–82. [Google Scholar]
- Lee, K.; Goodman, S. B. Current state and future of joint replacements in the hip and knee. Expert Rev. Med. Devices 2008, 5, 383–393. [Google Scholar] [CrossRef]
- Khanna, R.; Ong, J.L.; Oral, E.; Narayan, R.J. Progress in Wear Resistant Materials for Total Hip Arthroplasty. Coatings 2017, 7, 99. [Google Scholar] [CrossRef]
- Hussein, M. A.; Mohammed, A. S.; Al-Aqeeli, N. Wear characteristics of metallic biomaterials: a review. Materials 2015, 8, 2749–2768. [Google Scholar] [CrossRef]
- Saini, M.; Singh, Y.; Arora, P.; Arora, V.; Jain, K. Implant biomaterials: A comprehensive review. WJCC 2015, 3, 52. [Google Scholar] [CrossRef]
- Semlitsch, M. Titanium alloys for hip joint replacements. Clinical Mater. 1987, 2, 1–13. [Google Scholar] [CrossRef]
- Balazic, M.; Kopac, J.; Jackson, M. J.; Ahmed, W. Titanium and titanium alloy applications in medicine. Int. J. Nano Biomater. 2007, 1, 3–34. [Google Scholar] [CrossRef]
- Mahajan, A.; Devgan, S.; Kalyanasundaram, D. Surface alteration of Cobalt-Chromium and duplex stainless steel alloys for biomedical applications: a concise review. Mater. Manuf. Process. 2023, 38, 260–270. [Google Scholar] [CrossRef]
- Zaman, H. A.; Sharif, S.; Kim, D. W.; Idris, M. H.; Suhaimi, M. A.; Tumurkhuyag, Z. J. P. M. Machinability of cobalt-based and cobalt chromium molybdenum alloys-a review. Procedia Manufacturing 2017, 11, 563–570. [Google Scholar] [CrossRef]
- Trepanier, C.; Tabrizian, M.; Yahia, L. H.; Bilodeau, L.; & Piron, D. L. Effect of modification of oxide layer on NiTi stent corrosion resistance. J. Biomed. Mater. Res. 1998, 43, 433–440. [Google Scholar] [CrossRef]
- Mohammed, M. T.; Khan, Z. A.; Siddiquee, A. N. Surface modifications of titanium materials for developing corrosion behavior in human body environment: a review. Procedia Mater. Sci. 2014, 6, 1610–1618. [Google Scholar] [CrossRef]
- Jaishankar, M.; Tseten, T.; Anbalagan, N.; Mathew, B. B.; Beeregowda, K. N. Toxicity, mechanism and health effects of some heavy metals. Interdiscip. Toxicol. 2014, 7, 60–72. [Google Scholar] [CrossRef]
- McKay, G. C.; Macnair, R.; MacDonald, C.; Grant, M. H. Interactions of orthopaedic metals with an immortalized rat osteoblast cell line. Biomaterials 1996, 17, 1339–1344. [Google Scholar] [CrossRef] [PubMed]
- Lei, Y. B.; Wang, Z. B.; Zhang, B.; Luo, Z. P.; Lu, J.; Lu, K. Enhanced mechanical properties and corrosion resistance of 316L stainless steel by pre-forming a gradient nanostructured surface layer and annealing. Acta Materialia 2021, 208, 116773. [Google Scholar] [CrossRef]
- Nakanishi, T.; Tsuchiyama, T.; Mitsuyasu, H.; Iwamoto, Y.; Takaki, S. Effect of partial solution nitriding on mechanical properties and corrosion resistance in a type 316L austenitic stainless steel plate. Mater. Sci. Eng. A 2007, 460, 186–194. [Google Scholar] [CrossRef]
- Corradi, M.; Osofero, A.I.; Borri, A. Repair and Reinforcement of Historic Timber Structures with Stainless Steel—A Review. Metals 2019, 9, 106. [Google Scholar] [CrossRef]
- Järvenpää, A.; Jaskari, M.; Kisko, A.; Karjalainen, P. Processing and Properties of Reversion-Treated Austenitic Stainless Steels. Metals 2020, 10, 281. [Google Scholar] [CrossRef]
- Morsiya, C. A review on parameters affecting properties of biomaterial SS 316L. Aust. J. Mech. Eng. 2022, 20, 803–813. [Google Scholar] [CrossRef]
- Bordjih, K.; Jouzeau, J. Y.; Mainard, D.; Payan, E.; Delagoutte, J. P.; Netter, P. Evaluation of the effect of three surface treatments on the biocompatibility of 316L stainless steel using human differentiated cells. Biomaterials, 1996, 17, 491–500. [Google Scholar] [CrossRef]
- Zhang, H.; Han, J.; Sun, Y.; Huang, Y.; Zhou, M. MC3T3-E1 cell response to stainless steel 316L with different surface treatments. Mater. Sci. Eng. C 2015, 56, 22–29. [Google Scholar] [CrossRef]
- Chai, F.; Ochsenbein, A.; Traisnel, M.; Busch, R.; Breme, J.; Hildebrand, H. F. (2010). Improving endothelial cell adhesion and proliferation on titanium by sol–gel derived oxide coating. J. Biomed. Mater. Res. A 2010, 92, 754–765. [Google Scholar]
- Srinivasan, A.; Rajendran, N. Surface characteristics, corrosion resistance and MG63 osteoblast-like cells attachment behaviour of nano SiO 2–ZrO 2 coated 316L stainless steel. RSC Advances 2015, 5, 26007–26016. [Google Scholar] [CrossRef]
- Latifi, A.; Imani, M.; Khorasani, M. T.; Joupari, M. D. Electrochemical and chemical methods for improving surface characteristics of 316L stainless steel for biomedical applications. Surf. Coat. Technol. 2013, 221, 1–12. [Google Scholar] [CrossRef]
- Hsu, H. J.; Wu, C. Y.; Huang, B. H.; Tsai, C. H.; Saito, T.; Ou, K. L.; Peng, P. W. Surface characteristics and cell adhesion behaviors of the anodized biomedical stainless steel. Appl. Sci. 2020, 10, 6275. [Google Scholar] [CrossRef]
- Kocijan, A.; Conradi, M.; Hočevar, M. The influence of surface wettability and topography on the bioactivity of TiO2/epoxy coatings on AISI 316L stainless steel. Materials 2019, 12, 1877. [Google Scholar] [CrossRef] [PubMed]
- Bahl, S.; Shreyas, P.; Trishul, M. A.; Suwas, S.; Chatterjee, K. Enhancing the mechanical and biological performance of a metallic biomaterial for orthopedic applications through changes in the surface oxide layer by nanocrystalline surface modification. Nanoscale 2015, 7, 7704–7716. [Google Scholar] [CrossRef] [PubMed]
- Martínez-Calderon, M.; Manso-Silván, M.; Rodríguez, A.; Gómez-Aranzadi, M.; García-Ruiz, J. P.; Olaizola, S. M.; Martín-Palma, R. J Surface micro-and nano-texturing of stainless steel by femtosecond laser for the control of cell migration. Sci. Rep. 2016, 6, 36296. [Google Scholar] [CrossRef]
- Saqib, M.; Beshchasna, N.; Pelaccia, R.; Roshchupkin, A.; Yanko, I.; Husak, Y.; Orazi, L. Tailoring surface properties, biocompatibility and corrosion behavior of stainless steel by laser induced periodic surface treatment towards developing biomimetic stents. Surf. Interface 2022, 34, 102365. [Google Scholar] [CrossRef]
- Thakur, A.; Kumar, A.; Kaya, S.; Marzouki, R.; Zhang, F.; Guo, L. Recent advancements in surface modification, characterization and functionalization for enhancing the biocompatibility and corrosion resistance of biomedical implants. Coatings 2022, 12, 1459. [Google Scholar] [CrossRef]
- Shin, Y. C.; Pang, K. M.; Han, D. W.; Lee, K. H.; Ha, Y. C.; Park, J. W.; Lee, J. H. Enhanced osteogenic differentiation of human mesenchymal stem cells on Ti surfaces with electrochemical nanopattern formation. Mater. Sci. Eng, C 2019, 99, 1174–1181. [Google Scholar] [CrossRef]
- Malcor, J. D.; Mallein-Gerin, F. Biomaterial functionalization with triple-helical peptides for tissue engineering. Acta Biomaterialia 2022, 148, 1–21. [Google Scholar] [CrossRef] [PubMed]
- Nouri, C. Wen, 1 - Introduction to surface coating and modification for metallic biomaterials, Editor(s): Cuie Wen, Surface Coating and Modification of Metallic Biomaterials, Woodhead Publishing 2015, 3-60.
- Oshida, Y.; Sachdeva, R.; Miyazaki, S. , & Daly, J. Effects of shot-peening on surface contact angles of biomaterials. J. Mater. Sci.: Mater. Med 1993, 4, 443–447. [Google Scholar]
- Bagherifard, S.; Hickey, D. J.; de Luca, A. C.; Malheiro, V. N.; Markaki, A. E.; Guagliano, M.; Webster, T. J. The influence of nanostructured features on bacterial adhesion and bone cell functions on severely shot peened 316L stainless steel. Biomaterials 2015, 73, 185–197. [Google Scholar] [CrossRef]
- Jang, Y.; Choi, W. T.; Johnson, C. T.; García, A. J.; Singh, P. M.; Breedveld, V.; Champion, J. A. Inhibition of bacterial adhesion on nanotextured stainless steel 316L by electrochemical etching. ACS Biomater. Sci. Eng. 2018, 4, 90–97. [Google Scholar] [CrossRef] [PubMed]
- Asri, R. I. M.; Harun, W. S. W.; Samykano, M.; Lah, N. A. C.; Ghani, S. A. C. Tarlochan, F.; Raza, M. R. Corrosion and surface modification on biocompatible metals: A review. Mater. Sci. Eng. C 2017, 77, 1261–1274. [Google Scholar] [CrossRef] [PubMed]
- Razi, S.; Mollabashi, M.; Madanipour, K. Laser processing of metallic biomaterials: An approach for surface patterning and wettability control. Eur. Phys. J. Plus 2015, 130, 1–12. [Google Scholar] [CrossRef]
- Sirdeshmukh, N.; Dongre, G. Laser micro & nano surface texturing for enhancing osseointegration and antimicrobial effect of biomaterials: A review. Mater. Today: Proc. 2021, 44, 2348–2355. [Google Scholar]
Figure 1.
Surface SEM images of 316L stainless steel after (a) grinding and polishing, (b) substrate corrosion by a mixture of 6 M HNO3 and 6 M HCl for 3 min at room temperature, (c) substrate corrosion by a mixture of 6 M HNO3 and 6 M HCl for 6 min at room temperature, and (d) substrate corrosion by a mixture of 3 M HNO3 and 6 M HCl for 6 min at −5°C.
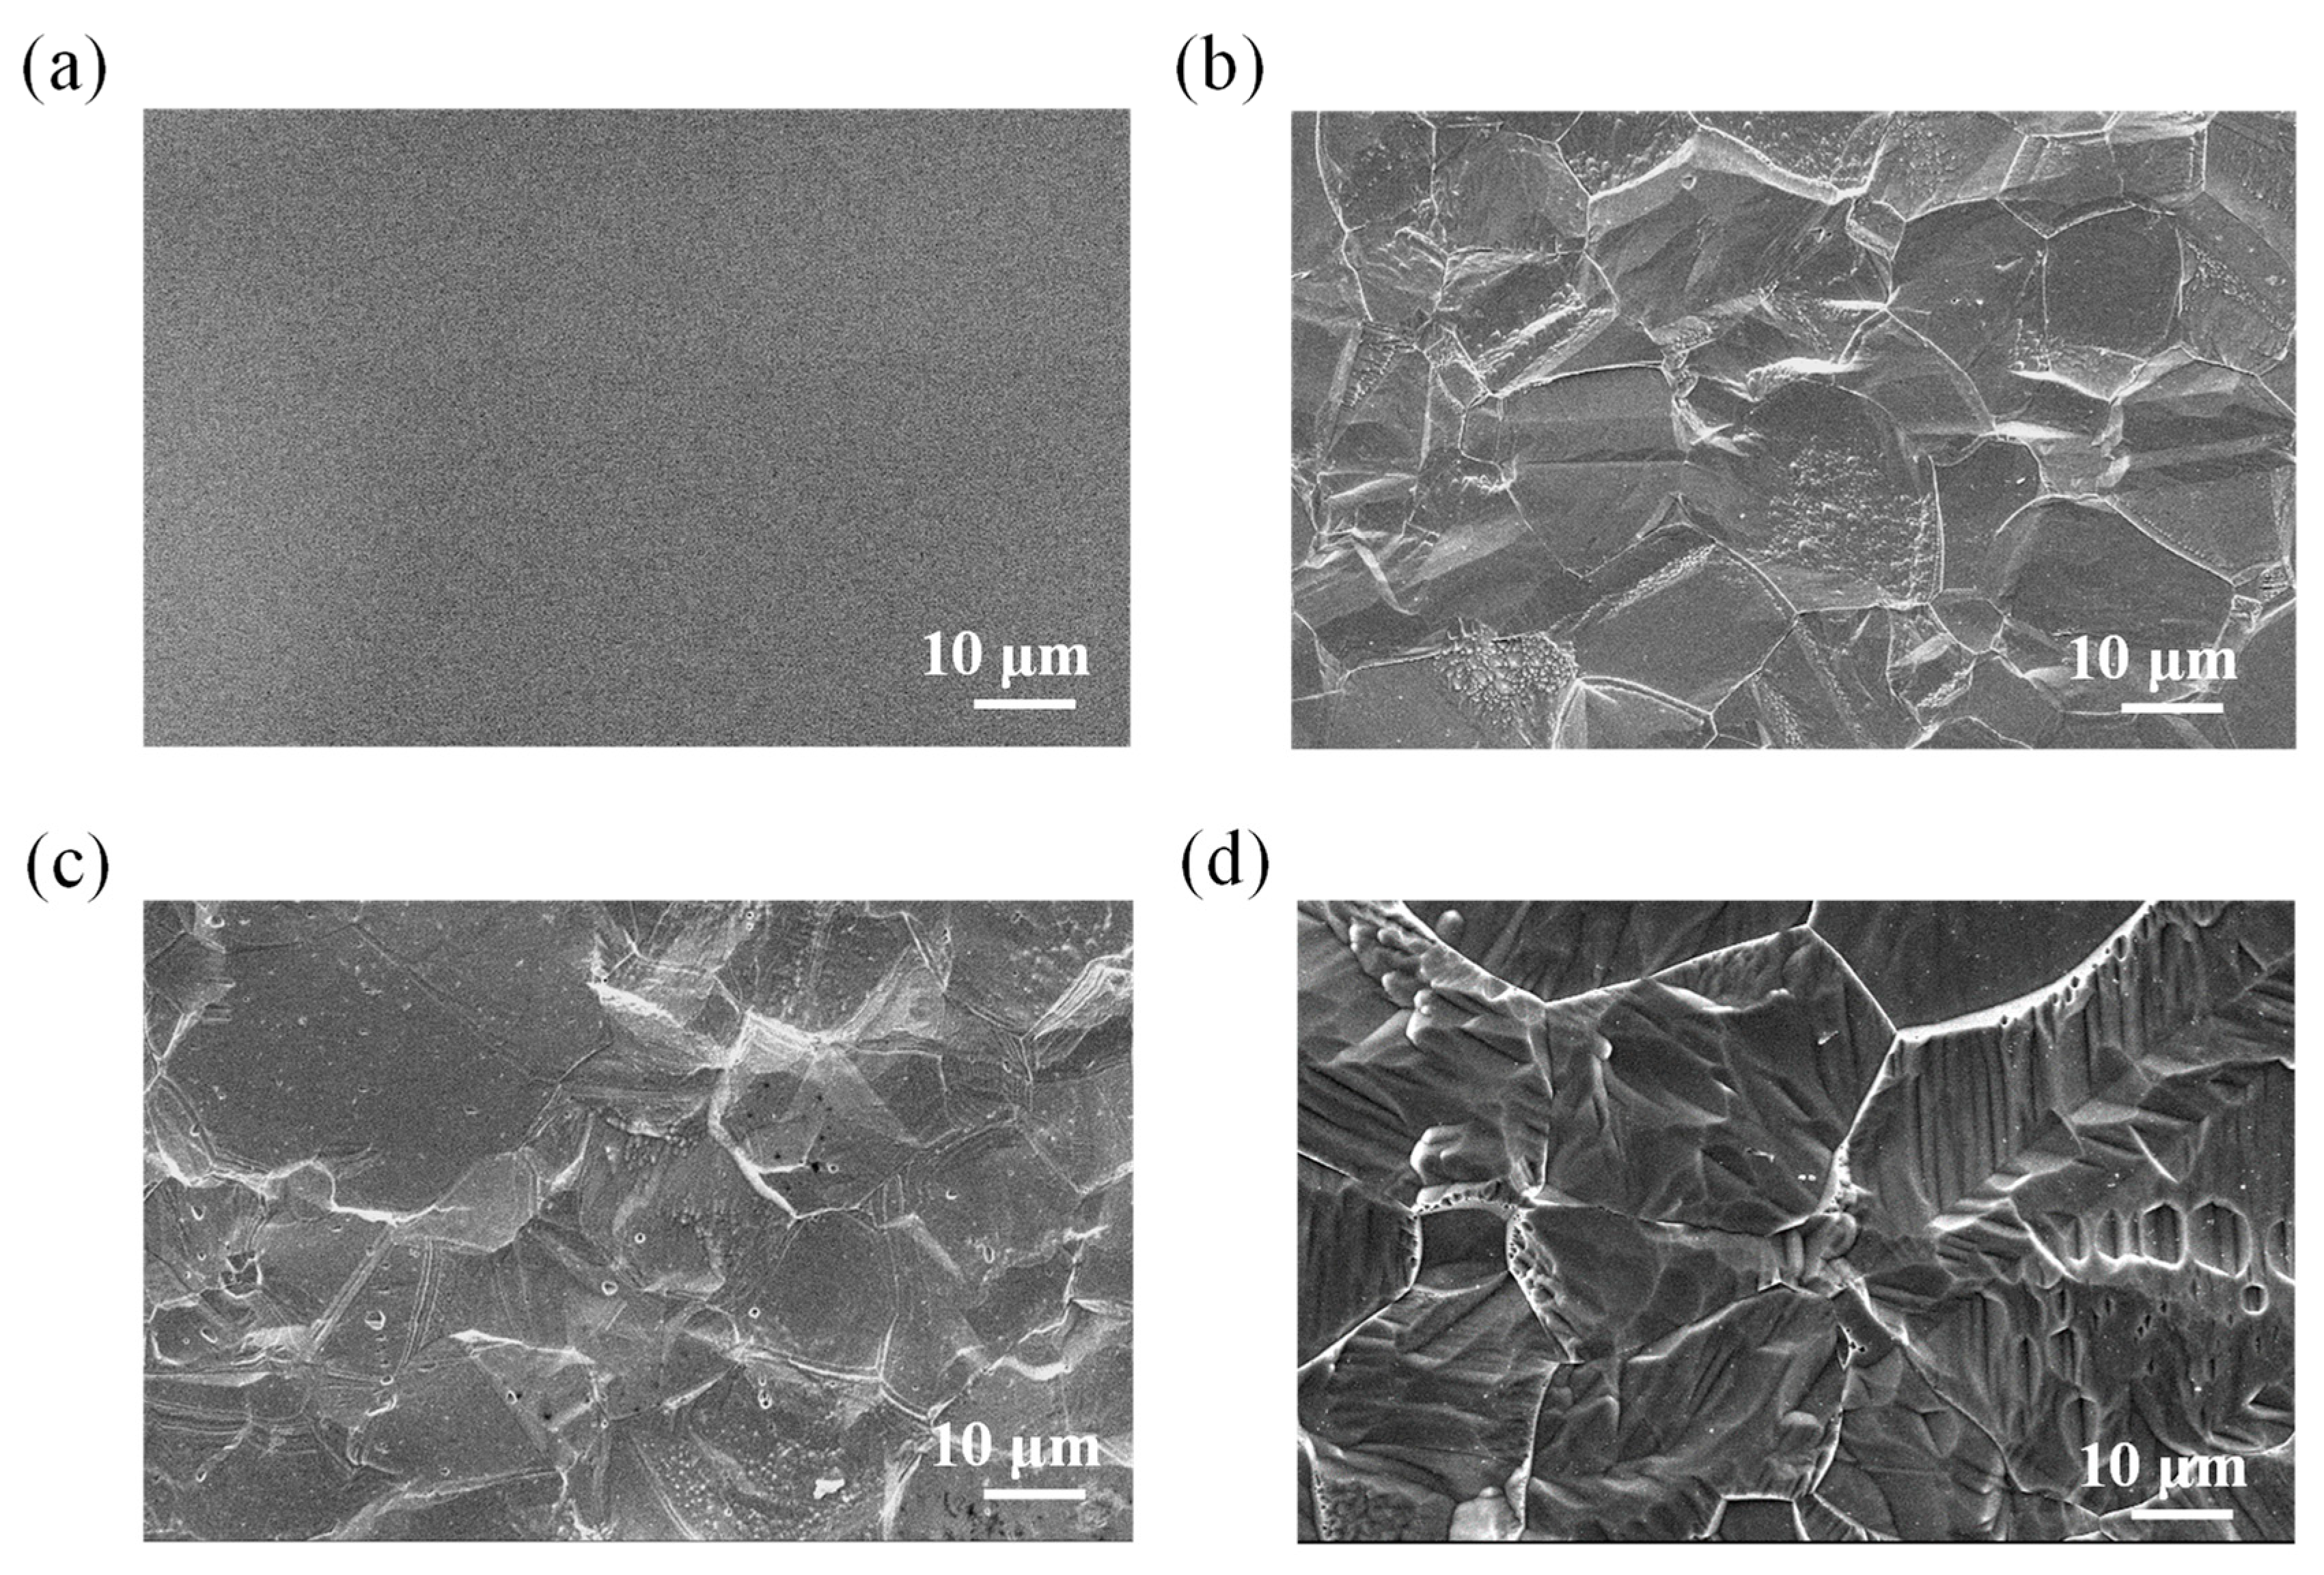
Figure 2.
Surface SEM images of (a) hydrogen-charged 316L stainless steel pretreated with substrate corrosion and (b) 316L stainless steel after hydrogen charging followed by immersion corrosion. Immersion corrosion was conducted with a mixture of 3 M HNO3 and 6 M HCl at −5°C for 6 min.
Figure 2.
Surface SEM images of (a) hydrogen-charged 316L stainless steel pretreated with substrate corrosion and (b) 316L stainless steel after hydrogen charging followed by immersion corrosion. Immersion corrosion was conducted with a mixture of 3 M HNO3 and 6 M HCl at −5°C for 6 min.
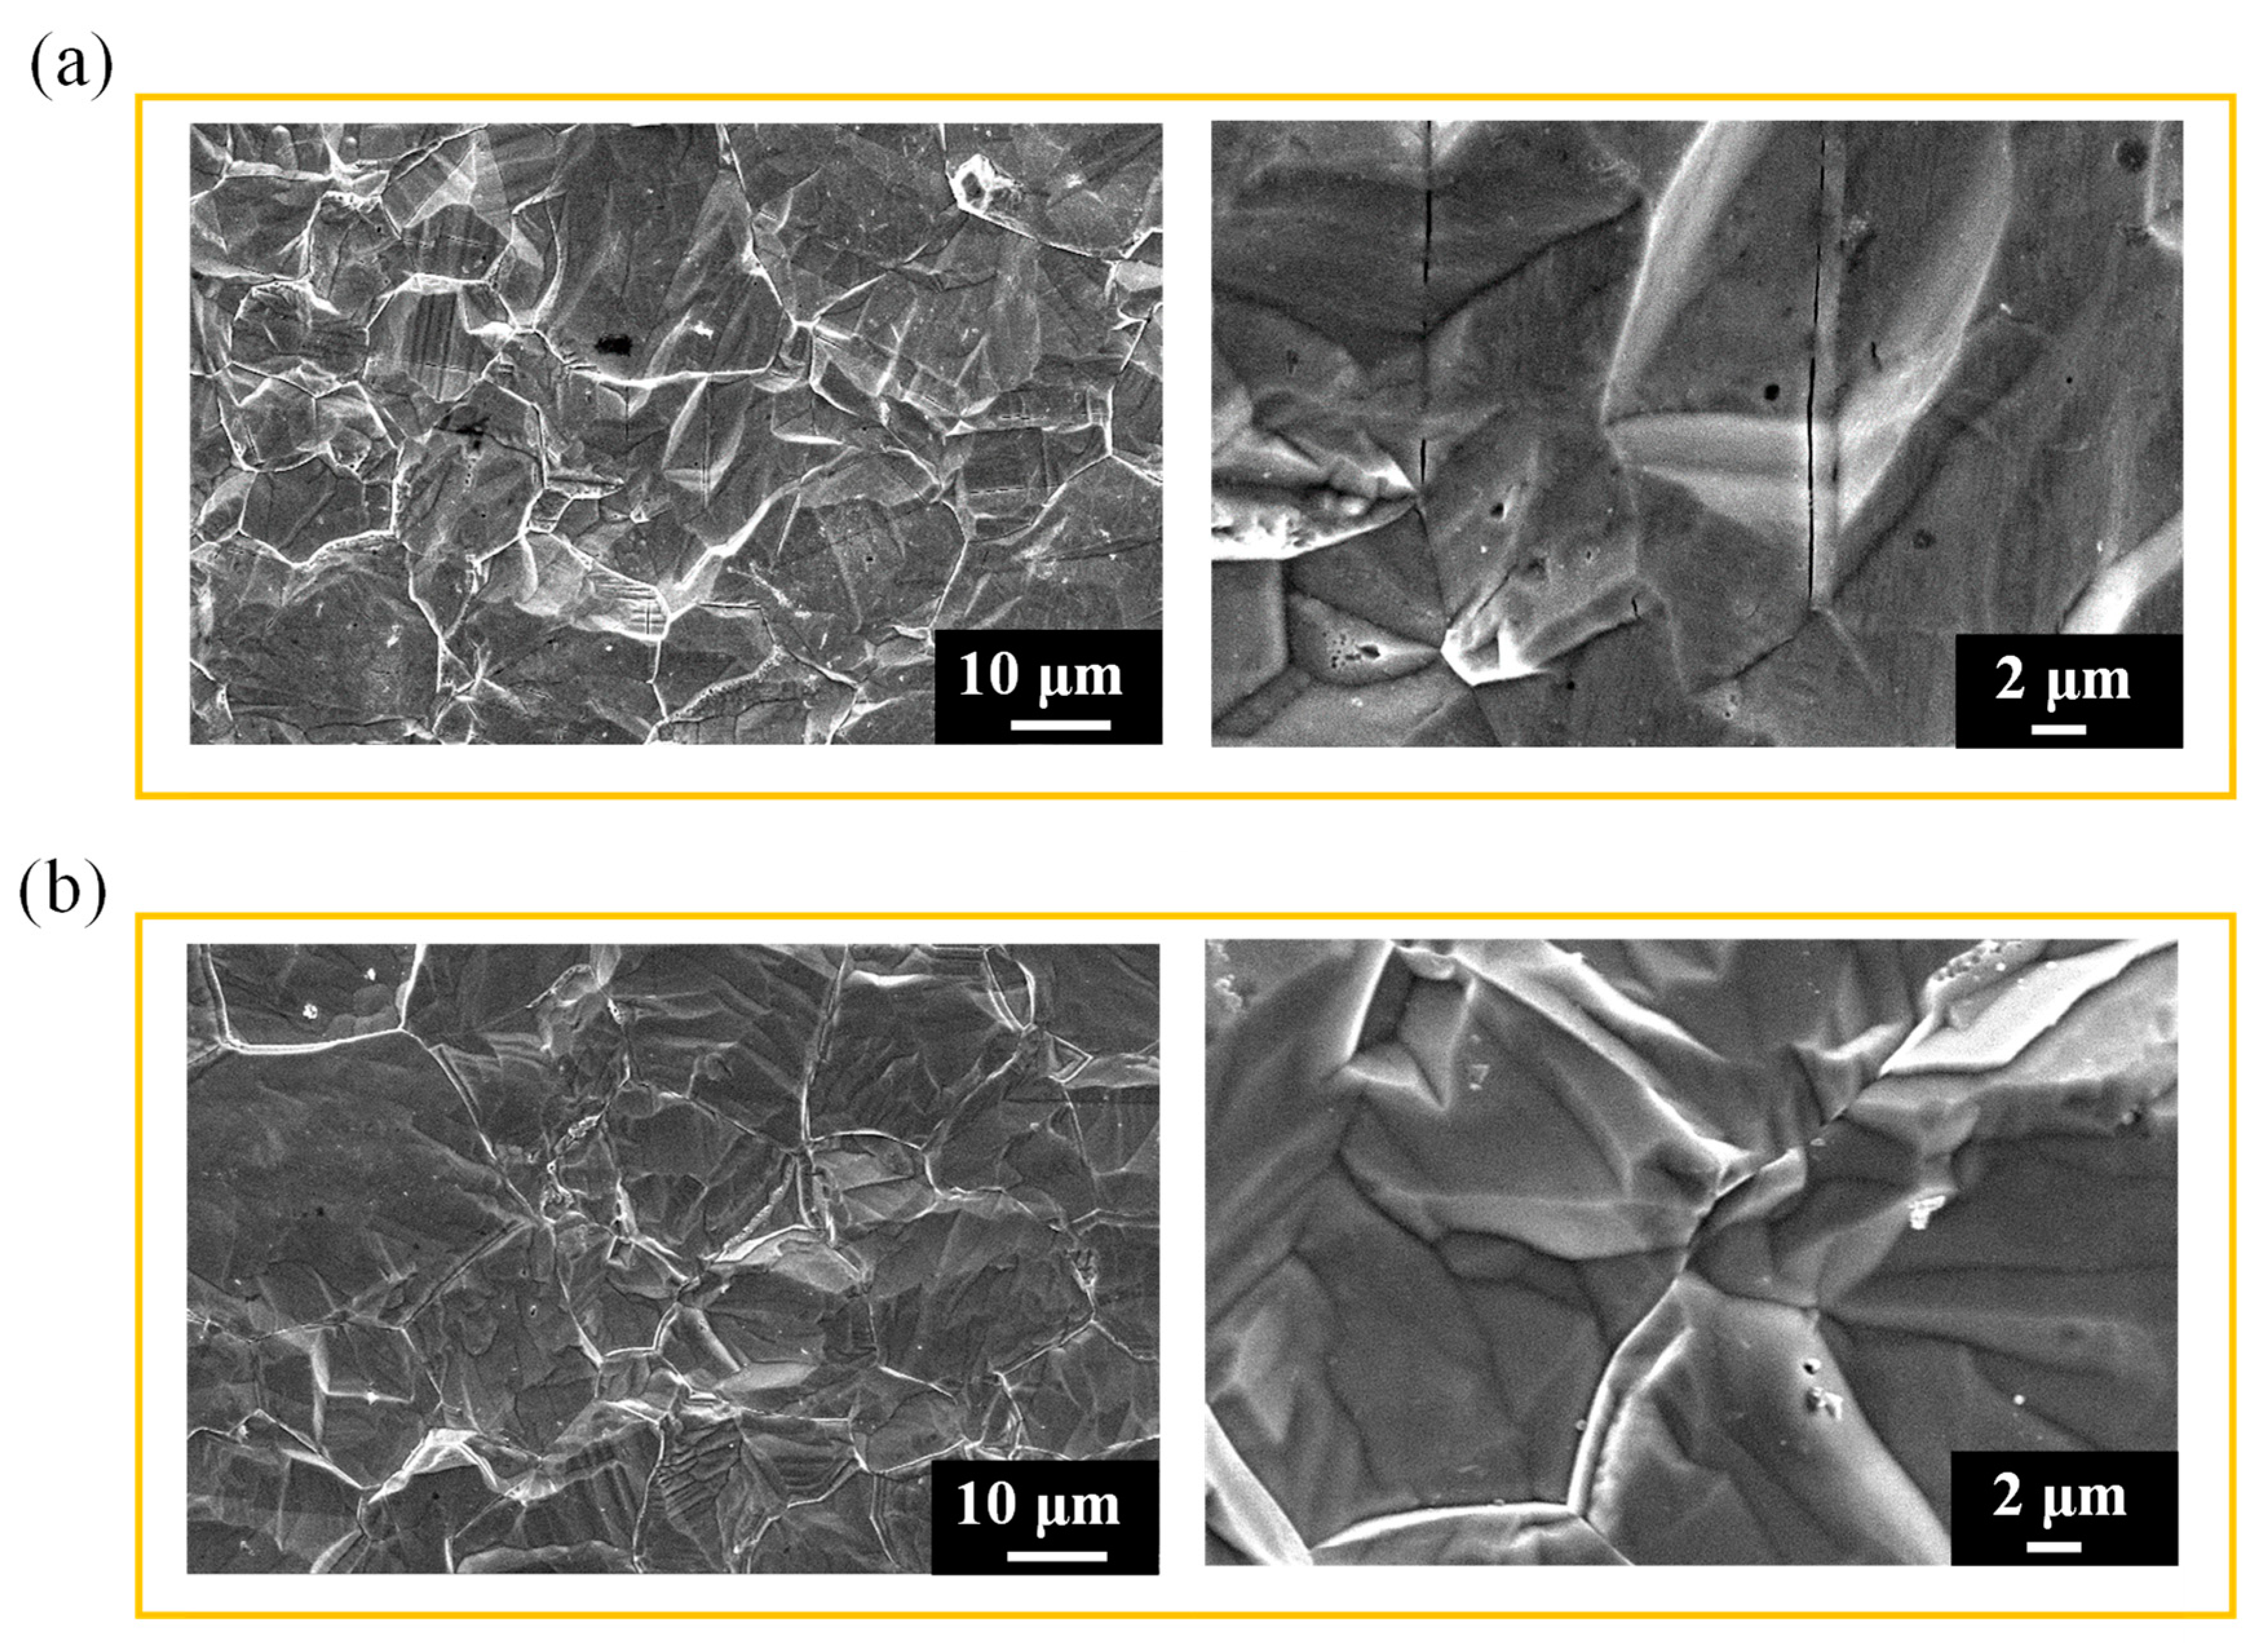
Figure 3.
Surface SEM images of 316L stainless steel pretreated using (a) 0.5-kg/cm2 shot peening for 20 s, (b) 0.5-kg/cm2 shot peening for 40 s, (c) 1-kg/cm2 shot peening for 20 s, and (d) 1.5-kg/cm2 shot peening for 10 s. Immersion corrosion was conducted with a mixture of 3 M HNO3 and 6 M HCl at −5°C for 6 min.
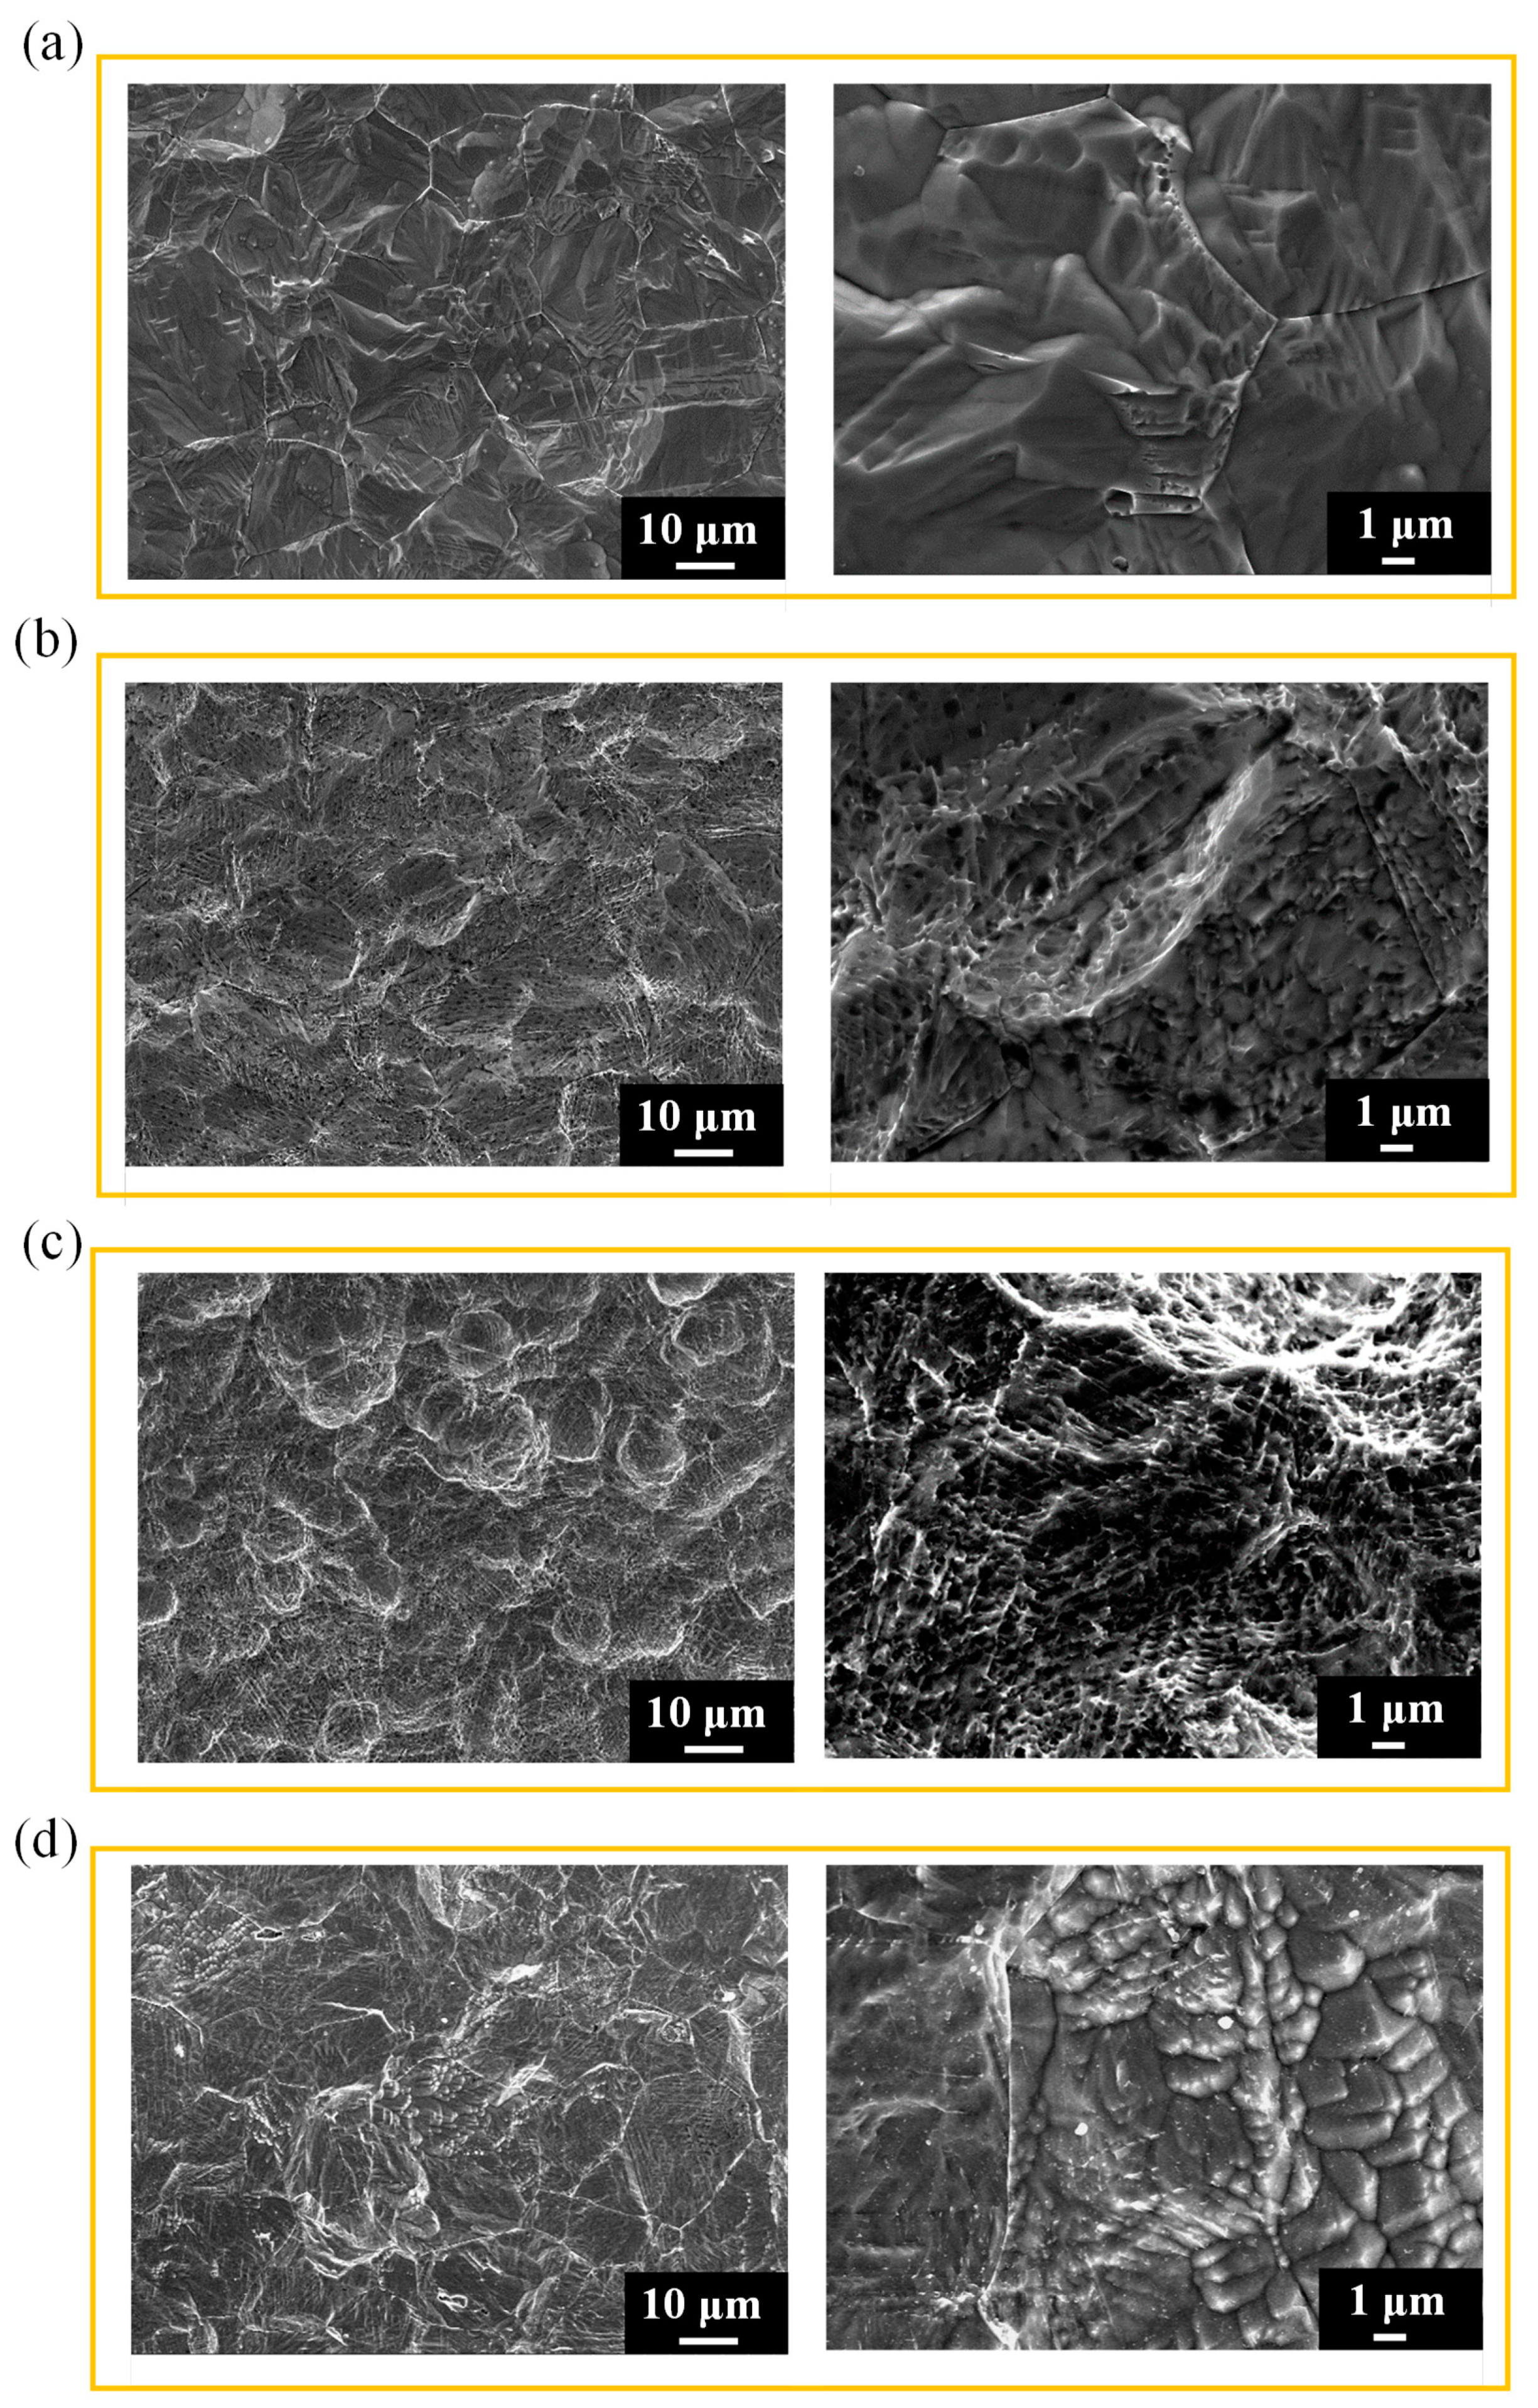
Figure 4.
SEM images of 316L stainless-steel surfaces obtained after electrochemical corrosion was conducted with HCl concentrations of (a) 1, (b) 0.75 , and (c) 0.5 M, with a current density of 30 mA/cm2, anodic and cathodic times of 120 and 60 s, and 120 alternating periods of anodic and cathodic cycles.
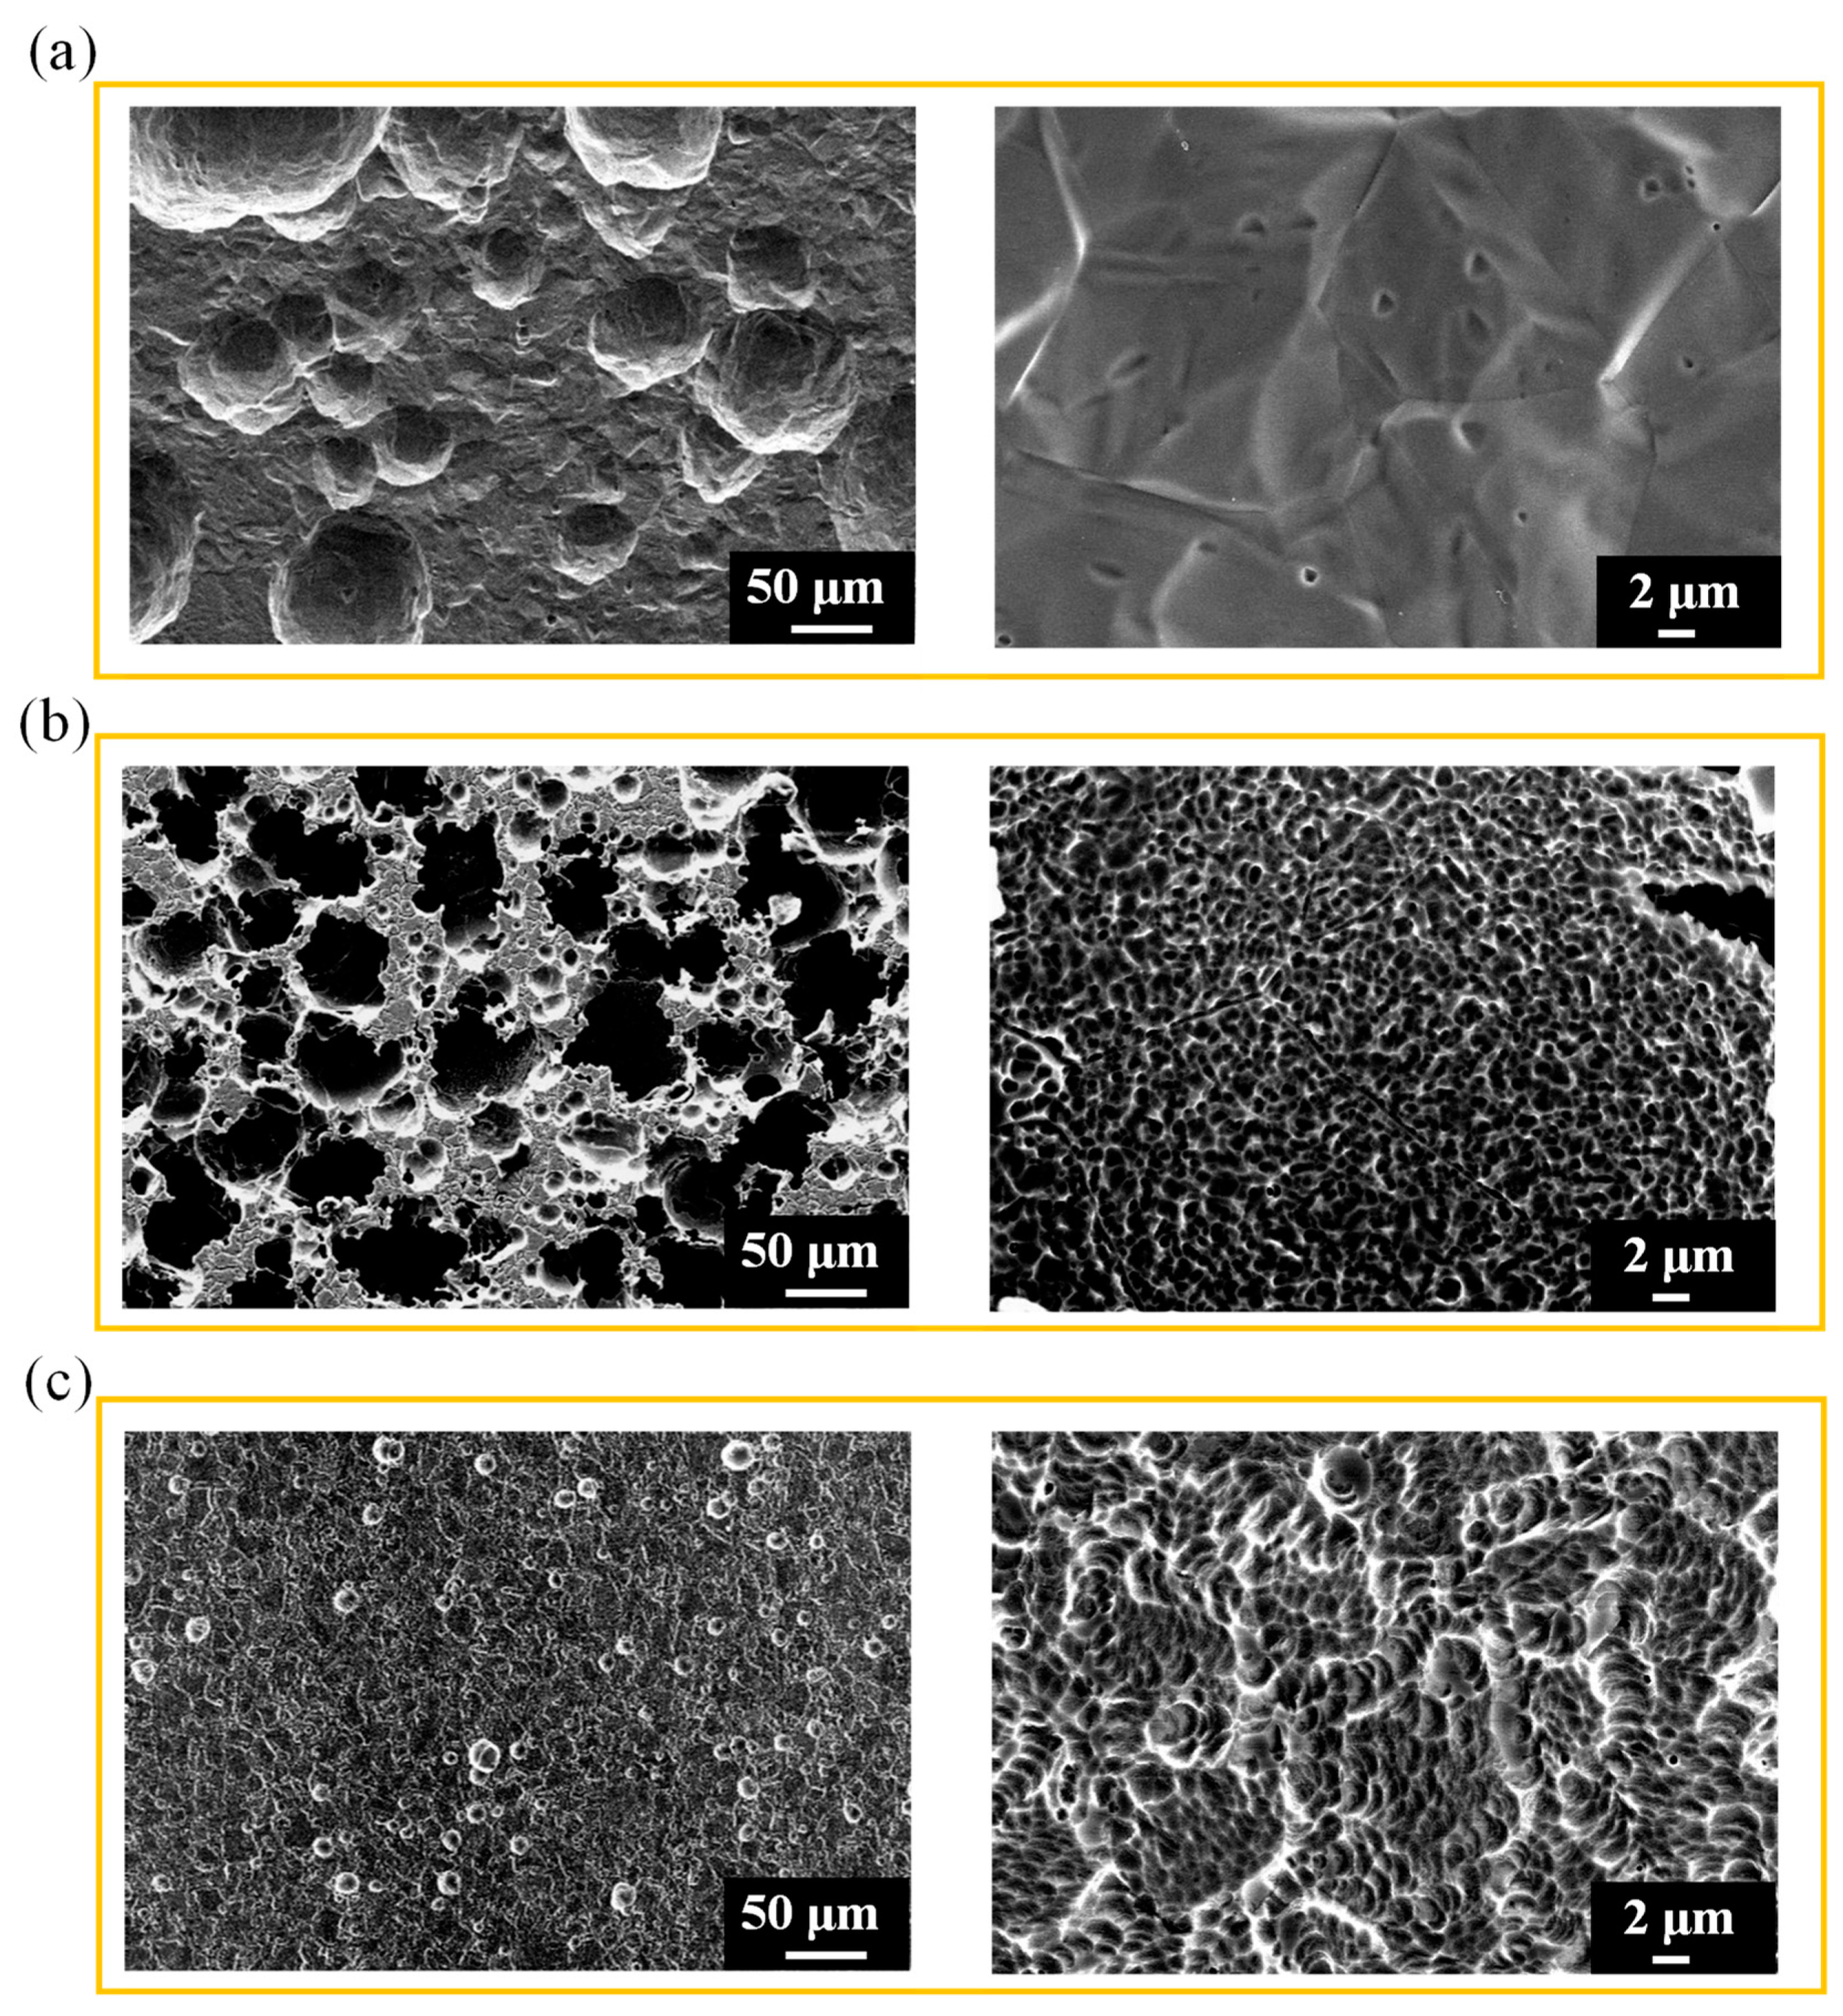
Figure 5.
Raman spectra of 316L stainless steel after (a) immersion corrosion, (b) immersion corrosion followed by hydrogen charging, (c) shot-peening pretreatment, and (d) cyclic electrochemical corrosion.
Figure 5.
Raman spectra of 316L stainless steel after (a) immersion corrosion, (b) immersion corrosion followed by hydrogen charging, (c) shot-peening pretreatment, and (d) cyclic electrochemical corrosion.
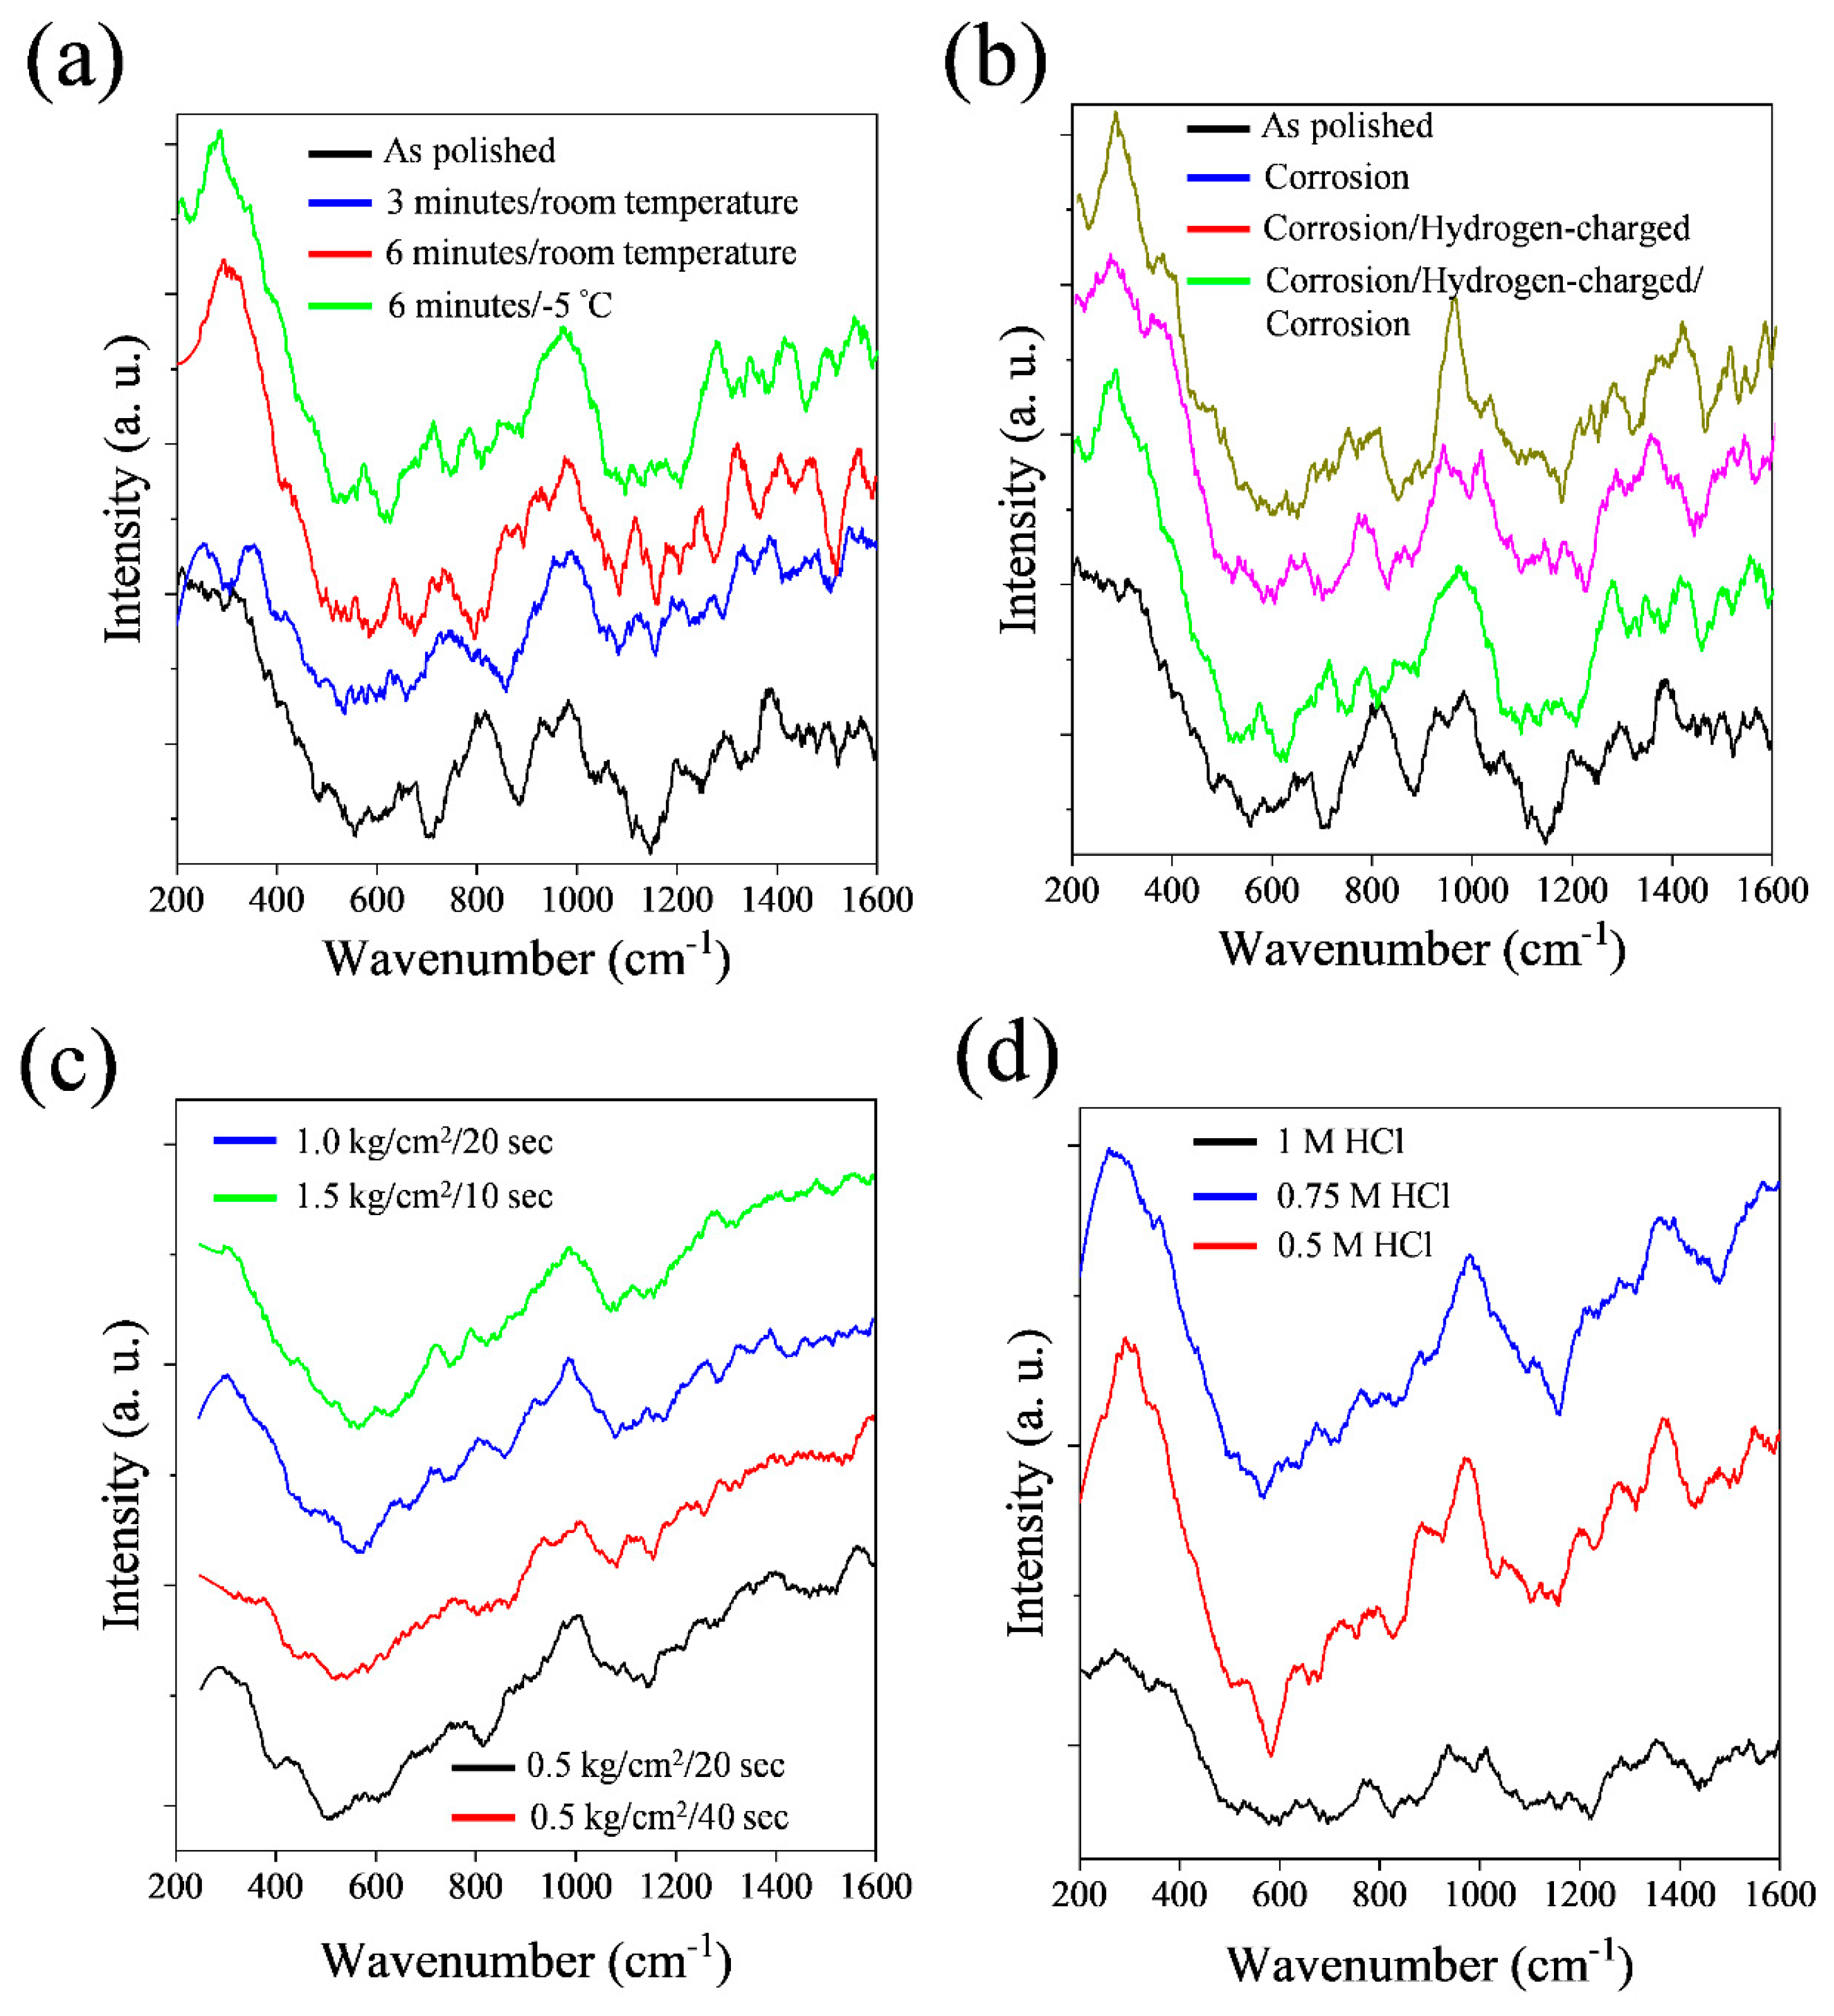
Figure 6.
OM images of cell adhesion to 316L stainless steel pretreated using (a) 0.5-kg/cm2 shot peening for 20 s, (b) 0.5-kg/cm2 shot peening for 40 s, (c) 1-kg/cm2 shot peening for 20 s, and (d) 1.5-kg/cm2 shot peening for 10 s. Immersion corrosion was conducted with a mixture of 3 M HNO3 and 6 M HCl at −5°C for 6 min.
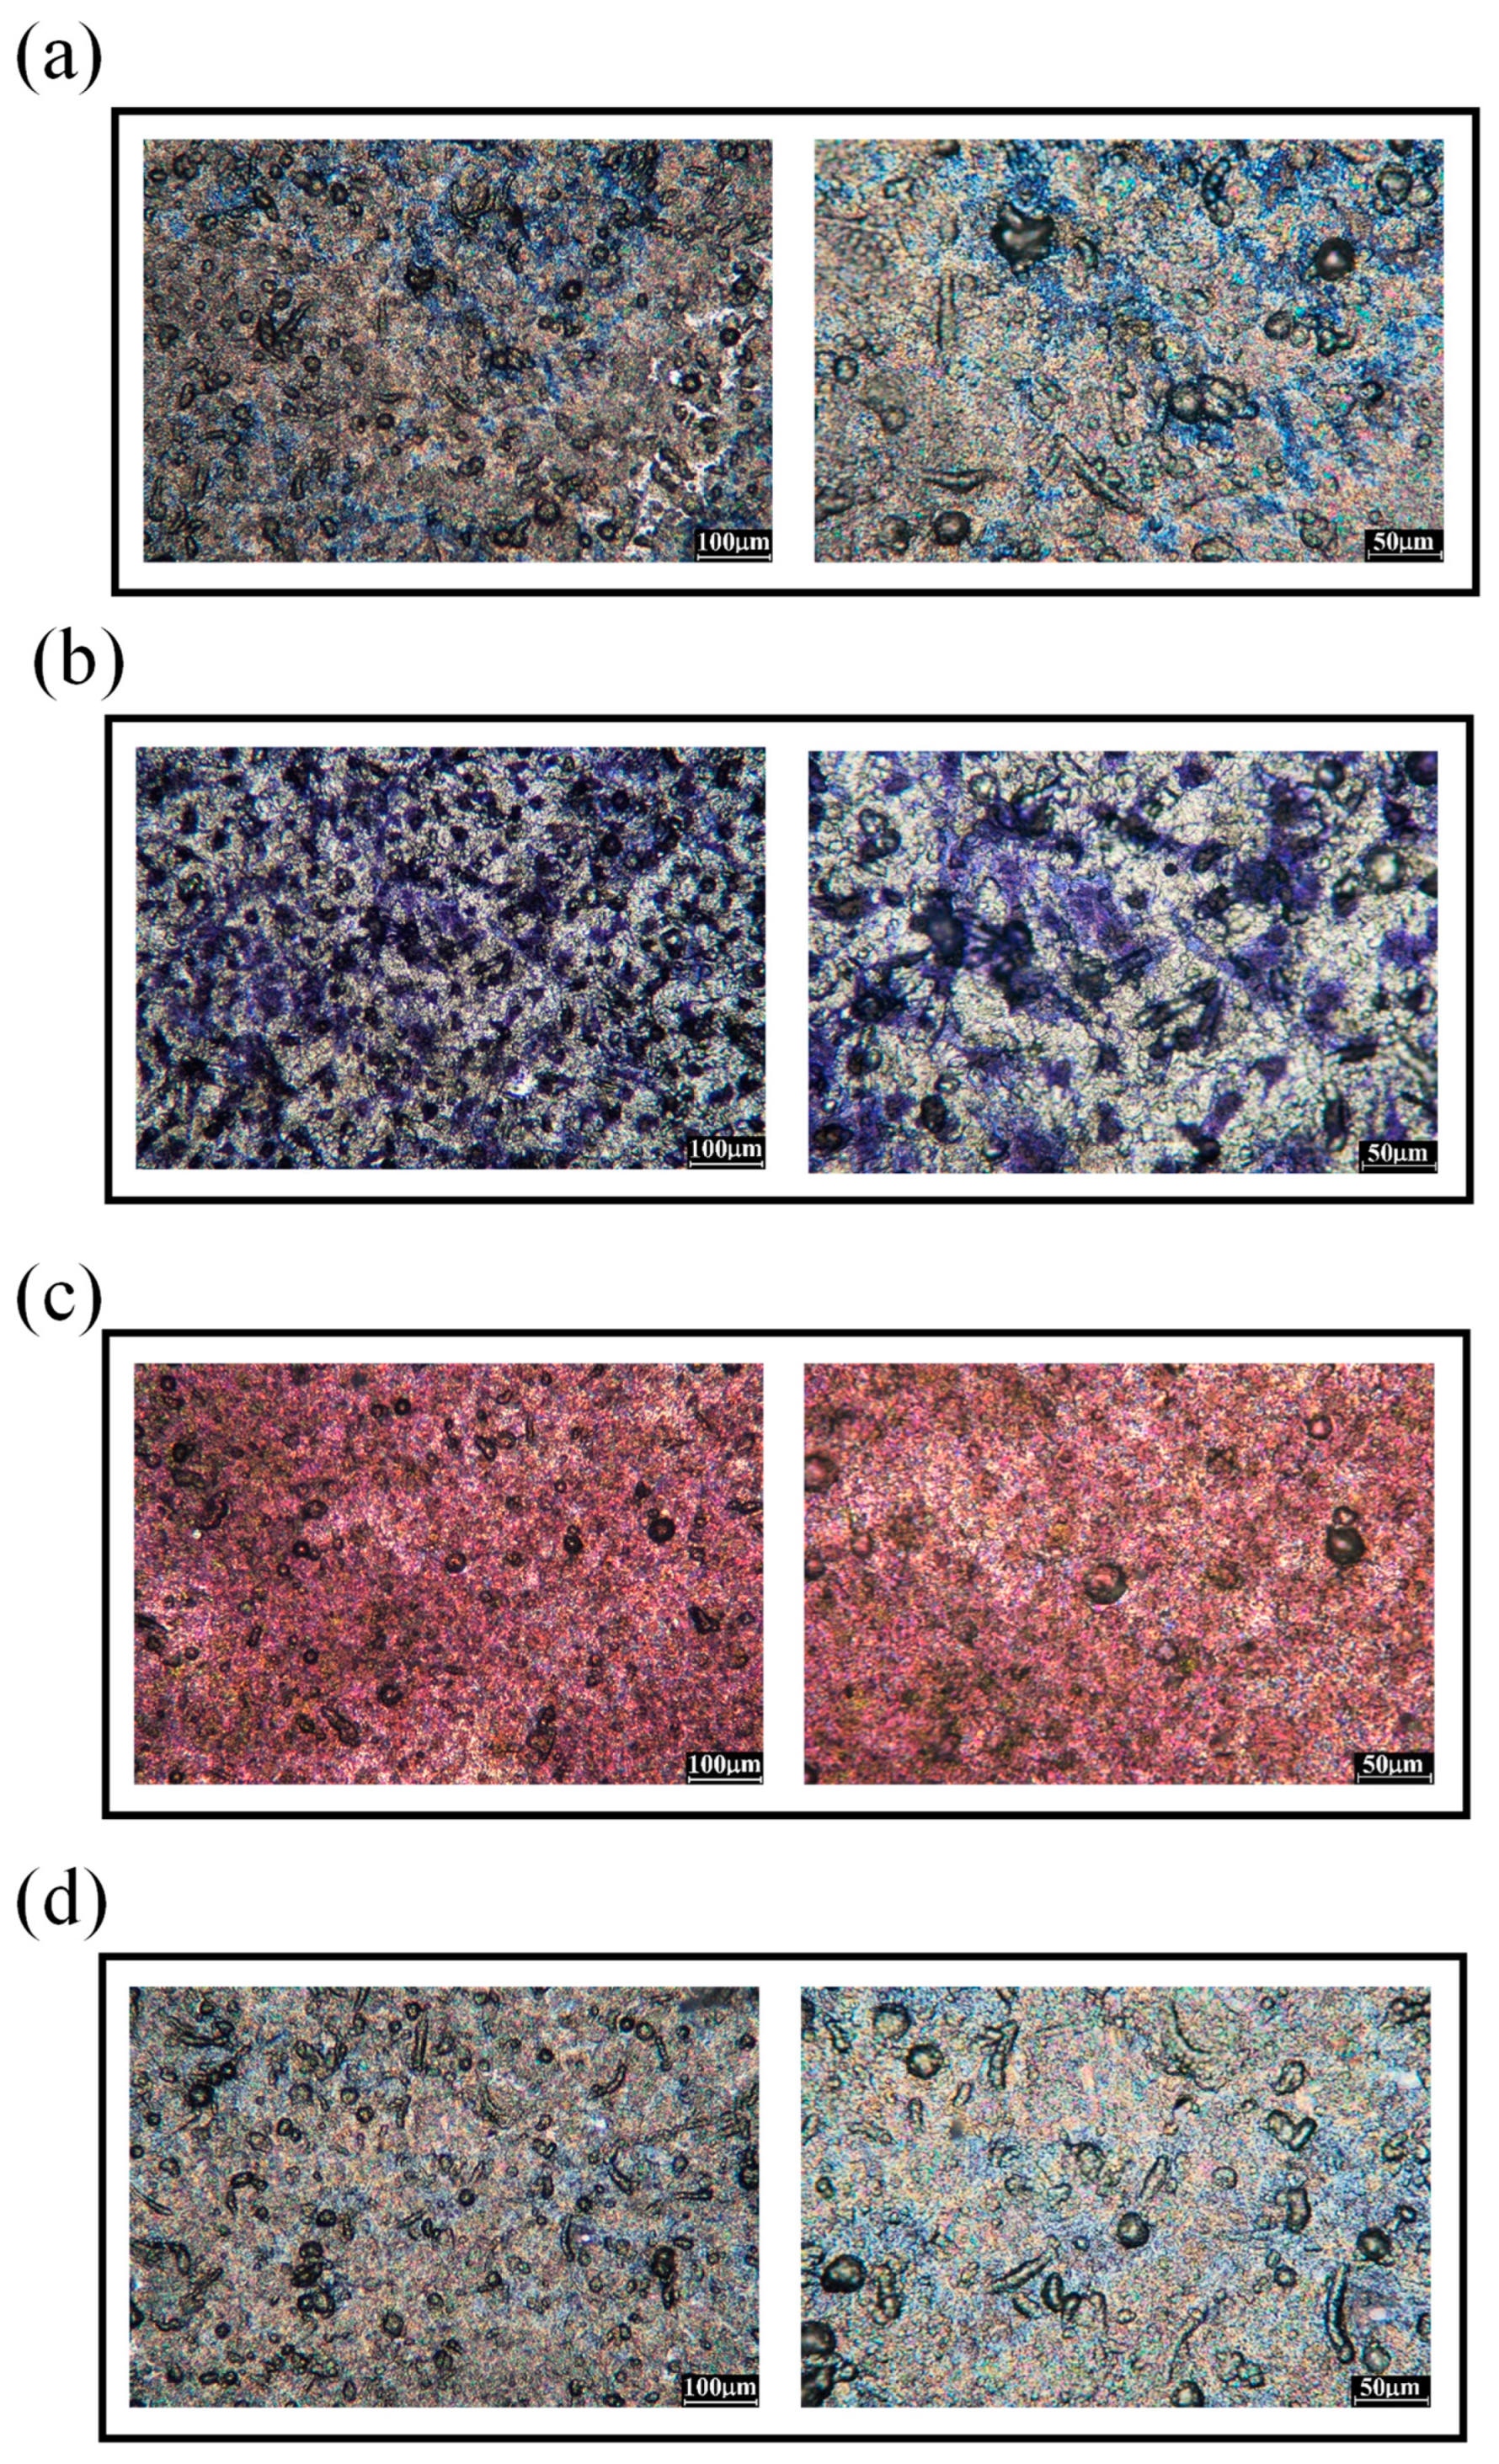
Figure 7.
OM images of cell adhesion tests of (a) bare 316L stainless steel and electrochemically etched stainless steel at HCl concentrations of (b) 0.75 and (c) 0.5 M, with a current density of 30 mA/cm2, anodic and cathodic times of 120 and 60 s, and 120 alternating periods of anodic and cathodic cycles.
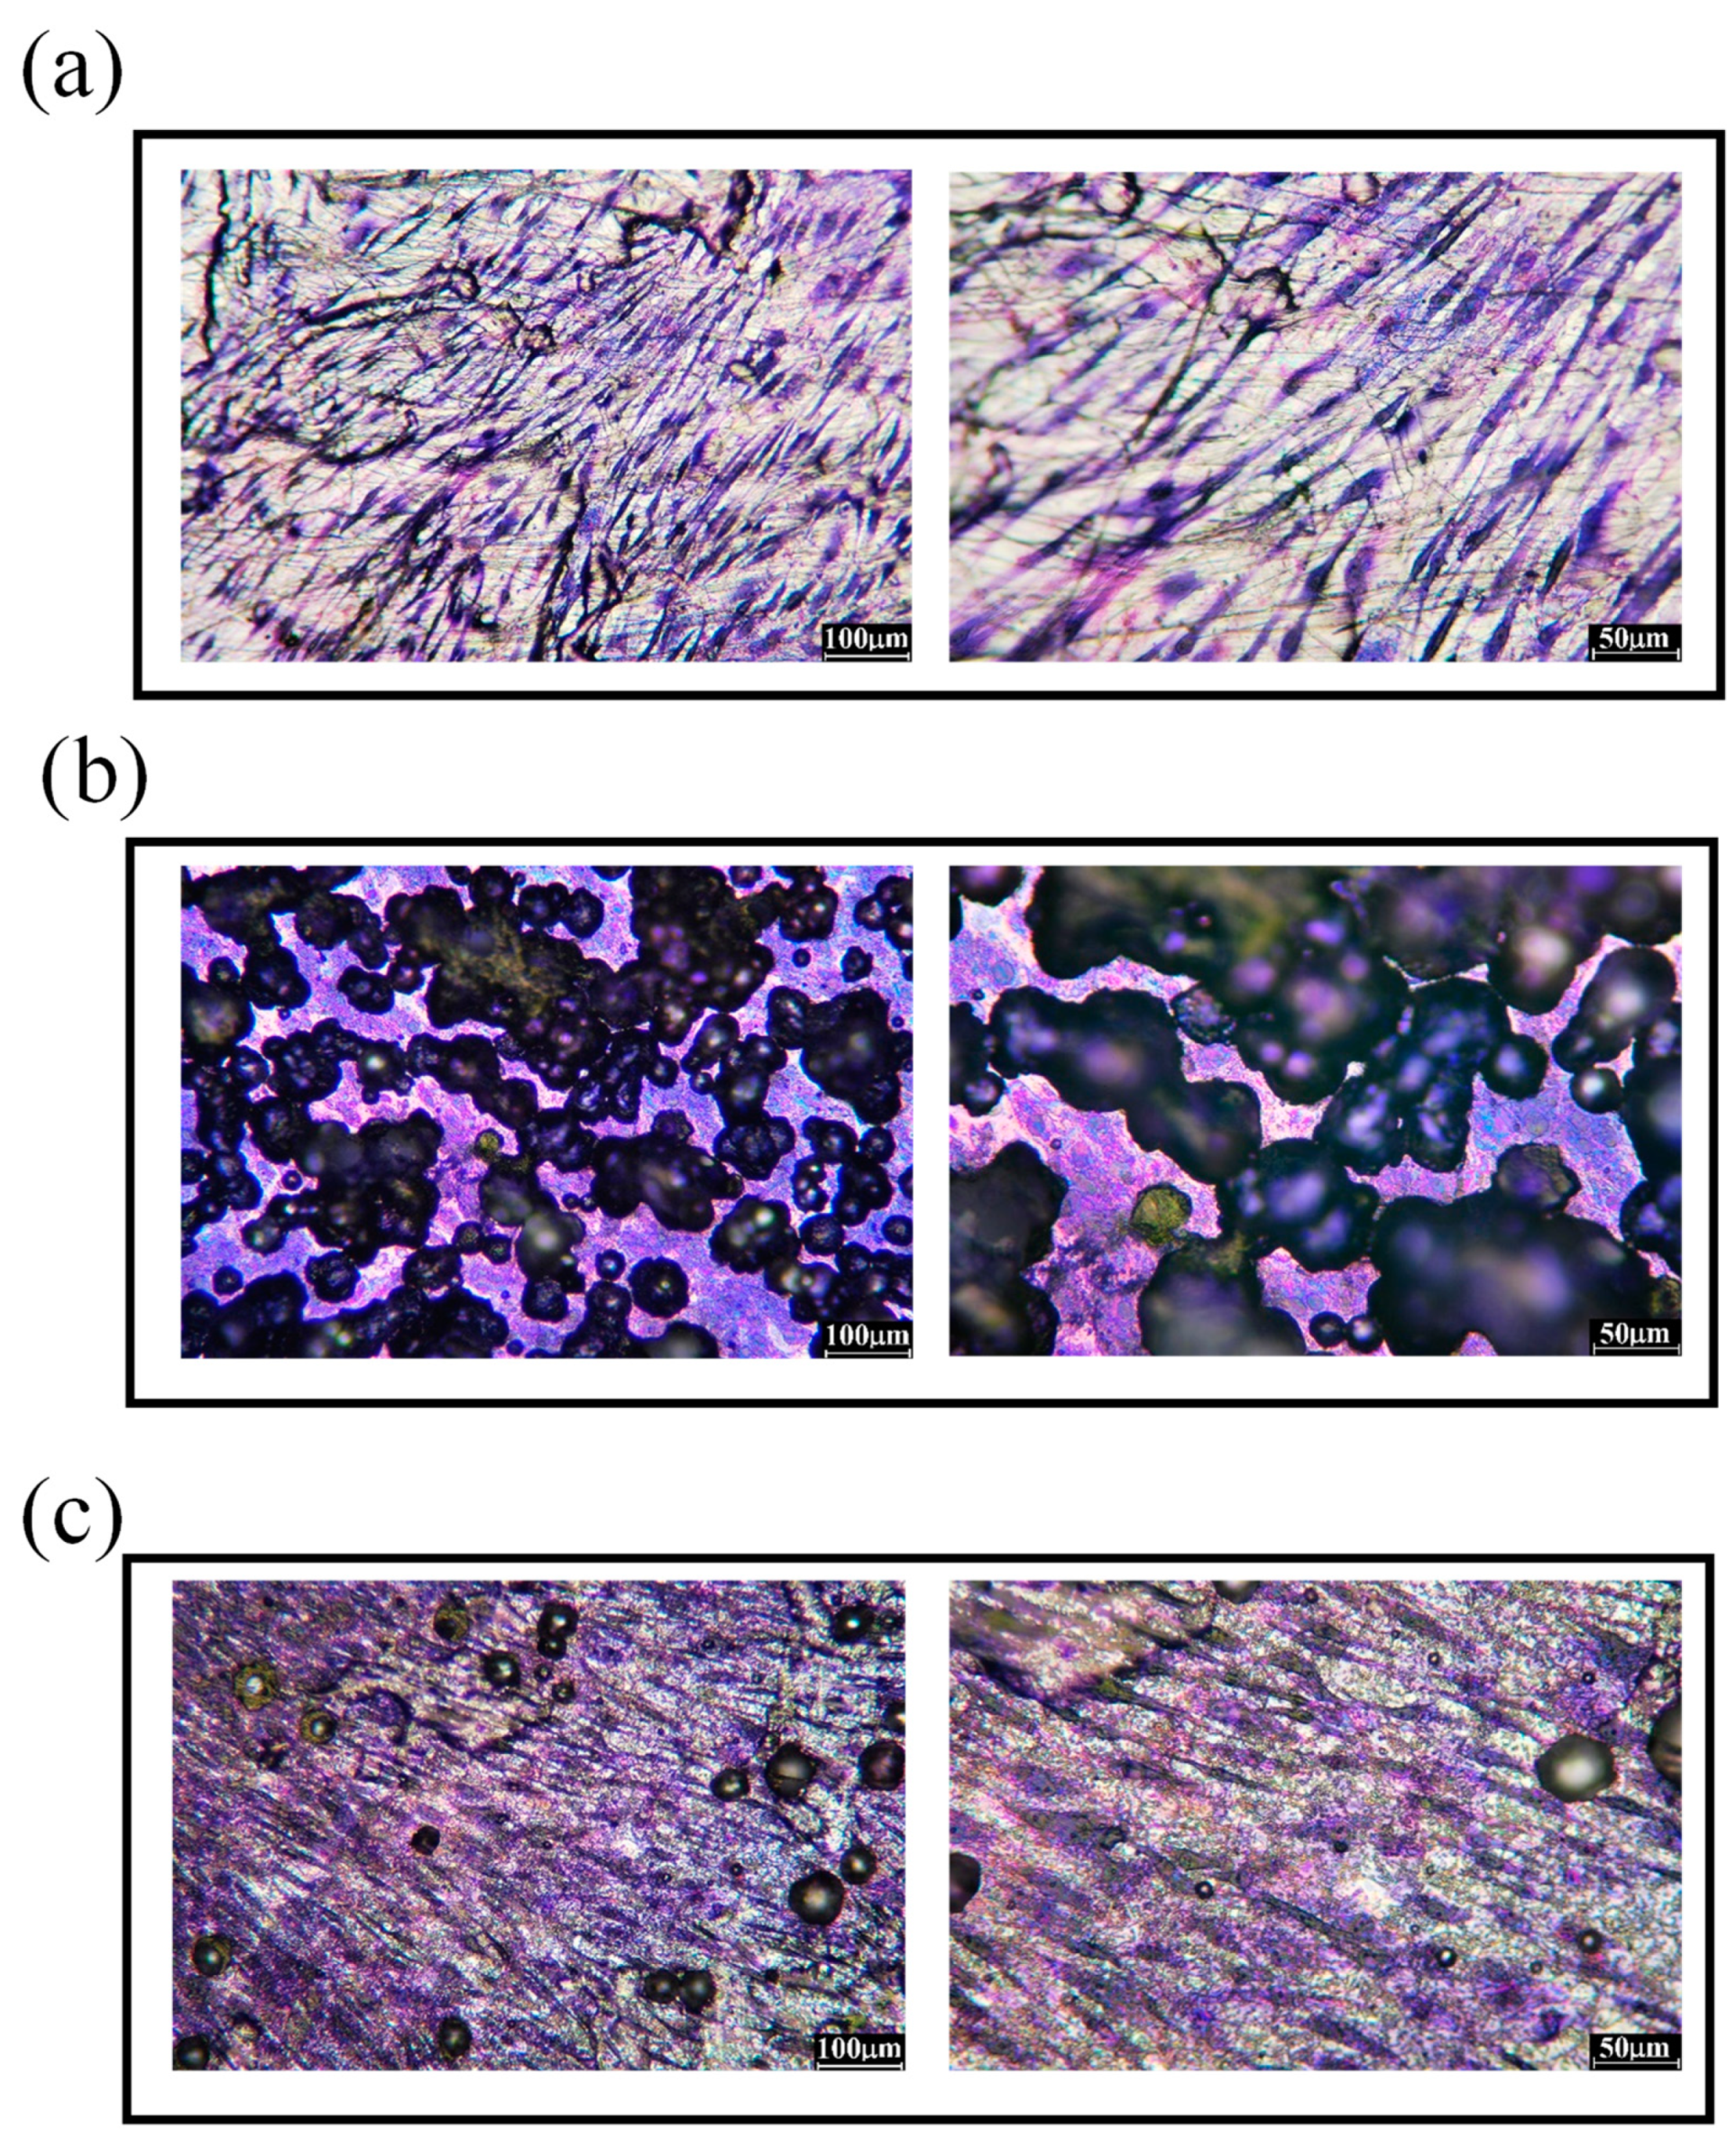

Table 1.
Surface roughness of 316L stainless steel after immersion corrosion under various conditions.
Table 1.
Surface roughness of 316L stainless steel after immersion corrosion under various conditions.
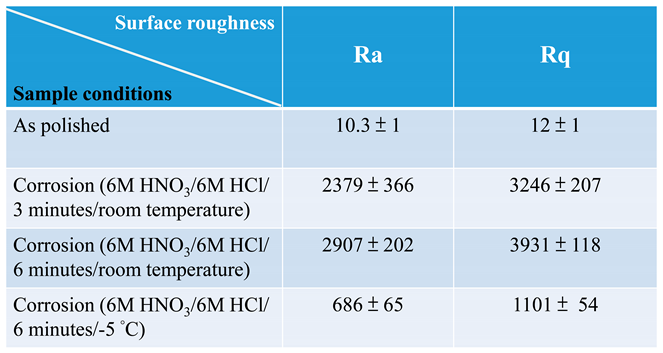
Table 2.
Surface roughness of 316L stainless steel after treatment under different immersion corrosion and hydrogen-charging conditions.
Table 2.
Surface roughness of 316L stainless steel after treatment under different immersion corrosion and hydrogen-charging conditions.
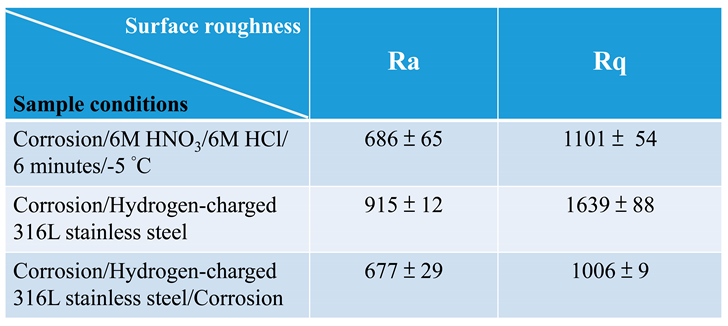
Table 3.
Surface roughness of 316L stainless steel after treatment under different immersion corrosion and hydrogen-charging conditions.
Table 3.
Surface roughness of 316L stainless steel after treatment under different immersion corrosion and hydrogen-charging conditions.
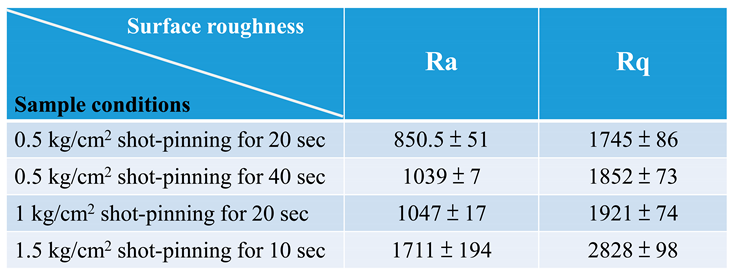
Table 4.
Surface roughness of 316L stainless steel after electrochemical corrosion with different concentrations of HCl.
Table 4.
Surface roughness of 316L stainless steel after electrochemical corrosion with different concentrations of HCl.
Disclaimer/Publisher’s Note: The statements, opinions and data contained in all publications are solely those of the individual author(s) and contributor(s) and not of MDPI and/or the editor(s). MDPI and/or the editor(s) disclaim responsibility for any injury to people or property resulting from any ideas, methods, instructions or products referred to in the content. |
© 2023 by the authors. Licensee MDPI, Basel, Switzerland. This article is an open access article distributed under the terms and conditions of the Creative Commons Attribution (CC BY) license (https://creativecommons.org/licenses/by/4.0/).
Copyright: This open access article is published under a Creative Commons CC BY 4.0 license, which permit the free download, distribution, and reuse, provided that the author and preprint are cited in any reuse.


