Submitted:
26 September 2023
Posted:
27 September 2023
You are already at the latest version
Abstract
Keywords:
1. Introduction
2. Materials and Methods
2.1. Description of study site
2.2. Methods of Plankton Sampling and Hydrological Investigation
2.2.1. Hydrochemical samples
2.2.2. Phytoplankton samples
2.3. Index Saprobity Determination
2.4. Statistical Analysis
3. Results
3.1. Characteristics of the hydrochemical parameters in investigated water bodies
3.2. Study of the Phytoplankton of Reservoir and the Indicators
3.3. Indicators of Habitat Conditions for Phytoplankton
3.4. Statistical Mapping
4. Discussion
5. Conclusions
Author Contributions
Funding
Institutional Review Board Statement
Informed Consent Statement
Data Availability Statement
Conflicts of Interest
Appendix A
| No. | Taxon | June | August | HAB | T | OXY | HAL | pH | D | SAP | Index S | AUT-HET | TRO |
|---|---|---|---|---|---|---|---|---|---|---|---|---|---|
| Bacillariophyta | |||||||||||||
| 1 | Acanthoceras zachariasii (Brun) Simonsen | 1 | 1 | P | - | st-str | i | ind | - | o-b | 1.4 | - | - |
| 2 | Achnanthidium minutissimum (Kützing) Czarn. | 1 | 1 | P-B | eterm | st-str | i | ind | es | b | 0.95 | ate | e |
| 3 | Asterionella formosa Hassall | 1 | 1 | P | temp | st-str | i | alf | sx | b | 1.35 | ate | me |
| 4 | Aulacoseira granulata (Ehrenberg) Simonsen | 1 | 1 | P-B | temp | st-str | i | alf | es | b | 2.0 | ate | e |
| 5 | Aulacoseira italica (Ehrenberg) Simonsen | 1 | 1 | P-B | cool | st-str | i | ind | es | b | 1.45 | ate | me |
| 6 | Aulacoseira italica var. tenuissima (Grunow) Simonsen | 1 | 1 | P-B | cool | st-str | i | ind | es | b | 1.3 | ate | me |
| 7 | Diatoma moniliformis (Kützing) D.M.Williams | 1 | 1 | P-B | temp | st-str | i | alf | - | x-o | 0.4 | - | - |
| 8 | Diatoma tenuis C.Agardh | 1 | 0 | P-B | temp | st-str | hl | alf | - | b-a | 2.4 | - | om |
| 9 | Encyonema cespitosum Kützing | 1 | 0 | B | temp | st | i | alf | es | o-b | 1.4 | - | - |
| 10 | Encyonema silesiacum (Bleisch) D.G.Mann | 1 | 1 | B | temp | st-str | i | ind | - | - | - | - | - |
| 11 | Entomoneis ornata (Bailey) Reimer | 0 | 1 | B | - | st-str | i | alf | - | b | 2.0 | hne | - |
| 12 | Epithemia sorex Kützing | 1 | 0 | B | temp | st-str | i | alf | - | - | - | - | - |
| 13 | Fragilaria crotonensis Kitton | 1 | 1 | P-B | temp | st-str | i | alf | - | - | - | - | - |
| 14 | Gomphonella olivacea (Hornemann) Rabenhorst | 1 | 0 | B | temp | st-str | i | alf | - | b | 2.3 | ate | om |
| 15 | Gomphonema acuminatum Ehrenberg | 1 | 0 | B | temp | st-str | i | ind | - | x-b | 0.8 | - | - |
| 16 | Gomphonema truncatum Ehrenberg | 1 | 0 | B | temp | st-str | i | ind | - | b | 2.0 | - | - |
| 17 | Gyrosigma acuminatum (Kützing) Rabenhorst | 1 | 1 | B | temp | st-str | i | alf | - | - | - | - | - |
| 18 | Iconella splendida (Ehrenberg) Ruck & Nakov | 0 | 1 | P-B | - | st-str | i | alf | - | - | - | - | - |
| 19 | Luticola mutica (Kützing) D.G.Mann | 1 | 1 | B,S | temp | st-str | hl | ind | - | o-a | 1.9 | ats | e |
| 20 | Navicula cryptotenella Lange-Bertalot | 1 | 0 | P-B | temp | st-str | i | ind | - | - | - | - | - |
| 21 | Navicula reinhardtii (Grunow) Grunow | 1 | 0 | - | - | - | - | - | - | - | - | - | - |
| 22 | Neidiomorpha binodis (Ehrenberg) M.Cantonati, Lange-Bertalot & N.Angeli | 0 | 1 | B | - | str | i | alf | - | o | 1.0 | - | - |
| 23 | Nitzschia frustulum (Kützing) Grunow | 1 | 0 | P-B | temp | st-str | hl | alf | es | a-o | 2.7 | - | - |
| 24 | Nitzschia gracilis Hantzsch | 1 | 0 | P-B | temp | st-str | i | ind | - | - | - | - | - |
| 25 | Nitzschia sigma (Kützing) W.Smith | 1 | 0 | B | temp | st-str | mh | alf | - | - | - | - | - |
| 26 | Rhopalodia constricta (Brébisson) Krammer | 1 | 0 | B | - | st-str | hl | alf | - | - | - | ats | e |
| 27 | Stephanodiscus hantzschii Grunow | 1 | 1 | P | temp | st-str | i | alf | sx | - | - | - | - |
| 28 | Stephanodiscus minutulus (Kützing) Cleve & Möller | 0 | 1 | P | temp | st-str | i | alb | es | a-o | 3.6 | hne | he |
| 29 | Surirella gracilis Grun. | 0 | 1 | B | - | st-str | i | ind | - | - | - | - | - |
| 30 | Tabellaria fenestrata (Lyngb.) Kütz. | 0 | 1 | P-B | - | st-str | i | ind | - | o-a | 1.9 | - | - |
| 32 | Ulnaria acus (Kützing) Aboal | 1 | 1 | P-B | warm | st-str | i | alf | es | o-a | 1.85 | ate | me |
| 31 | Ulnaria ulna (Nitzsch) Compère | 1 | 0 | P-B | temp | st-str | i | alf | es | b-a | 2.4 | ate | e |
| Charophyta | |||||||||||||
| 33 | Closterium sp. | 1 | 0 | - | - | - | - | - | - | - | - | - | - |
| 34 | Cosmarium bioculatum var. depressum (Schaarschmidt) Schmidle | 0 | 1 | P-B | - | st-str | hb | ind | - | x-o | 0.5 | - | m |
| 35 | Mougeotia sp. ster. | 0 | 1 | - | - | - | - | - | - | - | - | - | - |
| 36 | Spirogyra sp. ster. | 0 | 1 | P-B | - | - | - | alf | - | - | - | - | - |
| 37 | Spondylosium planum (Wolle) West & G.S.West | 0 | 1 | P-B | - | - | i | ind | - | - | - | - | - |
| 38 | Staurodesmus triangularis (Lagerheim) Teiling | 0 | 1 | P | - | - | i | acf | - | - | - | - | - |
| Chlorophyta | |||||||||||||
| 39 | Chlamydocapsa planctonica (West & G.S.West) Fott | 1 | 1 | P-B | - | - | - | alf | - | o | 1.2 | - | - |
| 40 | Coelastrum astroideum De Notaris | 0 | 1 | P | - | st-str | - | - | - | b | 2.2 | - | e |
| 41 | Coelastrum microporum Nägeli | 1 | 1 | P-B | - | st-str | i | ind | - | b | 2.3 | - | e |
| 42 | Desmodesmus communis (E.Hegewald) E.Hegewald | 1 | 1 | - | - | - | - | - | - | - | - | - | - |
| 43 | Eudorina elegans Ehrenberg | 0 | 1 | P | - | st-str | i | - | - | b | 2.3 | - | - |
| 44 | Eutetramorus globosus Walton | 1 | 1 | - | - | - | - | - | - | - | - | - | - |
| 45 | Hindakia tetrachotoma (Printz) C.Bock, Pröschold & Krienitz | 1 | 1 | P | - | st | i | - | - | b | 2.3 | - | - |
| 46 | Lemmermannia tetrapedia (Kirchner) Lemmermann | 0 | 1 | P-B | - | st-str | i | ind | - | b | 2.0 | - | e |
| 47 | Oedogonium sp. | 1 | 0 | - | - | - | - | - | - | - | - | - | - |
| 48 | Pandorina morum (O.F.Müller) Bory | 1 | 1 | P | - | st | i | - | - | - | - | - | m |
| 49 | Pediastrum duplex Meyen | 1 | 1 | P | - | st-str | i | ind | - | - | - | - | e |
| 50 | Pseudopediastrum boryanum (Turpin) E.Hegewald | 1 | 1 | P-B | - | st-str | i | ind | - | b | 2.1 | - | e |
| 51 | Pseudopediastrum boryanum var. longicorne (Reinsch) Tsarenko | 1 | 1 | P-B | - | st-str | - | - | - | b | 2.1 | - | e |
| 52 | Scenedesmus ellipticus Corda | 1 | 1 | P-B, S | - | st-str | - | - | - | b-o | 1.7 | - | - |
| 53 | Stauridium tetras (Ehrenberg) E.Hegewald | 1 | 1 | P-B | - | st-str | i | ind | - | - | - | - | om |
| 54 | Tetradesmus lagerheimii M.J.Wynne & Guiry | 1 | 0 | P-B | - | st-str | i | ind | - | b | 2.15 | - | e |
| 55 | Thelesphaera alpina Pascher | 1 | 1 | B | - | str | - | - | - | - | - | - | - |
| 56 | Ulothrix zonata (F.Weber & Mohr) Kützing | 1 | 0 | P-B | - | st-str | i | ind | - | o-a | 1.8 | - | - |
| Cyanobacteria | |||||||||||||
| 57 | Aphanizomenon flos-aquae Ralfs ex Bornet & Flahault | 1 | 1 | P-B | - | - | hl | alb | - | o-a | 1.95 | - | m |
| 58 | Aphanothece sp. | 0 | 1 | - | - | - | - | - | - | - | - | - | - |
| 59 | Calotrix sp. | 1 | 1 | - | - | - | - | - | - | - | - | - | - |
| 60 | Chroococcus minimus (Keissler) Lemmermann | 0 | 1 | P-B | - | - | hl | - | - | - | - | - | e |
| 61 | Dichothrix ramenskii Elenkin | 1 | 0 | - | - | - | - | - | - | - | - | - | - |
| 62 | Dolichospermum smithii (Komárek) Wacklin, L.Hoffmann & Komárek 2009 | 0 | 1 | P | - | - | - | - | - | - | - | - | - |
| 63 | Leptolyngbya sp. | 1 | 0 | - | - | - | - | - | - | - | - | - | - |
| 64 | Microcystis aeruginosa (Kützing) Kützing | 1 | 1 | P-B | - | - | hl | acf | - | b | 2.2 | - | me |
| 65 | Oscillatoria sp. | 1 | 1 | - | - | - | - | - | - | - | - | - | - |
| 66 | Planktothrix agardhii (Gomont) Anagnostidis & Komárek | 1 | 1 | P-B | - | st | hl | - | - | - | - | - | - |
| 67 | Woronichinia naegeliana (Unger) Elenkin | 1 | 1 | P | - | st | - | - | - | o-a | 1.8 | - | e |
| Euglenozoa | |||||||||||||
| 68 | Astasiidae cf. | 1 | 0 | - | - | - | - | - | - | - | - | - | - |
| 69 | Euglena sp. | 0 | 1 | - | - | - | - | - | - | - | - | - | - |
| 70 | Euglena texta (Dujardin) Hübner | 0 | 1 | P | eterm | st-str | - | ind | - | a-o | 2.9 | - | - |
| 71 | Phacus sp. | 1 | 1 | - | - | - | - | - | - | - | - | - | - |
| 72 | Trachelomonas hispida (Perty) F.Stein | 0 | 1 | P-B | eterm | st-str | i | acf | - | b | 2.2 | - | - |
| 73 | Trachelomonas ssp. | 1 | 0 | - | - | - | - | - | - | - | - | - | - |
| 74 | Trachelomonas volvocina (Ehrenberg) Ehrenberg | 0 | 1 | P-B | eterm | st-str | i | ind | - | b | 2.0 | - | - |
| Miozoa | |||||||||||||
| 75 | Ceratium hirundinella (O.F.Müller) Dujardin | 1 | 1 | P | - | st-str | i | - | - | o | 1.3 | - | e |
| 76 | Peridiniaceae sp. | 0 | 1 | - | - | - | - | - | - | - | - | - | - |
| 77 | Peridiniopsis quadridens (F.Stein) Bourrelly | 1 | 1 | P | - | - | - | - | - | o-b | 1.4 | - | - |
| Ochrophyta | |||||||||||||
| 78 | Dinobryon sertularia Ehrenberg | 1 | 1 | P-B | - | - | i | - | - | o | 1.3 | - | - |
| 79 | Tribonema vulgare Pascher | 0 | 1 | P-B | - | - | i | - | - | o-b | 1.4 | - | - |
References
- Protasov, A. A. Several aspects of application and optimization of EU Water Framework Directive approaches in view of assessment of ecological state of technoecosystem. Hydrobiol. J. 2018, 54, 55–68. [Google Scholar] [CrossRef]
- Uzunov, Y. I.; Protasov, A. A. Concept of ecosystem services as applied to water technoecosystems. Hydrobiol. J. 2019, 55, 3–17. [Google Scholar] [CrossRef]
- Field, C. B.; Behrenfeld, M. J.; Randerson, J. T.; Falkowski, P. Primary production of the biosphere: integrating terrestrial and oceanic components. Science 1998, 281, 237–240. [Google Scholar] [CrossRef] [PubMed]
- He, W.; Luo, J.; Xing, L.; Yu, X.; Zhang, J.; Chen, S. Effects of temperature–control curtain on algae biomass and dissolved oxygen in a large stratified reservoir: Sanbanxi Reservoir case study. J. of environmental management 2019, 248, 109250. [Google Scholar] [CrossRef]
- Korneva L., G. Phytoplankton of Volga River Basin Reservoirs; Kostromskoy pechatniy dom: Kostroma, Russia, 2015; p. 284. (In Russian) [Google Scholar]
- Kopylov, A. I.; Lazareva, V. I.; Mineeva, N. M.; Zabotkina, E. A. Planktonic community of a large eutrophic reservoir during a period of anomalously high-water temperature. Inland Water Biology 2020, 13, 339–348. [Google Scholar] [CrossRef]
- Kuksn, M. S.; Chaikovskaya T., S. Interannual fluctuations in the species composition and biomass of phytoplankton in the Novosibirsk Reservoir. In Comprehensive studies of the Novosibirsk reservoir. Gidrometeoizdat: Moscow, Russia, 1985; pp. 76-84. (In Russian).
- Gold, Z.G.; Anufrieva, T.N.; Muchkina, E.Y.; Kozhevnikova, N.A. et al. The dynamics of structural characteristics of the ecosystem in the Krasnoyarsk deep-water reservor (1977–1999). In Biodiversity and dynamics of ecosystems in North Eurasia: Int. Biodiversity Observ. Year, Novosibirsk, Russia, 21–26 Aug. 2000. IC&G: Novosibirsk, Russia, 2000, 5; pp. 125–127.
- Mukhutdinov, V. F.; Butakova, E. A. Production characteristics of phytoplankton in early years of the existence of Yumaguzin Reservoir. Inland Water Biology 2012, 5, 317–321. [Google Scholar] [CrossRef]
- Belyaeva, P. G. The dynamics of the composition and structure of the phytoplankton reservoir-cooler of the Karmanovsk State District Power Station (Bashkiria). Bot. Zhurn. 2018, 104, 1698–1711. (In Russian) [Google Scholar] [CrossRef]
- Belyaeva, P. G. Interannual dynamics of the composition and distribution of phytoplankton in the Votkinsk reservoir (Kama basin, Perm Territory). Bot. Zhurn. 2018, 103, 297–312. (In Russian) [Google Scholar] [CrossRef]
- Dzhaian, E. A. Interannual Сhanges in Phytoplankton of the Iriklinsky Reservoi. Inland Water Biology 2020, 13, 549–555. [Google Scholar] [CrossRef]
- Goncharov, A. A. Algoflora of the Primorsky Cooling Reservoir (Primorsky Krai). Bot. Zhurn. 1996, 81, 32–40. (In Russian) [Google Scholar]
- Oksiyuk, O. P.; Davydov, O. A.; Melenchuk, G. V. Formation of phytoplankton species diversity in the river sections of the Dnieper reservoirs. Algology 2005, 15, 78–85. (In Russian) [Google Scholar]
- Novoselova, T. N.; Protasov, A. A. Phytoplankton of cooling ponds of techno–ecosystems of nuclear and thermal power stations (a review). Hydrobiol. J. 2015, 51, 37–52. [Google Scholar] [CrossRef]
- Novoselova, T.; Barinova, S.; Protasov, A. Phytoplankton Indicators in the Assessment of the Ecological Status of Two Reservoirs with Different Purposes in Southern Ukraine. Ecologies 2022, 3, 96–119. [Google Scholar] [CrossRef]
- Genkal, S. I.; Kulikovskiy, M. S.; Mikheeva, T. M.; Kuznetsova, I. V.; Lukyanova, E.V. Plankton diatoms of the Svisloch River and its reservoirs; Nauchniy mir: Moscow, Russia, 2013; p. 236. ISBN 978-5-91522-357-7. (In Russian) [Google Scholar]
- Xu, Y.; Cai, Q.; Ye, L.; Shao, M. Asynchrony of spring phytoplankton response to temperature driver within a spatial heterogeneity bay of Three-Gorges Reservoir. China. Limnologica 2011, 41, 174–180. [Google Scholar] [CrossRef]
- Barinova, S.; Liu, N.; Ding, J. , An, Y.; Qin, X; Wu, C. Ecological assessment of water quality of the Songhua River upper reaches by algal communities. Acta Ecologica Sinica, 2016, 3, 126–132. [Google Scholar] [CrossRef]
- Barinova, S.; Liu, N.; Ding, J.; An, Y.; Qin, X.; Wu, C. Bioindication of water quality of the Xinlicheng Reservoir by algal communities. Transylvanian Review of Systematical and Ecological Research. The Wetlands Diversity 2020, 22.3, 1–16. [Google Scholar] [CrossRef]
- Barinova, S.; Alster, A. Algae and Cyanobacteria Diversity and Bioindication of Long–Term Changes in the Hula Nature Reserve, Israel. Diversity 2021, 13, 583. [Google Scholar] [CrossRef]
- Biggs, J.; Von Fumetti, S.; Kelly–Quinn, M. The importance of small waterbodies for biodiversity and ecosystem services: implications for policy makers. Hydrobiologia 2017, 793, 3–39. [Google Scholar] [CrossRef]
- Baturina, M. A.; Kononova, O. N.; Fefilova, E. B.; Teteryuk, B. Yu.; Patova, E. N.; Stenina, A. S.; Sterlyagova, I. N. Present State of Biota of Small Komi Republic Reservoirs. J. of Siberian Federal University. Biology 2017, 10, 422–445. [Google Scholar] [CrossRef]
- Antonova, L. N.; Kanyuk, G. I.; Pogonina, T. E.; Omelchenko, L. N.; Fokina, A. R. Purpose and features of the operating conditions of cooling ponds of thermal and nuclear power plants. East European Journal of Advanced Technologies 2012, 2, 56–63. [Google Scholar]
- Mason, C. F. Water pollution biology. Pollution: causes, effects and control, 3rd ed.; Mason, C. F., Ed.; Longman: Harlow, Essex, England, 1996; pp. 82–112. [Google Scholar]
- Peeters, F.; Straile, D.; Lorke, A.; Livingstone, D. M. Earlier onset of the spring phytoplankton bloom in lakes of the temperate zone in a warmer climate. Global Change Biology 2007, 13, 1898–1909. [Google Scholar] [CrossRef]
- Paerl, H. W.; Huisman, J. Blooms like it hot. Science 2008, 320, 57–58. [Google Scholar] [CrossRef] [PubMed]
- Zhilenkov, V.N. Experience in developing criteria for designing a filtration–selective water intake in the technical water supply system of the Pechorskaya State District Power Station. Izvestiya VNIIG im. B.E. Vedeneeva 2002, 240, 206–218. (In Russian) [Google Scholar]
- Boznak, E. I.; Zakharov, A. B. Fish population of an industrial reservoir under conditions of multifactorial anthropogenic impact. In Aquatic ecology: Modern problems of reservoirs and their watersheds, Proceed. of the Intern. Scient. Confer., Perm, Russia, 30 May – 2 June, 2009; Perm State Research University: Perm, Russia, 2009; Volume 2; pp. 220–224. (In Russian) [Google Scholar]
- Rafikov, R. R.; Boznak, E. I. Ichthyological characteristics of bleak Alburnus alburnus (Сyprinidae) from a cooling pond in the Pechora River basin. J. of Ichthyology 2021, 61, 646–649. [Google Scholar] [CrossRef]
- Methodology for studying biogeocenoses of inland water bodies. Mordukhai–Boltovskoi, F. D., Ed.; Nauka: Moscow, 1975; p. 240. (In Russian) [Google Scholar]
- Patova, E. N.; Stenina, A. S; Shabalina, Y. N.; Sterlyagova, I. N. Phytoplankton Communities of the Vychegda River in the Area of Treated-Wastewater Intake from the Pulp and Paper Industry. Contemporary Problems of Ecology 2021, 14, 633–641. [Google Scholar] [CrossRef]
- Diatoms of the USSR (fossil and modern). Gleser, S. I.; Jouse, A. P., Makarova, I. V., Proschkina-Lavrenko, A. I., Eds.; Sheshukova-Poretzkaja, V. S. Eds. Nauka: Leningrad, USSR, 1974; Volume 1; pp. 403. (In Russian) [Google Scholar]
- Komárek, J.; Anagnostidis, K. Cyanoprokaryota 1. Teil: Chroococcales. In Süsswasserflora von Mitteleuropa 19/1; Unaltered, repr., Ettl, H., Gärtner, G., Heynig, G., Mollenhauer, D., Eds.; Spektrum Akademischer Verlag: Heidelberg, Germany, 2008; p. 548. [Google Scholar]
- Komárek, J.; Anagnostidis, K. Cyanoprokaryota 2. Teil: Oscillatoriales. In Süsswasserflora von Mitteleuropa 19/2; Büdel, B., Gärtner, G., Krienitz, L., Schlager, M., Eds.; Unaltered repr., 2. print; Spektrum Akademischer Verlag: Heidelberg, Germany, 2008; p. 759. [Google Scholar]
- Komárek, J. Cyanoprokaryota 3. Teil: Heterocytous genera. In Süsswasserflora von Mitteleuropa 19/3; Büdel, B., Gärtner, G., Krienitz, L., Schlager, M., Eds.; Springer: Berlin/Heidelberg, Germany, 2013; p. 1133. [Google Scholar]
- Krammer, K.; Lange Bertalot, H. Bacillariophyceae 1. Naviculaceae. In Sǘßwasserflora von Mittelflora, 2/1. G. Fischer: Jena, Stuttgart, Lubeck, Ulm., 1986; pp. 876.
- Krammer, K.; Lange-Bertalot, H. Bacillariophyceae 2. Bacillariaceae, Epithemiaceae, Surirellaceae. In Süsswasserflora von Mitteleuropa, 2/2; Ettl, H., Gerloff, J., Heynig, H., Mollenhauer, D., Eds.; G. Fischer: Jena, Germany, 1988; p. 596. [Google Scholar]
- Krammer, K.; Lange-Bertalot, H. Bacillariophyceae 3. Centrales, Fragilariaceae, Eunotiaceae. Susswasserflora von Mitteleuropa, 2/3; Ettl, H., Gerloff, J., Heynig, H., Mollenhauer, D., Eds.; Gustav Fisher Verlag: Stuttgart, 1991; p. 576. [Google Scholar]
- Škaloud, P.; Rindi, F.; Boedeker, C.; Leliaert, F. Freshwater Flora of Central Europe. Chlorophyta: Ulvophyceae. Bd. 13. In Süβwasserflora von Mitteleuropa. Springer Spektrum: Berlin/ Heidelberg, Germany, 2018; p. 289. [CrossRef]
- Guiry, M.D.; Guiry, G.M. AlgaeBase. In World-Wide Electronic Publication; National University of Ireland: Galway, Ireland, 2023; Available online: http://www.algaebase.org (accessed on 20 September 2023).
- Barinova, S.; Bilous, O.; Tsarenko, P.M. Algal indication of water bodies in Ukraine: methods and perspectives. Haifa University Publishing House: Haifa, Kiev, 2019. pp. 367. (In Russian).
- Sládeček, V. System of water quality from the biological point of view. Arch. Hydrobiol. 1973, 7, 218. [Google Scholar]
- Barinova, S. S.; Medvedeva, L. A.; Anisimova, O. V. Diversity of Algal Indicators in Environmental Assessment. Pilies Studio: Tel-Aviv, Israel, 2006, pp. 498. (In Russian).
- Barinova, S. Essential and practical bioindication methods and systems for the water quality assessment. Int. J. Environ. Sci. Nat. Resour. 2017, 2, 79–89. [Google Scholar] [CrossRef]
- Love, J.; Selker, R.; Marsman, M.; Jamil, T.; Dropmann, D.; Verhagen, J.A.; Ly, A.; Gronau, F.Q.; Smira, M.; Epskamp, S.; et al. JASP: Graphical statistical software for common statistical designs. J. Stat. Softw. 2019, 88, 1–17. [Google Scholar] [CrossRef]
- Watanabe, T.; Asai, K.; Houki, A. Numerical estimation of organic pollution of flowing water by using the epilithic diatom assemblage—Diatom Assemblage Index (DAIpo). Sci. Total Environ. 1986, 55, 209–218. [Google Scholar] [CrossRef]
- Getsen, M. V. Algae of the Pechora River basin. Composition and distribution. Nauka: Leningrad, USSR, 1973, pp. 147. (In Russian).
- Habib, O. A.; Tippett, R.; & Murphy, K. J. J. Seasonal changes in phytoplankton community structure in relation to physico–chemical factors in Loch Lomond, Scotland. Hydrobiologia 1997, 350, 63–79. [Google Scholar] [CrossRef]
- Willén, E. Dominance patterns of planktonic algae in Swedish forest lakes. Hydrobiologia 2003, 502, 315–324. [Google Scholar] [CrossRef]
- Paerl, H. W.; Hall, N. S.; Calandrino, E. S. Controlling harmful cyanobacterial blooms in a world experiencing anthropogenic and climatic–induced change. Science of the total environment 2011, 409, 1739–1745. [Google Scholar] [CrossRef] [PubMed]
- Patova, E. N. Bloom-forming Cyanoprokaryotes in Kharbeyskie lakes of Bolshezemelskaya tundra. J. of the Siberian Federal University. Biology 2014, 7, 282–290. [Google Scholar] [CrossRef]
- Kurashov, E. A.; Barbashova, V. A.; Dudakova, D. S.; Kapustina, L. L.; Mitrukova, G. G.; Rusanov, A. G.; Aleshina, D. G.; Iofina, I. V.; Protopopova, Ye. V.; et al. Ladoga Lake ecosystem: present–day conditions and trends in the late XX to early XXI century. Biosphere 2018, 2, 65–121. (In Russian) [Google Scholar] [CrossRef]
- Dreher, T. W.; Matthews, R.; Davis II, E. W.; Mueller, R. S. Woronichinia naegeliana: A common nontoxigenic component of temperate freshwater cyanobacterial blooms with 30 % of its genome in transposons. Harmful Algae 2023, 125, 102433. [Google Scholar] [CrossRef]
- Gabyshev, V.; Davydov, D.; Vilnet, A.; Sidelev, S.; Chernova, E.; Barinova, S.; Gabysheva, O.; Zhakovskaya, Z. Gloeotrichia cf. natans (Cyanobacteria) in the Continuous Permafrost Zone of Buotama River, Lena Pillars Nature Park, in Yakutia (Russia). Water 2023, 15, 2370. [Google Scholar] [CrossRef]
- Winder, M.; Sommer, U. Phytoplankton response to a changing climate. Hydrobiologia 2012, 698, 5–16. [Google Scholar] [CrossRef]
- Barinova, S.; Gabyshev, V.; Genkal, S.; Gabysheva, O. Diatoms of Small Water Bodies as Bioindicators in the Assessment of Climatic and Anthropogenic Impacts on the Coast of Tiksi Bay, Russian Arctic. Water 2023, 15, 1533. [Google Scholar] [CrossRef]
- Pislegina, E. V.; Shchapov, K. S.; Izmestyeva, L. R. Influence of wind carrying over on an abundance of a plankton in direct thermal stratification of 2009 in Southern Baikal (settlement the Bolshie Coty). Bulletin of the Irkutsk State University. Biology. Ecology 2011, 4, 67–72. (In Russian) [Google Scholar]
- Mikaelyan, A. S.; Zatsepin, A. G.; Kubryakov, A. A. Effect of mesoscale eddy dynamics on bioproductivity of the marine ecosystems (review). Physical Oceanograph 2020, 27, 590–618. [Google Scholar] [CrossRef]
- Barinova, S.; Gabyshev, V.; Genkal, S. Diversity of Diatom Algae in the Lena Delta Nature Reserve and the Adjacent Territory in the Specific Ecological Factors of the Arctic. Diversity 2023, 15, 802. [Google Scholar] [CrossRef]
- Hustedt, F. Systematische und Ökologische Untersuchungen über die Diatomeenflora von Java, Bali und Sumatra. Archiv. Hydrobiol. Suppl. 1938–1939, 15–16, 131–177, 393–506, 638–790, 1–155, 274–394.
- Hustedt, F. Die Diatomeen flora des Flußsystems der Weser im Gebiet der Hansestadt Bremen. Abhandlungen Naturwissenschaftlichen Vereins Bremen 1957, 34, 181–440. [Google Scholar]
- Van Dam, H.; Mertens, A.; Sinkeldam, J. A coded checklist and ecological indicator values of freshwater diatoms from the Netherlands. Netherlands Journal of Aquatic Ecology 1994, 28(1), 117–133. [Google Scholar] [CrossRef]

| Station | Location in reservoir |
Latitude | Longitude | Depth, m | Temperature, °С June |
Temperature, °С August |
pH June |
pH August |
Oxygen, mg O2 dm-3 June |
Oxygen, mg O2 dm-3 August |
|---|---|---|---|---|---|---|---|---|---|---|
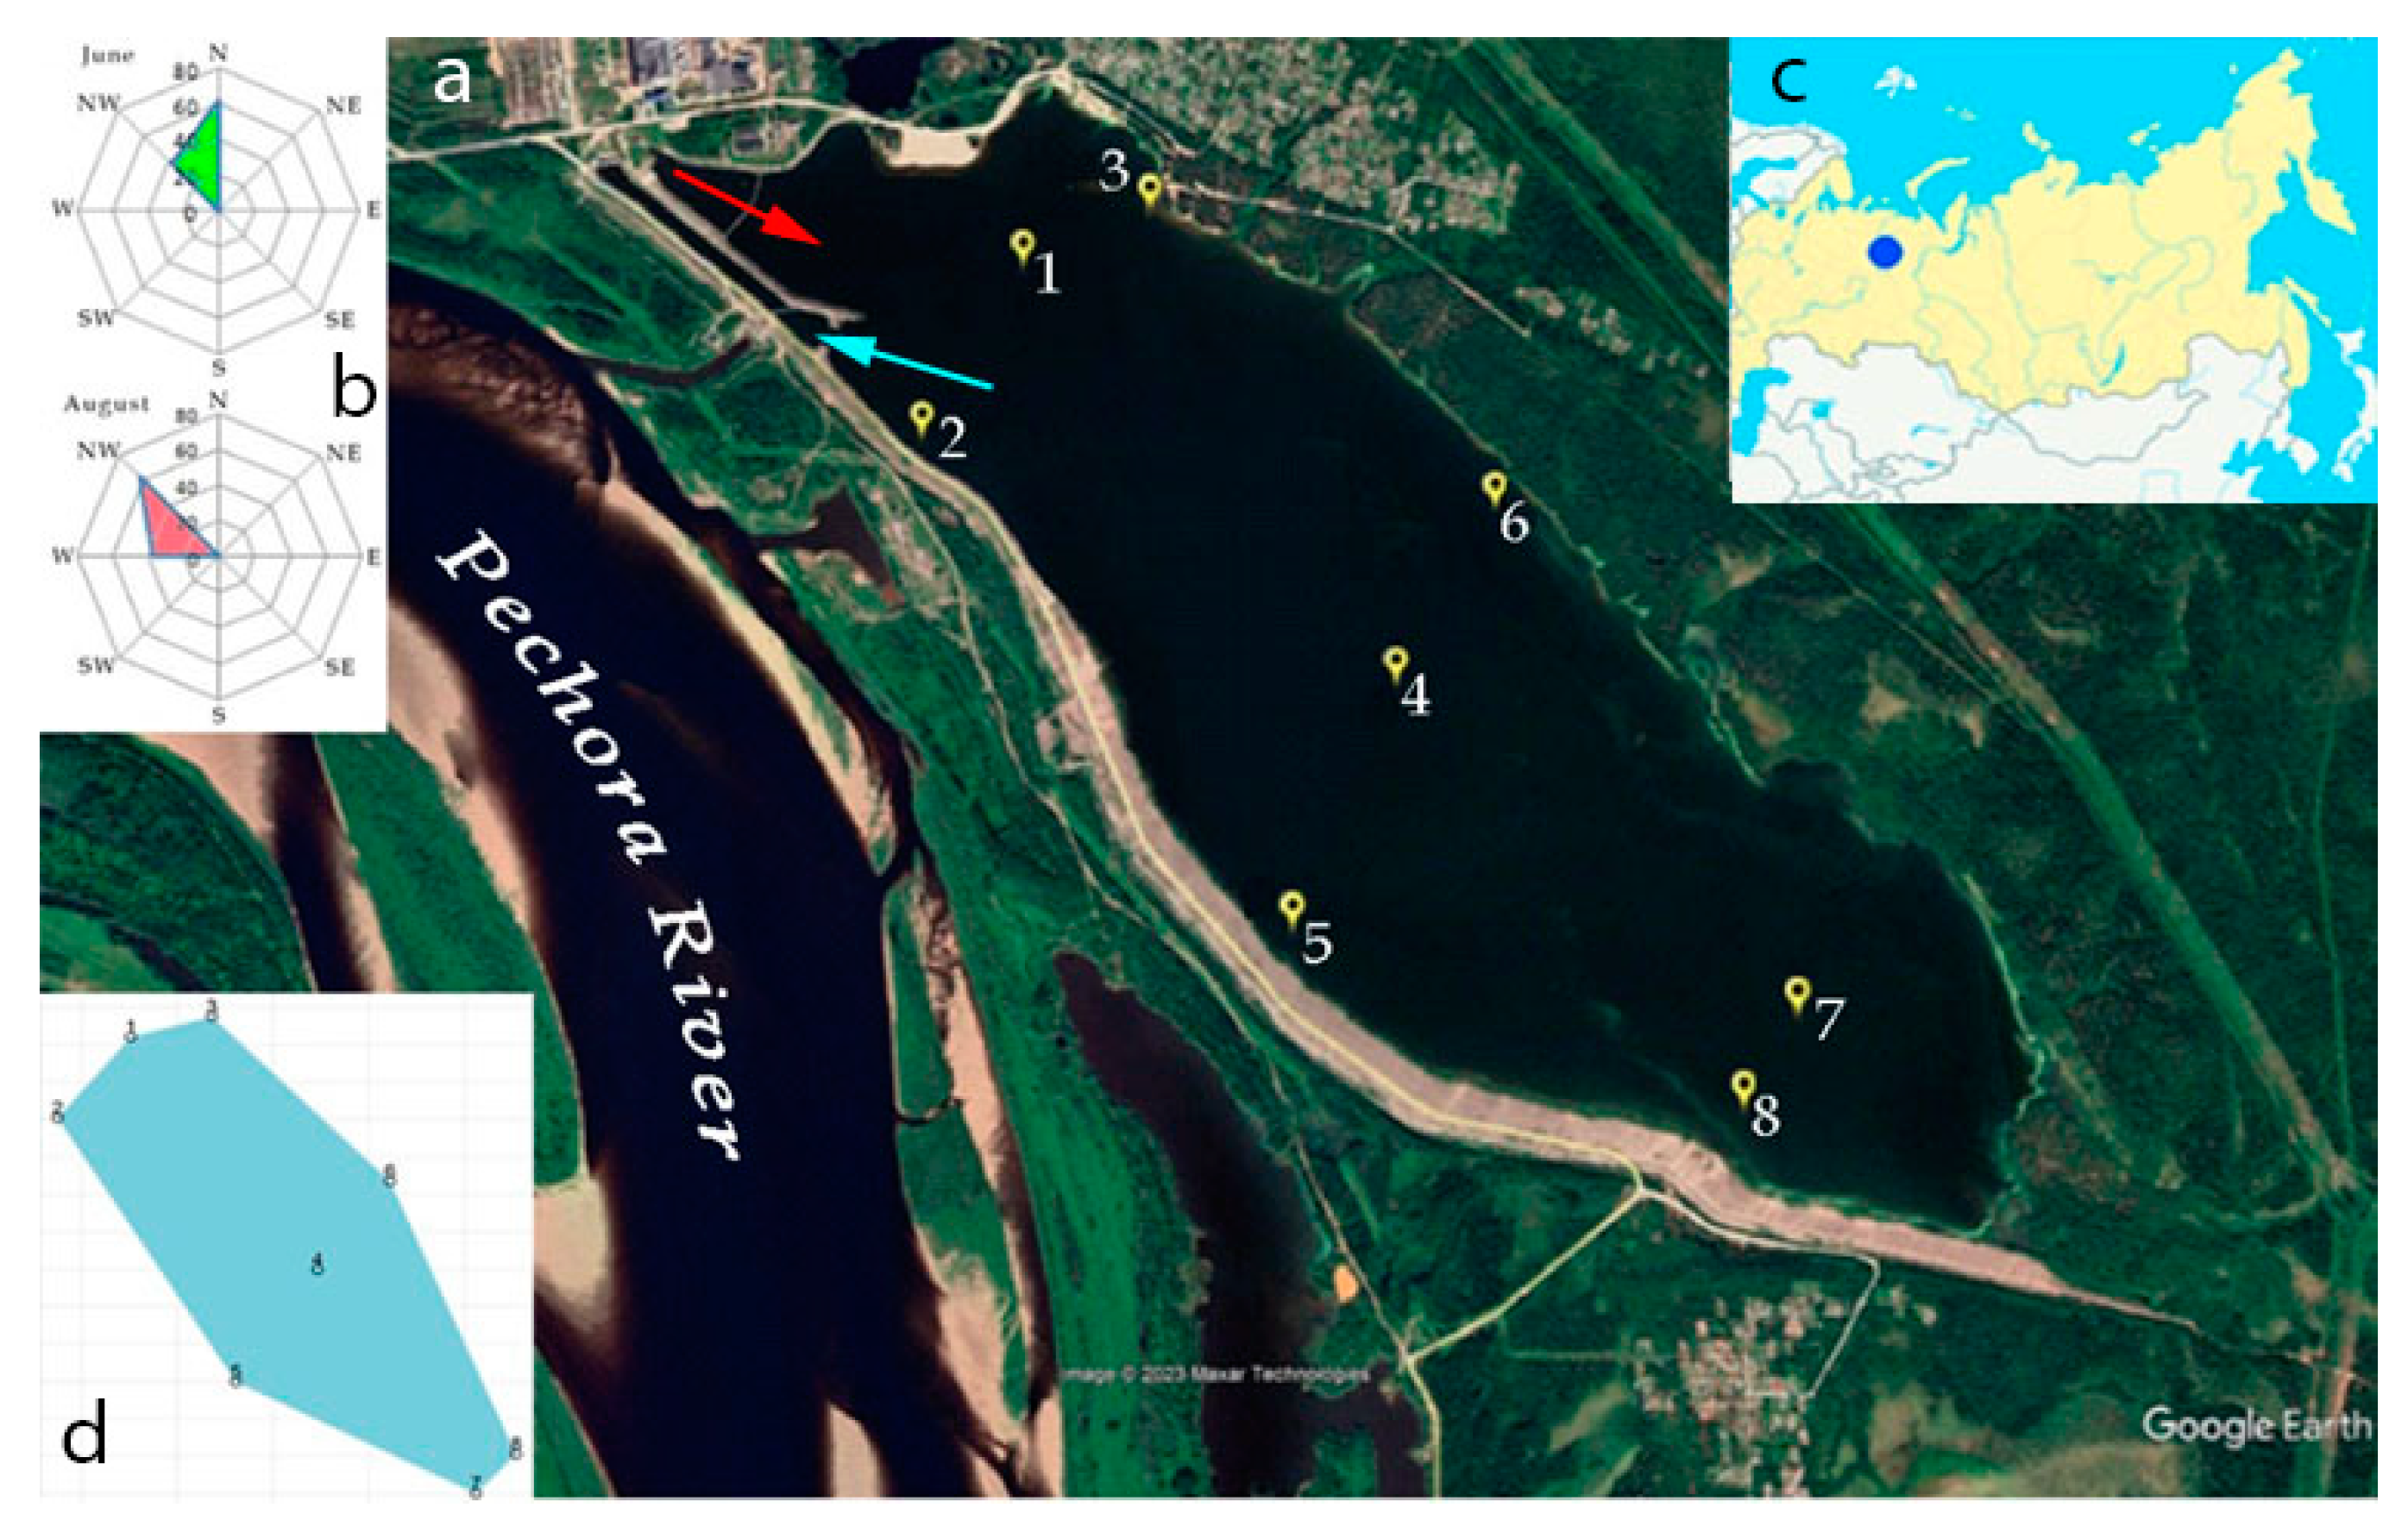
| 1 | Upper part, center | 65.126408° | 57.335149° | 5.8 | 21.1 | 18.6 | 7.2 | 7.6 | 8.51 | 8.25 |
| 2 | Upper part, near the southern coast (place of discharge of warm waters) | 65.122078° | 57.327509° | 4.3 | 24.5 | 19.9 | 7.2 | 7.6 | 8.43 | 8.77 |
| 3 | Upper part, on the north coast | 65.127499° | 57.343625° | 5.7 | 24.5 | 18.5 | 7.2 | 7.9 | 8.60 | 8.85 |
| 4 | Central part of the reservoir | 65.113962° | 57.354654° | 6.9 | 22.4 | 17.8 | 7.2 | 7.7 | 8.50 | 8.86 |
| 5 | Central part, near the southern coast | 65.107971° | 57.346128° | 4.0 | 21.1 | 18.2 | 7.1 | 7.9 | 8.74 | 9.18 |
| 6 | Central part. on the north coast | 65.118693° | 57.362238° | 5.0 | 21.3 | 18.3 | 7.1 | 7.9 | 8.71 | 8.96 |
| 7 | Lower part, center | 65.102001° | 57.371222° | 3.9 | 21.3 | 18.8 | 7.1 | 8.1 | 8.61 | 9.58 |
| 8 | Lower part, near the southern coast | 65.104101° | 57.375376° | 2.8 | 21.1 | 18.9 | 7.1 | 8.1 | 8.82 | 9.60 |
| Station | 1 | 4 | 7 | 1 | 4 | 7 | |
|---|---|---|---|---|---|---|---|
| Variable | Unit | June | June | June | August | August | August |
| рН | - | 7.2±0.2 | 7.2±0.2 | 7.1±0.2 | 7.6±0.2 | 7.7±0.2 | 8.1±0.2 |
| Electrical Conductivity | µS cm-1 | 79±4 | 78±4 | 78±4 | 87±4 | 87±4 | 89±4 |
| HCO3 | mg dm-3 | 43±5 | 43±5 | 69±8 | 47±6 | 45±5 | 48±6 |
| Total alkalinity | mmol dm-3 | 0.71±0.09 | 0.70±0.08 | 1.14±0.14 | 0.77±0.09 | 0.73±0.09 | 0.79±0.09 |
| PV (Permanganate Value) | mg dm-3 | 5.7±0.6 | 5.9±0.6 | 5.9±0.6 | 6.3±0.6 | 6.3±0.6 | 6.3±0.6 |
| COD | mgO dm-3 | 21±6 | 22±7 | 18±5 | 20±6 | 21±6 | 20±6 |
| CI- | mg dm-3 | 1.8±0.3 | 1.9±0.3 | 1.9±0.3 | 1.61±0.29 | 1.61±0.29 | 1.80±0.3 |
| SO42- | mg dm-3 | 4.5±0.8 | 3.8±0.8 | 3.8±0.8 | 3.9±0.8 | 4.1±0.8 | 3.7±0.8 |
| PO43- | mg dm-3 | <0.05 | <0.05 | <0.05 | <0.05 | <0.05 | <0.05 |
| TSS | mg dm-3 | 0.0 | 1.45±0.26 | 0.63±0.14 | 1.17±0.21 | 1.06±0.19 | 2.00±0.40 |
| Fe | mg dm-3 | <0.050 | <0.050 | <0.050 | <0.050 | <0.050 | <0.050 |
| Cu | µg dm-3 | <1 | 6.1±1.4 | 4.2±1.0 | 5.3±2.2 | 5.1±2.1 | 4.4±1.9 |
| Phenol | µg dm-3 | <0.25 | 0.35±0.14 | 0.28±0.11 | <0.25 | <0.25 | <0.25 |
| Zn | µg dm-3 | <5 | <5 | <5 | <5 | <5 | <5 |
| Sr | µg dm-3 | 40±10 | 41±11 | 35±9 | 41±11 | 41±11 | 42±10 |
| Mn | µg dm-3 | 1.7±0.4 | <1.0 | 1.3±0.4 | <1.0 | <1.0 | <1.0 |
| Ni | µg dm-3 | <1.0 | <1.0 | <1.0 | 2.6±1.1 | 2.1±0.9 | 2.0±0.8 |
| Ca | mg dm-3 | 10.0±1.6 | 10.2±1.6 | 9.05±1.4 | 12.7±2.0 | 12.6±2.0 | 12.8±2.1 |
| Mg | mg dm-3 | 2.3±0.3 | 2.3±0.3 | 2.0±0.3 | 2.6±0.4 | 2.7±0.3 | 2.7±0.4 |
| K | mg dm-3 | 0.86±0.21 | 0.82±0.20 | 0.73±0.18 | 0.83±0.20 | 0.83±0.20 | 0.87±0.21 |
| Na | mg dm-3 | 3.2±0.5 | 3.3±0.5 | 3.0±0.4 | 3.2±0.5 | 3.2±0.5 | 3.3±0.5 |
| N-NO3 | mg dm-3 | <0.010 | <0.010 | <0.010 | 0.018±0.008 | <0.010 | 0.015±0.008 |
| N-NO2 | mg dm-3 | <0.010 | <0.010 | <0.010 | 0.016±0.006 | <0.010 | <0.010 |
| N-NН4 | mg dm-3 | 0.010±0.002 | 0.011±0.002 | 0.041±0.009 | 0.061±0.014 | 0.031±0.007 | 0.070±0.016 |
| Stotal | mg dm-3 | 1.7±0.4 | 1.8±0.4 | 1.6±0.4 | 1.8±0.4 | 1.8±0.4 | 1.8±0.4 |
| Ptotal | mg dm-3 | <0.020 | <0.020 | <0.020 | 0.027±0.011 | <0.020 | <0.020 |
| Variable | St 1 | St 2 | St 3 | St 4 | St 5 | St 6 | St 7 | St 8 |
|---|---|---|---|---|---|---|---|---|
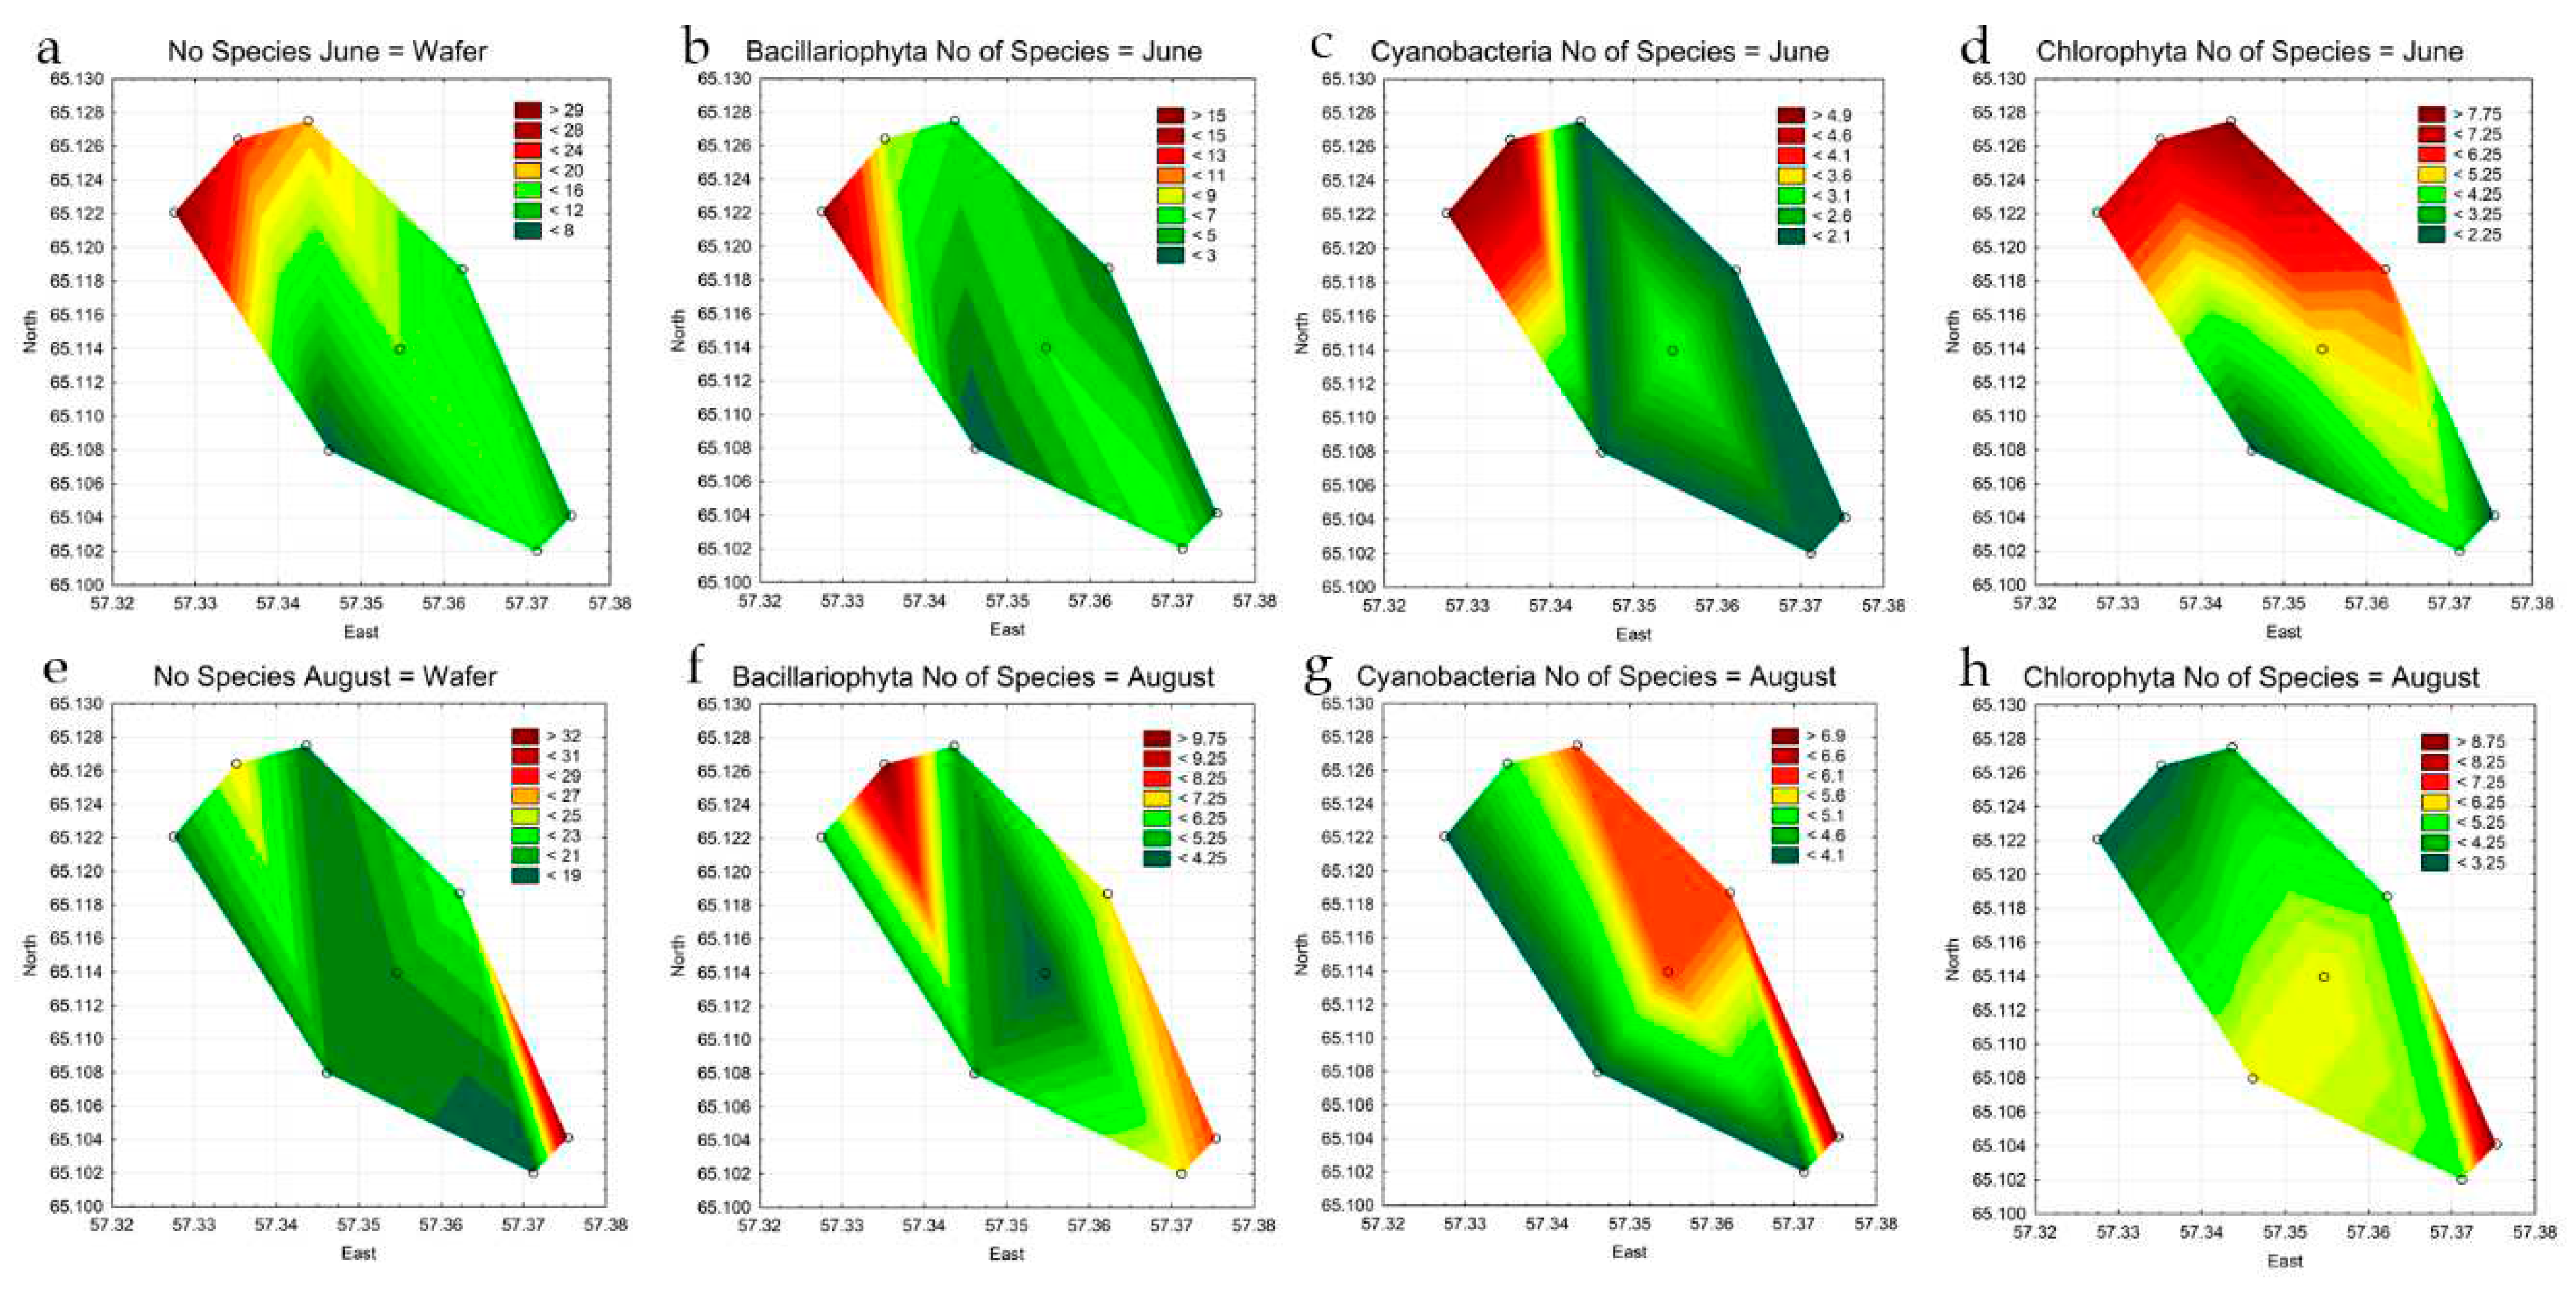
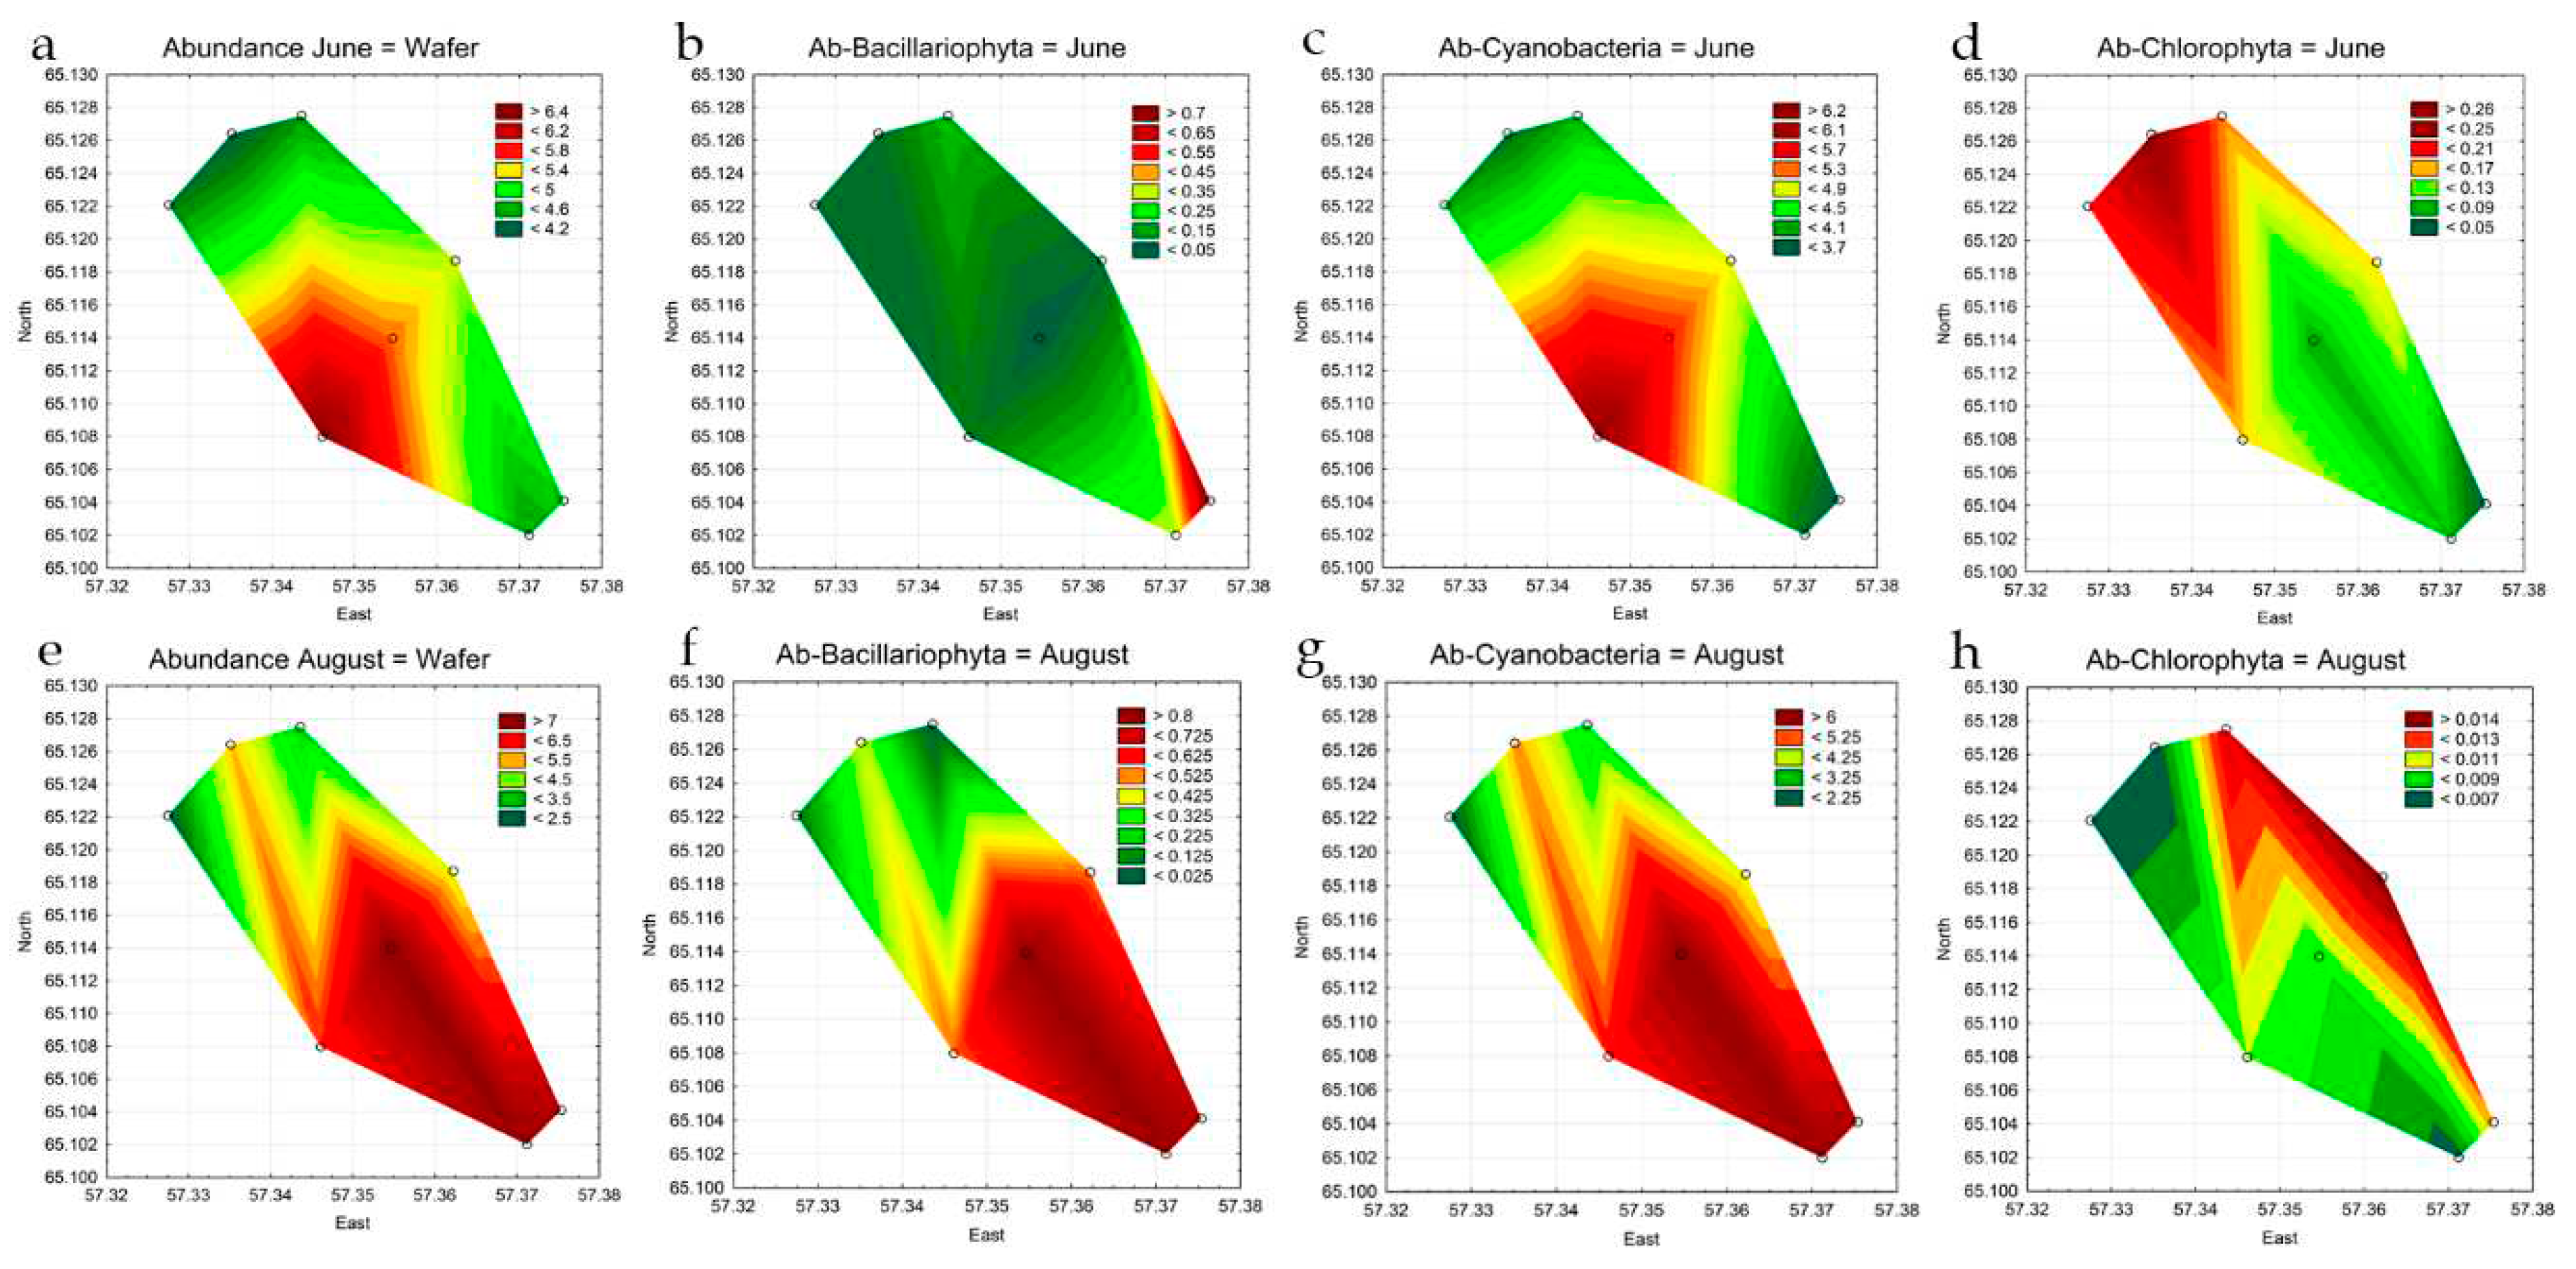
| No Species June | 23 | 30 | 20 | 16 | 7 | 13 | 15 | 10 |
| No Species August | 26 | 19 | 19 | 20 | 20 | 23 | 18 | 33 |
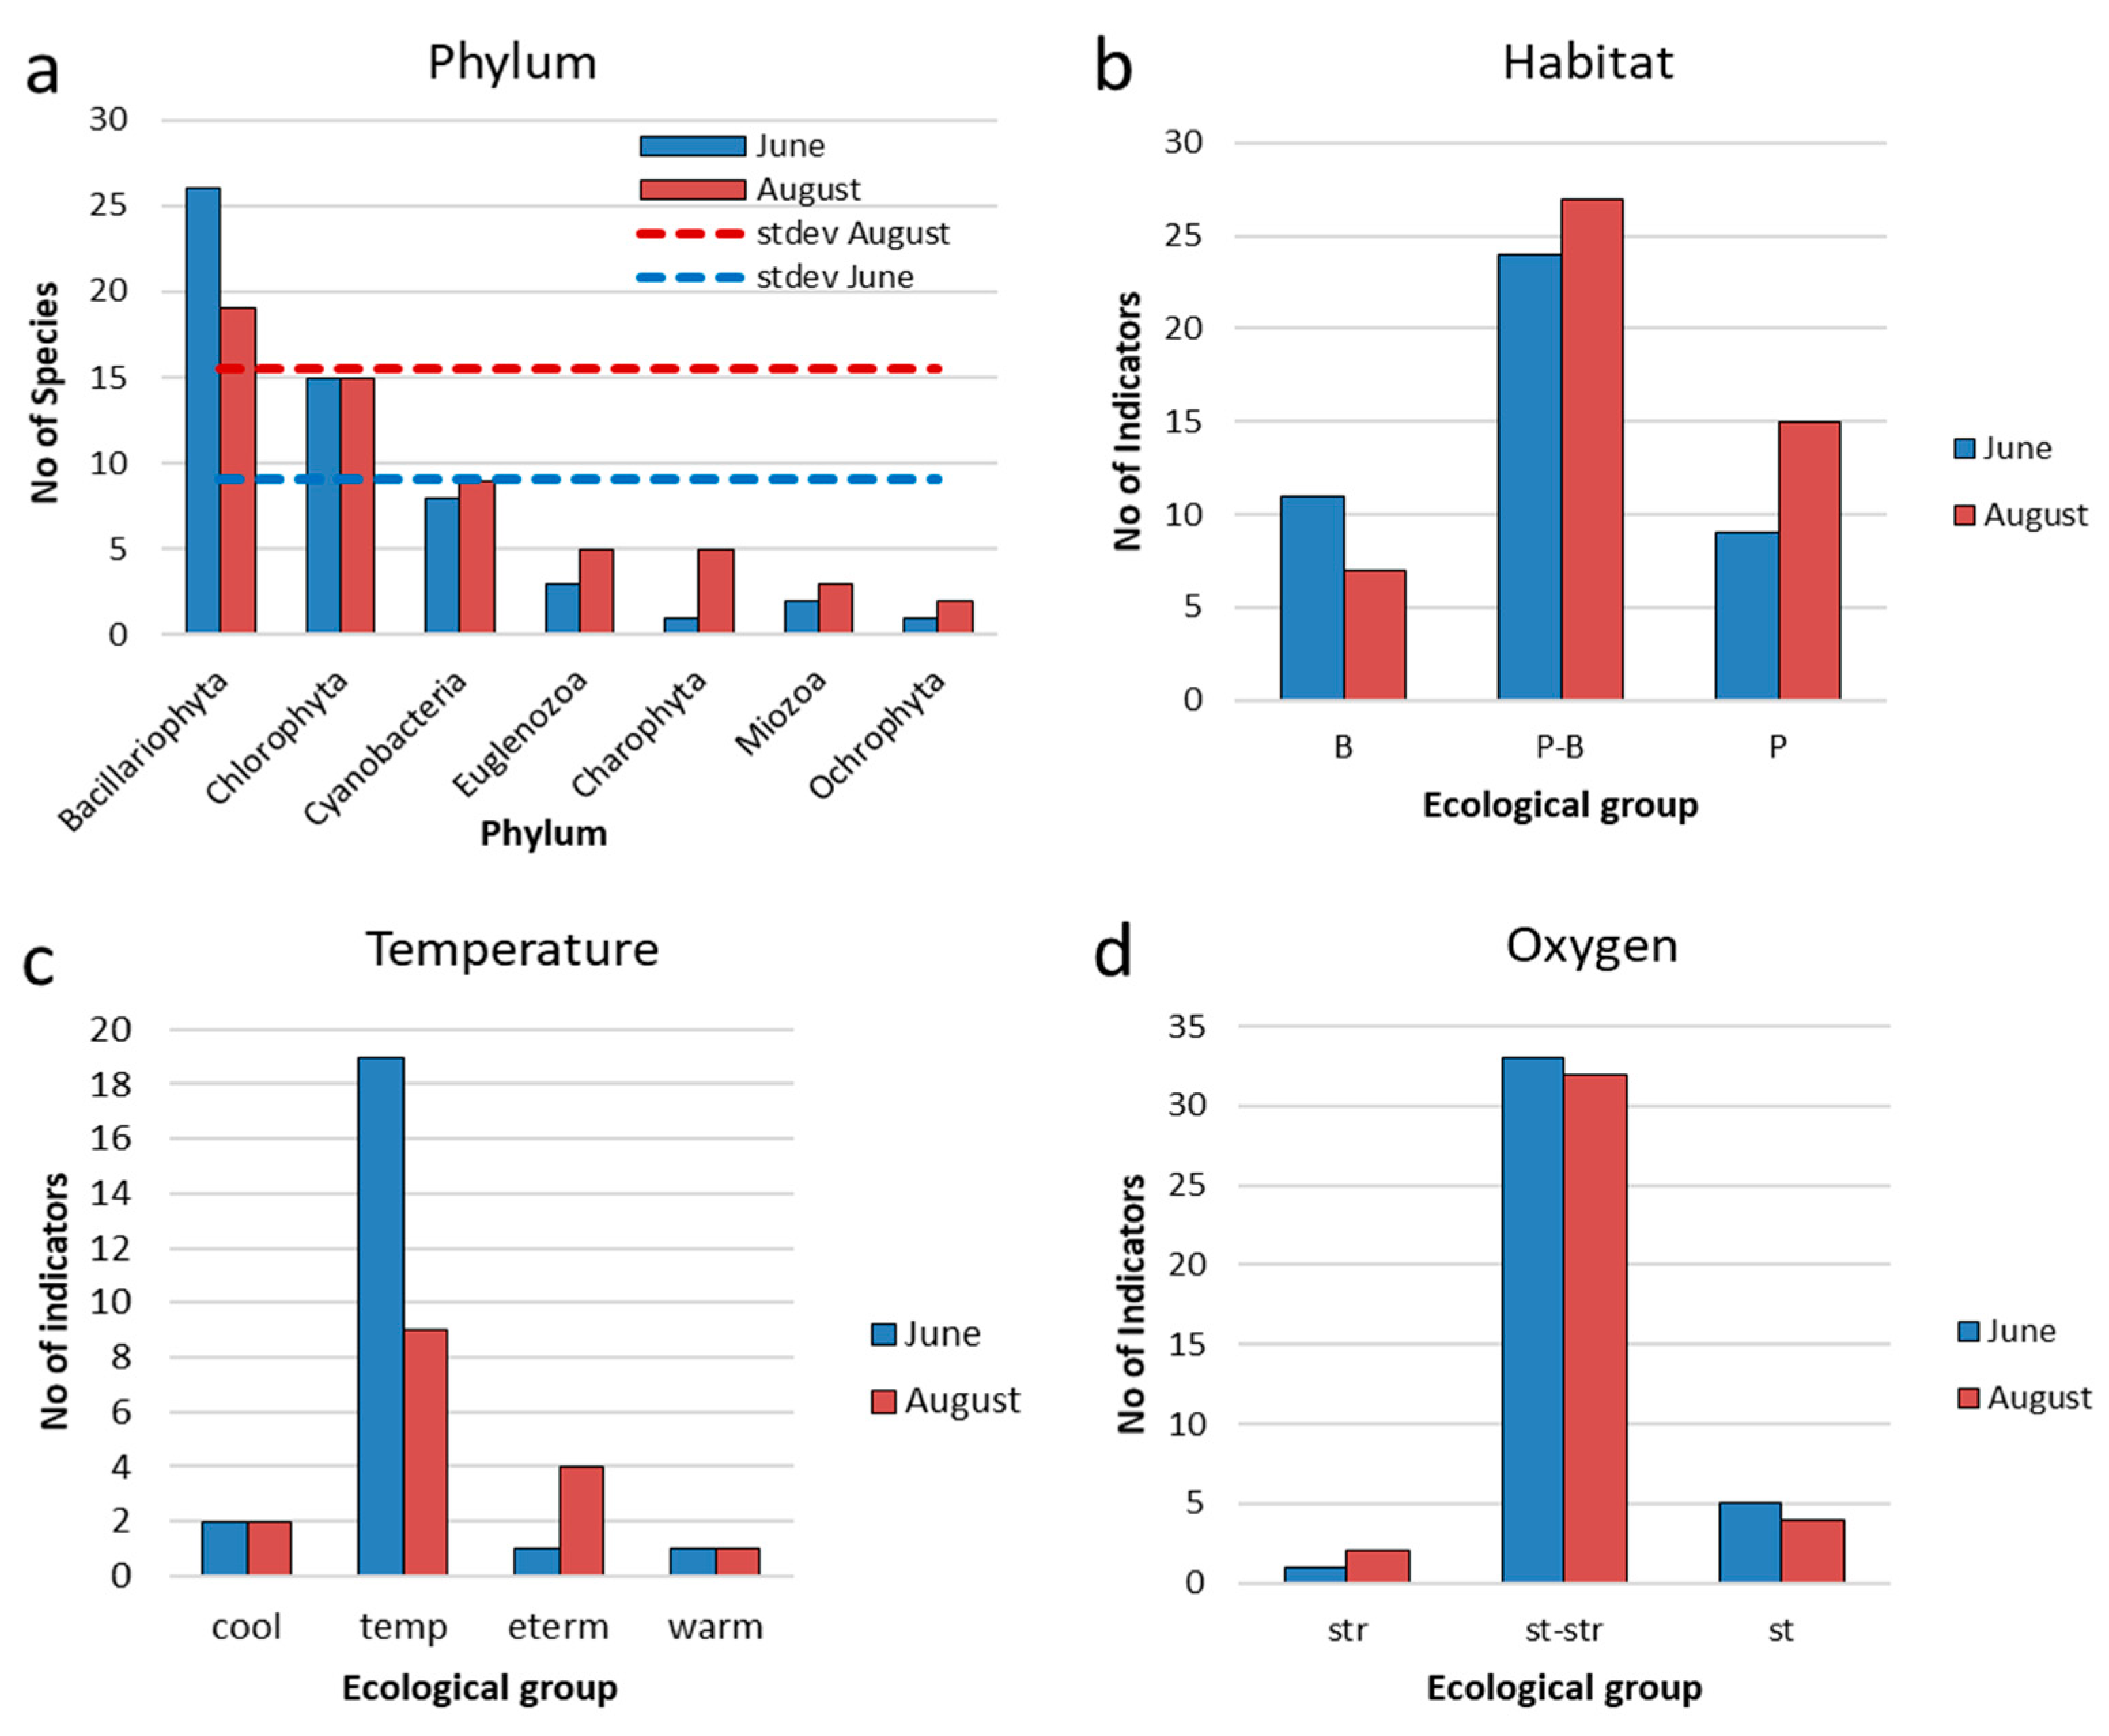
| Bacillariophyta, no. species June | 8 | 16 | 6 | 6 | 2 | 3 | 7 | 3 |
| Chlorophyta, no. species June | 7 | 7 | 8 | 5 | 2 | 6 | 4 | 2 |
| Cyanobacteria, no. species June | 5 | 5 | 2 | 3 | 2 | 2 | 2 | 2 |
| Euglenozoa, no. species June | 1 | 0 | 3 | 0 | 0 | 0 | 0 | 1 |
| Miozoa, no. species June | 2 | 1 | 1 | 1 | 0 | 1 | 1 | 1 |
| Ochrophyta, no. species June | 1 | 1 | 0 | 1 | 0 | 1 | 1 | 1 |
| Charophyta, no. species June | 0 | 0 | 0 | 0 | 1 | 0 | 0 | 0 |
| Bacillariophyta, no. species August |
10 | 5 | 5 | 4 | 5 | 7 | 7 | 8 |
| Charophyta, no. species June | 3 | 2 | 3 | 1 | 2 | 1 | 1 | 4 |
| Chlorophyta, no. species June | 3 | 3 | 4 | 6 | 6 | 5 | 5 | 9 |
| Cyanobacteria, no. species June | 5 | 4 | 6 | 6 | 4 | 6 | 4 | 7 |
| Euglenozoa, no. species June | 2 | 3 | 0 | 1 | 1 | 1 | 0 | 2 |
| Miozoa, no. species June | 2 | 2 | 1 | 2 | 2 | 2 | 1 | 2 |
| Ochrophyta, no. species June | 1 | 0 | 0 | 0 | 0 | 1 | 0 | 1 |
| Total Abundance, million cells L-1 June |
4.1470 | 4.3348 | 4.4660 | 5.5973 | 6.4875 | 5.1283 | 4.4813 | 4.6775 |
| Total Abundance, million cells L-1 August | 5.2998 | 2.2891 | 3.5435 | 7.7418 | 6.0063 | 4.8970 | 7.6073 | 7.2395 |
| Bacillariophyta, million cells L-1 June | 0.0675 | 0.0490 | 0.1700 | 0.0313 | 0.0800 | 0.0525 | 0.3353 | 0.7400 |
| Chlorophyta, million cells L-1 June | 0.2603 | 0.1993 | 0.1745 | 0.0823 | 0.1613 | 0.1580 | 0.0885 | 0.0445 |
| Cyanobacteria, million cells L-1 June | 3.8105 | 4.0513 | 4.1163 | 5.4663 | 6.2450 | 4.8925 | 3.7825 | 3.6463 |
| Bacillariophyta, million cells L-1 August | 0.3698 | 0.0735 | 0.0088 | 0.8425 | 0.5325 | 0.5288 | 0.8513 | 0.7578 |
| Chlorophyta, million cells L-1 August | 0.0060 | 0.0060 | 0.0140 | 0.0093 | 0.0100 | 0.0158 | 0.0065 | 0.0118 |
| Cyanobacteria, million cells L-1 August | 4.8825 | 2.1960 | 3.4670 | 6.7825 | 5.3950 | 4.3113 | 6.6425 | 6.3263 |
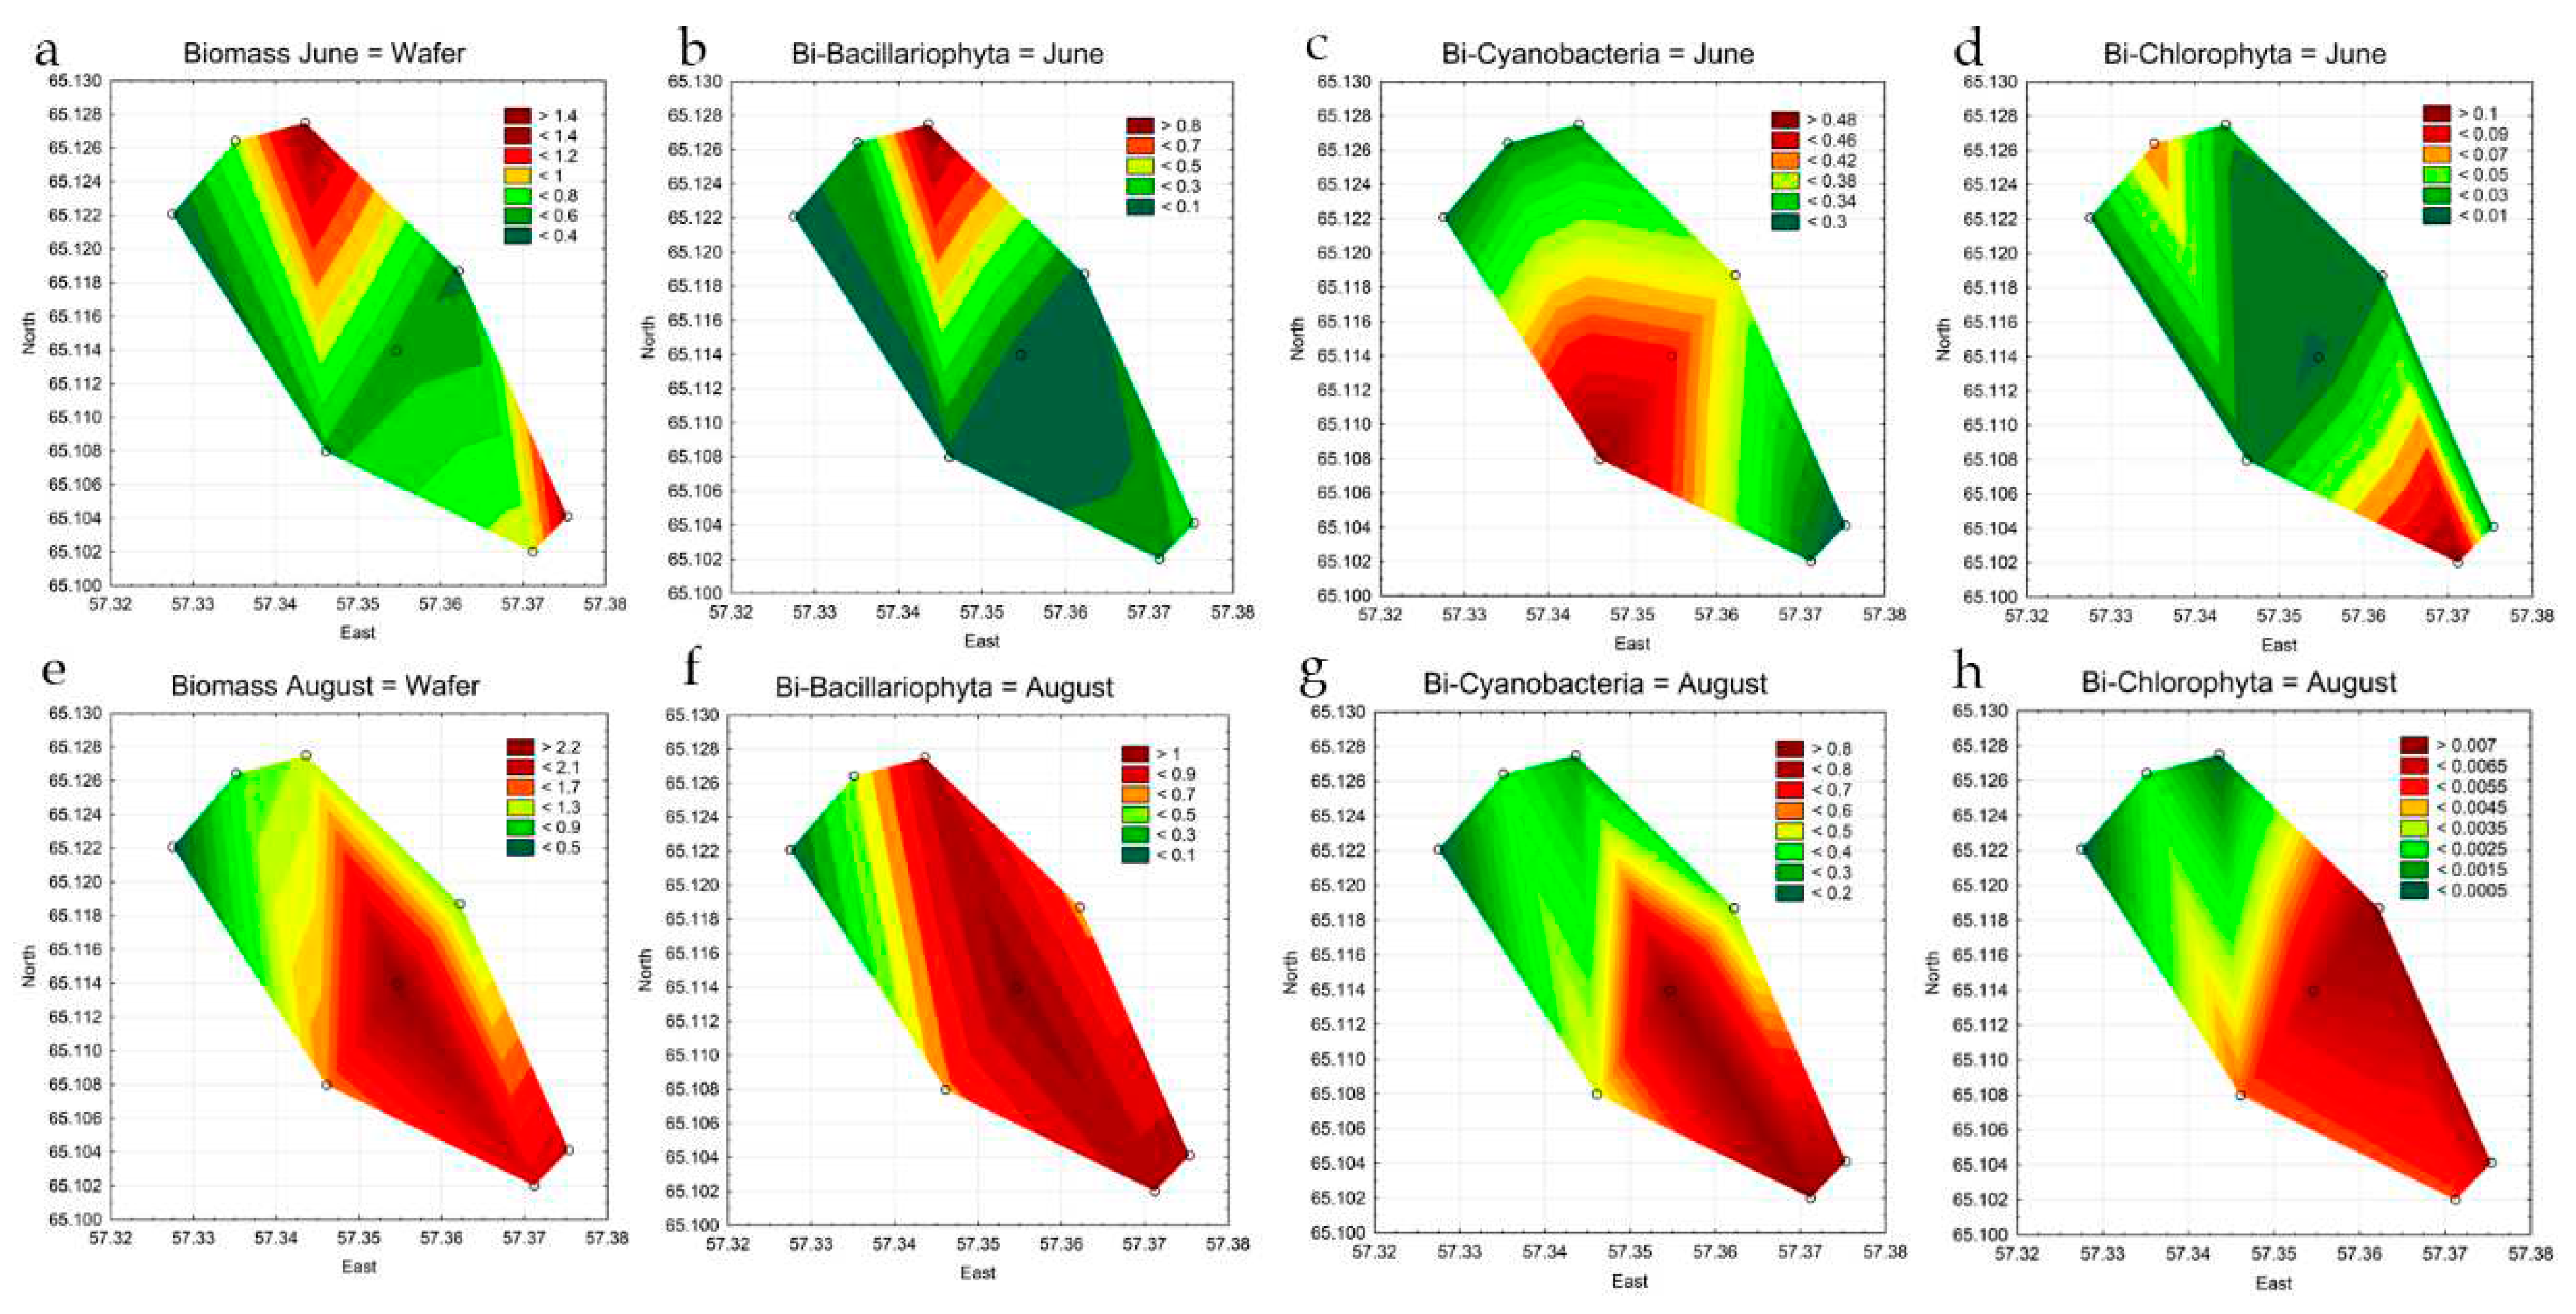
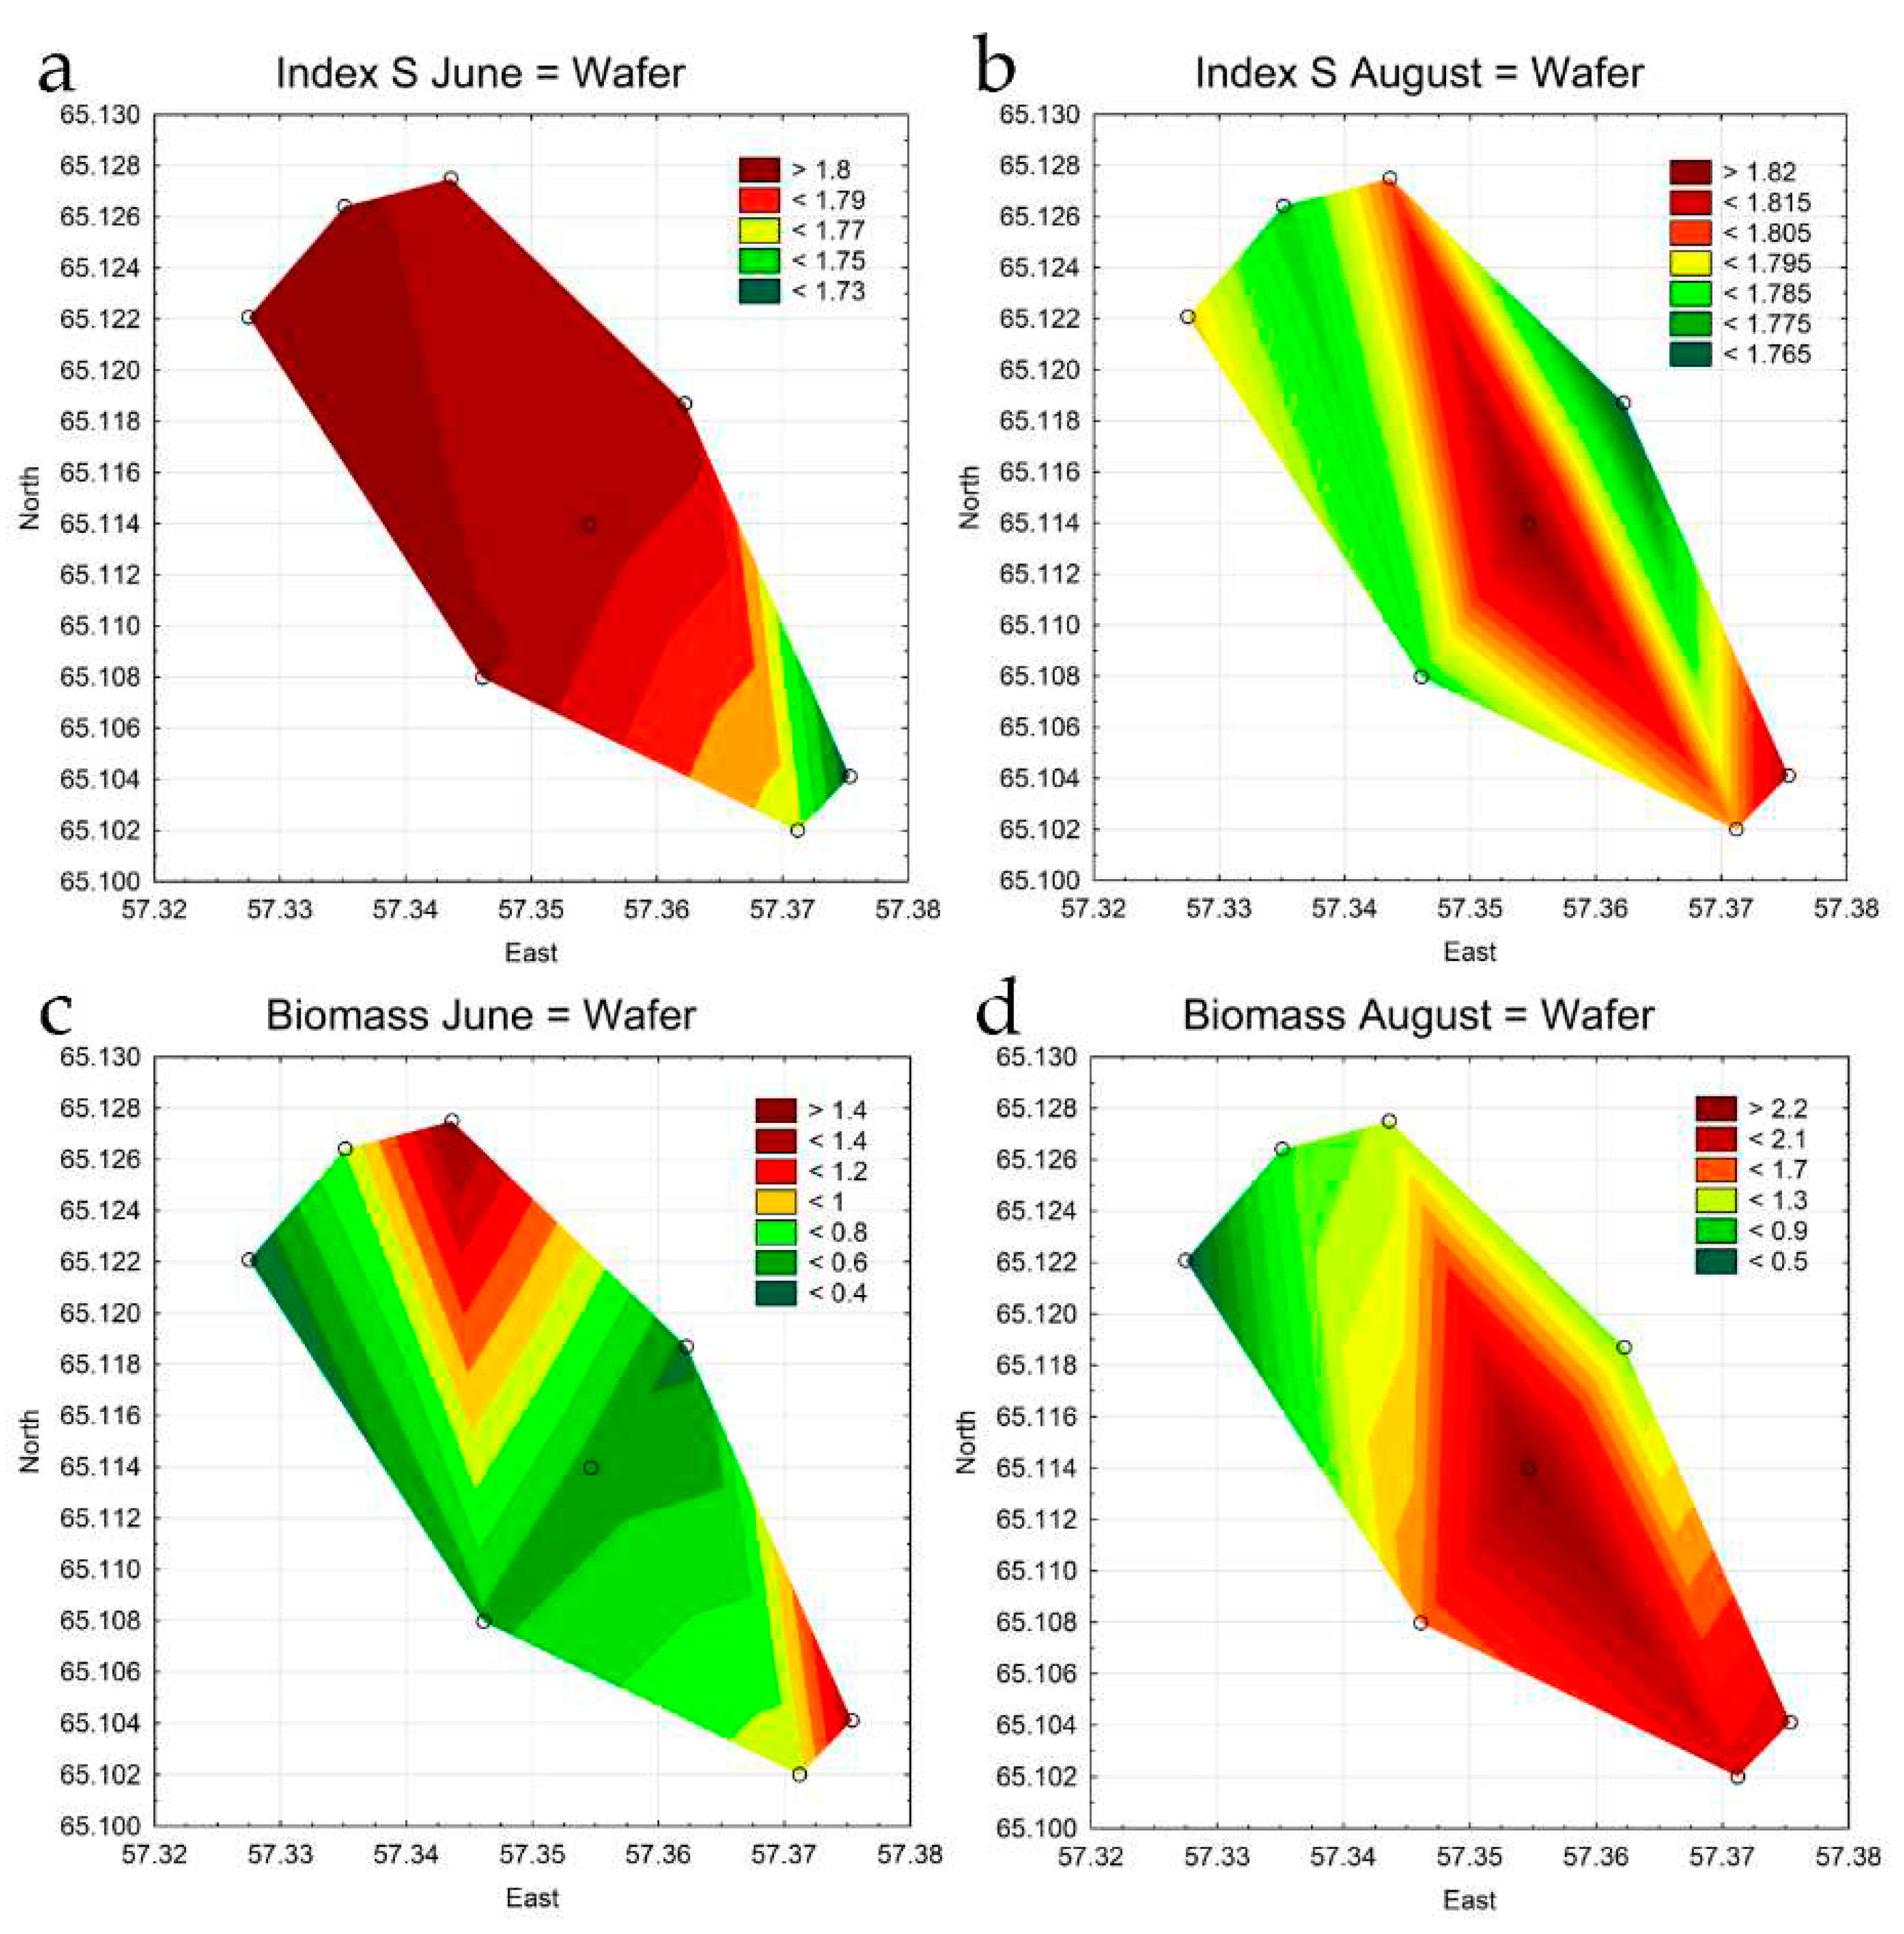
| Total Biomass, mg L-1 June | 0.8096 | 0.3873 | 1.4320 | 0.5467 | 0.5757 | 0.4696 | 0.8639 | 1.3103 |
| Total Biomass, mg L-1 August | 1.0799 | 0.4032 | 1.2327 | 2.3626 | 1.5968 | 1.1466 | 1.9572 | 1.9903 |
| Bacillariophyta, mg L-1 June | 0.1859 | 0.0403 | 0.9847 | 0.0339 | 0.0647 | 0.0432 | 0.1309 | 0.2950 |
| Chlorophyta, mg L-1 June | 0.0688 | 0.0174 | 0.0211 | 0.0085 | 0.0134 | 0.0174 | 0.1061 | 0.0226 |
| Cyanobacteria, mg L-1 June | 0.3135 | 0.3018 | 0.3203 | 0.4351 | 0.4965 | 0.3851 | 0.3008 | 0.2901 |
| Bacillariophyta, mg L-1 August | 0.4954 | 0.0761 | 0.9239 | 1.0520 | 0.6741 | 0.6681 | 0.9559 | 0.9512 |
| Chlorophyta, mg L-1 August | 0.0025 | 0.0004 | 0.0006 | 0.0067 | 0.0049 | 0.0076 | 0.0051 | 0.0066 |
| Cyanobacteria, mg L-1 August | 0.3884 | 0.1752 | 0.2783 | 0.8494 | 0.4975 | 0.4281 | 0.8421 | 0.7784 |
| Index S June | 1.81 | 1.81 | 1.80 | 1.81 | 1.81 | 1.81 | 1.76 | 1.72 |
| Index S August | 1.78 | 1.80 | 1.80 | 1.82 | 1.78 | 1.76 | 1.80 | 1.82 |
Disclaimer/Publisher’s Note: The statements, opinions and data contained in all publications are solely those of the individual author(s) and contributor(s) and not of MDPI and/or the editor(s). MDPI and/or the editor(s) disclaim responsibility for any injury to people or property resulting from any ideas, methods, instructions or products referred to in the content. |
© 2023 by the authors. Licensee MDPI, Basel, Switzerland. This article is an open access article distributed under the terms and conditions of the Creative Commons Attribution (CC BY) license (https://creativecommons.org/licenses/by/4.0/).


