1. Introduction
Bisphenol A diglycidyl ether (2, 2-Bis (4-glycidyloxyphenyl) propane, BADGE) is a condensation product of BPA and epichlorohydrin. It can be used as additive of polyester fiber and scrubber of hydrochloric acid. It is often used to remove hydrochloric acid in organosol resin, and widely exists in the inner wall of metal cans [
1,
2,
3]. If the chemical reaction is not complete during the coating manufacturing process, BADGE may remain in food cans [
4,
5]. In addition, it may migrate to food contents during processing and storage [
6,
7]. Due to the complexity of food matrix, when BADGE contact with acidic or greasy food, hydrolysis or chlorination reaction will occur to generate various derivatives, such as Bisphenol A (2, 3-dihydroxypropyl) glycidyl ether (BADGE·H
2O), Bisphenol A (3-chloro-2-hydroxypropyl) glycidyl ether (BADGE·HCl) and Bisphenol A (3-chloro-2-hydroxypropyl) (2,3-dihydroxypropyl) glycidyl ether (BADGE·HCl·H
2O) [
8,
9]. BADGE may lead to abnormalities of human endocrine system, immune system or nervous system, and affect normal reproductive and genetic functions [
10,
11,
12]. In fact, BADGE and its derivatives residues had been detected in canned foods such as canned seafood, canned meat products, and energy drinks from markets [
13,
14]. Based on the toxicological research of BADGE and its derivatives and the pollution status in food, European legislation requires that the specific migration limits (SMLs) of BADGE and its hydrolysis derivatives (BADGE·H
2O) were set at 9 mg/kg in foodstuffs or in food simulants, and hydrochloric derivatives (BADGE·HCl and BADGE·HCl·H
2O) should not exceed 1 mg/kg [
15].
There are many analytical methods for bisphenol-dihydrate glycerol ether compound, which mainly concentrated on liquid chromatography-ultraviolet detection (HPLC-UV) [
16], high performance liquid chromatography-fluorescence (HPLC-FLD) [
17,
18,
19], high performance liquid chromatography-tandem mass spectrometry (HPLC-MS/MS) [
20,
21,
22] and gas chromatography-mass spectrometry (GC-MS) [
23]. Although LC-MS / MS and GC-MS / MS have good accuracy and high sensitivity, they are expensive, complex, and require trained operators, which mean they may not be suitable for rapid primary on-site detection. Compared with the instrumental analysis method, the immunoassay method can be used for detection a variety of samples at the same time, and can meet the needs of mass sample detection in the market. The immunochromatographic strip assay eliminates the culture and washing step in the enzyme-linked immunoassay method (ELISA), and the results are given within 15-20 minutes, which means it provides an effective screening method for rapid detection of small molecular contaminants [
24,
25,
26]. At present, gold nanoparticle-based immunochromatographic assay has been widely used in rapid detection in the fields of diagnosis and small molecular detection [
27,
28,
29,
30].
To our best knowledge, at present, there have studies on the production of monoclonal antibodies that can recognize BADGE and the establishment of ELISA method for detecting BADGE in lake water [
31]. The preparation of broad-spectrum polyclonal antibodies that can recognize BADGE and its derivatives and the establishment of immunochromatographic assay have not been reported. Actually, during the migration of BADGE to food contents, hydrolysis or chlorination products may also appear in food matrix. As a result, it is of great significance to establish a rapid and simple immunochromatographic assay to realize the quantitative and qualitative detection of multiple residues on site.
In this work, we developed an immunochromatographic assay using Au nanoparticles (AuNPs) and broad-spectrum polyclonal antibody according to the competitive principle, and the visualization results were processed by Adobe Photoshop CC software to achieve quantitative analysis. Canned food samples were selected for the reliability compliance test and the immunochromatographic strip method can meet the rapid screening of a large number of samples in the market.
2. Results
2.1. Screening of broad-spectrum antibodies
The standard solution of BADGE derivatives was prepared, the IC
50 values were determined and the cross-reactivities were calculated by ic-ELISA. The recognition capability of the selected antiserum to BADGE derivatives was investigated. As shown in
Table 1, the cross-reactivities of antiserum PAb-1 to BADGE·HCl, BADGE·H
2O and BADGE·HCl·H
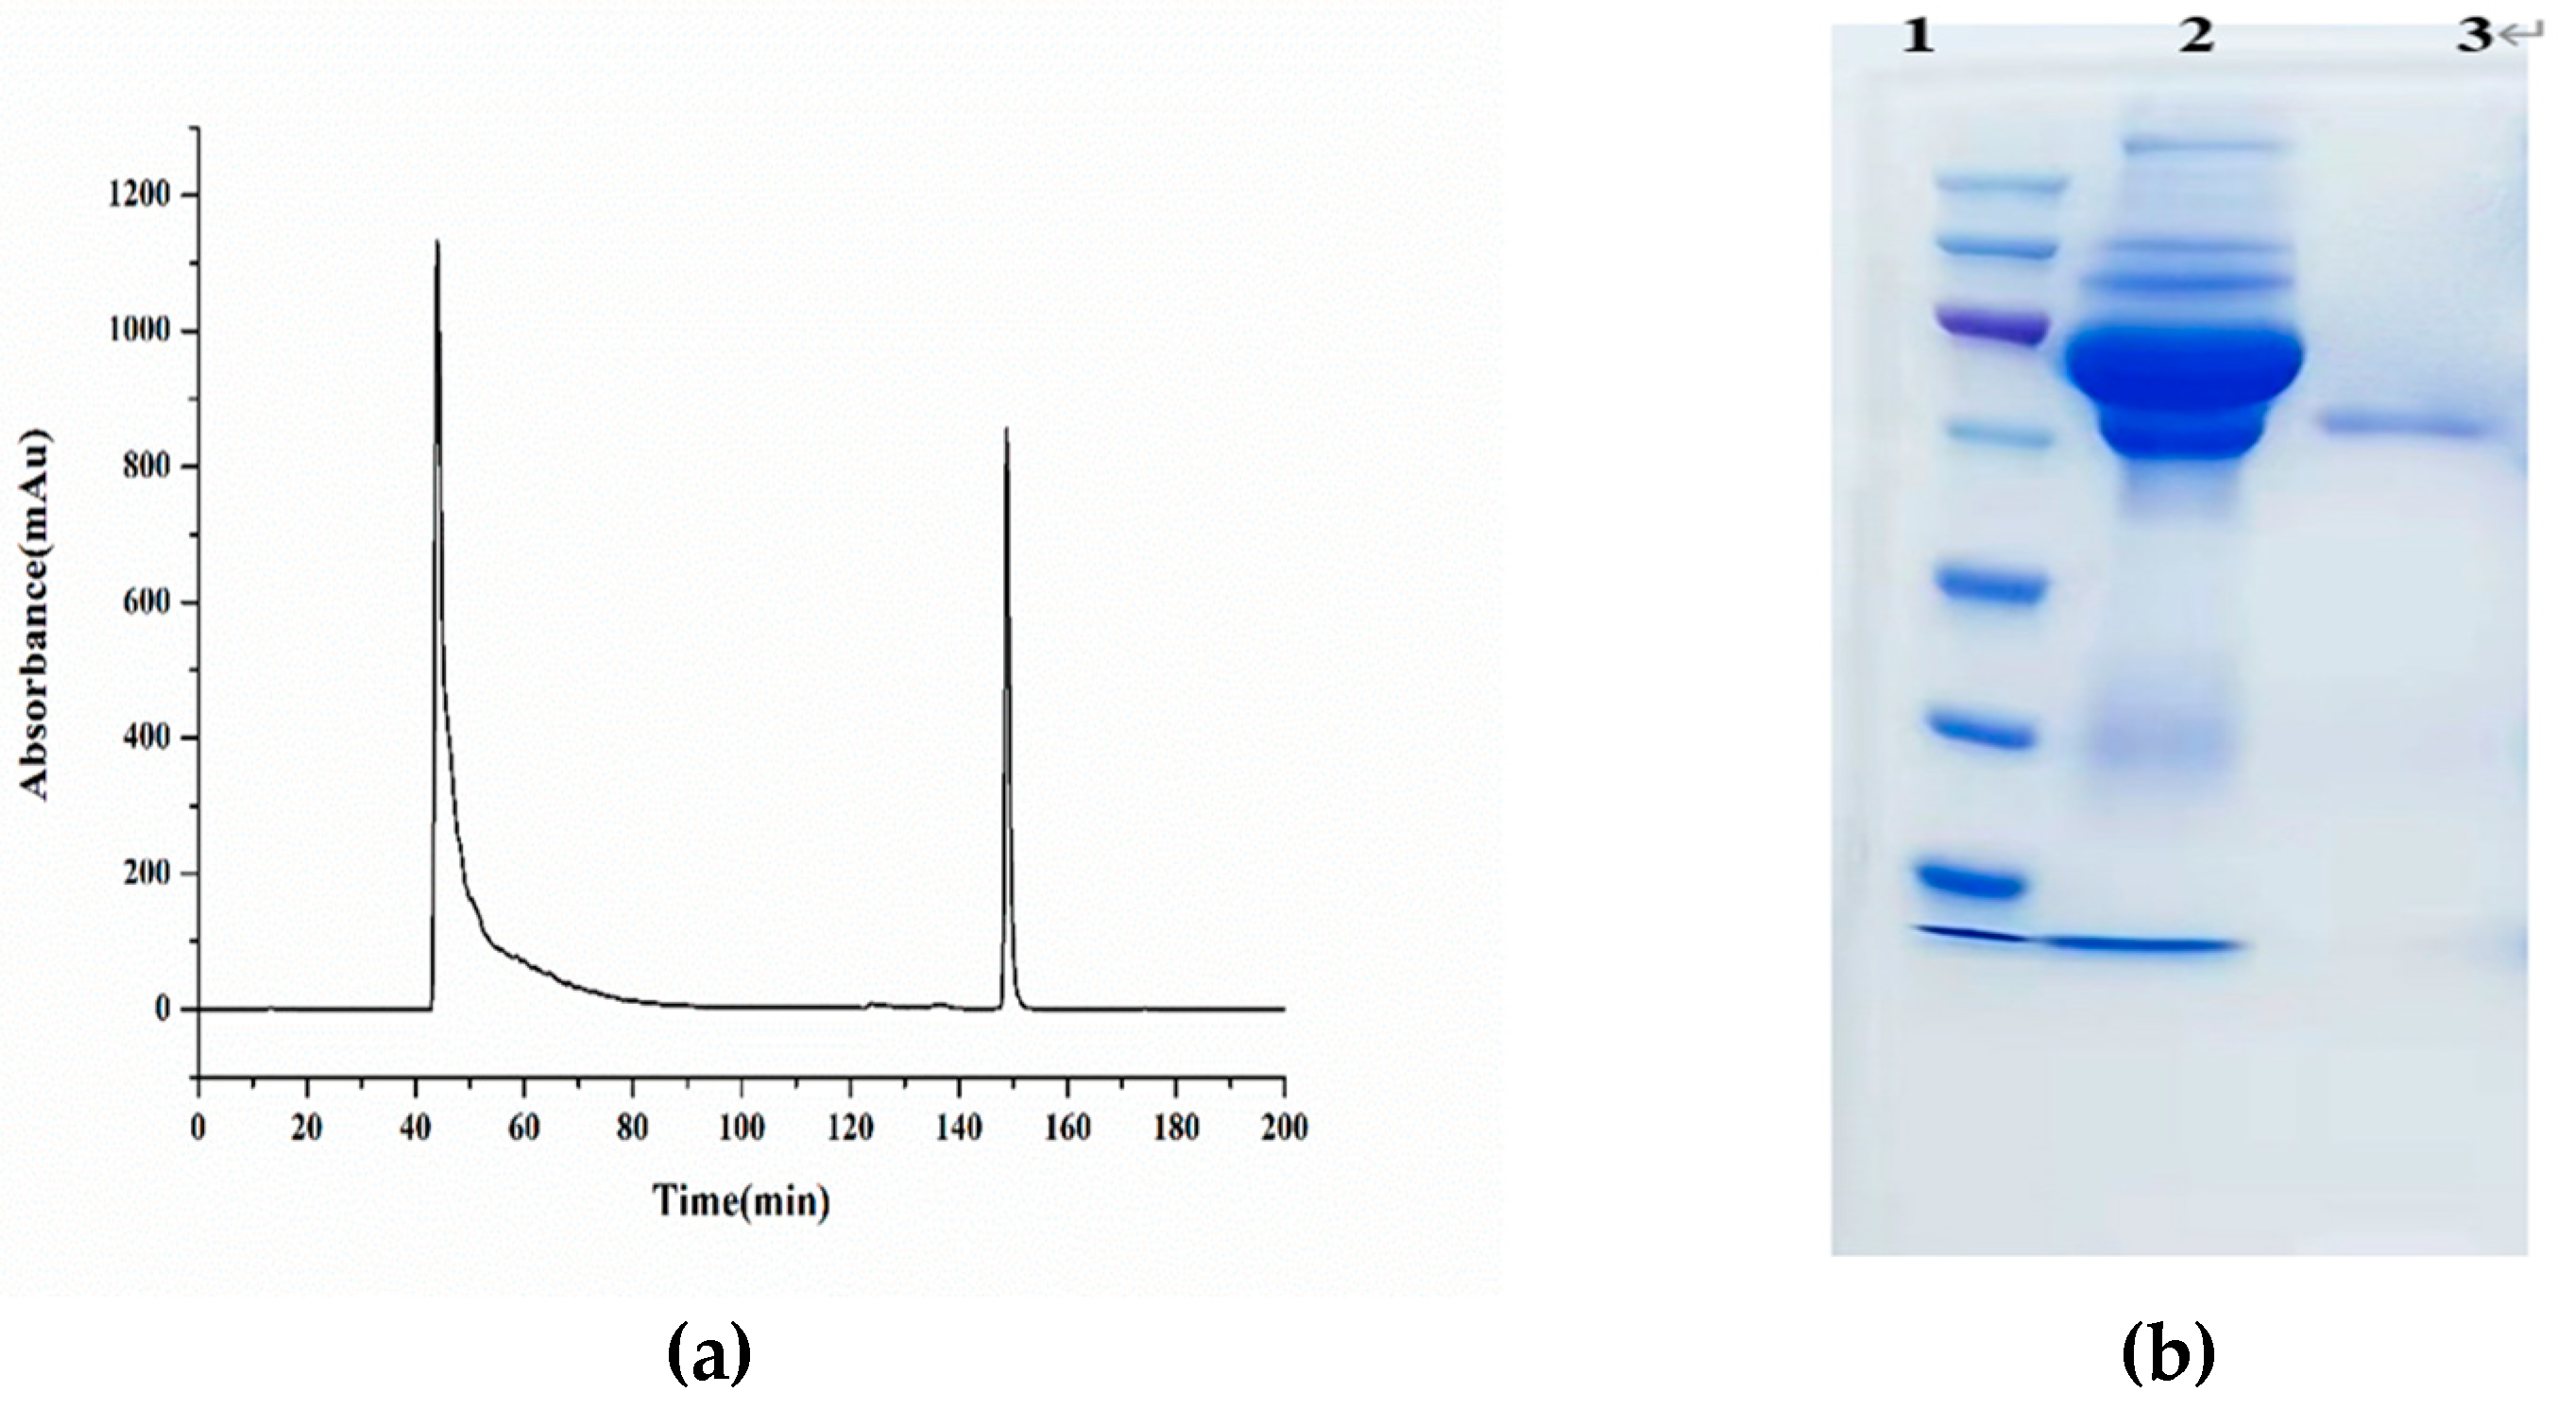
2O were 79.6%, 175.8% and 110.8%, respectively. Compared with other antisera, the antiserum PAb-1 had better recognition capability to BADGE and its derivatives and could be considered as broad-spectrum toward BADGE and its derivatives. Then, the antibody was purified by protein A-Sepharose 4B affinity chromatography, and characterized by SDS-PAGE.
Figure 1(a) was the antibody purification obtained by AKTA, and the second peak represented the target antibody.
Figure 1(b) showed the SDS-PAGE of the purified antibody, compared with the antiserum, there only has one protein band, indicating that the impurity protein of the antiserum has been eluted completely.
2.2. Characterization of AuNPs and labelling with the antibody
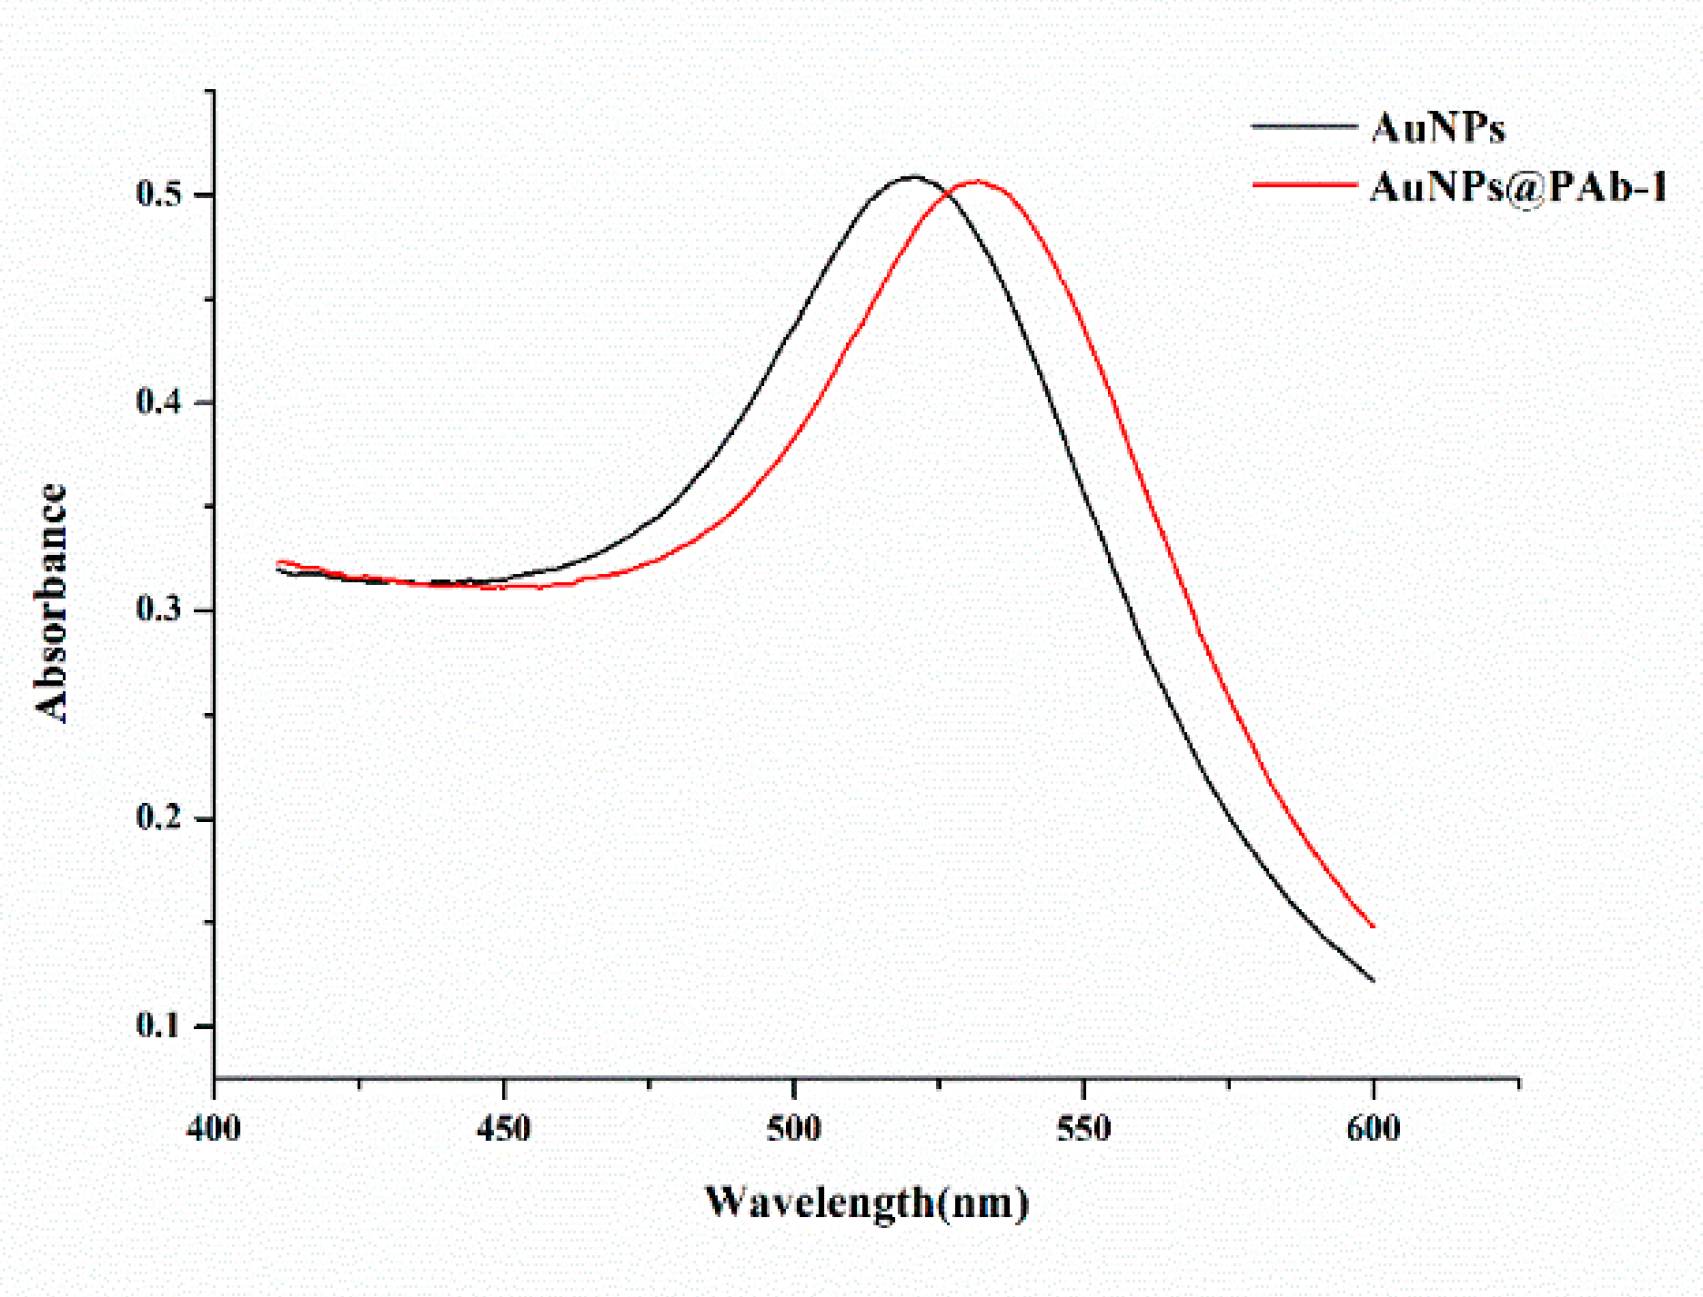
The characterizations of AuNPs and the antibody conjugates were confirmed by UV-vis, as shown in
Figure 2. The prepared AuNPs had an absorption peak at 521 nm and a strong signal under UV. By the conjugation of antibody and AuNPs, the surface plasmon band was red shifted to 532 nm which indicated that AuNPs were successfully coupled with antibody.
2.3. The optimization of AuNPs-labelled antibody
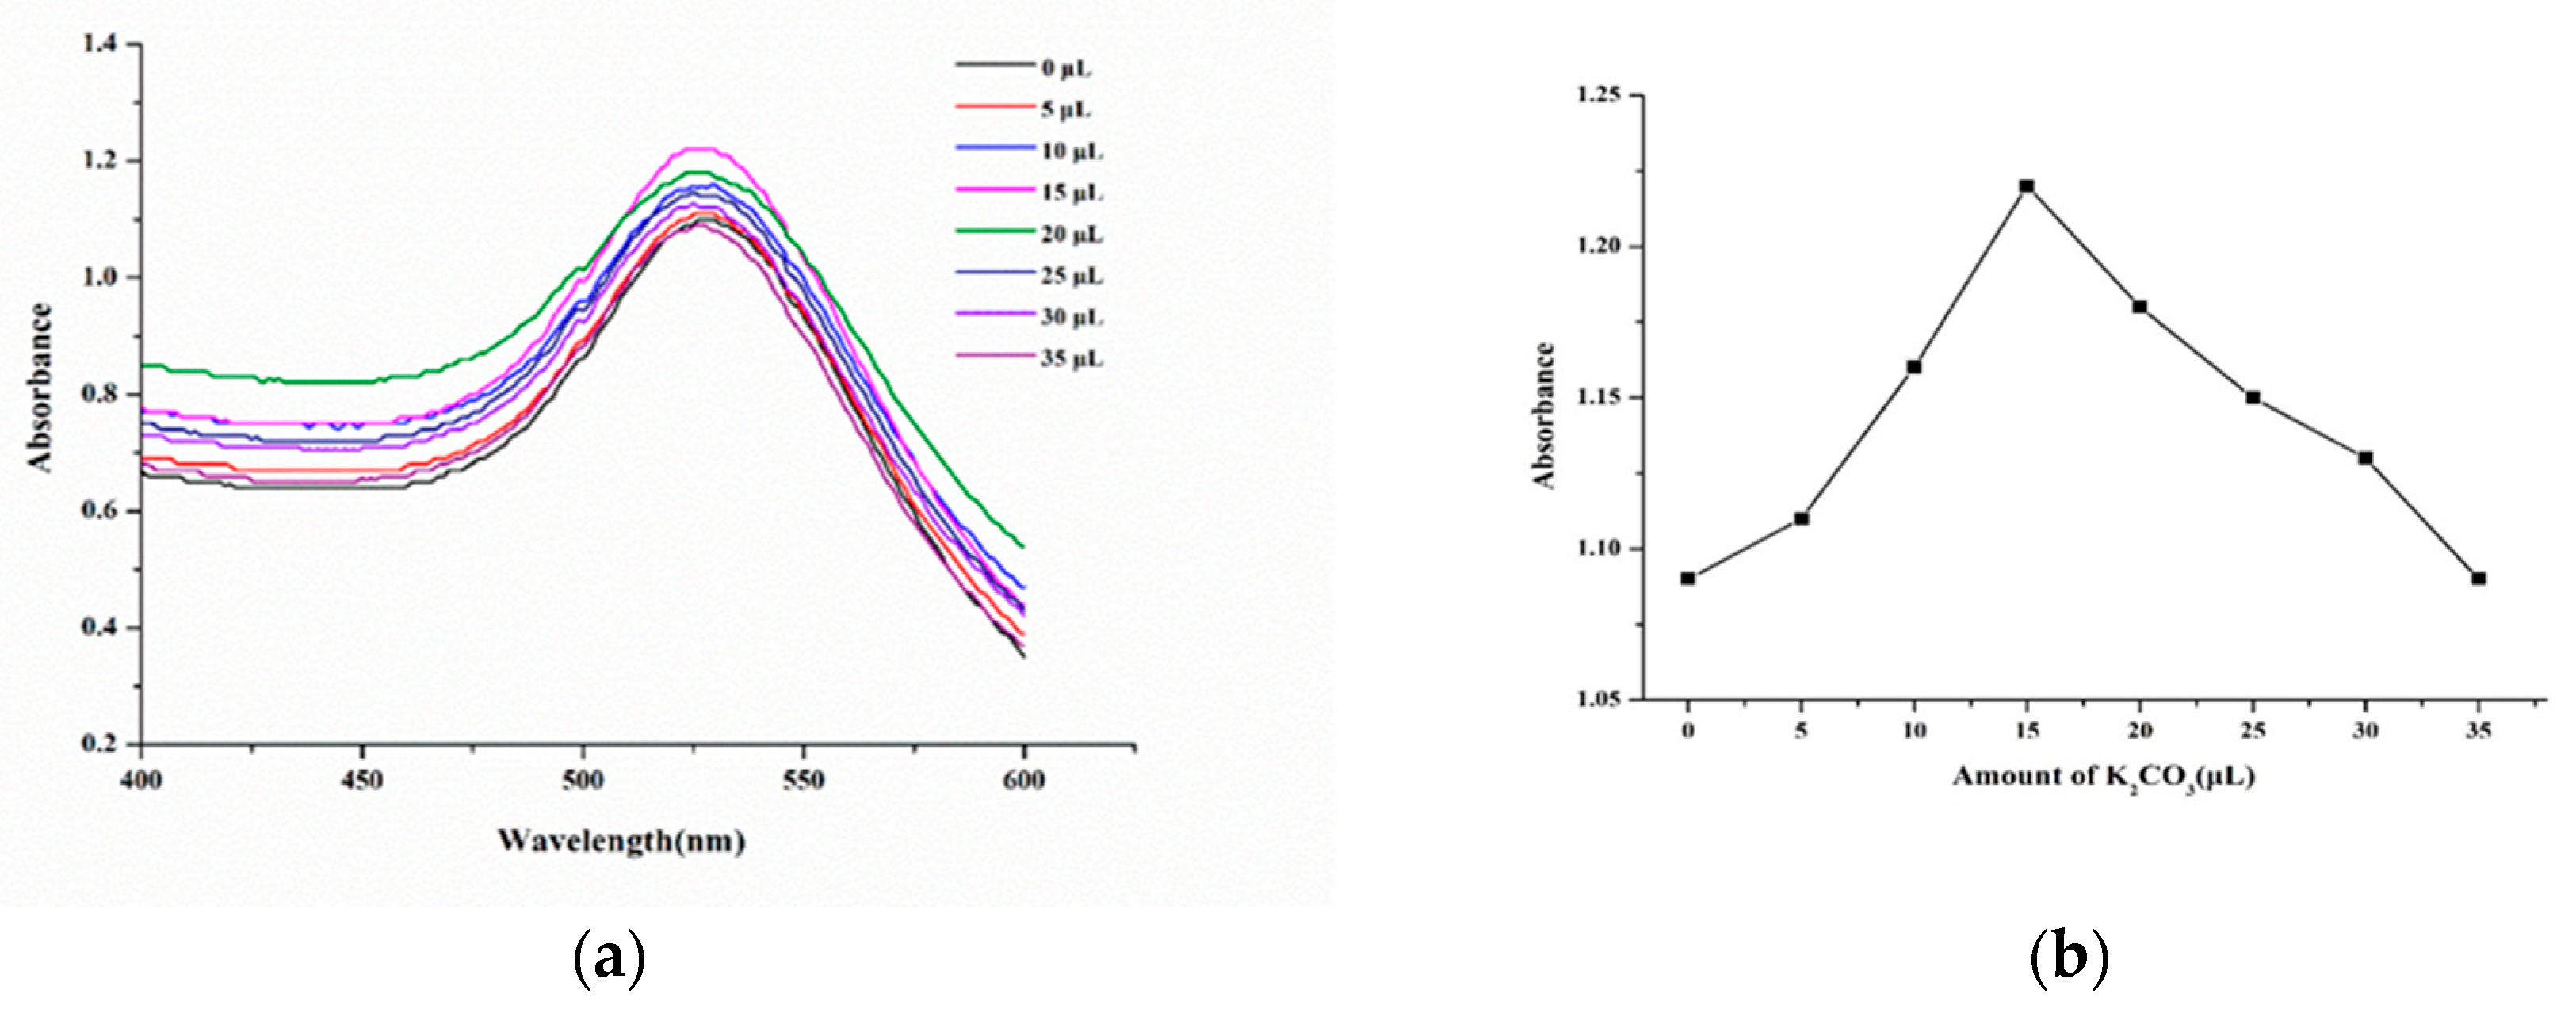
Preparation of AuNPs labeled protein was essentially the process of antibody being adsorbed on the surface of AuNPs. The combination of AuNPs and antibody mainly depended on pH and the amounts of antibody. When the pH of the system was close to the isoelectric point of the antibody, the binding was stable. The pH value of AuNPs solution was adjusted by adding different volumes of K
2CO
3 solution, and excessive antibodies was added for labeling. As shown in
Figure 3, the absorbance value first increased and then decreased with the increase of the amount of K
2CO
3 solution, and when the volume was 15 μL, the absorbance was the largest. Therefore, to obtain the maximum absorption of the AuNPs-labelled antibody, 15 μL of K
2CO
3 solution was selected for adjusting the pH.
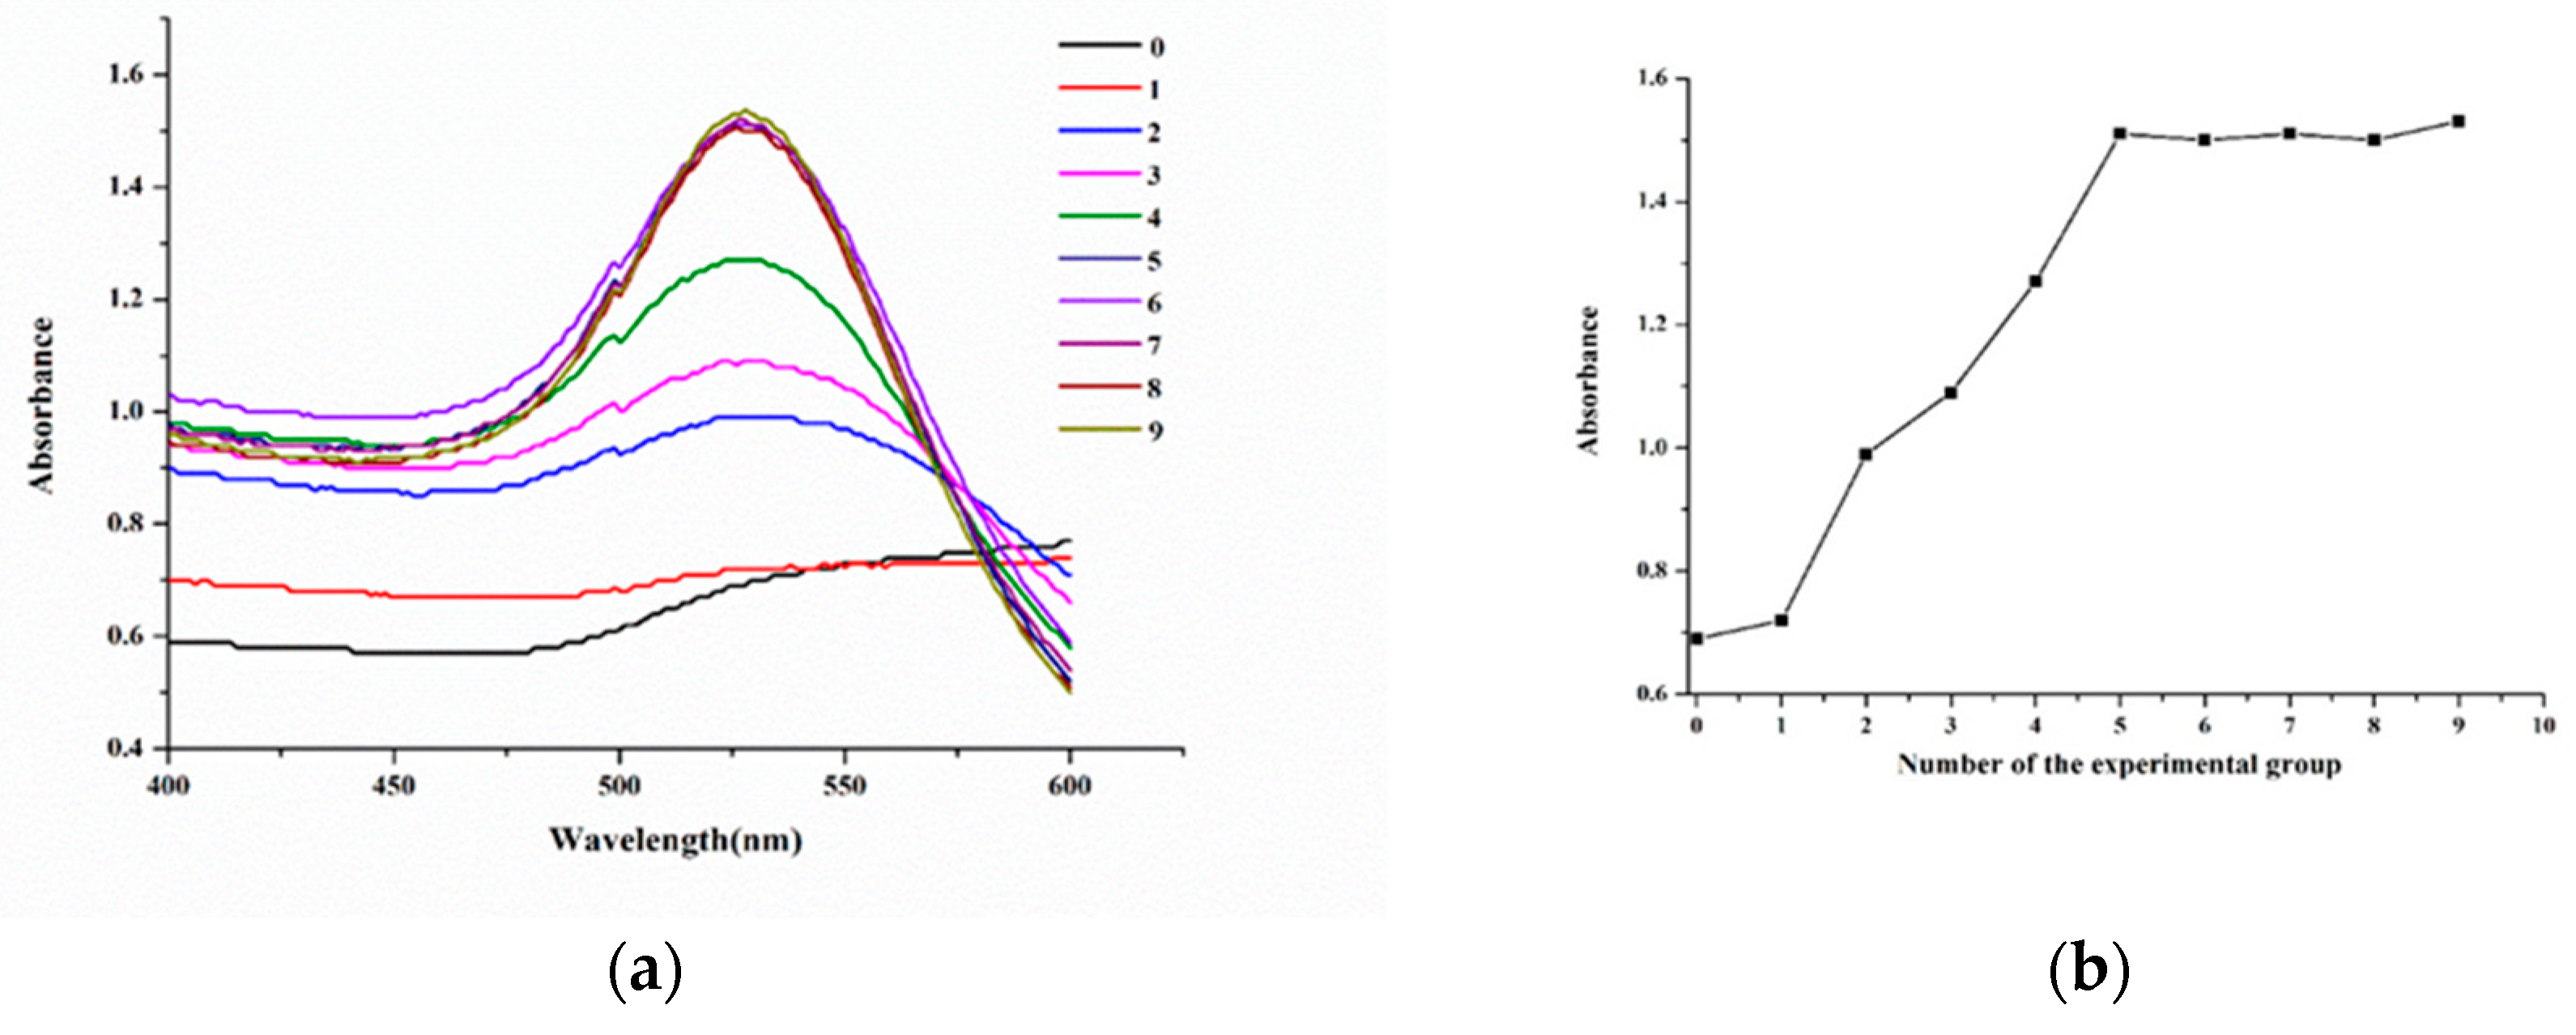
The amount of the antibody for labelling was also a key factor. The lack of antibody would result in surface instability of AuNPs, while the overdose would lead to a waste of antibody. According to
Figure 4, when the dosage of antibody was 9.35 μg, the amount of antibody labeling had reached saturation, 20% more than this dose was the actual amount required for labeling 1 mL AuNPs solution.
2.4. Establishment of AuNPs immunochromatographic method
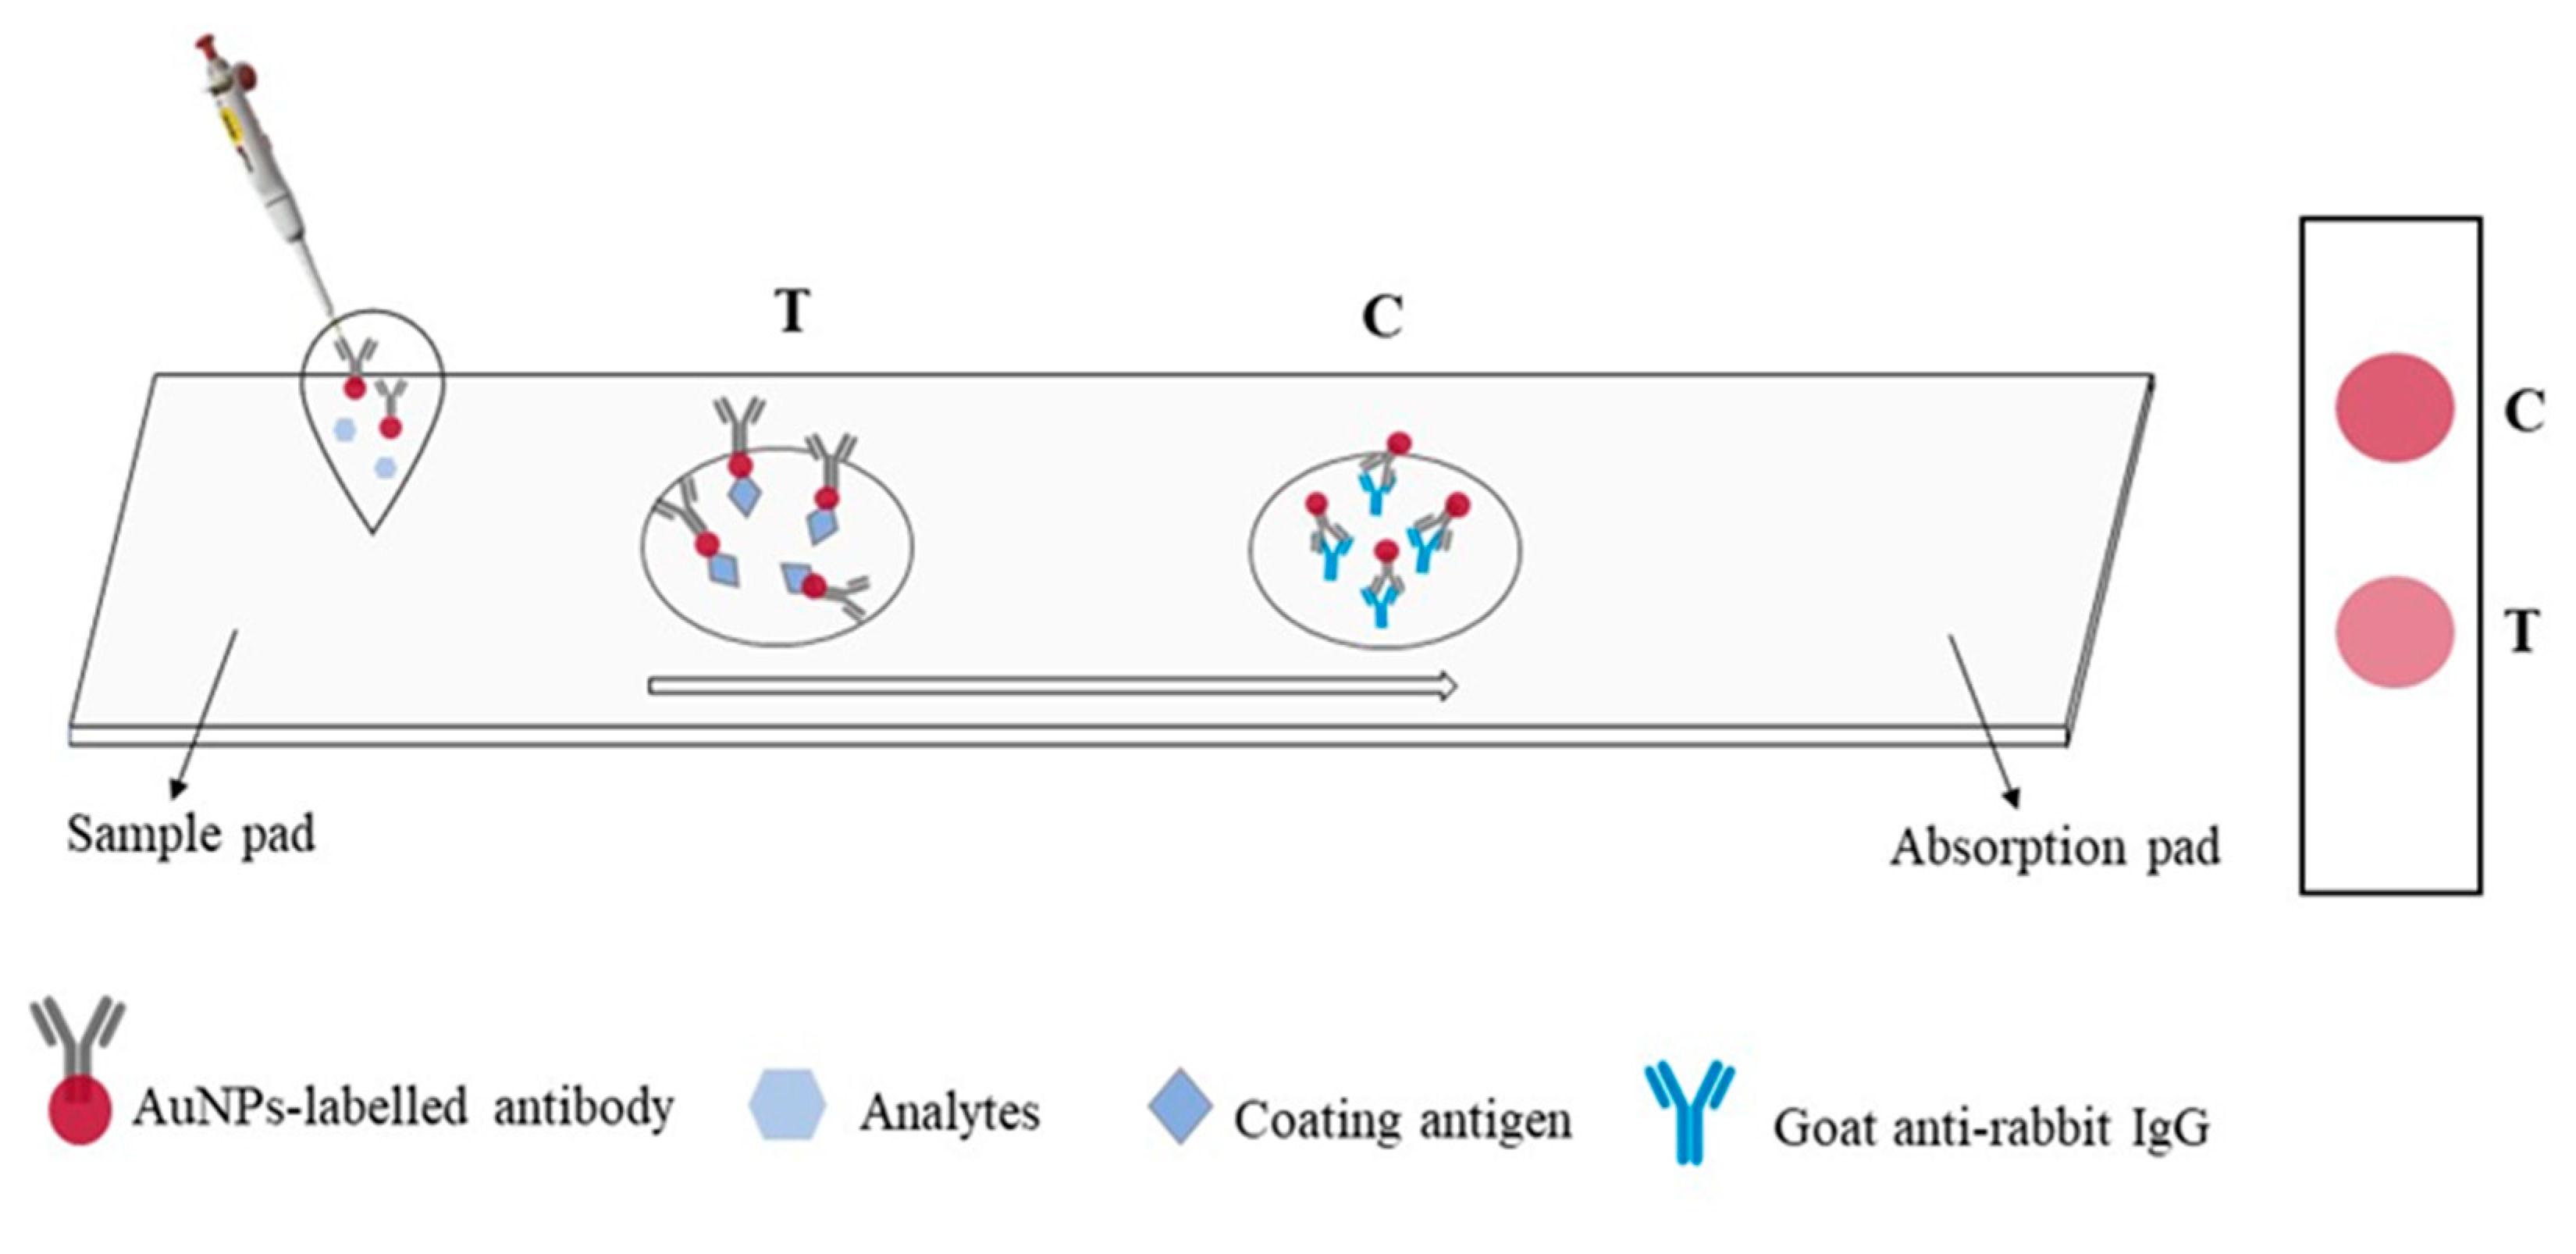
The immunochromatographic strip assay was established based on an antibody–antigen reaction and competitive immunoreactions. The process was shown in
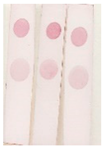
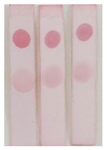
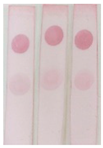
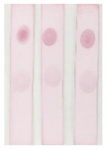
Figure 5. The reaction principle was that if BADGE was absent from the sample, the AuNPs labelled antibody would bind to the coating antigen at the T zone, making the T zone become red, and it was determined to be negative results. When the samples contained BADGE, it would compete with coating antigen on T zone to combine with AuNPs labelled antibody. The higher the concentration of BADGE in the samples, the weaker the color of the T zone. The concentration of coating antigen and AuNPs labelled antibody in the lateral flow immunoassay were optimized. As shown in
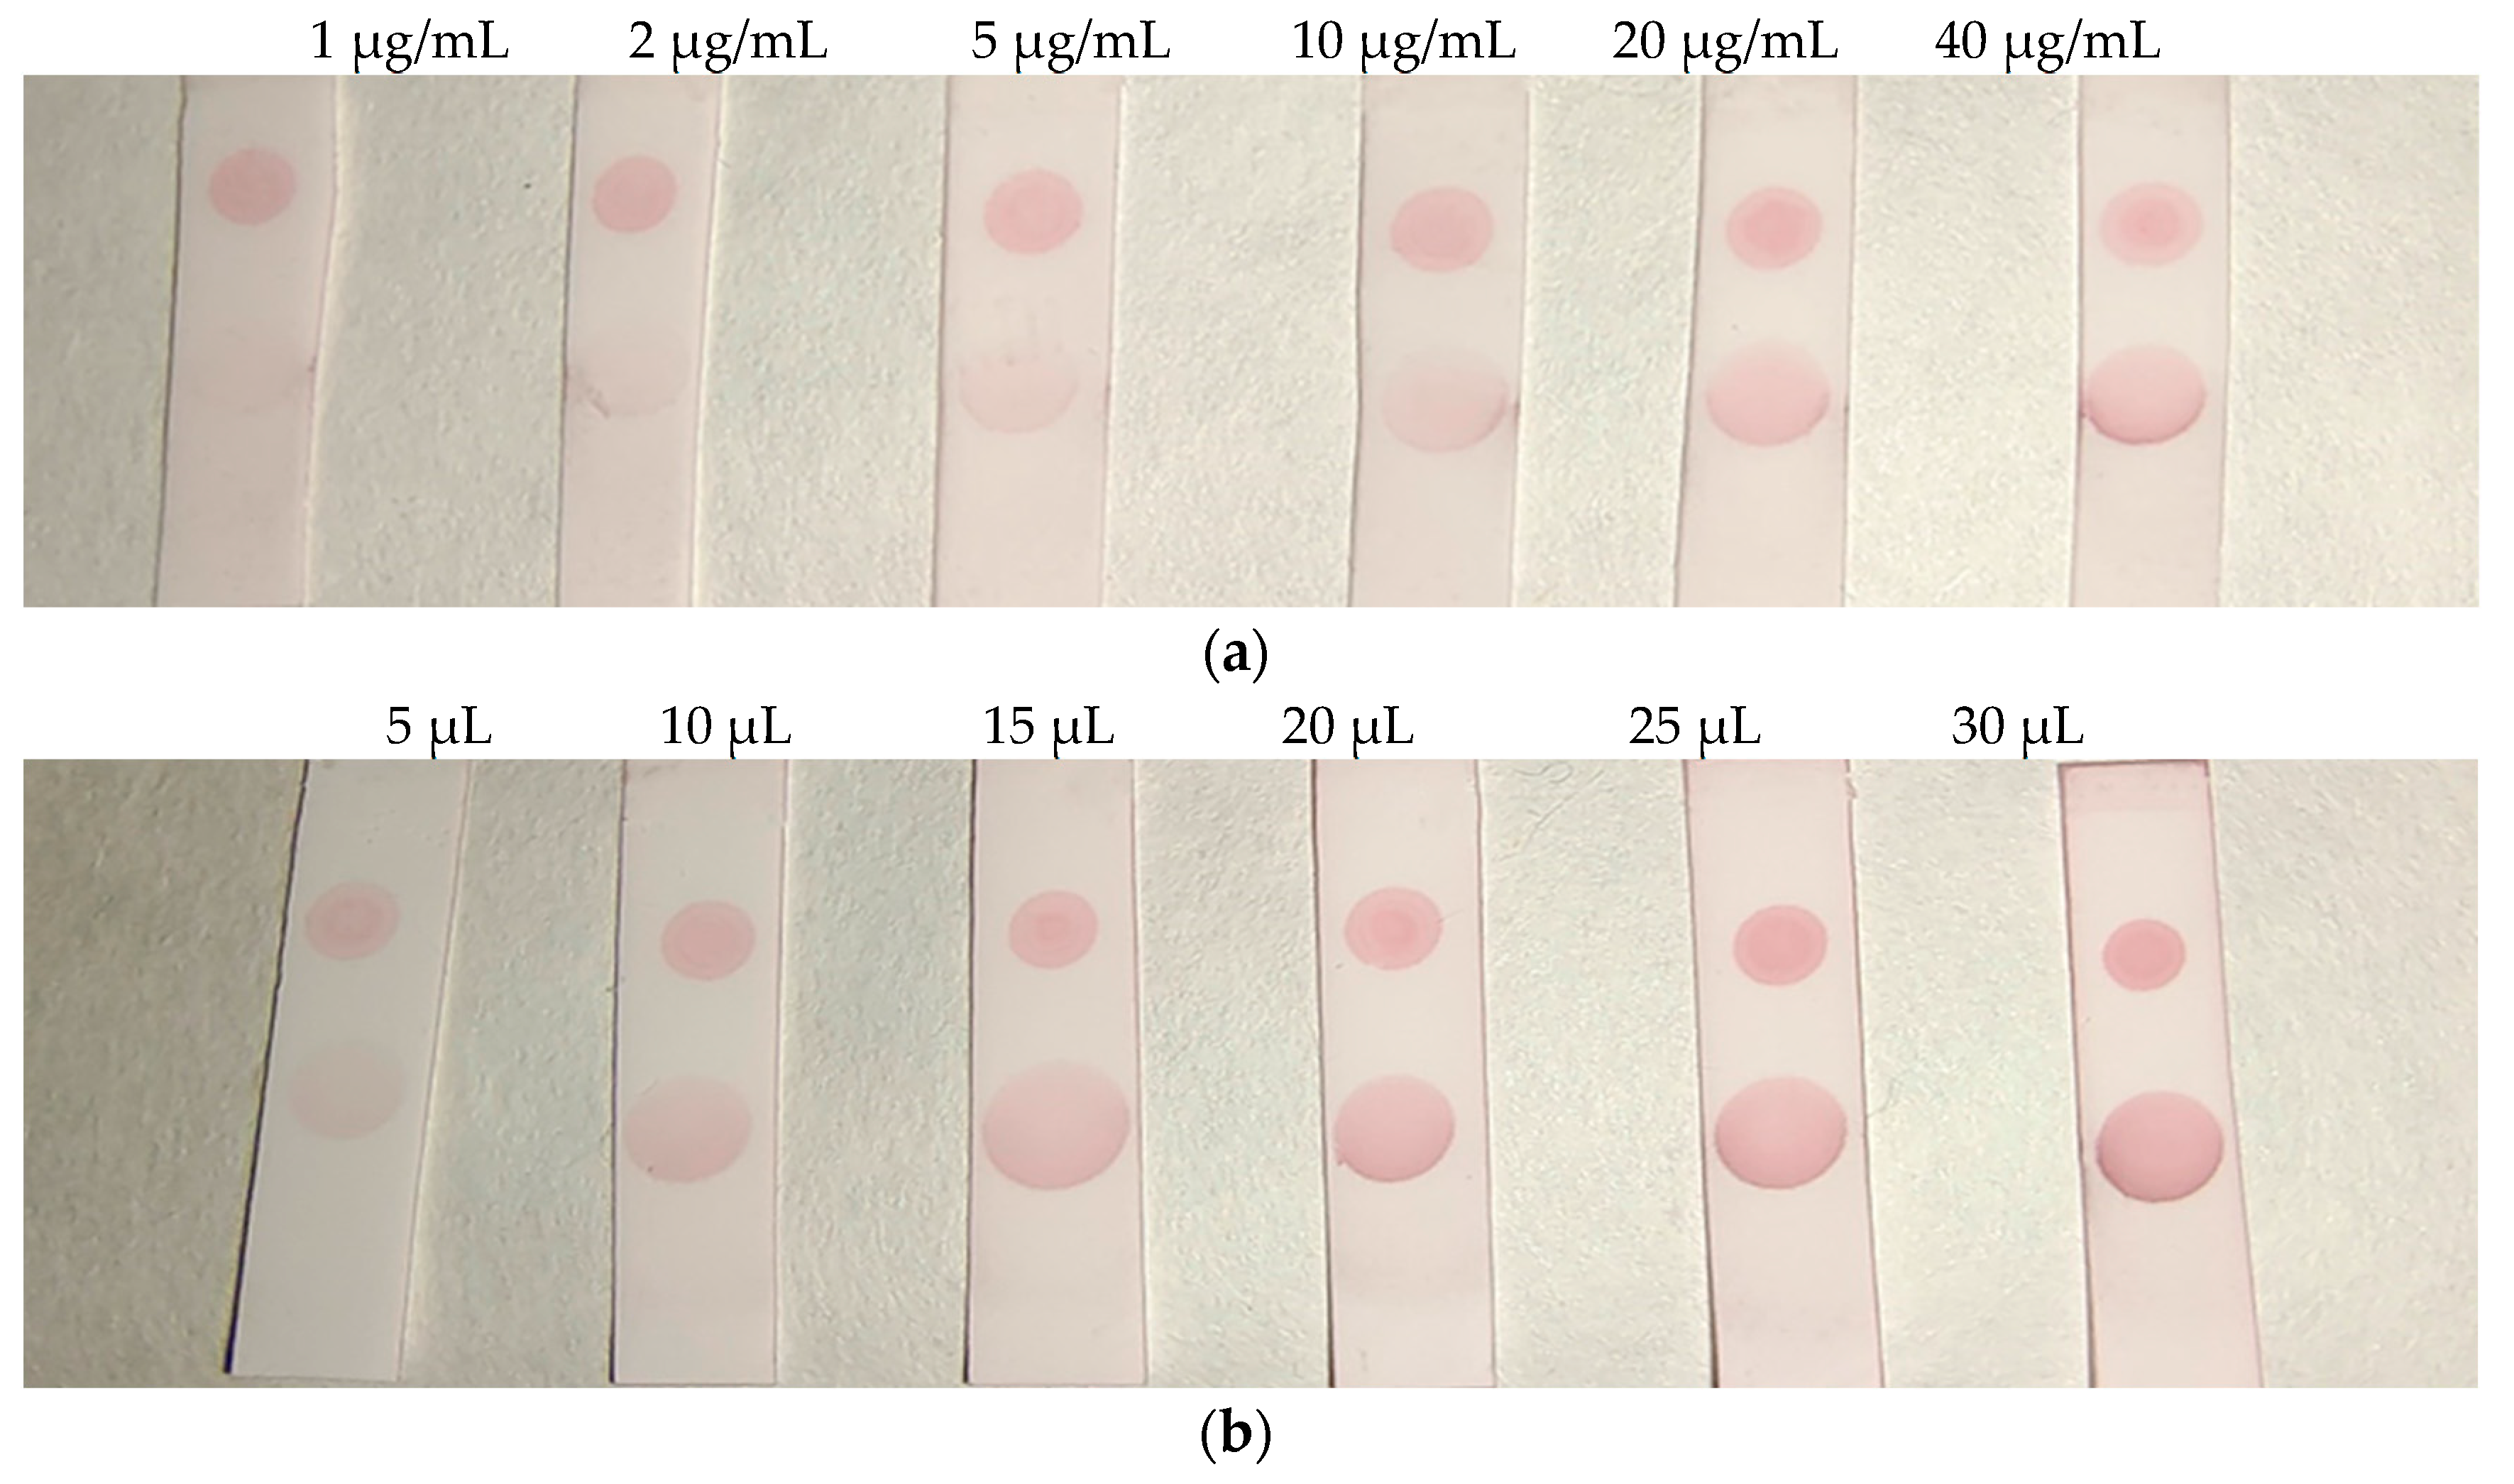
Figure 6 (a), the color of the T zone gradually deepened with the increase of the concentration of the coating antigen. When reaching 20 μg/mL, the color was no longer significantly deepened. Therefore, 20 μg/mL was selected for the next experiment. As shown in
Figure 6 (b), when the volume of AuNPs labelled antibody reached 20 μL, the color did not significantly deepen, so 20 μL was selected as the optimal amount.
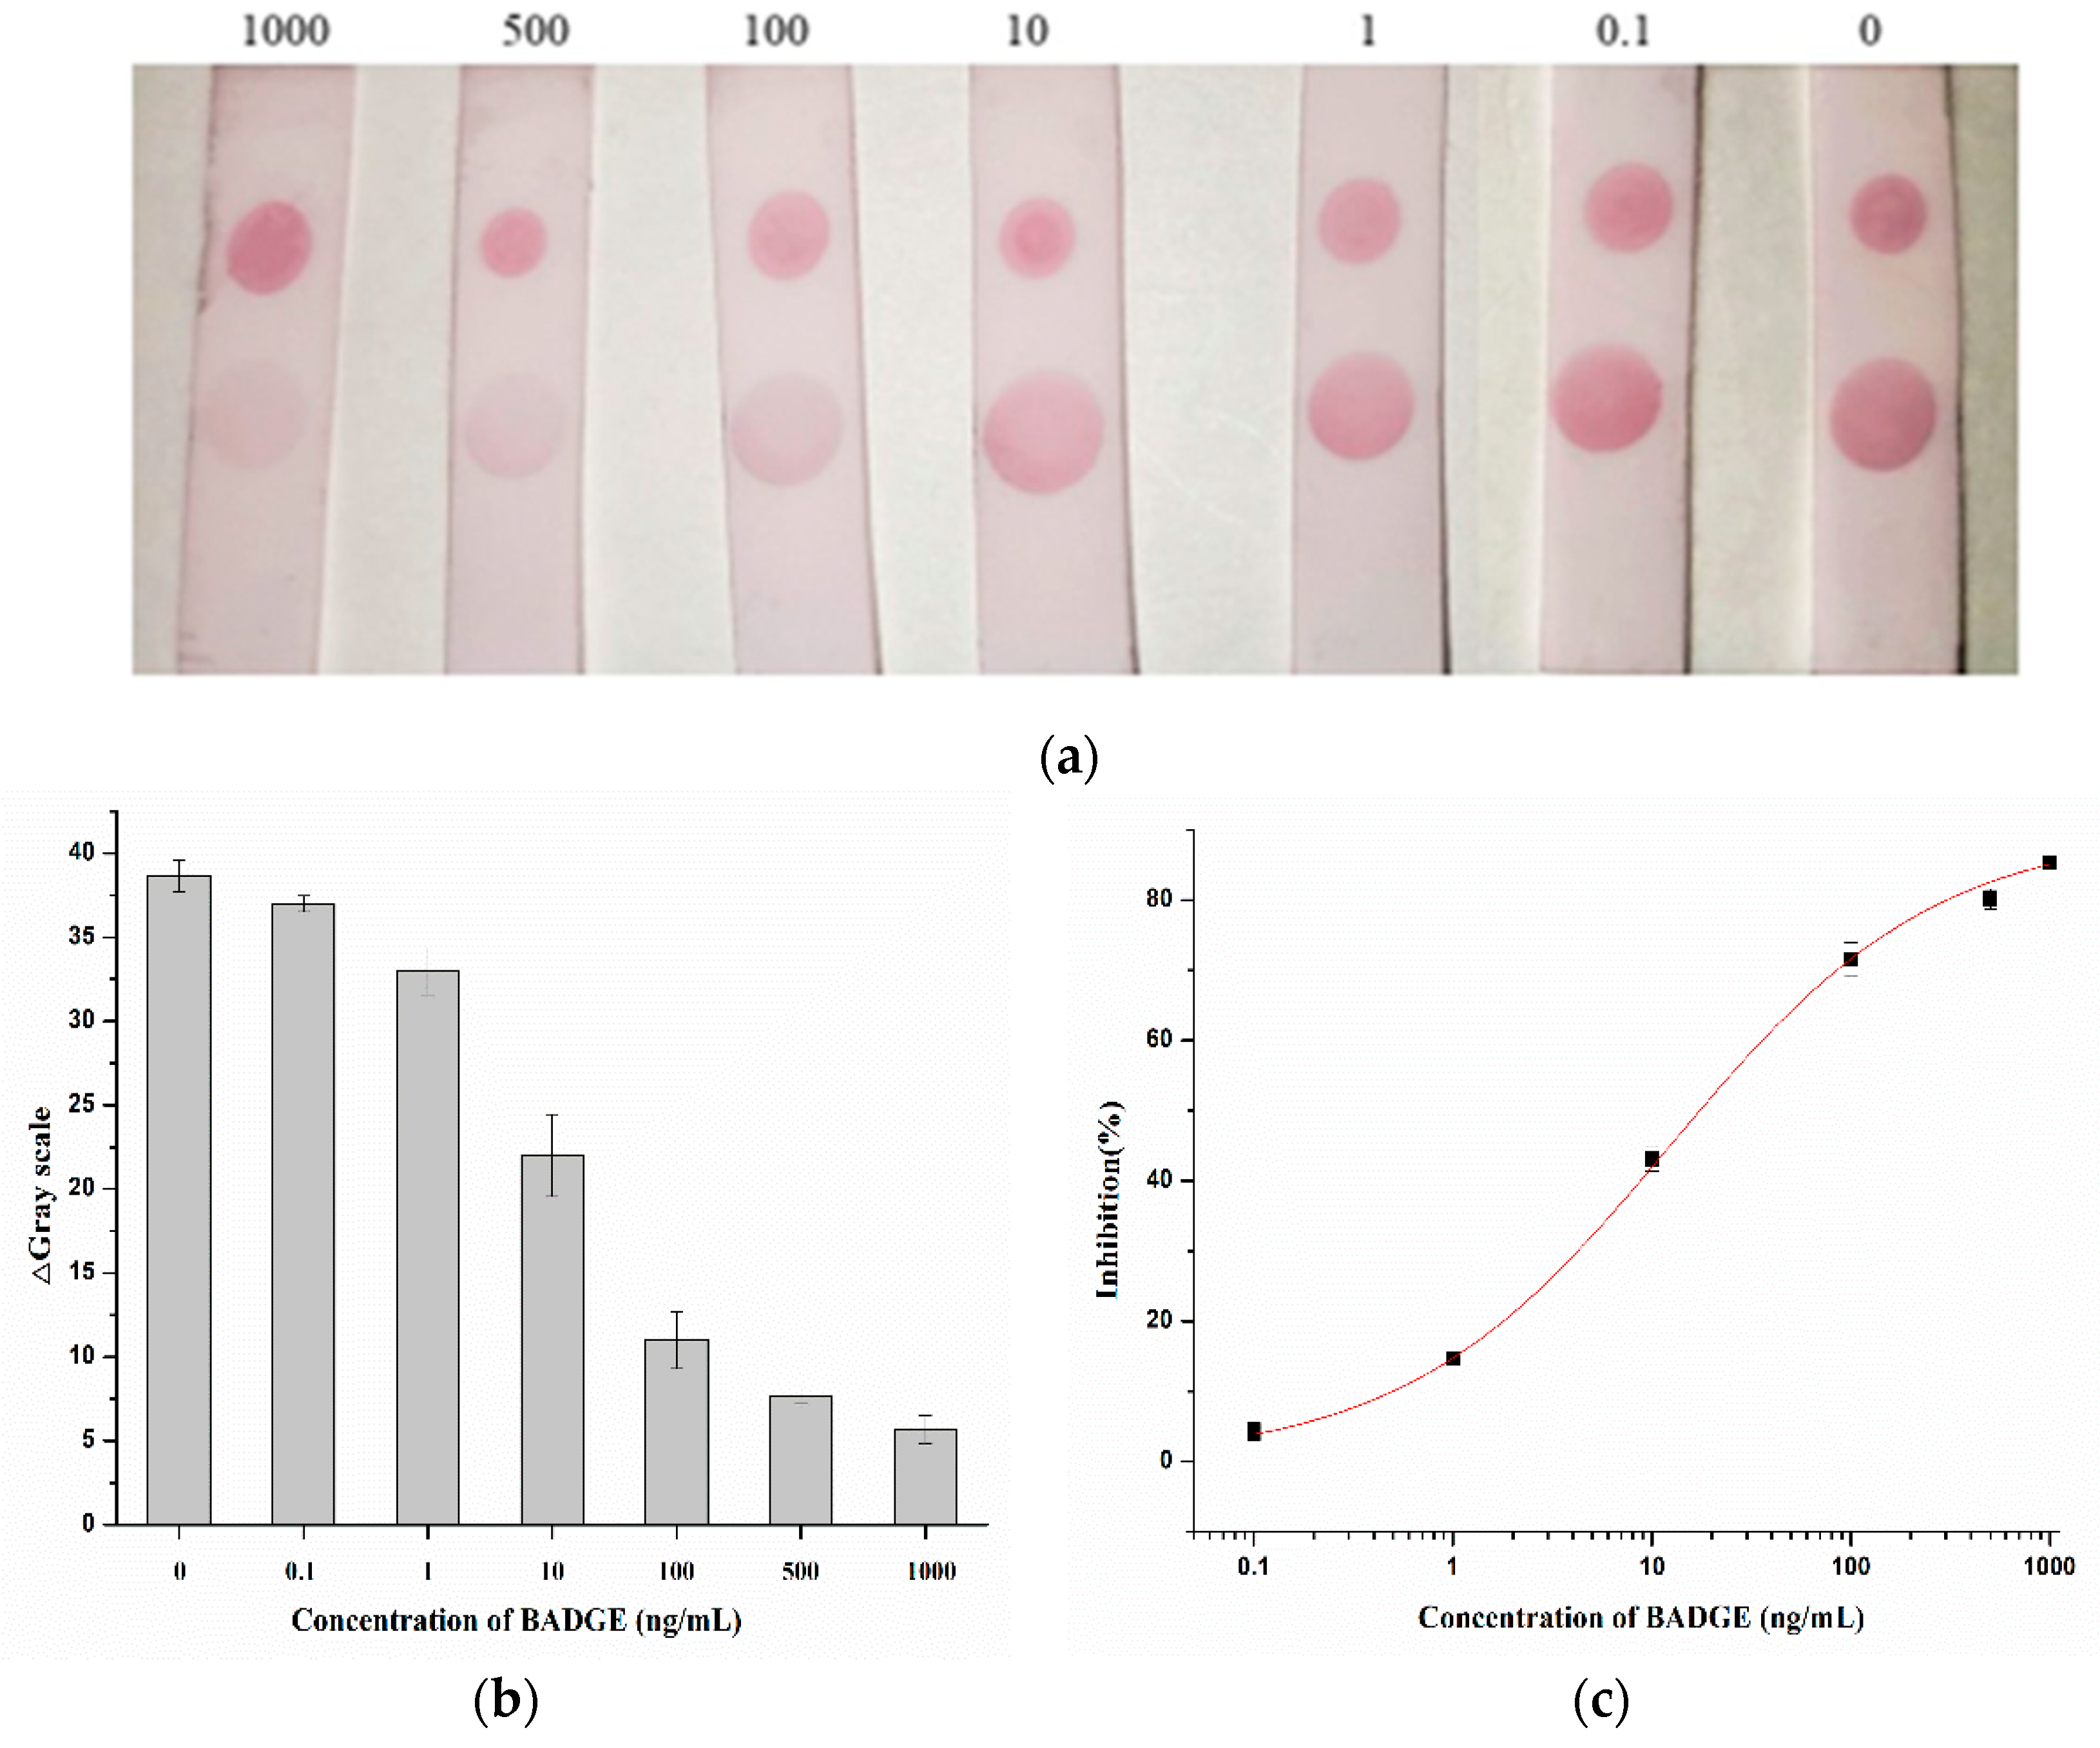
Under the optimal conditions, the AuNPs labelled antibody was mixed with different concentrations of BADGE and added to the strip, as shown in
Figure 7 (a), the higher the concentration of BADGE, the lighter the color of T zone. When the concentration of BADGE reached 1 ng/mL, the color of T zone can be distinguished from the negative sample, so the visual detection limit (vLOD) was 1 ng/mL.
Color intensities were quantified by Adobe Photoshop CC software, the grayscale variation of T zone was shown in
Figure 7 (b) and the standard curve was drawn by calculating inhibition ratio
Figure 7 (c). The calculated limit of detection (cLOD) was 0.97 ng/mL (IC
15, concentration at inhibition rate of 15%), which was in general agreement with the visual results.
2.5. Stability analysis of AuNPs-PAb immunochromatographic strip
The test strips were stored at 4℃ for 1, 3, 5 and 7 days, and the color was observed by immunochromatographic reaction with 1 ng/mL of BADGE standard solution, and the results are shown in
Table 2. There was no significant change in the color of the T region, which indicates that the test strips have good stability.
2.6. Matrix effect
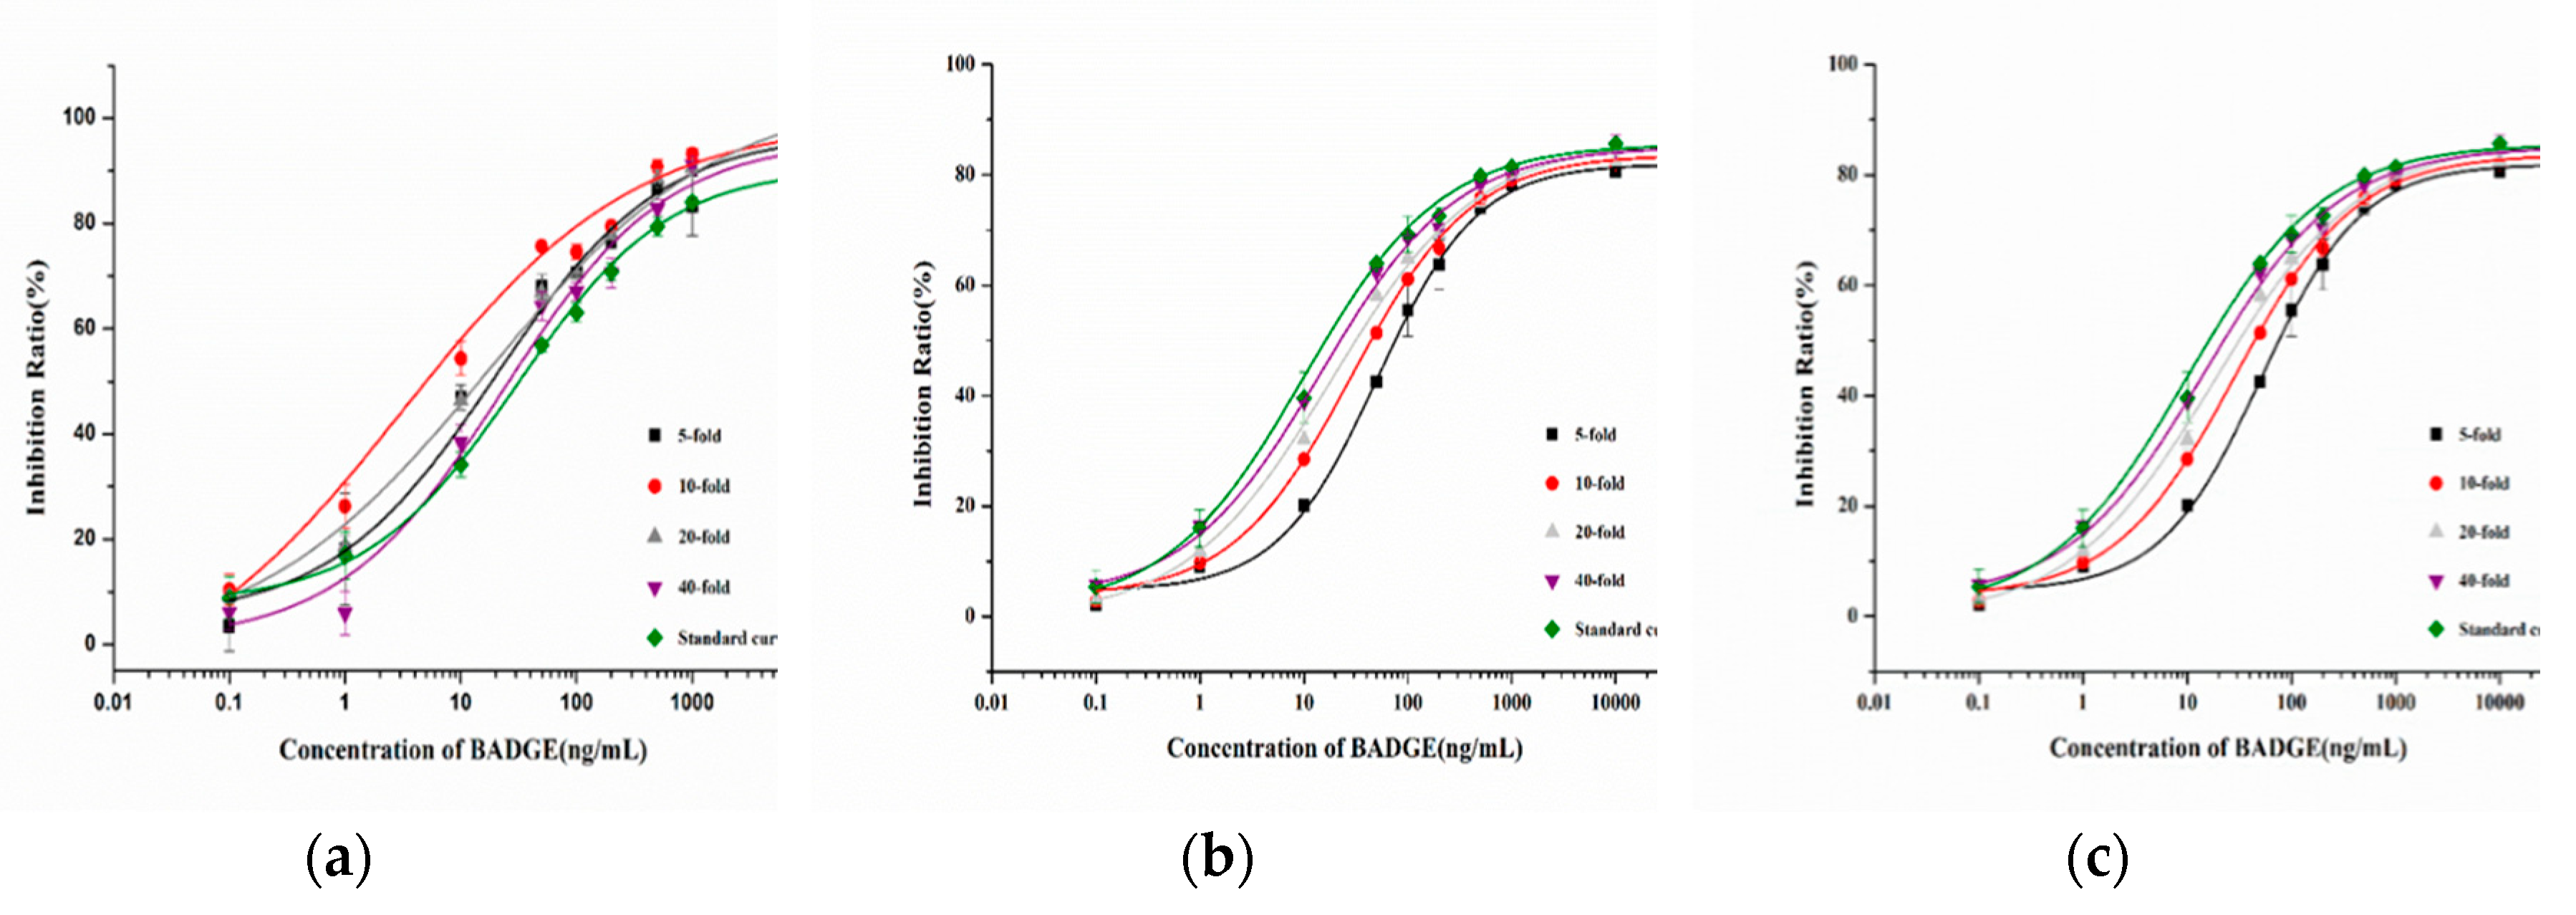
In the analysis of the actual sample, the matrix may interfere with the accuracy of detection. Therefore, in order to eliminate the influence of matrix on the detection performance, the samples were diluted at different multiples (5-fold, 10-fold, 20-fold, 40-fold) and then analyzed by the ic-ELISA. As shown in
Figure 8, the sample curve almost overlapped with the standard curve by 40-fold dilution with 10% methanol-PBS (V/V). Therefore, samples could be diluted 40-fold and analyzed by the immunochromatographic method.
2.7. Recovery Experiments
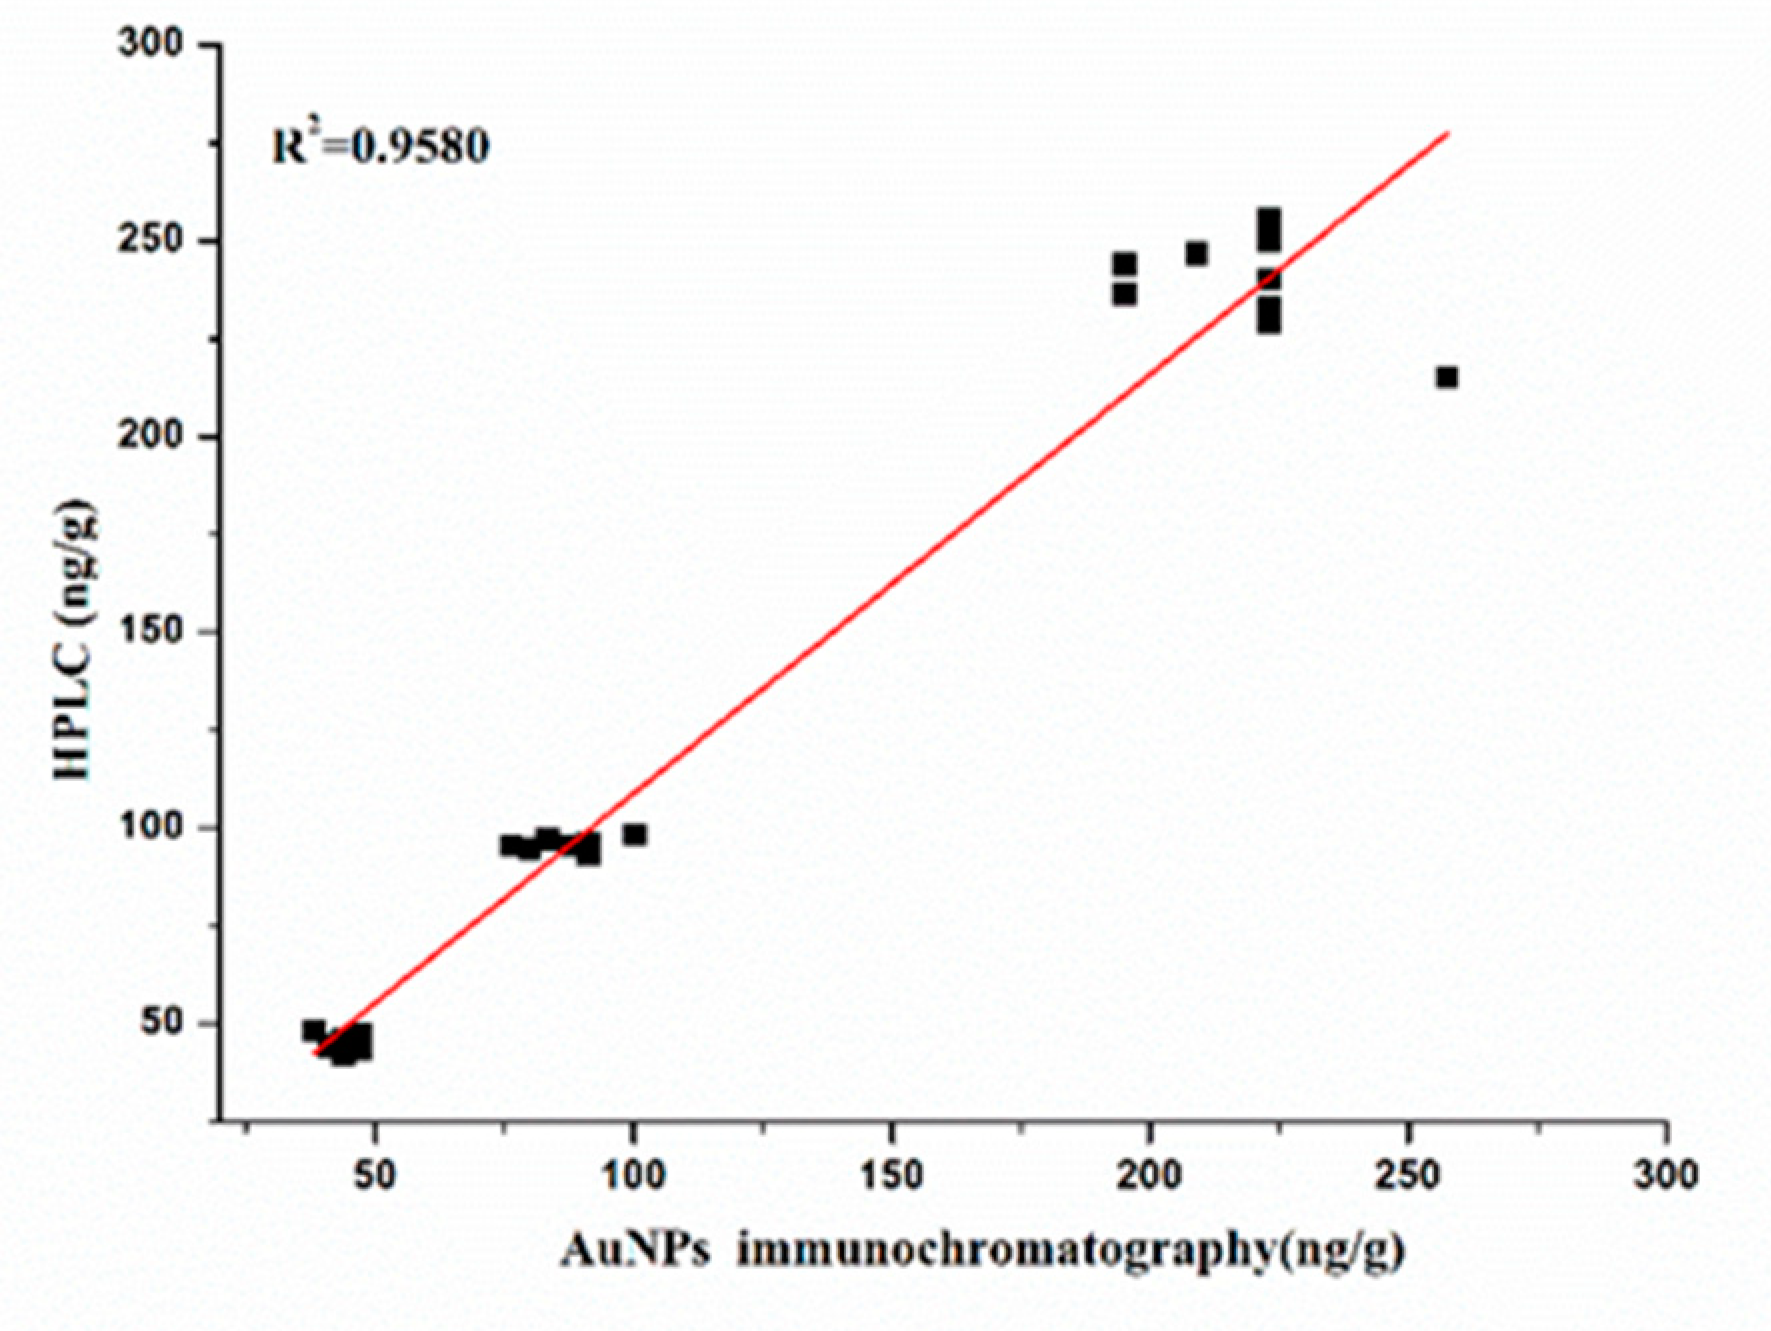
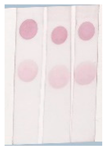
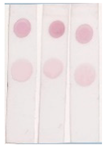
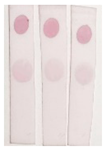
Spiking and recovery tests with BADGE were performed by the immunochromatographic method and HPLC (
Table 3). The recovery rate of BADGE in canned luncheon meat, canned yellow peach and red bull drink samples ranged from 79.86% to 93.81%. These results were basically the same as the HPLC results (
Figure 9, R
2=0.9580), showing that the immunochromatographic method had high accuracy and reliability.
2.8. Sample analysis using the immunochromatographic strip assay
The immunochromatographic strip assay and HPLC were used to detect the concentration of BADGE and its derivatives in different kinds of canned samples to assess the practicability of the established method. Because of BADGE and its derivatives may simultaneously exist in actual samples, we have detected the total amount of BADGE and its derivatives by the proposed immunochromatographic strip. As shown in
Table 4, the total amount of BADGE compounds in samples determined by immunochromatographic strip was consistent with that by HPLC. It is proved that the immunochromatographic strip assay can be used to detect real samples.
3. Discussion
BADGE is used as an additive or starting agent in coatings for cans. It is commonly used to avoid direct contact between food matrix and metals in packaging materials. During the processing, storage and transportation, BADGE is prone to migrate to the food matrix and generate hydrated derivatives or chlorinated derivatives, which can accumulate in the human body through the food chain, causing abnormalities in the endocrine system and nervous system. Anna et al. [
32] studied the toxicity and potential lipid destruction of BADGE in human placental JEG-3 cells, and found that it can interfere with lipid metabolism and alter the cellular lipidome, ultimately causing disease. Instrumental analysis is applied for the detection of BADGE and its derivatives. Gallo et al. [
33] simultaneously determined eight kinds of bisphenol substances in soft drinks by liquid chromatography-fluorescence (LC-FD), including BADGE and BFDGE residues.
Due to the wide polarities of BADGE and its derivatives, conventional liquid chromatography requires complex sample pretreatment to complete the separation, which cannot meet the requirements of rapid detection. The traditional instrumental analysis method cannot realize the simple and rapid analysis of large numbers of samples, and it is difficult to real-time feedback the real migration residual pollution status.
Immunoassay based on antibodies or other biological molecules with recognition function have the advantages of rapid analysis process with simple pretreatments, which can be an effective supplementary method for conventional instrument analysis. In fact, immunoassay has been widely for the analysis of various pollutants in the field of food safety detection because of its reliability, efficiency and cost-saving. It has also been recommended by authoritative testing departments for rapid screening of large quantities of samples. Canned food has the advantages of convenience and nutrition, which is widely accepted and consumed in large quantities. Therefore, the health hazards caused by bisphenol diglycidyl ether compounds in packaging materials cannot be ignored. Based on the requirements of consumers for the safety monitoring of food in daily contact, long-term, multi-frequency, high-throughput sample analysis is needed to draw regular conclusions from a large number of analysis results, and immunoassay methods fully meet the requirements of such research. Guan [
34] developed a fluorescence polarization (FP) assay for simultaneous monitoring BPA, BPF, BADGE, and BFDGE in canned tuna, and the detection limits were 0.35, 0.08, 0.10 and 0.49 mg/L, respectively. The results are not sensitive for the detection of BADGE, which may be the fact that the receptor cannot completely replace the biological antibody to achieve high affinity recognition to the target object. Due to the coexistence of BADGE and its derivatives, we developed broad-spectrum polyclonal antibodies that can recognize BADGE and its derivatives. In this study, a rapid immunochromatography method based on gold nanoparticles was established to detect BADGE and its hydrolyzed and chlorinated derivatives in canned food. The assay can be finished in 15 min and the visualization of results are processed by Adobe Photoshop CC software to achieve quantitative analysis and the detection limit (IC
15) is 0.97ng/mL. It can meet the requirements of real-time screening and detection of large quantities of samples.
4. Materials and Methods
4.1. Chemicals and Reagents
HAuCl4·4H2O, trisodium citrate dihydrate (C6H5Na3O7), sodium chloride (NaCl), potassium carbonate (K2CO3), disodium hydrogen phosphate dodecahydrate (Na2HPO4·12H2O), sodium phosphate dibasic dihydrate (Na2HPO4·2H2O), H2SO4, potassium dichromate (K2Cr2O7), Tween-20, ethyl acetate, hexane, acetonitrile, methanol were purchased from Sinopharm Chemical Reagent (Shanghai, China). The chemical standards of BADGE, BADGE·H2O, BADGE·HCl and BADGE·HCl·H2O were purchased from Macklin (Shanghai, China). Bovine serum albumin (BSA), non-fat milk powder and goat anti-rabbit IgG-HRP were purchased from Sangon Biotech (Shanghai, China). The canned luncheon meat, canned yellow peach and red bull drinks were purchased from local supermarket (Zhenjiang, China).
4.2. Instruments
HH-A magnetic stirrer was purchased from Zhongda instrument factory (Changzhou, China), UV-1801 ultra-violet spectrophotometer was purchased from Ruili Company (Beijing, China). HPLC was performed on a LC-20AD module (Shimadzu, Japan) coupled to ultraviolet detector.
4.3. Screening of broad-spectrum antibodies
Our research group has preliminarily screened four antisera which have certain recognition ability to BADGE and its derivatives in the preliminary experiment. The cross reactivity of four antisera to BADGE derivatives was investigated to determine the broad-spectrum recognition specificity of antisera. The cross-reactivity (%) was calculated as follows:
4.4. Preparation of AuNPs
The AuNPs were produced by the sodium citrate method. Briefly, 100 mL 0.01 % HAuCl4 solution was heated and kept boiling. Then, 4 mL of 1% sodium citrate was quickly added under stirring, the solution was heated and stirred for 5~10 min until the color was stable. The obtained AuNPs solution was cooled to room temperature and stored at 4°C.
4.5. Preparation of AuNPs-labelled antibody
4.5.1. Optimization of pH
AuNPs with different pH were adjusted by adding different volumes of K2CO3 solution. Excess amounts of antibodies were added under each condition and stood for 10 min at room temperature, then 10% NaCl was added and vortex mixing. After standing for 10 min, the color was observed and scanned by UV-vis spectroscopy.
4.5.2. Optimization of the amounts of antibody
10 tubes of AuNPs solution were taken in glass tube, the pH were adjusted with 0.2M K2CO3 solution. According to
Table 5, different amounts of antibody was added to AuNPs solution and stood for 10 min at room temperature, then 10% NaCl was added and vortex mixing. After standing for 10 min, the color was observed and scanned by UV-vis spectroscopy.
10 mL AuNPs with the optimal pH were adjusted by 0.2M K2CO3 solution, the antibody was added to the following solution, and then mixed. The mixture reacted at 4℃ for 3 h, and then 10% BSA was added to block the excess binding sites on AuNPs for 1 h. After the reaction, the solution was centrifuged at 12000 rpm for 20 min, the precipitation was re-dissolved in 1 mL PB solution containing Tween-20 and BSA and stored at 4℃ for use.
4.6. Establishment of AuNPs immunochromatographic method
In this work, NCM film with smooth backing was used to prepare immunochromatographic strip, including sample zone, test zone (T), control zone (C) and absorbent zone. The NCM films were cut to certain size and the test zone was coated with coating antigen, the control zone was coated with goat anti-rabbit IgG. Then, the strip was dried at room temperature and stored at 4℃. A certain volume of AuNPs labelled antibody was mixed with 100 μL BADGE standard solution at different concentrations and incubated for 10 min. The mixture was then added to the sample zone, after 15 minutes, the liquid flows completely through T and C zones. The visualization results were recorded by taking photos with smart phone, and the results of T zone were processed by Adobe Photoshop CC software to realize quantitative analysis.
G: grayscale variation without BADGE; G1: grayscale variation of BADGE with different concentration.
4.7. Sample analysis
The canned luncheon meat, canned yellow peach and red bull drinks were selected for sample analysis, which obtained from a local supermarket of Zhenjiang. Canned luncheon meat samples were treated as follows: 2.0 g of samples were homogenized with 10 mL hexane and treated with ultrasonic assisted extraction for 30 min. Then the mixture centrifuged at 4500 rpm for 10 min. The supernatant was extracted with 5 mL acetonitrile twice. The acetonitrile extracts were evaporated to dryness at 40°C under nitrogen. After that, the residues were re-dissolved in 2 mL methanol. Canned yellow peach samples were treated as this method: the sample of 2 g was weighed and 5 mL of ethyl acetate was added as extraction solvent. The mixture was shaken for 20 min in the shaker and 30 min in an ultrasonic bath. Then the mixture centrifuged at 4500 rpm for 15 min. The supernatant was evaporated to dryness under nitrogen stream. Then, the extract was re-dissolved in 2 mL methanol. 5 mL red bull drinks were centrifuged at 4500 rpm for 10 min, the supernatant was filtered by 0.22 μm membrane before analysis. The samples were separately spiked with BADGE at different concentrations (2, 10, 20 ng/mL) to evaluate the accuracy of the AuNPs immunochromatographic method, and the results were confirmed by HPLC simultaneously.
The Hypersil GOLD C18 column (4.6 mm×250 mm, 5 μm) was employed for chromatographic separation in HPLC analysis. The mobile phase was composed of 40% ultrapure water and 60% acetonitrile. The eluent flow rate was 0.5 mL/min, the injection volume was 10 µL and the temperature of the column oven was maintained at 30°C.
5. Conclusions
To summarize, in this study, we screened a broad-spectrum polyclonal antibody that can recognize BADGE and its derivatives including BADGE·HCl, BADGE·H2O and BADGE·HCl·H2O. A lateral flow immunochromatographic assay for detecting BADGE and its derivatives in canned food was developed by coupling the antibody with AuNPs, and the visualization results were processed by Adobe Photoshop CC software to achieve quantitative analysis. The method was applied to the actual sample detection and compared with the results of HPLC, it was proved that the method was reliable and accurate. In addition, the immunochromatographic strip assay could meet the requirements of rapid screening of large quantities of samples in the market because of its advantages of simple, rapid operation, cost-effectiveness and non-instrumental.
Author Contributions
Q.Y. and C.Z. constructed the project; C.Y., Q.Y. and C.Z. designed the experiments; C.Y., J.H. and Y.Z. performed the experiments; C.Y., C.Z. and W.W. analyzed the data; C.Y. wrote the paper. All authors have read and agreed to the published version of the manuscript.
Funding
This work was financially supported by the Special Foundation for Distinguished Taishan Scholar of Shandong Province (tstp20230630),National Key Research and Development Program of China [No. 2022YFF1102200], National Natural Science Foundation of China [No. U22A20541], the High-level Talent Start-up Fund from Qingdao Agricultural University, Science & Technology Specific Projects in Agricultural High-tech Industrial Demonstration Area of the Yellow River Delta (2022SZX26).
Institutional Review Board Statement
Not applicable.
Informed Consent Statement
Not applicable.
Data Availability Statement
Not applicable.
Conflicts of Interest
The authors declare no conflict of interest.
Sample Availability
Samples of the compounds are available from the authors.
References
- Cabado, A. G.; Aldea, S.; Porro, C.; et al. Migration of BADGE (bisphenol A diglycidyl-ether) and BFDGE (bisphenol F diglycidyl-ether) in canned seafood [J]. Food and Chemical Toxicology, 2008, 46(5): 1674-80. [CrossRef]
- García, R. S.; Losada, P. P.; Lamela, C. P. Determination of Compounds from Epoxy Resins in Food Simulants by HPLC-Fluorescence [J]. Chromatographia, 2003, 58(5-6): 337-342. [CrossRef]
- Jordakova, I.; Dobias, J.; Voldrich, M.; et al. Determination of bisphenol A, bisphenol F, bisphenol A diglycidyl ether and bisphenol F diglycidyl ether migrated from food cans using Gas Chromatography-Mass Spectrometry [J]. Czech Journal of Food Sciences, 2003, 21(3): 85-90. [CrossRef]
- Namba, K. S. Selective synthesis of bisphenol F catalyzed by microporous H-beta zeolite [J]. Applied Catalysis A: General, 2005,. [CrossRef]
- Leepipatpiboon, N.; Sae-Khow, O.; Jayanta, S. Simultaneous determination of bisphenol-A-diglycidyl ether, bisphenol-F-diglycidyl ether, and their derivatives in oil-in-water and aqueous-based canned foods by high-performance liquid chromatography with fluorescence detection [J]. Journal of Chromatography A, 2005, 1073(1-2): 331-339. [CrossRef]
- Bolt, H. M.; Stewart, J. D. Highlight report: the bisphenol A controversy [J]. Archives of Toxicology, 2011, 85(12): 1491-1492. [CrossRef]
- Kang, J. H.; Kondo, F. Bisphenol A in the Surface Water and Freshwater Snail Collected from Rivers Around a Secure Landfill [J]. Bulletin of Environmental Contamination and Toxicology, 2006, 76(1): 113-118. [CrossRef]
- García, R. S.; Losada, P. P. Determination of bisphenol A diglycidyl ether and its hydrolysis and chlorohydroxy derivatives by liquid chromatography-mass spectrometry [J]. Journal of Chromatography A, 2004, 1032(1-2): 37-43. [CrossRef]
- Le, H. H.; Carlson, E. M.; Chua, J. P.; et al. Bisphenol A is released from polycarbonate drinking bottles and mimics the neurotoxic actions of estrogen in developing cerebellar neurons [J]. Toxicology Letters, 2008, 176(2): 149-156. [CrossRef]
- Poole, A.; Van, H. P.; Weideli, H.; et al. Review of the toxicology, human exposure and safety assessment for bisphenol A diglycidylether (BADGE) [J]. Food Additives & Contaminants, 2004, 21(9): 905-919. [CrossRef]
- Satoh, K.; Ohyama, K.; Aoki, N.; et al. Study on anti-androgenic effects of bisphenol a diglycidyl ether (BADGE), bisphenol F diglycidyl ether (BFDGE) and their derivatives using cells stably transfected with human androgen receptor, AR-EcoScreen [J]. Food Chem Toxicol, 2004, 42(6): 983-993. [CrossRef]
- Ramilo, G.; Valverde, I.; Lago, J.; et al. Cytotoxic effects of BADGE (bisphenol A diglycidyl ether) and BFDGE (bisphenol F diglycidyl ether) on Caco-2 cells in vitro [J]. Archives of Toxicology, 2006, 80(11): 748-755. [CrossRef]
- Gallart-Ayala, H.; Moyano, E.; Galceran, M. T. Fast liquid chromatography-tandem mass spectrometry for the analysis of bisphenol A-diglycidyl ether, bisphenol F-diglycidyl ether and their derivatives in canned food and beverages [J]. J Chromatogr A, 2011, 1218(12): 1603-1610. [CrossRef]
- Fattore, M.; Russo, G.; Barbato, F.; et al. Monitoring of bisphenols in canned tuna from Italian markets [J]. Food Chem Toxicol, 2015, 83: 68-75. [CrossRef]
- European Commission Regulation (EC) No. 1895/2005. The restriction of use of certain epoxy derivatives in materials and articles intended to come into contact with food [J]. Official Journal of the European Union, 2005, L 302/28: 28-32.
- Poustková, I.; Dobiáš, J.; Steiner, I.; et al. Stability of bisphenol A diglycidyl ether and bisphenol F diglycidyl ether in water-based food simulants [J]. European Food Research and Technology, 2004, 219(5): 534-539. [CrossRef]
- Alabi, A.; Caballero-Casero, N.; Rubio, S. Quick and simple sample treatment for multiresidue analysis of bisphenols, bisphenol diglycidyl ethers and their derivatives in canned food prior to liquid chromatography and fluorescence detection [J]. J Chromatogr A, 2014, 1336: 23-33. [CrossRef]
- Fischnaller, M.; Bakry, R.; Bonn, G. K. A simple method for the enrichment of bisphenols using boron nitride [J]. Food Chem, 2016, 194: 149-155. [CrossRef]
- Guo, M.; He, M.; Zhong, J.; et al. High-performance liquid chromatography (HPLC)-fluorescence method for determination of bisphenol A diglycidyl ether (BADGE) and its derivatives in canned foods [J]. Sci Total Environ, 2020, 710: 134975. [CrossRef]
- Miguez, J.; Herrero, C.; Quintas, I.; et al. A LC-MS/MS method for the determination of BADGE-related and BFDGE-related compounds in canned fish food samples based on the formation of [M + NH4](+) aducts [J]. Food Chemistry, 2012, 135(3): 1310-1315. [CrossRef]
- Lane, R. F.; Adams, C. D.; Randtke, S. J.; et al. Bisphenol diglycidyl ethers and bisphenol A and their hydrolysis in drinking water [J]. Water Research, 2015, 72(apr.1): 331-339. [CrossRef]
- Cheng, Y.; Nie, X.M.; Wu, H. Q.; et al. A high-throughput screening method of bisphenols, bisphenols digycidyl ethers and their derivatives in dairy products by ultra-high performance liquid chromatography-tandem mass spectrometry [J]. Analytica Chimica Acta, 2017, 950: 98-107. [CrossRef]
- Oca, M. L.; Ortiz, M. C.; Herrero, A.; et al. Optimization of a GC/MS procedure that uses parallel factor analysis for the determination of bisphenols and their diglycidyl ethers after migration from polycarbonate tableware [J]. Talanta, 2013, 106: 266-280. [CrossRef]
- Huang, X.; Aguilar, Z. P.; Xu, H.; et al. Membrane-based lateral flow immunochromatographic strip with nanoparticles as reporters for detection: A review [J]. Biosensors & Bioelectronics, 2016, 75:166-180. [CrossRef]
- Ji, Y.W.; Liu, R.R.; Li,Y.P.; et al. Detection of aflatoxin B1 with immunochromatographic test strips: Enhanced signal sensitivity using gold nanoflowers [J]. Talanta, 2015, 142: 206-212. [CrossRef]
- Jin, Y.; Liu, R.R.; Zhu, L.X.; et al. Development of high sensitivity immunochromatographic test card for zearalenone [J]. Journal of Hygiene Research, 2019, 48(4): 651-658.
- Xu, C.; Kong, D.; Song, S.; et al. Gold nanoparticle-based semi-quantitative and quantitative ultrasensitive paper sensor for the detection of twenty mycotoxins [J]. Nanoscale, 2016, 8(9): 5245-5253. [CrossRef]
- Lin, L.; Wu, X.; Luo, P.; et al. IC-ELISA and immunochromatographic strip assay based monoclonal antibody for the rapid detection of bisphenol S [J]. Food and Agricultural Immunology, 2019, 30(1): 633-646. [CrossRef]
- Fan, H.; Jy, A.; Tz, A.; et al. A gold nanoparticle-based immunochromatographic assay for simultaneous detection of multiplex sildenafil adulterants in health food by only one antibody - ScienceDirect [J]. Analytica Chimica Acta, 2021, 1141:1-12. [CrossRef]
- Song, C. M.; Yang, X.D.; Wu, S.Y.; et al. Establishment of a lateral flow colloidal gold immunoassay strip for the rapid detection of estradiol in milk samples [J]. LWT - Food Science and Technology, 2015, 64(1): 88-94. [CrossRef]
- Ge, W. L.; L, L.; Xu, C. Study on immunoassay of bisphenol A diglycidyl ether [J]. PACKAGING ENGINEERING, 2019, 40(23): 59-63.
- Am, A. ; Pa, A. ; Cf, A.; et al. Toxic effects of bisphenol A diglycidyl ether and derivatives in human placental cells - ScienceDirect[J]. Environmental Pollution, 2019, 244: 513-521. [CrossRef]
- Gallo, P.; Pisciottano, I. M.; Esposito, F. ; et al. Determination of BPA, BPB, BPF, BADGE and BFDGE in canned energy drinks by molecularly imprinted polymer cleaning up and UPLC with fluorescence detection[J]. Food Chemistry, 2017, 220(apr.1): 406-412. [CrossRef]
- Guan, T. Z.; Li, T. Z.; Zhang, T.H.; et al. Fluorescence polarization assay for the simultaneous determination of bisphenol A, bisphenol F and their diglycidyl ethers in canned tuna[J]. INTERNATIONAL JOURNAL OF FOOD PROPERTIES, 2017, 20(52): S1920–S1929. [CrossRef]
|
Disclaimer/Publisher’s Note: The statements, opinions and data contained in all publications are solely those of the individual author(s) and contributor(s) and not of MDPI and/or the editor(s). MDPI and/or the editor(s) disclaim responsibility for any injury to people or property resulting from any ideas, methods, instructions or products referred to in the content. |
© 2023 by the authors. Licensee MDPI, Basel, Switzerland. This article is an open access article distributed under the terms and conditions of the Creative Commons Attribution (CC BY) license (https://creativecommons.org/licenses/by/4.0/).
