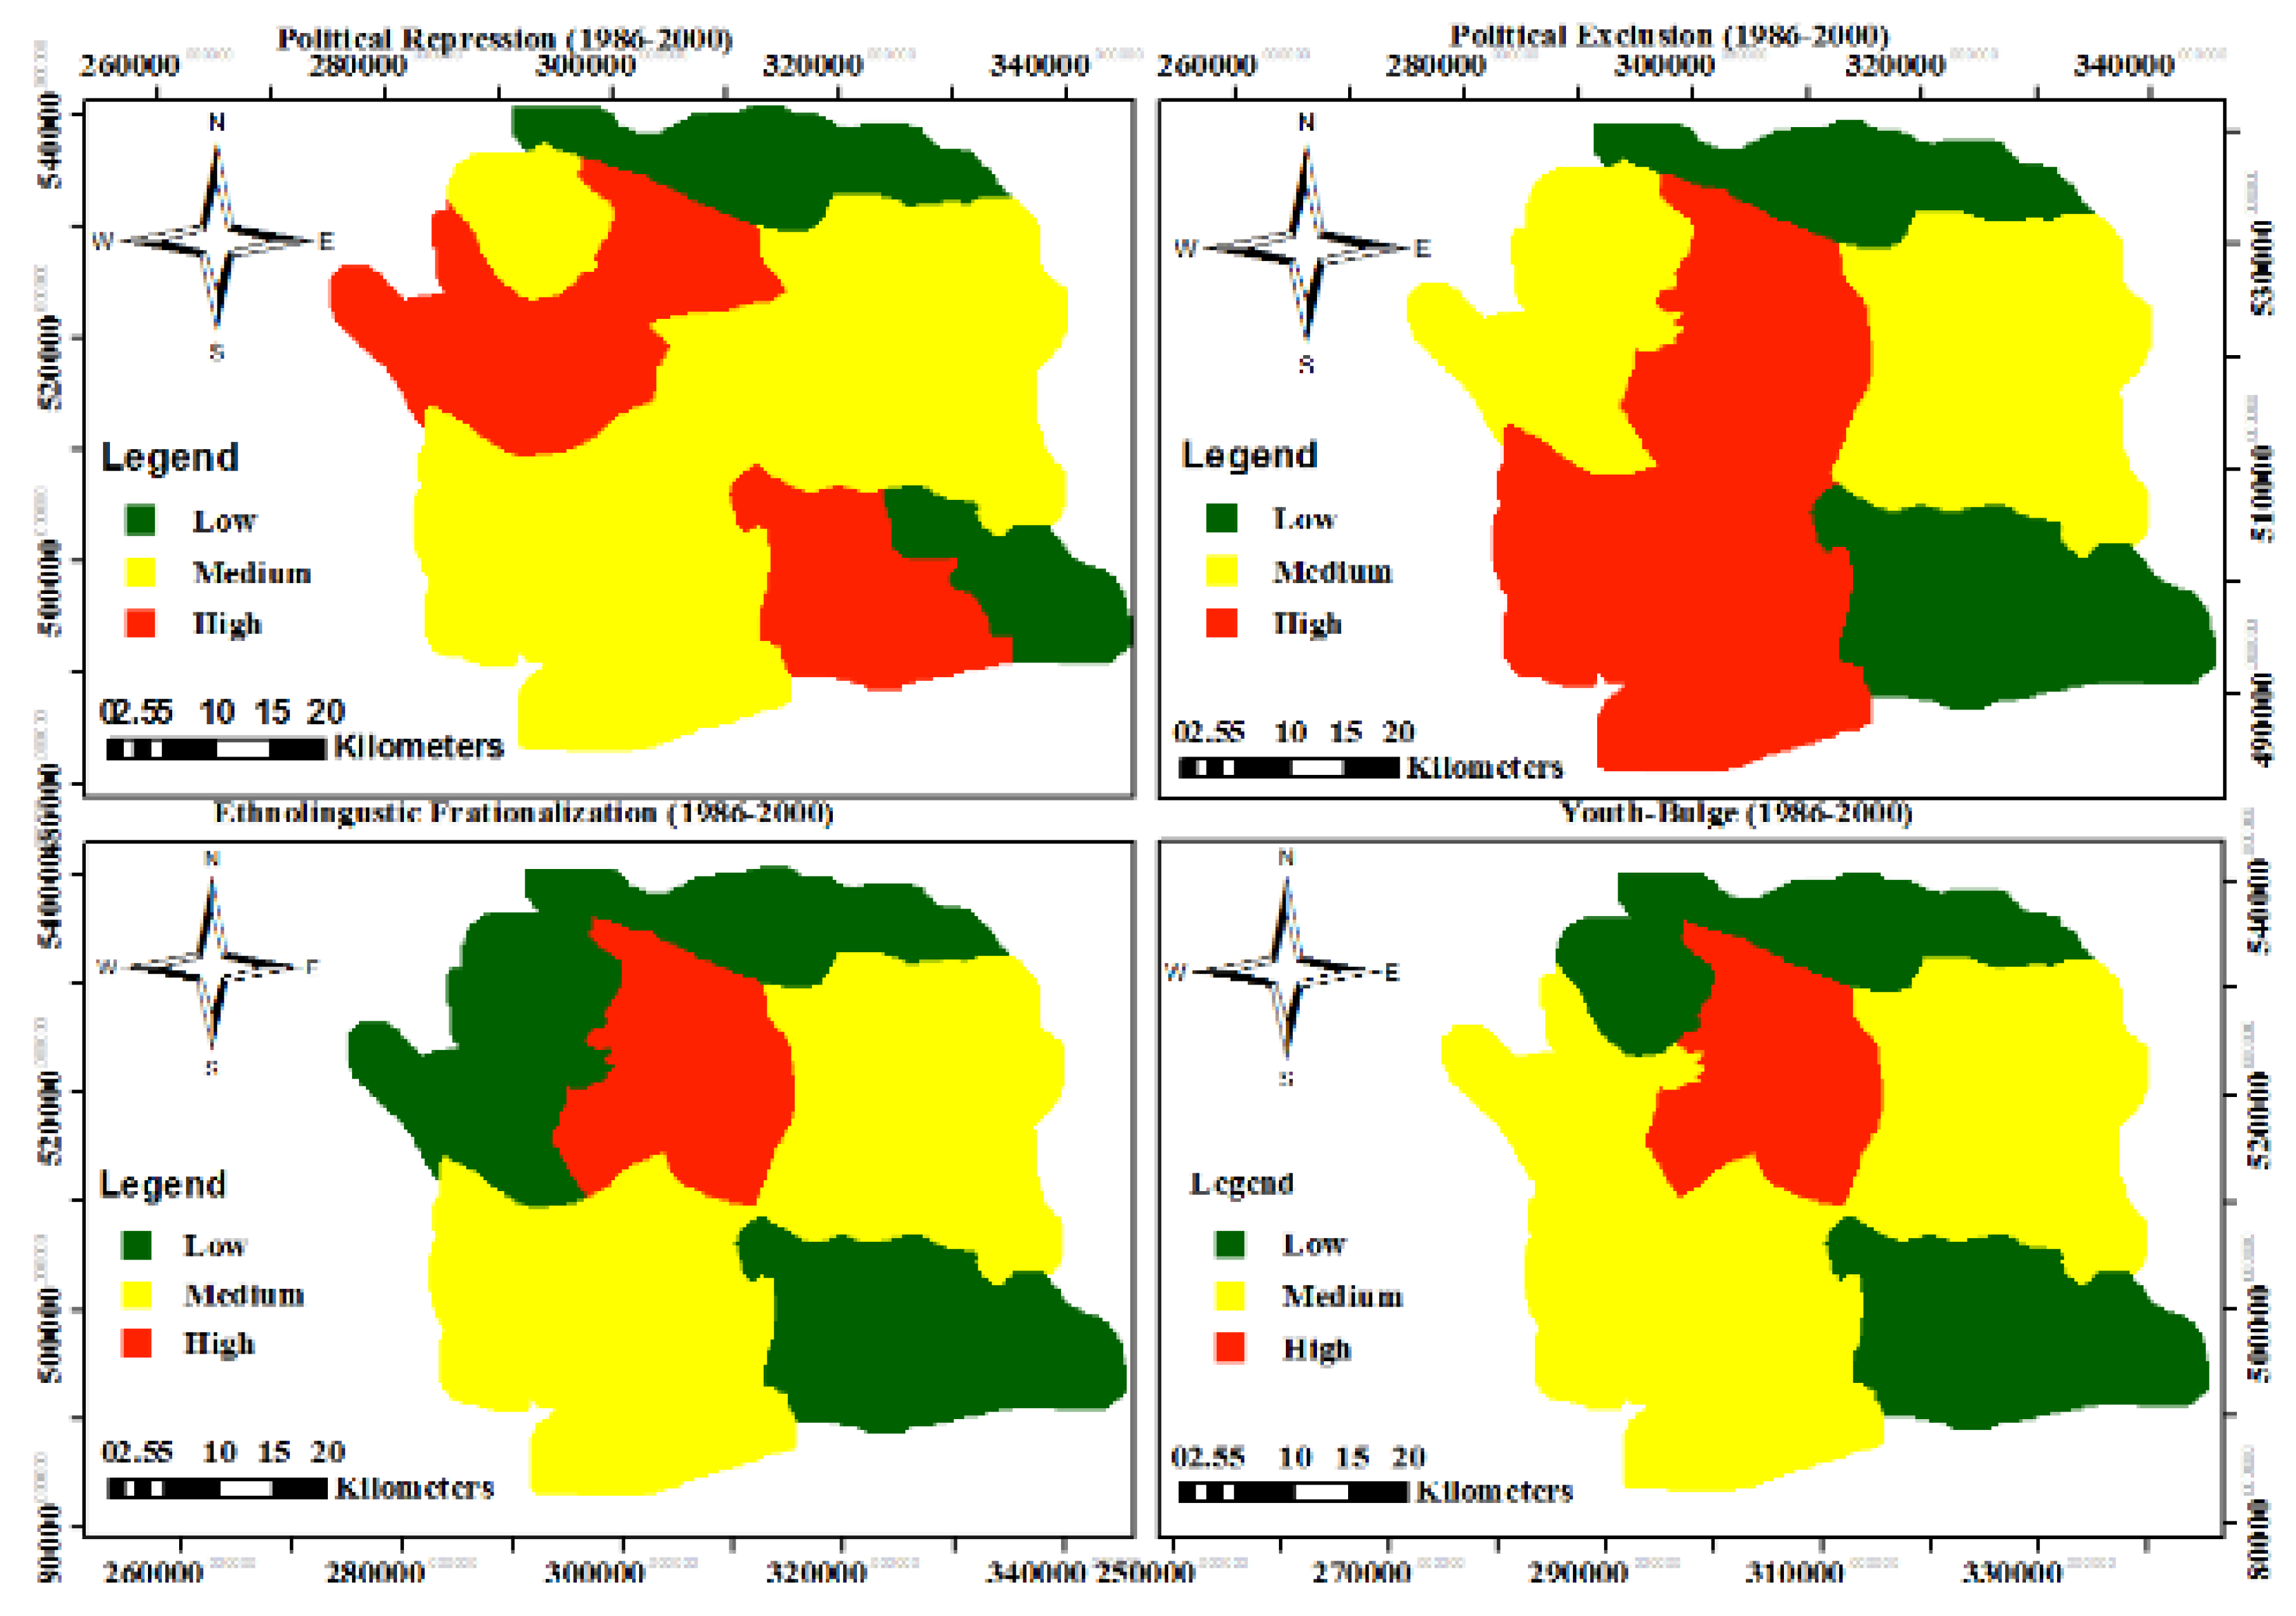
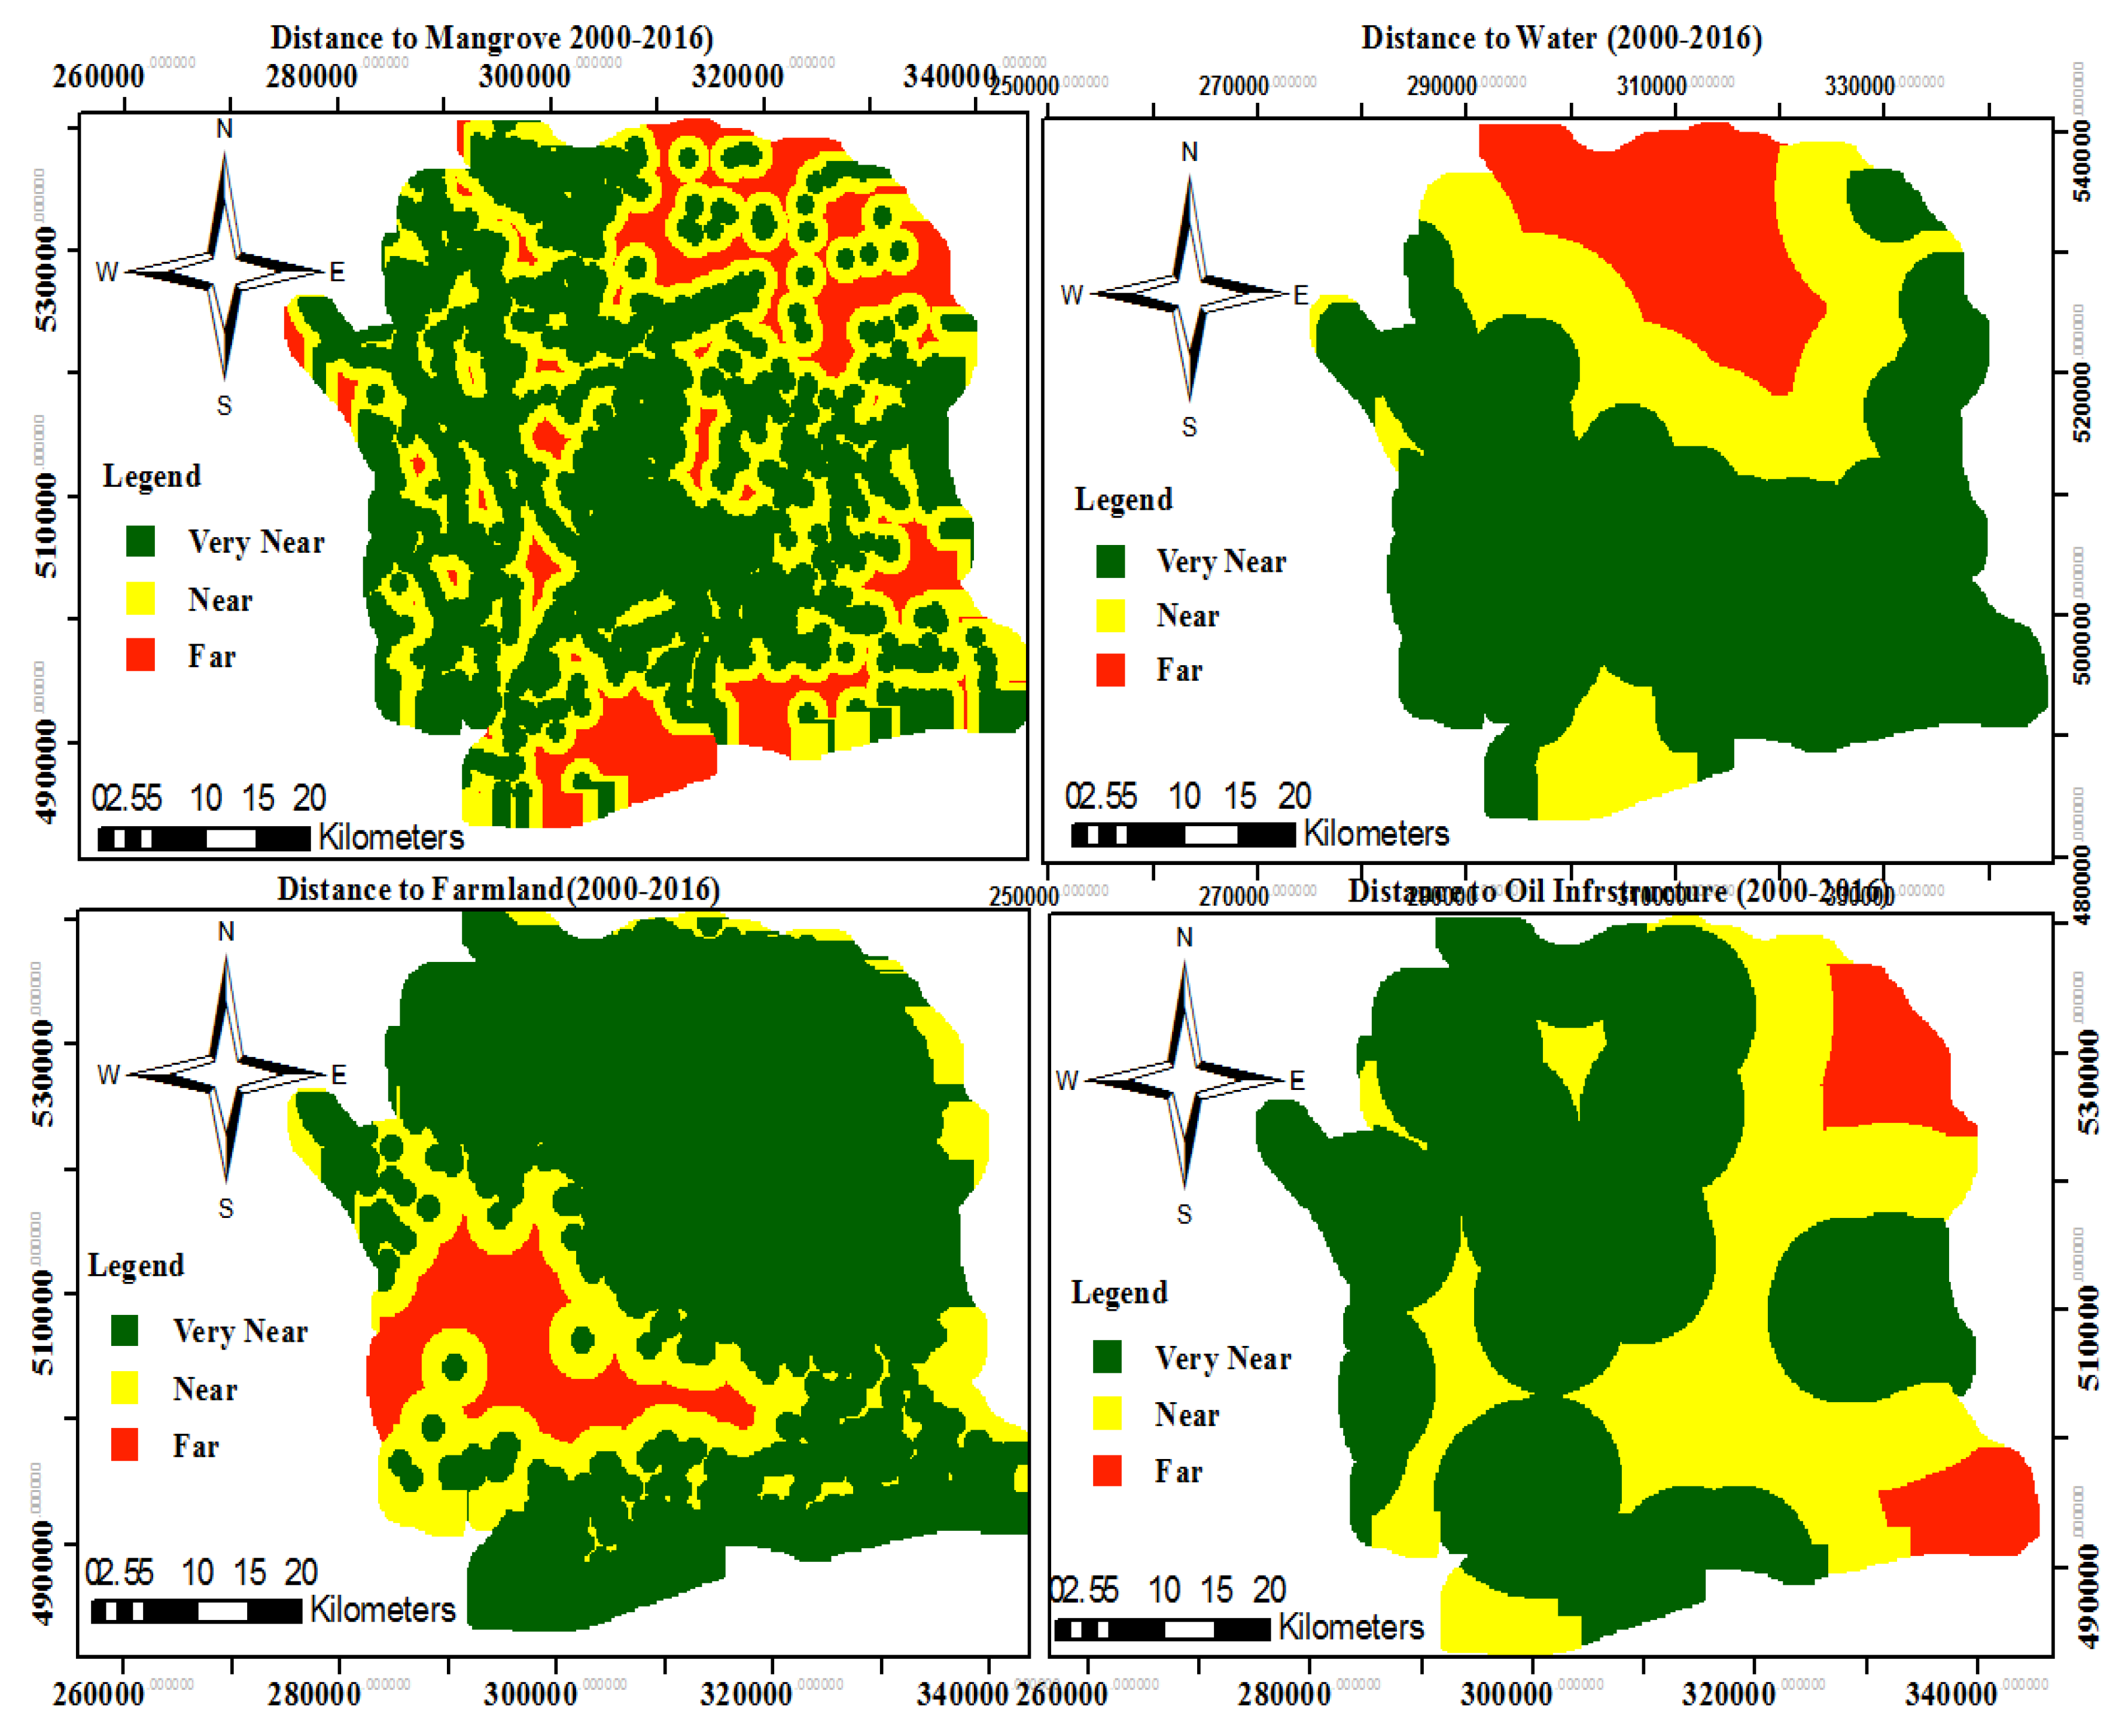
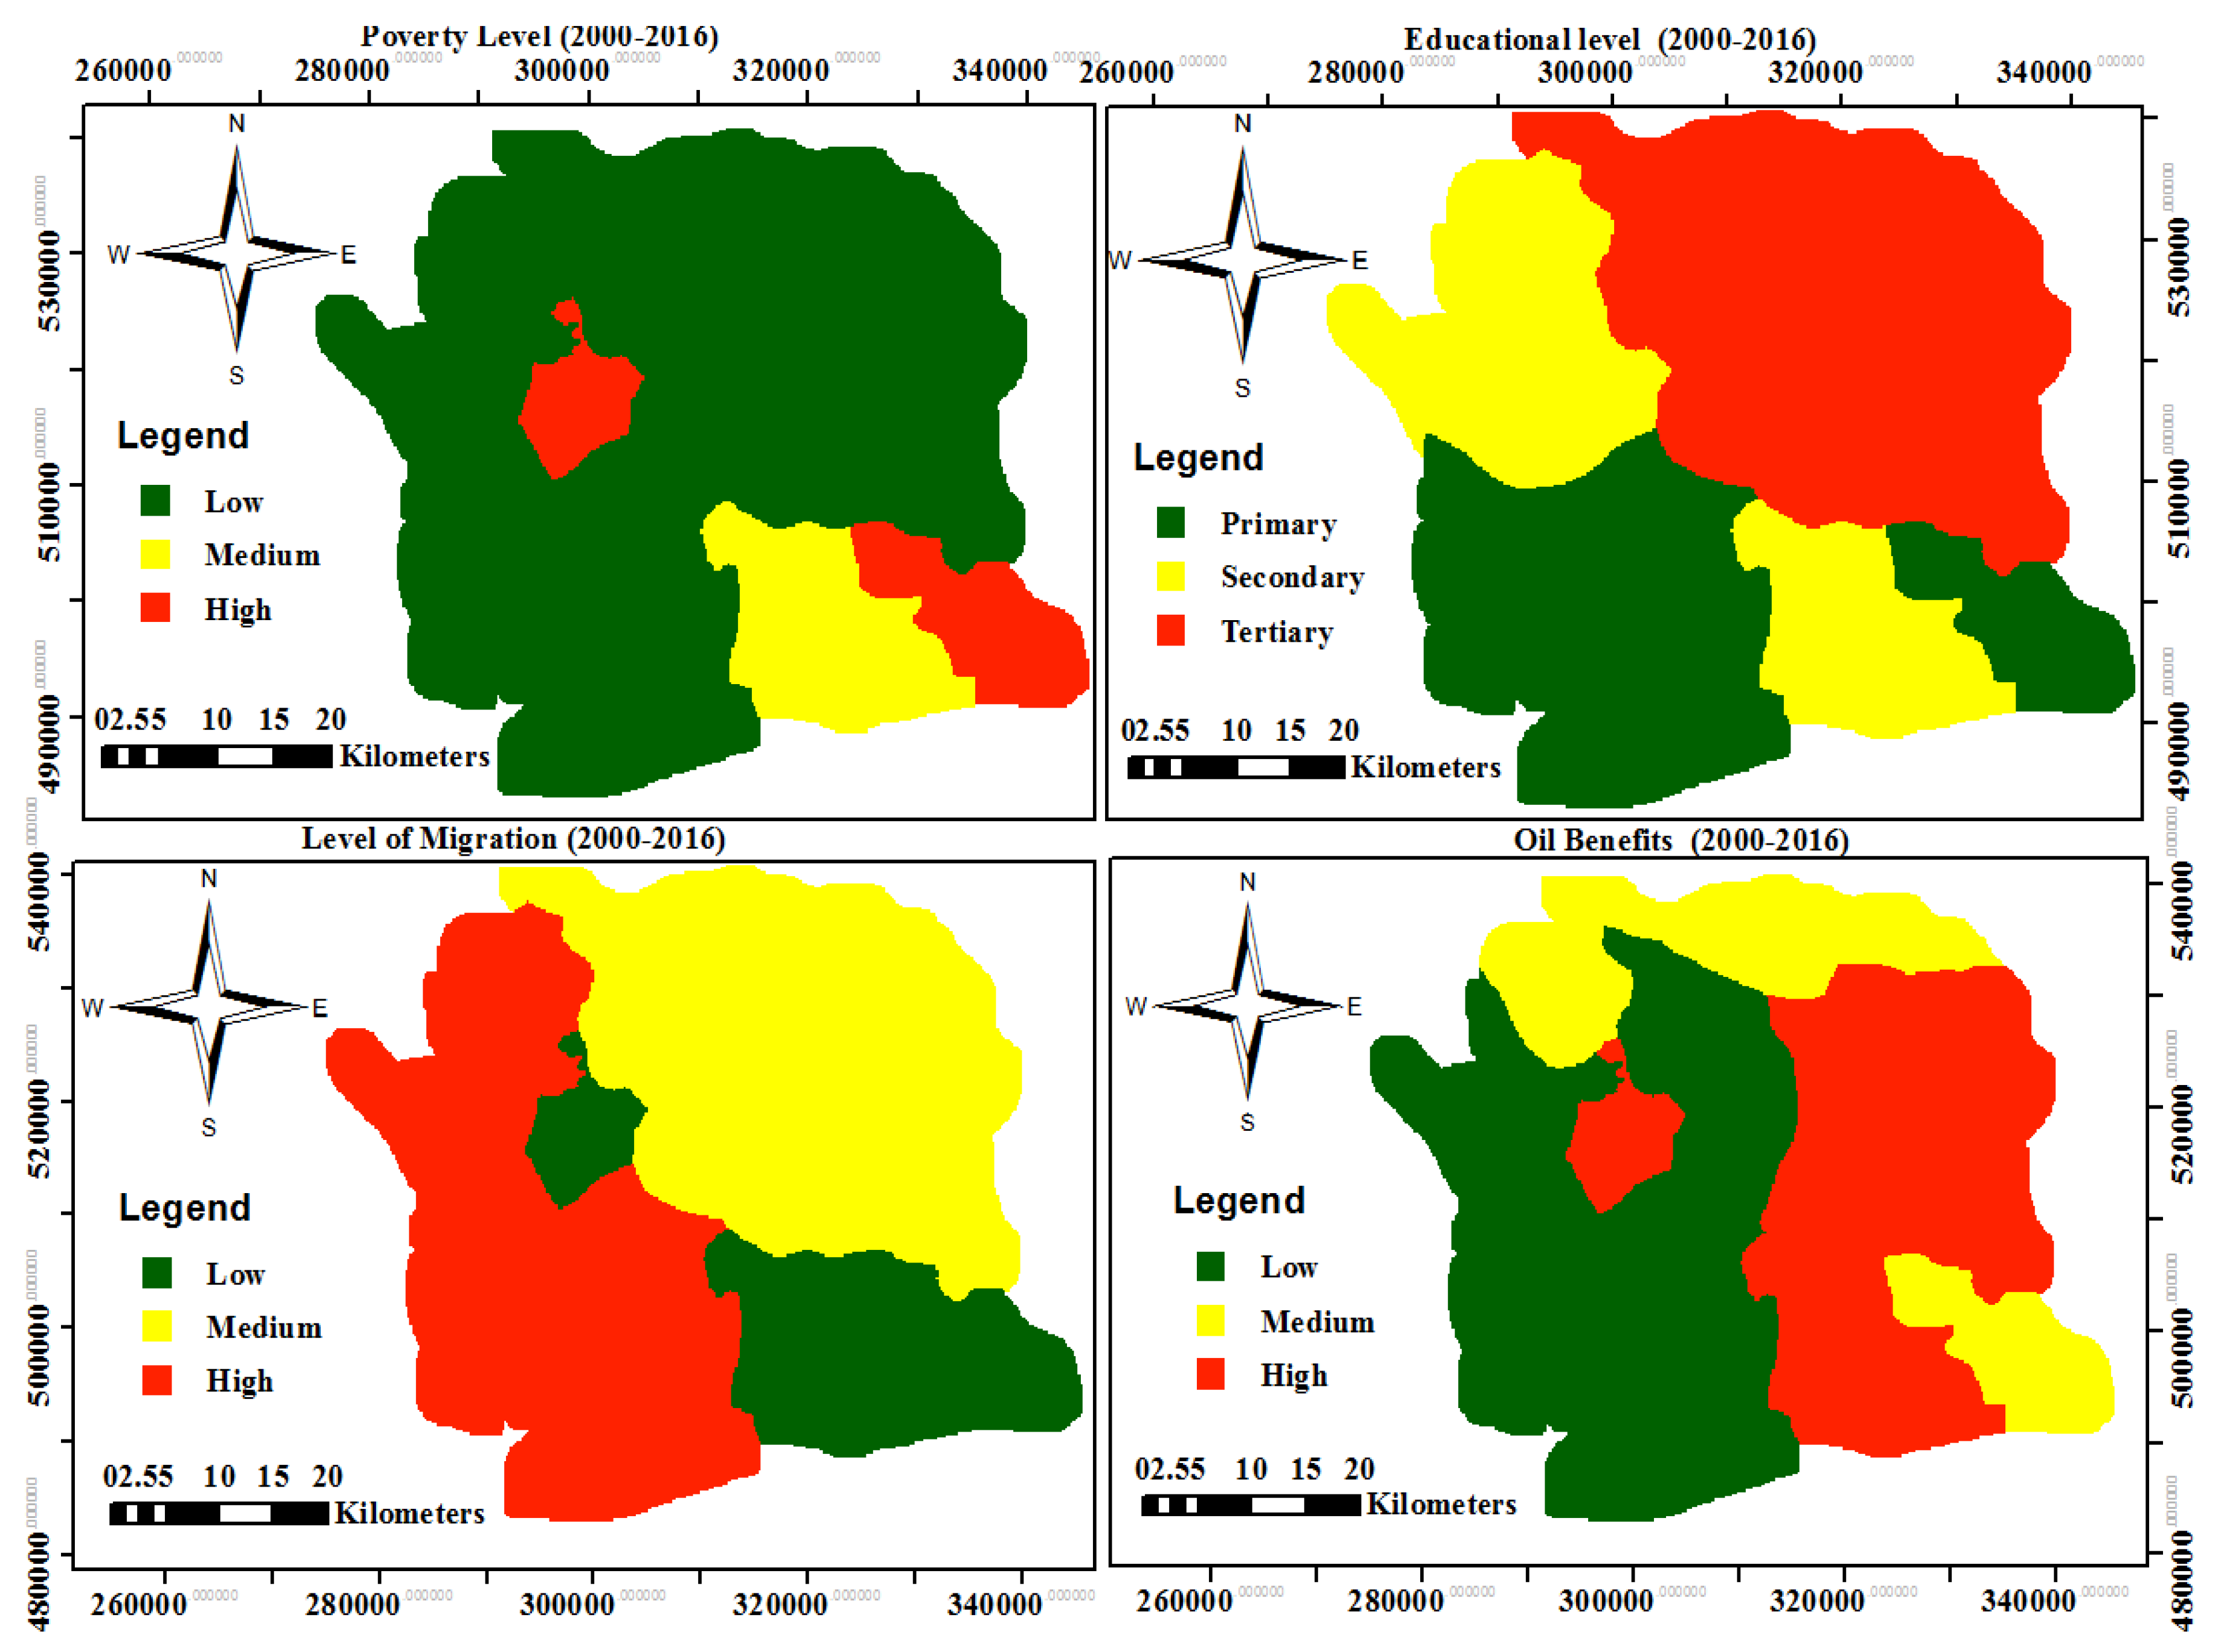
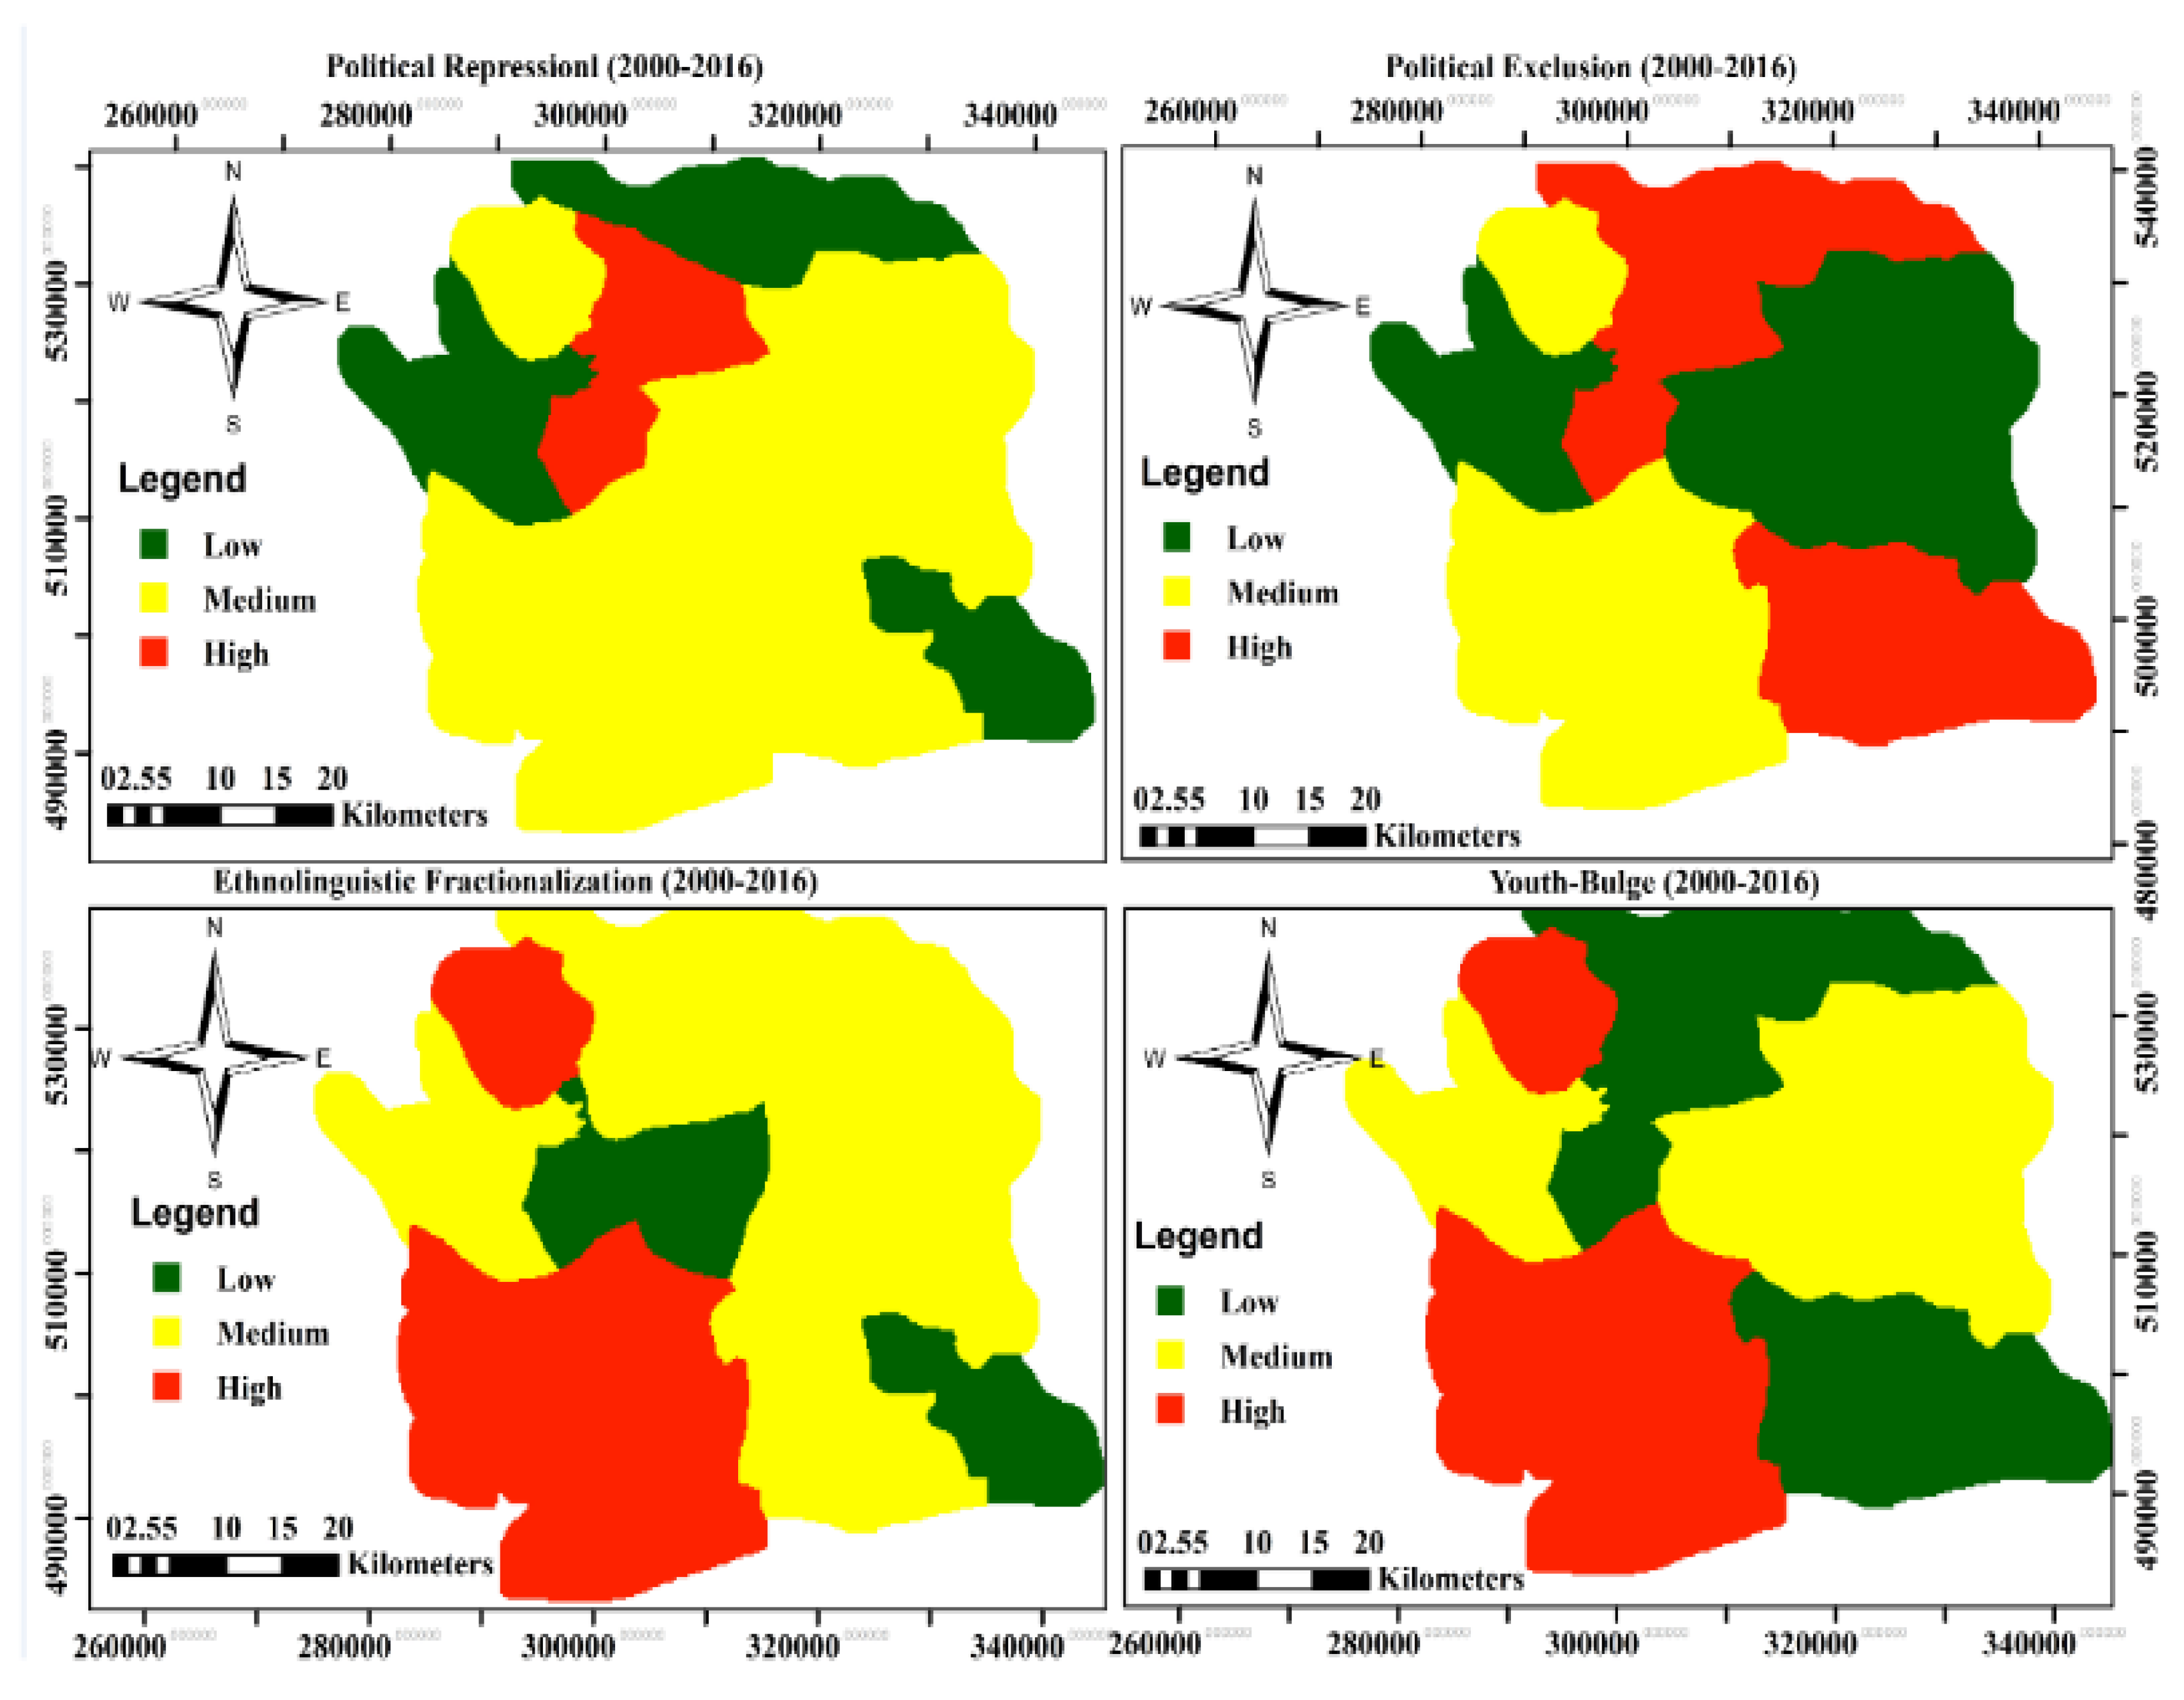
1. Introduction
The United Nations Environment Programme (UNEP) has brought attention to a troubling global trend: over the past six decades, a minimum of 40% of all conflicts have been linked to natural resources. These conflicts often stem from the extraction of high-value resources such as oil or disputes regarding renewable resources[
1,
2] Various theoretical approaches have been employed to analyze the drivers of Natural Resource-Based Conflicts (NRBCs). These approaches encompass concepts like the “resource abundance” or “resource curse” [
3,
4,
5,
6] , “resource scarcity”[
3,
7,
8] and community management of common pool resources (CPR)[
9] albeit with outcomes that are inconclusive.
Under the “resource abundance” perspective, models like multiple linear regression models (MLRM) and multinomial logistic regression models (MNLR) have been applied at the national level [
4,
10]. In this context, socio-economic and political factors are employed to elucidate the concepts of “greed and grievance,” suggesting that conflicts are more likely to occur in countries with lower GDP. In contrast, proponents of resource scarcity and political ecology have predominantly relied on qualitative case studies characterized by in-depth analyses of individual conflict cases. Neo-Malthusian arguments assert that limiting access to renewable resources can escalate frustration within communities. Conversely, Cornucopians believe that humans can adapt to the adverse environmental and social impacts of resource conflicts through technological or institutional innovations [
9]. As we step into the twenty-first century, there exists an urgent need to revisit and build upon these earlier theories. This is of paramount importance in the development of strategies that promote Conflict Management (CM) and Natural Resource Management (NRM), laying the foundation for sustainable peace[
11,
12,
13].
To achieve sustainability and peace, it is crucial to incorporate the various aspects of sustainability into our approach. However, the large-scale studies involving a substantial number of cases (referred to as Large-N studies) have posed challenges to policy implementation. This is mainly due to their limited spatial resolution at the national level [
14,
15]. Additionally, scientific research struggles to determine the extent to which environmental changes, socioeconomic drivers, and socio-political factors can be harmonized to understand conflicts or cooperation. This challenge extends to the development of indices for Natural Resource-Based Conflicts (NRBCs) that can bridge the gap between conflict research and practical policy interventions [
15]. Resource conflicts have the potential to evolve into cooperation and sustainable peace[
11,
13,
16] However, this transformation depends on a profound understanding of the relationship between natural resources and conflicts. To illustrate this point, Ratner et al., (2013) [
17]advocate for a shift in focus from the historical causative and negative aspects of natural resources and civil conflicts toward a more nuanced perspective that involves stakeholders at the local level [
18,
19,
20].
To date, there has been limited research in integrative modeling within the context of NRBCs [
21]. Addressing this gap is the primary objective of this article. Integrative modeling requires an explicit commitment to a transdisciplinary-based coupled approach, drawing on the knowledge of local actors and insights from both natural and social sciences disciplines and sustainability to investigate NRBCs comprehensively[
22,
23,
24].The Niger Delta Region of Niger serves as a suitable case study for testing an integrative model for analyzing resource conflicts. It is a diverse region with geographic, environmental, socio-economic, and political significance in resource extractive regions worldwide. Geographically, it is defined as a delta, with its water systems significantly affected by human activities and ultimately flowing into the Atlantic Ocean. By conducting an analysis at the community level, we can measure and explicitly assess numerous phenomena believed to influence conflict risks and understand their geographical clustering or diffusion ([
25]. Spatially disaggregating NRBCs at the local level offers several advantages.
Firstly, this approach allows for a comprehensive understanding of conflict and the various forms of organized violence, including low-intensity conflicts, social unrest, communal violence, and high-intensity rebel-related violence. It involves considering the perspectives and insights of the key actors involved in these conflicts. Secondly, when examining the spatial clustering of Non-Residential Building Conflicts (NRBCs) at the local level, it is important to note that conflicts themselves may not necessarily imply a direct causal relationship, as highlighted by Buhaug and Gleditsch [
26]. Instead, the observed spatial clustering of conflicts may be attributed to the corresponding distribution of relevant endogenous characteristics associated with these conflicts. In situations where there is limited data availability, fuzzy models prove to be highly suitable. They enable the generation of fuzzy rules based on a combination of linguistic statements and expert knowledge, as proposed by Zadeh [
27,
28].
In this paper, we present an integrative approach that facilitates the inclusion of community knowledge in modeling NRBCs. We utilize the Spatially Explicit Fuzzy Logic-Based Adapted Model for Conflict Management (SEFLAME-CM) algorithm to develop the Conflict Vulnerability Likelihood (CVL) Index. This approach differs from the institutional framework applied at the community level in the Nobel Prize-winning works of Elinor Ostrom [
9,
29,
30]. Ostrom’s economic and policy analysis primarily assumed that communities would self-organize to resolve resource conflict problems. In contrast, the SEFLAME-CM integrates various factors, including space, time, multiple drivers, and resource conflict typologies. The primary objective is to incorporate the local knowledge and perceptions of key stakeholders into spatial decision-making technologies, thereby advancing sustainable peace efforts.
The article is structured as follows. The second section, titled “Materials and Methods,” provides an overview of the data collection process, which serves as the foundation for knowledge integration. We discuss three primary data sources in this section: secondary data (
Section 2.1.1), fieldwork data, including open interviews, questionnaire surveys, and workshops (
Section 2.1.2), and remote sensing data (
Section 2.1.3). Following the data sources, we present a description of the model steps in
Section 2.2. In
Section 2.3, we delve into spatial attributes and provide an explanation of fuzzy conflict data (FUZZYCONDATA). The subsequent section,
Section 2.4, presents the case study. The results and discussions are presented in
Section 3 and
Section 4, respectively. In the results section, we discuss the proposition of knowledge integration, elucidate membership functions, and outline the rules employed in our model. The Discussion section further delves into the results, including a discussion of model validation, and draws comparisons with the SEFLAME-CM model.
2. Materials and Methods
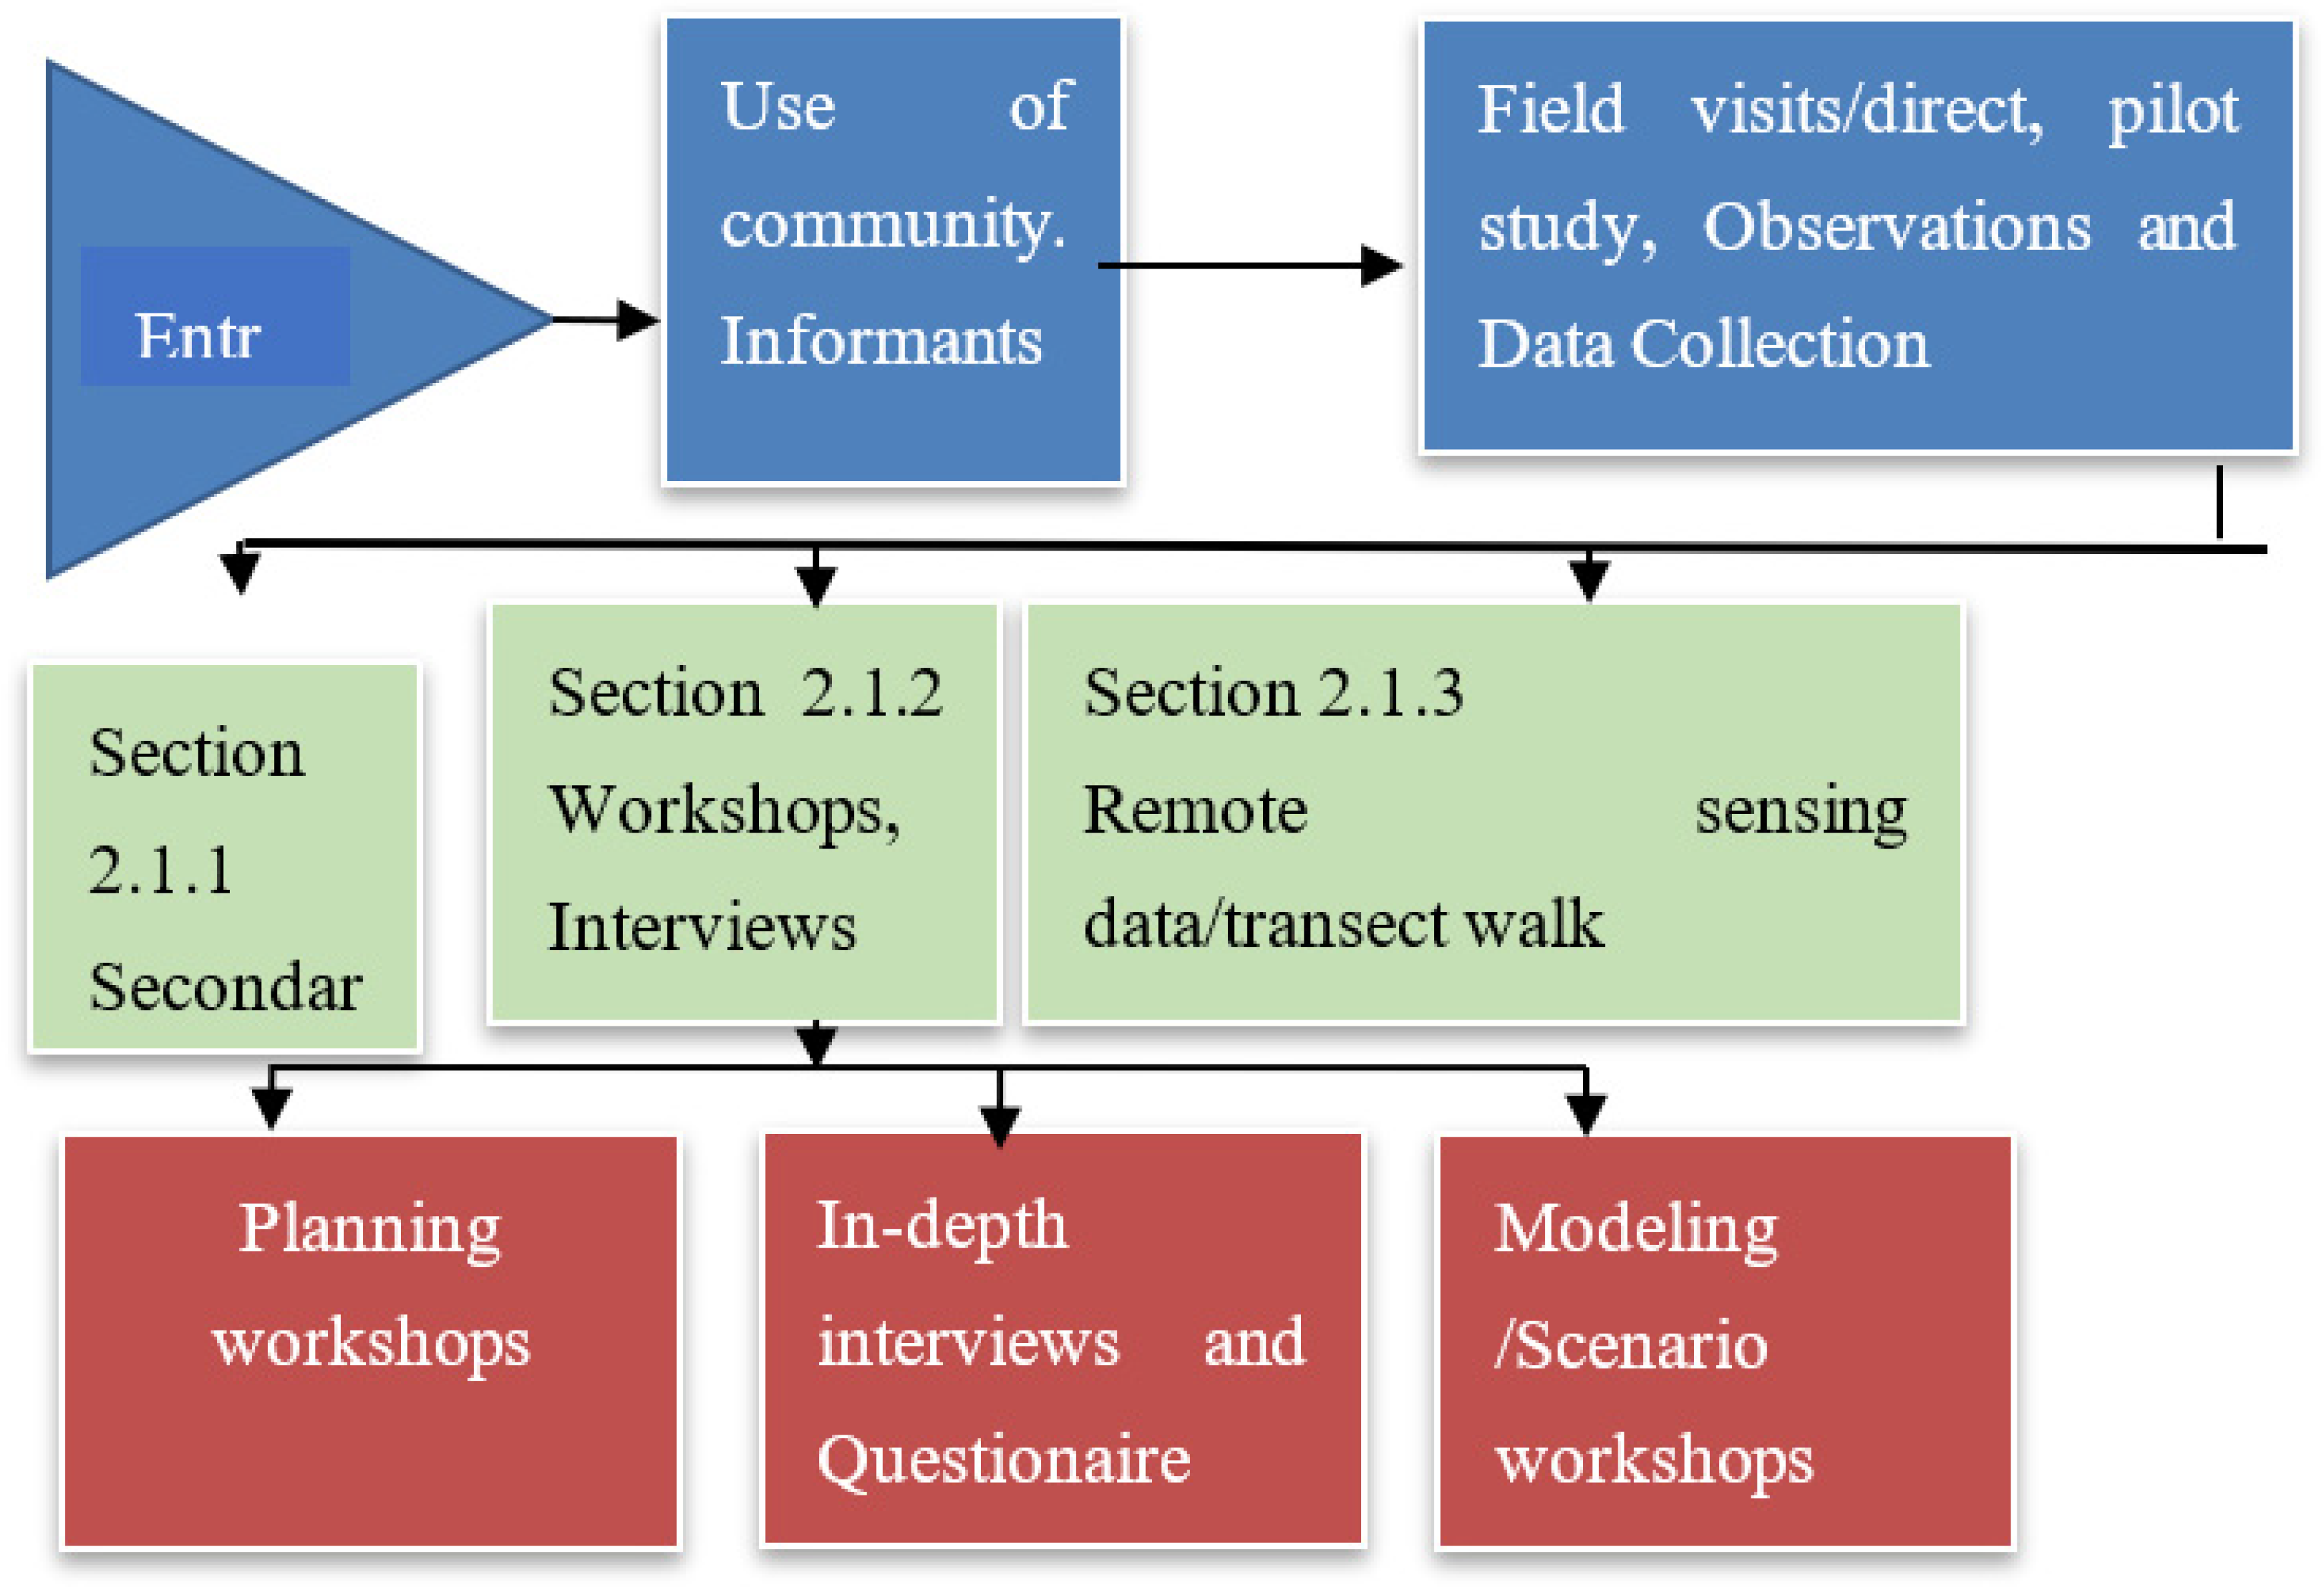
In advancing our fuzzy logic models for conflict modelling, we adopted a triangulation approach, distinguishing it from the methods employed in previous [
31,
32]. The data collection between 2015 and 2022 began with pilot study, workshops, ground truth satellite data collection (
Figure 1). Data types (refer to
Table 1) were harnessed to construct FUZZYCONDATA, which served as the foundation for modelling and validation (for details on spatial data attributes, see
Section 2.3). To ensure the robustness of our data, we leveraged validation data consisting of rebel-based and territorial-based conflict typologies. These data were sourced from the Uppsala Conflict Data Programme Geo-referenced Event Dataset (UCDP-GED) (
http://ucdp.uu.se/downloads/) and Armed Conflict Location Event Data (ACLED) (
https://www.acleddata.com/data/). Additionally, we incorporated the remote sensing datasets (see
Table 1). The utilization of triangulation and the pilot study bolstered the validity and reliability of the used data.
Figure 1.
Fieldwork steps for collaborative research and data collection at the local level.
Figure 1.
Fieldwork steps for collaborative research and data collection at the local level.
Table 1.
List of datasets and sources in vulnerability assessment of natural resource-based conflicts.
Table 1.
List of datasets and sources in vulnerability assessment of natural resource-based conflicts.
Conflict drivers and vulnerability
Dimensions |
Sources |
| Environmental dimension (external component) |
|
| Mangrove loss |
Remote Sensing |
| Water pollution |
Remote Sensing |
| Farmland loss |
Remote Sensing |
| Oil infrastructure, e.g., pipeline, oil well, |
Petroleum Corporations in Nigeria |
| Socio-economic dimension (internal component) |
|
| Poverty level (Wealth index) |
National Population Commission |
| Education Level |
National Population Commission |
| Oil Migration |
National Population Commission |
| Oil Benefits |
National Population Commission |
| Political dimension (internal component) |
|
| Political Repression |
Fieldwork |
| Political Exclusion |
Fieldwork |
| Ethnic Linguistic Fractionalization |
Census Data from National Population Commission/ Fieldwork |
| Youth-Bulge |
Census Data from National Population Commission/ Fieldwork |
| Observed Conflicts |
UCDP-GED and ACLED |
2.1.1. Secondary Data Sources
The secondary data was collected from various sources, encompassing statistical profiles and socio-economic indicators. These included demographic characteristics, primary health care data, spatial data (such as land cover information), and data pertaining to oil infrastructure, including details on oil pipelines, oil wells, and oil spill incidents.
2.1.2. Workshops, Surveys, and Local Knowledge on Perception of Conflicts
This phase of our data collection process involved collaborative efforts from our research team, which included Ph.D. scholars, two MSc researchers, and two staff members from the University of Port-Harcourt, Nigeria. We conducted modelling sessions with field assistants, comprising various activities. To gather valuable insights and perspectives, we administered a total of 40 semi-structured questionnaires to key stakeholders in each community (refer to
Table 2). This resulted in the retrieval of 200 field questionnaires. During our modeling workshops, we employed a unique approach, distinct from that utilized in previous studies[
31,
32]. In these workshops, parameters were rated on a scale ranging from 0 to 10 in collaboration with our research team from Germany.
Table 2.
Distribution of structured questionnaire.
Table 2.
Distribution of structured questionnaire.
| Age |
Farmers |
Youths
|
NGOs
|
Politicians
|
Community Leaders |
70 years and above
|
40 |
40 |
40 |
40
|
40
|
| 40-69 years |
40 |
40 |
40 |
40
|
40 |
| 20- 39 years |
40
|
40
|
40
|
40
|
40 |
2.1.3. Remote Sensing for Deriving Environmental Parameters
To obtain essential environmental and physical parameters of the model, the optical remote sensors were deployed (see
Table 3). The data collection was from two distinct periods: one before the 1980s, during a time marked by intense conflicts in the study area, and the other from the late 1980s to the early 1990s [
32]. Pre-processed data were supported with transect walk sessions aimed at incorporating the local knowledge.
Table 3.
Characteristics of satellite images used.
Table 3.
Characteristics of satellite images used.
| Time scale |
Data |
Date |
Resolution |
Source |
| Before 1986 |
Landsat TM |
1986-12-19 |
30 m |
USGS |
| 1987-2000 |
Landsat ETM |
2000-12-17 |
30 m |
USGS |
| 2001-Present |
KOMPSAT 2 |
2012-02-11 |
4m |
ESA |
| Nig Sat 2 |
2013-02-11 |
22m |
NSRDA |
| Landsat 8 |
2016-01-03 |
30m |
USGS |
Following classification schemes that align with the research question and existing frameworks (as outlined in
Table 3), feature extraction was conducted [
33] (see
Table 4). This process drew from established schemes[
34,
35] and involved post-classification comparisons, contingency tables, intensity analysis for the intervals[
36] .
Table 4.
The Land Use Land Cover (LULC classification scheme used in this study.
Table 4.
The Land Use Land Cover (LULC classification scheme used in this study.
| Level I (Main Cover category) |
Code* |
Level II (category Description) |
| Built-up |
BU |
Single-family Units, Multi-family, Group Quarters, Other Residential or industrial infrastructures |
| Farmland |
FL |
Cropland, Mixed farmland, plantations, and others |
| Water Pollution |
WP |
Streams, canals, lakes, bays, and estuaries |
| Mangrove Loss |
ML |
Mangrove swamp forest, different mangrove trees, and shrubs, mangrove trenches |
| Secondary Forest |
SF |
Disturbed thick forest, abandoned farmlands |
| Thick forest |
TF |
Undisturbed forests such as nypa palm |
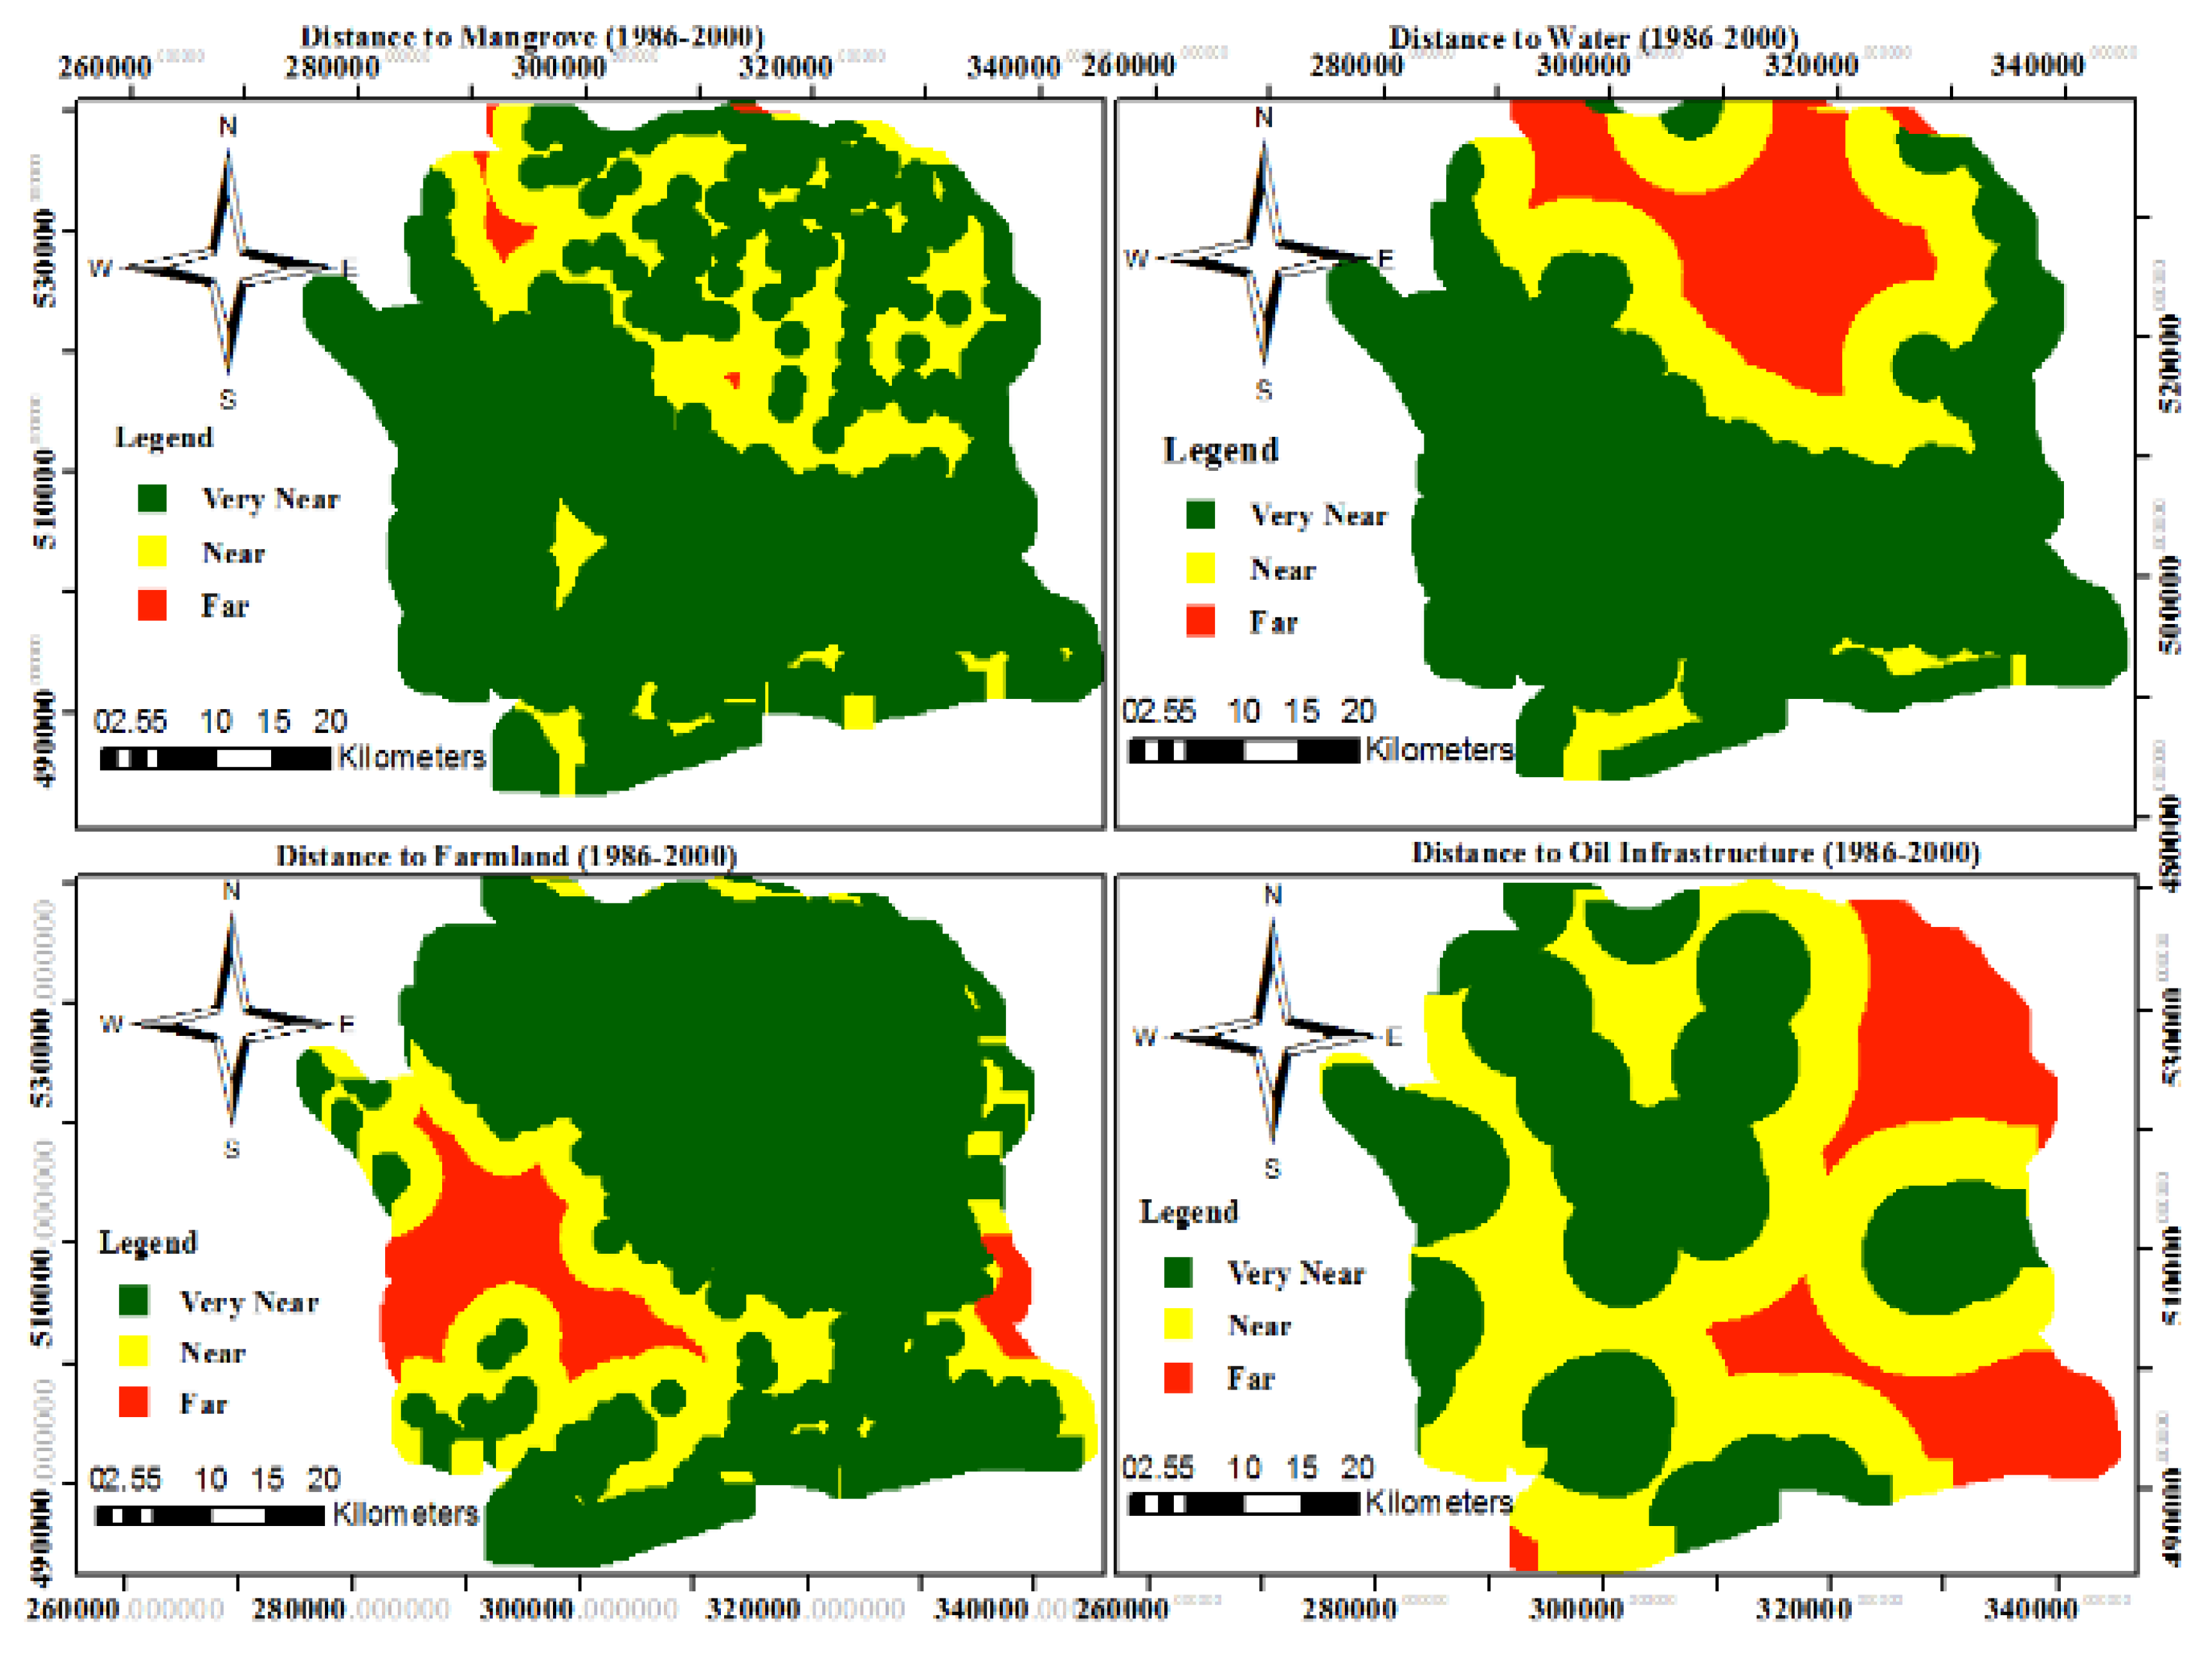
From Euclidean distance measurement, an object can be identified by its perceived spatial boundaries, not solely their location and surrounding environment[
37]. For instance, villagers tend to minimize the distances to essential resources, such as streams, arable farms, primary health care services, etc. Additionally, proximity to oil infrastructure increases likelihood of conflicts [
38,
39](see Equations 1 and 2,
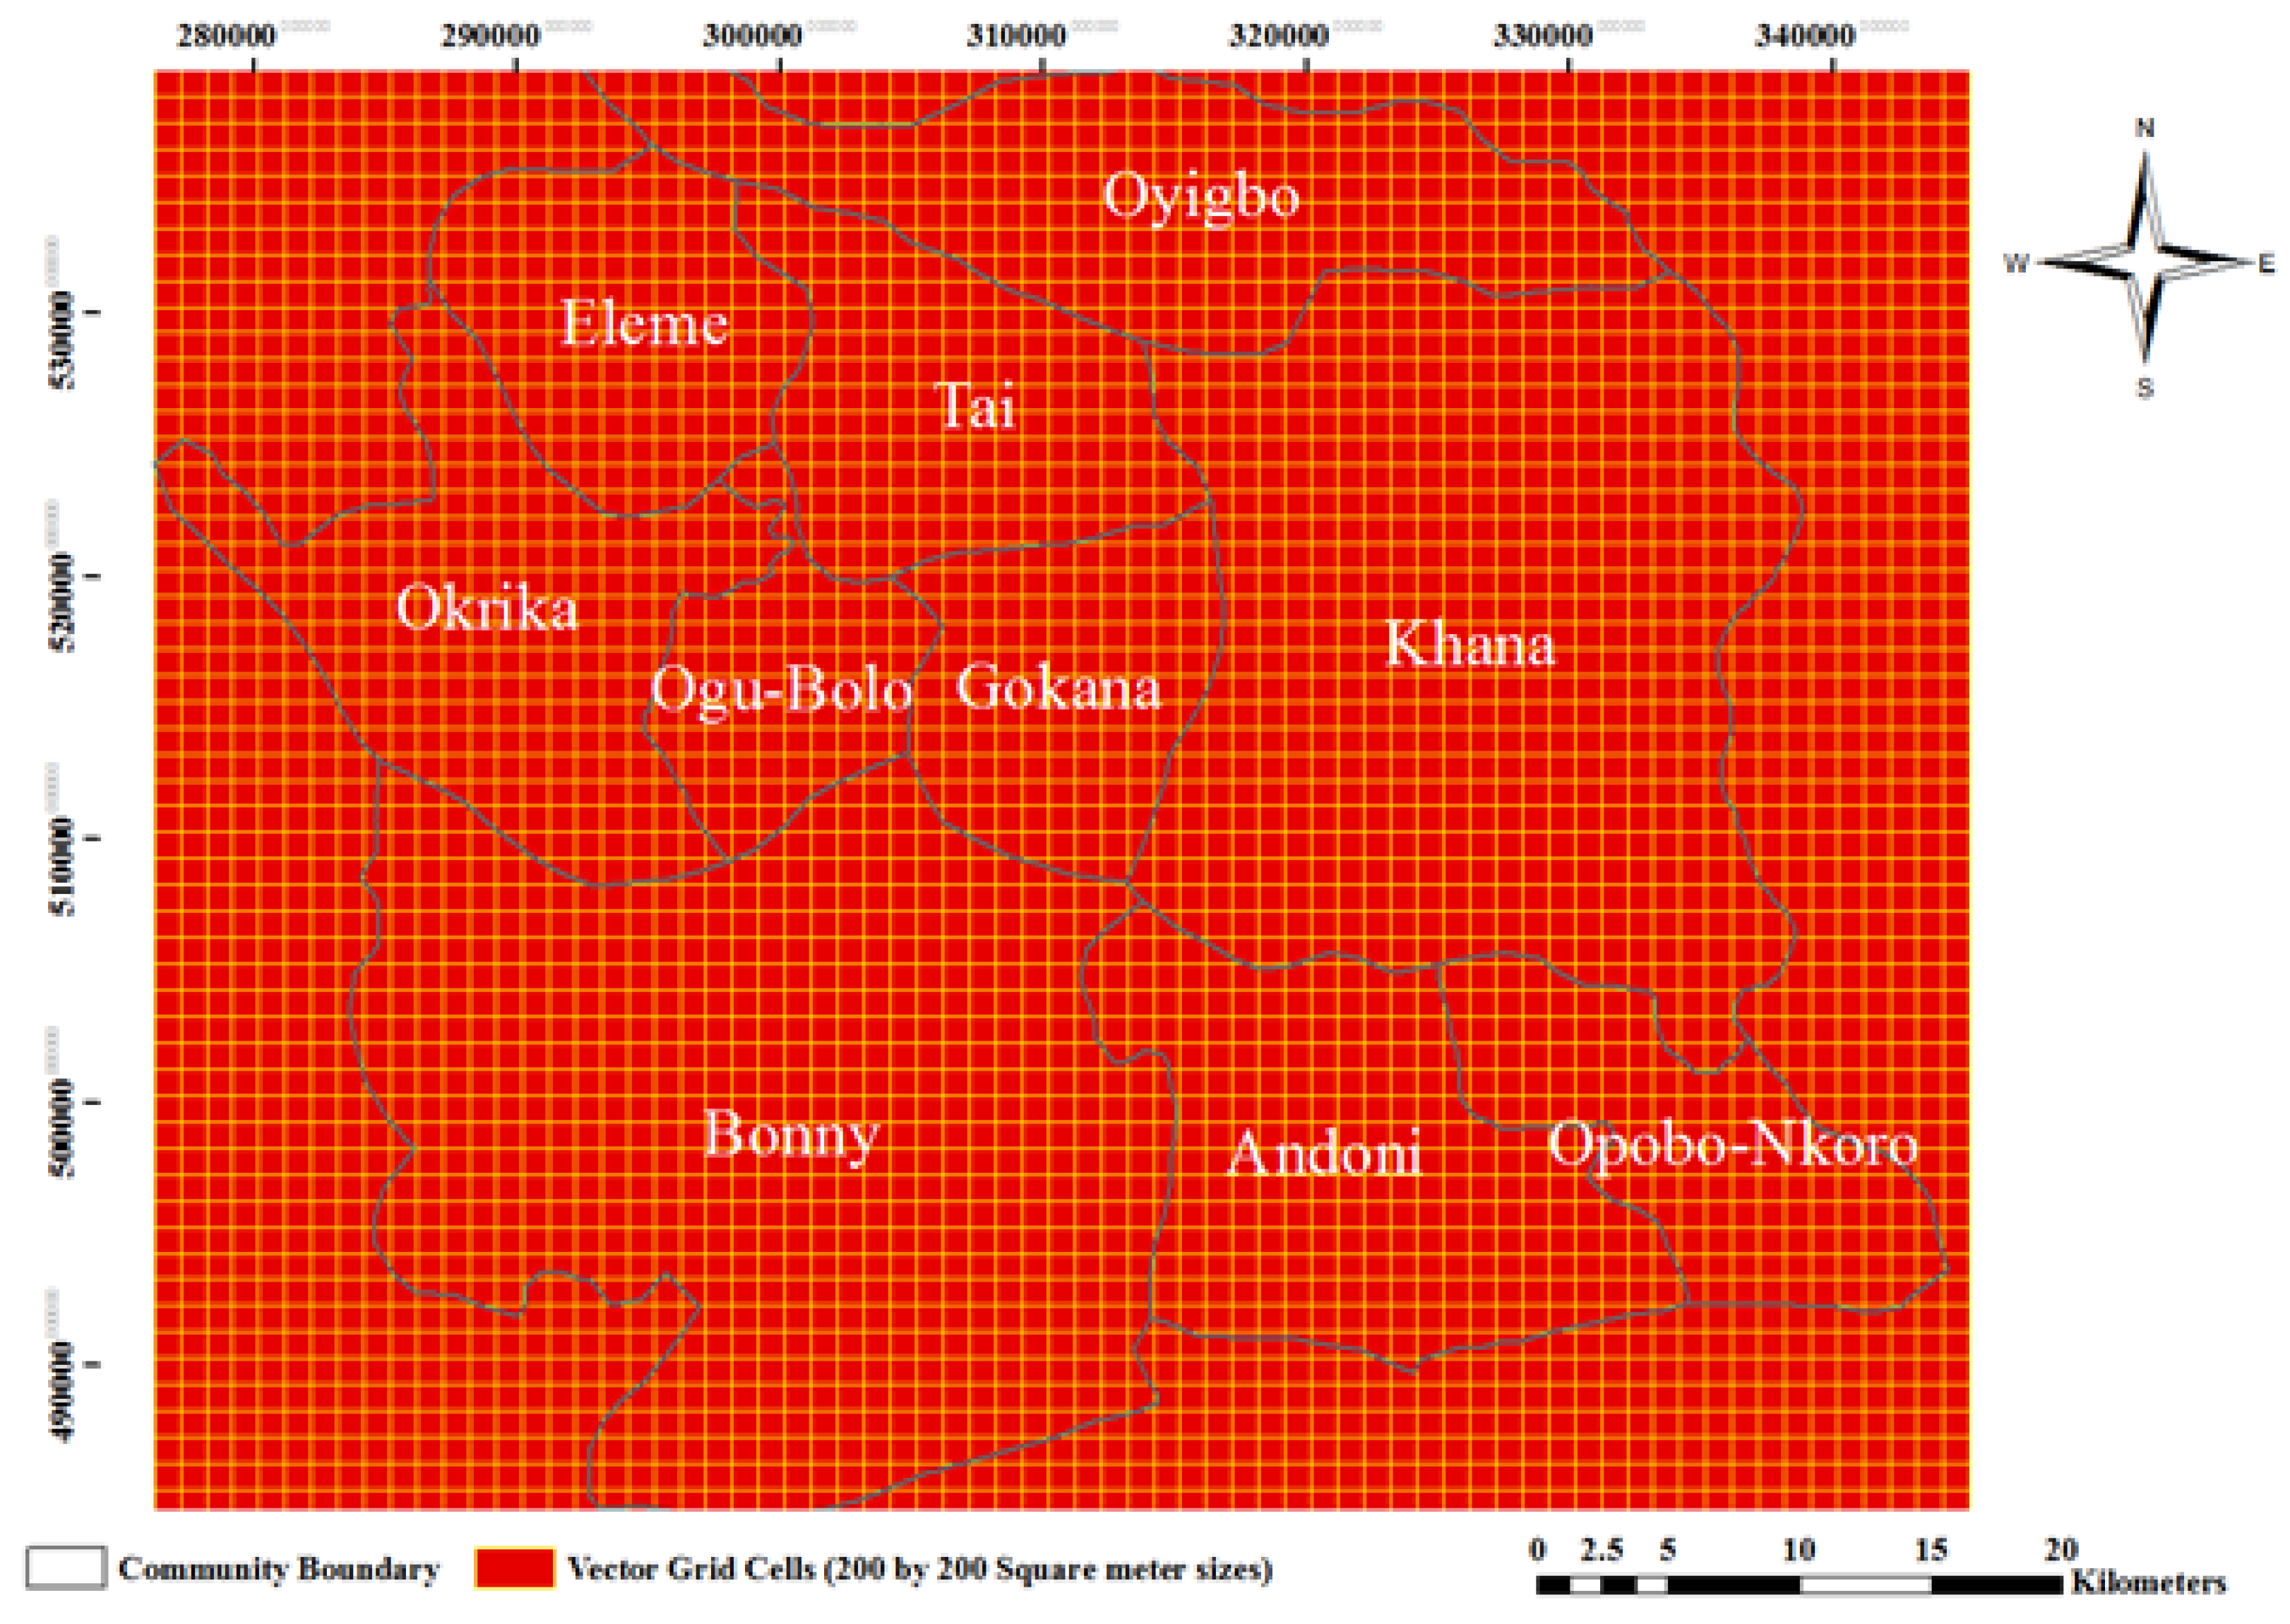
Table 5). Spatially Explicit Distance Parameters (SEDPs) were developed based 200 by 200-meter square artificially constructed grid cells with resolution of the available data and the area of study using GIS (see
Figure 2).
Table 5.
Measurement of distance in GIS.
Table 5.
Measurement of distance in GIS.
| Distance |
Mangrove (ha) |
Farmland(ha) |
Water (ha) |
| Very Near |
0-5km |
0-5km |
0-5km |
| Near |
5-10km |
5-10km |
5-10km |
| Far |
10-15km |
10-15km |
10-15km |
Figure 2.
Sample conflict grid cells.
Figure 2.
Sample conflict grid cells.
2.2. Model
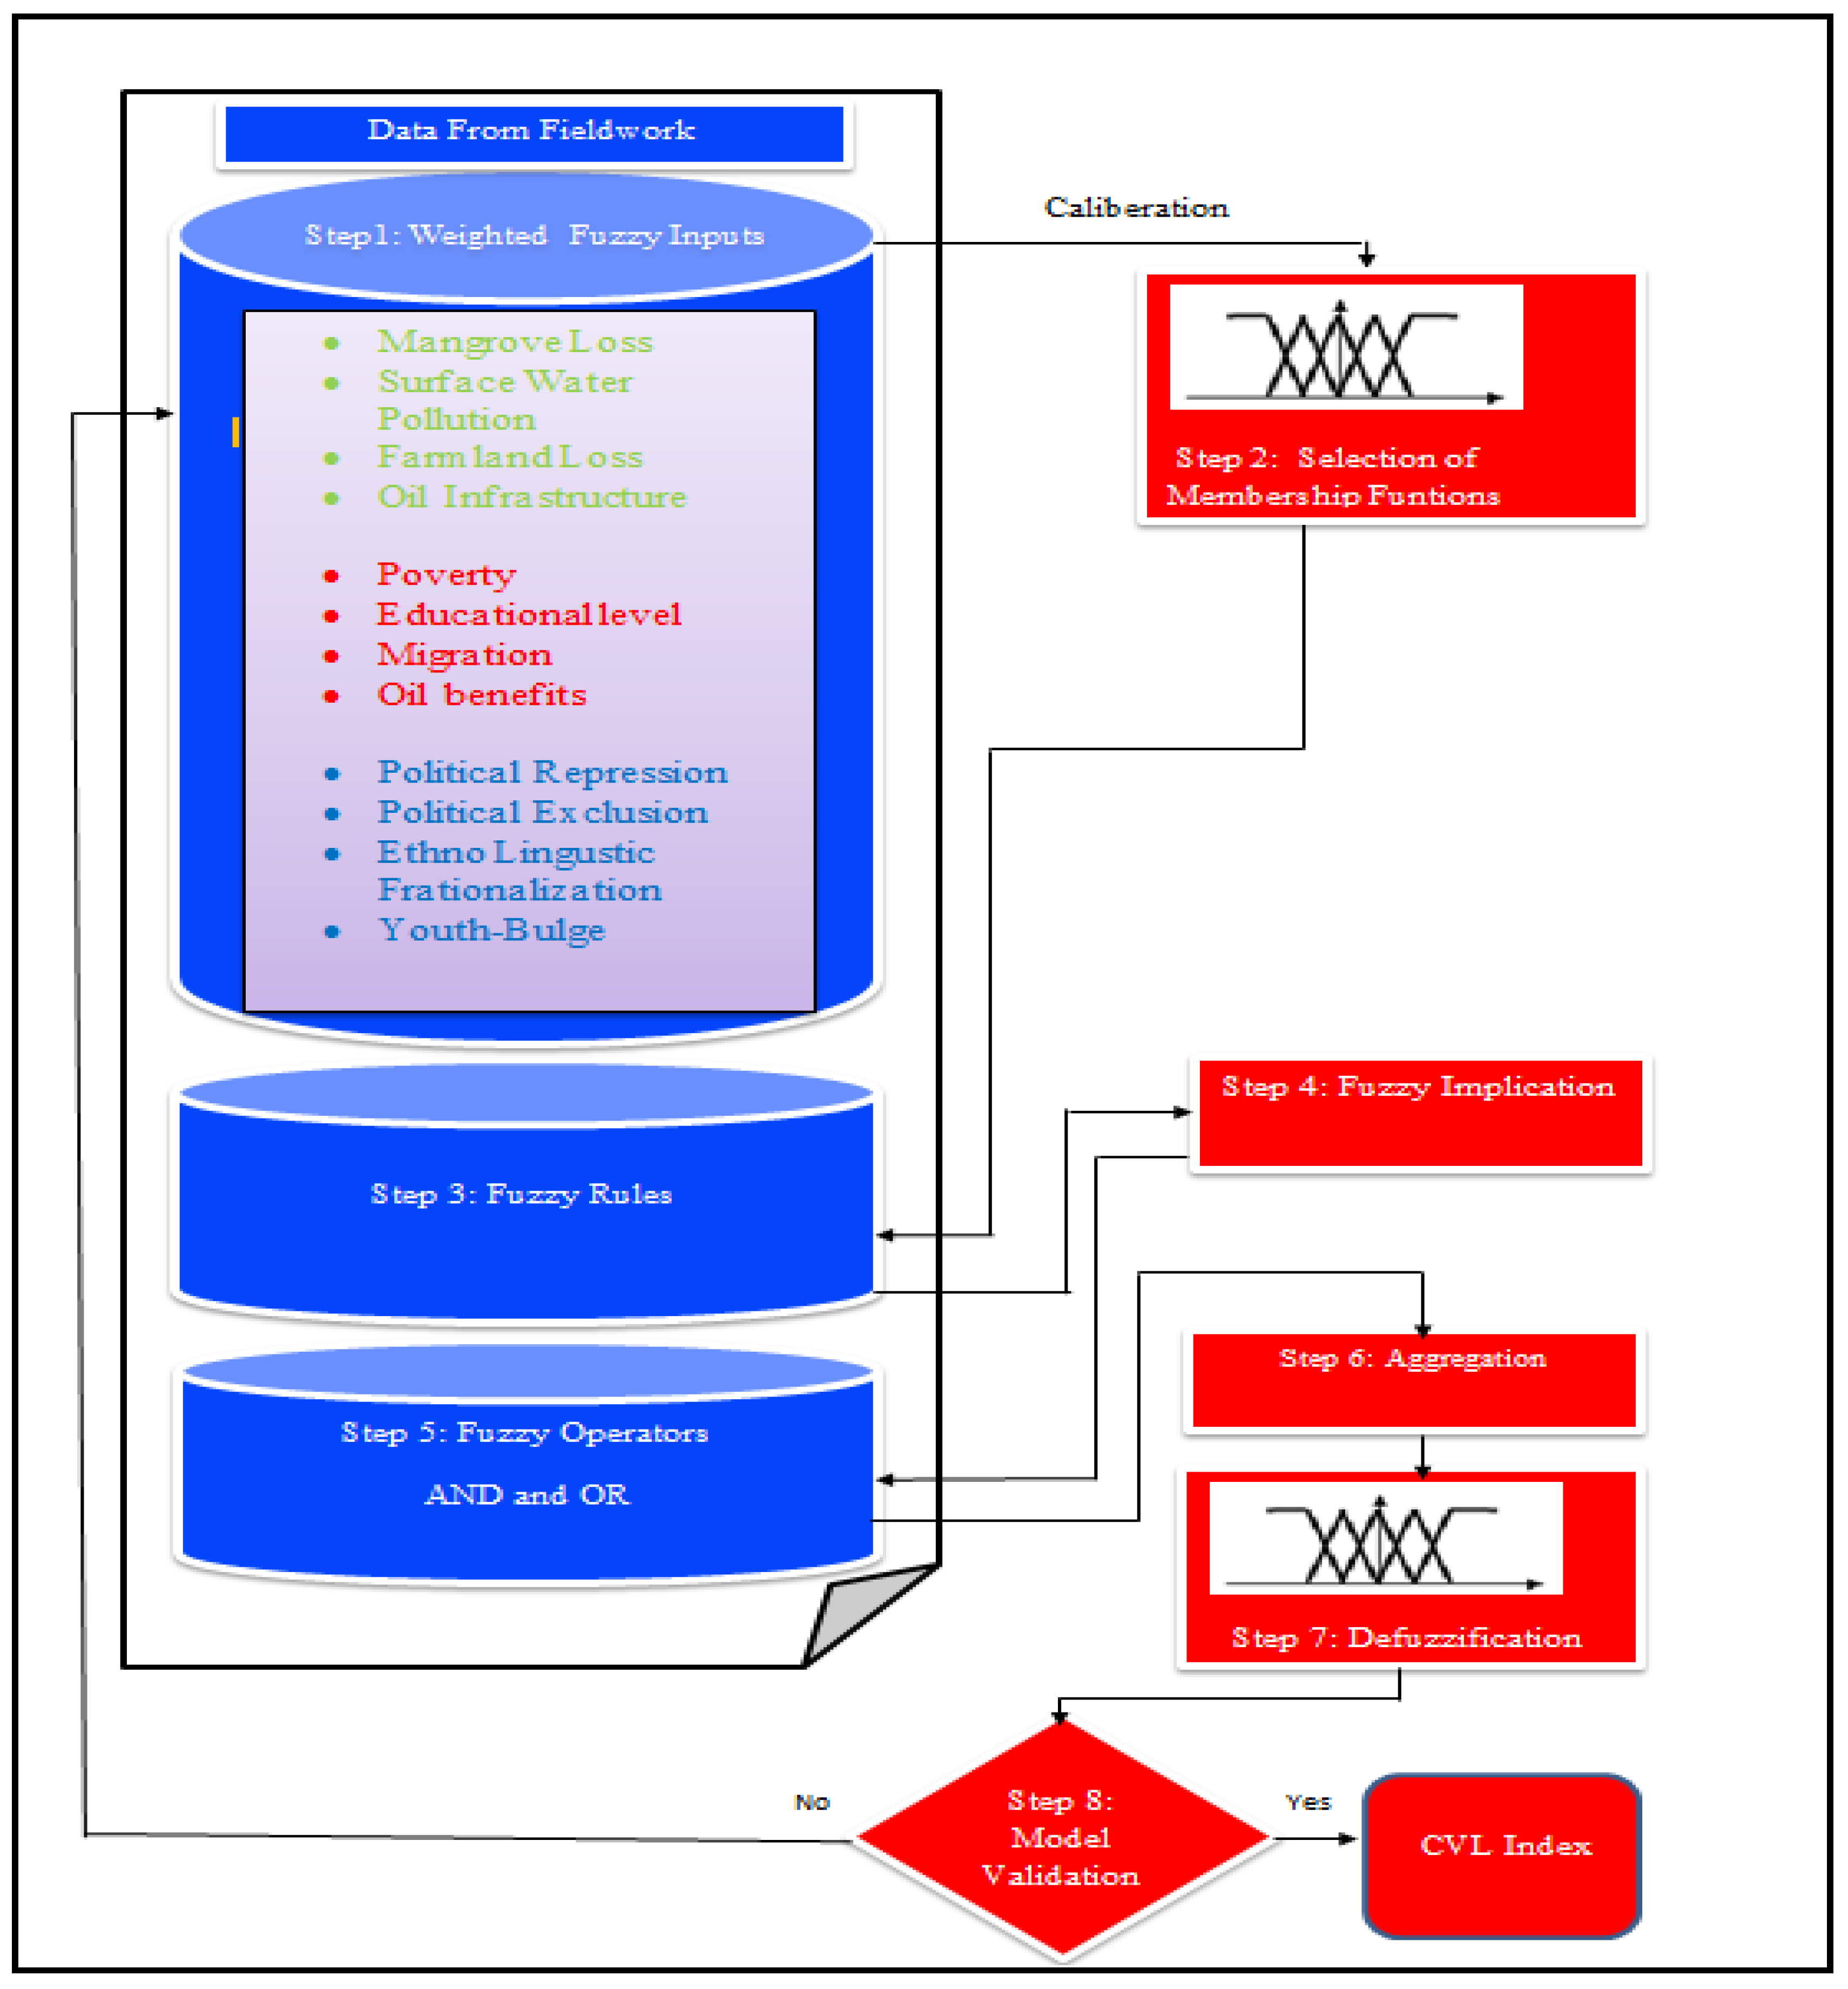
The steps followed in the modelling processes for both FLAME-CM and SEFLAME-CM, detailing the inputs and outputs are outlines in this section. A visual representation of the integration and modeling steps can be found in
Figure 3.
2.2.1. Integrating Qualitative and Quantitative Data.
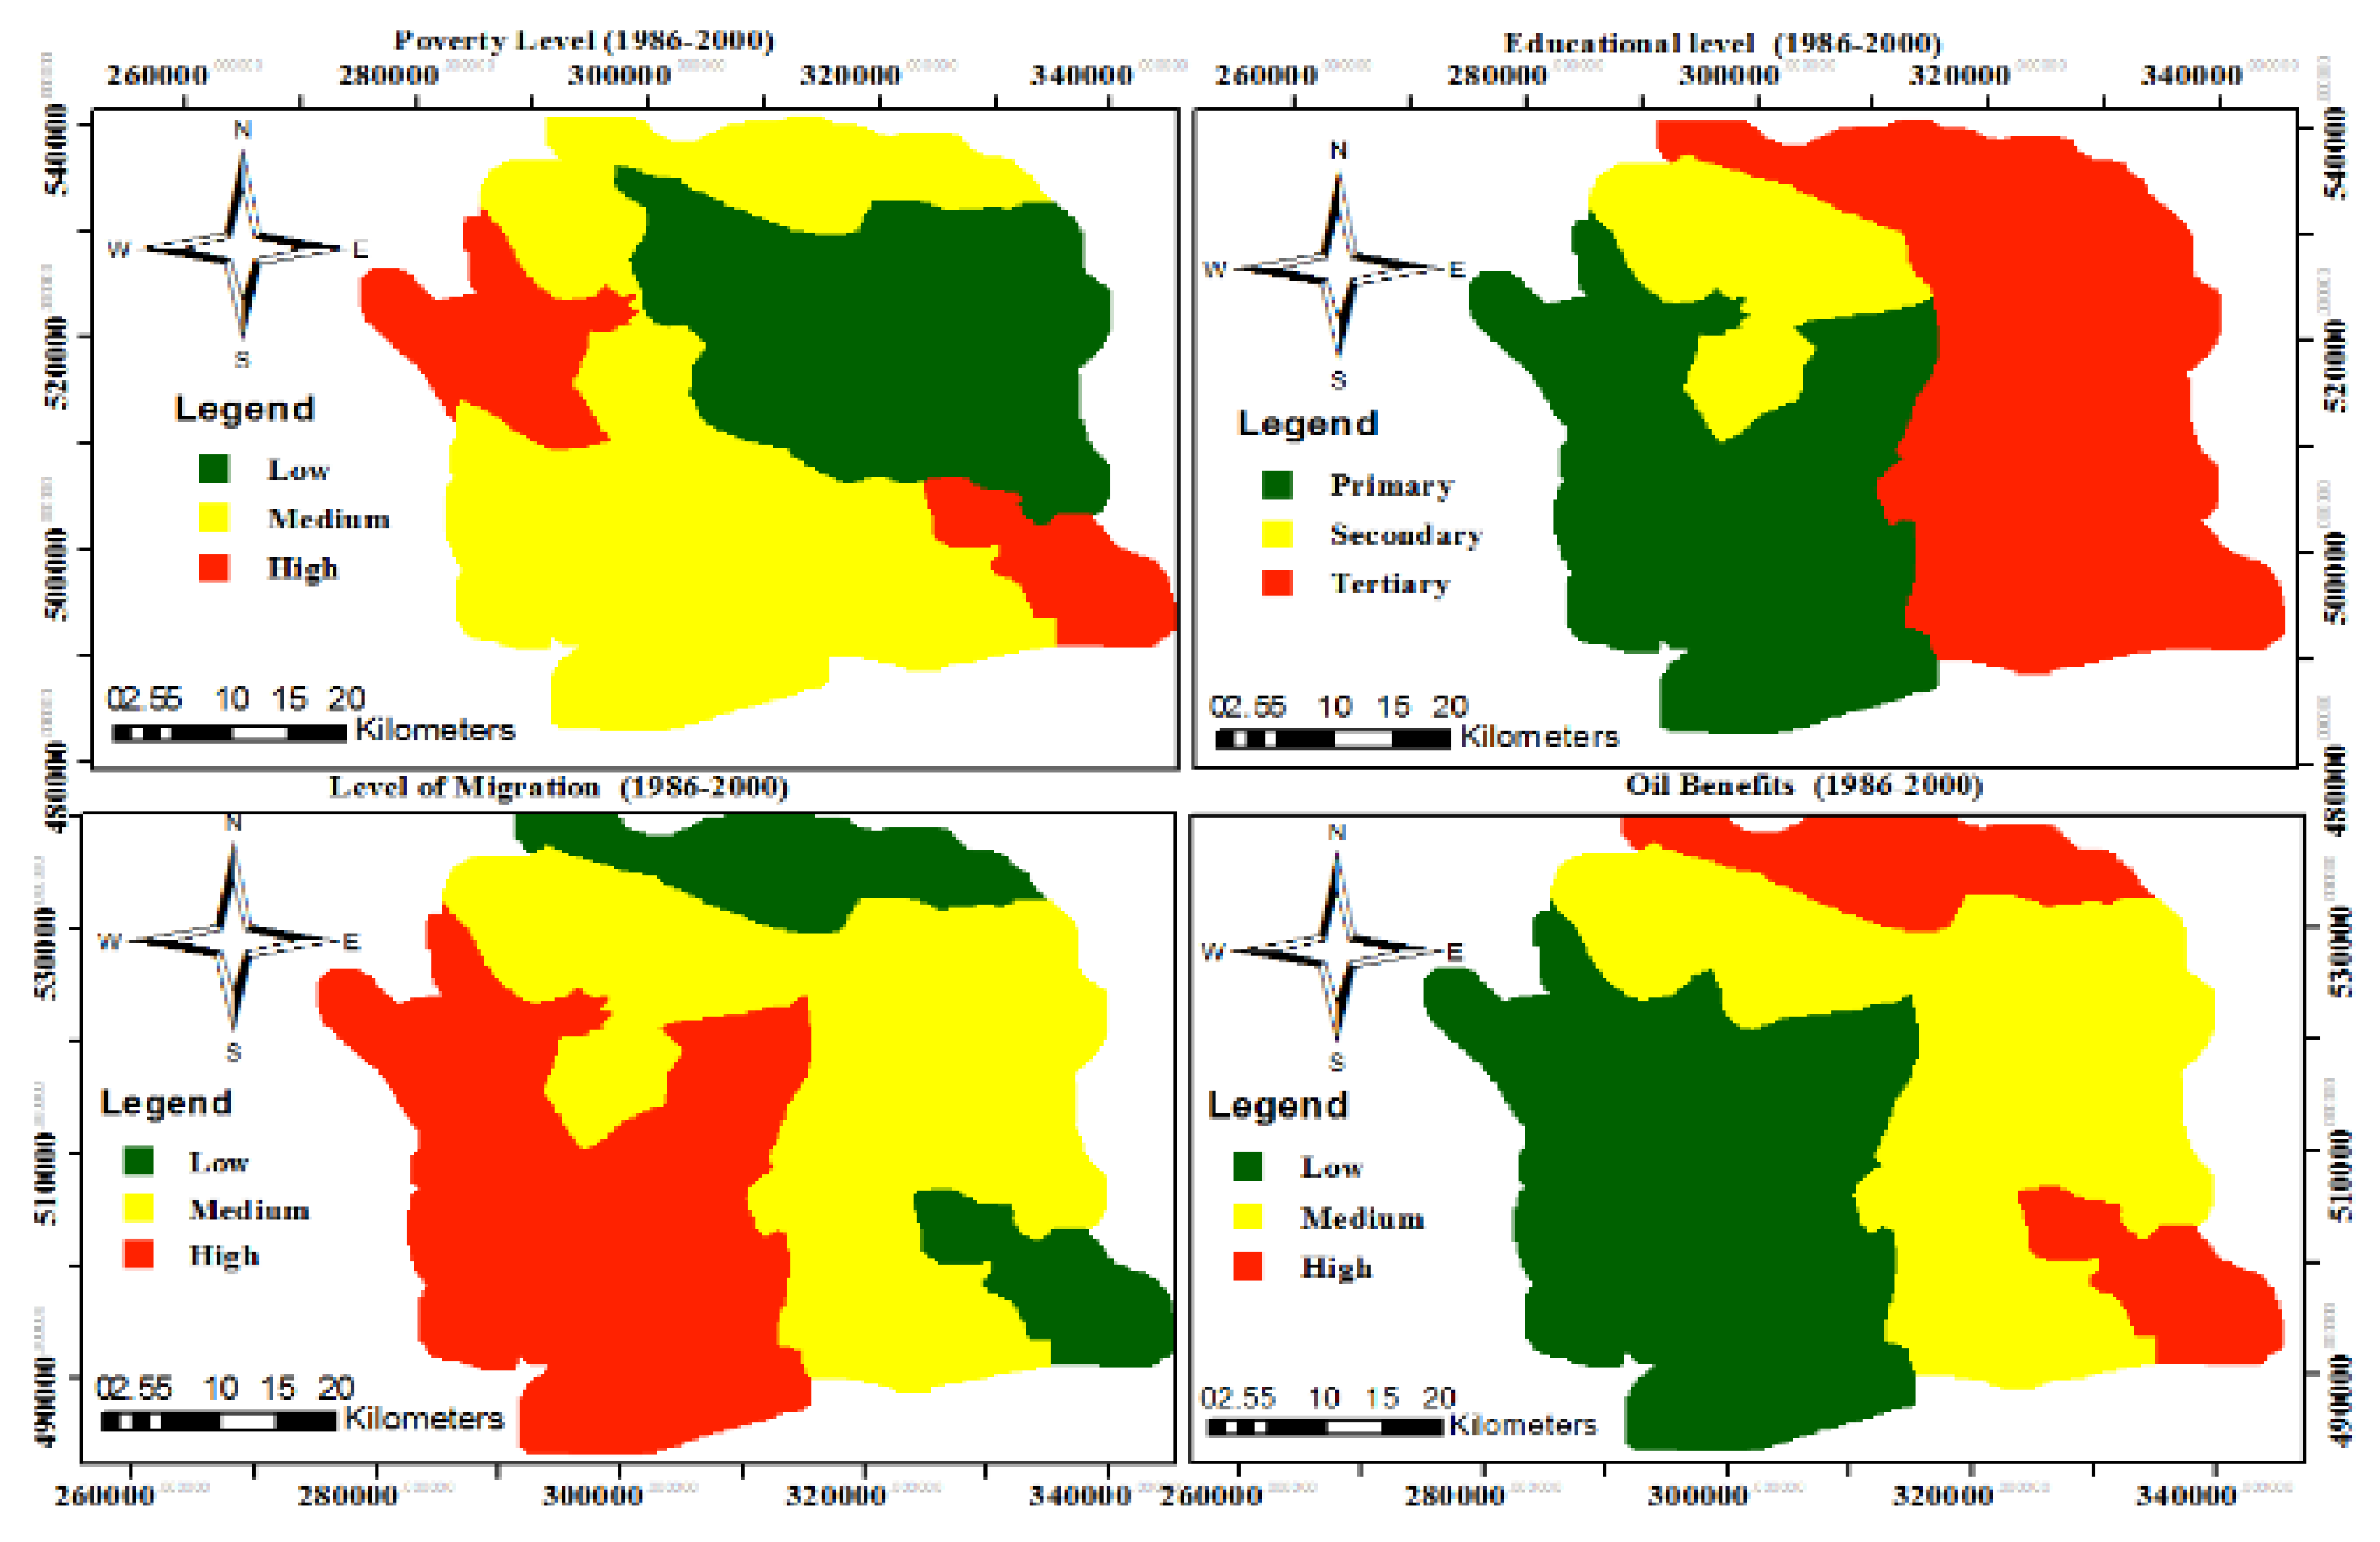
The language and statements provided by the actors can be linked to quantitative modeling.This integration occurred in two key steps: First, the factors such as socio-economic and the political categories were derived from interviews, then secondary data sources. Second, the input variables were weighted by the actors. The weights (see Equations 1 and 2) for example were derived from a questionnaire survey and integrated into the measured distances to resources from a village center and the collected secondary data.
2.2.2. Inputting the Variables and Model Implementation Steps
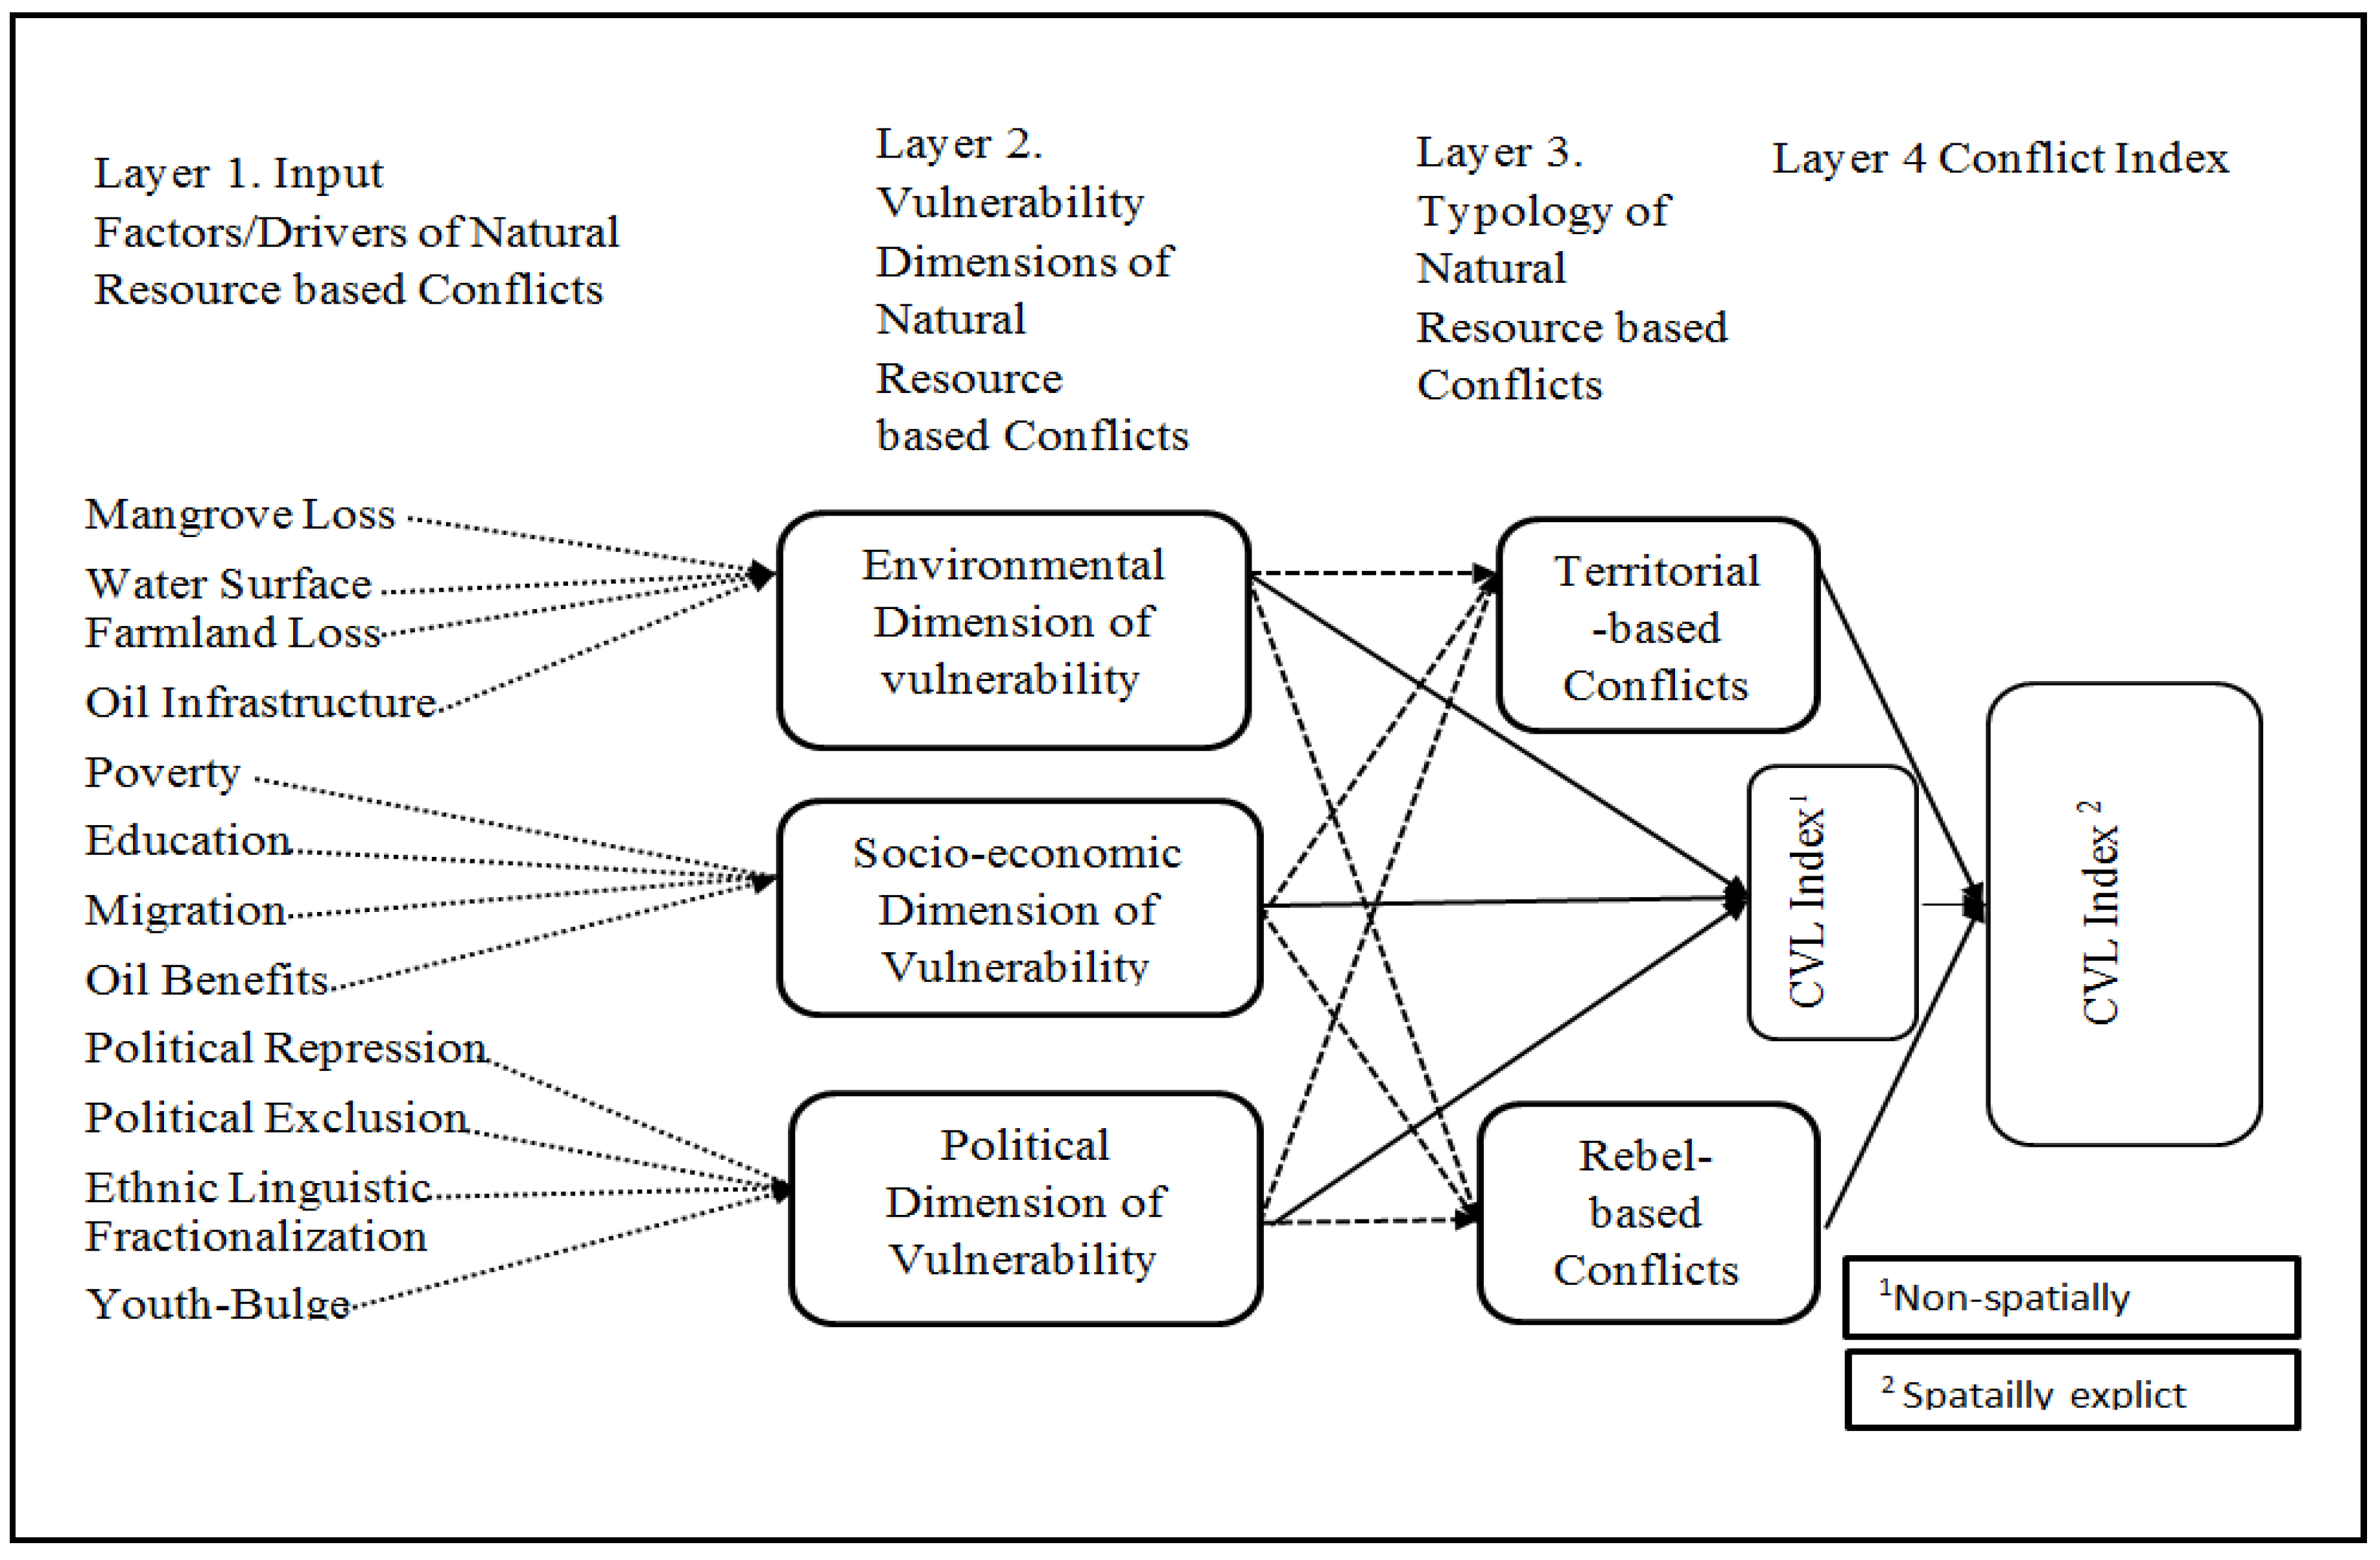
To integrate the local knowledge, model inputs were weighted (see, Equations 1). Then each layer of output forms the input layer of the next input. See
Figure 6 for the simplified hierarchical structure of model input data layers 1-4.
Figure 3.
Architecture of the integration of field data into the SEFLAME-CM design steps.
Figure 3.
Architecture of the integration of field data into the SEFLAME-CM design steps.
Layer1: Initial input parameters based on weights from questionnaire survey.
This was integrated into the measured distances using scale (0—10)
(See Equations 1 and 2, applicable to deriving the inputs of mangrove
R = Range [0 10]
N = Number of actors giving the weight among the actors in a village)
MLdist1 = Mangrove loss distance (fuzzy parameter category 1)
MLdist2 Mangrove loss distance (fuzzy parameter category 2)
MLdist3 = Mangrove loss distance (fuzzy parameter category 3)
Layer2: The three dimensions of conflict drivers. For CVL Index for environmental drivers (Iev), and CVL Index for socio-economic drivers (Ise) and the CVL Index for political drivers (Ipo), Equation 3 applies for example:
where
YIev = Conflicts index value for environment (ev)
Ev = Environmental drivers of conflicts
evi = Value of the membership function of the output fuzzy set, ev in rule i
I = Representing rule, I of the ev inputs
= Value of the corresponding membership area, indicating the degree to which rule i is fired
Layer 3: Introducing the two typologies of conflicts on dimensions of environmental, socio-economic, and political drivers. The following were derived using equation such as Appendix A.1
CVL Index-environmental drivers of conflicts vs. rebel-based conflicts (IevRBC)
CVL Index Socio-economic drivers vs. rebel-based conflicts (YIseRBC)
CVL Index Political drivers vs. rebel-based conflicts (YIpoRBC).
The same approach was used to derive the following:
CVL Index- environmental drivers of conflicts vs. territorial-based conflicts (IevTBC),
CVL Index- socio-economic drivers vs. territorial-based conflicts (YIseTBC) and
CVL Index- political drivers vs. territorial -based conflicts (YIpoTBC).
CVL Index for all rebel-based conflict typology was derived as an average of the YIevRBC, YIseRBC, and YIpoRBC using Appendix A.2. Similar model was used to derive the CVL Index for all territorial-based conflict typology as an average of YIevTBC, YIseTBC, and YIpoTBC
Layer 4: The CVL Indices (non-spatially explicit and the final spatially explicit CVL Index).
The CVL Index is based on FLAME-CM (non-spatially explicit). It is the average output of layer2 (CVL Index 1), See Appendix A.3.
The result of SEFLAME-CM (spatially explicit) is the average of the layer 3 output. This was derived using Equation 4below:
where
CVL Index2 = Conflicts Vulnerability Likeliness Index -spatially explicit [0 1]
YIRBC = Conflicts index for rebel-based conflicts
YITBC = Conflicts Index for territorial based conflicts
n = Number of conflict typology
2.2.3. Membership Functions (MFs) Evaluation
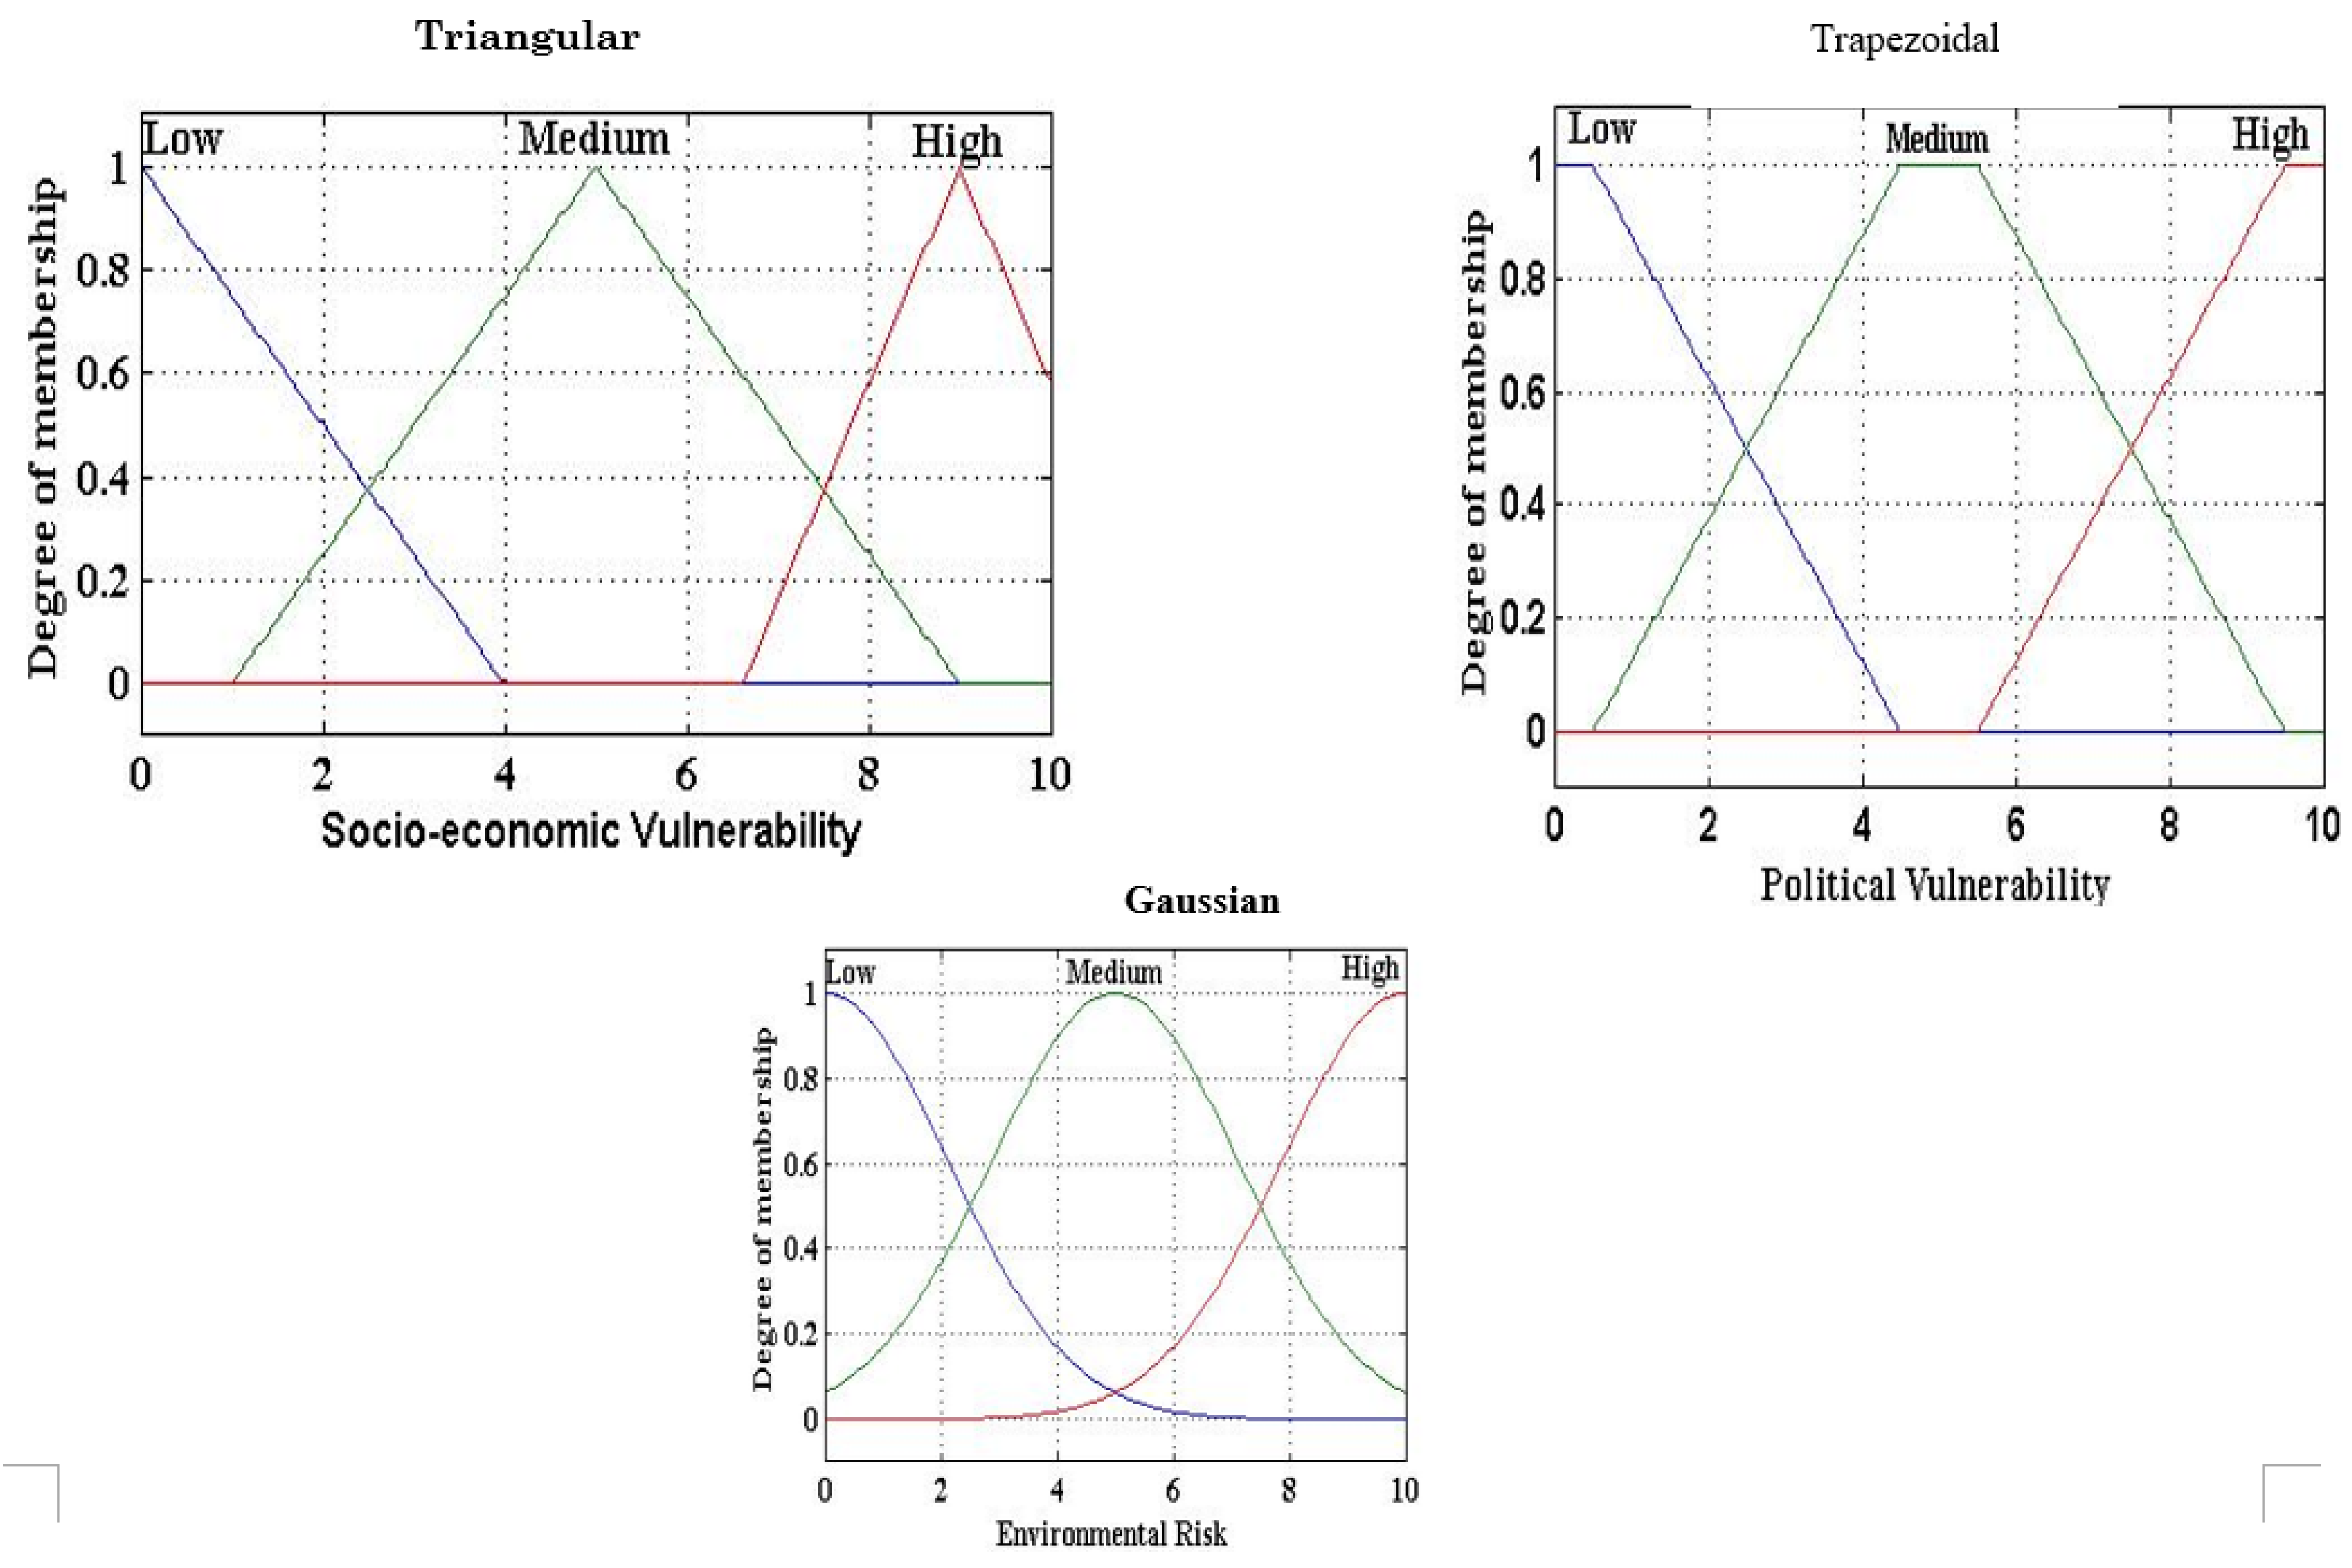
The membership functions (MFs) are very important in fuzzy logic models. The most commonly used shapes are triangular, trapezoidal, gaussian and bell-shaped membership functions[
41]. MFs were evaluated by considering the MF types such as triangular, trapezoidal, and Gaussian MFs (
Figure 10).
2.2.4. Generation of Fuzzy Rules (Translation of Linguistic Statements from Interviews in Combination with Expert Knowledge)
Logical inference should simulate the knowledge base of the problem being investigated, with the choice of the number of curves determined by the number of input variables and the number of MFs[
42]. There are four input variables in each conflict driver dimension and three MFs for each fuzzy parameter. To derive the rules, therefore, (x) raise to the number of input variables (y) i.e., x
y, is 3
4. This gave a total of 81 rules[
43].
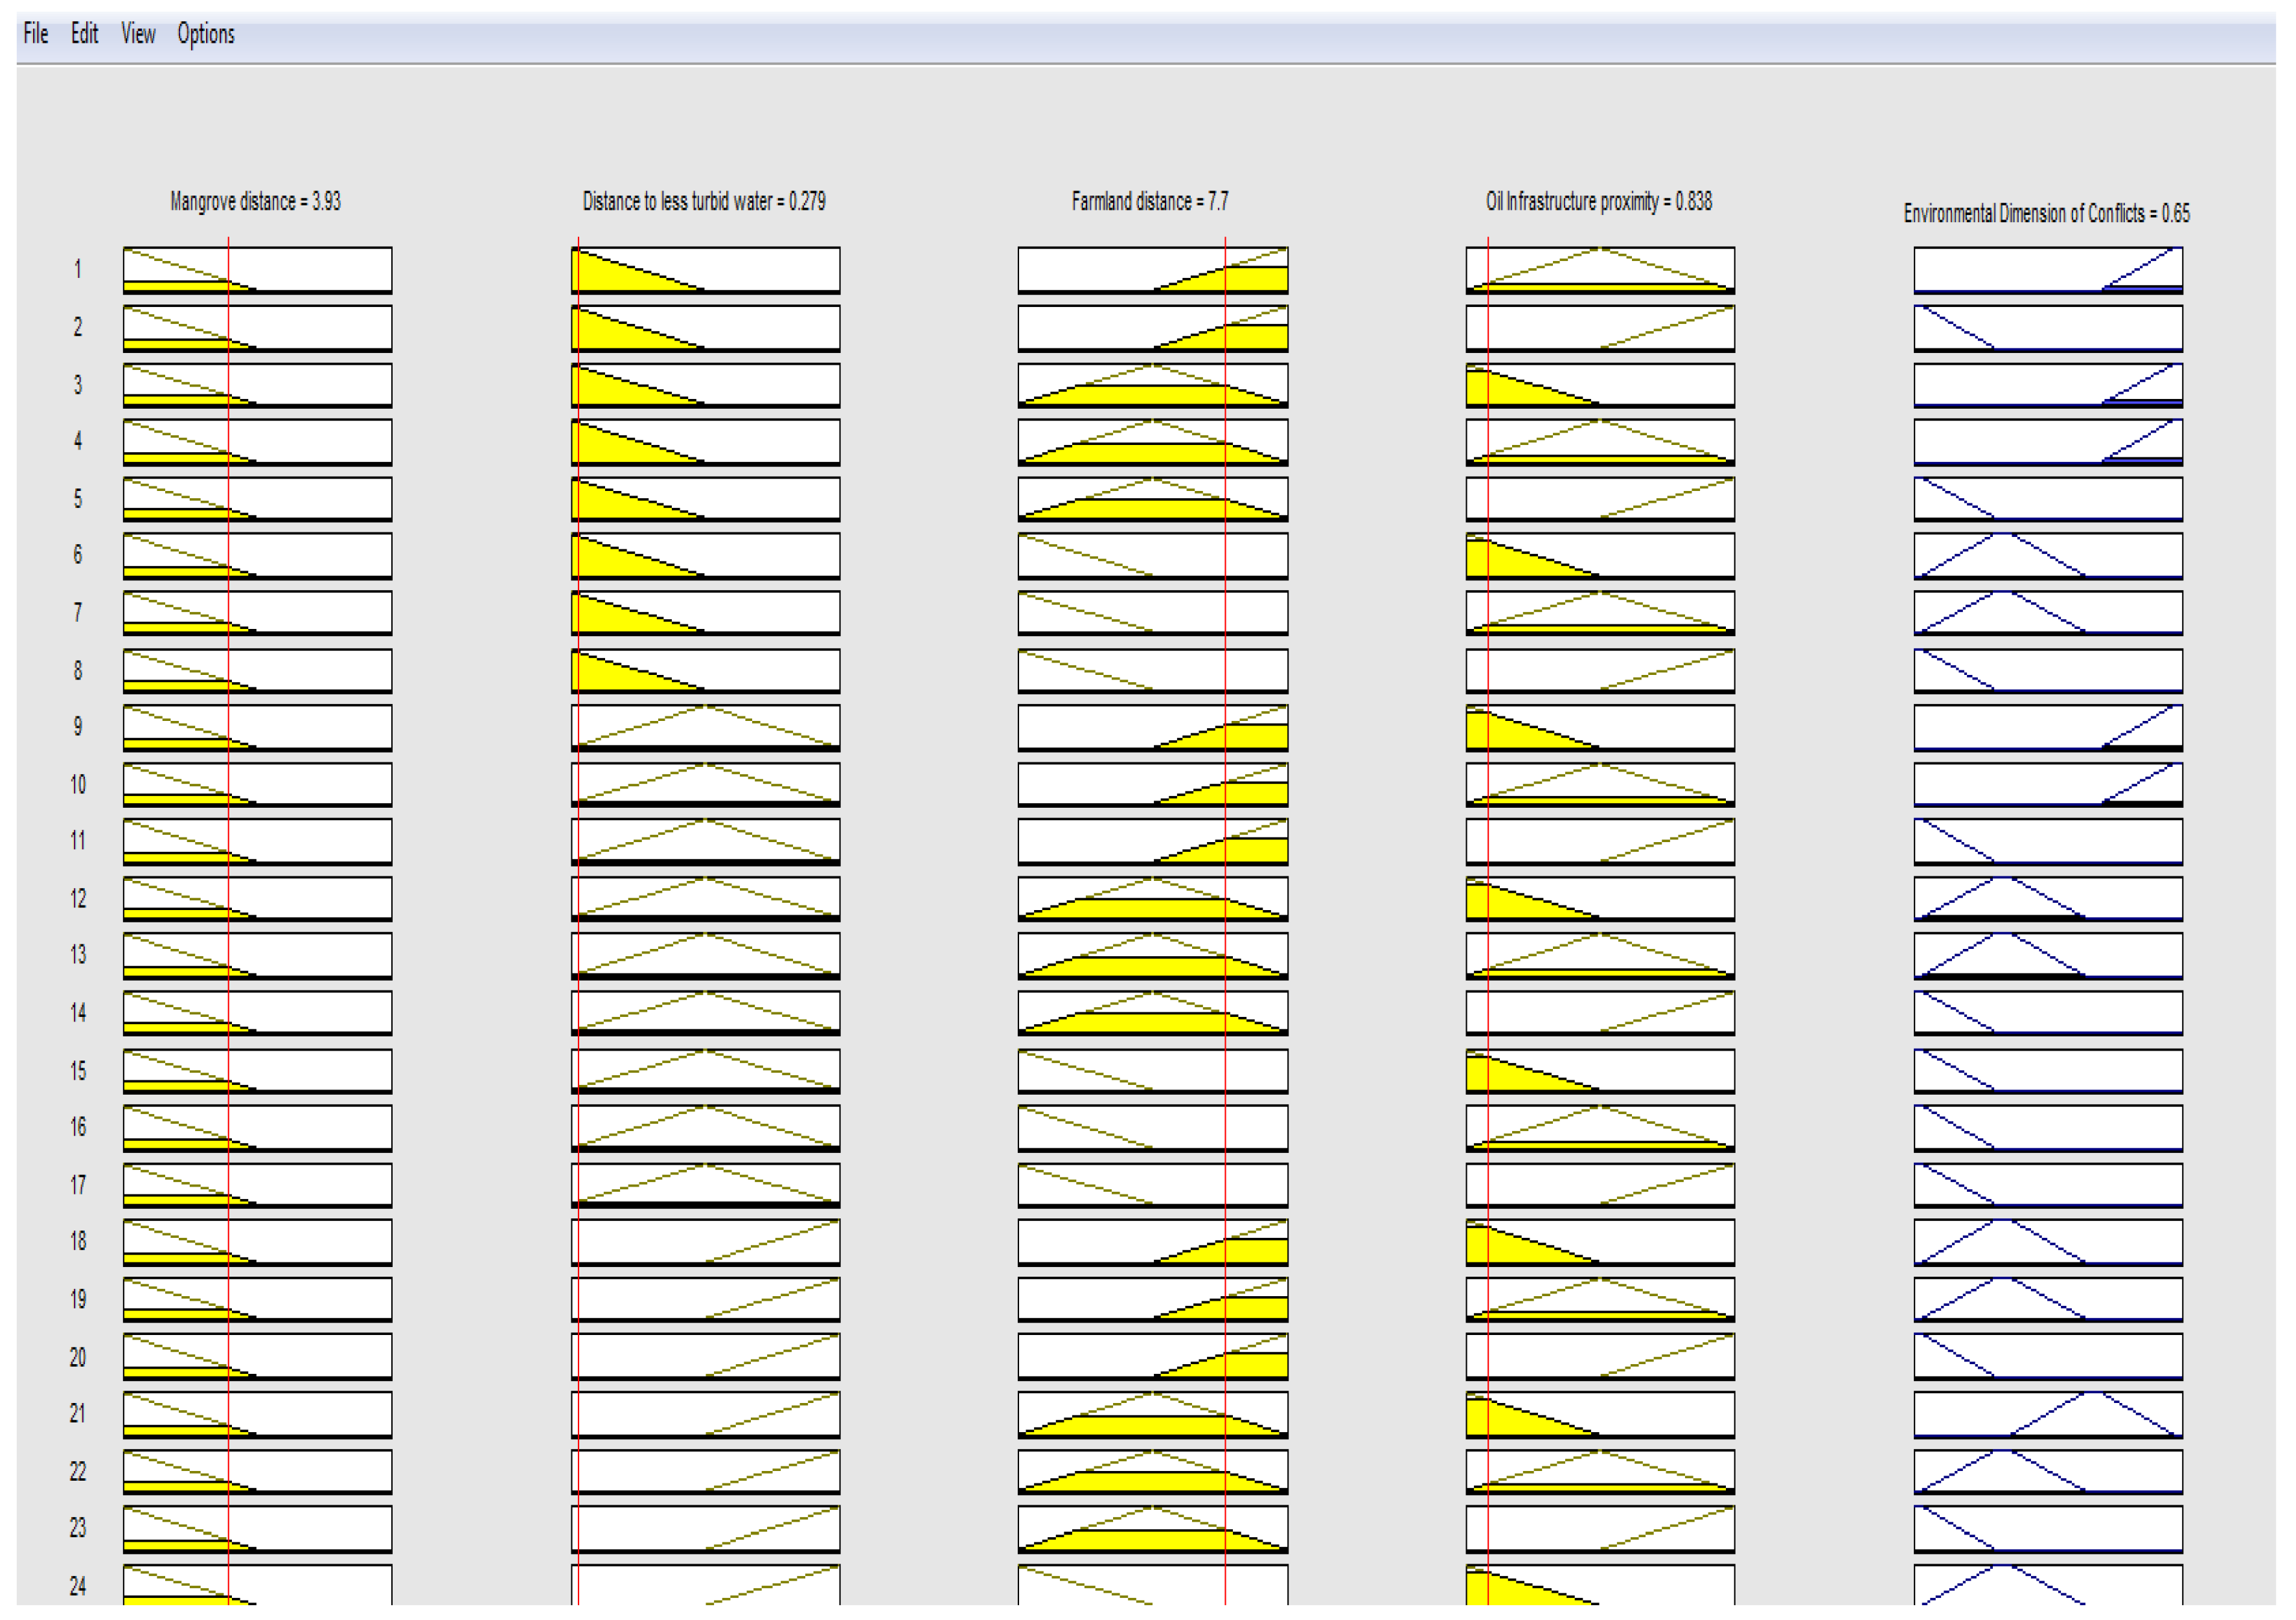
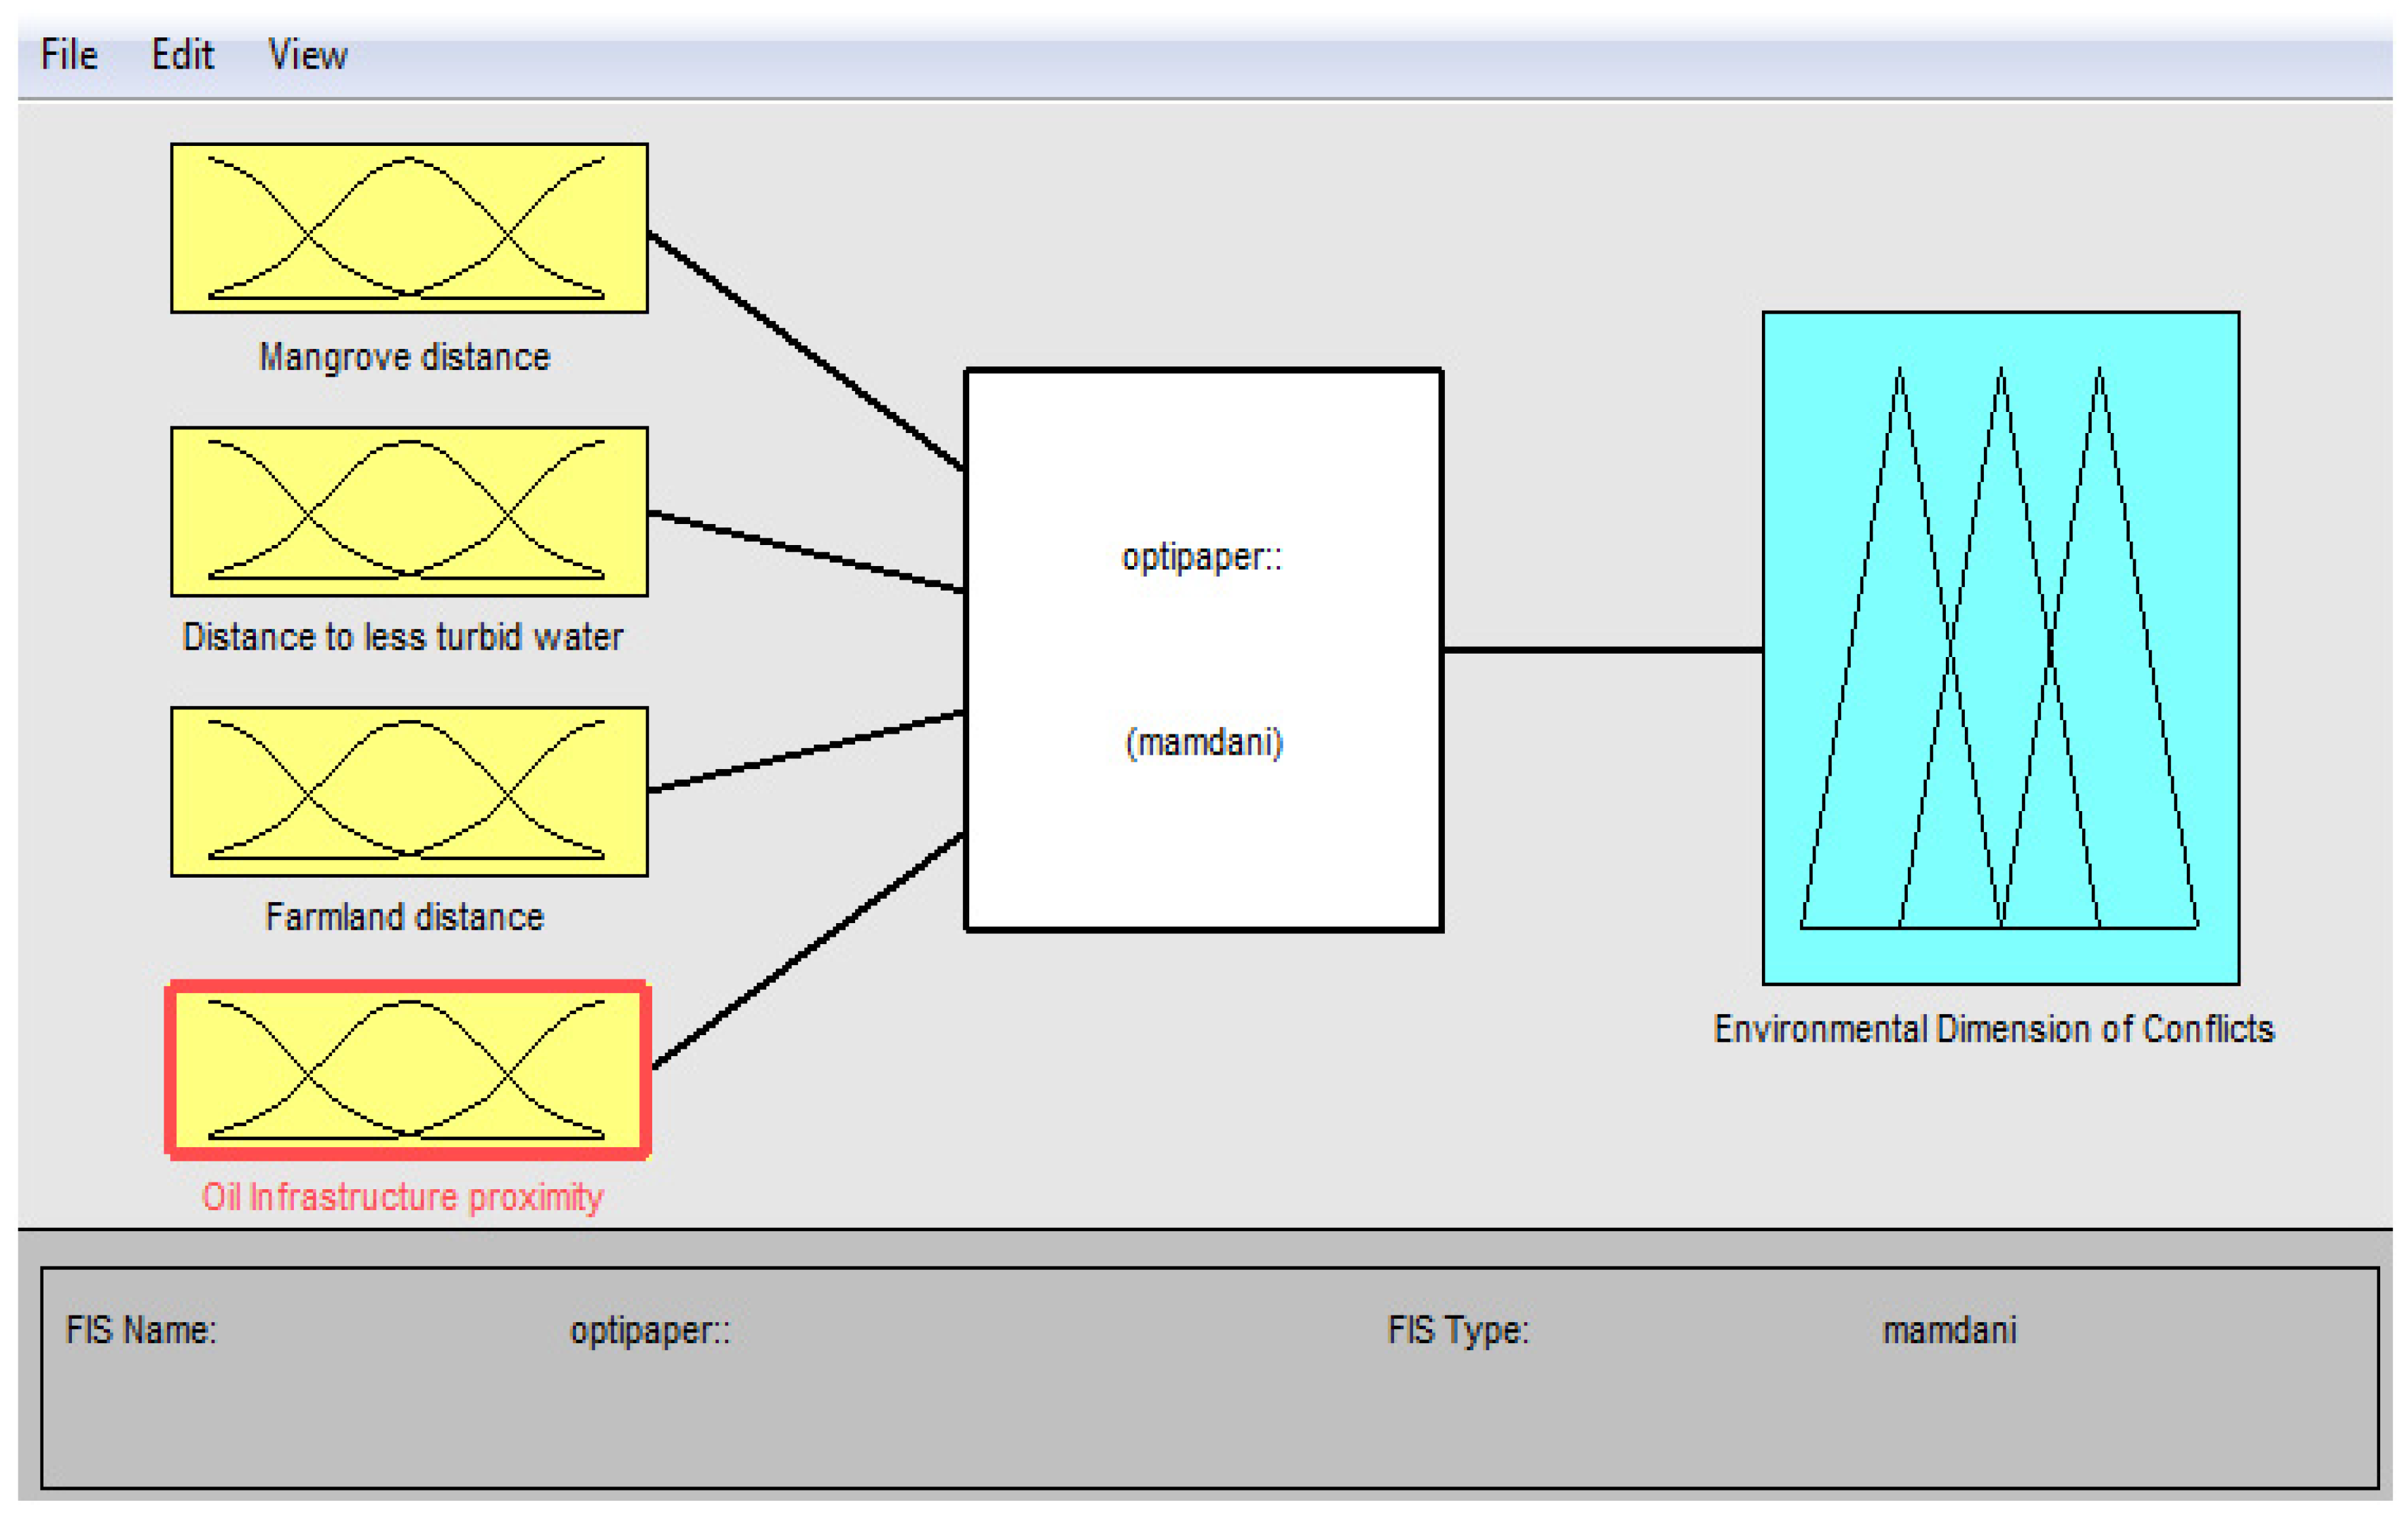
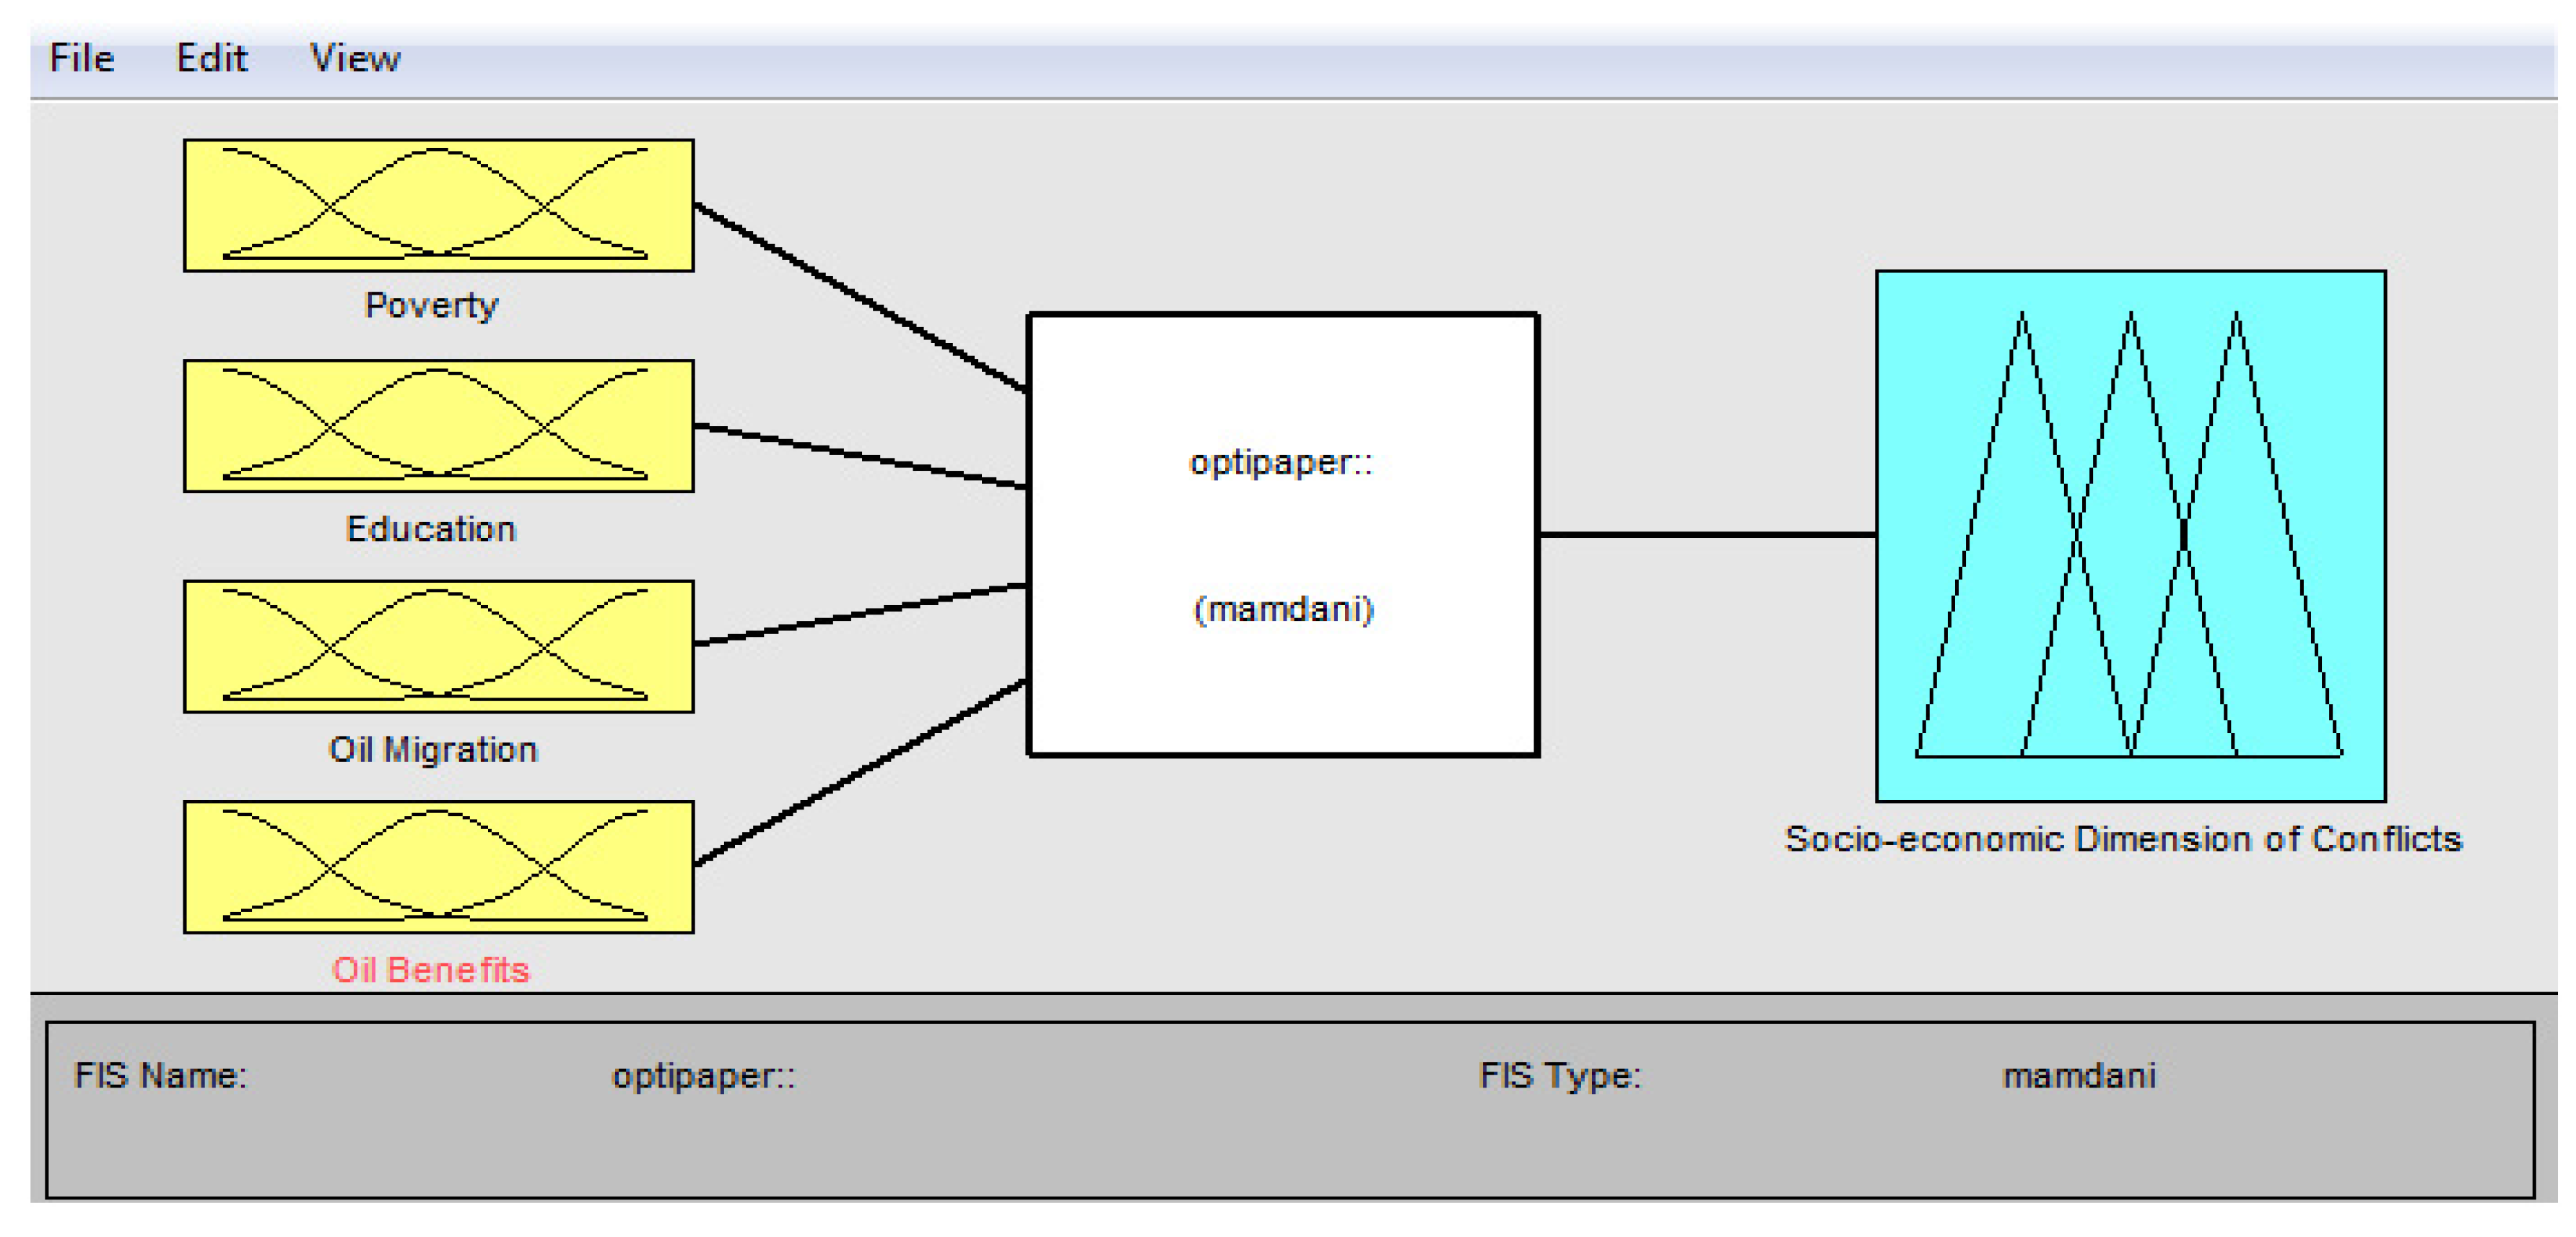
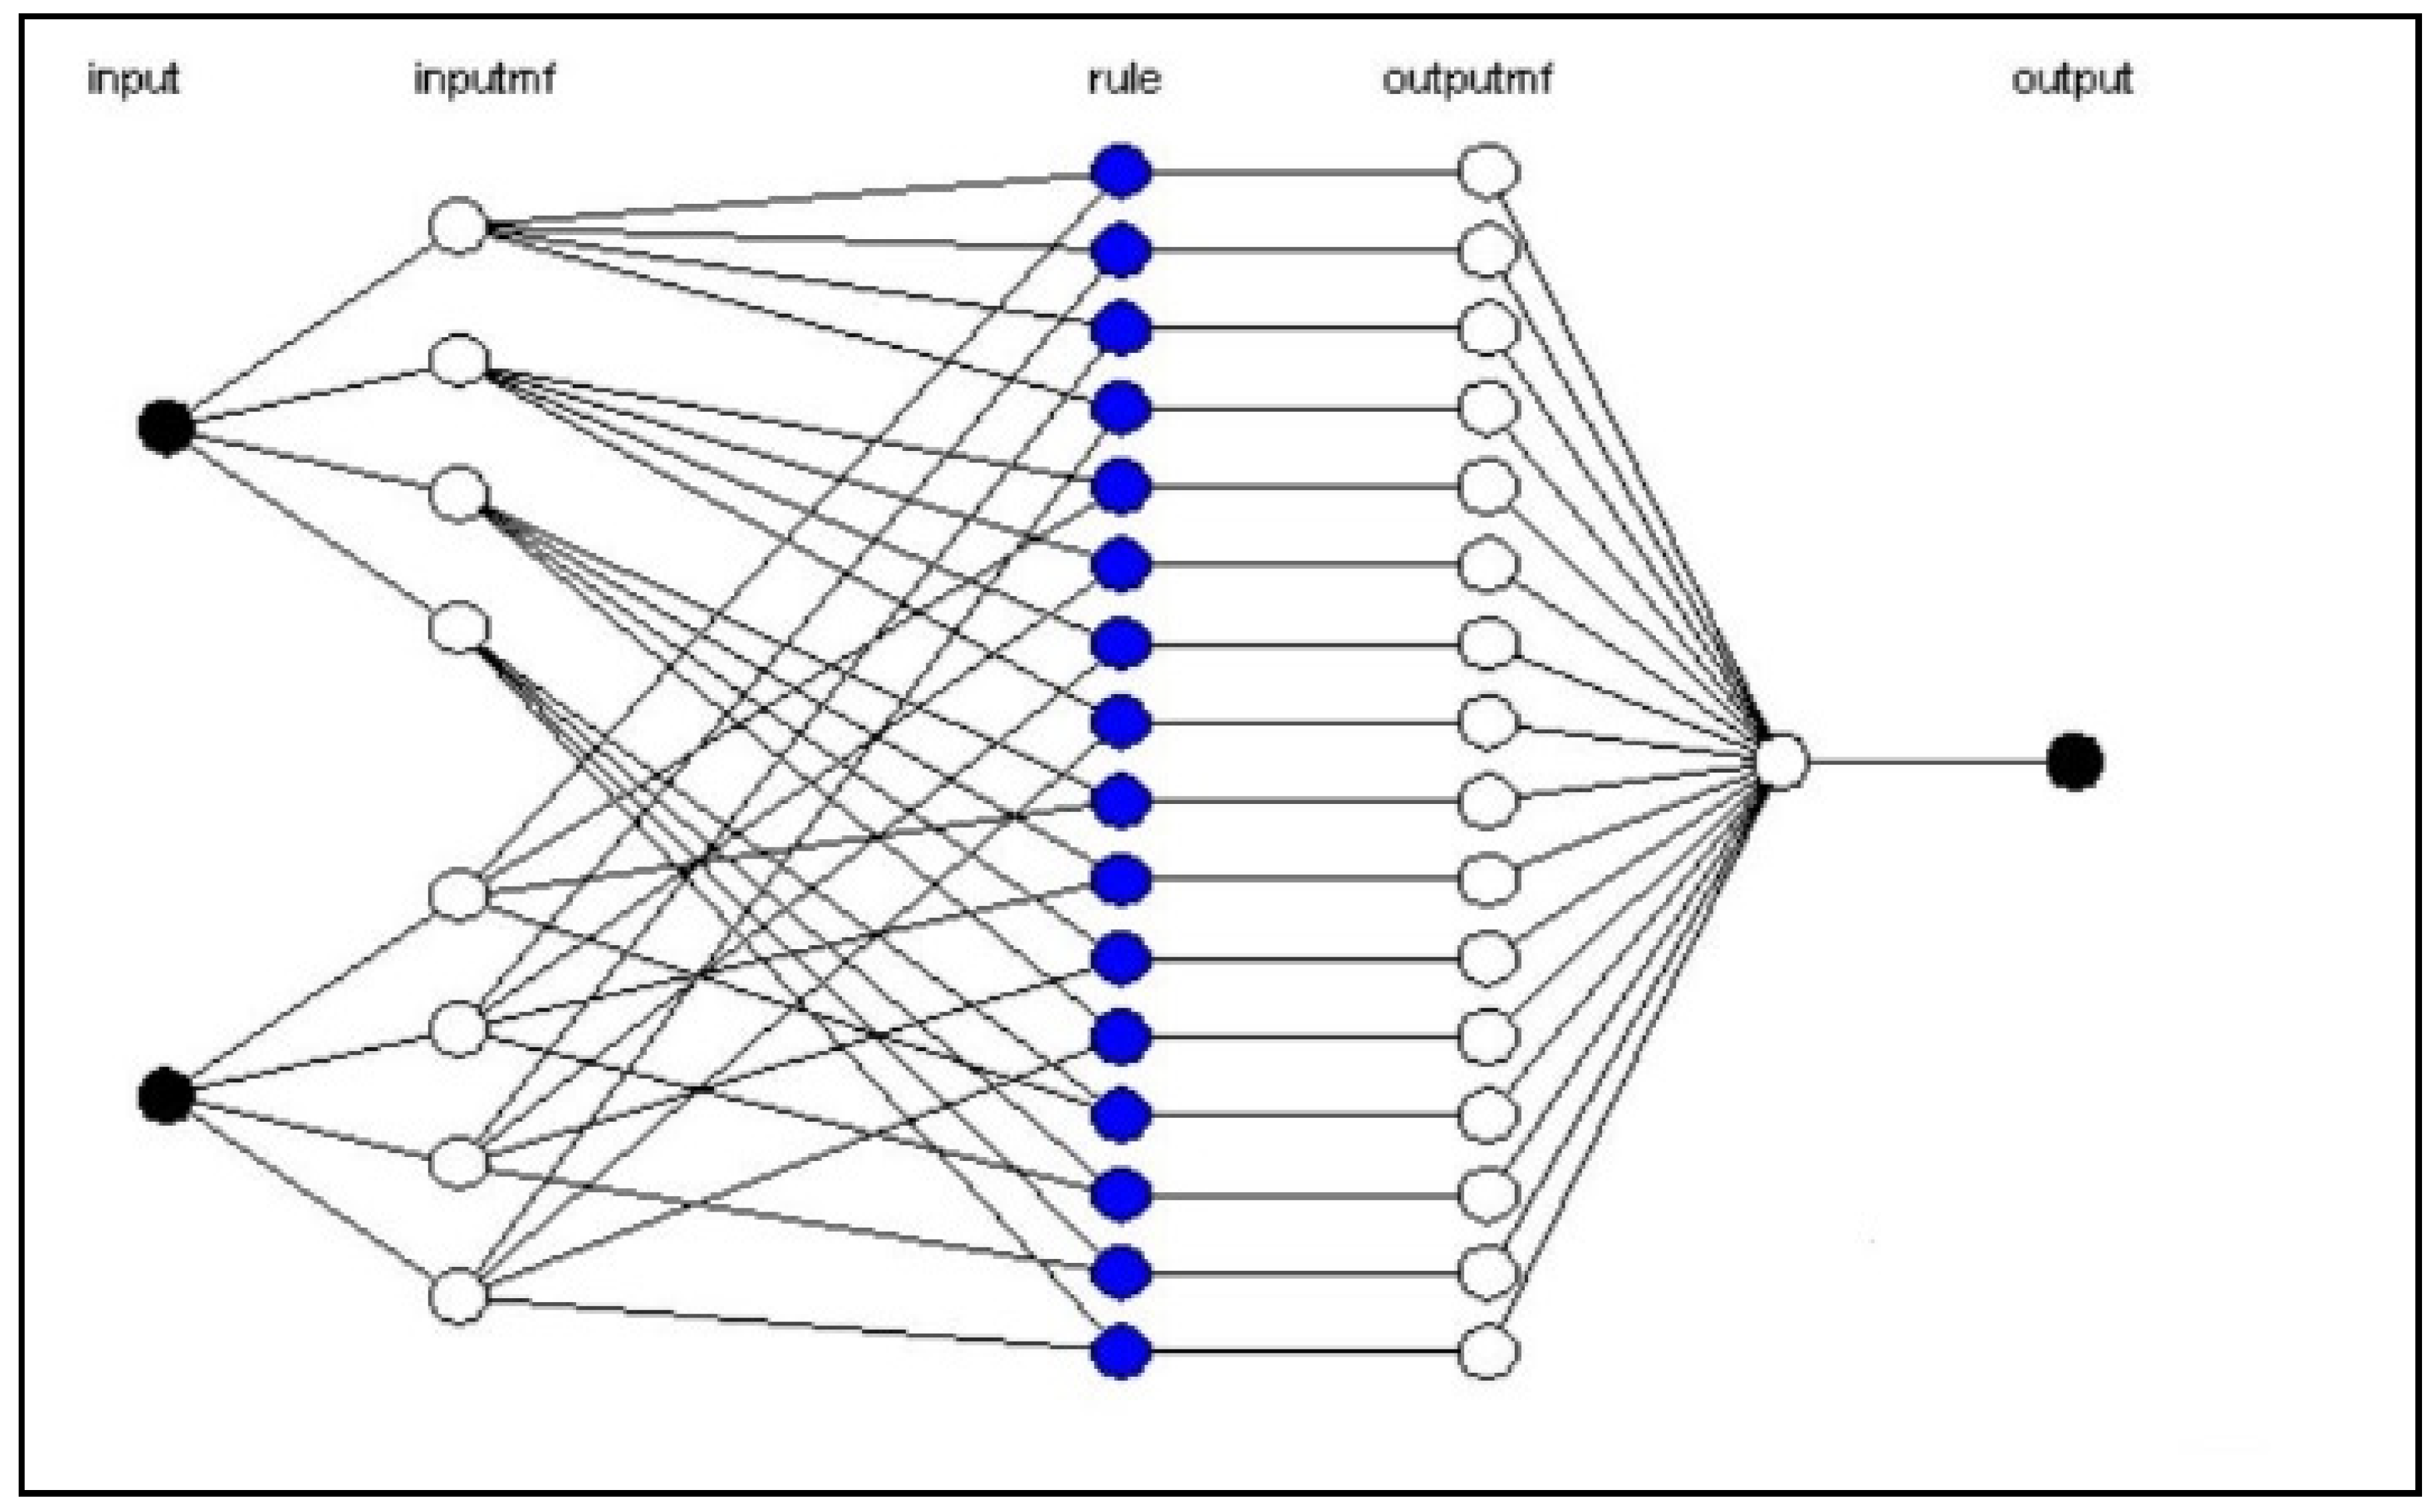
Figure 8 shows a screen-shot of sample rule viewer of SEFLAME-CM as implemented in the Simulink of MATLAB (MATLAB, 2015).
2.2.5. Fuzzy Implication Rules
After determining the rule’s weight, the next step was the fuzzy implication of the rules, which describes a relationship between inputs and outputs. Every rule has a weight (a number between 0 and 1), which is applied to the number given by the antecedents. If the weight is 1 there will be no effect at all on the implication process. But one rule is weighted relative to the others assigned to each rule. The fuzzy rule weightings are aggregated
(Equation 5). To complete the process of the implication rule, the
consequent side which is represented by a MFs and the linguistic characteristics that are attributed to it, is reshaped using a function associated with the
antecedent (a single number). The
implication is then implemented for each rule:
where
TWARAev = The total weight assigned to a rule by actors (TWARA) on environmental.
drivers’ dimension (ev)
TRWev = Total rule weight used for environmental drivers’ dimension (ev)
TNPW = Total number of possible weights of a rule in ev
R = Range [0 10]
N = Number of actors assigning a weight
2.2.6. Fuzzy Operator: OR and or AND
While implication links the antecedent and the consequent part of the rule, fuzzy operator links the segments of the antecedent. As shown in
Figure 8, each of the lines represents a rule. Fuzzy rules form an inference engine (integrative component) in fuzzy modeling and are combined with the fuzzy operators[
42]. A few other fuzzy operators exists[
44]. For examples, suppose input fuzzy maps A, B and C with
,
and
, respectively, are membership values in each of their attributes and with
WA,
WB and
WC, as map weights, the Fuzzy AND (FA) operator and output fuzzy values,
combination are obtained[
42]. Two inbuilt fuzzy logic model in MATLAB are used: OR and AND (refer to result section in section 3)
2.2.7. Aggregation of Outputs
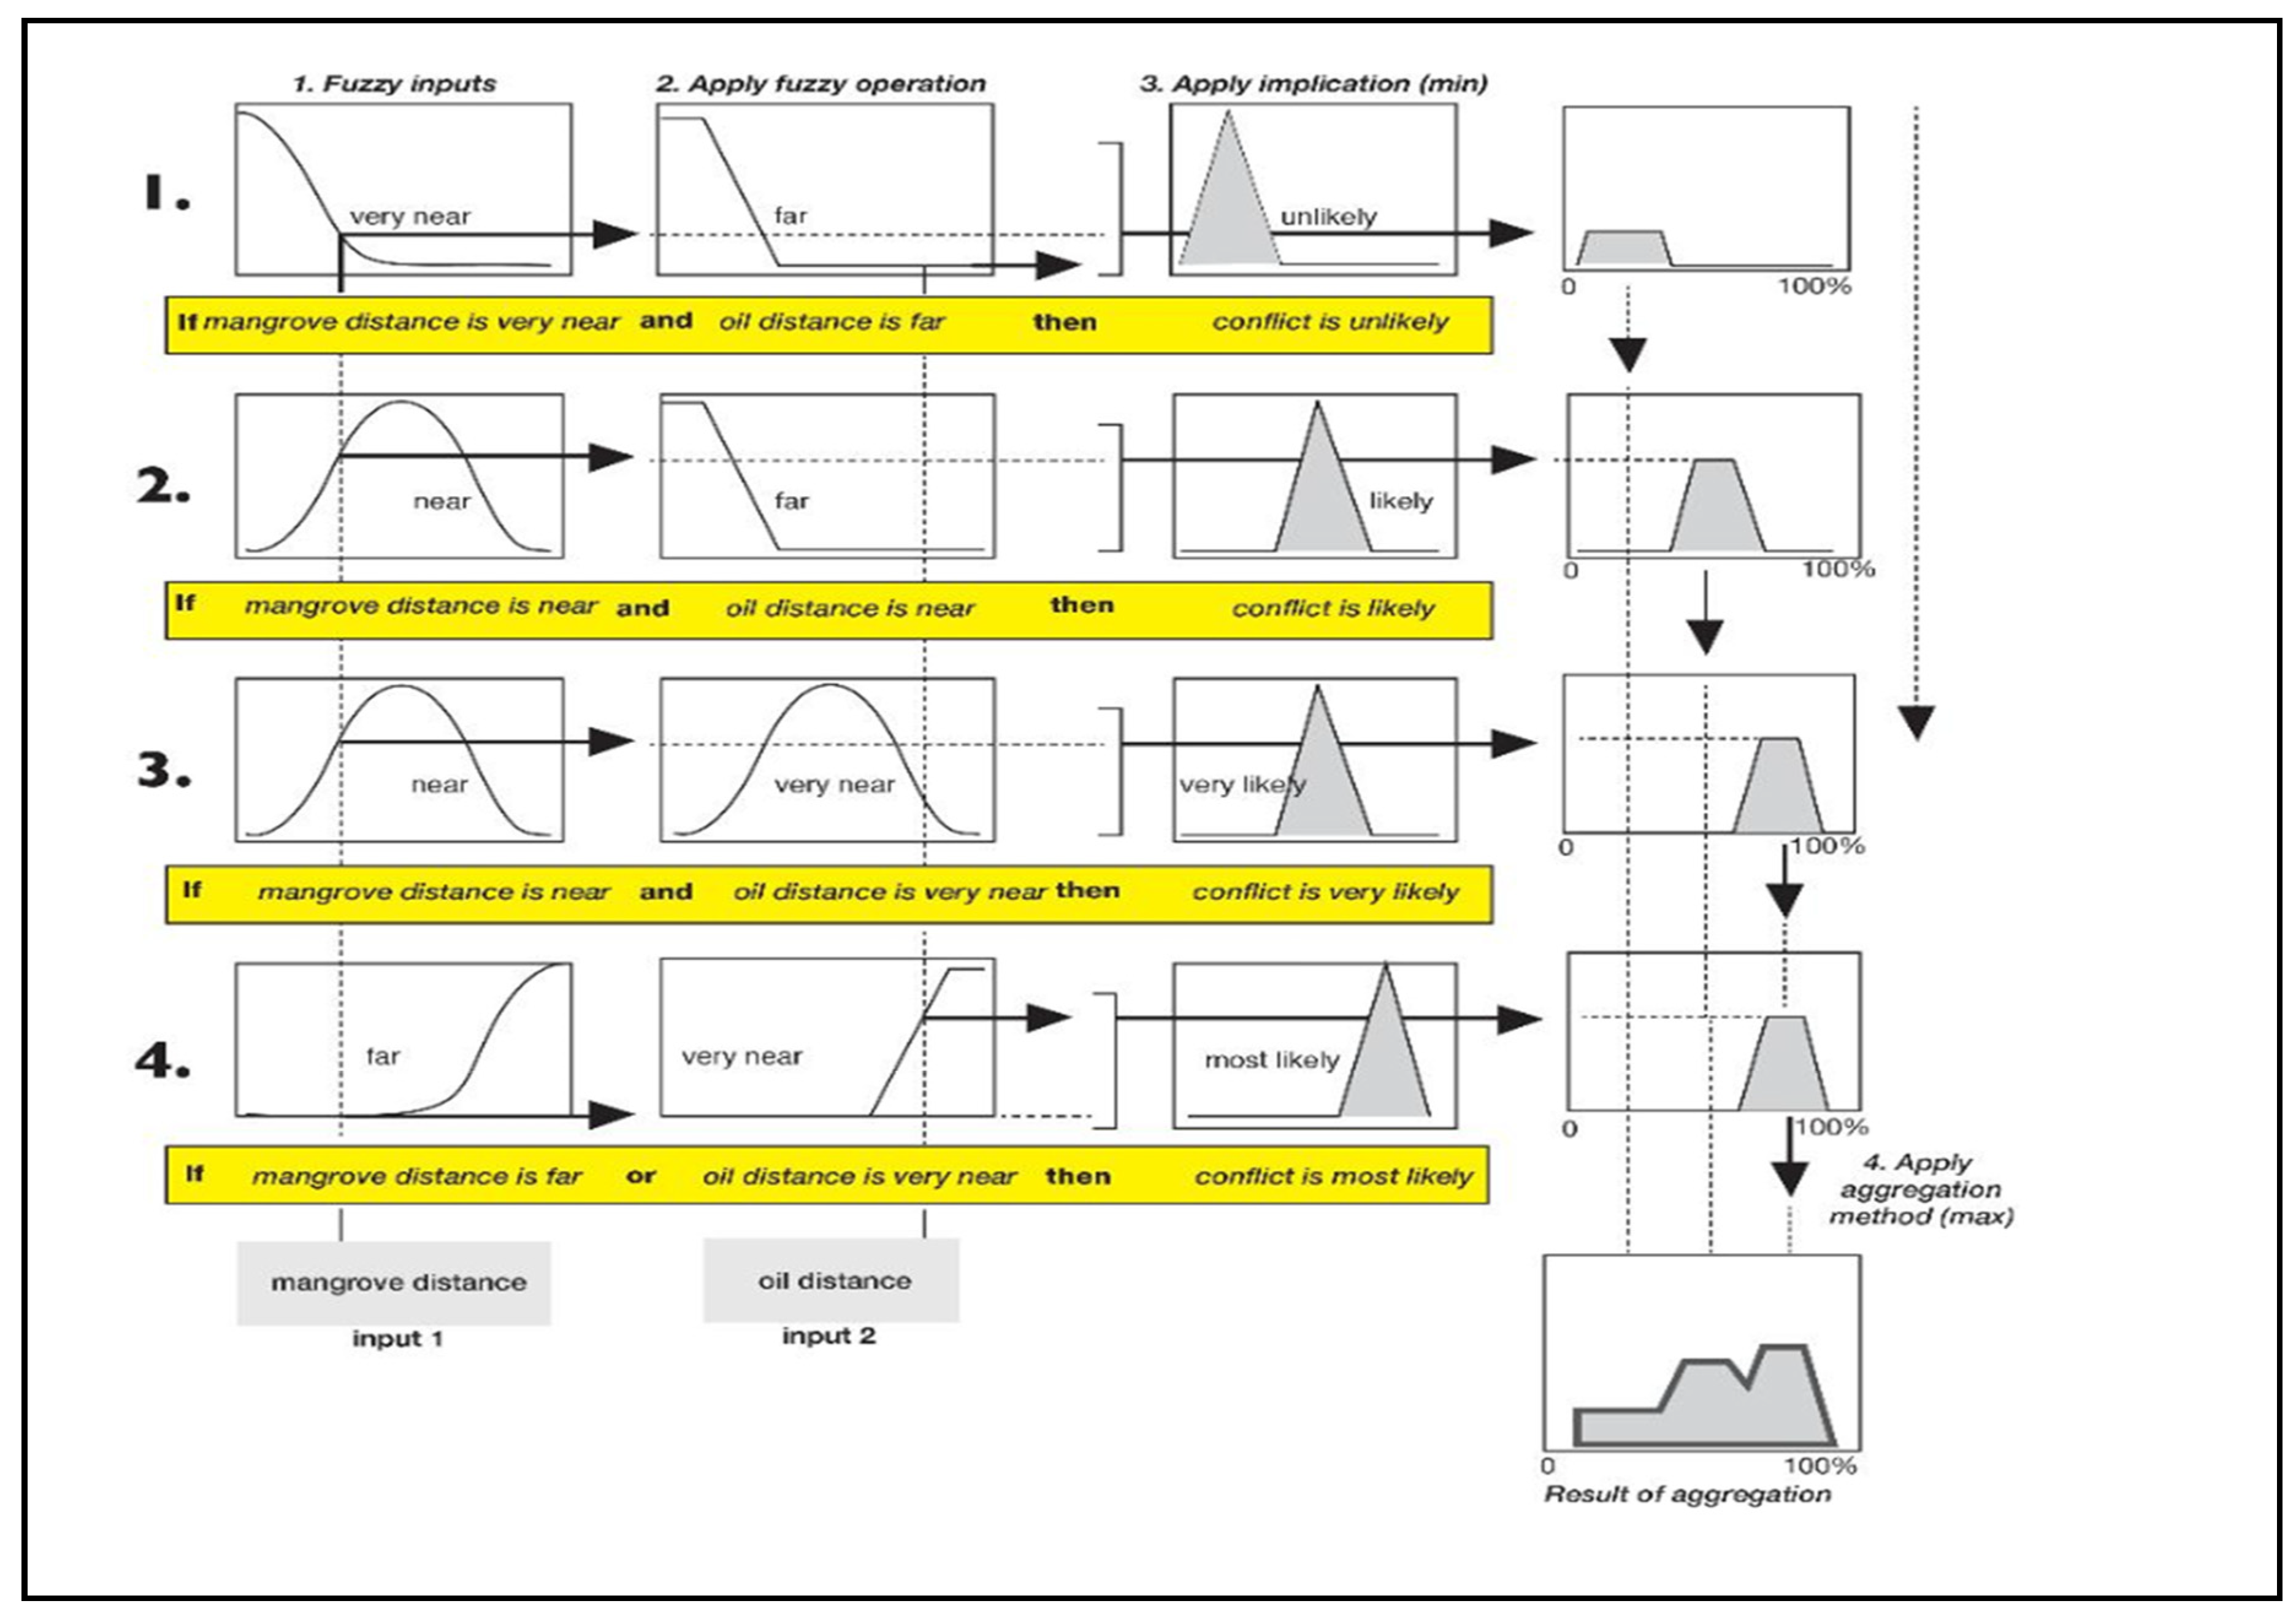
Aggregation is the process by which the fuzzy sets represent the outputs of each rule are combined into a single fuzzy set. The input of the aggregation process is the list of truncated output functions returned by the implication process (see
Section 2.2.5). Aggregation only occurs once for each output variable, prior to defuzzification (see
Section 2.2.8).
2.2.8. Defuzzification (Centroid Defuzzification Algorithm) and Decision Making
Defuzzification transforms the synthesized fuzzy set back to a crisp set, which expresses the result of modeling. The center of gravity (COG) is used because of its simplicity and adaptability to new problems, results sensitive to all rules[
43,
45,
46]. This is defined mathematically in
Equation 6 according to [
47,
48] and [
49] (:432), The COG Equations are applied to the different data layers to implement the SEFLAME-CM outlined in
Figure 6.
where
Y = Output crisp value
Mi = The value of the membership function of the output fuzzy set of rules i
I = Representation of rule i
Ai = The crisp value of the corresponding membership area, indicating the the degree to which that the rule i is fired
2.2.9. Model Validation of Fuzzy Composite Index: Conflict Vulnerability Likeliness (CVL) Index
The Model-SEFLAME-CM combines multiple drivers of NRBCs into one measure (see
Figure 6 and
Table 6)[
46,
50,
51] See data types in the model design in
Table 6 for example. The results of SEFLAME-CM were compared with those of SMCE-CM.
2.3. Spatial Attributes and the Description of FUZZYCONDATA
FUZZYCONDATA contains the training, and the validation data sets which were derived from the various data sources.
Table 6 shows a list of input variables with fuzzy set parameters. Outputs are expressed as four linguistic categories of vulnerability to conflict:
Unlikely, Likely, very likely, and most likely (
Table 7).
Table 6.
Fuzzy input variables.
Table 6.
Fuzzy input variables.
| Input Variables |
Fuzzy set Parameter (Categories) |
| Mangrove Distance |
Verynear (1) -Near (2) -Far (3) |
| Distance to Less Turbid water |
Verynear (2) -Near (2)-Far (3) |
| Distance to Farmland |
Verynear (1) -Near (2) -Far (3) |
| Oil Infrastructure Distance |
Verynear (1) -Near (2) -Far (3) |
| Poverty |
High (1) -Medium (2) - Low (3) |
| Education |
High (1) -Medium (2) - Low (3) |
| Oil Migration |
High (1) -Medium (2) - Low (3) |
| Oil Benefits |
High (1) -Medium (2) - Low (3) |
| Political Repression |
High (1) -Medium (2) - Low (3) |
| Political Exclusion |
High (1) -Medium (2) - Low (3) |
| Ethnic Linguistic Fractionalization |
High (1) -Medium (2) - Low (3) |
| Youth-Bulge |
High (1) -Medium (2) - Low (3) |
Table 7.
Fuzzy Output variables.
Table 7.
Fuzzy Output variables.
| Output |
Fuzzy Set of Conflict Likeliness |
| Environmental risk Vulnerability |
Unlikely-Likely-Very Likely-Most Likely |
| Socio-economic Vulnerability |
Unlikely-Likely-Very Likely-Most Likely |
| Political Vulnerability |
Unlikely-Likely-Very Likely-Most Likely |
| CVL Index |
Unlikely-Likely-Very Likely-Most Likely |
2.4. Case Study
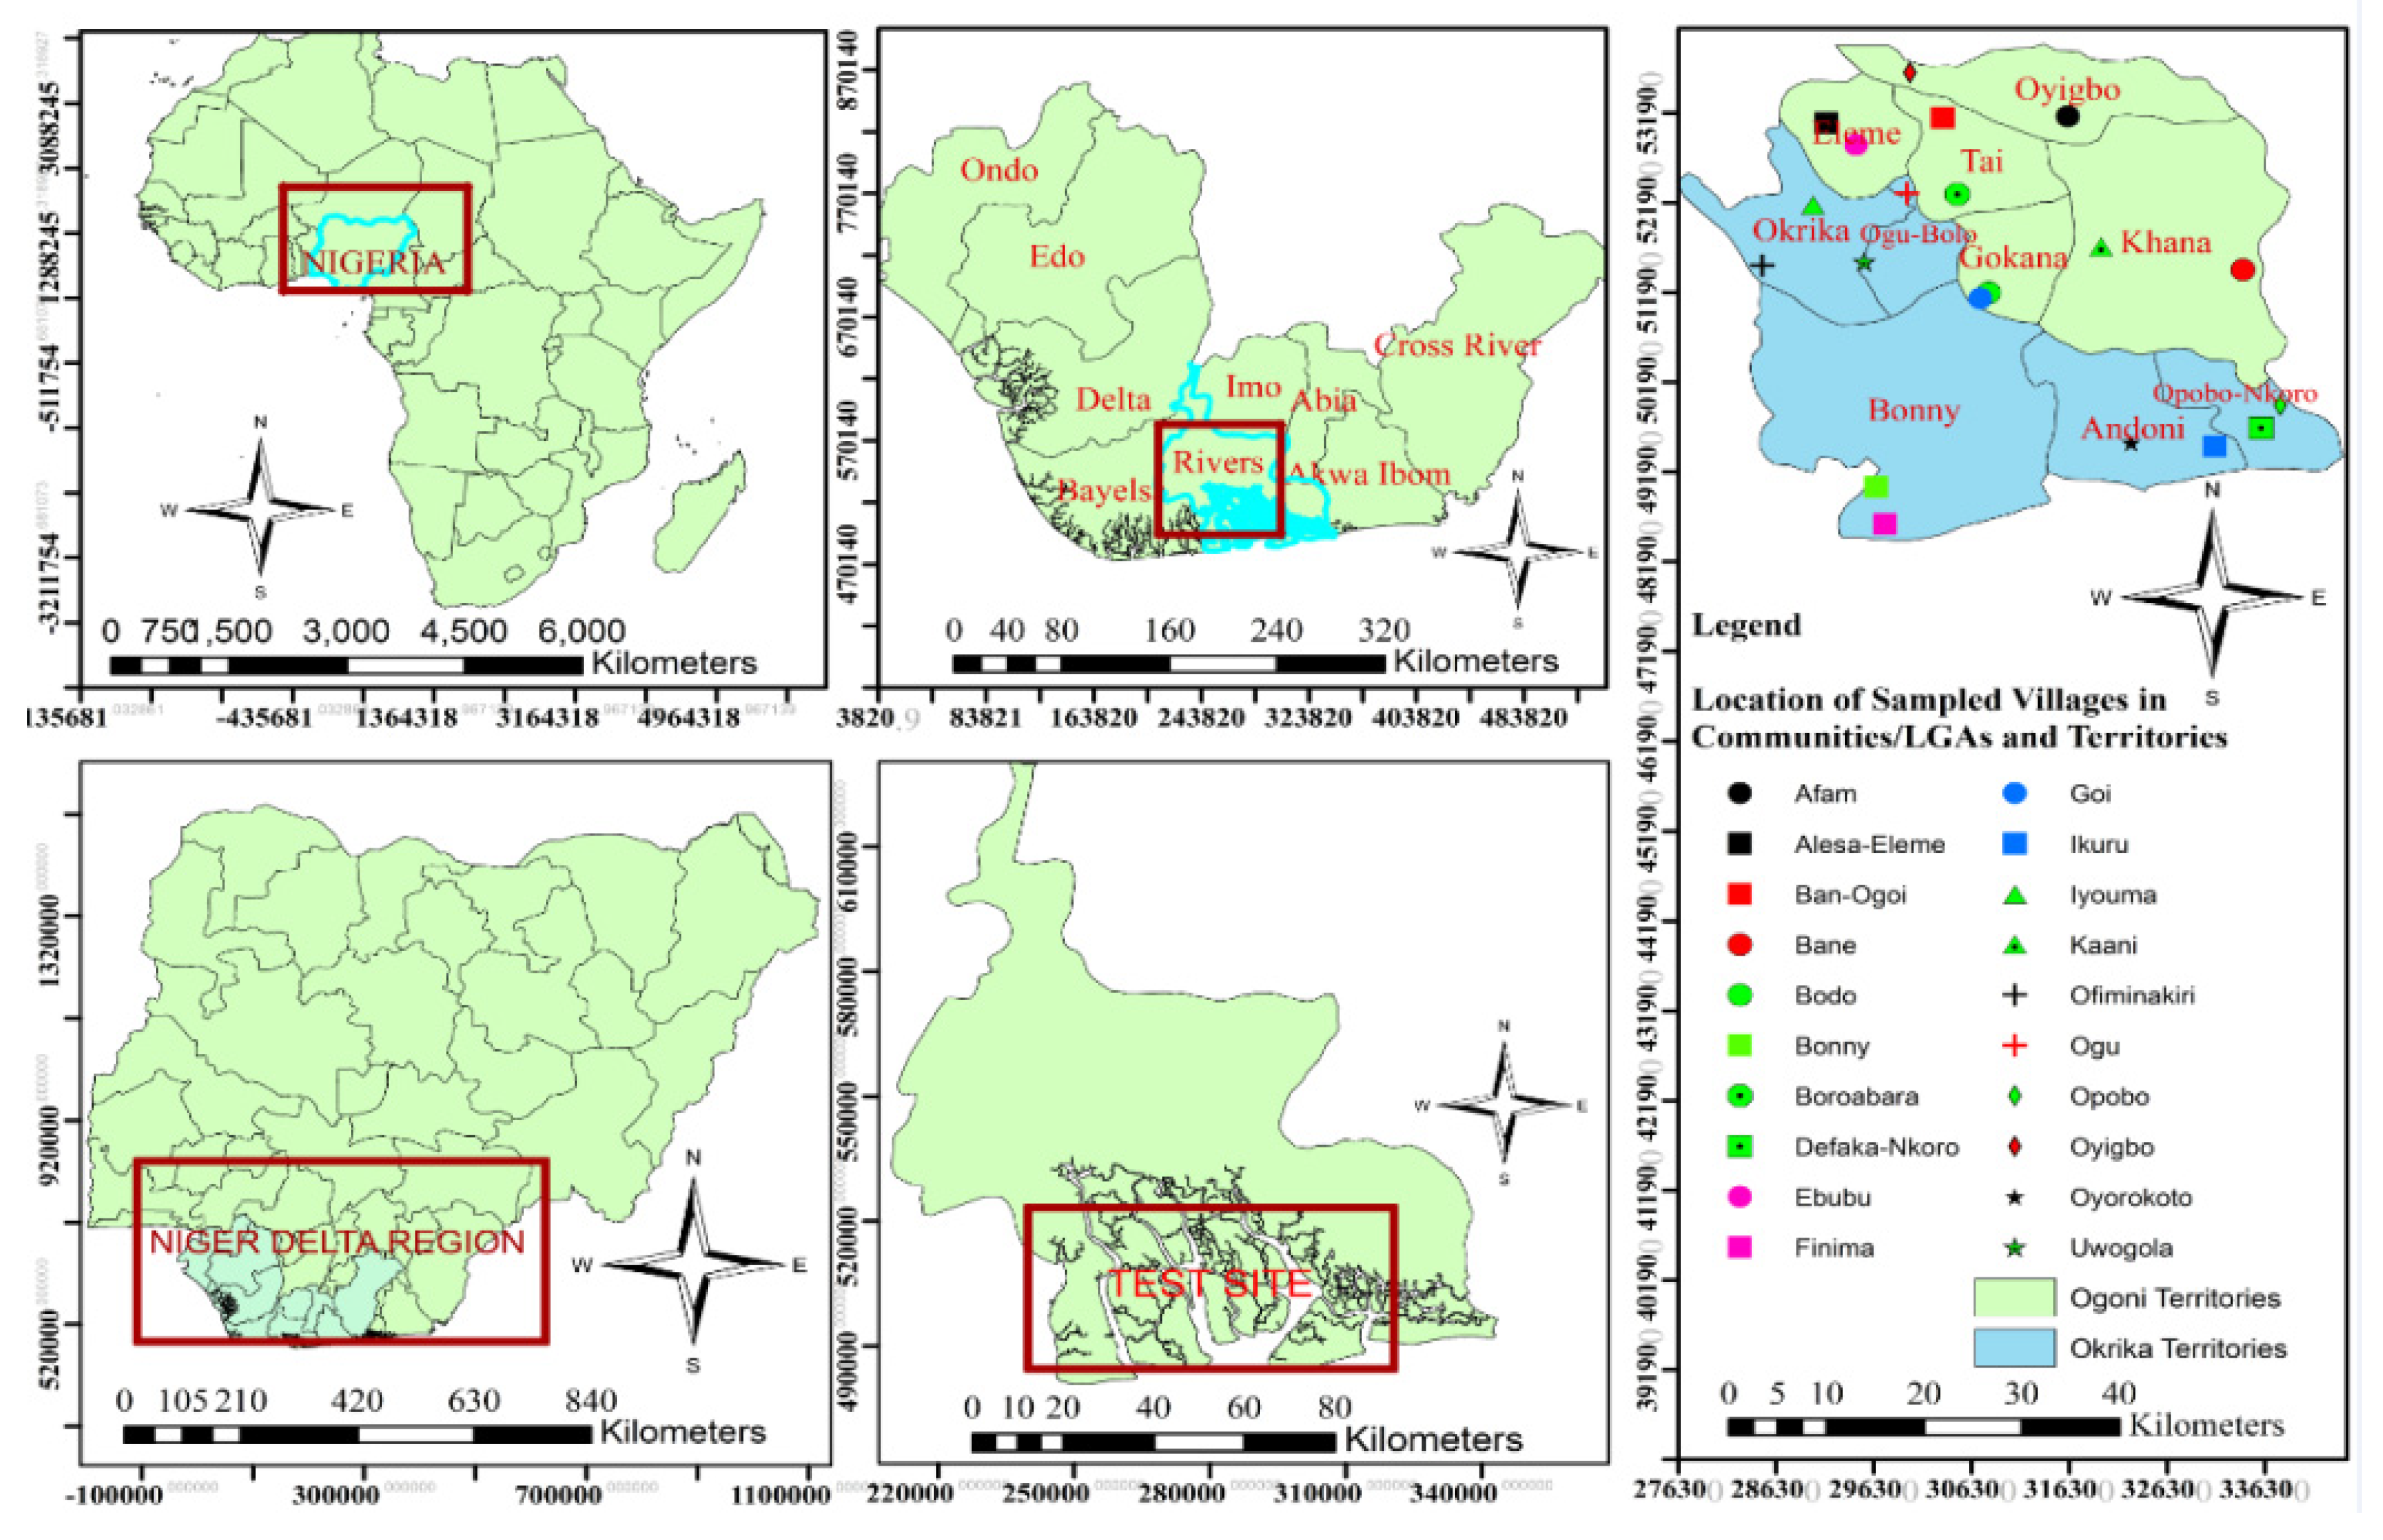
This method is tested in oil extractive territories of Nigeria, Niger Delta region (see
Figure 4). As a test case, part of the region is used. Niger Delta region has a major significance to the world because of environmental (flora and fauna) and socio-economic characteristics as key source of oil production in Africa and indeed in the world[
31,
32,
52]. Many conflicts have been reported relating to groups/communities, militias, and military amid environmental devastation from destructive oil extraction with policy measures seen to be unsustainable (see section 2.4.2). The entire Niger Delta region was not used because of its large geographic extent. As a result, parts of the Niger Delta (Ogoni and Okrika Territories in River State) were selected based on various reasons, among them being the representation of the diversity with respect to the environmental and the socio-economic characteristics. The characteristics of the selected territories, communities and villages give an insight into the natural and anthropogenic realities and diversities of the Niger Delta region. The Niger Delta region is located within the Gulf of Guinea, approximately between longitude 5
o east to 8
o east and latitude 4
o north to 6
o north. It is a wetland that is rich in oil deposits, mangroves, and fisheries resources. It occupies a total land area of 75,000 km
2.Among the 11 sites designated as wetlands of international importance, three are found in this region. For a more detailed characterization of the Niger Delta region [
53].
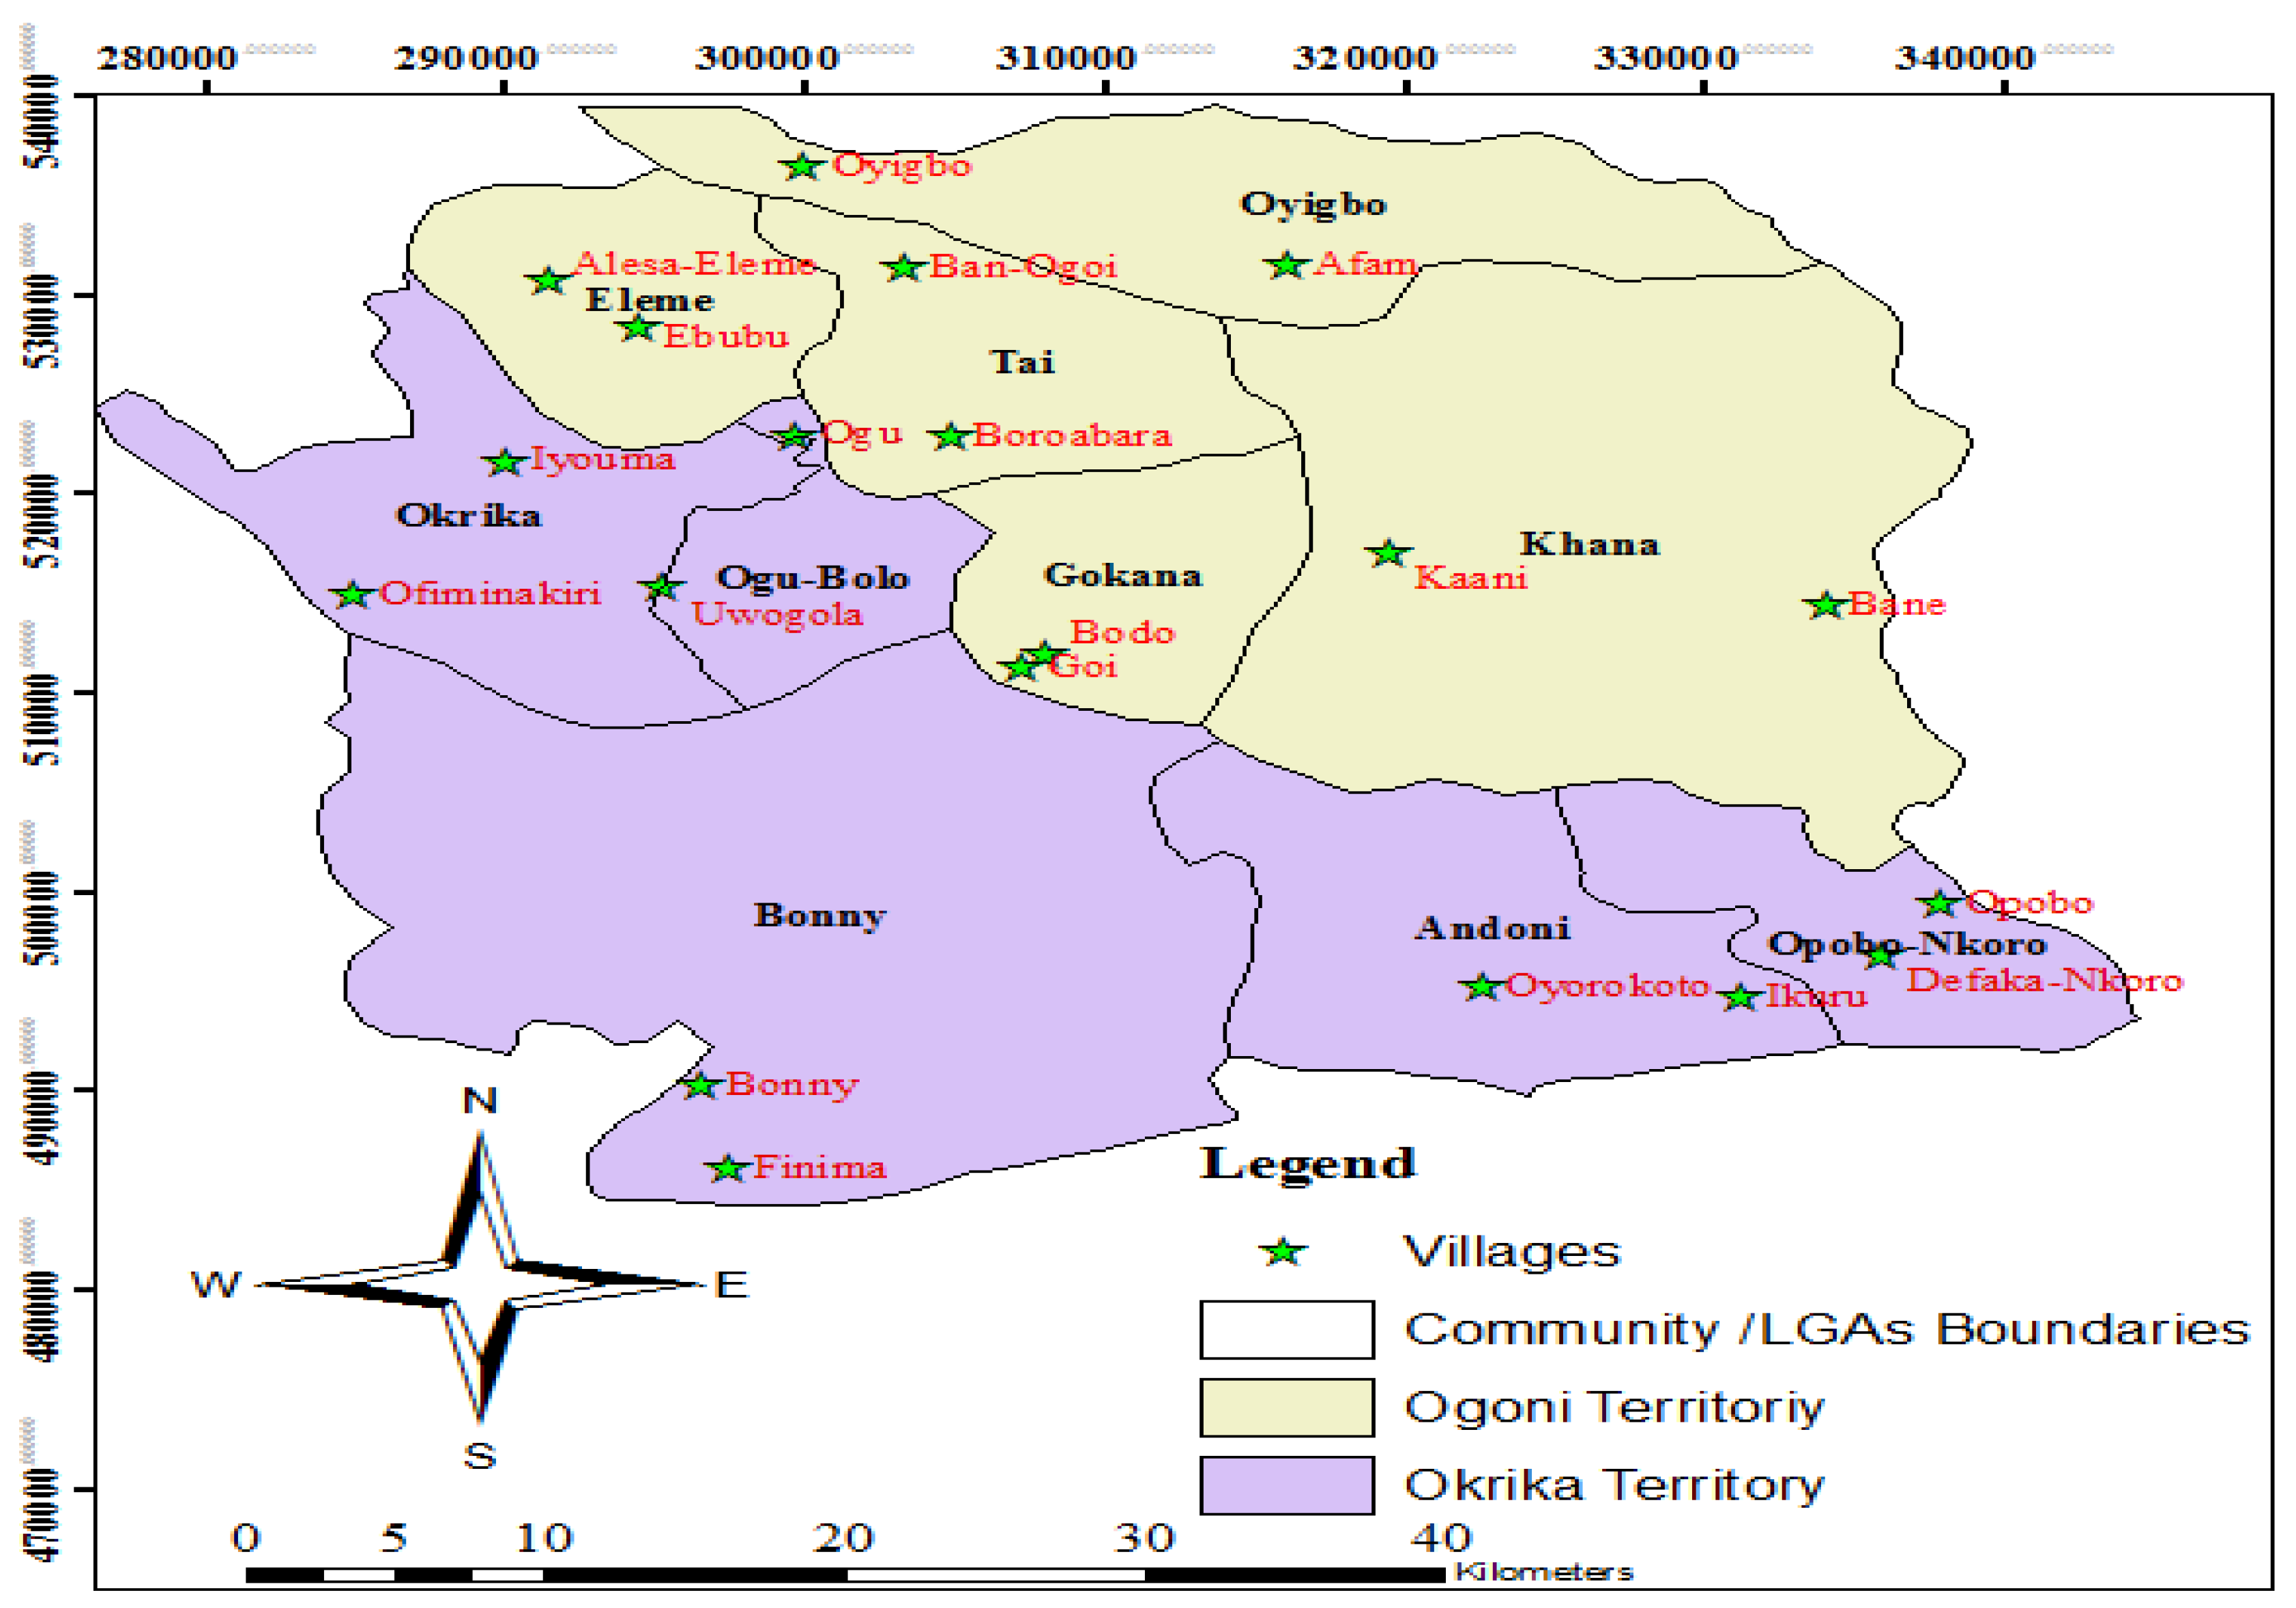
Figure 4 shows the map of the case study, with Niger Delta, Rivers State and the selected communities and villages for investigations.
2.4.1. Spatial Attributes of the test case.
As mentioned earlier, the research focused on two territories in Rivers State (Ogoni and Okrika territories) (see
Figure 4). Rivers State occupies a land mass of about 10,361km2 with Port-Harcourt as the capital. Each LGA, interchangeably referred to as communities, has an average population size of about 150,000 inhabitants. LGAs are made up of villages.
Figure 4.
Location of Nigeria in Africa (top left); Niger Delta in Nigeria (down left); Niger Delta States with the nine States (top middle); Rivers States with test site (down middle); case study with two territories and communities/Local Government Areas (LGAs) and villages.
Figure 4.
Location of Nigeria in Africa (top left); Niger Delta in Nigeria (down left); Niger Delta States with the nine States (top middle); Rivers States with test site (down middle); case study with two territories and communities/Local Government Areas (LGAs) and villages.
Figure 5 shows the map of the territories and the LGAs/communities and villages. The villages are of various sizes. They can be reached mostly by walking distance in the dry land areas, or by boat in the remote coastlands. The NRBCs of this region is not ubiquitous[
54], its pattern is explainable. The two territories selected are made up of 10 Local Government Areas (LGAs) (
Figure 5). Two representative territories were selected based on oil presence, impacts of extraction on health other socio-economic and political lives of people as identified and based on conflict events from each of the LGAs.
Figure 5.
Map of the case study.
Figure 5.
Map of the case study.
Development Policies and Research-Based Conflict Management Strategies in the Niger Delta
The precarious problems of environmental degradation, unemployment and resource conflicts have led to various development policies with recommendation strategies and communiqués by various international aid organizations e.g., DFID, UNDP, and World since the 1990s, among which include:
Niger Delta Development Board (NDDB)
Niger Delta Basin Development Authority (NDBDA)
Oil Pollution Act of 1990
The Environmental Impact Assessment Act (Decree No. 86 of 1992
National Oil Spill Detection and Response Agency for National Oil Spill Contingency Plan (NOSCP)
Niger Delta Environmental Survey (NDES)
While the above-mentioned and many other policy measures have not improved the region. most of the local publications which do directly link to polices are theory-based research with methodology mainly limited to qualitative methods[
22,
52] These are based on resource curse theories and political ecology approach which provide the context for the many conflicting values and perspectives on the crisis in the Niger Delta[
55], hence a new modeling has become very necessary.
3. Results
3.1. Graphical Representation of SEFAME-CM in MATLAB Simulink.
Results of the interview were translated to quantitative modelling, employing the concept of computing with words (CWW). This approach encompassed of encoding, integration, and decoding steps [
40]and perception-based paradigms where appropriate design of survey instruments, risk factors can be quantified[
56]. For example, using
a scale of 0—10):
how do you further specify the rating of the options given (Unlikely, Likely, Very Likely, Most Likely)? The options included: [Unlikely: 0 1 2], [Likely: 3 4 5;], [Very likely: 6 7 8], [Most likely: 9 10].[
57]. The integration and decoding processes were executed through a defuzzification algorithm (as detailed in
Section 2.2.7), employing semantic rules to link each linguistic term set.
Results are based on the two typologies of conflicts analyzed using SEFLAME-CM (see
Figure 6 for the data layers). Methods based on fuzzy logic, such as presented help to model factors that are difficult to combine: environmental, socio-economic, and political dimensions in Large-N studies[
3,
4,
10], but the combination of these factors provide further insight into the analysis of NRBCs.
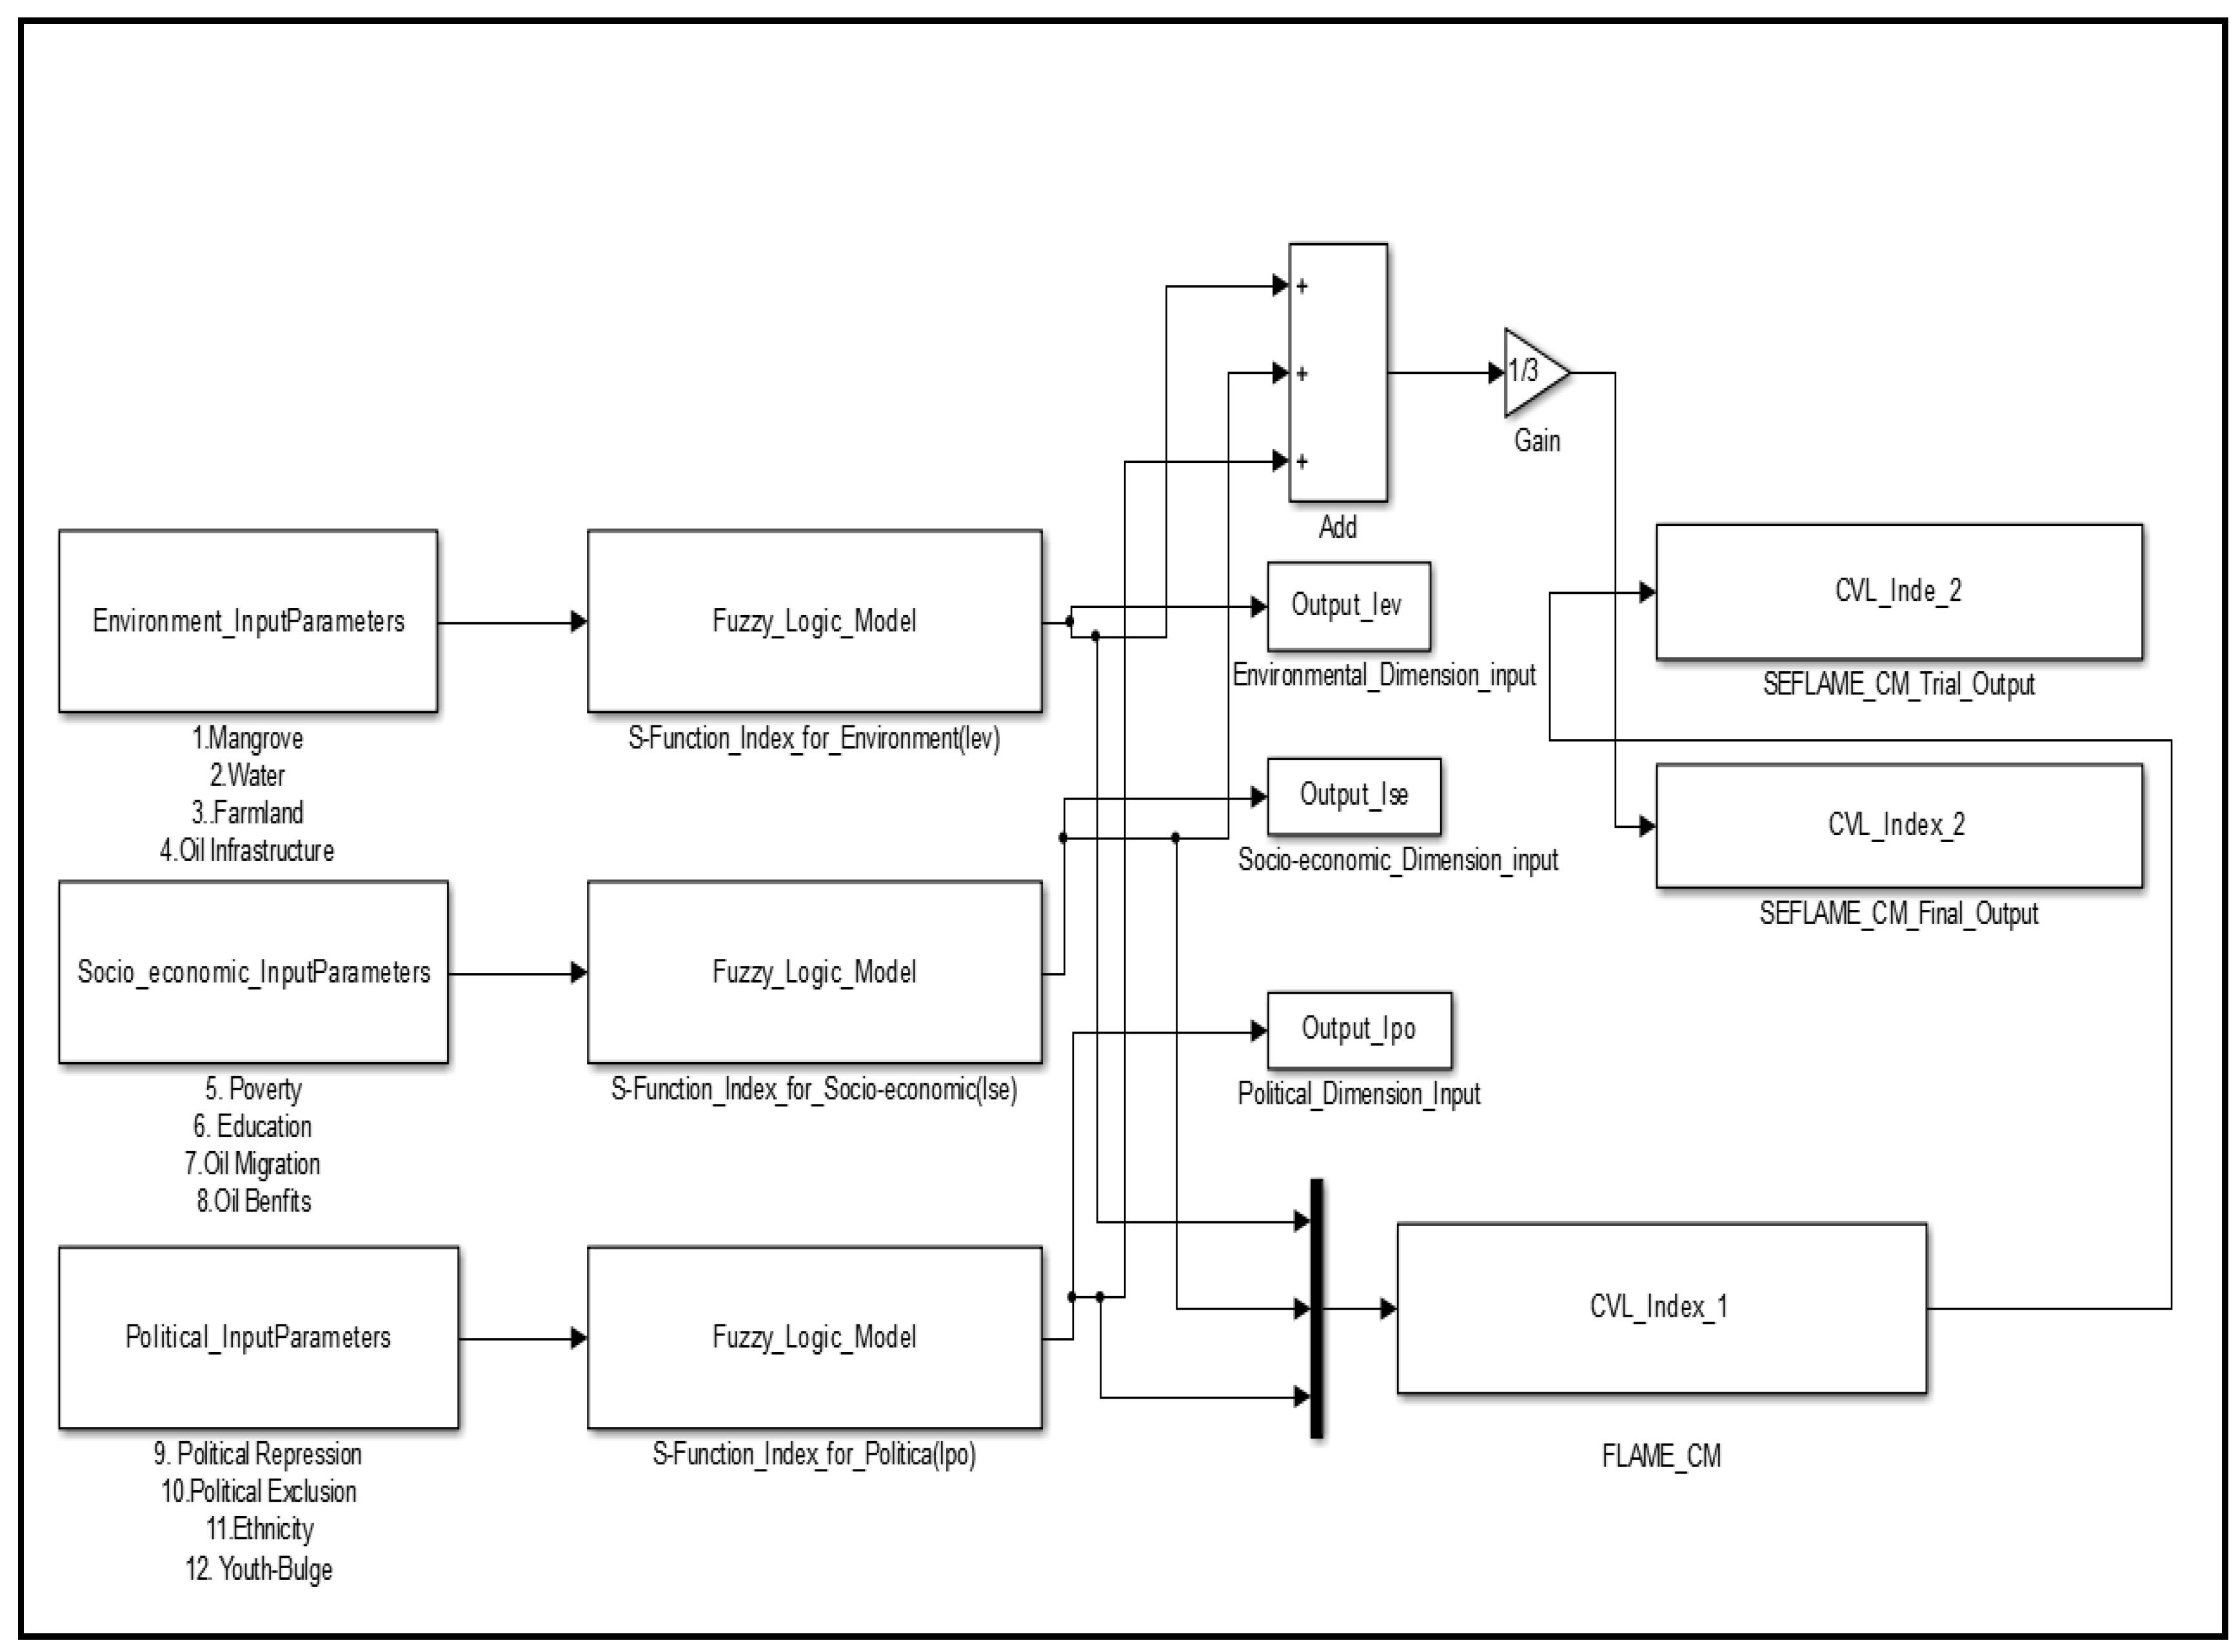
Figure 7 showcases the implementation of SEFLAME-CM in MATLAB. The final CVL index was subsequently validated using the SMCE-CM.
Figure 6.
Simplified hierarchical structure of model input data layers.
Figure 6.
Simplified hierarchical structure of model input data layers.
Figure 7.
Overview of implementation strategy of SEFAME-CM in MATLAB for deriving the CVL Index.
Figure 7.
Overview of implementation strategy of SEFAME-CM in MATLAB for deriving the CVL Index.
3.2. Results on the Fuzzy Operator and Fuzzy Rules
As each line in
Figure 8 represents rule fuzzy operators are very relevant to determining the degree of fulfilment of the output variables. For instance, the output of the Fuzzy Algebraic Sum (FuAS) for each point consistently surpasses or equals the maximum fuzzy value at the corresponding point in any input map, showcasing a “maximizing” effect. Two types of fuzzy operators, OR and AND, are the inbuilt in the fuzzy logic model in MATLAB. In the model, a value of 2 represented OR, while 1 represented AND. These operators were utilized to consolidate multiple parts of the antecedent, resulting in a single numerical value ranging from 0 to 1, which signifies the degree of support for the rule. In the translation of the rule in fuzzy logic OR represents the maximum and AND represents a minimum. For instance, in a rule:
If (mangrove distance is far, Water Distance is far, Farmland is far, oil infrastructure is near) conflict is very likely, with the fuzzy membership values: [0.0 0.2 0.9 1] respectively. The fuzzy OR operator simply selects the maximum of the three values, 1, and concludes the fuzzy operation of the rule. If the AND operator is chosen, the minimum value will be taken, and the rest will be discarded. See
Figure 8 for Sample rule viewer and Figure 9 (A, B and C) shows the SEFLAME-CM interface for environmental, socio-economic, and political vulnerability assessments. See Appendix B.1
- Appendix B.3
for the fuzzy rules.
3.3. Aggregated Outputs
The output of the aggregation process is one fuzzy set for each output variable[
43]. This is combined /aggregated into a single fuzzy set following fuzzy inputs, fuzzy rules, fuzzy implication rules, and fuzzy operator as described earlier. During the aggregation, the membership functions (as shown in
Figure 10) were used to assign weights to each output. These weights determine the values representing the vulnerability to natural resource-based conflicts. The results are the generation of the fuzzy parameter maps visualized in GIS (see Appendix C.1-C3 and Appendix D.1-D3 for the parameters). Based on[
42] , maps resulting from application of operators such as Fuzzy AND and Fuzzy OR are consistent with the rules from actors. For a simplified representation of how all three rules in each line interact, please see
Figure 11, and for an overview of the interrelationships between the inputs, rules, membership functions, and outputs, please refer to
Figure 12.
Figure 8.
Sample rule viewer of SEFLAME-CM.
Figure 8.
Sample rule viewer of SEFLAME-CM.
Figure 9.
SEFLAME-CM Interface (A).
Figure 9.
SEFLAME-CM Interface (A).
Figure 9.
SEFLAME-CM Interface (B).
Figure 9.
SEFLAME-CM Interface (B).
Figure 10.
Types of membership functions (triangular, trapezoidal and gaussian MF).
Figure 10.
Types of membership functions (triangular, trapezoidal and gaussian MF).
Figure 11.
Overview of schematics of how all three rules in each line are combined/aggregated into a single fuzzy set adapted from [43.]
Figure 11.
Overview of schematics of how all three rules in each line are combined/aggregated into a single fuzzy set adapted from [43.]
Figure 12.
Interrelationships between the inputs, rules, membership functions and outputs.
Figure 12.
Interrelationships between the inputs, rules, membership functions and outputs.
3.5. Validation Results
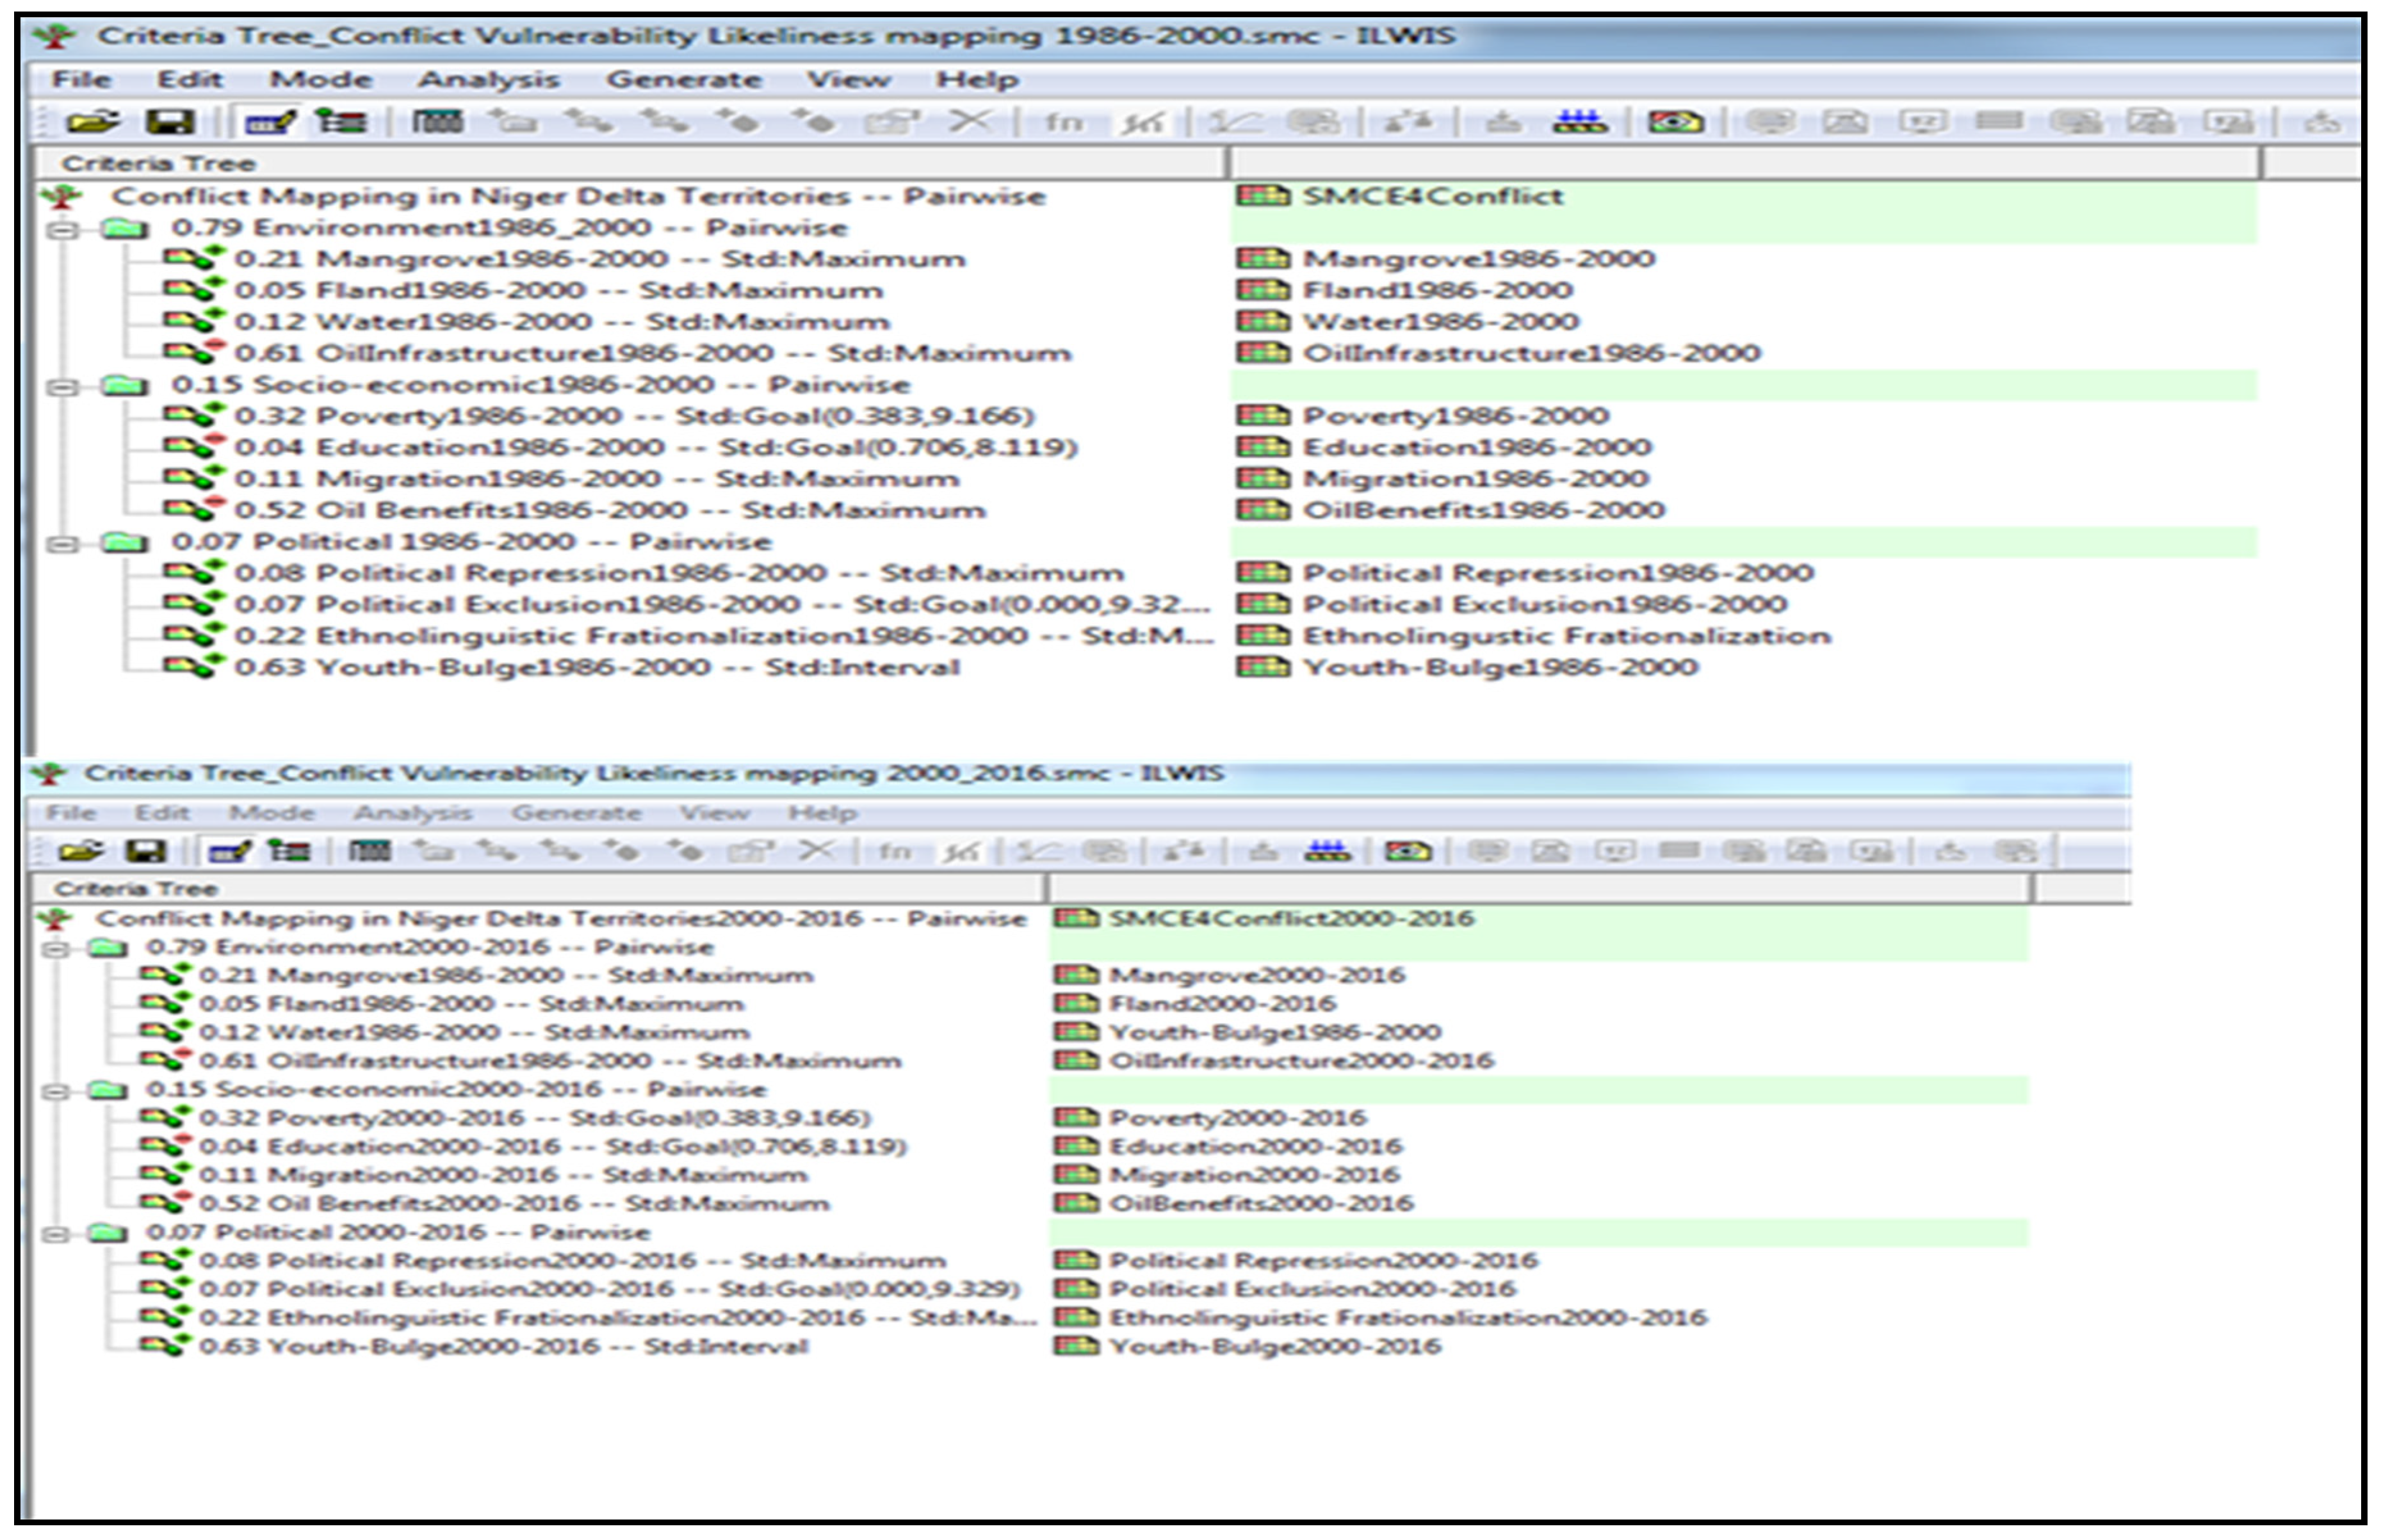
This section presents the validation of the developed model: SEFLAME-CM and SMCE-CM models. The implementation of SMCE-CM comprises three primary steps. Firstly, it involves defining the criteria tree and grouping of factors and/or constraints. Secondly, it encompasses the standardization of criteria. The third step entails assigning weights to the criteria. The implementation of the weighting process in SMCE-CM was based on ‘pairwise comparison’[
58]. The implementation of the SMCE-CM used the ILWIS-GIS environment[
58](see
Figure 13). The weights assigned to each driver/factor were derived from the pairwise comparison matrix. In the analysis, critical considerations included insights from the literature review and the opinions of experts involved in the context of NRBCs and the implementation of SEFLAME-CM. These factors were deemed crucial. The results of SEFLAME-CM and SMCE-CM are compared using spatial statistics[
59,
60,
61].
Figure 13.
SMCE-CM screenshot: criteria tree.
Figure 13.
SMCE-CM screenshot: criteria tree.
4. Discussion
This research analyses resource conflicts associated with oil extractive territories using various drivers and impacts of oil extraction with the SEFLAME-CM model. Notably, fuzzy logic requires predefined membership functions and fuzzy inference rules to map data into linguistic variable terms, as demonstrated in [
42].
4.1. Fuzzy Maps and Spatial Distribution of Resource Conflicts across the Ogoni and Okrika Territories
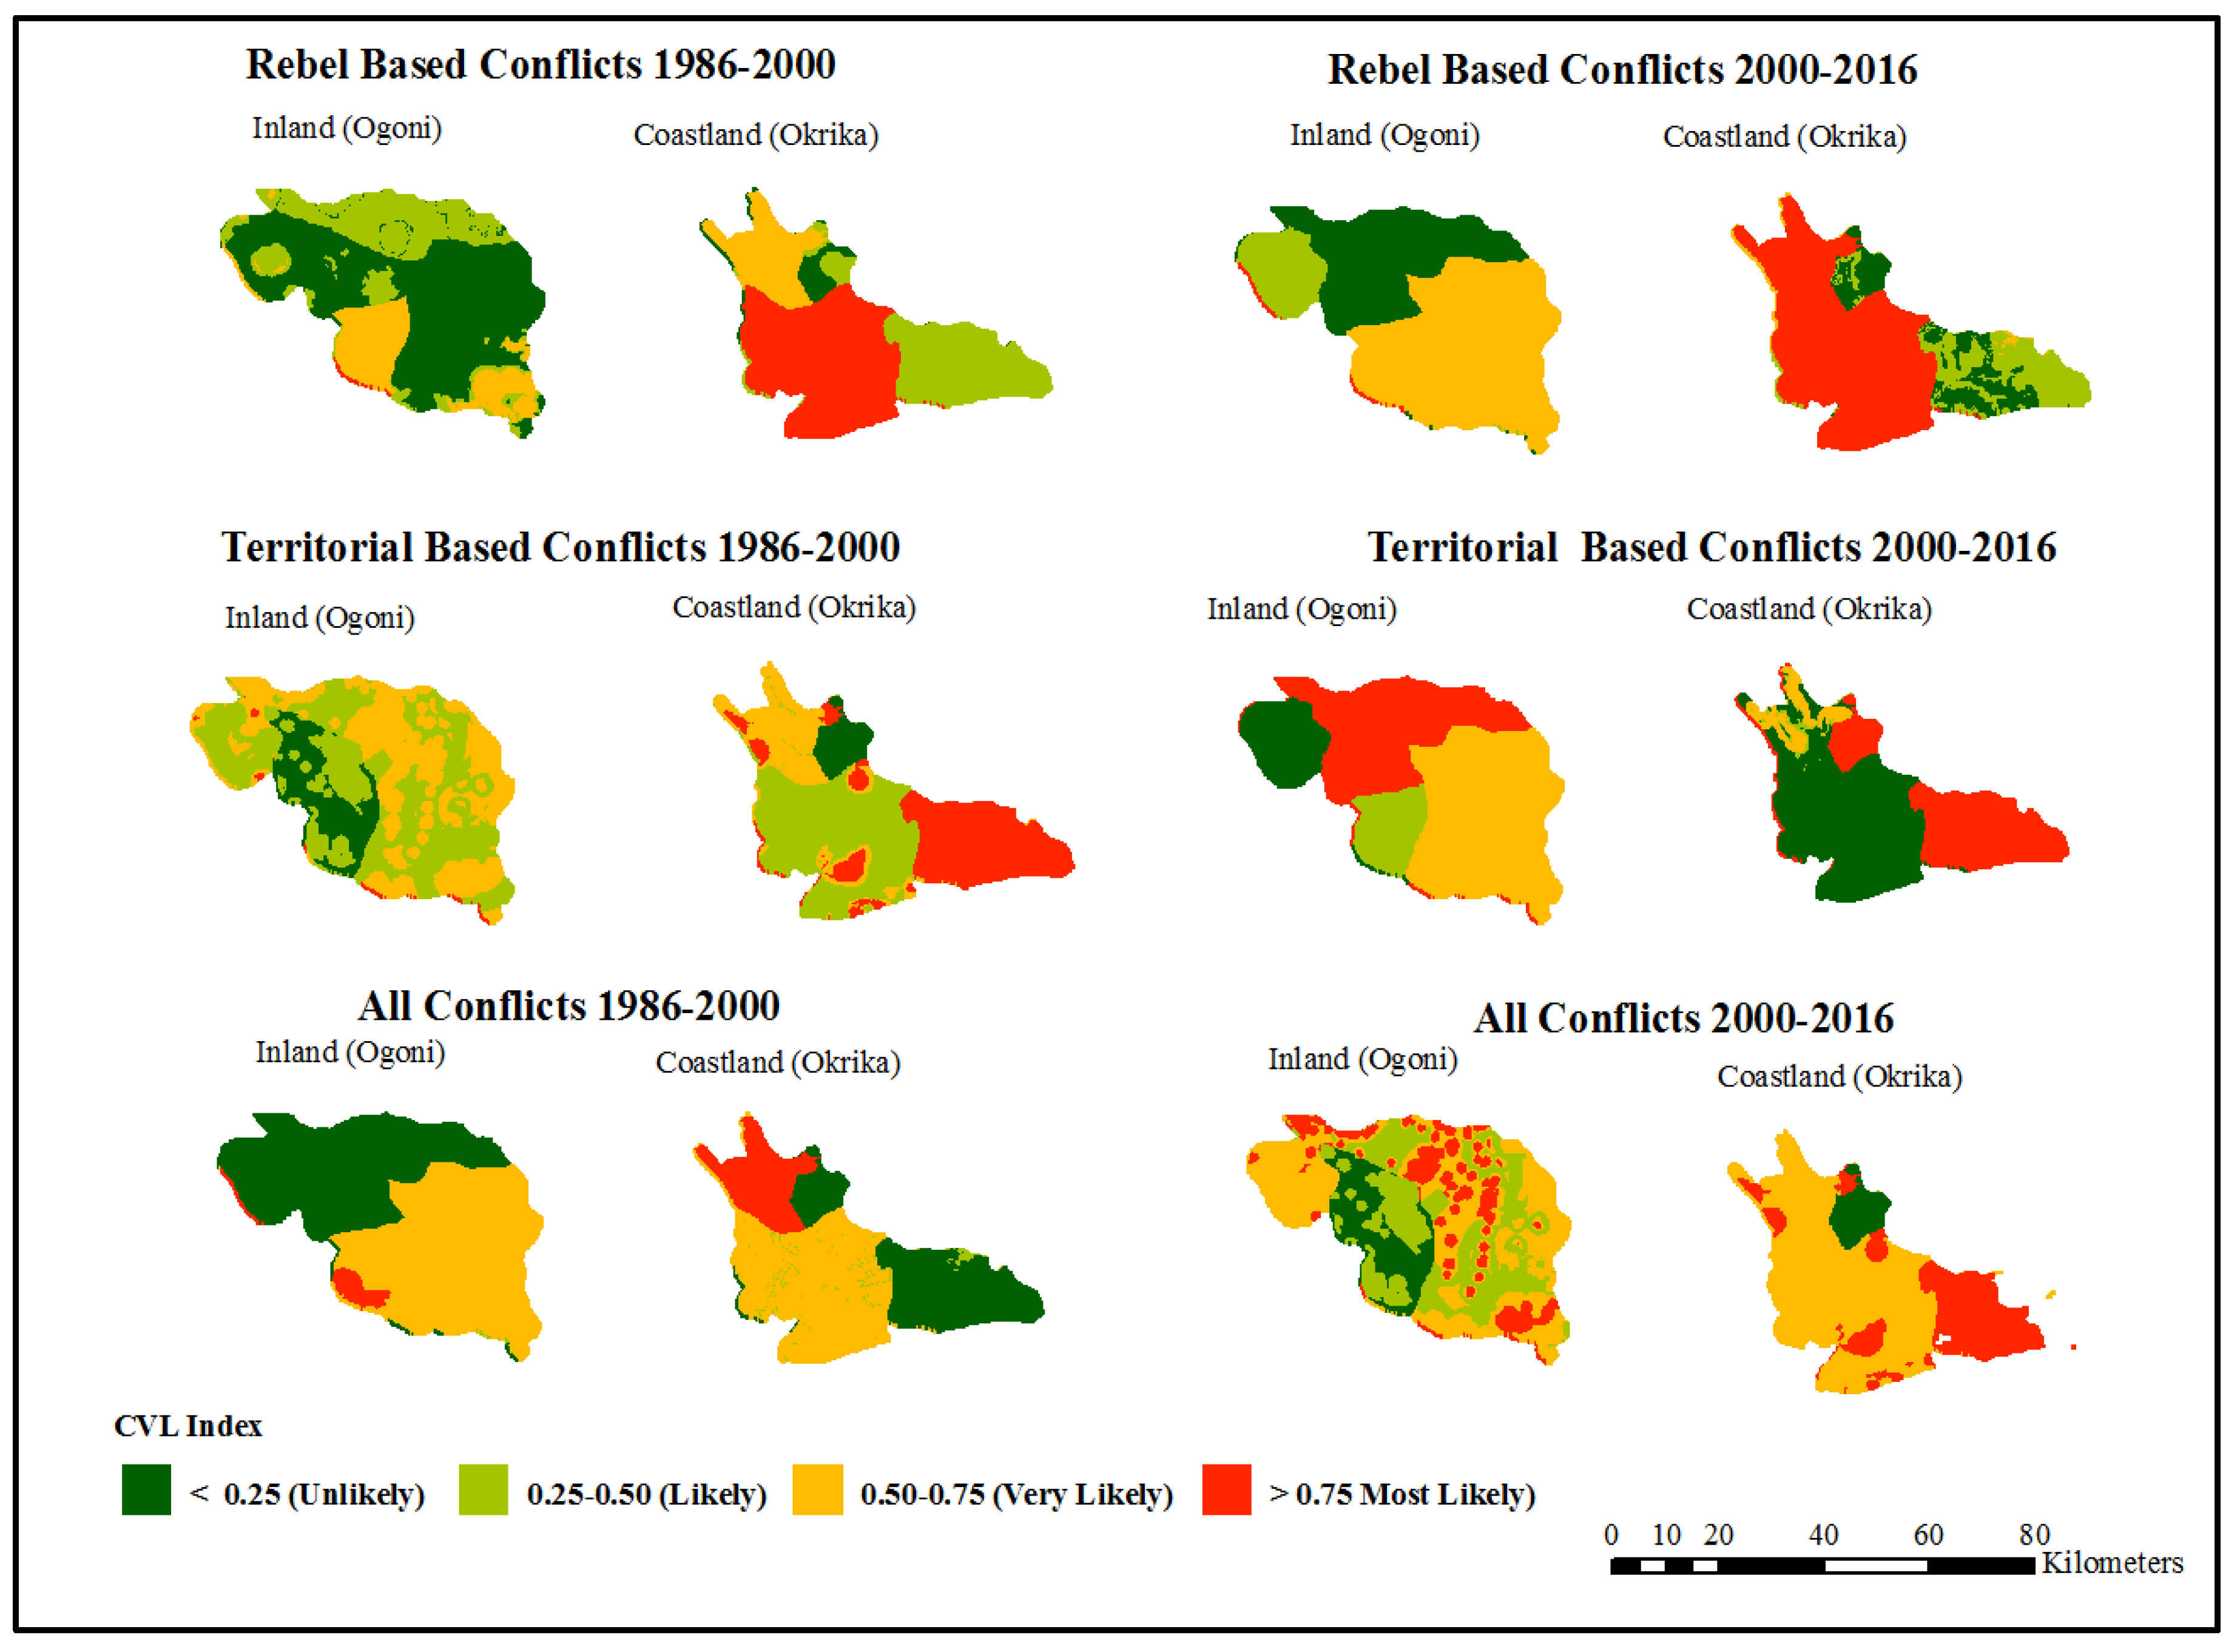
The findings of the final conflict indices for each of the typologies based on the two main territories of the study: Inland areas (Ogoni territory) and the coastal areas (Okrika territory) is discussed.
Figure 14 shows a map comparing the spatial CVL Index for the typologies of NRBCs studied: the rebel-based conflicts and the territorial-based conflicts and all the conflict categories.
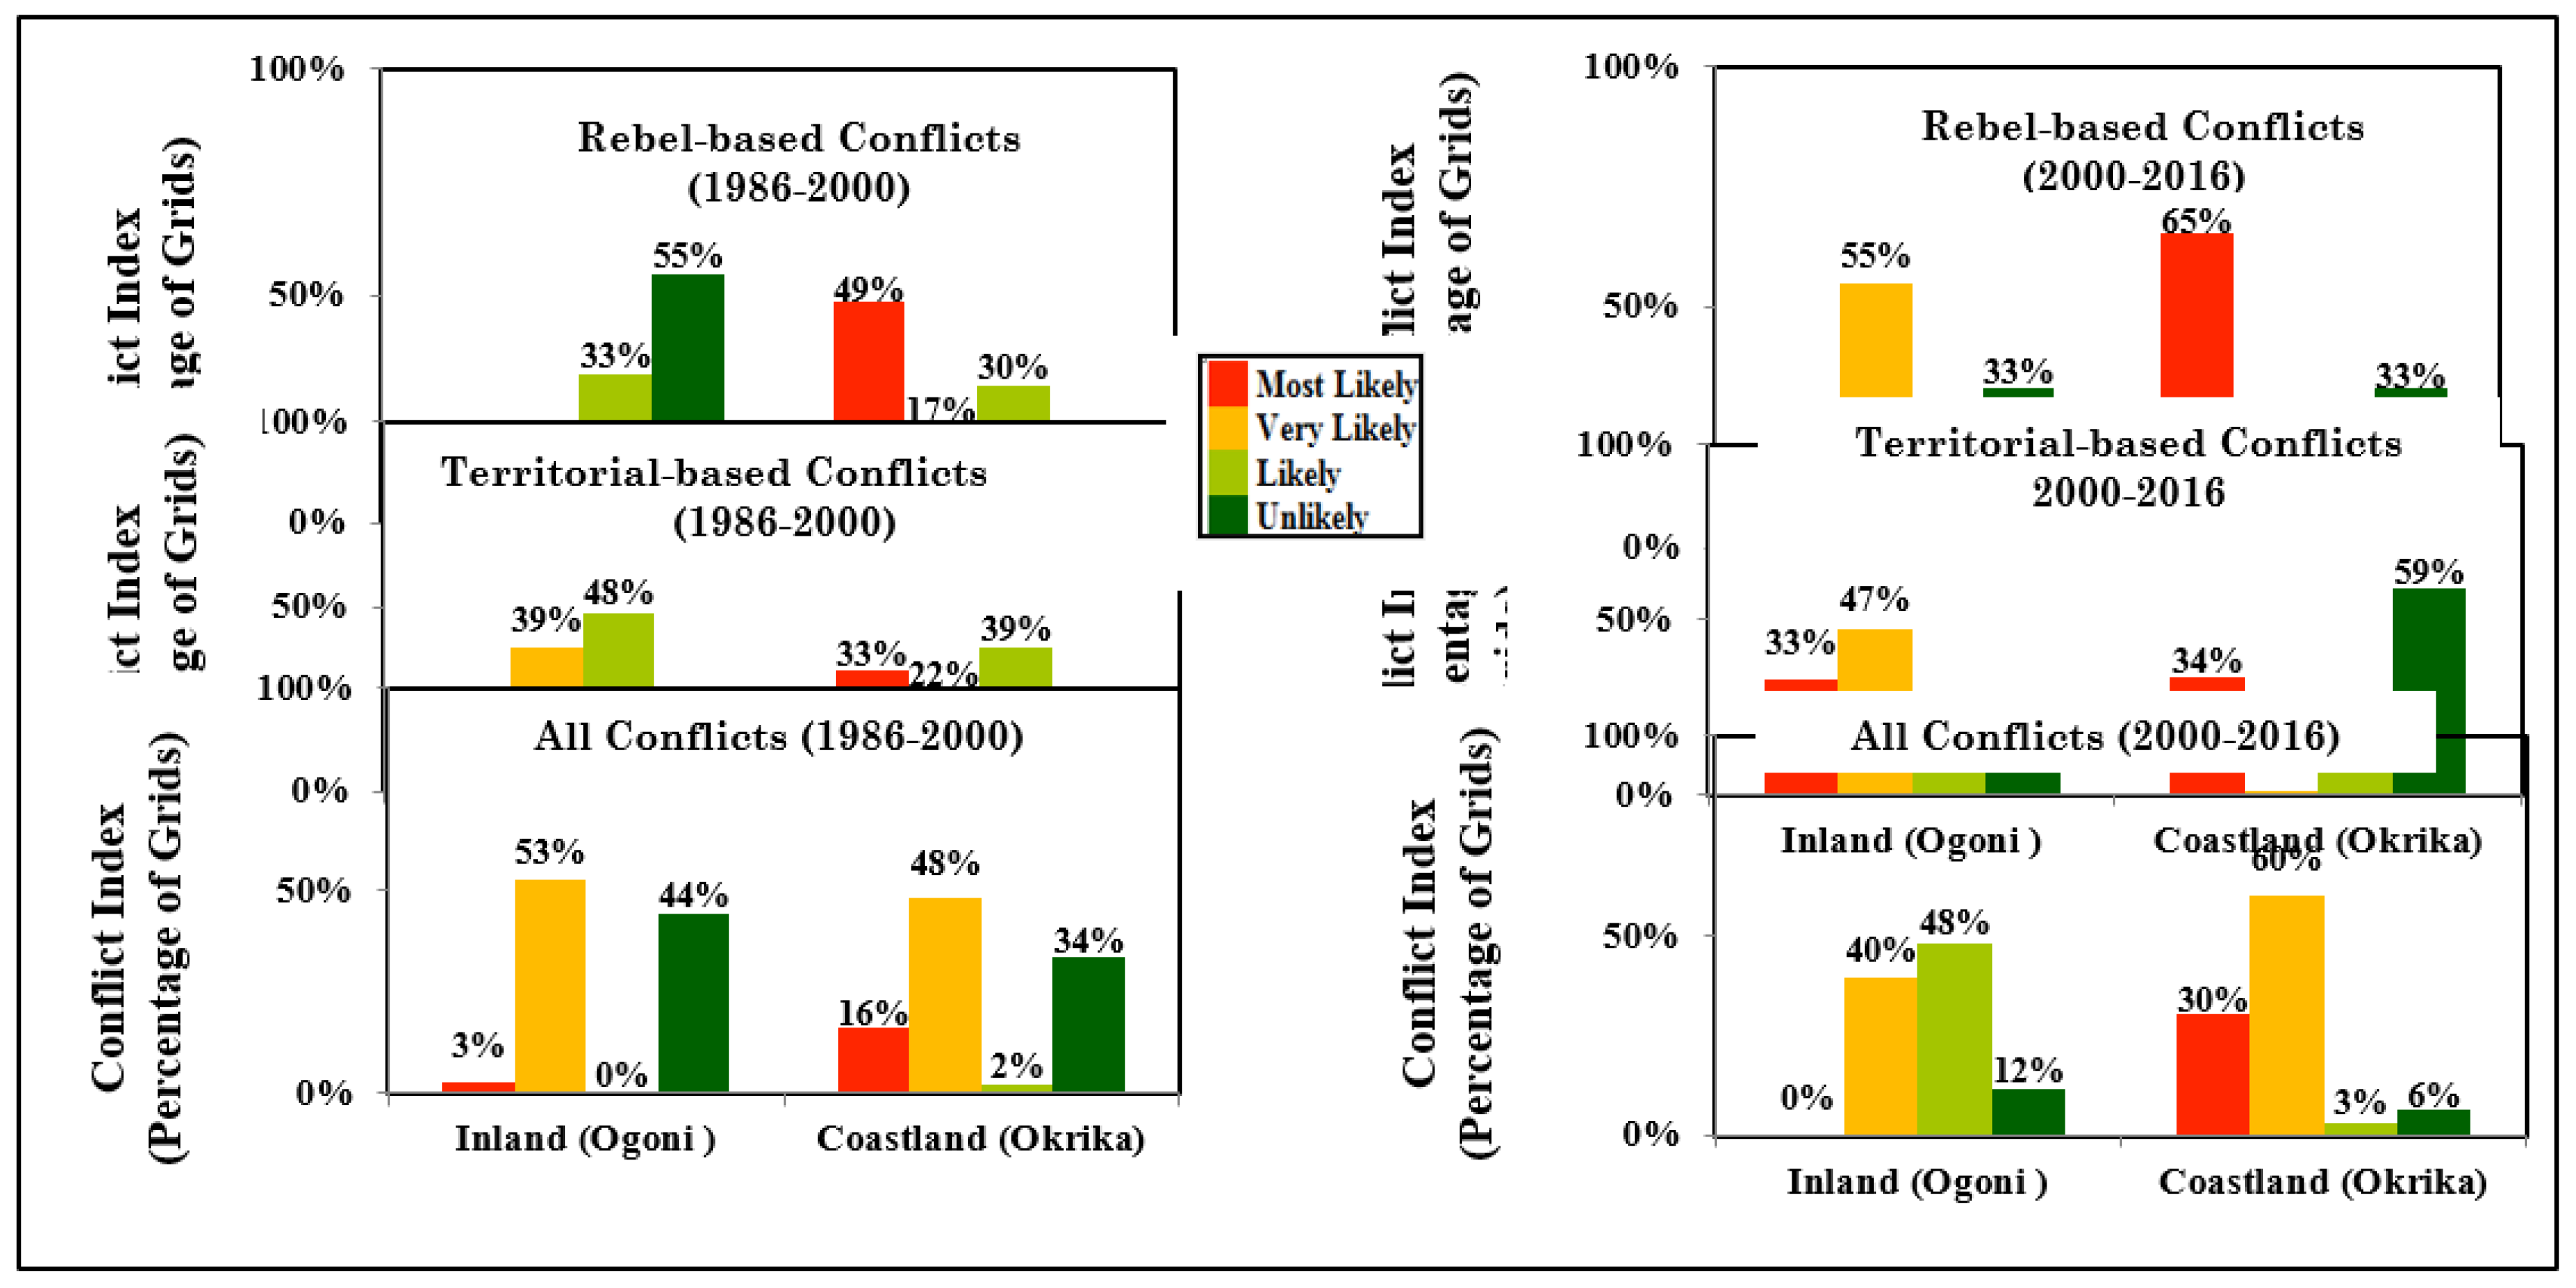
Figure 15 shows the descriptive statistics of the map.
The Rebel-based Conflicts in Ogoni: Under the Rebel-conflicts typology, the spatial CVL Index of most likely is (0%) in both the 1986-2000- and 2000-2016-year periods. However, the index decreased from very likely (12%) in 1986-2000 to very likely (55%) in 2000-2016. As expected, the index, unlikely reduced from (55% in 1986-2000 to 33% in 2000-2016.
The Territorial-based Conflicts in Ogoni: The dynamics of the conflicts are most evident in the cases of the territorial-based conflicts. For example, from 1986-2000, the spatial CVL Index of most likely is (0%), but this increased to (33%) in 2000-2016, while the spatial CVL Index for very likely increased from (39%) to (47%) in 1986-2000 and 2000-2016 respectively. When compared to rebel-based conflicts in Ogoni, it’s evident that there are more grievances associated with land resources and territorial claims than rebel-based uprisings and youth belligerence.
All Conflicts in Ogoni: The spatial CVL Index is
most likely (3%) and (0%) in 1986-2000 and 2000-2016 respectively. Conflicts seem to have reduced in the latter years in the inland areas (Ogoni territory). There seems to be a significant diffusion of conflicts from inland areas towards coastal areas over time. This reduction of conflicts and diffusion to certain geographic area couldn’t be explained by earlier studies of NRBCs that mainly examined the onset and duration of wars and resource conflicts over time [
5], except when conflicts are accounted for or measured at the sub-national scale[
14,
62].
The Rebel-based Conflicts in Okrika: In Okrika, under the rebel-conflicts typology, the spatial CVL Index most likely is (49%) in the 1986-2000 period. This increased to (65%) in 2000-2016 period. This increase also reflected in the reduction of very likely and likely categories. In 1986-2000 and the 2000–2016-year periods, spatial CVL Index under very likely reduced from (17%) to (1 %), while that of likely reduced from (30%) to (0%) within the two reference periods respectively.
The Territorial Conflicts in Okrika: In 1986-2000 the spatial CVL for
most likely was (33%) and this slightly increased to (34%) in 2000-2016. When compared with the Ogoni territory (Inland), it clearly shows that the coastland seemed to be more attractive resource conflicts that are associated with telluric resources[
63], thereby giving a strong indication of increased territorial conflicts in the future and mainly around the coastal area.
All Conflicts in Okrika: The spatial CVL Index most likely, increased from (16%) in 1986-2000 to (30%) in 2000-2016, while the spatial CVL Index very likely increased from (48%) in 1986-2000 to (60%) in 2000-2016 respectively. As mentioned earlier, when compared with the inland territory (Ogoni), the results show that conflicts seem to have diffused from the inland territory but clustered towards the coastal area.
4.2. Comparison of SEFLAME-CM with SMCE-CM
As earlier mentioned, to assess the SEFLAME-CM model, a comparison was made with SMCE-CM, a well-established model for evaluating problems involving multiple factors. Spatial statistics were applied for this comparison, which is crucial in the application of spatial analysis in the social sciences and addressing real-world problems in cross-disciplinary studies [
59,
60,
61].
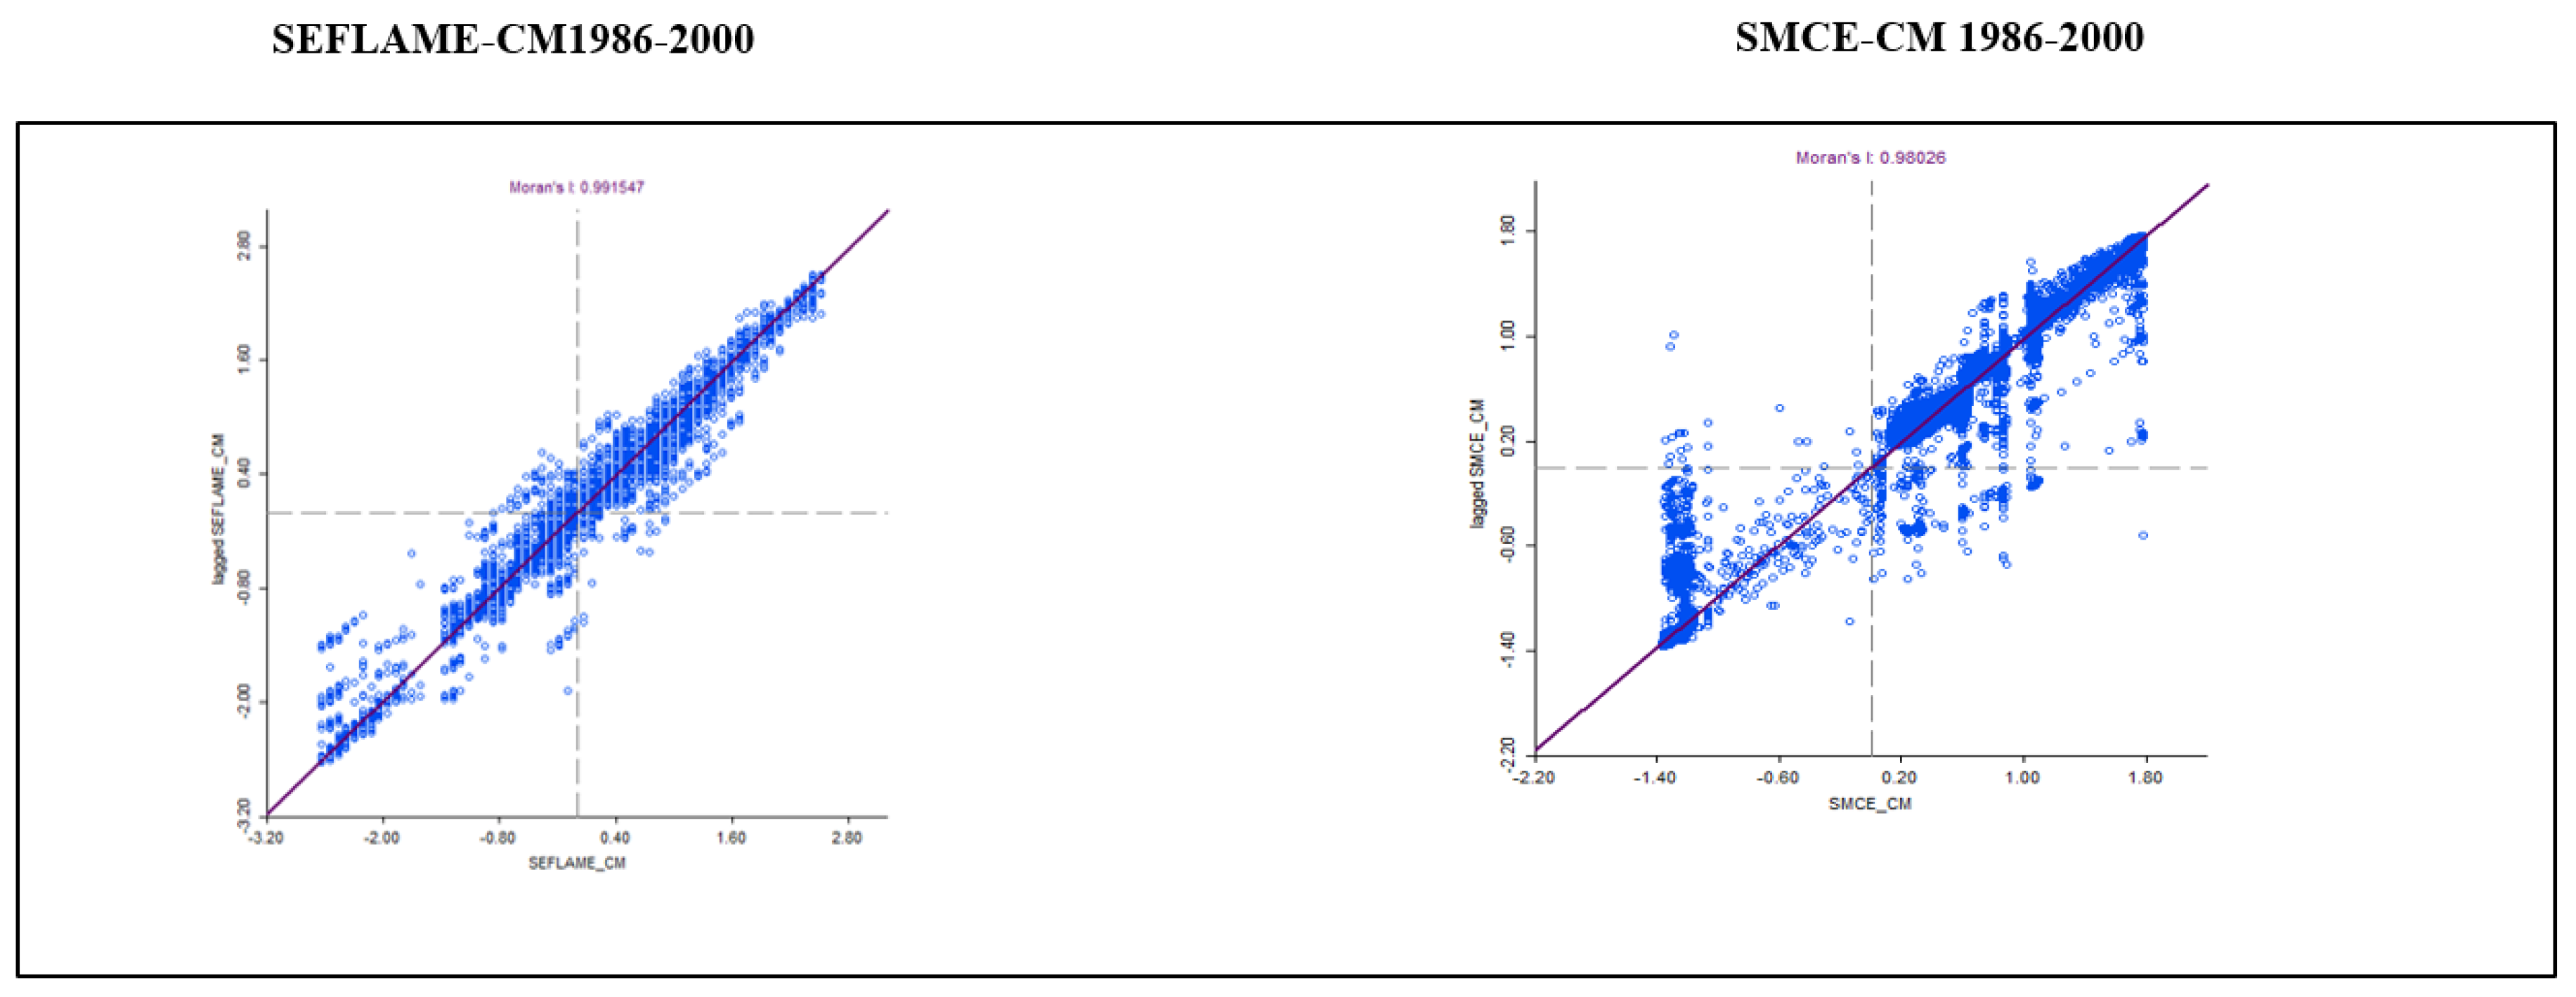
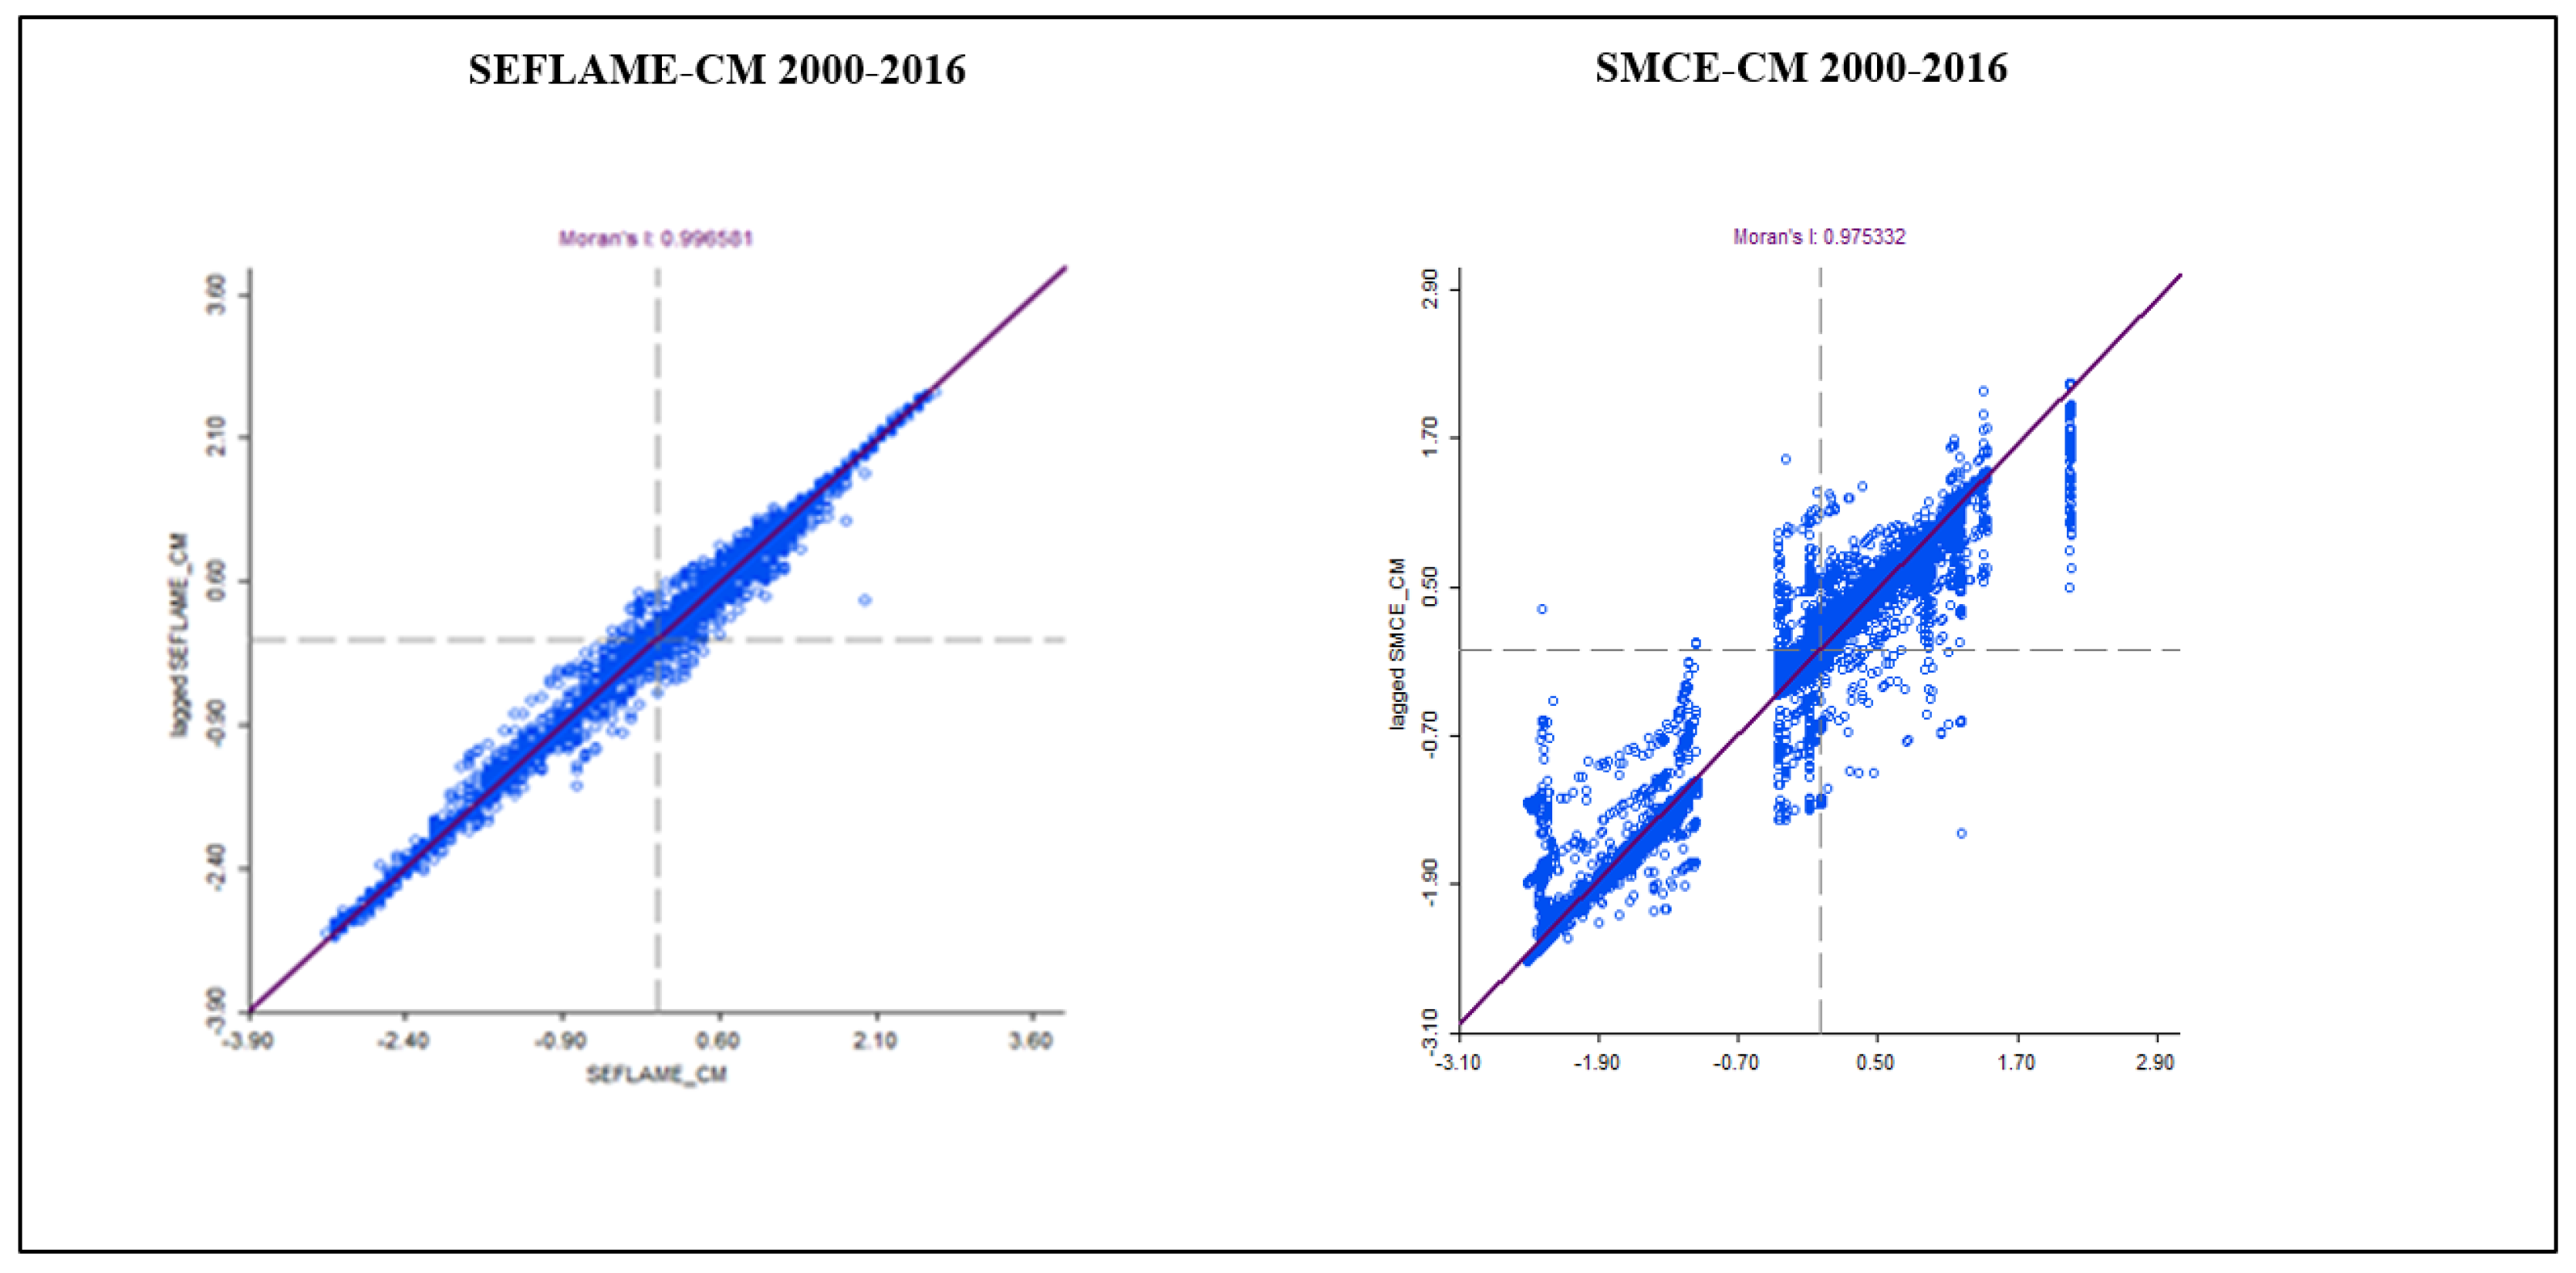
Figure 15 and
Figure 16 show the Moran’s
I scatter plots for the overall conflicts in 1986-2000 and 2000-2016. These plots reveal significant values of 0.99 and 0.98 for both the SEFLAME-CM and SMCE, respectively, indicating the presence of significant spatial autocorrelation in both models. In the Moran’s
I scatter plots, the horizontal axis shows the CVL Index as generated in the simulation using the SEFLAME-CM and the SMCE-CM, while the y-axis is the spatial lag (the weighted average of neighbouring values) [
64].
The Moran’s I scatter plot is divided into four distinct quadrants:
Upper right quadrant: These are communities with above-average index values, termed “high–high” communities. These are communities exhibit high average values and are surrounded by neighbours with high average values.
Lower left quadrant: These are communities with low average values and neighbours with low average values (low–low).
Lower right quadrant: These are communities with higher average values, surrounded by locations with lower average values (high–low).
Upper left quadrant: Like the lower right quadrant, the upper left quadrant are areas with low average values but surrounded by areas with higher average values (low–high)[
65].
The results of both SEFLAME-CM and SMCE-CM suggests that spatial explicit CVL Indices are not randomly distributed but rather follow a systematic pattern[
65,
66].
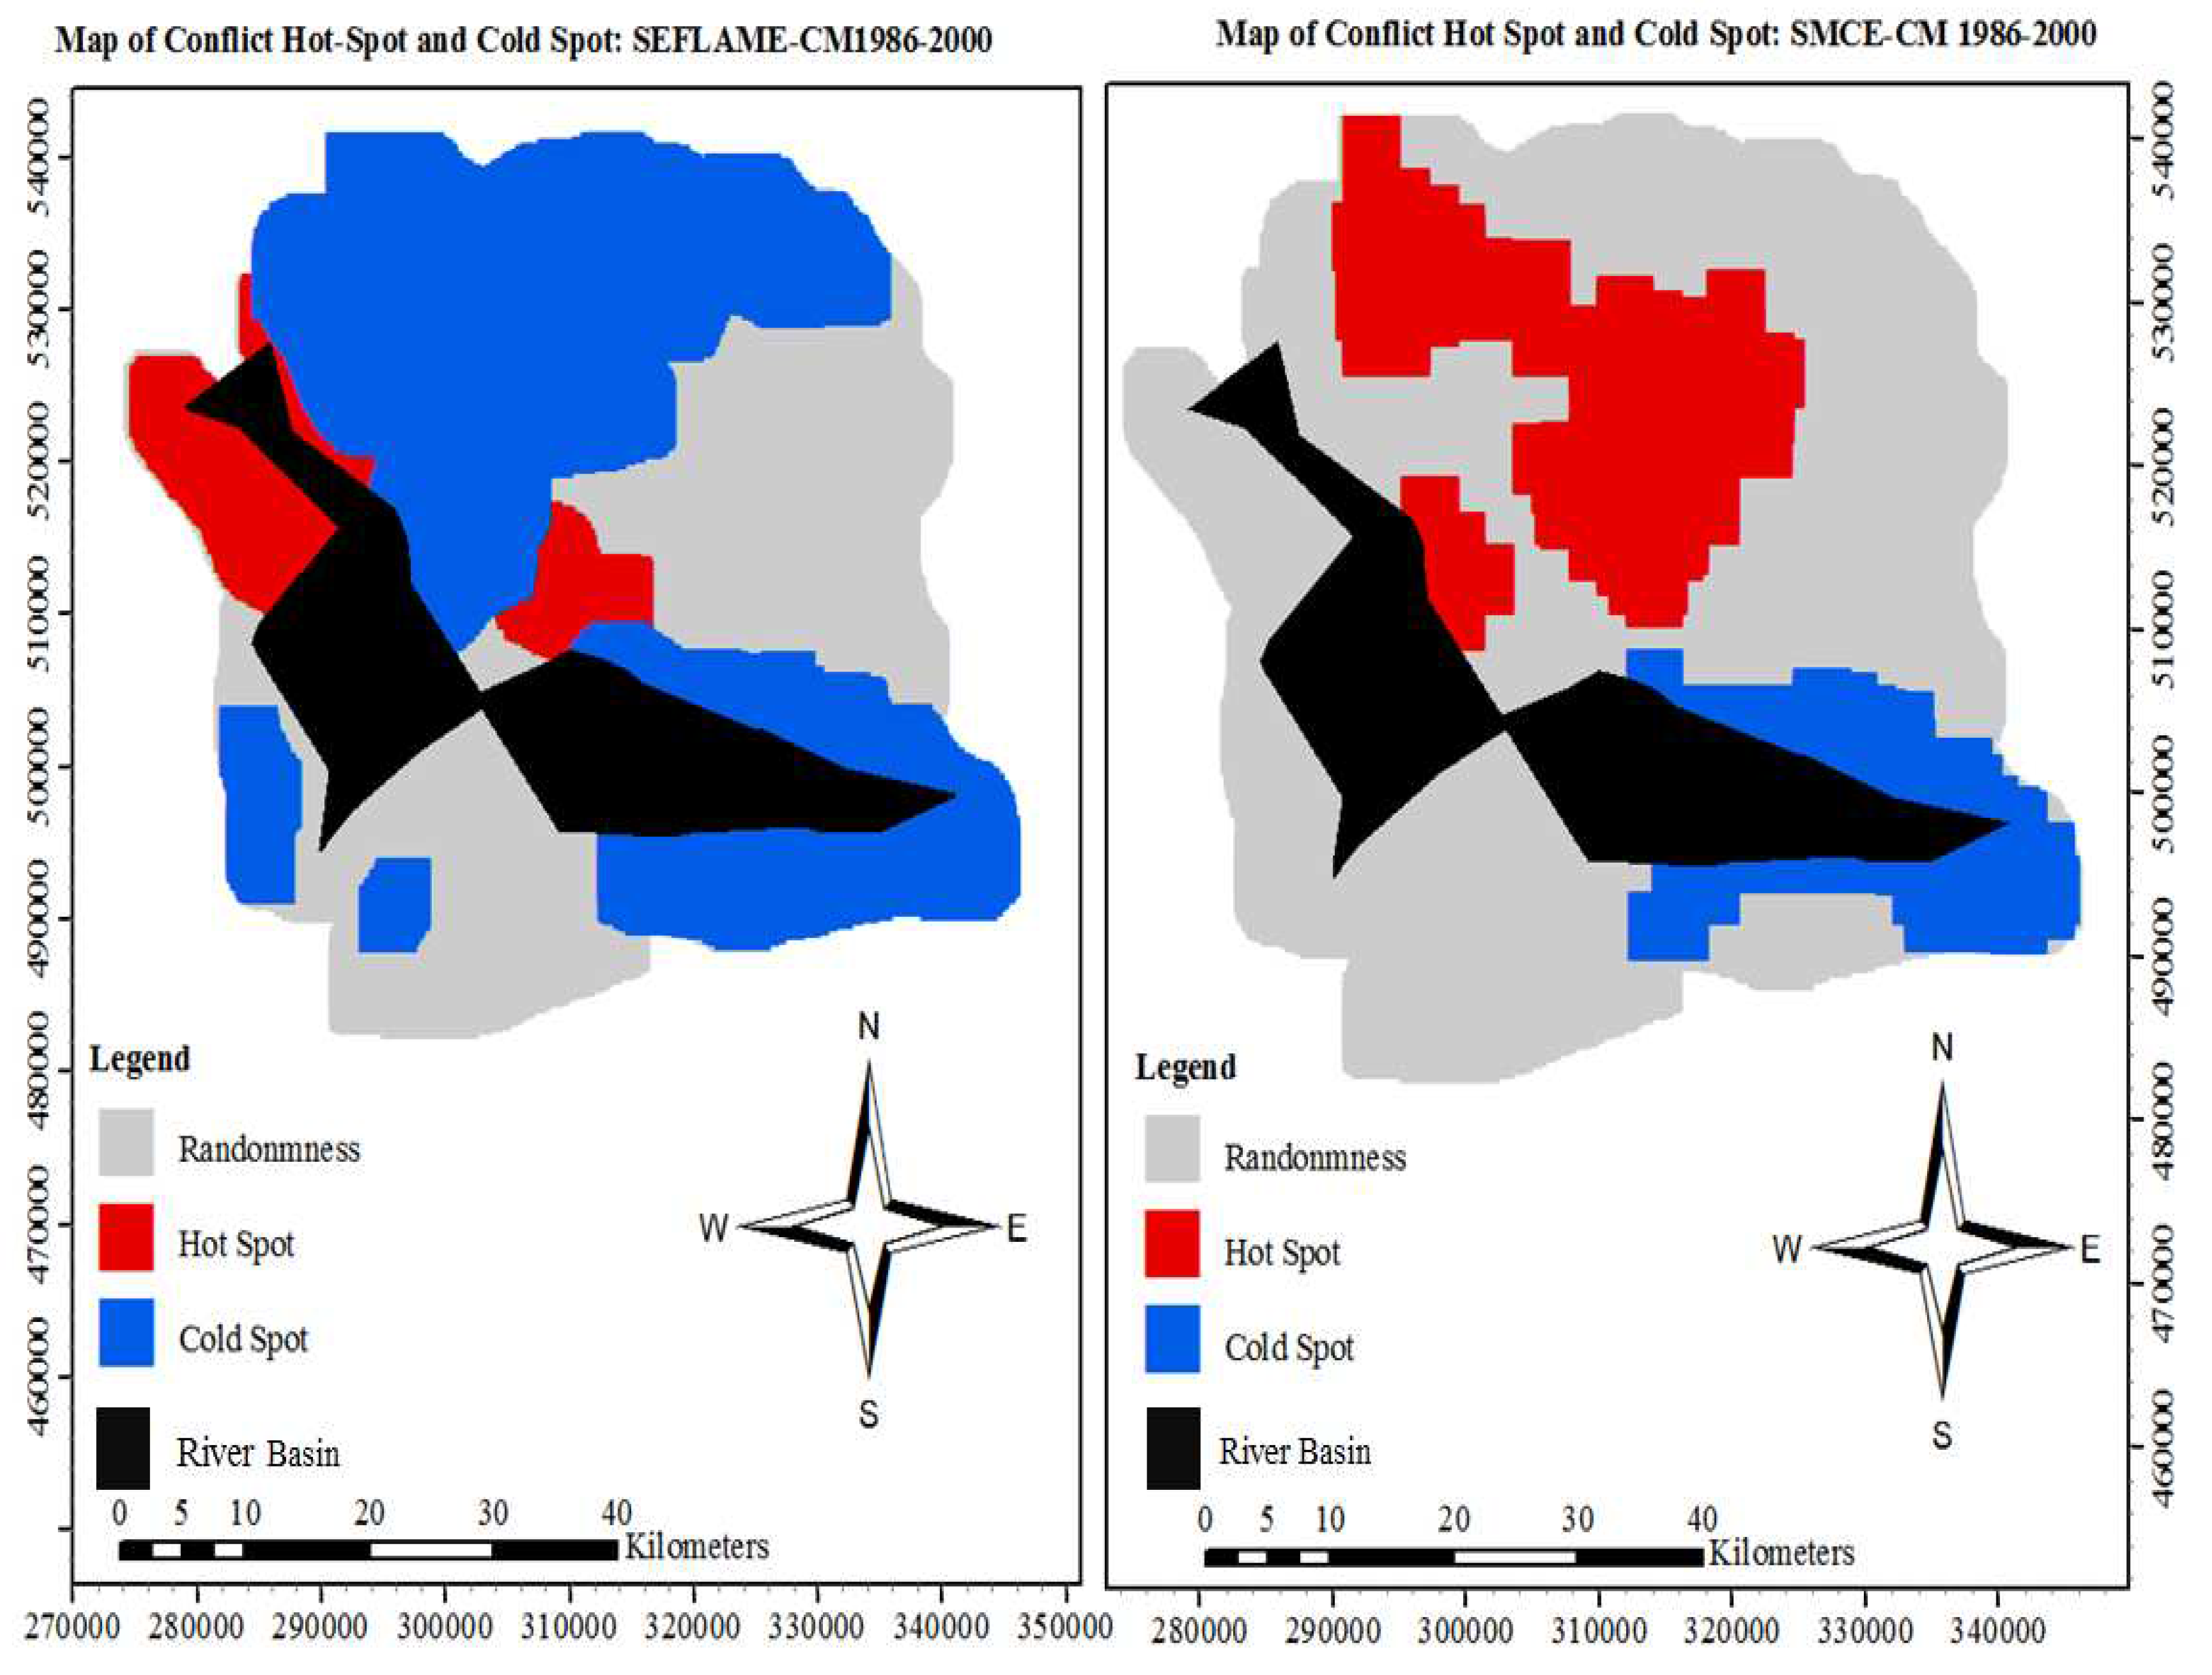
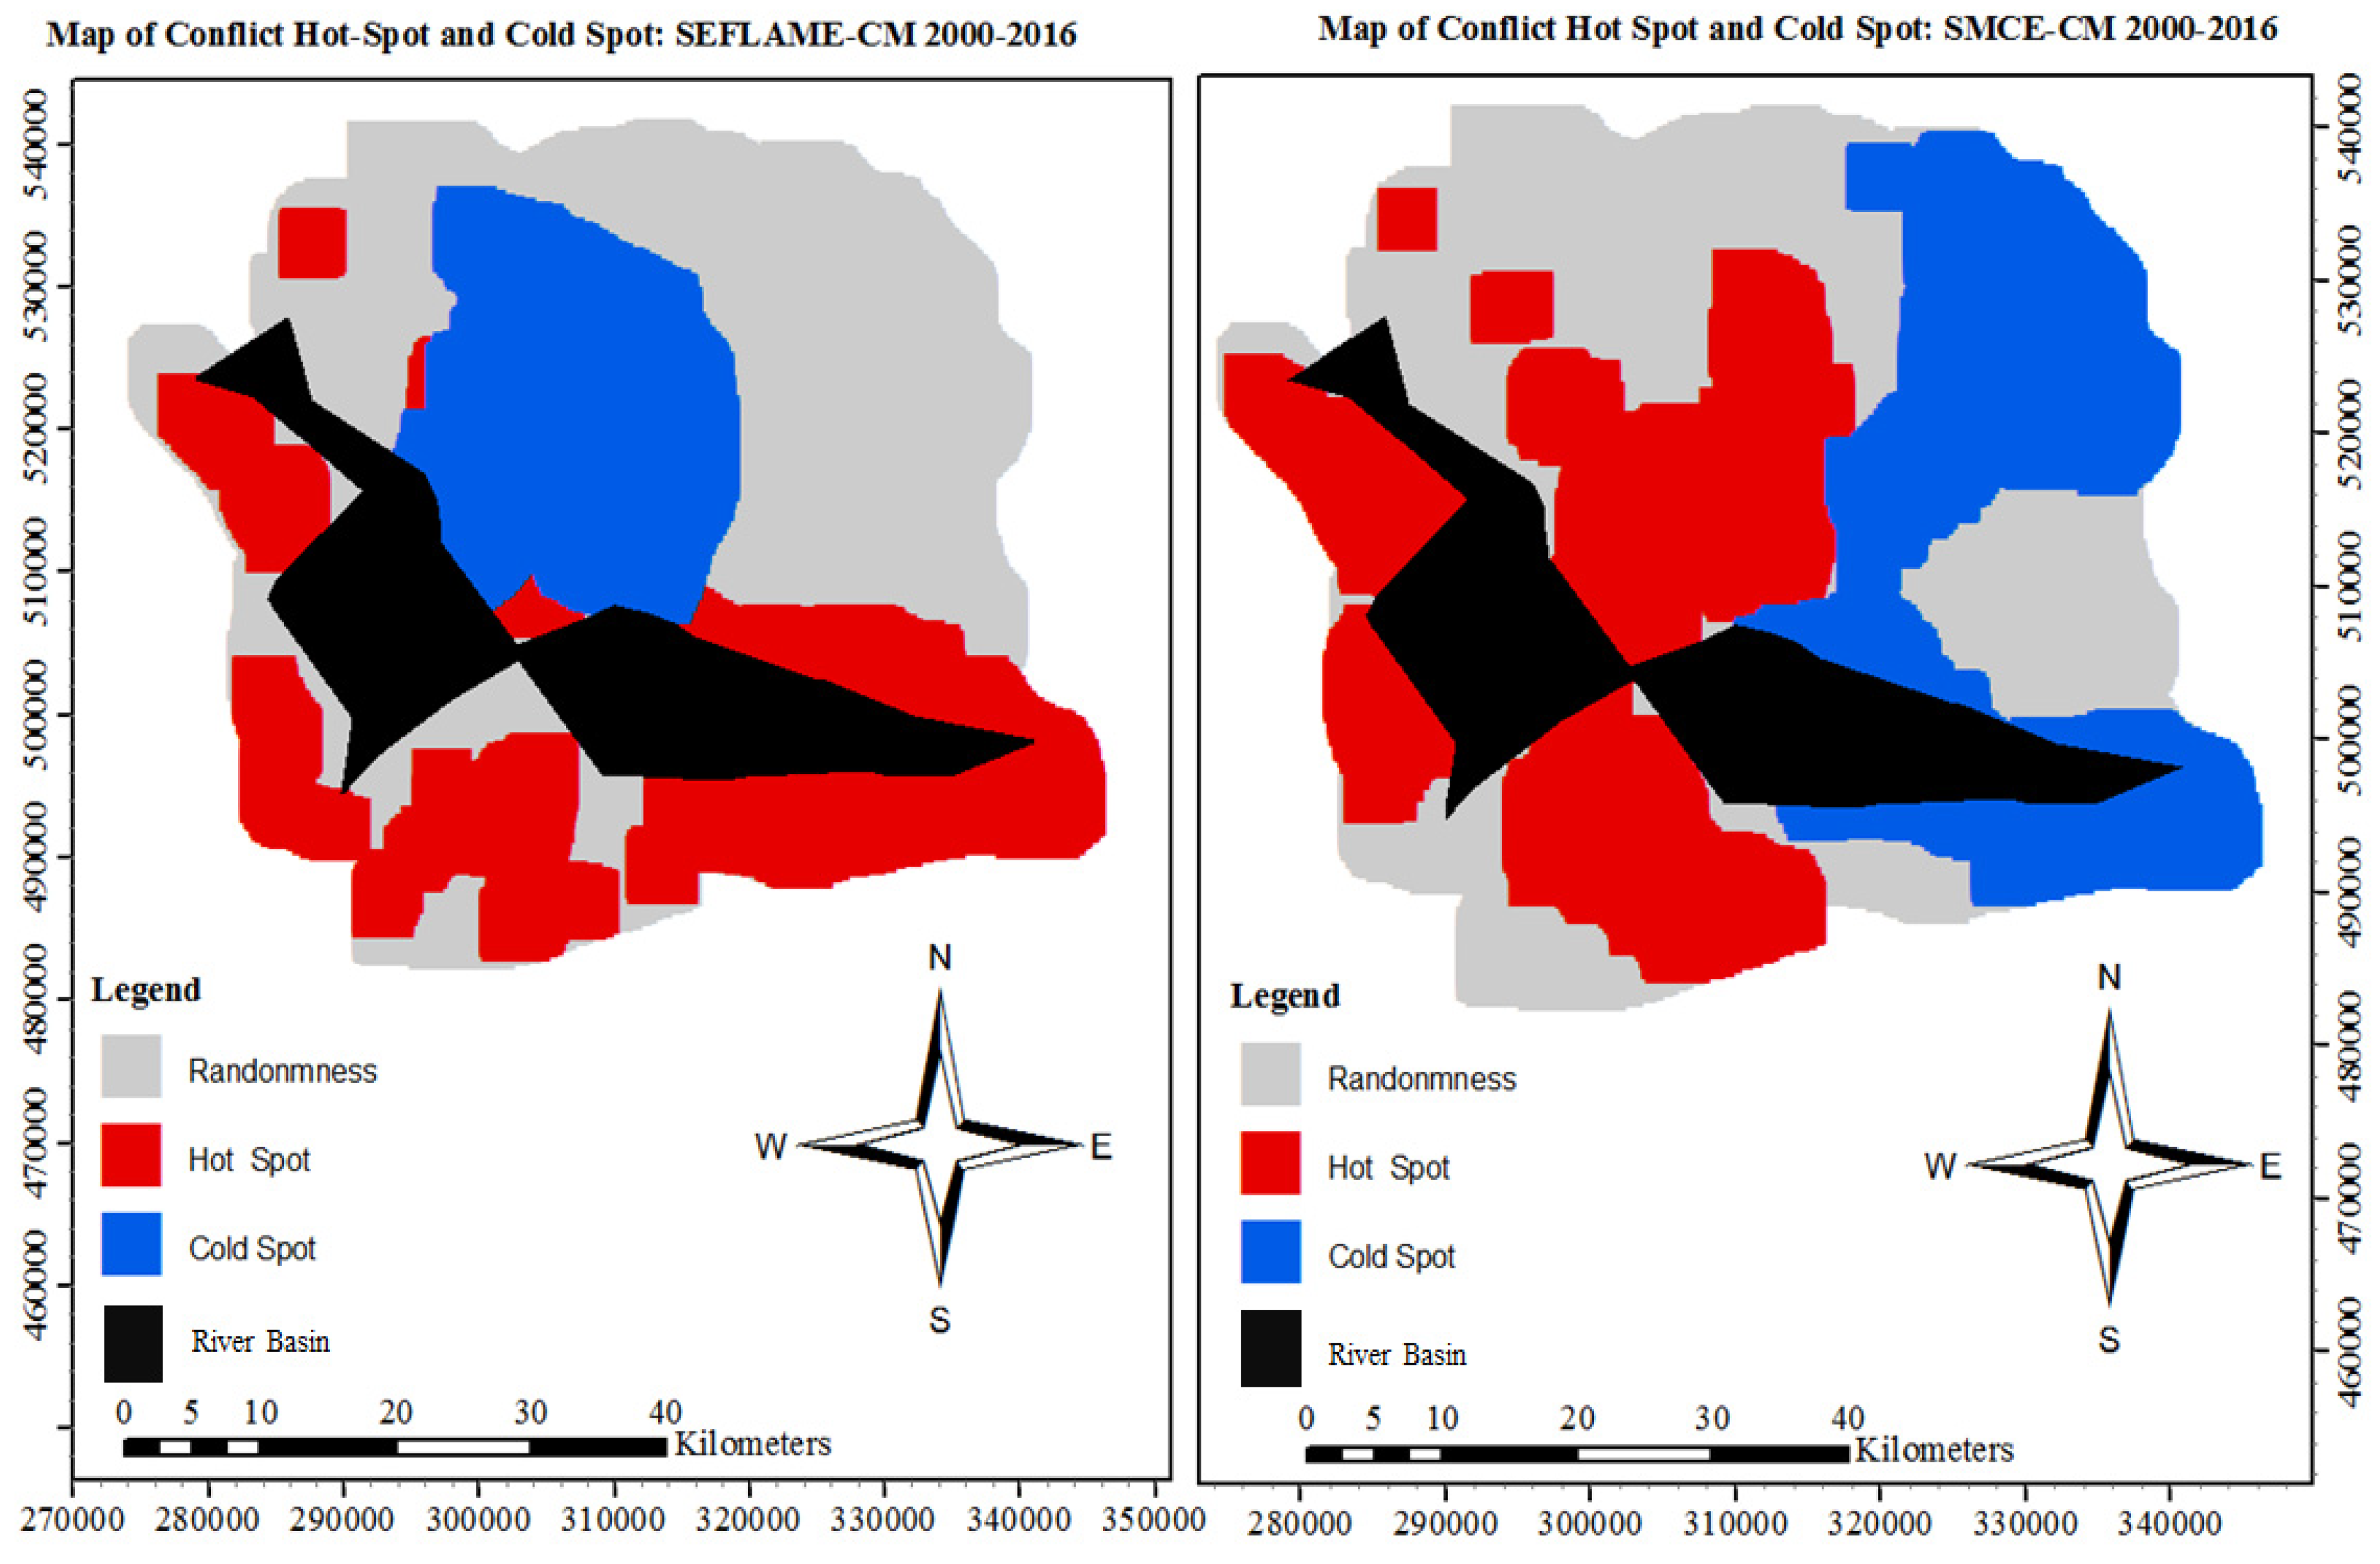
In the period from 1986-2000, the local Morans ’I show that the inland communities such as Okrika and Khana dominate the areas of hot spots in both the SFLAME-CM and the SMCE-CM (refer to Appendix E.1 and Appendix E.2 for the final conflict maps using both SEFLAME-CM and SMCE-CM for the 1986-2000 and 2000-2016 periods.). In contrast, in 2000-2016, the hot spot shifted coastward to communities such as Bonny, Finima and Opobo-Nkoro and Andoni (SEFLAME-CM) (see Appendix E.2).
It can be concluded that SEFLAME-CM shows promise as a robust model for modeling NRBCs, especially with further enhancements and the availability of better datasets. The current design of SMCE has key challenges with its implementation. Recent users of SMCE for spatial decision-making have found that it often requires customized design to improve its performance[
67,
68,
69]. While SMCE can be useful in resource conflict management and negotiations, it typically requires stakeholder participation from problem structuring and joint problem framing phases. SEFLAME-CM addresses this limitation effectively, particularly by incorporating a critical joint problem framing phase into its functionality. Both SEFLAME-CM and SMCE-CM can complement each other’s strengths when harnessed together. Therefore, the advantages of utilizing SEFLAME-CM as an innovative conflict management model include, but are not limited to:
Involvement of actor’s participation from the problem structuring phase.
Weighting of drivers of conflict generating the model inputs.
The transdisciplinary nature of the model because knowledge is derived from both the actors and from different disciplinary backgrounds.
The SEFLAME-CM has therefore proved very useful. While there is room for further improvement in the model’s quality, it has demonstrated the capacity of modeling a complex real-world problem in a transparent manner. In addition to validating the model with observed conflict datasets, further validation with remote sensing data has been conducted
Figure 14.
Descriptive statistics of natural resource-based conflicts for the inland (Ogoni) and coastal (Okrika) territories (1986-2000) and (2000-2016).
Figure 14.
Descriptive statistics of natural resource-based conflicts for the inland (Ogoni) and coastal (Okrika) territories (1986-2000) and (2000-2016).
Figure 15.
SEFLAME-CM (Left) vs SMCE–CM (right) for the CVL Index-1986-200. Moran’s scatter plot with the I value displayed at the top. Note: The x-axis is the value of I and the y-axis is the spatial lag (the weighted average of neighbouring values). The slope of the line is Moran’s I).
Figure 15.
SEFLAME-CM (Left) vs SMCE–CM (right) for the CVL Index-1986-200. Moran’s scatter plot with the I value displayed at the top. Note: The x-axis is the value of I and the y-axis is the spatial lag (the weighted average of neighbouring values). The slope of the line is Moran’s I).
Figure 16.
SEFLAME-CM (left) vs. SMCE–CM (right) for the CVL Index 2000-2016. Moran’s scatter plot with the I value displayed at the top. Note: The x-axis is the value of I and the y-axis is the spatial lag (the weighted average of neighbouring values). The slope of the line is Moran’s I).
Figure 16.
SEFLAME-CM (left) vs. SMCE–CM (right) for the CVL Index 2000-2016. Moran’s scatter plot with the I value displayed at the top. Note: The x-axis is the value of I and the y-axis is the spatial lag (the weighted average of neighbouring values). The slope of the line is Moran’s I).
5. Conclusions
This paper introduces an innovative approach to assess the vulnerability of individuals within the context of natural resource-based conflicts (NRBCs). We present the development of SEFLAME-CM, a spatially explicit fuzzy logic adapted model for conflict management. SEFLAME-CM serves as a tool to enhance the comprehensive assessment of vulnerability by considering both the external and internal driver components of NRBCs at the community scale. Our paper underscores the significance of spatial information technologies and knowledge exchange between experts and local stakeholders in effectively managing resource conflicts. We emphasize the need to address environmental degradation, socio-economic factors, and political drivers of resource conflicts both holistically and as individual factors. This approach is essential for understanding the intricate relationship between natural resources and conflicts at the community level. The policy implications derived from our research suggest that integrating these diverse drivers into conflict management is crucial for ensuring sustainability and peace. International and national interventions, including organizations such as DFID, UNDP, the World Bank, and national agencies like the Presidential Amnesty Program (PAP), should adopt an integrated approach that reflects the needs of affected communities and addresses the multifaceted issues underlying conflicts. While our paper demonstrates the potential of SEFLAME-CM, we acknowledge the necessity for further validation using data from additional sources, such as the integration of remotely sensed data. Despite variations in individual actors’ perceptions of conflict drivers, our hierarchical grouping approach defined 81 unique rules. This highlights the utility of fine-grained spatial and temporal analysis in supporting sustainable peace in resource-extractive regions and integrated coastal zone management (ICZM) strategies, despite the inherent limitations associated with complex social processes in real-world scenarios. The adaptability of our model to other NRBC cases in Africa and worldwide, especially in areas where natural resource extraction and conflicts intersect, positions it as a valuable tool for addressing resource-related challenges, even in data-scarce or imprecise environments. SEFLAME-CM represents a significant advancement compared to previous methods for analyzing resource-related conflicts, thanks to its nuanced approach in addressing the complex dimensions of NRBCs. Future studies should explore the applicability of SEFLAME-CM in other case studies, and its extended use can shed light on how multiple stakeholders can collaboratively solve resource conflict problems.
Author Contributions
Conceptualization, Dr. Lawrence Ibeh. and Dr. Deepak Rajendra Unune.; methodology, Dr. Lawrence Ibeh.; software, Prof. Dr Wolfram Mauser.; validation and correction, Dr. Lawrence Ibeh., Dr. Noah Mutai. and Dr. Nguyen Manh Cuong.; formal analysis and algorithm, Dr. Lawrence Ibeh; investigation, Dr. Lawrence Ibeh; platform and resources, Prof. Dr. Kyriakos Kouveliotis, data curation, Dr. Lawrence Ibeh.; writing—original draft preparation and writing, Dr. Lawrence Ibeh.; review and editing, Dr. Noah Mutai, Dr. Nguyen Manh Cuong, Dr. Anastasios Fountis, Dr. Anna Rostomyan, Dr. Svitlana Samoylenko, Ms. Olufunke Mercy Popoola.; visualization, Dr. Lawrence Ibeh.; supervision, Prof. Dr. Wolfram Mauser; Prof. Dr. Kyriakos Kouveliotis.; funding acquisition, Dr. Lawrence Ibeh. All authors have read and agreed to the published version of the manuscript.”.
Funding
The field work of this research received funding from the Rachel Carson Center, LMU München. Remote Sensing Data was supplied by the European Space Agency while the platform and resources for the final preparation of manuscript was made possible by the support of Berlin School of Business and Innovation (BSBI).
Informed Consent Statement
Informed consent was obtained from all subjects involved in the study.
Data Availability Statement
Data is available on request from the corresponding author.
Acknowledgments
We acknowledge the support of Prof. Dr. Kyriakos Kouveliotis for providing an enabling environment that made it possible to complete this paper.
Conflicts of Interest
The authors declare no conflict of interest.
References
- UNEP, “Toolkit and guidance for preventing and managing land and natural resources conflict,” Nairobi, 2012.
- UNEP, “UNEP Post 2015 Note: Environmental Dmensions of Resilient and Peaceful Societies.,” 2015. Accessed: Sep. 21, 2023. [Online]. Available: https://wedocs.unep.org/handle/20.500.11822/9674?show=full.
- A. Hoeffler, P. Collier, and D. Rohner, “Beyond Greed and Grievance: Feasibility and Civil War,” Oxf Econ Pap, vol. 61, pp. 1–27, Sep. 2009. [CrossRef]
- P. Collier and A. Hoeffler, “High-value natural resources, development, and conflict: Channels of causation,” High-Value Natural Resources and Peacebuilding, Sep. 2012.
- P. Collier, “Greed and Grievance in Civil War,” Oxf Econ Pap, vol. 56, pp. 563–595, Sep. 2004. [CrossRef]
- P. Collier and A. Hoeffler, “On Economic Causes of Civil Wars,” Oxf Econ Pap, vol. 50, pp. 563–573, Sep. 1998. [CrossRef]
- T. Homer-Dixon, J. Boutwell, and G. Rathjens, “Environmental Change and Violent Conflict,” Scientific American - SCI AMER, vol. 268, pp. 18–25, Sep. 2011. [CrossRef]
- T. Homer-Dixon and M. Levy, “Environment and Security,” Int Secur, vol. 20, pp. 189–198, Sep. 1995. [CrossRef]
- E. Ostrom, J. Burger, C. B. Field, R. B. Norgaard, and D. Policansky, “Revisiting the commons: Local lessons, global challenges,” Science, vol. 284, no. 5412. American Association for the Advancement of Science, pp. 278–282, Apr. 09, 1999. [CrossRef]
- J. Fearon, “Primary Commodity Exports and Civil War,” Journal of Conflict Resolution - J CONFLICT RESOLUT, vol. 49, pp. 483–507, Sep. 2005. [CrossRef]
- H. Brauch, “Building Sustainable Peace by Moving Towards Sustainability Transition,” in Addressing Global Environmental Challenges from a Peace Ecology Perspective. , vol. 4, 2016, pp. 145–179. [CrossRef]
- H. Brauch et al., Coping with Global Environmental Change, Disasters and Security: Threats, Challenges, Vulnerabilities and Risks. 2011. [CrossRef]
- H. Brauch, “Sustainable Peace in the Anthropocene: Towards Political Geoecology and Peace Ecology,” in Handbook on Sustainability Transition and Sustainable Peace, vol. 10, 2016, pp. 187–236. [CrossRef]
- H. Buhaug and P. Lujala, “Measuring Geography in Quantitative Studies of Civil War,” Polit Geogr, vol. 24, pp. 399–418, Sep. 2005. [CrossRef]
- T. Bernauer and N. Gleditsch, “New Event Data in Conflict Research,” International Interactions - INT INTERACT, vol. 38, pp. 375–381, Sep. 2012. [CrossRef]
- P. Johansson, “Nurturing Adaptive Peace: Resilience Thinking for Peacebuilders,” in the Fifteenth Biennial Conference of the International Association for the Study of the Commons, 2015, pp. 2–15. Accessed: Sep. 21, 2023. [Online]. Available: https://dlc.dlib.indiana.edu/dlc/bitstream/handle/10535/9838/Johansson_Patrik_Adaptive_Peace_May15.pdf?sequence=1&isAllowed=y.
- B. Ratner, R. Meinzen-Dick, C. May, and E. Haglund, “Resource Conflict, Collective Action, and Resilience: An Analytical Framework,” Int J Commons, vol. 7, Sep. 2013. [CrossRef]
- B. Sivakumar, “Water Crisis: From Conflict to Cooperation. An Overview,” Hydrol Sci J, vol. 56, pp. 531–552, Sep. 2011. [CrossRef]
- F. Ekong, J. Atser, and S. Ebong, “Water Resource Management in the Niger Delta Region of Nigeria: The Role of Physical Planning,” International Review of Social Sciences and Humanities, vol. 3, pp. 51–61, Sep. 2012.
- S. Gray, A. Chan, D. Clark, and R. Jordan, “Modeling the integration of stakeholder knowledge in social–ecological decision-making: Benefits and limitations to knowledge diversity,” Ecological Modelling - ECOL MODEL, vol. 229, Sep. 2011. [CrossRef]
- U. Okpara, L. Stringer, and A. Dougill, “Using a novel climate–water conflict vulnerability index to capture double exposures in Lake Chad,” Reg Environ Change, vol. 17, Sep. 2017. [CrossRef]
- L. Ibeh, “A Transdisciplinary-Based Coupled Approach For Vulnerability Assessment in the Context of Natural Resource-Based Conflicts Using Remote Sensing, Spatial Statistics and Fuzzy Logic Adapted Models,” LMU, München, 2019. [CrossRef]
- W. Mauser et al., “Transdisciplinary global change research: The co-creation of knowledge for sustainability,” Current Opinion in Environmental Sustainability, vol. 5, no. 3–4. pp. 420–431, Sep. 2013. [CrossRef]
- L. C. Woodall, S. Talma, O. Steeds, P. Stefanoudis, M. M. Jeremie-Muzungaile, and A. De Comarmond, “Co-development, co-production and co-dissemination of scientific research: A case study to demonstrate mutual benefits,” Biol Lett, vol. 17, no. 4, Apr. 2021. [CrossRef]
- S. Rustad and H. Binningsbø, “A Price Worth Fighting For? Natural Resources and Conflict Recurrence,” J Peace Res, vol. 49, pp. 531–546, Sep. 2012. [CrossRef]
- H. Buhaug and K. Gleditsch, “Contagion or Confusion? Why Conflicts Cluster in Space,” International Studies Quarterly, vol. 52, pp. 215–233, Sep. 2008. [CrossRef]
- L. Zadeh, “From Computing with Numbers to Computing with Words — from Manipulation of Measurements to Manipulation of Perceptions,” in American Institute of Physics, vol. 12, 2005, pp. 507–544. [CrossRef]
- L. Zadeh, “A New Direction in AI: Toward a Computational Theory of Perceptions,” AI Mag, vol. 22, p. 628, Sep. 2001. [CrossRef]
- A., & O. E. AGRAWAL, “Collective Action, Property Rights, and Decentralization in Resource Use in India and Nepal.,” Politics & Society, vol. 29, no. 4, pp. 485–514, 2001. [CrossRef]
- Ostrom E, “A general framework for analyzing sustainability of social-ecological systems,” Science (1979), vol. 325, no. 5939, pp. 419–422, Jul. 2009.
- A. Oyefusi, “Oil, Youths, and Civil Unrest in Nigeria’s Delta: The Role of Schooling, Educational Attainments, Earnings, and Unemployment,” Conflict Management and Peace Science, vol. 27, pp. 326–346, Sep. 2010. [CrossRef]
- A. Oyefusi, “Oil and the Probability of Rebel Participation Among Youths in the Niger Delta of Nigeria,” Journal of Peace Research - J PEACE RES, vol. 45, pp. 539–555, Sep. 2008. [CrossRef]
- E. F. Lambin, “Modelling and monitoring land-cover change processes in tropical regions,” Prog Phys Geogr, vol. 21, pp. 375–393, 1997, [Online]. Available: https://api.semanticscholar.org/CorpusID:128012656. [CrossRef]
- J. R. Anderson, E. E. Hardy, J. T. Roach, and R. E. Witmer, “A Land Use and Land Cover Classification System for Use with Remote Sensor Data,” 1976. [CrossRef]
- D. A. Mengistu and A. T. Salami, “Application of remote sensing and GIS inland use/land cover mapping and change detection in a part of south western Nigeria,” Afr J Environ Sci Tech, vol. 1, no. 5, pp. 99–109, 2007, [Online]. Available: http://www.academicjournals.org/AJEST.
- S. Z. Aldwaik and R. G. Pontius, “Intensity analysis to unify measurements of size and stationarity of land changes by interval, category, and transition,” Landsc Urban Plan, vol. 106, no. 1, pp. 103–114, May 2012. [CrossRef]
- J. Brennan and E. Martin, “Spatial proximity is more than just a distance measure,” Int. J. Hum.-Comput. Stud., vol. 70, pp. 88–106, Sep. 2012. [CrossRef]
- P. Lujala, J. K. Rød, and N. Thieme, “Fighting Over Oil: Introducing a New Dataset,” Conflict Management and Peace Science - CONFLICT MANAG PEACE SCI, vol. 24, pp. 239–256, Sep. 2007. [CrossRef]
- P. Lujala, “The spoils of nature: Armed civil conflict and rebel access to natural resources,” J Peace Res, vol. 47, pp. 15–28, Sep. 2010. [CrossRef]
- F. Liu and J. Mendel, “Encoding Words Into Interval Type-2 Fuzzy Sets Using an Interval Approach,” Fuzzy Systems, IEEE Transactions on, vol. 16, pp. 1503–1521, Sep. 2009. [CrossRef]
- J. Zhao and B. Bose, “Evaluation of membership functions for fuzzy logic controlled induction motor drive,” Sep. 2002, pp. 229–234 vol.1. [CrossRef]
- R. Sicat, E. J. Carranza, and U. Nidumolu, “Fuzzy modeling of farmers’ knowledge for land suitability classification,” Agric Syst, vol. 83, pp. 49–75, Sep. 2005. [CrossRef]
- MATLAB, “MATLAB ® User’s Guide Fuzzy Logic Toolbox Computation Programming Visualization,” Hill Drive Natick, MA 01760-2098, 2015. [Online]. Available: http://www.mathworks.com.
- H.-J. Zimmermann, Fuzzy Set Theory – and Its Applications, vol. 2001. 2001. [CrossRef]
- H. Hellendoorn and C. Thomas, “On Quality Defuzzification,” in Fuzzy Logic and its Applications to Engineering, Information Sciences, and Intelligent Systems, 1995, pp. 167–176. [CrossRef]
- L. A. Acosta-Michlik, K. S. Kavi Kumar, R. J. T. Klein, and S. Campe, “Application of fuzzy models to assess susceptibility to droughts from a socio-economic perspective,” Reg Environ Change, vol. 8, no. 4, pp. 151–160, Dec. 2008. [CrossRef]
- T. Ross, “Fuzzy Logic With Engineering Applications,” Fuzzy Logic with Engineering Applications: Third Edition, Sep. 1995. [CrossRef]
- T. J. Ross, Fuzzy logic with engineering applications. John Wiley, 2010.
- C. P. Pappis and C. Siettos, “Fuzzy reasoning,” in Search Methodologies—Introductory Tutorials in Optimization and Decision Support Techniques, E. K. Burke and G. Kendall, Eds., 2014, pp. 519–556. [CrossRef]
- J. Fritzsch, “A Composite Fuzzy Indicator for Assessing Farm Household Potential for Non-farm Income Diversification,” Sep. 2011.
- S. N. Sivanandam, S. Sumathi, and S. N. Deepa, Introduction to fuzzy logic using MATLAB. Springer, 2007.
- A. Ikelegbe and N. Umukoro, “Exclusion and Peacebuilding in the Niger Delta of Nigeria: An Assessment of the Presidential Amnesty Programme,” Journal of Peacebuilding & Development, vol. 11, pp. 25–36, Sep. 2016. [CrossRef]
- R. K. UDO, Geographical Regions of Nigeria. California: University of California Press , 1970.
- J. Agbonifo, “Niger Delta conflicts: Place and contentious mobilisation,” Interface: A journal for and about social movements , vol. 3, no. 1, pp. 240–265, 2011.
- C. Acey, “Managing wickedness in the Niger Delta: Can a new approach to multi-stakeholder governance increase voice and sustainability?,” Landsc Urban Plan, vol. 154, pp. 102–114, Oct. 2016. [CrossRef]
- P. Slovic, The Perception of Risk. Praeger, Westport, CT:, 2016. [CrossRef]
- F. Herrera, S. Alonso, F. Chiclana, and E. Herrera-Viedma, “Computing with words in decision making: Foundations, trends and prospects,” Fuzzy Optimization and Decision Making, vol. 8, pp. 337–364, Sep. 2009. [CrossRef]
- ITC, “ILWIS 3.0 for Windows The Integrated Land and Water Information System User’s Guide,” 2005. [Online]. Available: http://www.itc.nl/ilwis/.
- L. Anselin, “The future of spatial analysis in the social sciences,” Geographic Information Sciences, vol. 5, no. 2, pp. 67–76, Dec. 1999. [CrossRef]
- L. Anselin, “Spatial Models in Econometric Research Location Analysis View project A Spatial Perspective on the Econometrics of Health Program Evaluation View project,” 2021. [CrossRef]
- M. Goodchild, L. Anselin, R. Appelbaum, and B. Harthorn, “Toward Spatially Integrated Social Science,” International Regional Science Review - INT REG SCI REV, vol. 23, pp. 139–159, Sep. 2000. [CrossRef]
- H. Buhaug, S. Gates, and P. Lujala, “Geography, Rebel Capability, and the Duration of Civil Conflict,” Journal of Conflict Resolution - J CONFLICT RESOLUT, vol. 53, pp. 544–569, Sep. 2009. [CrossRef]
- B. Korf, “Resources, violence and the telluric geographies of small wars,” Prog Hum Geogr, vol. 35, Sep. 2011. [CrossRef]
- L. Khatiwada, “A spatial approach in locating and explaining conflict hot spots in Nepal,” Eurasian Geogr Econ, vol. 55, pp. 201–217, Sep. 2014. [CrossRef]
- P. Voss, D. Long, R. Hammer, and S. Friedman, “County Child Poverty Rates in the US: A Spatial Regression Approach,” Popul Res Policy Rev, vol. 25, pp. 369–391, Sep. 2006. [CrossRef]
- A. Rupasingha and S. Goetz, “Social and political forces as determinants of poverty: A spatial analysis,” Journal of Socio-Economics, vol. 36, pp. 650–671, Sep. 2007. [CrossRef]
- Y. Hua, B. Cui, W. He, and Y. Cai, “Identifying potential restoration areas of freshwater wetlands in a river delta,” Ecol Indic, vol. 71, pp. 438-448., 2016, [Online]. Available: http://www.elsevier.com/open-access/userlicense/1.0/2.
- S. T. Moghadam, C. Delmastro, P. Lombardi, and S. P. Corgnati, “Towards a New Integrated Spatial Decision Support System in Urban Context,” Procedia Soc Behav Sci, vol. 223, pp. 974–981, Jun. 2016. [CrossRef]
- V. Ferretti and G. Montibeller, “Key challenges and meta-choices in designing and applying multi-criteria spatial decision support systems Article (Accepted version) (Refereed),” 2016.
|
Disclaimer/Publisher’s Note: The statements, opinions and data contained in all publications are solely those of the individual author(s) and contributor(s) and not of MDPI and/or the editor(s). MDPI and/or the editor(s) disclaim responsibility for any injury to people or property resulting from any ideas, methods, instructions or products referred to in the content. |
© 2023 by the authors. Licensee MDPI, Basel, Switzerland. This article is an open access article distributed under the terms and conditions of the Creative Commons Attribution (CC BY) license (http://creativecommons.org/licenses/by/4.0/).
