1. Introduction
Owing to their enhanced design flexibility and cost-effective manufacturing solutions, utilization of polymer materials in engineering production technologies, such as injection moulding and additive manufacturing, has brought about significant advancements across diverse industries [
1,
2,
3].
However, concerns have been raised regarding the potential fire and explosion hazards associated with the increasing use of polymer powders in these processes.
Common flammable dust accidents are urging industrial process managers to focus on flammable powder properties and safer designs. Underestimating risks during safety analyses is often due to a lack of understanding and insufficient analysis of characteristic explosion parameters. The absence of experimental data poses a risk of underestimating process hazard and overestimating safety measures [
4,
5,
6].
Preventing explosion hazards involves knowing the characteristics of dust parameters, such as the minimum ignition energy (MIE), the maximum rate of pressure rise (explosion constant - K
st), the dust minimum oxygen concentration (MOC), the maximum pressure P
max, the minimum ignition temperature of the dust layer (MITL), the minimum ignition temperature of the dust cloud (MITC) or the limiting oxygen concentration (LOC) [
6,
7,
8].
Understanding the explosion characteristics becomes vital for preventing dust explosions. Measuring the explosion severity and ignition sensitivity parameters of polymers dust is of utmost importance for enterprises in order to prevent and mitigate potential polymers dust explosions.
The aim of the research was to investigate and analyse the fire and explosion characteristics of various polymer powders commonly used in engineering production technologies. Thanks to conducted comprehensive experimental studies, this paper provides valuable insights into the behaviour of polymer powders under different conditions and concentrations, while shedding light on potential risks and safety implications in industrial settings.
2. Materials and Methods
Three samples of polymers used in production technologies were tested – PA12 polyamide, UMHW PE polyethylene and PP polypropylene. The samples were not treated before the measurement. The characterization of their properties (granulometry, LSM, SEM, X-RAY and FTIR) is presented in the following sections of the presented article.
2.1. Polyamide PA 12
The study investigated Polyamide PA 12 by VESTOSINT® X7004 trade name, a polymer polyamide 12 powder utilized for injection moulded parts and high-quality sintered coatings. According to the Material Safety Data Sheet (MSDS), the melting point of PA12 is 180°C (ISO 11 253), [
9,
10].
Thermogravimetric analysis [
11] demonstrated that the melting point of PA12 is 185°C, with the decomposition of its chains commencing at a temperature of 325°C.
In our previous study, the polymer powder PA12 Sinterit utilized in laser sintering was found to be known for exhibiting explosive characteristics. The highest explosion overpressure recorded for the sample was 6.78 bar at a concentration of 750 g.m
-3 [
12].
Another study focused on the incendiary powder PA12 with a bimodal particle size distribution (10 μm and 55 μm). It was revealed that the minimum ignition energy of PA12 is below 40mJ for the concentrations approaching 1000 g.m
-3 [
7].
In the field of laser sintering, semi-crystalline thermoplastics, particularly polyamides (Polyamide PA 12 and Polyamide PA 11), are the most commonly utilized polymers. These polyamides account for over 95% of the available powder used in the polymer additive manufacturing market within the industry [
13,
14].
2.2. Polypropylene PP
For the measurements, natural polypropylene from Borealis (Austria) known as BorPlus SE523MO was utilized. This particular grade of polypropylene is intended for rotational moulding applications and has been specially designed to improve impact performance, particularly in low-temperature conditions. [
15,
16].
Polypropylene (PP), a type of polymer, is widely utilized in various industries, including transportation, furniture, automotive, insulation, electronics, electric casings, interior decorations, and architectural materials [
17,
18].
In one study, the thermal decomposition temperature of PP in the air atmosphere was found to be 250°C. The particle size distribution was observed to reach d(10) = 8.64 µm, d(50) = 29.2 µm, and d(90) = 128 µm. The maximum values of P
max and K
st were measured at 8 bar and 257 bar.m.s
-1, respectively. P
max and K
st exhibited an initial increase with the rise in dust concentration, followed by a decrease. Furthermore, the Minimum Explosible Concentration (MEC) of PP powders was determined to be 25 g.m
-3 [
18]. The melting point of PP was in the range of 150- 166°C, flash point >300°C [
19,
20].
2.3. Polyethylene UHMW- PE
For the experiment, a powder of Ultra-High Molecular Weight Polyethylene (UHMW-PE), known as GUR®2024 -PE-UHMW and produced by Celanese (United States) was used. This material demonstrates a significantly higher molecular weight compared to standard PE and exhibits a density of 930 kg/m
3. UHMWPE is known for its high wear resistance, high toughness, high impact strength and low friction coefficient, as well as durability, biocompatibility and chemical inertness and excellent mechanical characteristics, even in cryogenic conditions. Its MFR (Melt Flow Rate) temperature is 190°C, and it can be processed through compression moulding and film extrusion techniques [
21].
The melting point of UHMWPE was found to be around 136°C, and the decomposition of its chains begins at a temperature of 429°C, as shown by thermogravimetric analysis [
22].
Typically, the UHMWPE powder, as it is after polymerization, undergoes processing through ram extrusion or compression moulding techniques at elevated temperatures (200–240 °C) and high pressures (8–10 MPa) [
23]. These processes are intricate, costly, and time-consuming, often requiring several hours to complete. In 2007, a new approach to UHMWPE processing was introduced, known as impact compaction [
24]. This method involves applying a series of blows from an impactor to the powder enclosed in a metal mould, resulting in cyclic impact compaction. This technology allows for the rapid production of small, flat-shaped parts in just a few minutes.
2.4. Granulometry, topography (LSM, SEM), X-RAY, FTIR and TGA of the samples
These techniques are commonly used in materials science and research to analyse the properties, composition, and behaviour of various materials. They provide valuable insights into the structure and characteristics of materials at different levels of detail.
2.4.1. Granulometry
The proportion of dimensional fractions of the Polyamide PA 12, Polypropylene and UHMW Polethylene samples was determined by sieve analysis. The analysis procedure was performed according to the EN 933-1 Standard [
25]. The analysis was conducted on a Retsch AS 200 sieving machine with a sieving time of 15 min and an amplitude of 2 mm/G. The results of samples sieve analysis with median value are given in
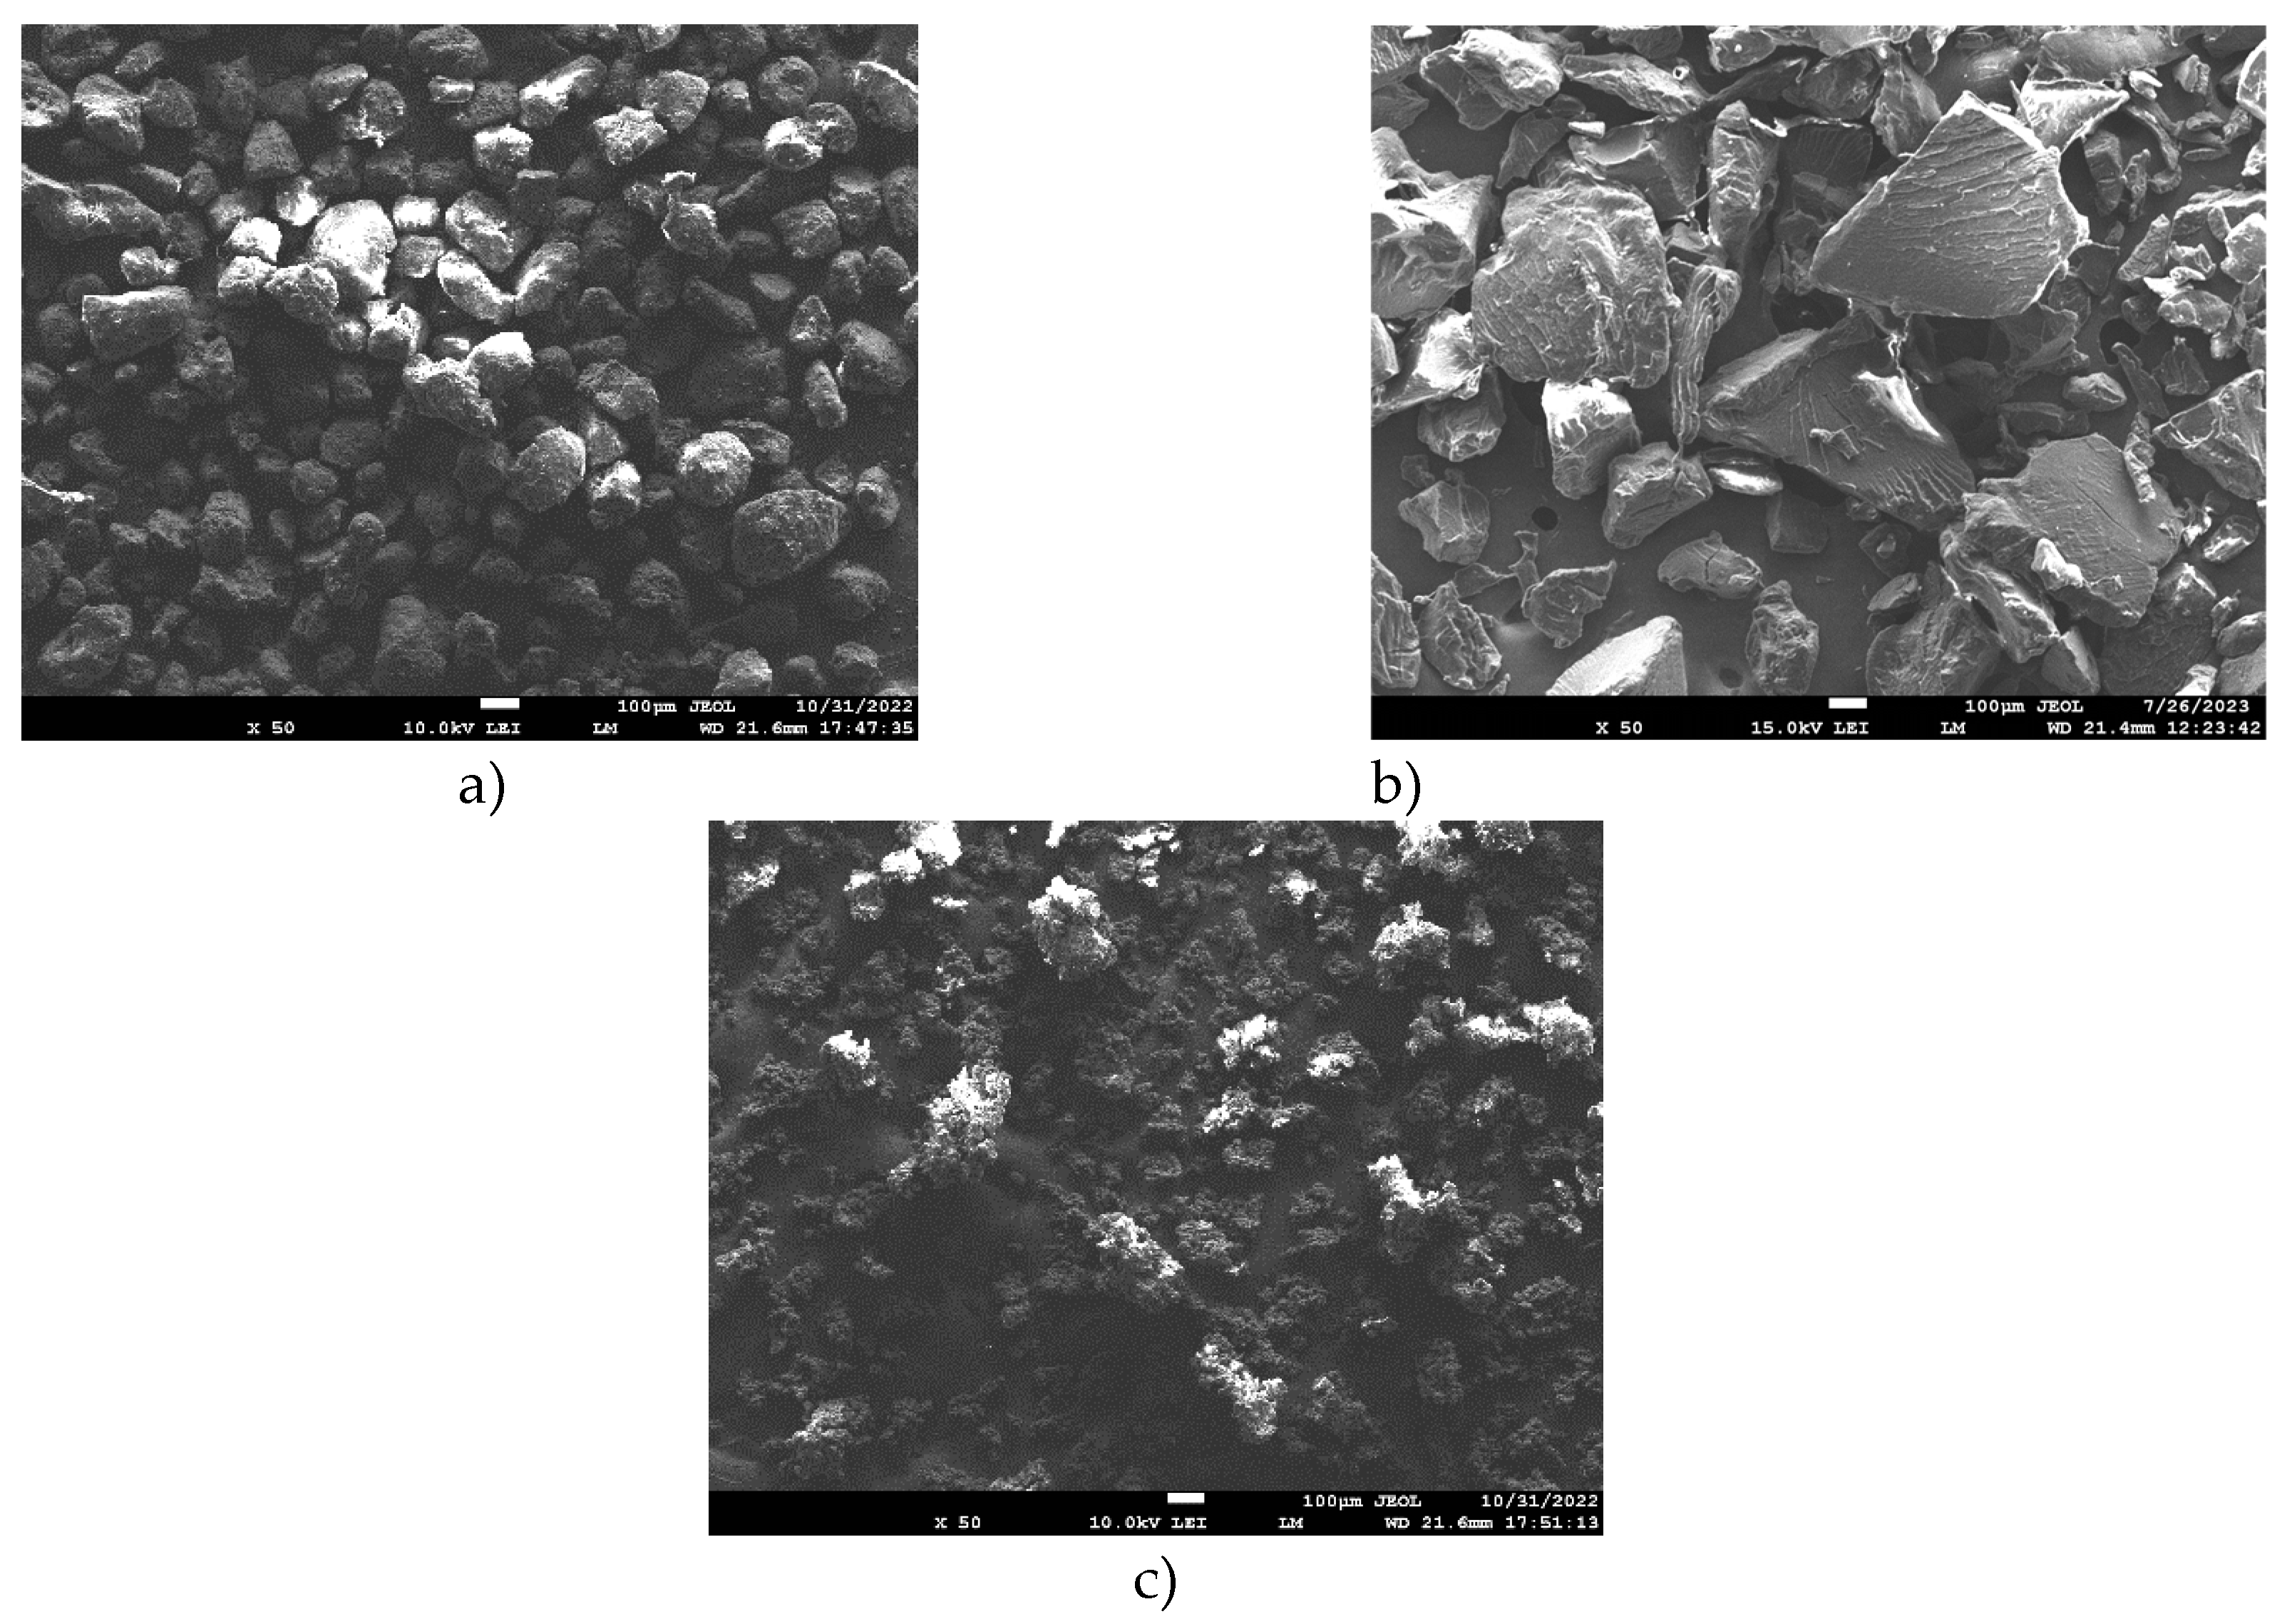
Table 1. The particle shape of the Polyamide PA12, Polypropylene and UHMW Polyethylene powder is shown in
Figure 1 and
Figure 2.
2.4.2. Topography
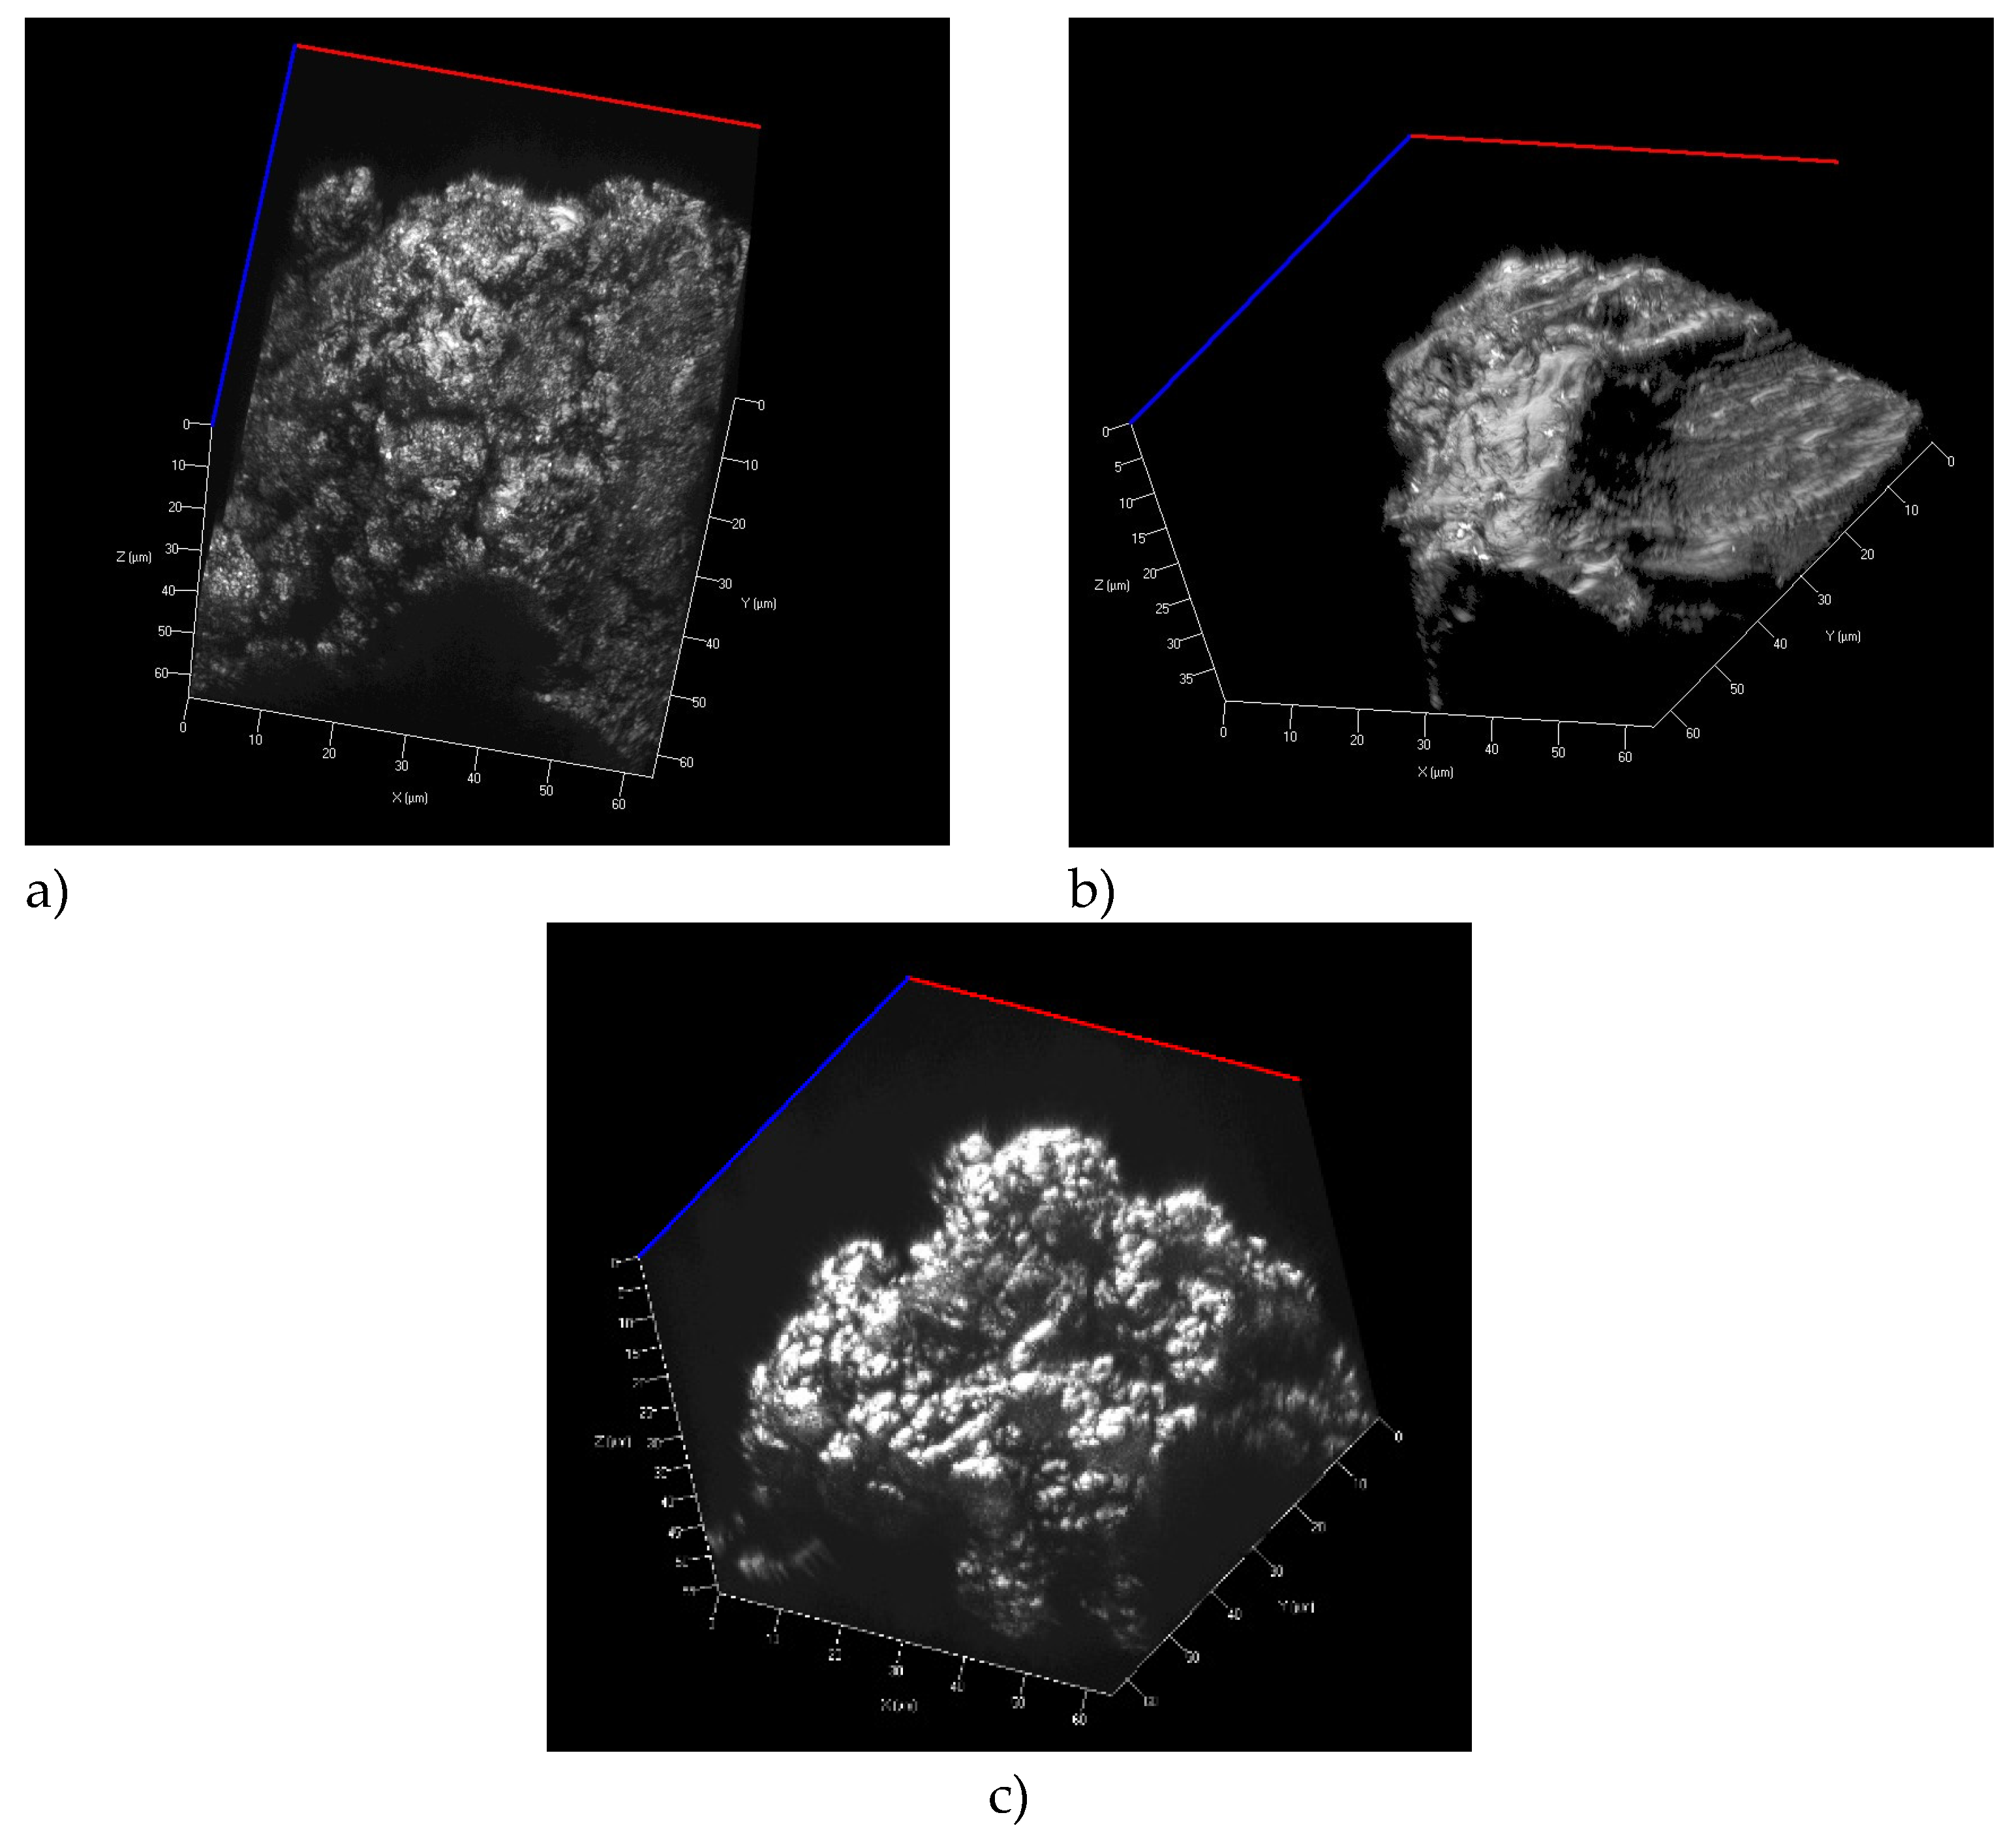
Topography of powder particles was documented using a ZEISS LSM700 scanning confocal microscope. A 405 nm light source was used which in combination with a Epiplan-Apochromat 100x/0.95 objective enabled to reach the step sizes of 110 nm on the X and Y axes as well as 60 nm in the Z axis (
Figure 1 and
Figure 2).
2.4.3. X - Ray
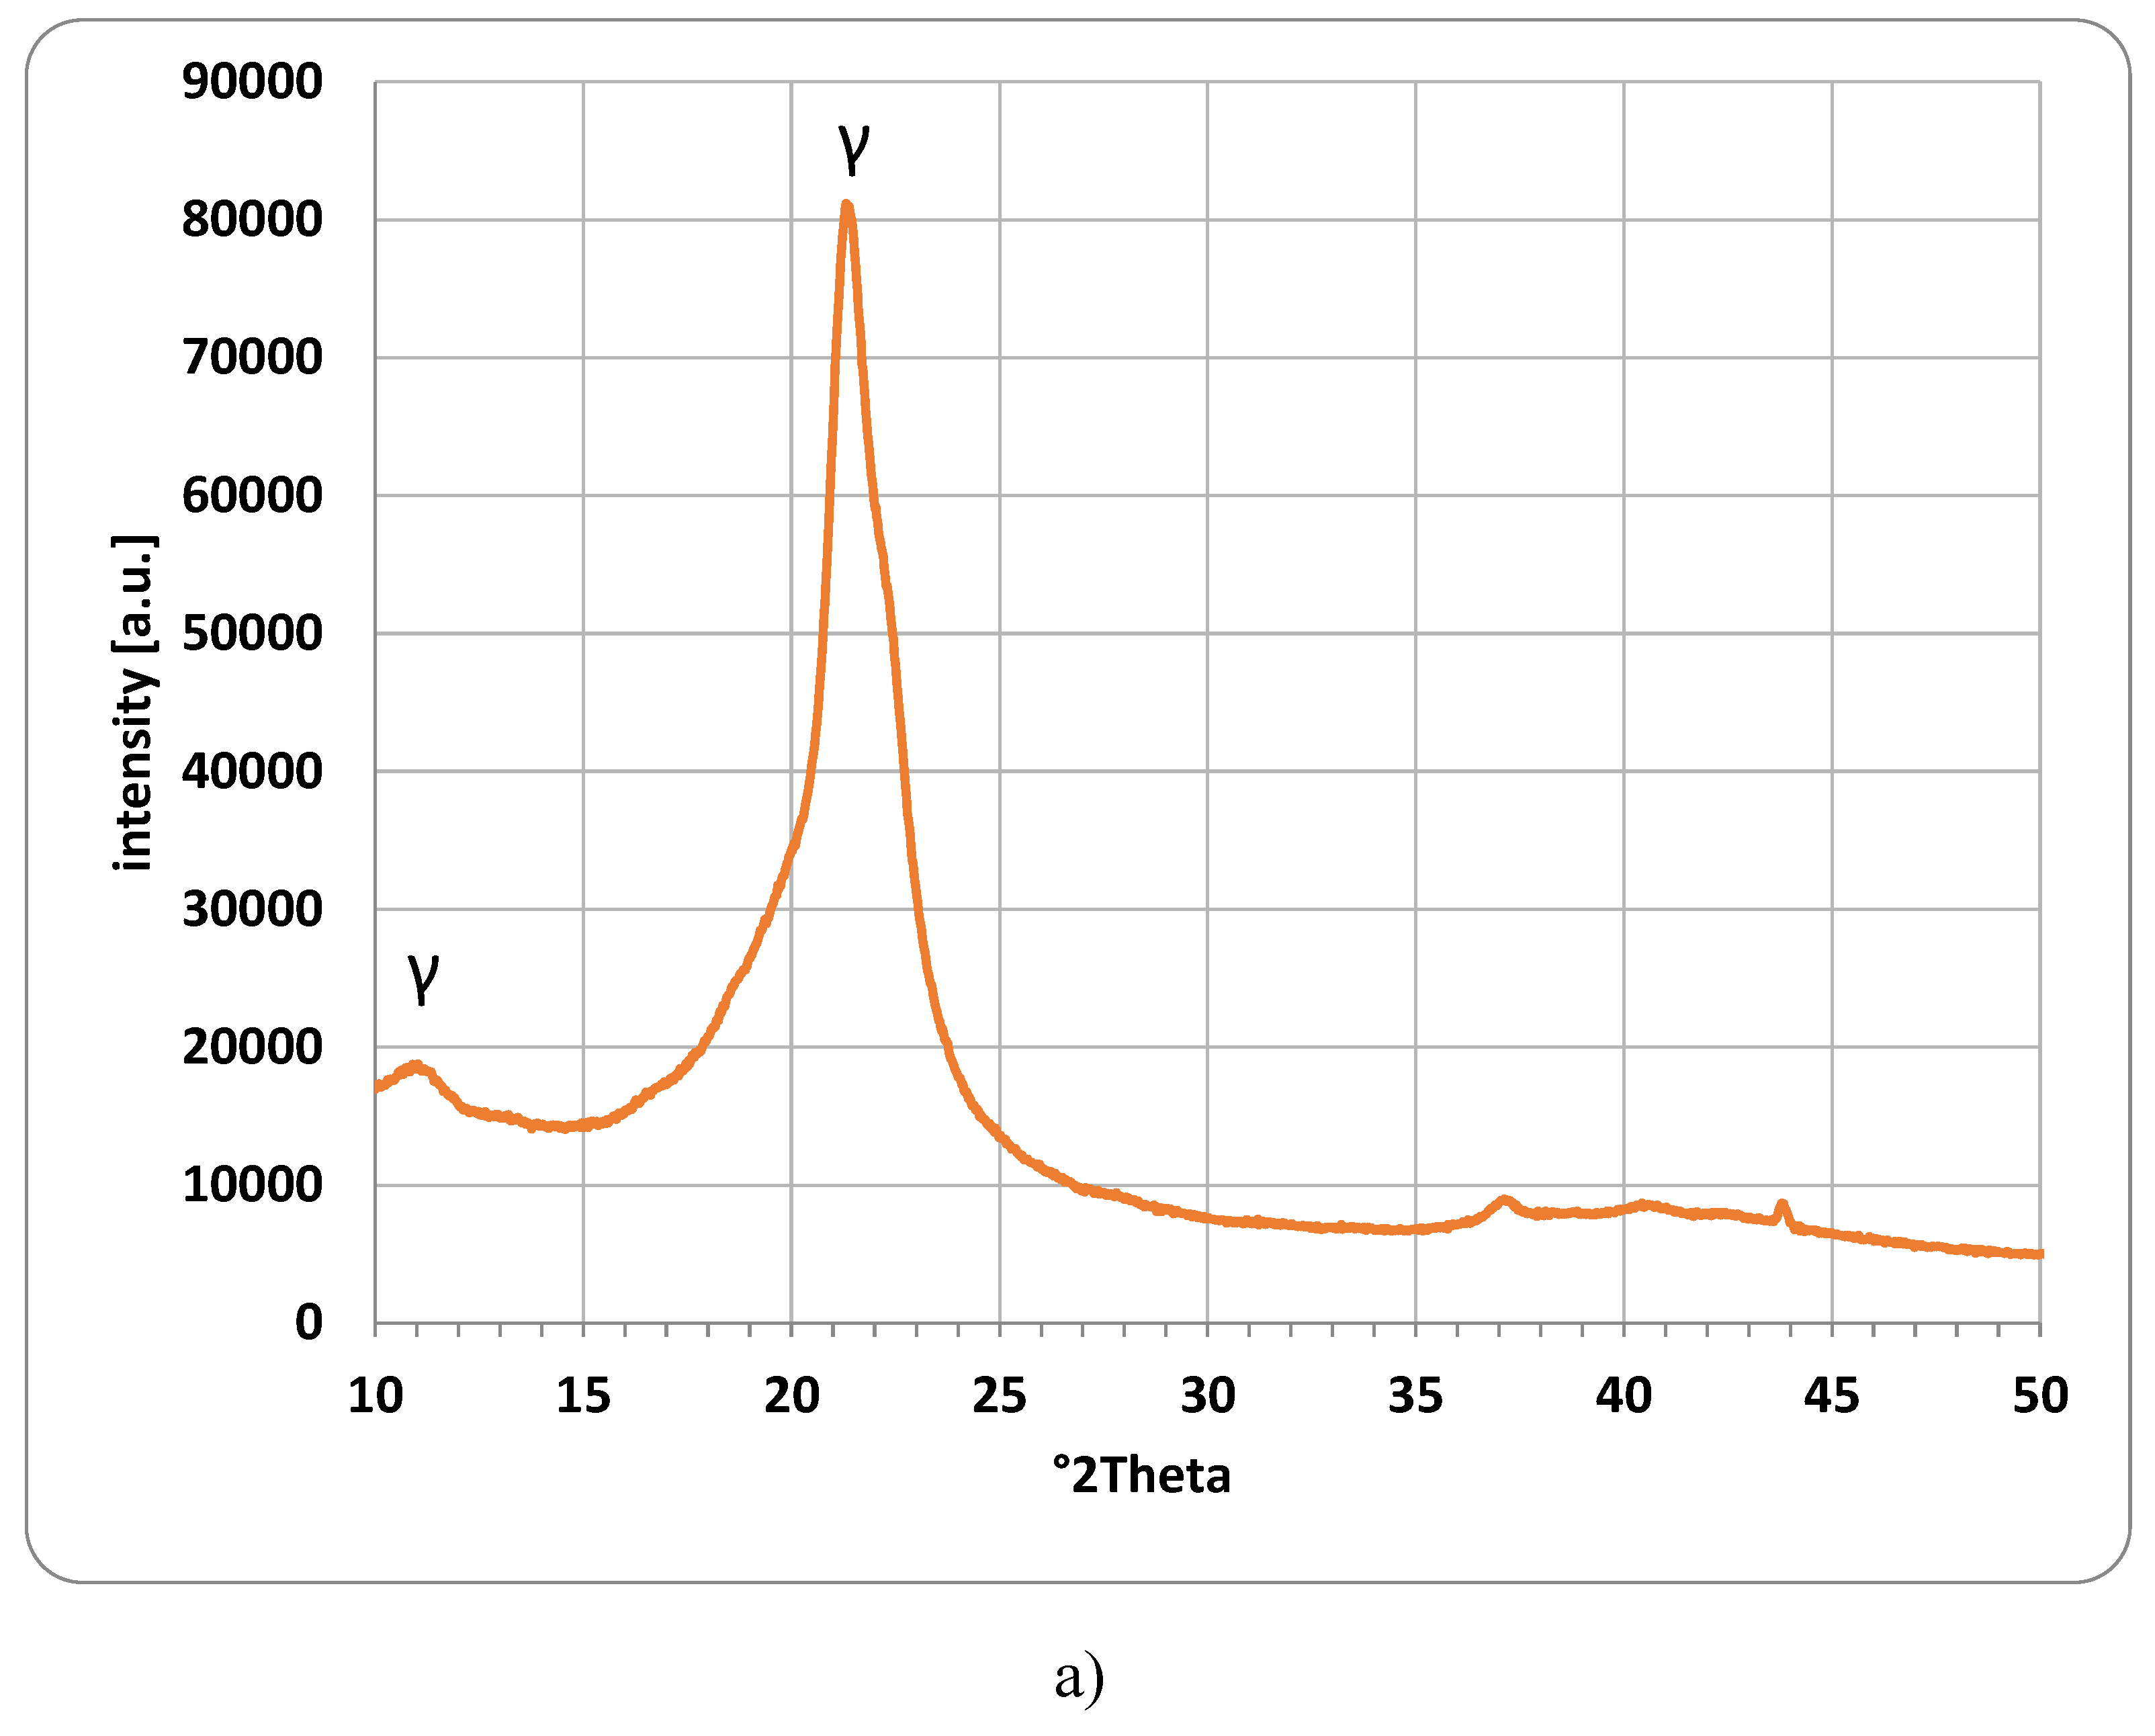
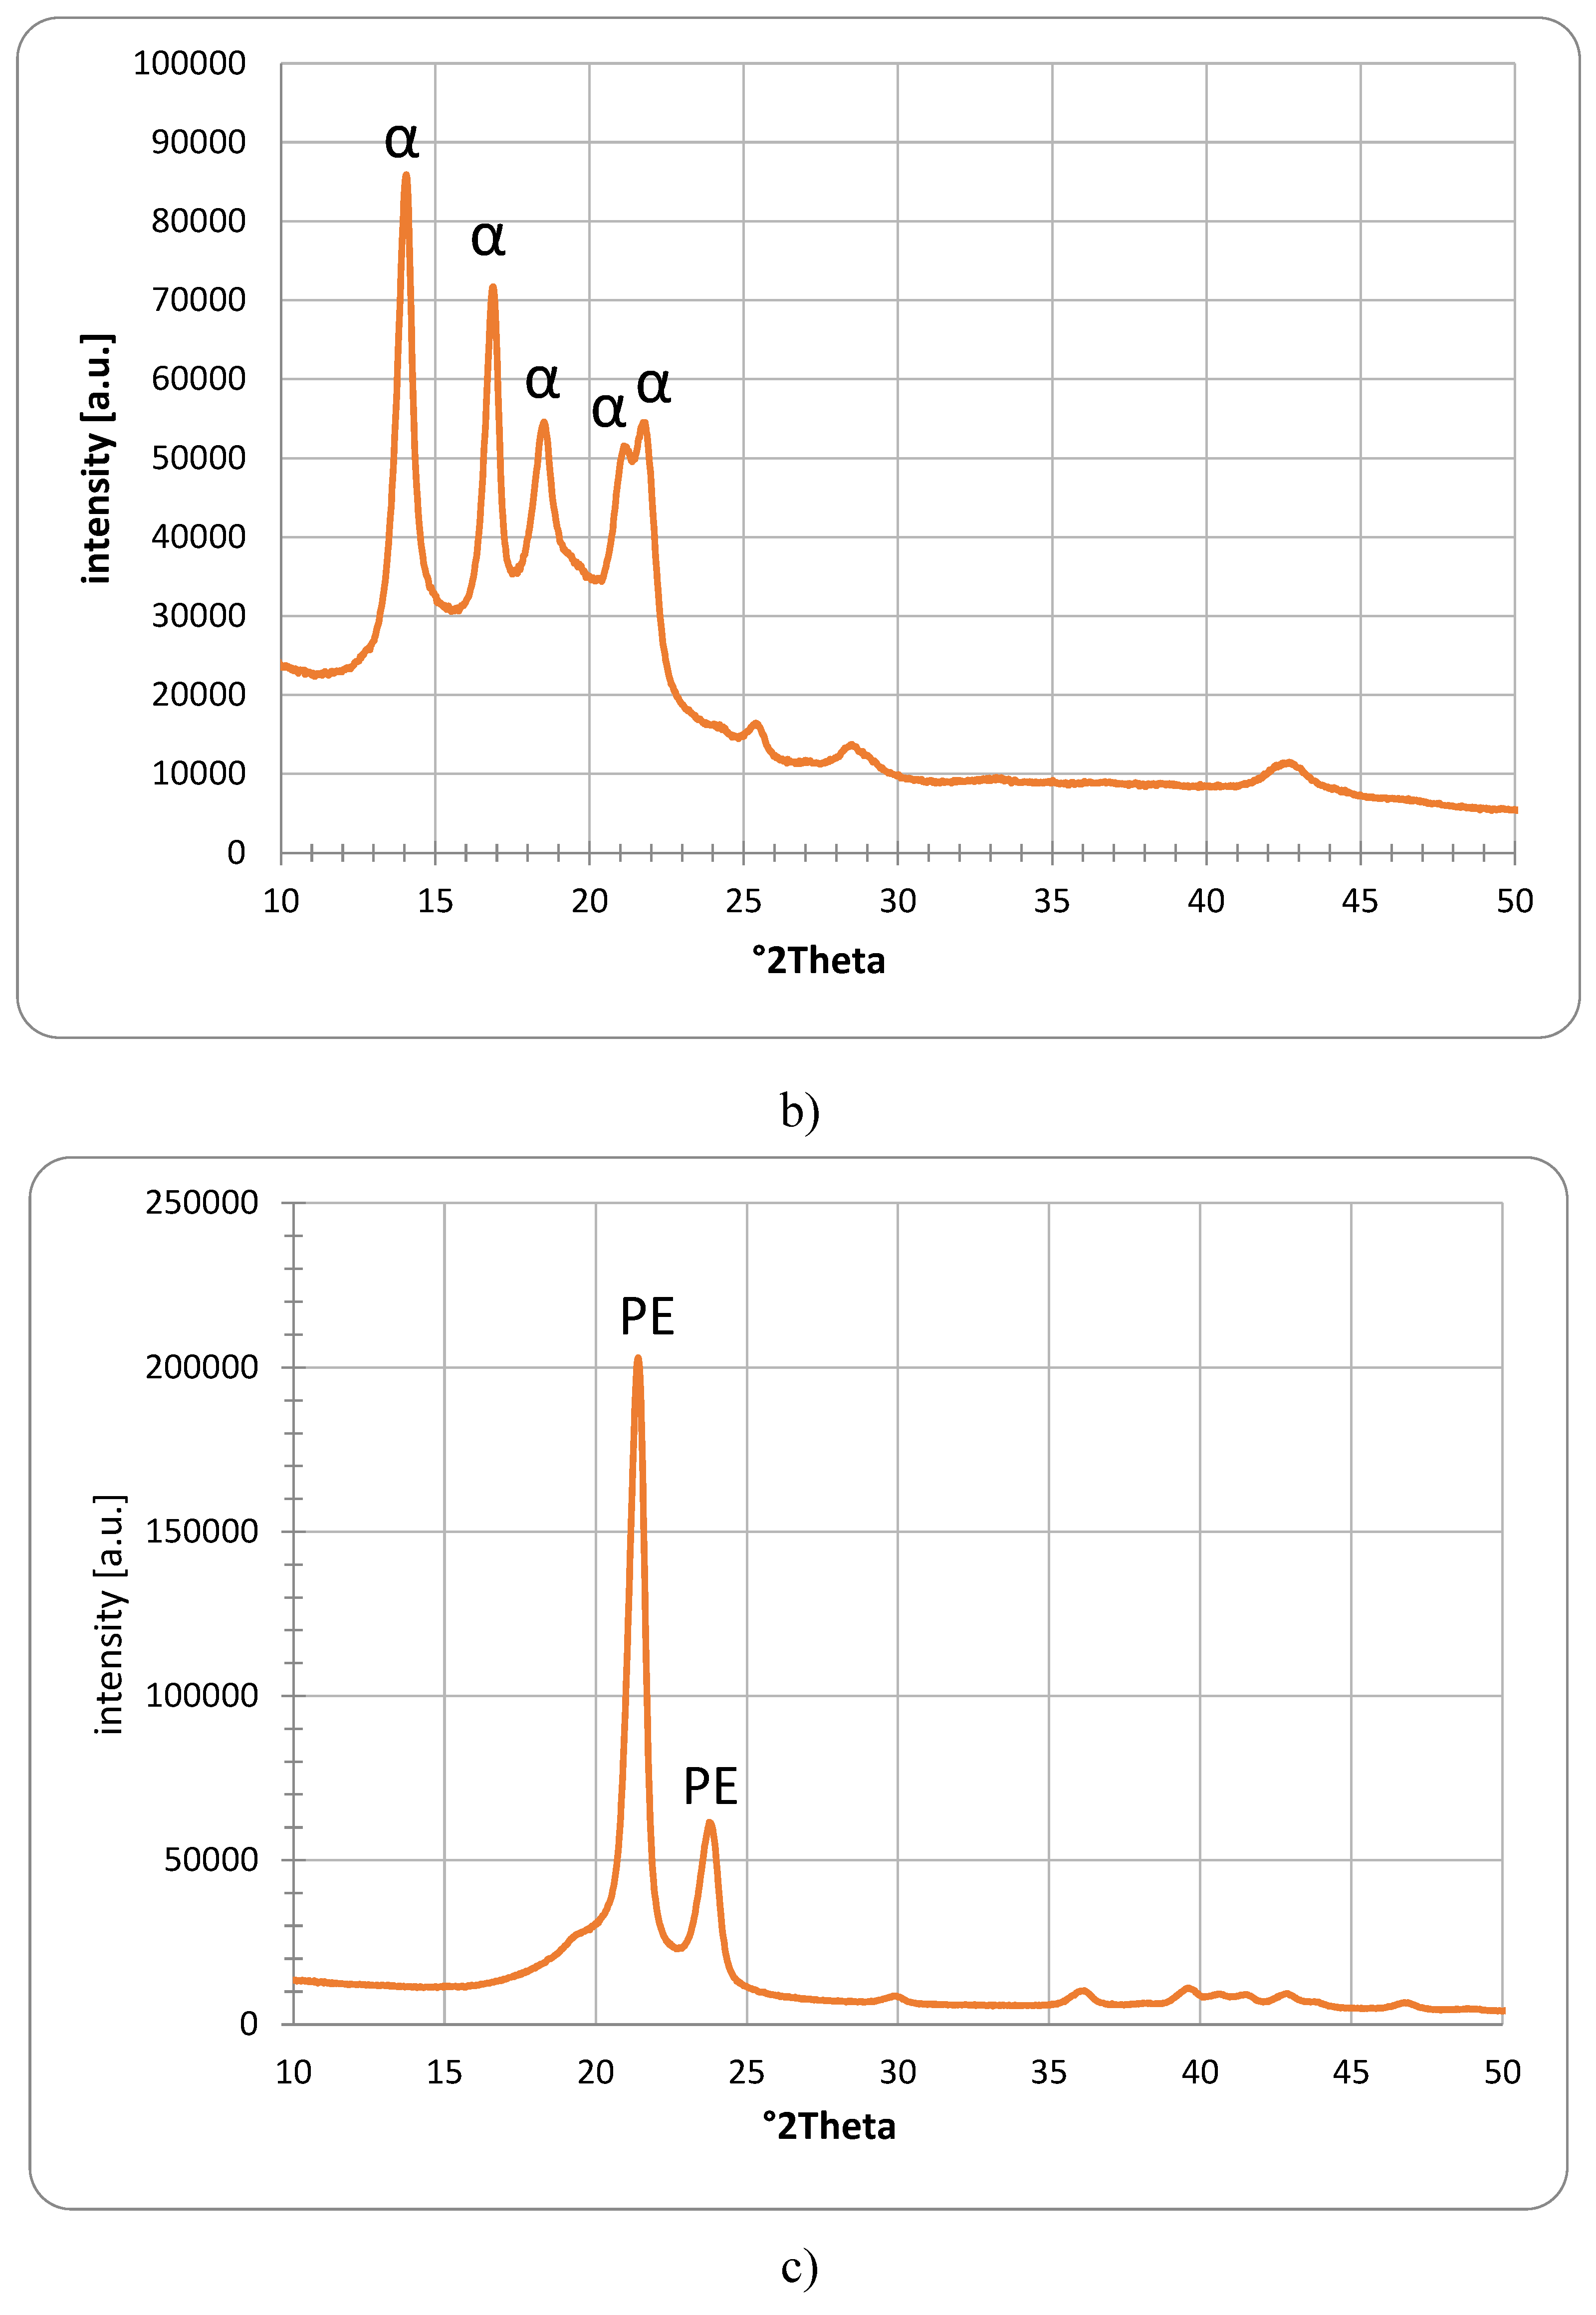
Figure 3 shows the XRD patterns recorded for each polymer powder investigated. The X-ray diffraction measurements were performed using a Panalytical Empyrean diffractometer with a Ni-filtered Cu–Kα radiation. XRD patterns were recorded in the range of 10–110° 2Theta.
Figure 3a) shows the XRD pattern for the investigated Polyamide PA12 powder. The obtained XRD pattern confirms the presence of the crystalline γ phase (peaks at 11.2° and 21.5° 2Theta), however, basically no peaks of the α phase could be identified. [
26] (PDF 00-057-1433), [
27,
28,
29,
30,
31].
The presence of crystalline polypropylene can be confirmed for the Sample 2, based on
Figure 3b). All peaks can be related to the isotactic α form of polypropylene, based on the JCPDS ICCDD database PDF 00-061-1416. This is in line with multiple publications [
32,
33,
34,
35]. For polypropylene, a β form is also reported to form under certain conditions [
36,
37]. However, this was not found in our investigated sample.
The XRD pattern of the UHMW Polyethylene is shown in
Figure 3c). A very good overlap with multiple publications investigating UHMW Polyethylene was found [
23,
38,
39]. Interestingly, the diffraction pattern of UHMW Polyethylene is matching the one of HD-PE [
33], JCPDS ICCDD database PDF 00-060-0986).
2.4.4. FTIR
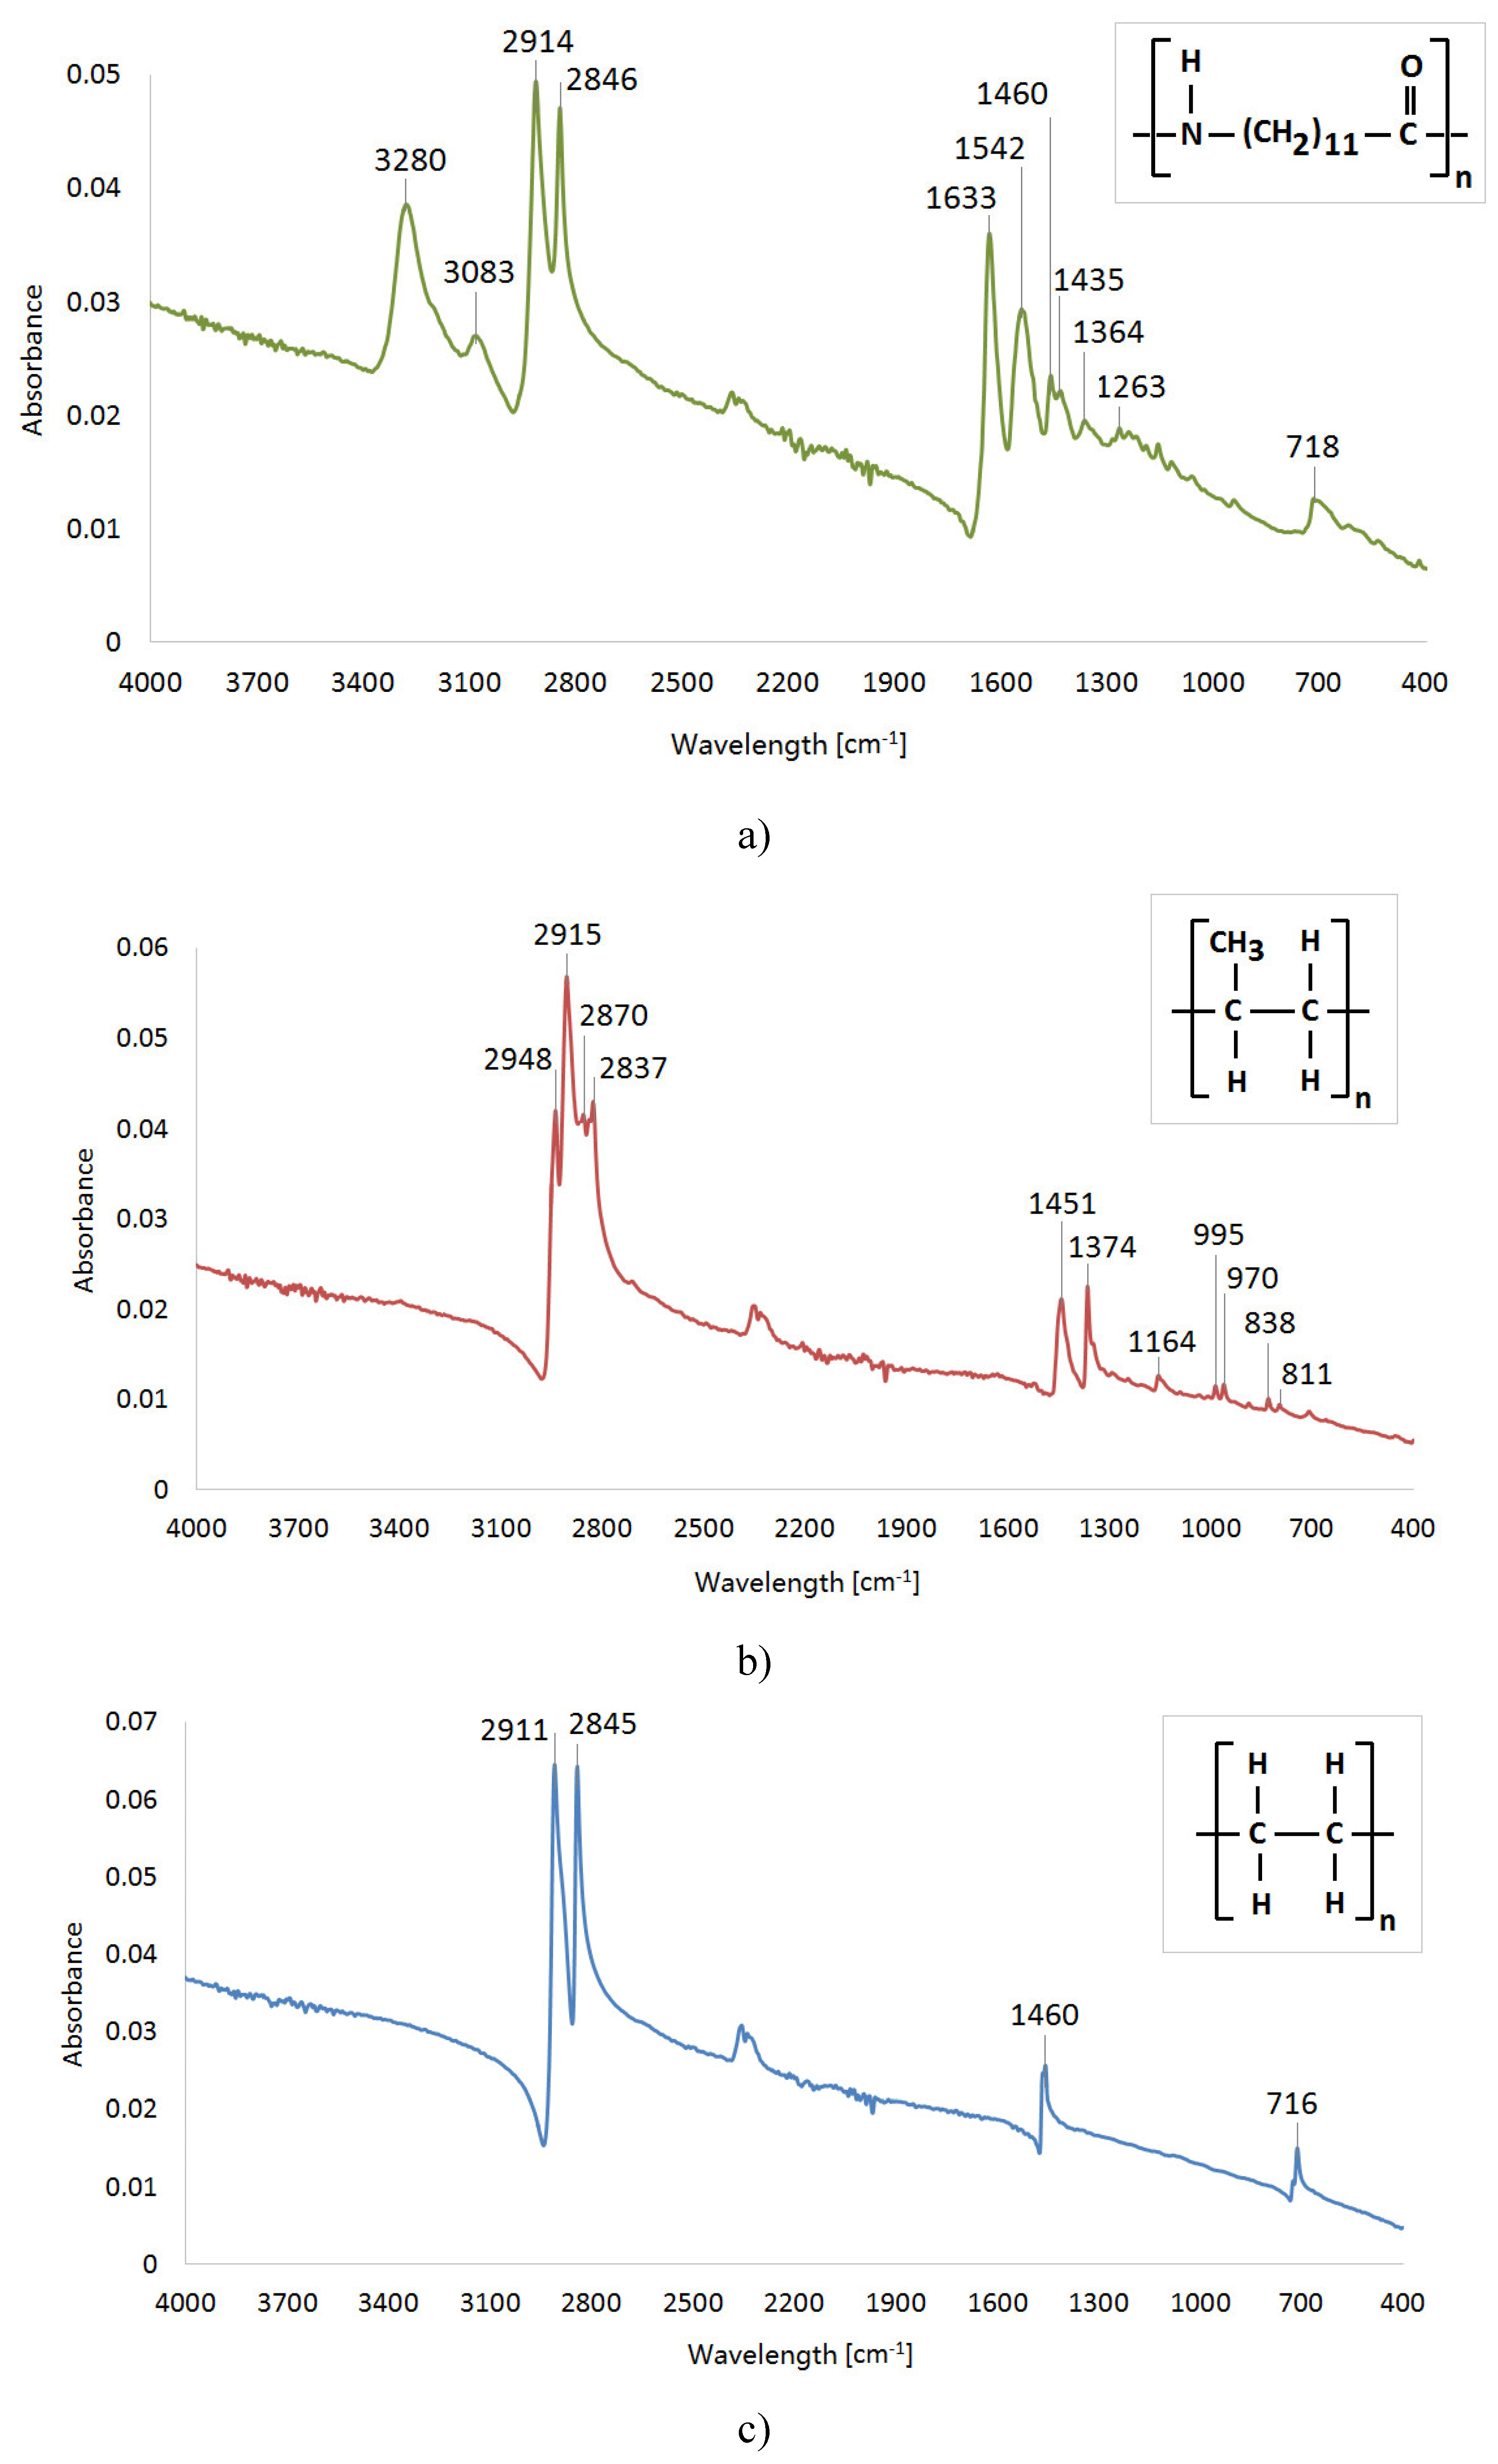
The ATR-FTIR spectra were recorded using a Varian FT-IR Spectrometer 660 (Agilent Technologies, Inc., Santa Clara, CA, USA). The samples were directly applied to a diamond crystal of ATR GladiATR (PIKE Technology Inc., Madison, WI, USA), and the resulting spectra were corrected for background air absorbance. The spectra were recorded using a Varian Resolutions Pro, and samples were measured in the region of 4000 – 400 cm−1, while each spectrum was measured 256 times, at resolution 4 (
Figure 4).
Figure 4 c) demonstrates the infrared spectrum of UHMW Polyethylene with absorption bands which correspond to the following chemical structure – 2911 cm
-1 (CH2 asymmetric stretching vibrations), 2845 cm
-1 (CH2 symmetric stretching vibrations), 1460 cm
-1 (CH2 bending vibrations) and 716 cm
-1 C–CH2 rocking vibrations). [
40,
41].
Figure 4 b) illustrates the spectrum of PP. Absorption bands located at specific wavenumbers correspond to the following functional groups – 2948 cm
-1 (CH3 asymmetric stretching vibrations), 2915 cm
-1 (CH2 asymmetric stretching vibrations), 2870 cm
-1 (CH3 symmetric stretching vibrations), 2837 cm
-1 (CH2 symmetric stretching vibrations), 1451 cm
-1 (CH3 symmetric bending vibrations), 1374 cm
-1 (CH3 umbrella mode), 1164 cm
-1 (C–H wagging vibrations, CH3 rocking vibrations), 995 cm
-1 (CH3 rocking vibrations, C–C stretching vibrations), 970 cm
-1 (CH3 rocking vibrations, C–C stretching vibrations), 838 cm-1 (C–H rocking vibrations) and 811 cm
-1 (C–C stretching vibrations). [
42,
43].
The spectrum of Polyamide PA12 (
Figure 4 c)) shows the peaks at the indicated wavenumbers which correspond to the following functional groups – 3280 cm
-1 (N–H stretching vibrations), 3083 cm
-1 (overtone of N–H bend), 2914 cm
-1 (CH2 asymmetric stretching vibrations), 2846 cm
-1 (CH2 symmetric stretching vibrations), 1633 cm
-1 (Amide I, C=O stretching vibrations), 1542 cm
-1 (Amide II, N–H in plane bending vibrations), 1460 cm
-1 + 1435 cm
-1 + 1364 cm
-1 (C–H bending vibrations), 1263 cm
-1 (Amide III, C–N stretch) and 718 cm
-1 (N–H out-of-plane bending vibrations). [
44,
45,
46]
2.5. MIT of Dispersed Dust
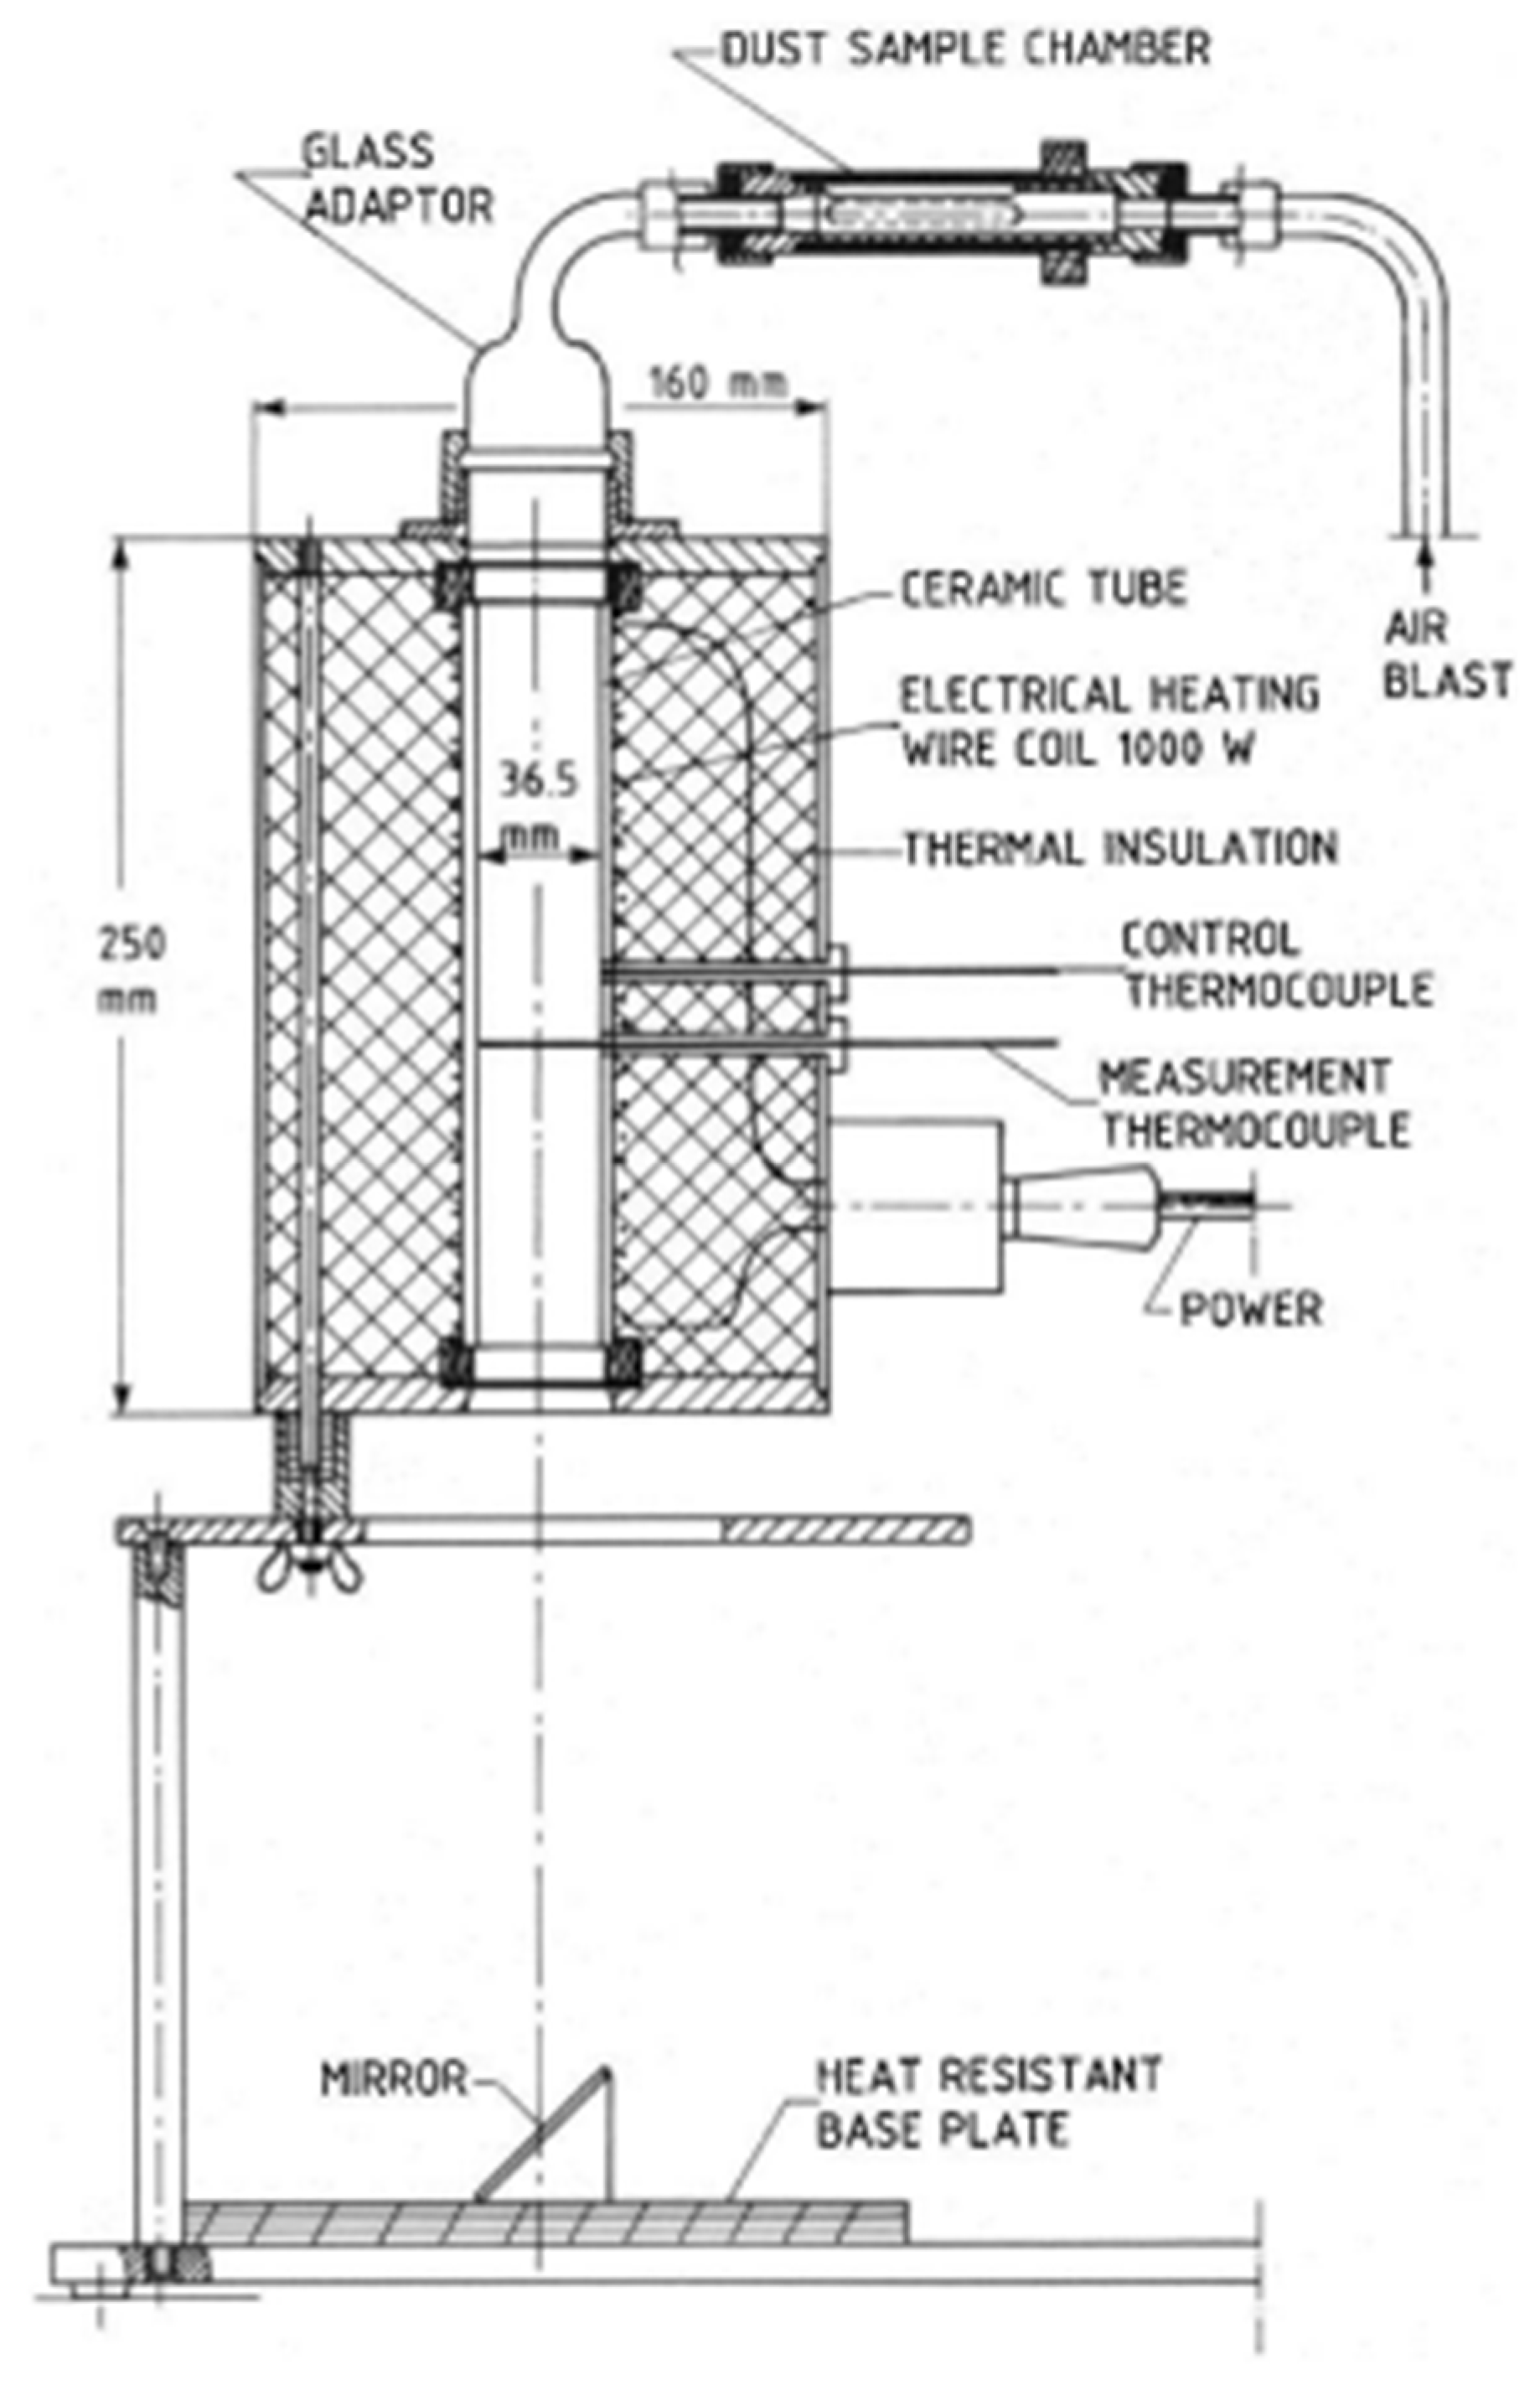
The MIT measurements of dispersed dust were performed using a standardized equipment, Godbert-Greenwald furnace,
Figure 5.
G-G furnace for determination of MIT of dispersed dust. Small quantities of dust are blown vertically downward through a heated furnace, and ignition is detected by visual inspection. The test material is dispersed in the furnace by air blast. Since most of the sample consists of two fractions (>32 µm, >45 µm), the resulting MIT value depends mainly on these two fractions. Owing to their percentage in the sample, other fractions have a negligible effect on the MIT value of the dispersed dust from the hot surface. The dust quantity is 0.15 g (corresponds to the concentration with the highest P
max value) and the dust is dispersed at the air pressure 20 kPa and 50 kPa. If a burst of flame is seen below the end of the furnace tube, this shall be considered as an ignition. For each combination of temperature and pressure, five measurements were performed. The measurements were assessed “YES” if at least one test was performed with positive results. MIT of the dispersed dust is recorded as the lowest temperature of the furnace at which ignition was obtained, minus 20 K [
48]. Owing to the dust characteristics according to MSDS (melting point 180°C), the MIT determination of settled dust was not performed.
2.6. Explosion Parameters
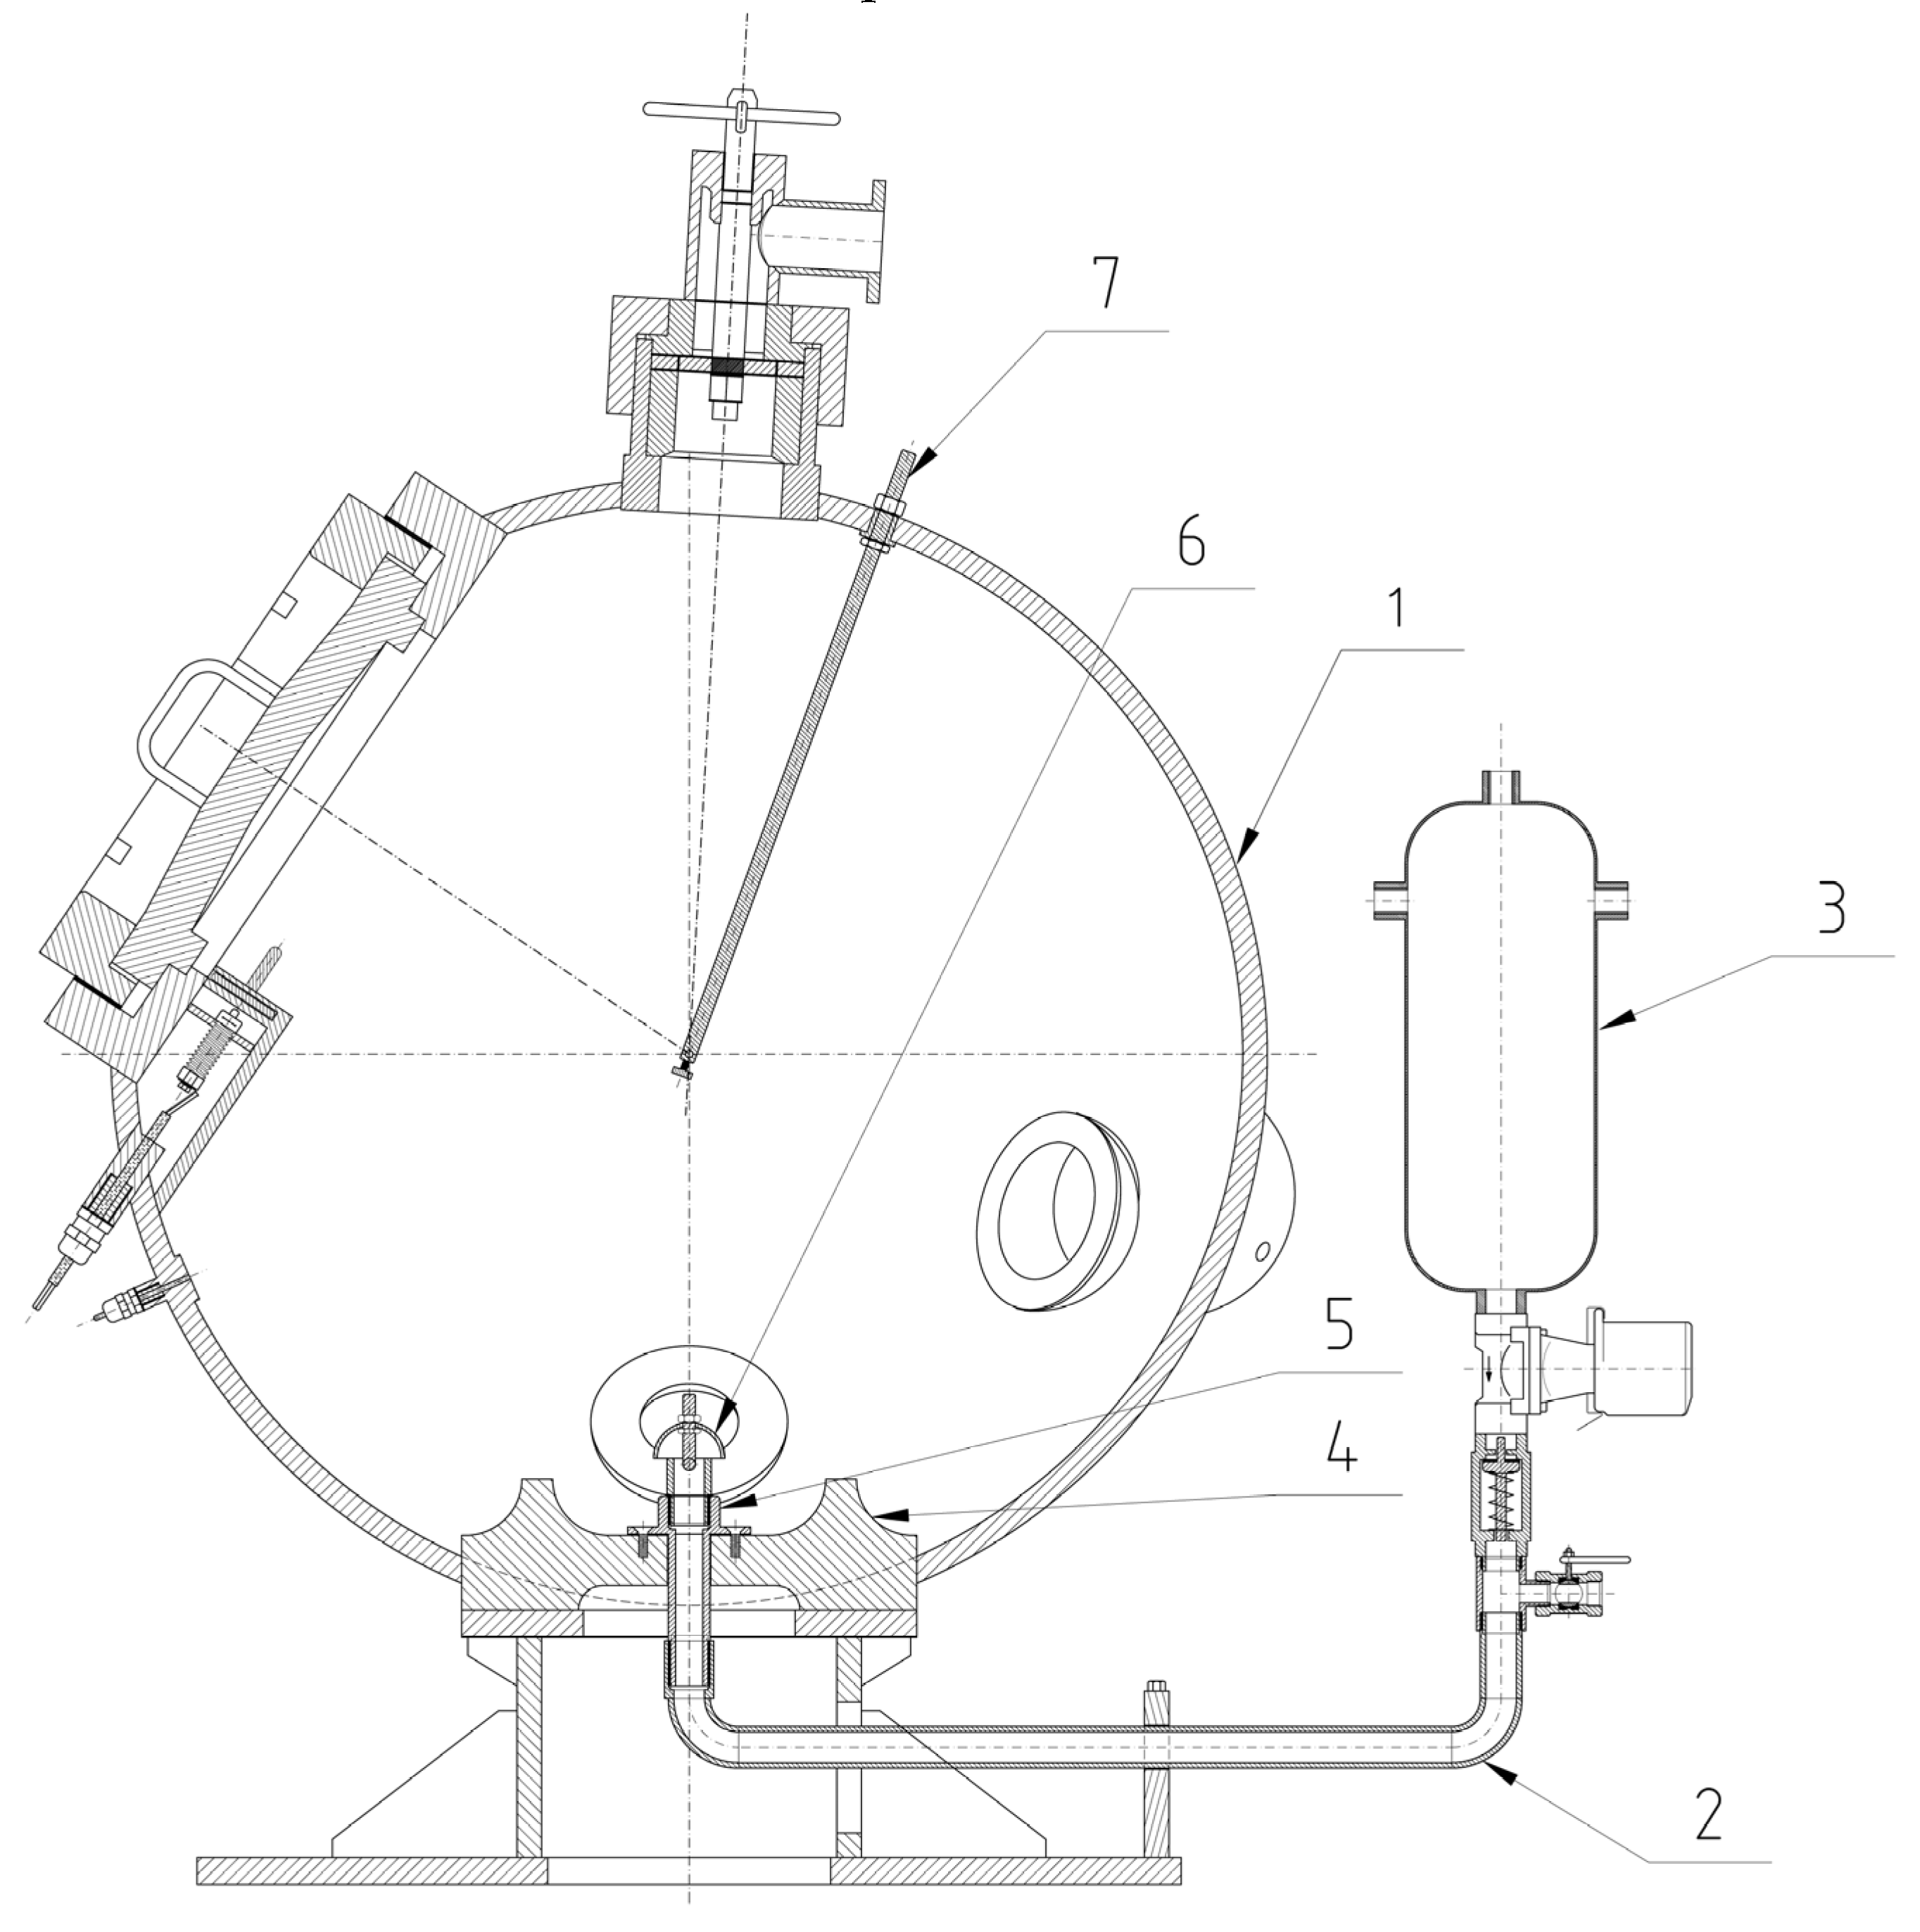
The explosion parameters of samples were determined in the KV 150M2 explosion chamber,
Figure 6 and
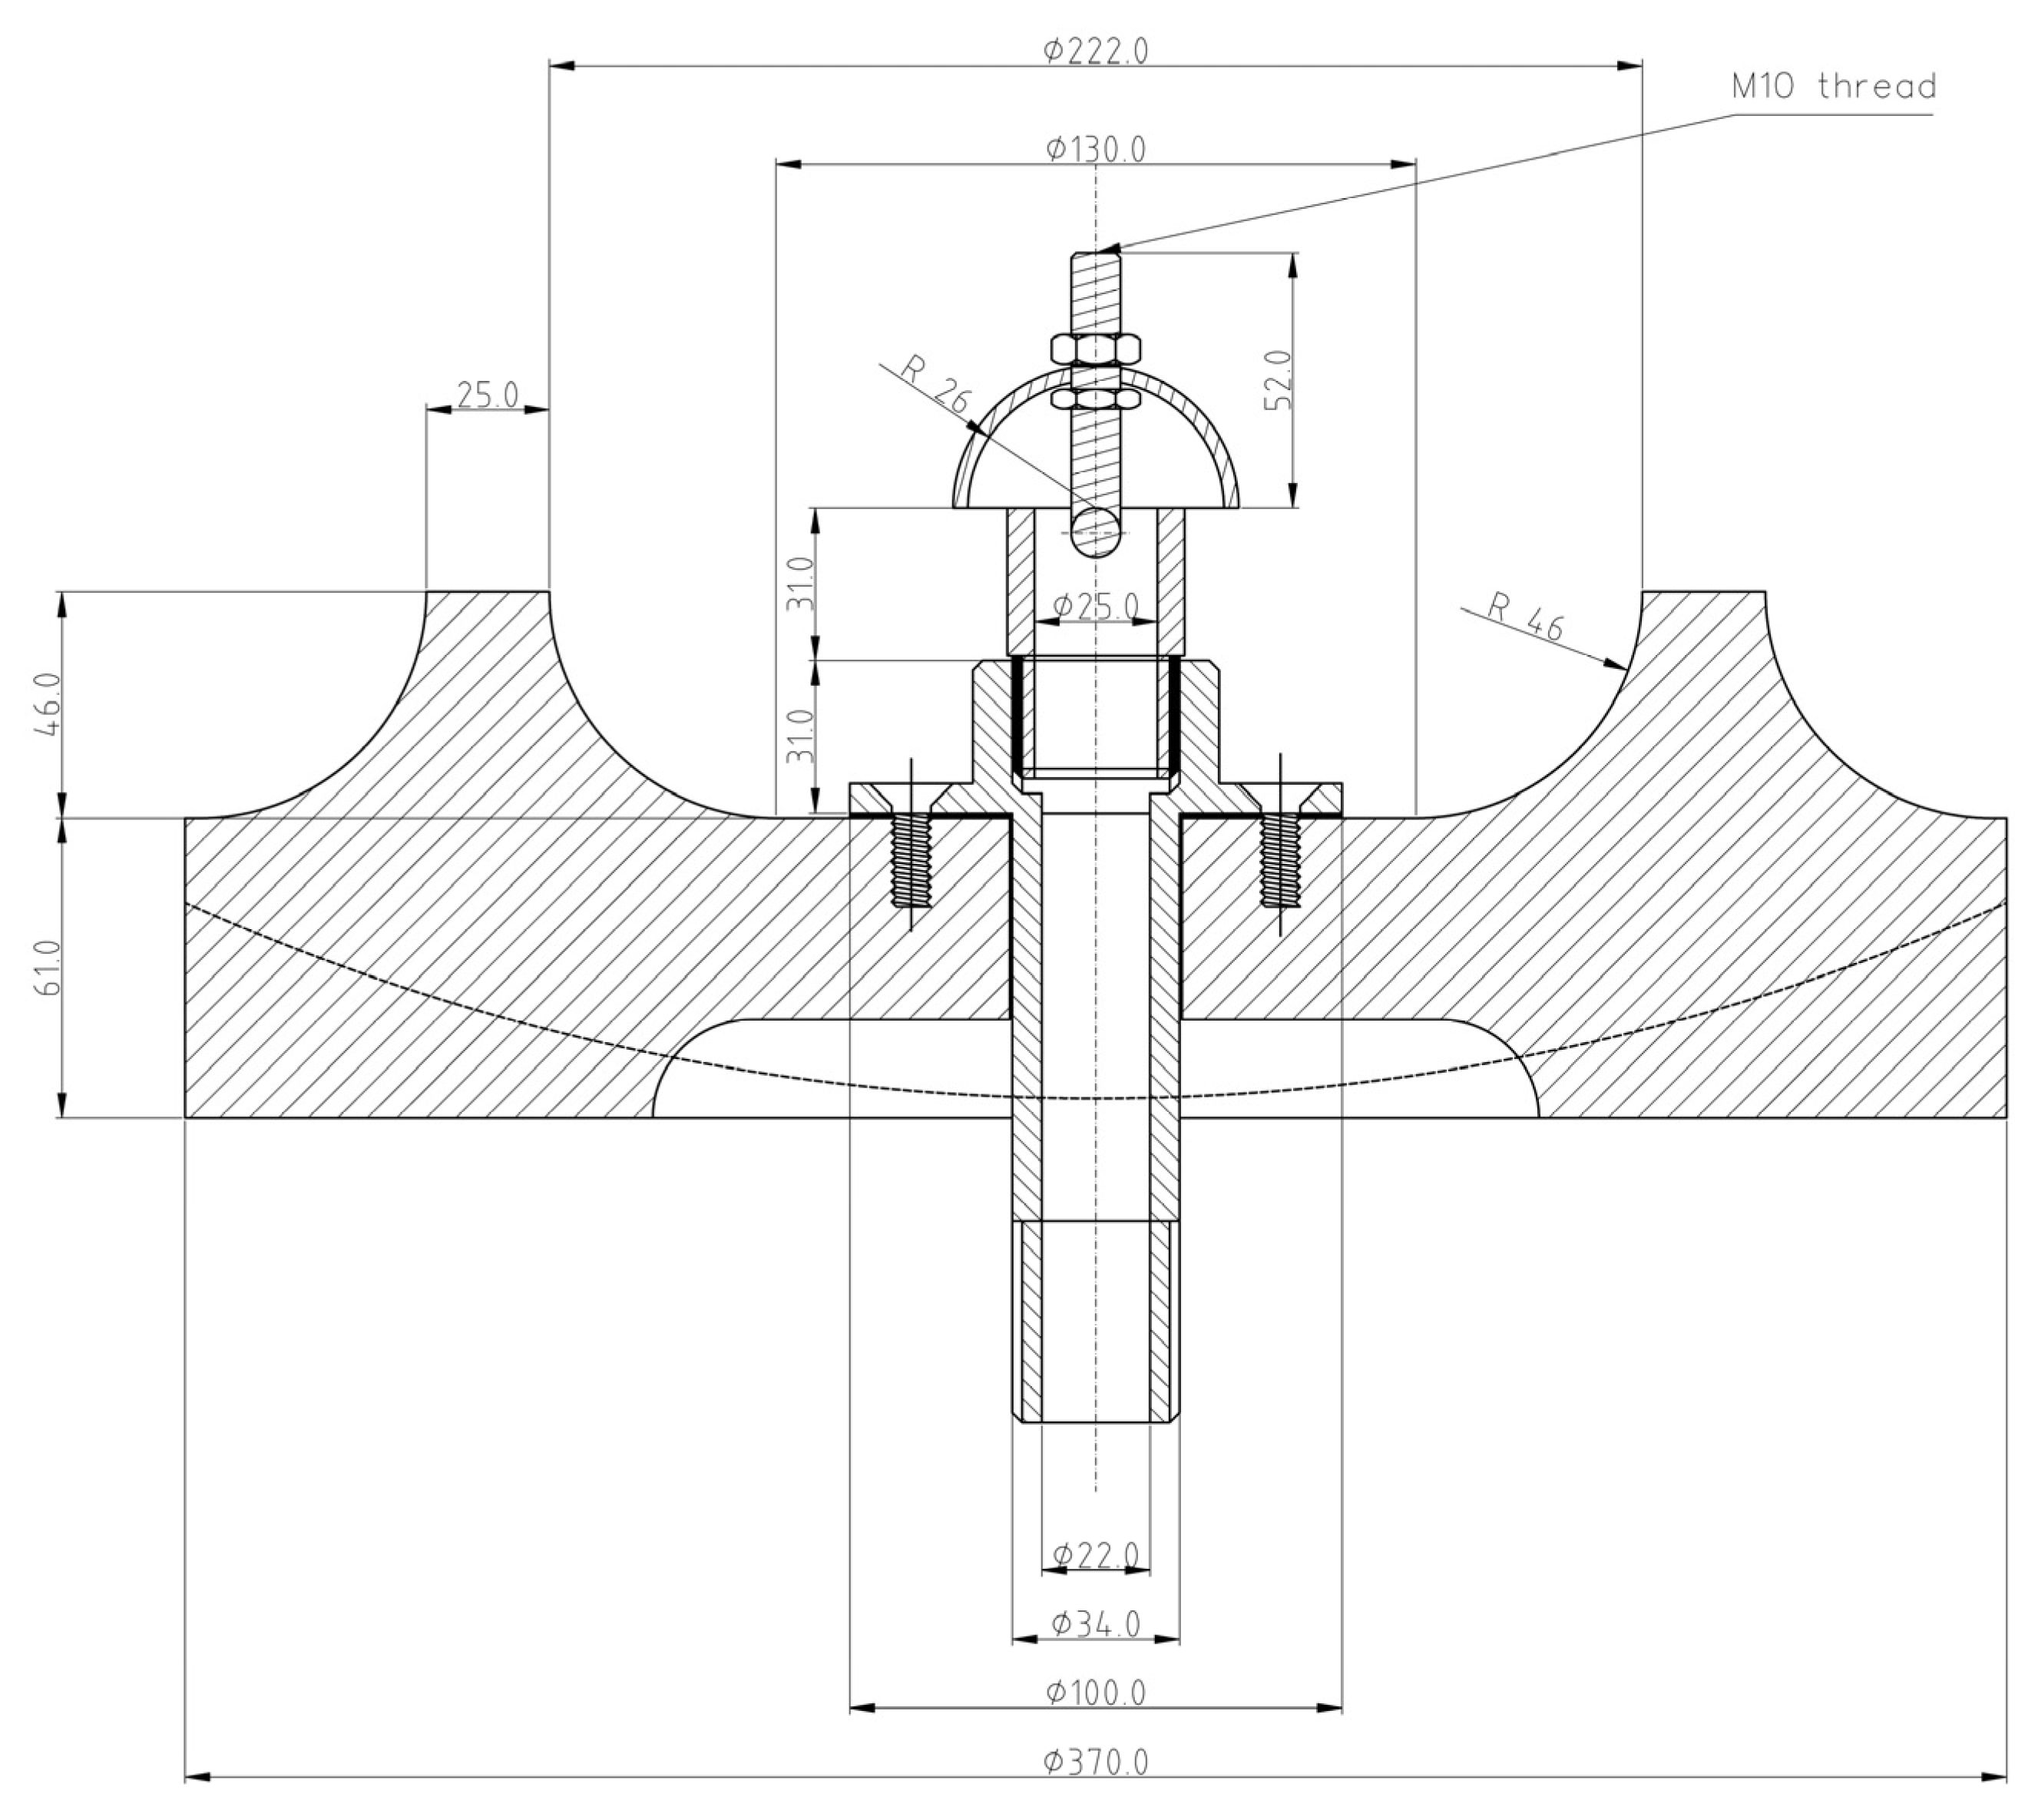
Figure 7.
Compressed air for dispersing the dust is supplied from a compressed air vessel (6.5 L at 10 bar) through a fast-opening valve into the chamber. The volume of the chamber is 365 L. The sample is placed on a disperser plate and is dispersed by a stream of compressed air. The sample is then ignited by an igniter with an energy of 2 × 5 kJ. The igniter is located in the centre of the explosion chamber according to the EN 14034 Standard [
49].
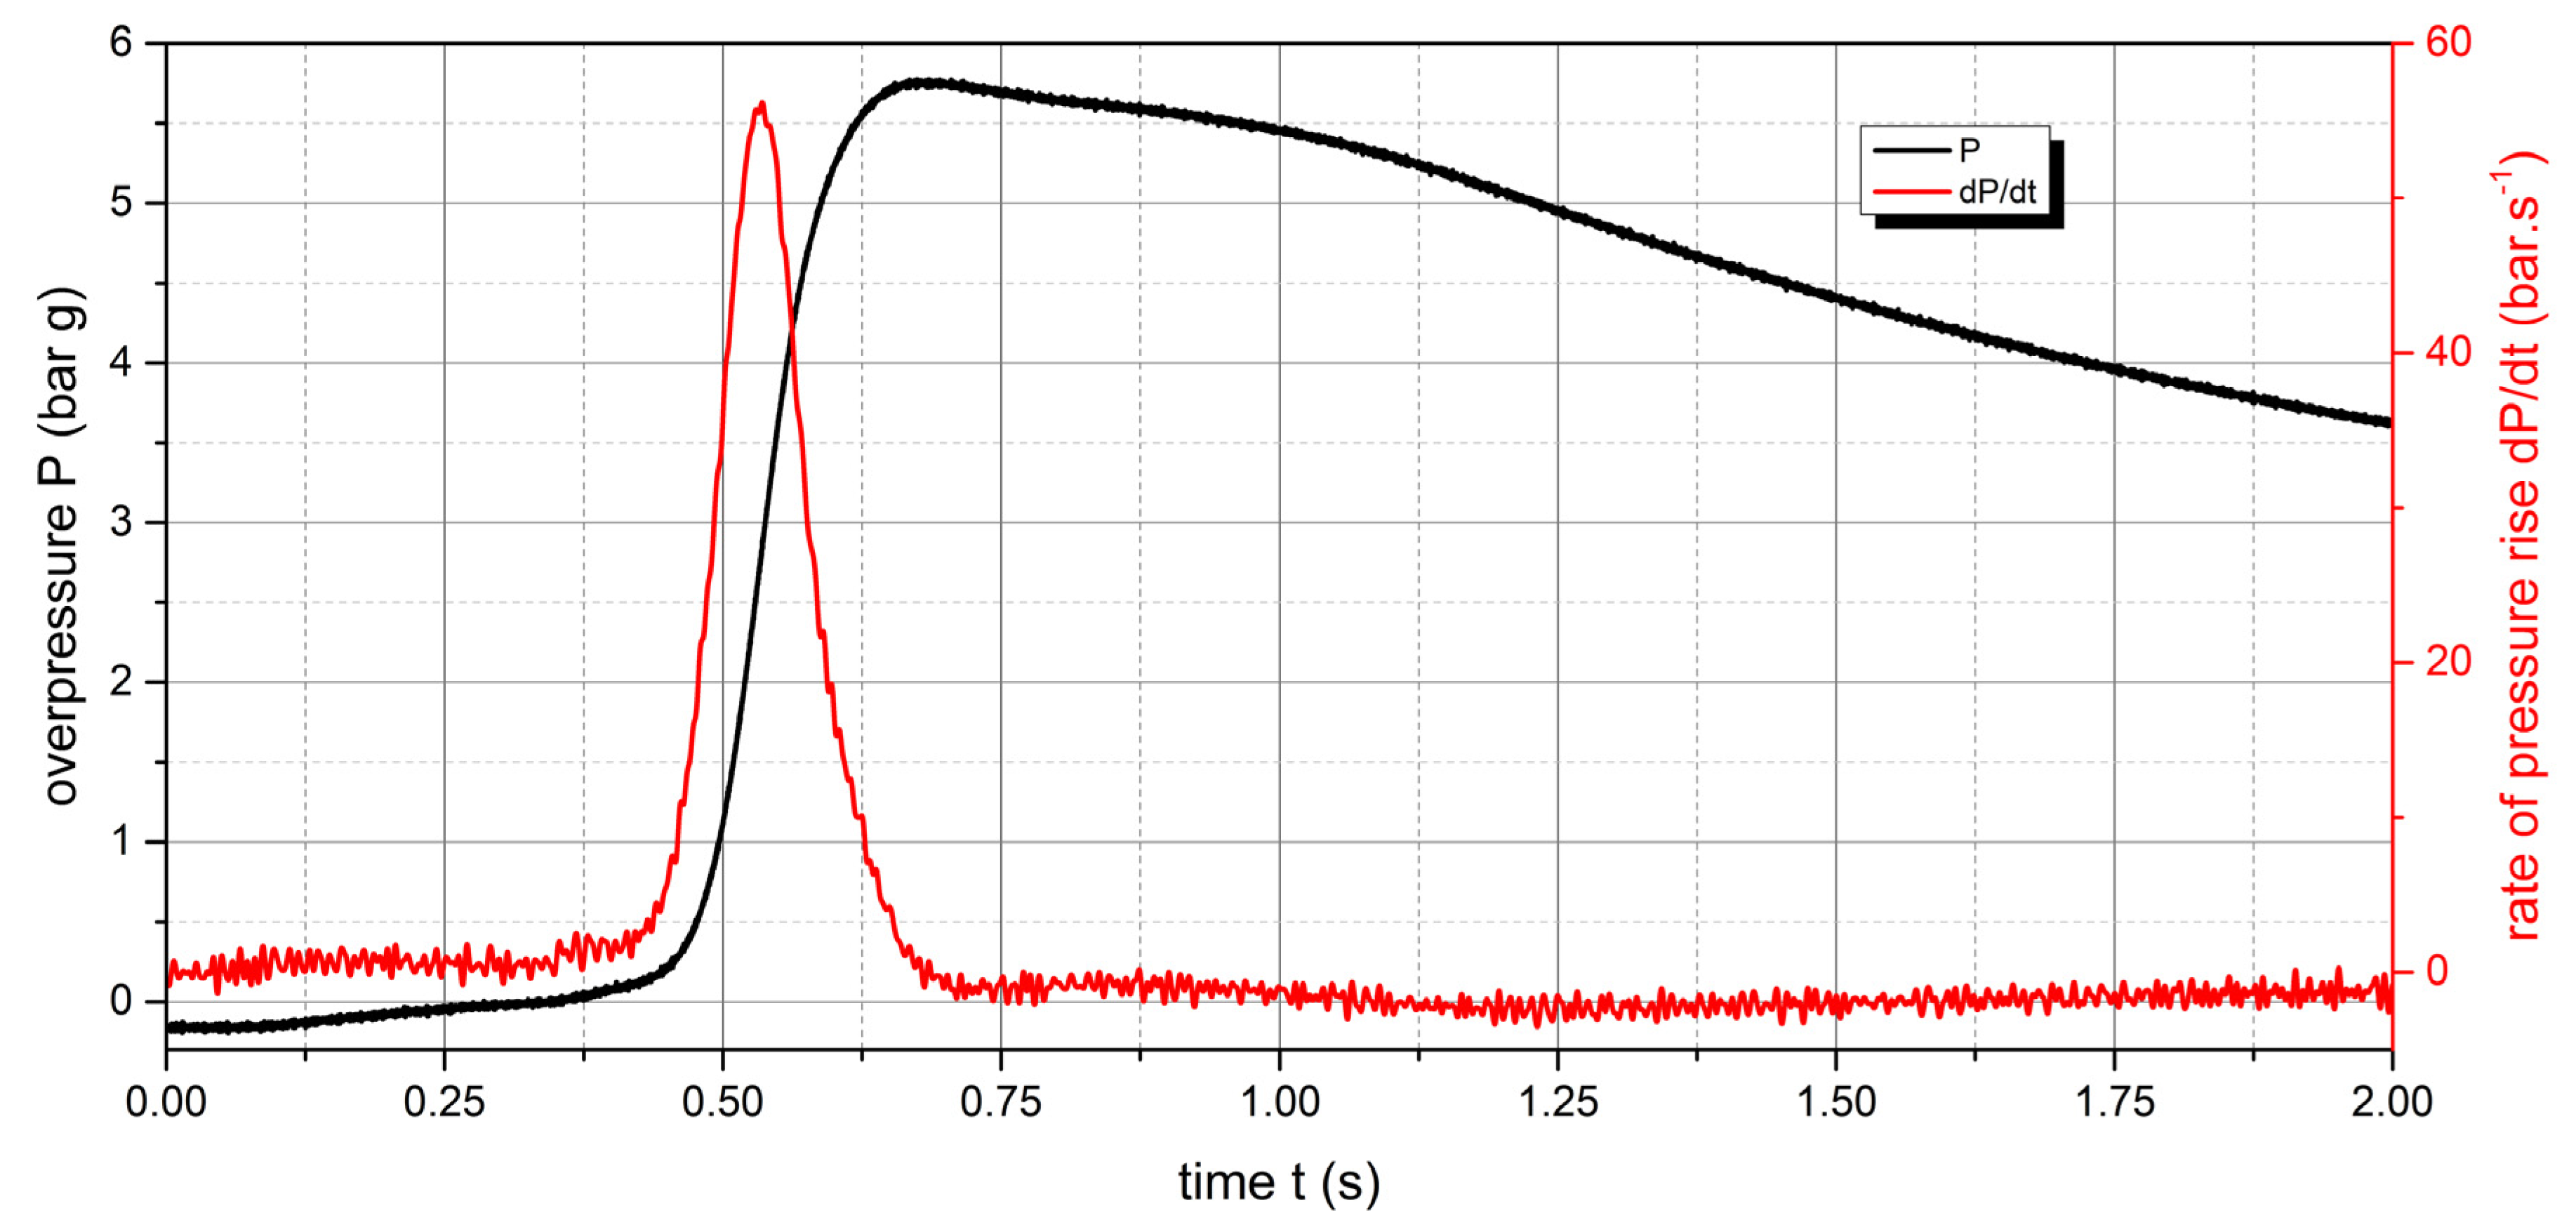
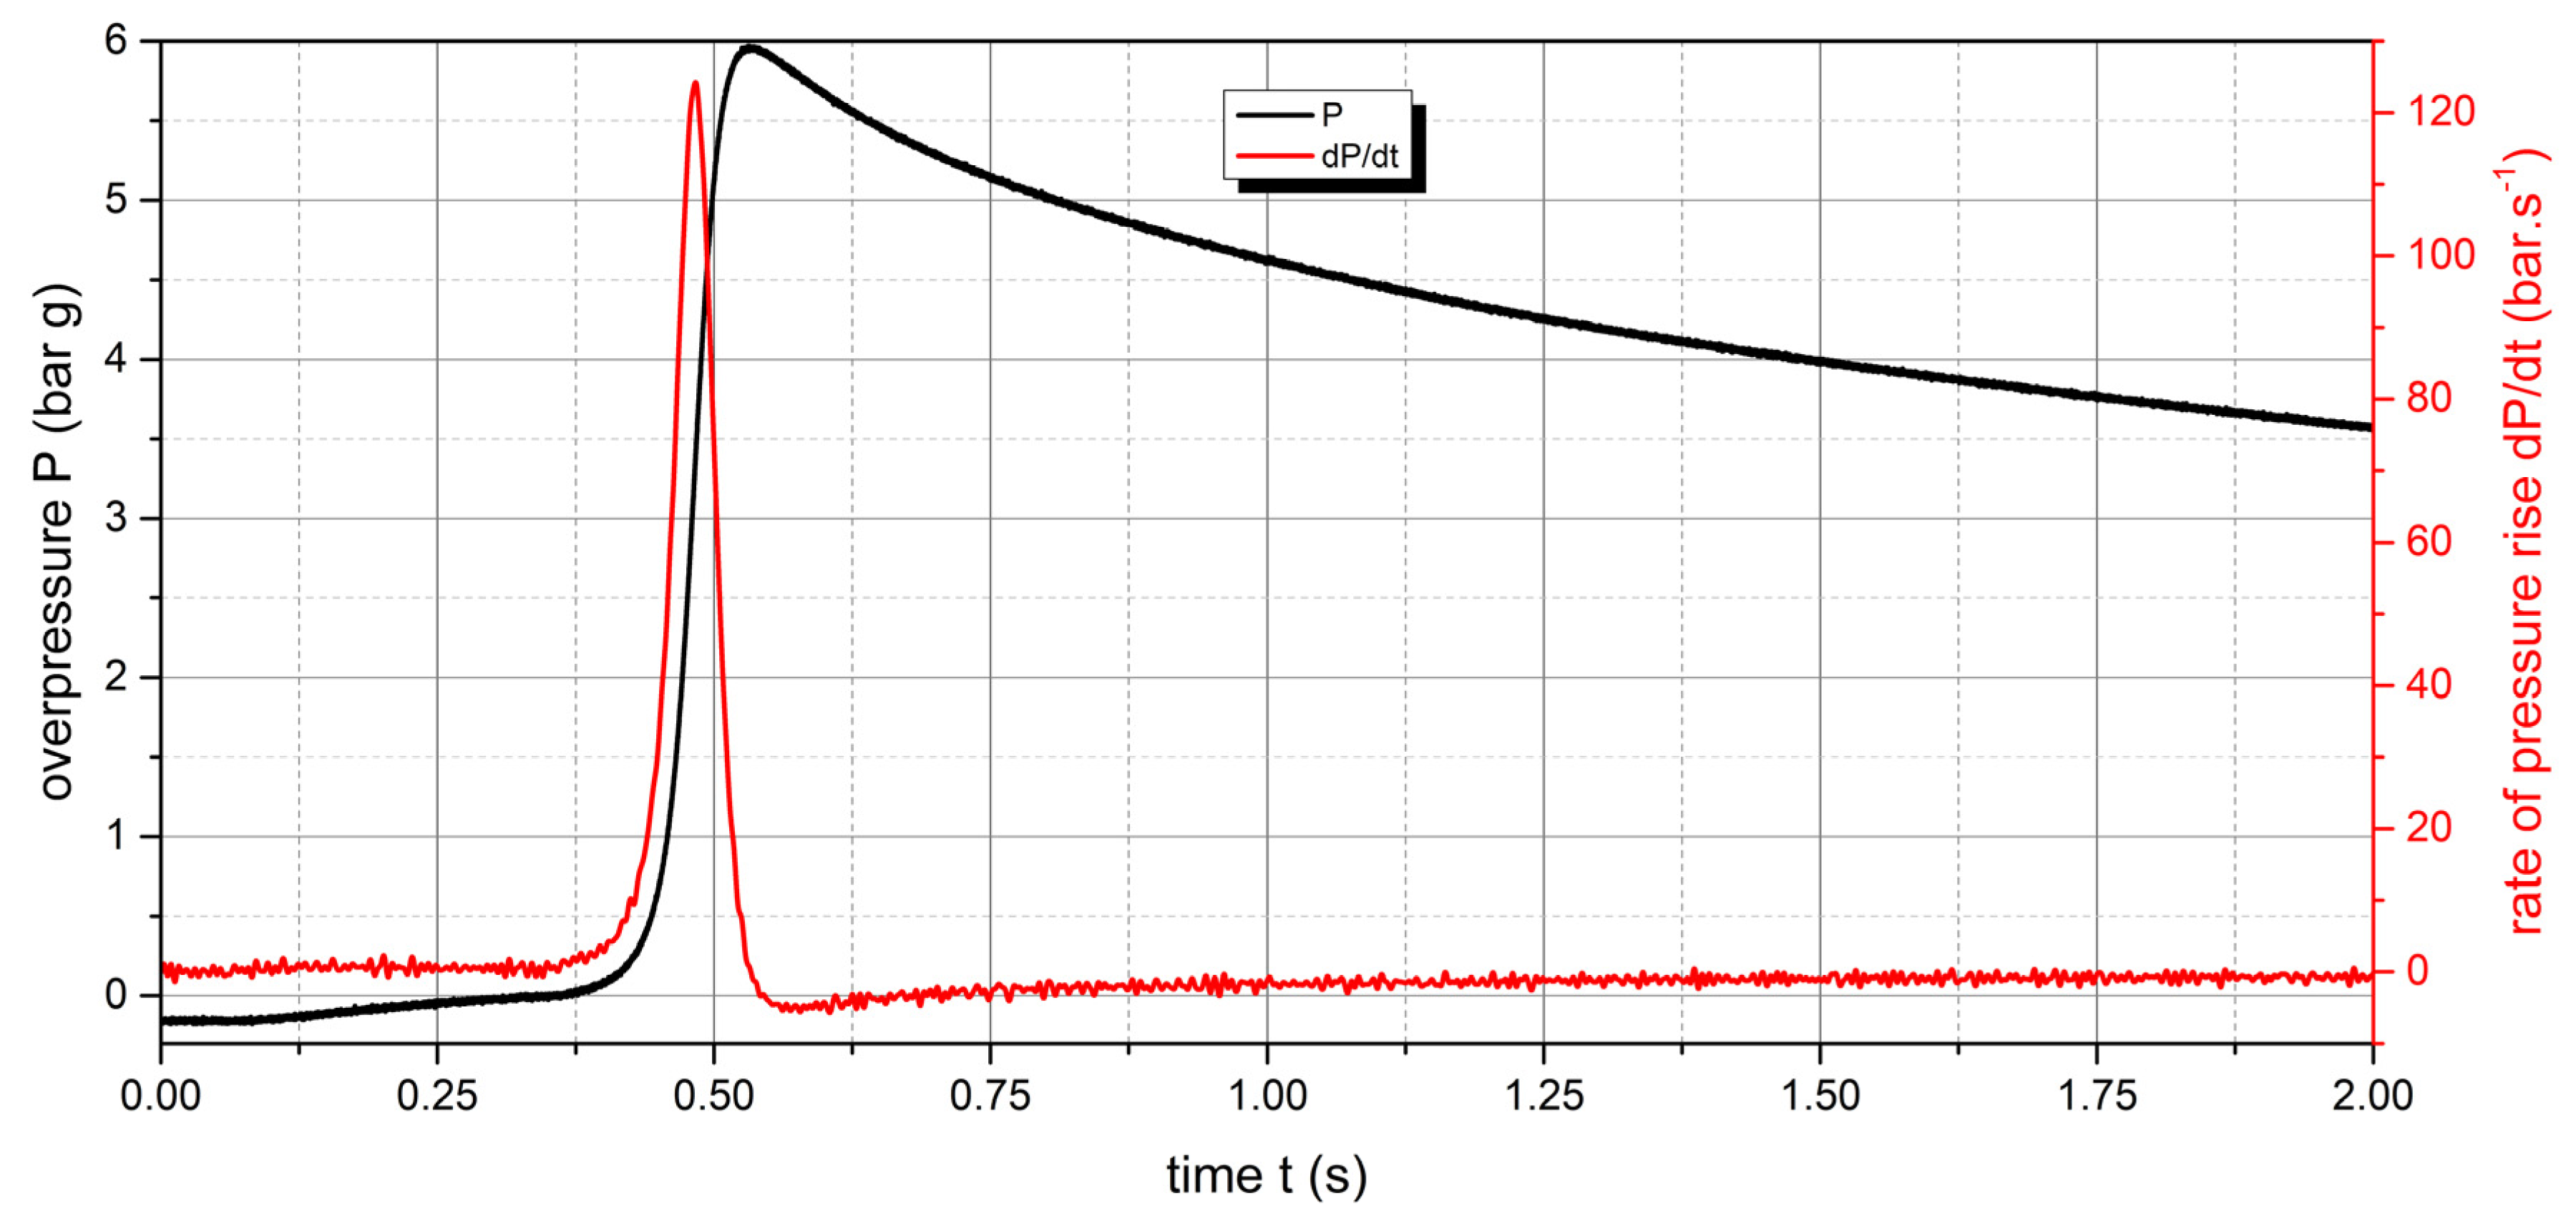
The time between opening the dispersing valve and activation of the igniter is 350 ms. Pressure changes inside the chamber are recorded by pressure transducers. The values are recorded at a speed of 50,000/s. Pressure changes during the explosion of dust clouds were measured at the following concentrations: 15 g·m−3 , 30 g·m−3 , 60 g·m−3 , 125 g·m−3 , 250 g·m−3 , 500 g·m−3 , 750 g·m−3 and 1000 g·m−3 . The measurement was performed three times at each concentration. The value is the highest value obtained during the measurements. The values of dP/dt Pmax were obtained by deriving a smoothed P-t curve (FFT filter, 200 Hz = 125 points of window).
Figure 6.
Cross-section of the KV 150M2 explosion chamber [
50] (1, chamber; 2, disperser tube; 3, air pressure vessel; 4, dispersing plate; 5, disperser; 6, air flow reverser.
Figure 6.
Cross-section of the KV 150M2 explosion chamber [
50] (1, chamber; 2, disperser tube; 3, air pressure vessel; 4, dispersing plate; 5, disperser; 6, air flow reverser.
Figure 7.
Cross-section of disperser [
51].
Figure 7.
Cross-section of disperser [
51].
3. Results and discussion
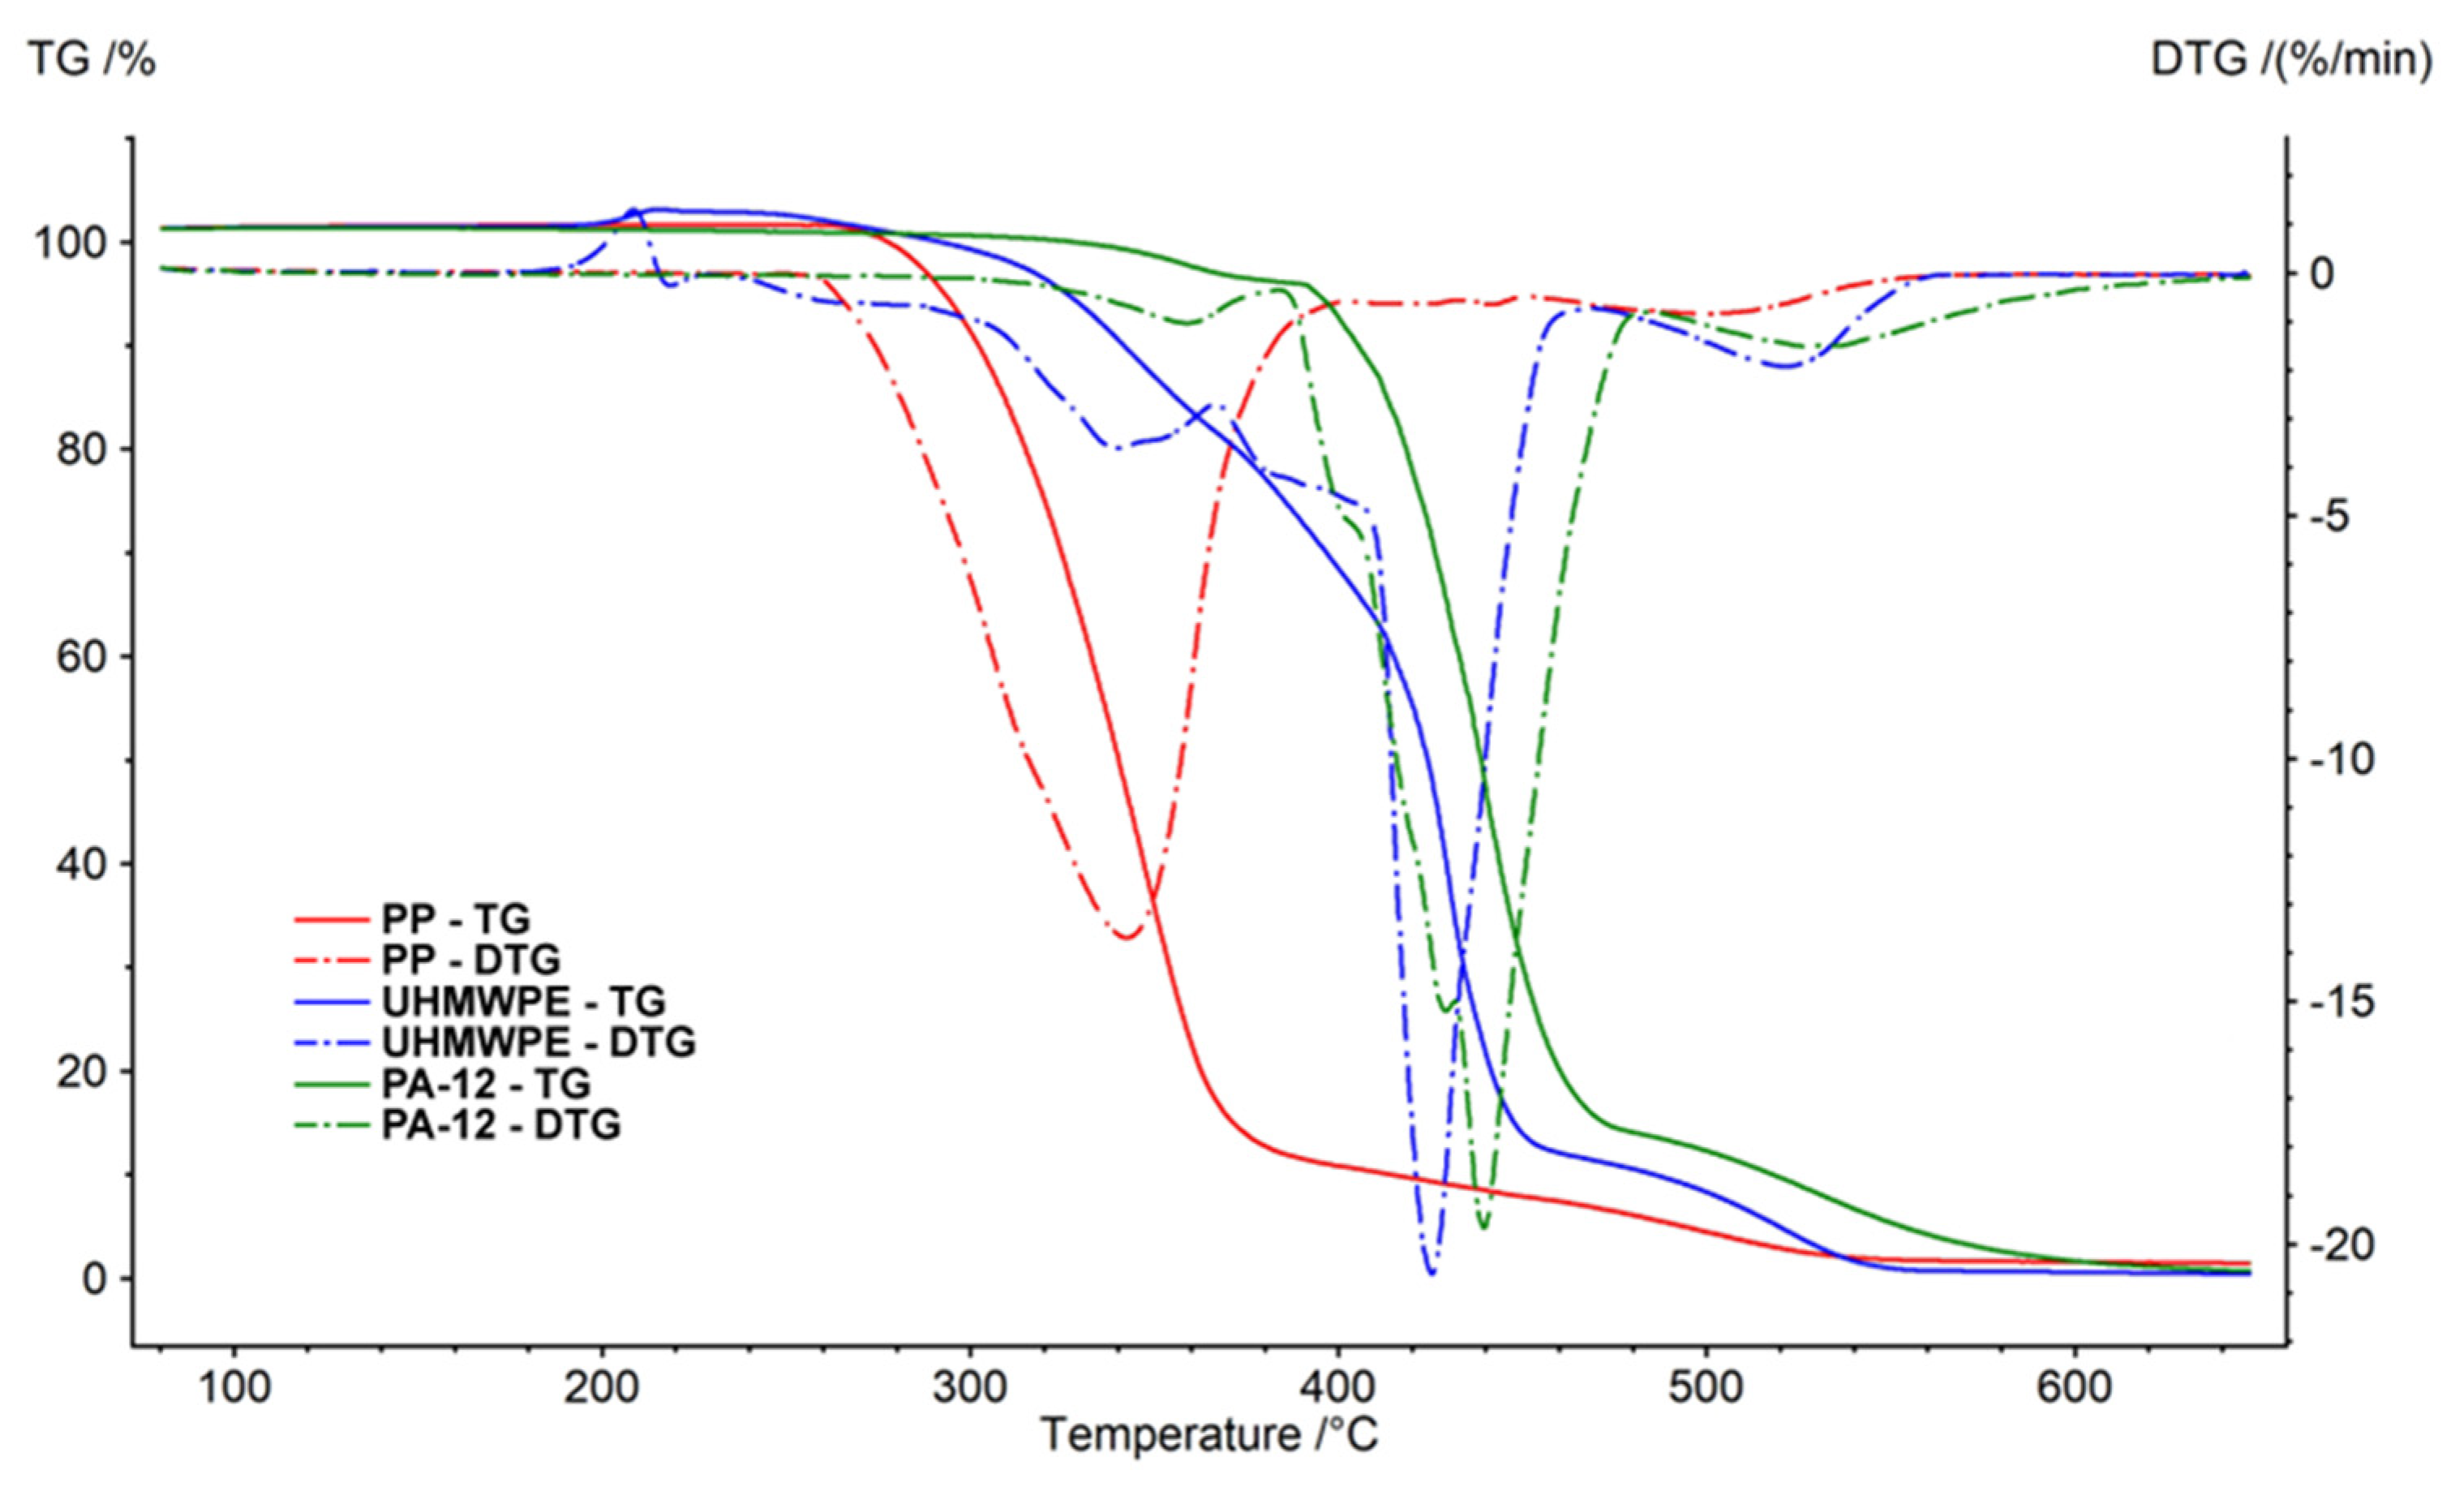
Thermogravimetric analysis (TGA) was performed using a NETZSCH STA 449 F5 Jupiter analyzer. TGA and DSC (differential scanning calorimetry) were used for measuring the energy change of the polymer by increasing the temperature in air (
Figure 8) and nitrogen (
Figure 9) atmosphere. Aluminium cells were used for analysis of the polymers. The temperatures of the sample cells were increased by 10 K/min. The weights of all of the samples were 10.0 ± 1.0 mg. The measurements were performed in a stream of pure nitrogen and a mixture simulating air (80%
vol. N
2 and 20%
vol. O
2). The gas flow rate was 100 ml.min
-1. The results are shown in
Table 2 and
Table 3.
Decomposition of polymer samples in nitrogen occurred in one step. The initial mass loss temperature of Polyamide PA12 was 126 °C, Polypropylene 221 °C and UMHW Polyethylene 287 °C. The undecomposed residue at 650 °C was about 1% of the weight of the samples.
In the air, the behaviour of individual polymers was different. The weight loss was due to the presence of oxygen at lower temperatures. Polypropylene weight loss took place in two stages. The main decrease (oxidation reactions) was observed at a temperature of 342 °C (1st peak). The thermogravimetric curve of Polypropylene in the air is very similar to the curve obtained by the measurement in nitrogen.
Decomposition of Polyamide PA12 was observed at higher temperatures. The course was similar to Polypropylene. However, the main decrease was at a temperature of 439 °C (2nd peak). The decrease caused by oxidation reactions (1st peak) was recorded at a temperature of 359 °C.
UHMW Polyethylene decomposed in oxygen in several steps. First, (Peak 1) at the temperatures around 200°C, there was an increase in the weight of the sample (caused by binding the oxygen from the surrounding atmosphere). Three more stages of decomposition followed. The main loss (Peak 3) was observed at a temperature of 425 °C (-70% weight loss). Similar to the measurements in nitrogen, the undecomposed residue after the measurements was lower than 2% in all cases.
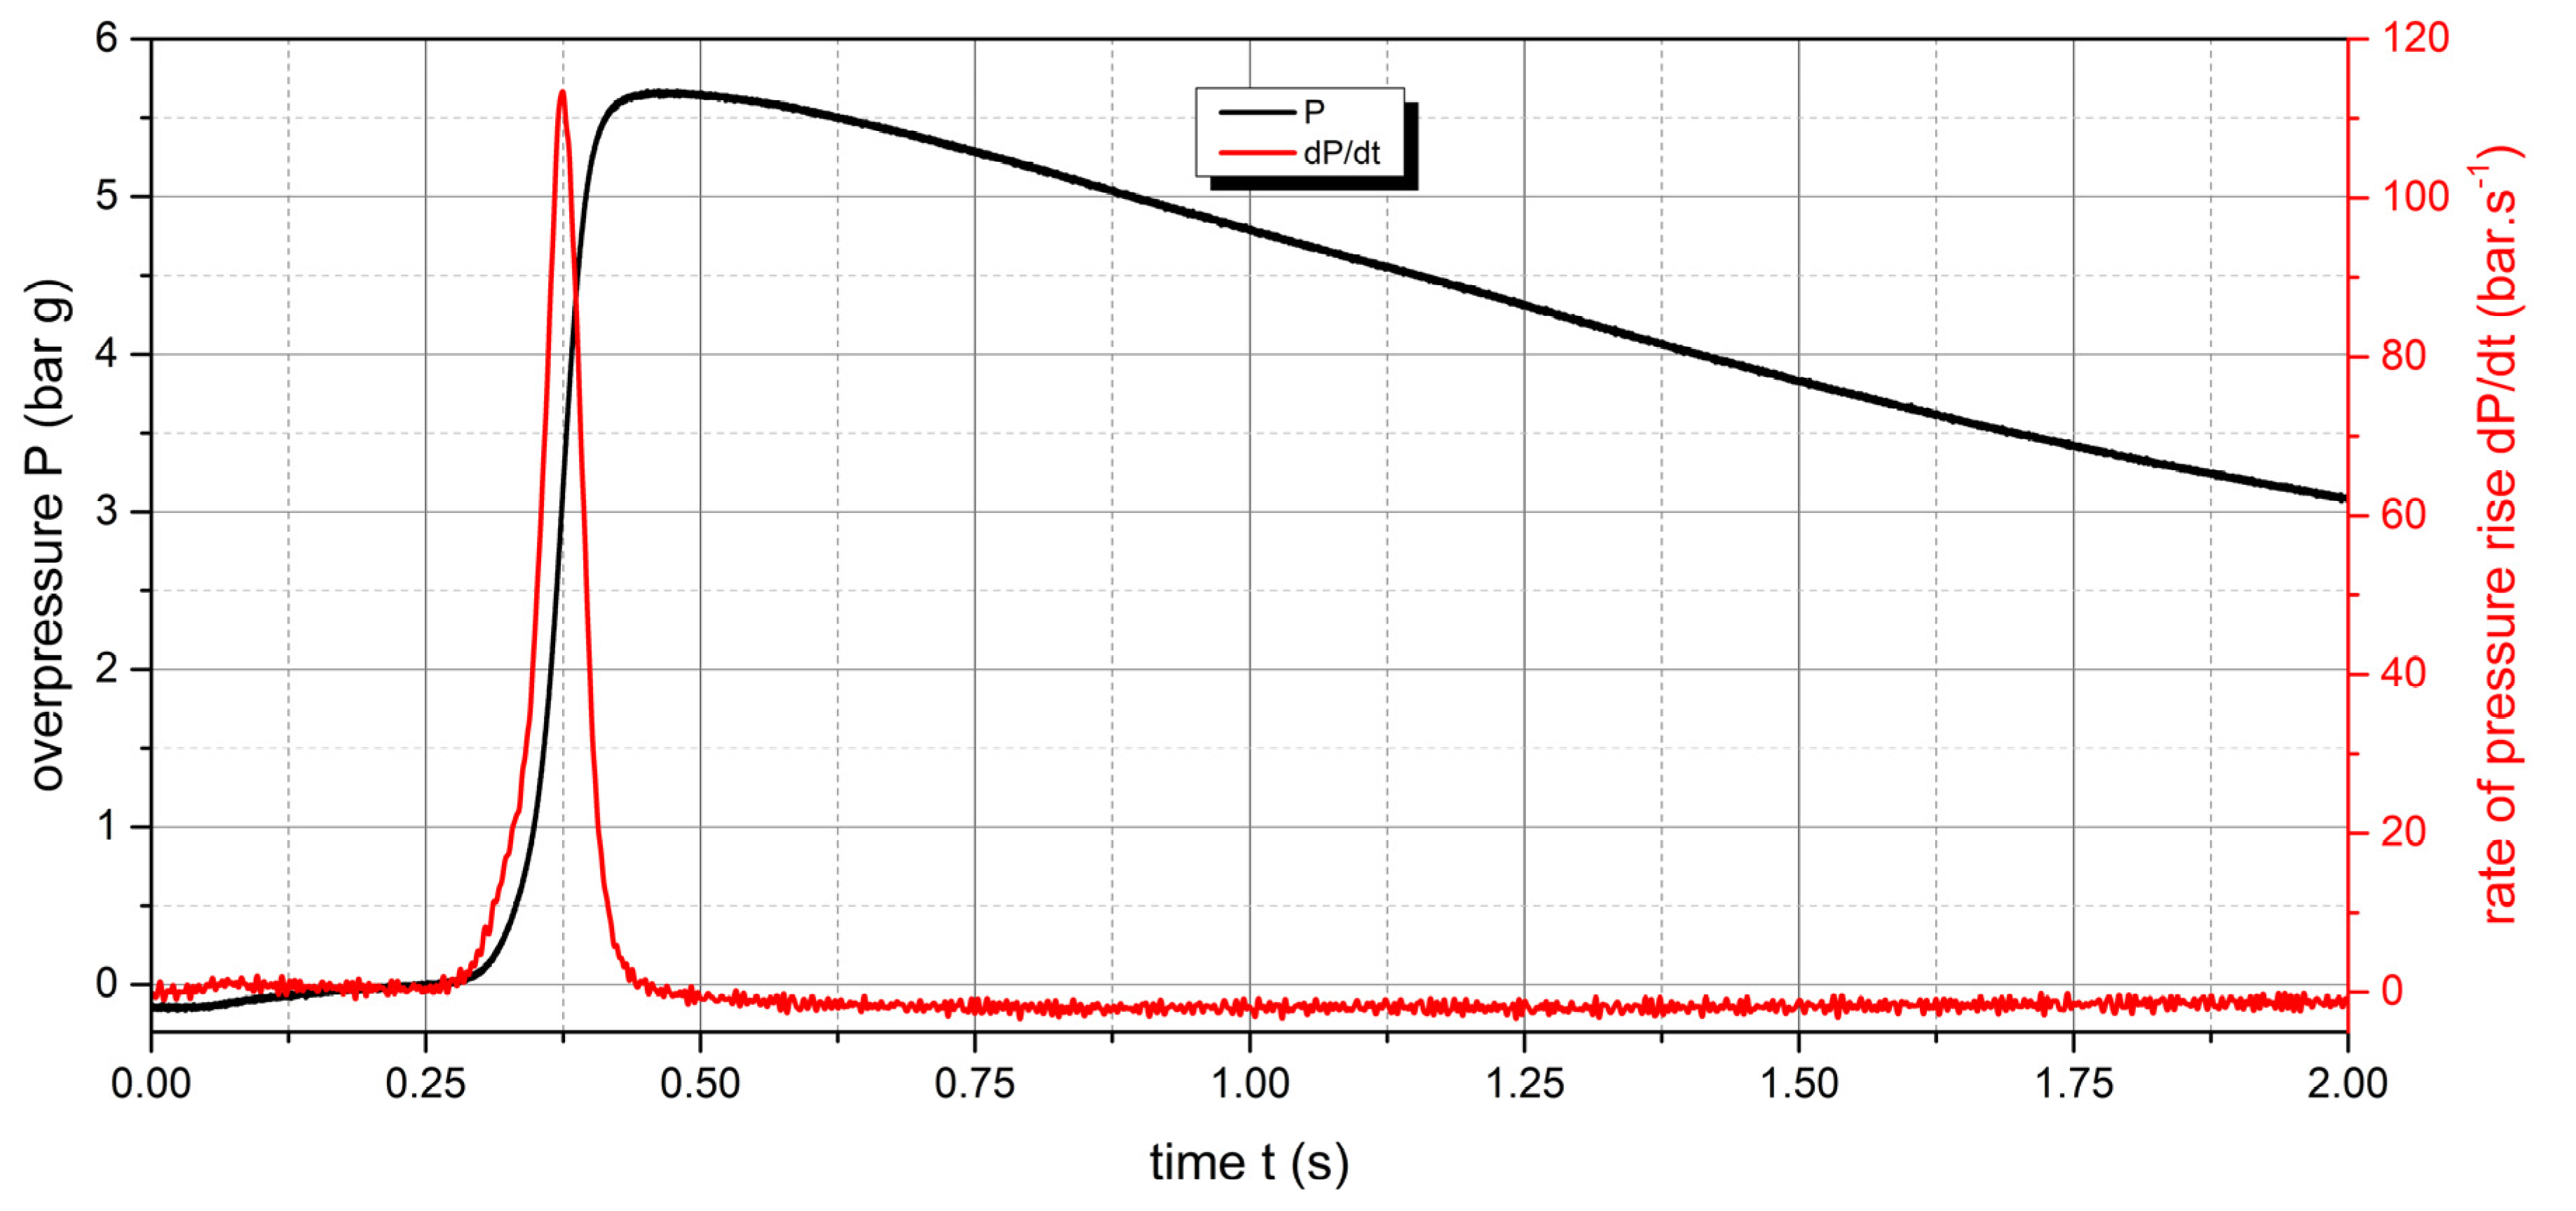
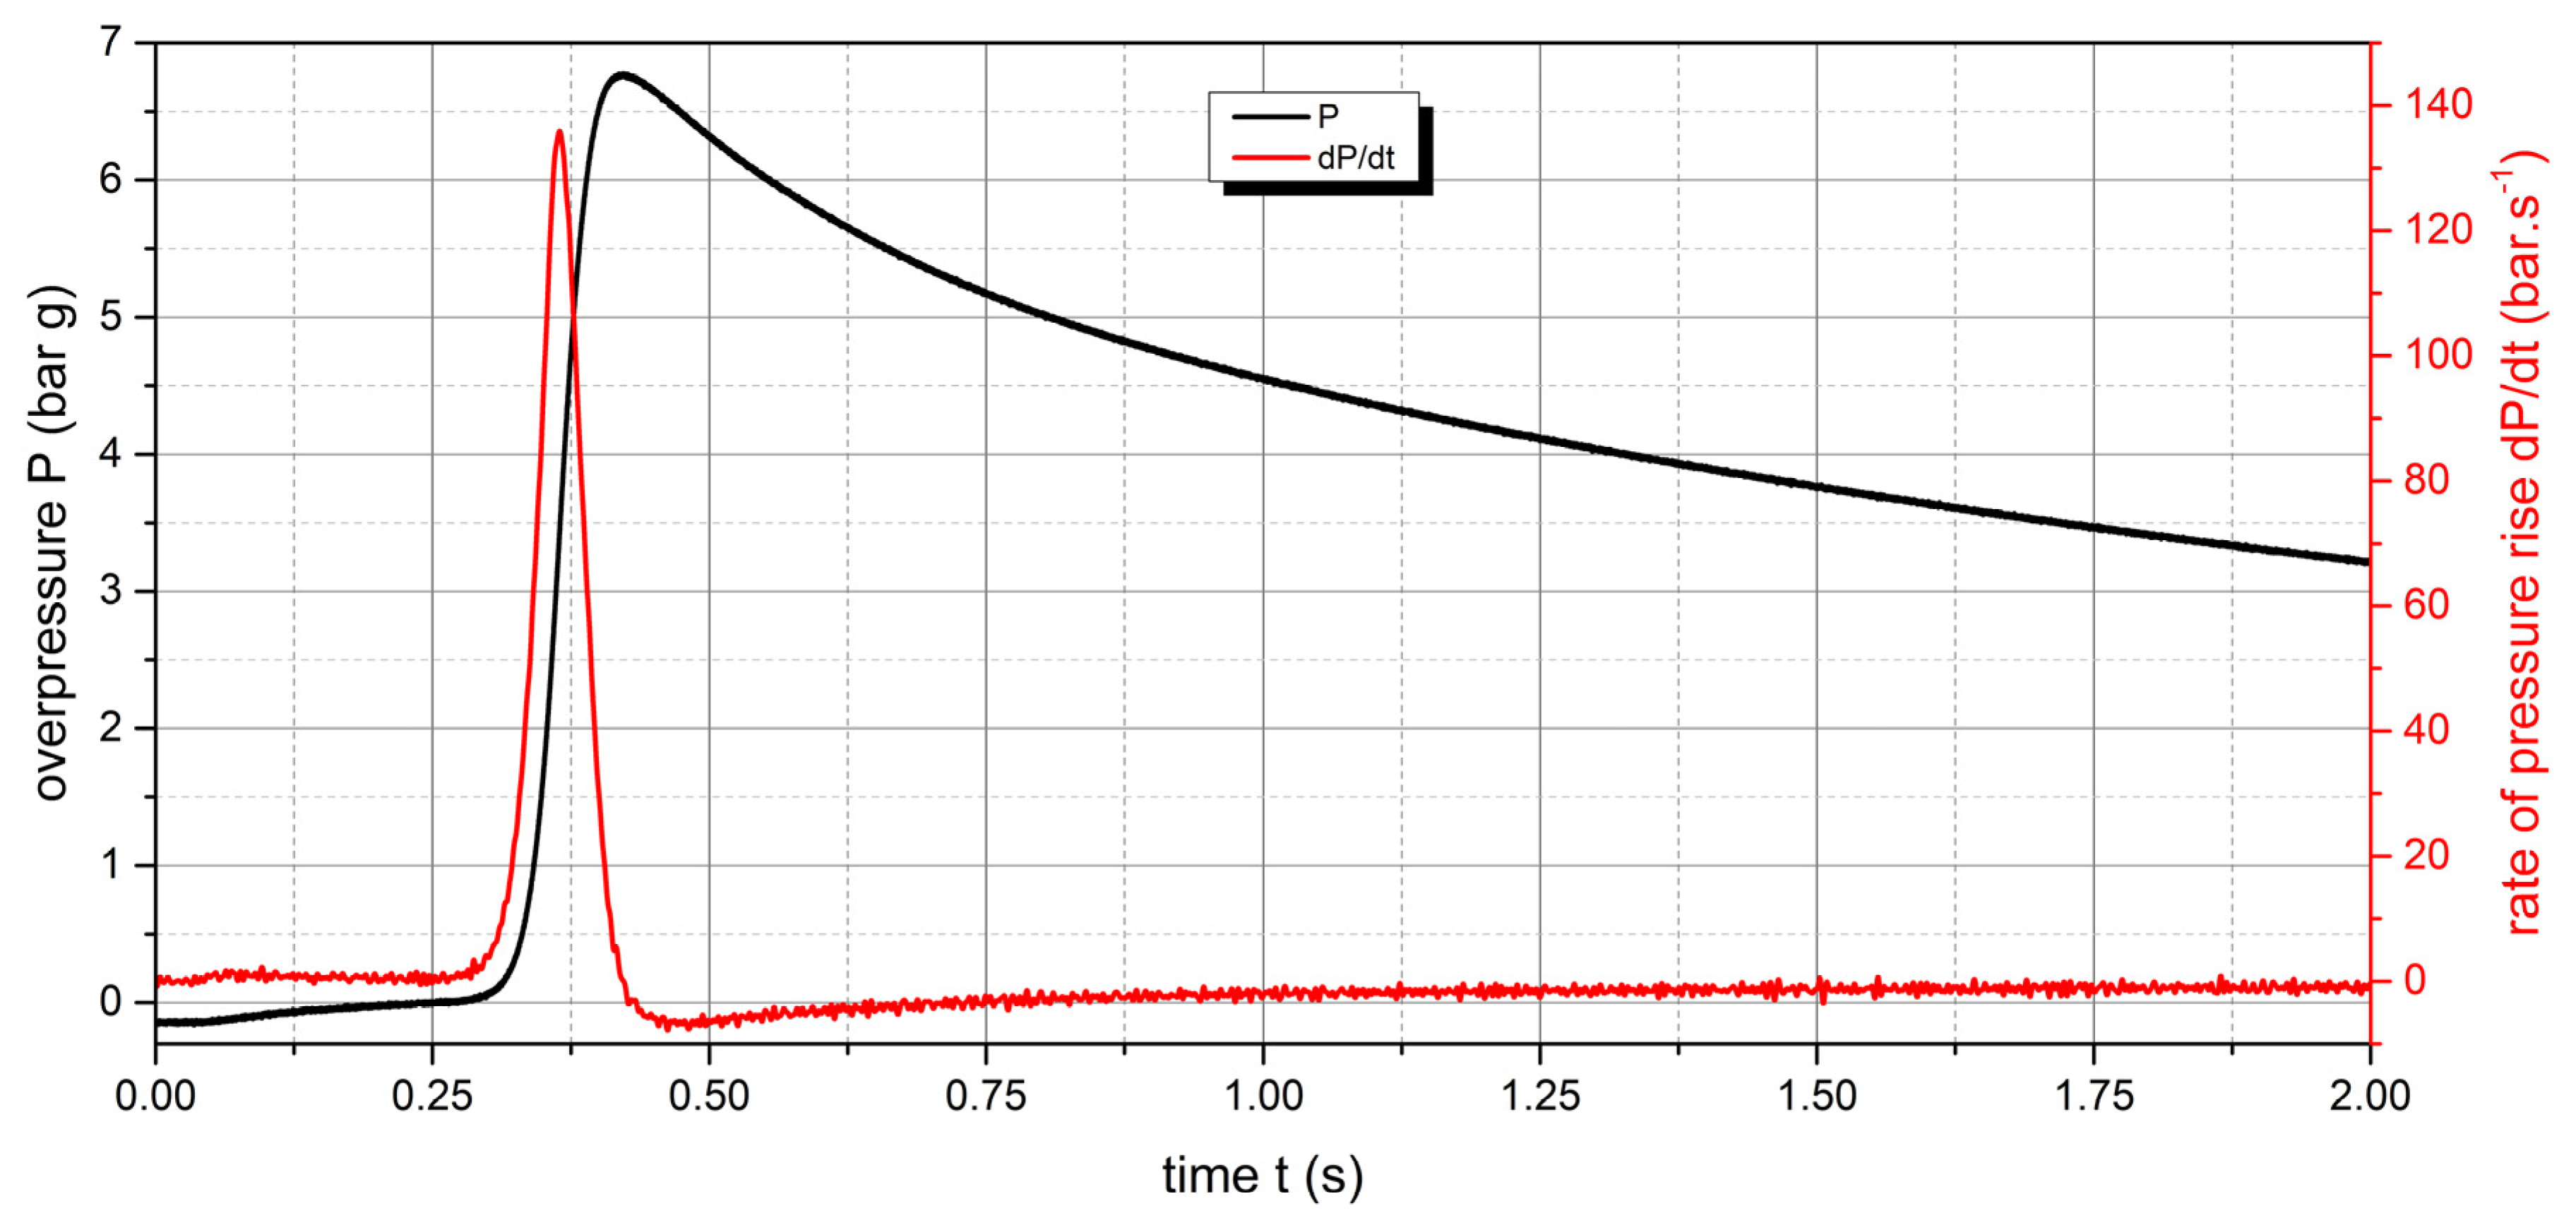
The measured values show that two samples are flammable. The highest values of explosion parameters were achieved with the Polyamide PA12 sample. The maximum explosion pressure Pmax was 6.76 bar at a concentration of 750 g.m-3. The highest rate of pressure rise was at a concentration of 500 g.m-3 with a value of 163.2 bar.s-1 (Kst = 116.6 bar.m.s-1). The lower explosive limit of the sample was 30 g.m-3.
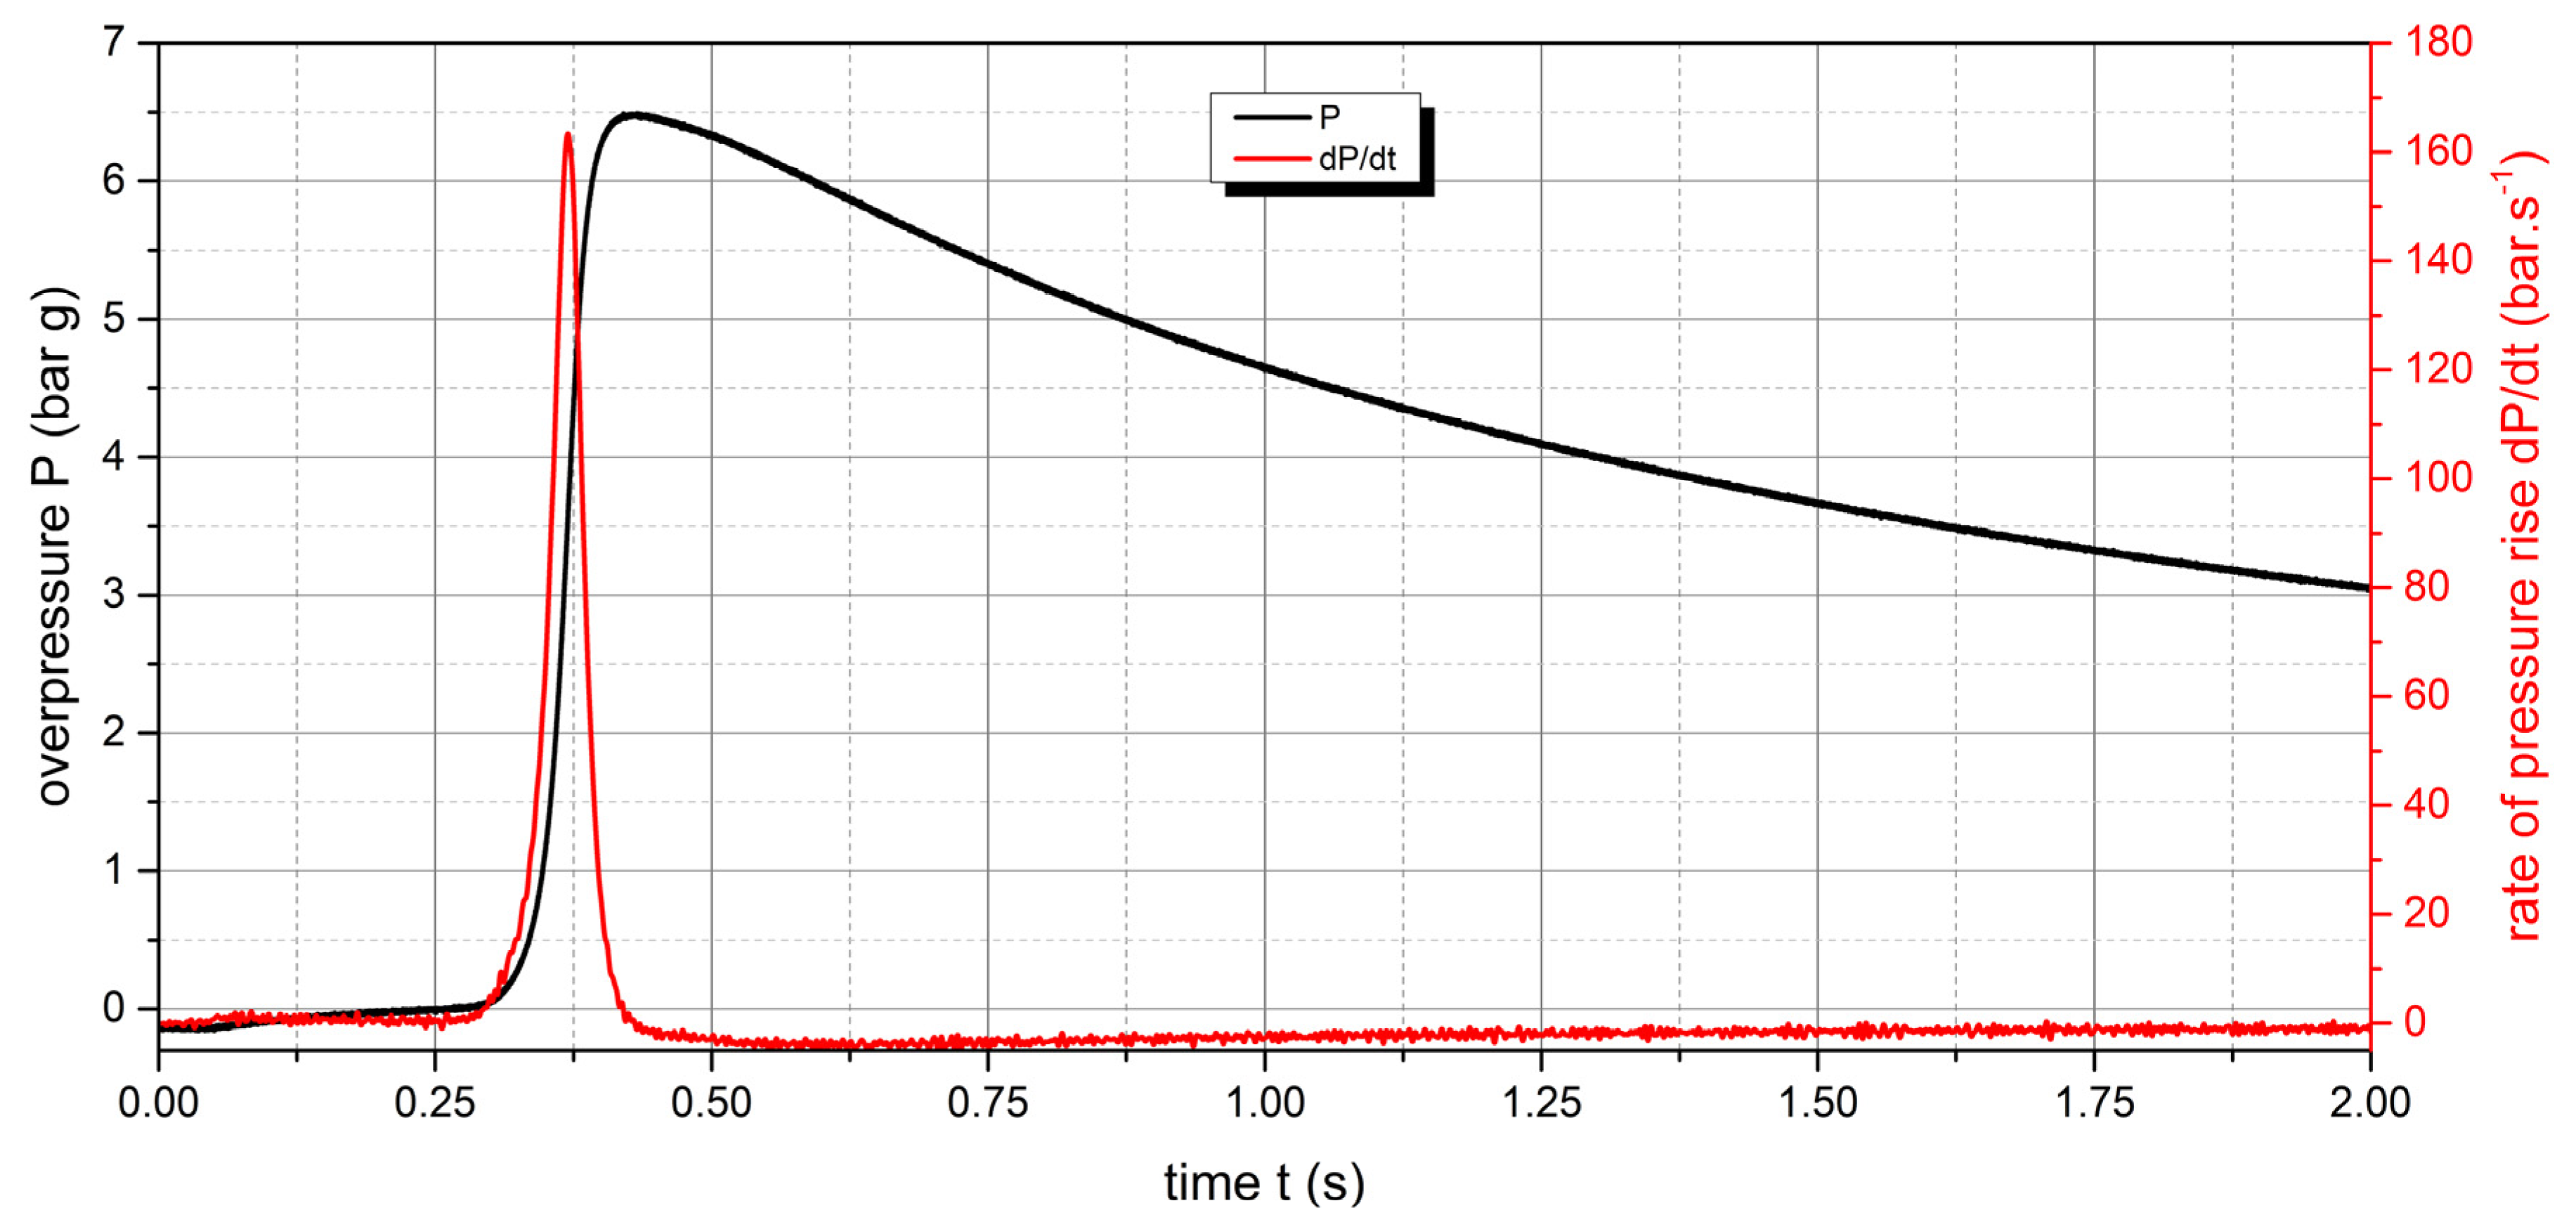
For the UHMW Polyethylene sample, the highest values were recorded at a concentration of 500 g.m-3. The explosion pressure value Pmax is 6.47 bar and the rate of pressure rise was 135.9 bar.s-1 (Kst = 97.1 bar.m.s-1). The lower explosive limit of the sample was 60 g.m-3. The same time response to the ignition source was observed for both flammable polymer samples.
No explosion was observed in the polypropylene sample at any of the measured concentrations. Despite the fact that polypropylene is a flammable substance, the additives contained in this polymer make it non-flammable. In practice, inorganic substances (oxides, carbonates...) or special organic substances (antioxidants) can be used as additives.
The results (
Table 5 and
Table 6) of the measurements in accordance with the EN ISO/IEC 80079 Standard show that the MIT of dispersed dust for Polyamide PA12 is 350 °C and the MIT for the UHMW Polyethylene sample is 320 °C. Polypropylene did not ignite when measuring the MIT dispersed dust. The use of Polypropylene material is safe in the entire temperature range (up to 450 °C). Polyamide PA12 and UHMW Polyethylene polymers can be safely used at the temperatures up to 300 °C.
4 Conclusion
The fire parameters of three polymer samples used in production technologies were determined. Currently, production technologies working with polymers are more and more frequent.
They often use powdery materials that can be flammable and explosive. Despite the fact that the basic component of such materials are polymers, various modifications and additives can significantly change their fire properties. Based on the measurement of fire parameters, it is then possible to assess the safety of their use.
The fire parameters of three types of polymers were compared in the research described in this article. The results allow us to conclude that two of the three samples are flammable and explosive.
The LEL values are 30 and 60 g.m-3, the maximum explosion pressure is more than 6 bar g and the explosion constant 100-135 bar.m.s-1. The minimum ignition temperature of dispersed dust from a hot surface is in the range of 320-350 °C. Therefore, when using these materials, it is necessary to apply the principles of explosion protection for their safe use. The Polypropylene sample was evaluated as non-flammable and non-explosive. It contains additives that make it non-flammable. Its use is safe, even if it comes to dispersion and contact with a hot surface. It can be concluded that the recommended way of increasing the fire safety level of polymers is the use of suitable additives. This can significantly increase the fire safety of polymer materials.
Authors of Contributions
R.K., Z.S., E.B. conceived and designed the experiments; R.K., Z.S., E.B., L.K., P.R., L.B., D.M., P.G. and F.J. performed the experiments and analysed the data; and R.K. and Z.S. managed all the experimental and writing process as the corresponding authors. All authors discussed the results and commented on the manuscript. All authors have read and agreed to the published version of the manuscript.
Funding
This research was supported by the Cultural and Educational Grant Agency of the Ministry of Education, Science, Research and Sport of the Slovak Republic under the Contract No. 020STU-4/2021 and by the Slovak Research and Development Agency under the Contract No. APVV-21-0187.
Institutional Review Board Statement
Not applicable.
Informed Consent Statement
Not applicable.
Data Availability Statement
The data presented in this study are available on request from the corresponding author.
Conflicts of Interest
The authors declare no conflict of interest.
References
- J. Vlachopoulos and D. Strutt, “Polymer processing,” Mater. Sci. Technol., Vol. 19, No. 9, pp. 1161–1169, 2003. [CrossRef]
- E. Manju Kumari Thakur, Handbook of sustainable polymers: processing and applications. CRC Press, 2016.
- C. M. González-Henríquez, M. A. Sarabia-Vallejos, and J. Rodriguez-Hernandez, “Polymers for additive manufacturing and 4D-printing: Materials, methodologies, and biomedical applications,” Prog. Polym. Sci., Vol. 94, pp. 57–116, 2019. [CrossRef]
- T. Abbasi and S. A. Abbasi, “Dust explosions-Cases, causes, consequences, and control,” J. Hazard. Mater., Vol. 140, No. 1–2, pp. 7–44, 2007. [CrossRef]
- R. K. Eckhoff, Dust explosions in the Process Industries, 3rd ed. USA: Gulf Professional Publishing, 2003.
- M. C. Wei, Y. C. Cheng, Y. Y. Lin, W. K. Kuo, and C. M. Shu, “Applications of dust explosion hazard and disaster prevention technology,” J. Loss Prev. Process Ind., Vol. 68, p. 104304, 2020. [CrossRef]
- S. Bernard, L. Youinou, and P. Gillard, “MIE determination and thermal degradation study of PA12 polymer powder used for laser sintering,” J. Loss Prev. Process Ind., Vol. 26, No. 6, pp. 1493–1500, 2013. [CrossRef]
- R. Kuracina, Z. Szabová, and M. Škvarka, “Study into parameters of the dust explosion ignited by an improvised explosion device filled with organic peroxide,” Process Saf. Environ. Prot., Vol. 155, pp. 98–107, 2021. [CrossRef]
- Technical data sheet, Polyamide 12. 2023.
- Vestosint, “Polyamide 12 powders for demanding couting applicatiobs,” 2023. Accessed: Jun. 11, 2023. [Online]. Available: https://www.vestosint.com/en/download.
- M. Vasquez, B. Haworth, and N. Hopkinson, “Methods for Quantifying the Stable Sintering Region in Laser Sintered Polyamide-12,” Polym. Eng. Sci., Vol. 53, No. 6, pp. 1131–1356, 2013. [CrossRef]
- R. Kuracina, Z. Szabová, E. Buranská, A. Pastierová, P. Gogola, and I. Buranský, “Determination of fire parameters of polyamide 12 powder for additive technologies,” Polymers (Basel)., Vol. 13, No. 17, 2021. [CrossRef]
- Wholers Report, “3D Printing and Additive Manufacturing State of the Industry,” 2020. [Online]. Available: https://wohlersassociates.com/2020report.htm.
- B. Özbay Kısasöz, I. E. Serhatlı, and M. E. Bulduk, “Selective Laser Sintering Manufacturing and Characterization of Lightweight PA 12 Polymer Composites with Different Hollow Microsphere Additives,” J. Mater. Eng. Perform., Vol. 31, No. 5, pp. 4049–4059, 2022. [CrossRef]
- “Plasty a riešenie,” Plastoplant SK - Web page, 2023. https://www.plastoplan.sk/ (accessed May 20, 2023).
- “Polypropylene SE523MO,” Borealis -Web page, 2023. https://www.material-safety-sheet.com/companies/borealisgroup.html (accessed May 15, 2023).
- X. S. Chen, Z. Z. Yu, W. Liu, and S. Zhang, “Synergistic effect of decabromodiphenyl ethane and montmorillonite on flame retardancy of polypropylene,” Polym. Degrad. Stab., Vol. 94, No. 9, pp. 1520–1525, 2009. [CrossRef]
- J. Yang et al., “Inerting effects of ammonium polyphosphate on explosion characteristics of polypropylene dust,” Process Saf. Environ. Prot., Vol. 130, pp. 221–230, 2019. [CrossRef]
- N. Pasquini, “Polypropylene handbook,” Choice Rev. Online, Vol. 43, No. 05, pp. 43-2825-43–2825, 2006. [CrossRef]
- Hisham A. Maddah, “Polypropylene as a Promising Plastic: A Review,” Am. J. Polym. Sci., Vol. 6, No. 1, pp. 1–11, 2016. [CrossRef]
- Technical data sheet, Ultra-High Molecular Weight Polyethylene - Technical Data Sheet. 2023.
- N. Kaya et al., “Polymeric thermal analysis of C + H and C + H + Ar ion implanted UHMWPE samples,” Nucl. Instruments Methods Phys. Res. Sect. B Beam Interact. with Mater. Atoms, Vol. 261, No. 1-2 SPEC. ISS., pp. 711–714, 2007. [CrossRef]
- A. Shtertser, B. Zlobin, V. Kiselev, S. Shemelin, A. Ukhina, and D. Dudina, “Cyclic Impact Compaction of an Ultra High Molecular Weight Polyethylene (UHMWPE) Powder and Properties of the Compacts,” Materials (Basel)., Vol. 15, No. 19, pp. 1–13, 2022. [CrossRef]
- D. Jauffrès, O. Lame, G. Vigier, and F. Doré, “Microstructural origin of physical and mechanical properties of ultra high molecular weight polyethylene processed by high velocity compaction,” Polymer (Guildf)., Vol. 48, No. 21, pp. 6374–6383, 2007. [CrossRef]
- 2: 933-1, 2012; 25. EN 933-1:2012 Tests for geometrical properties of aggregates, 2012.
- G. S. Martynková et al., “Polyamide 12 materials study of morpho-structural changes during laser sintering of 3d printing,” Polymers (Basel)., Vol. 13, No. 5, 2021. [CrossRef]
- G. V. Salmoria, R. A. Paggi, A. Lago, and V. E. Beal, “Microstructural and mechanical characterization of PA12/MWCNTs nanocomposite manufactured by selective laser sintering,” Polym. Test., Vol. 30, No. 6, pp. 611–615, 2011. [CrossRef]
- T. Ishikawa, S. Nagai, and N. Kasai, “Effect of Casting Conditions on Polymorphism of Nylon-12.,” J. Polym. Sci. Part A-2, Polym. Phys., Vol. 18, No. 2, pp. 291–299, 1980. [CrossRef]
- Y. Liu, L. Zhu, L. Zhou, and Y. Li, “Microstructure and mechanical properties of reinforced polyamide 12 composites prepared by laser additive manufacturing,” Rapid Prototyp. J., Vol. 25, No. 6, pp. 1127–1134, 2019. [CrossRef]
- R. Androsch, M. Stolp, and H. J. Radusch, “Simultaneous X-ray diffraction and differential thermal analysis of polymers,” Thermochim. Acta, Vol. 271, No. 1–2, pp. 1–8, 1996. [CrossRef]
- M. Schmid, R. Kleijnen, M. Vetterli, and K. Wegener, “Influence of the origin of polyamide 12 powder on the laser sintering process and laser sintered parts,” Appl. Sci., Vol. 7, No. 5, 2017. [CrossRef]
- T. Nishino, T. Matsumoto, and K. Nakamae, “Surface structure of isotactic polypropylene by X-ray diffraction,” Polymer Engineering and Science, Vol. 40, No. 2. pp. 336–343, 2000. [CrossRef]
- E. S. Clark, Physical properties of materials: Second edition. 2007.
- Ž. Andrić, M. D. Dramićanin, V. Jokanović, T. Dramićanin, M. Mitrić, and B. Viana, “Luminescent properties of nano-SiO2:Eu3+/polypropylene composite,” J. Optoelectron. Adv. Mater., Vol. 8, No. 2, pp. 829–834, 2006.
- S. Wang, A. Ajji, S. Guo, and C. Xiong, “Preparation of microporous polypropylene/titanium dioxide composite membranes with enhanced electrolyte uptake capability via melt extruding and stretching,” Polymers (Basel)., Vol. 9, No. 3, 2017. [CrossRef]
- R. H. Somani, B. S. Hsiao, A. Nogales, H. Fruitwala, S. Srinivas, and A. H. Tsou, “Structure development during shear flow induced crystallization of i-PP: In situ wide-angle X-ray diffraction study,” Macromolecules, Vol. 34, No. 17. pp. 5902–5909, 2001. [CrossRef]
- G. Machado et al., “Crystalline properties and morphological changes in plastically deformed isotatic polypropylene evaluated by X-ray diffraction and transmission electron microscopy,” Eur. Polym. J., Vol. 41, No. 1, pp. 129–138, 2005. [CrossRef]
- B. Zhu et al., “Novel Polyethylene Fibers of Very High Thermal Conductivity Enabled by Amorphous Restructuring,” ACS Omega, Vol. 2, No. 7, pp. 3931–3944, 2017. [CrossRef]
- N. Stojilovic, S. V. Dordevic, and S. Stojadinovic, “Effects of clinical X-ray irradiation on UHMWPE films,” Nucl. Instruments Methods Phys. Res. Sect. B Beam Interact. with Mater. Atoms, Vol. 410, pp. 139–143, 2017. [CrossRef]
- M. Fejdyś, M. Łandwijt, A. Kucharska-Jastrzabek, and M. H. Struszczyk, “The effect of processing conditions on the performance of UHMWPE-fibre reinforced polymer matrix composites,” Fibres Text. East. Eur., Vol. 24, No. 4, pp. 112–120, 2016. [CrossRef]
- B. C. Smith, “The Infrared Spectra of Polymers II: Polyethylene,” Spectroscopy, Vol. 36, No. 9, pp. 24–29, 2021. [CrossRef]
- J. Fang, L. Zhang, D. Sutton, X. Wang, and T. Lin, “Needleless melt-electrospinning of polypropylene nanofibres,” J. Nanomater., Vol. 2012, 2012. [CrossRef]
- B. C. Smith, “The Infrared Spectra of Polymers III: Hydrocarbon Polymers,” Spectroscopy, Vol. 36, No. 11, pp. 22–25, 2021. [CrossRef]
- M. Bahrami, J. Abenojar, and M. A. Martínez, “Comparative characterization of hot-pressed polyamide 11 and 12: Mechanical, thermal and durability properties,” Polymers (Basel)., Vol. 13, No. 20, pp. 1–21, 2021. [CrossRef]
- Y. Schuman and L. Hang, “‘Thermal Degradation Study of Nylon 66 using Hyphenation Techniques TGA-MS and TGA-FTIR-GC/MS,’” J. Therm. Anal. Calorim., Vol. 59, No. 1/2, pp. 385–394, 2000.
- B. C. Smith, “Infrared Spectroscopy of Polymers, XI: Introduction to Organic Nitrogen Polymers,” Spectroscopy, Vol. 38, No. 3, pp. 14–18, 2023.
- R. K. Eckhoff, “Origin and development of the Godbert-Greenwald furnace for measuring minimum ignition temperatures of dust clouds,” Process Saf. Environ. Prot., Vol. 129, pp. 17–24, 2019. [CrossRef]
- ISO/IEC 80079-20-2 British and Institution Standards, Explosive Atmospheres—Part 20—2: Material Characteristics—Combustible Dusts Test Methods. London, UK, 2016.
- STN EN 14034-A1, Determination of properties of combustible dust during explosion. Part 1: Determination of the maximum pressure Pmax during combustible dust explosion. Slovakia: Slovak Standards Institute, 2011.
- Kuracina R., Szabová Z., Bachratý M., Mynarz M., Škvarka M., A new 365-litre dust explosion chamber: Design and testing, Powder Technology, Volume 386, 2021, Pages 420-427, ISSN 0032-5910. [CrossRef]
- Kuracina R., Szabová Z., Škvarka M., Study into parameters of the dust explosion ignited by an improvised explosion device filled with organic peroxide, Process Safety and Environmental Protection, Volume 155, 2021, Pages 98-107, ISSN 0957-5820. [CrossRef]
Figure 1.
LSM images particles of a) Polyamide PA12 b) Polypropylene c) UHMW Polyethylene (confocal laser scanning microscope).
Figure 1.
LSM images particles of a) Polyamide PA12 b) Polypropylene c) UHMW Polyethylene (confocal laser scanning microscope).
Figure 2.
SEM images of fracture surfaces of a) Polyamide PA12 b) polypropylene c) UHMW Polyethylene (scanning electron microscope).
Figure 2.
SEM images of fracture surfaces of a) Polyamide PA12 b) polypropylene c) UHMW Polyethylene (scanning electron microscope).
Figure 3.
X-RAY of a) Polyamide PA12 b) Polypropylene c) UHMW Polyethylene.
Figure 3.
X-RAY of a) Polyamide PA12 b) Polypropylene c) UHMW Polyethylene.
Figure 4.
Infrared spectra of a) Polyamide PA12 b) Polypropylene c) UHMW Polyethylene.
Figure 4.
Infrared spectra of a) Polyamide PA12 b) Polypropylene c) UHMW Polyethylene.
Figure 5.
Cross-section of Godbert-Greenwald furnace [
47].
Figure 5.
Cross-section of Godbert-Greenwald furnace [
47].
Figure 8.
Thermogravimetric analysis of samples in air.
Figure 8.
Thermogravimetric analysis of samples in air.
Figure 9.
Thermogravimetric analysis of samples in nitrogen.
Figure 9.
Thermogravimetric analysis of samples in nitrogen.
Figure 10.
Pressure record of Polyamide PA12 with concentration of 250 g.m-3.
Figure 10.
Pressure record of Polyamide PA12 with concentration of 250 g.m-3.
Figure 11.
Pressure record of Polyamide PA12 with concentration of 500 g.m-3.
Figure 11.
Pressure record of Polyamide PA12 with concentration of 500 g.m-3.
Figure 12.
Pressure record of Polyamide PA12 with concentration of 750 g.m-3.
Figure 12.
Pressure record of Polyamide PA12 with concentration of 750 g.m-3.
Figure 13.
Pressure record of UHMW Polyethylene with concentration of 250 g.m-3.
Figure 13.
Pressure record of UHMW Polyethylene with concentration of 250 g.m-3.
Figure 14.
Pressure record of UHMW Polyethylene with concentration of 500 g.m-3.
Figure 14.
Pressure record of UHMW Polyethylene with concentration of 500 g.m-3.
Figure 15.
Pressure record of UHMW Polyethylene with concentration of 750 g.m-3.
Figure 15.
Pressure record of UHMW Polyethylene with concentration of 750 g.m-3.
Table 1.
Proportion of particle sizes in the sample Polyamide PA12, Polypropylene and UHMW Polyethylene.
Table 1.
Proportion of particle sizes in the sample Polyamide PA12, Polypropylene and UHMW Polyethylene.
| Sieve size (µm) |
Sample |
| Polyamide PA 12 |
UMHW Polyethylene |
Polypropylene |
| % wt.
|
cumulative % |
% wt.
|
cumulative % |
% wt.
|
cumulative % |
| 500 |
0.08 |
100 |
32.64 |
100 |
0 |
100 |
| 355 |
0.14 |
99.92 |
29.34 |
67.36 |
1.61 |
100 |
| 250 |
0.58 |
99.78 |
21.18 |
38.02 |
8.11 |
98.39 |
| 180 |
12.11 |
99.2 |
7.42 |
16.84 |
14.86 |
90.28 |
| 125 |
43.62 |
87.09 |
6.04 |
9.42 |
19.98 |
75.42 |
| 90 |
35.12 |
43.47 |
1.47 |
3.38 |
24.09 |
55.44 |
| 63 |
7.23 |
8.35 |
1.29 |
1.91 |
17.81 |
31.35 |
| 45 |
0.91 |
1.12 |
0.53 |
0.62 |
11.62 |
13.54 |
| < 45 |
0.21 |
0.21 |
0.09 |
0.09 |
1.92 |
1.92 |
| median |
95 µm |
293 µm |
84 µm |
Table 2.
Results of thermogravimetric measurement of samples in air.
Table 2.
Results of thermogravimetric measurement of samples in air.
| Polymer |
Polypropylene |
UHMW Polyethylene |
Polyamide PA-12 |
| Step 1 |
Range [°C] |
218.5-450.8 |
185.8-214.5 |
124.4-384.1 |
| Peak [°C] |
342.4 |
208.5 |
358.7 |
| Weight loss [%] |
92.3 |
-1.6 |
5.2 |
| Step 2 |
Range [°C] |
450.8 – 650.0 |
214.5-366.4 |
384.1-484.0 |
| Peak [°C] |
498.9 |
339.8 |
439.5 |
| Weight loss [%] |
6.3 |
21.1 |
81.2 |
| Step 3 |
Range [°C] |
- |
366.4-469.1 |
484.0-650.0 |
| Peak [°C] |
- |
425.4 |
526.8 |
| Weight loss [%] |
- |
69.3 |
12.9 |
| Step 4 |
Range [°C] |
- |
469.1-650.0 |
- |
| Peak [°C] |
- |
521.3 |
- |
| Weight loss [%] |
- |
10.8 |
- |
| Residue at 650 °C [%] |
1.4 |
0.4 |
0.7 |
Table 3.
Results of thermogravimetric measurements of samples in air.
Table 3.
Results of thermogravimetric measurements of samples in air.
| Polymer |
Polypropylene |
UHMW Polyethylene |
Polyamide PA-12 |
| Step 1 |
Range [°C] |
221.4-650.0 |
287.1-650.0 |
126.3-650.0 |
| Peak [°C] |
450.9 |
480.1 |
442.7 |
| Weight loss [%] |
98.8 |
99.3 |
98.7 |
| Residue at 650 °C [%] |
1.2 |
0.7 |
1.3 |
Table 4.
Explosion parameters of polymer samples.
Table 4.
Explosion parameters of polymer samples.
| Sample |
Polyamide PA 12 |
UHMW Polyethylene |
Polypropylene |
Concentration
[g.m-3]
|
Pmax
[bar g] |
dP/dt
[bar.s-1] |
Pmax
[bar g] |
dP/dt
[bar.s-1] |
|
| 30 |
0.75 |
5.6 |
– |
– |
NO EXPLOSION |
| 60 |
2.51 |
24.5 |
1.81 |
12.6 |
| 125 |
4.29 |
56.5 |
4.14 |
34.9 |
| 250 |
5.66 |
113.3 |
5.77 |
56.2 |
| 500 |
6.48 |
163.2 |
6.47 |
135.9 |
| 750 |
6.76 |
135.8 |
5.97 |
124.2 |
| 1000 |
6.33 |
111.5 |
5.67 |
87.3 |
Table 5.
Measured values of MIT sample Polyamide PA12.
Table 5.
Measured values of MIT sample Polyamide PA12.
| Sample weight [g] |
Air Pressure [kPa] |
Temperature [°C] |
Results |
| 0.2 |
50 |
450 |
YES |
| 440 |
YES |
| 430 |
YES |
| 420 |
YES |
| 410 |
YES |
| 400 |
YES |
| 390 |
YES |
| 380 |
YES |
| 370 |
NO |
| 0.11 |
50 |
370 |
NO |
| 380 |
YES |
| 370 |
NO |
Table 6.
Measured values of MIT sample UHMW Polyethylene.
Table 6.
Measured values of MIT sample UHMW Polyethylene.
| Sample weight [g] |
Air Pressure [kPa] |
Temperature [°C] |
Results |
| 0.11 |
50 |
370 |
YES |
| 360 |
YES |
| 350 |
YES |
| 340 |
NO |
|
Disclaimer/Publisher’s Note: The statements, opinions and data contained in all publications are solely those of the individual author(s) and contributor(s) and not of MDPI and/or the editor(s). MDPI and/or the editor(s) disclaim responsibility for any injury to people or property resulting from any ideas, methods, instructions or products referred to in the content. |
© 2023 by the authors. Licensee MDPI, Basel, Switzerland. This article is an open access article distributed under the terms and conditions of the Creative Commons Attribution (CC BY) license (http://creativecommons.org/licenses/by/4.0/).
