Preprint
Article

Comparative analysis of COVID-19 response measures and their impact on mortality rate

Altmetrics

Downloads

176

Views

35

Comments

0

A peer-reviewed article of this preprint also exists.

This version is not peer-reviewed

Submitted:

28 September 2023

Posted:

03 October 2023

You are already at the latest version

Alerts
Abstract
(1) Background: The COVID-19 pandemic significantly affected worldwide, with varying responses implemented to control its spread. This study aimed to compare the epidemic data compiled by the World Health (2) Methods: Organization to understand the impact of the measures adopted by each country on the mortality rate. The increase or decrease in the number of confirmed cases was understood in logarithmic terms, for which logarithmic growth rates “K” were used. The mortality rate was calculated as the percentage of deaths from the confirmed cases, which was also used for logarithmic comparison. (3) Results: Countries that effectively detected and isolated patients had a mortality rate 10 times lower than those that did not. Although strict lockdowns were once effective, they could not be implemented on an ongoing basis. In fact, after their cancelation, large outbreaks occurred because of medical breakdowns. The virus variants mutated with increased infectivity, which impeded the measures that were once effective, including vaccinations. Although the designs of mRNA vaccines were renewed, they could not keep up with the virus mutation rate. The only effective defence was steadily identifying and isolating patients. (4) Conclusions: These findings have crucial implications for the complete containment of the pandemic and future pandemic preparedness.
Keywords: 
Subject: Public Health and Healthcare  -   Health Policy and Services

1. Introduction

The COVID-19 pandemic has spread worldwide, leading to physical disabilities and countless deaths [1-6]. Countries have implemented various measures to respond to the pandemic. Some countries, such as Iceland and Taiwan, have successfully contained the virus by conducting frequent polymerase chain reaction (PCR) tests and quickly identifying new cases [7-9]. Others have attempted to lockdown areas to contain the spread of the virus. However, the effectiveness of these measures varied greatly, with many countries experiencing delayed epidemic detection and inefficient disease control. The effectiveness of frequent PCR testing and strict lockdown has been demonstrated in China, Australia, and New Zealand [10, 11]. However, with the emergence of the more infectious Omicron variant, strict lockdowns were inadequate. At that time, residents began to protest against the lockdowns, and the governments terminated the lockdown policy without any consideration for a soft landing [12-14]. Many other countries, such as Japan, have not conducted sufficient PCRs, making it difficult to understand the trends of the infection [11]. In some countries, such as Sweden, lockdowns were not implemented and the public was left to make their own decisions [15]. In these countries, the epidemic progressed regardless of the residents’ self-help efforts. Thus, it is important to compare the differences among the effects of these measures.
The technical difficulties of identifying trends in the patient population, which can rapidly increase or decrease, may be responsible for these failures in detecting epidemics. Hence, adaptation to the Susceptible–Infected–Recovered (SIR) model is difficult. It targeted a rather limited number of people, and the period of logarithmic increase was very short, so there is little point in estimating R0 [16]; this would be because viruses that were not originally human viruses gradually acclimatised to humans. Those that become more infectious, repeatedly penetrate defence systems and cause epidemics [17, 18]. When switching hosts, the mutation rate is particularly rapid, and infectivity becomes stronger [19]. Therefore, the most recent Omicron variant, which has persisted for over a year, is highly infectious [20]. Moreover, the parameter R0, which the SIR model originally emphasised, has a lognormal distribution, is mathematically unstable, and requires complicated calculations to be estimated precisely [16]. This makes it difficult to use as an indicator of trends. Therefore, it is more realistic to work with a logarithmic growth rate K, which has a base value of two. This is not only easy to calculate but also suitable as an indicator of the epidemic phase. The changes in K are shown in the following actual data.
SARDS-CoV-2 underwent significant mutation during the pandemic. Therefore, the messenger (mRNA) vaccine, which initially showed great promise, was no longer effective in containing the epidemic and was unlikely to reduce the disease severity effectively. The vaccine design could not keep pace with this mutation.
This study provides a comprehensive analysis of the effectiveness of various government policies in response to the COVID-19 pandemic. By identifying the effective strategies for containing epidemics, this study can help guide policymakers in their decision-making for containing COVID-19 as well as preparing for future pandemics.

2. Materials and Methods

2.1. Data

Data on the number of confirmed cases, deaths, and vaccinations were collected and published by the WHO [1]. However, for Japan, data published by the Ministry of Health, Labour and Welfare (MWLW) of Japan were used [21]. Furthermore, the mortality rate per 100,000 people [22] was used to determine the impact of vaccines on mortality.

2.2. Calculations

The principles of the calculations were described in a previous article [16]. K is calculated from the 7-day difference, K = log2(Cases / Cases-7day) /7, and the mortality rate is calculated from the ratio of the 18-day difference, mortality = Death/ Cases-18day. Each dataset was taken as a 9-day moving average for ease of viewing. Analyses were performed using the free statistical package R [23]. The code and sample data used are available in the Supplement and can be used to reproduce all the figures and results.
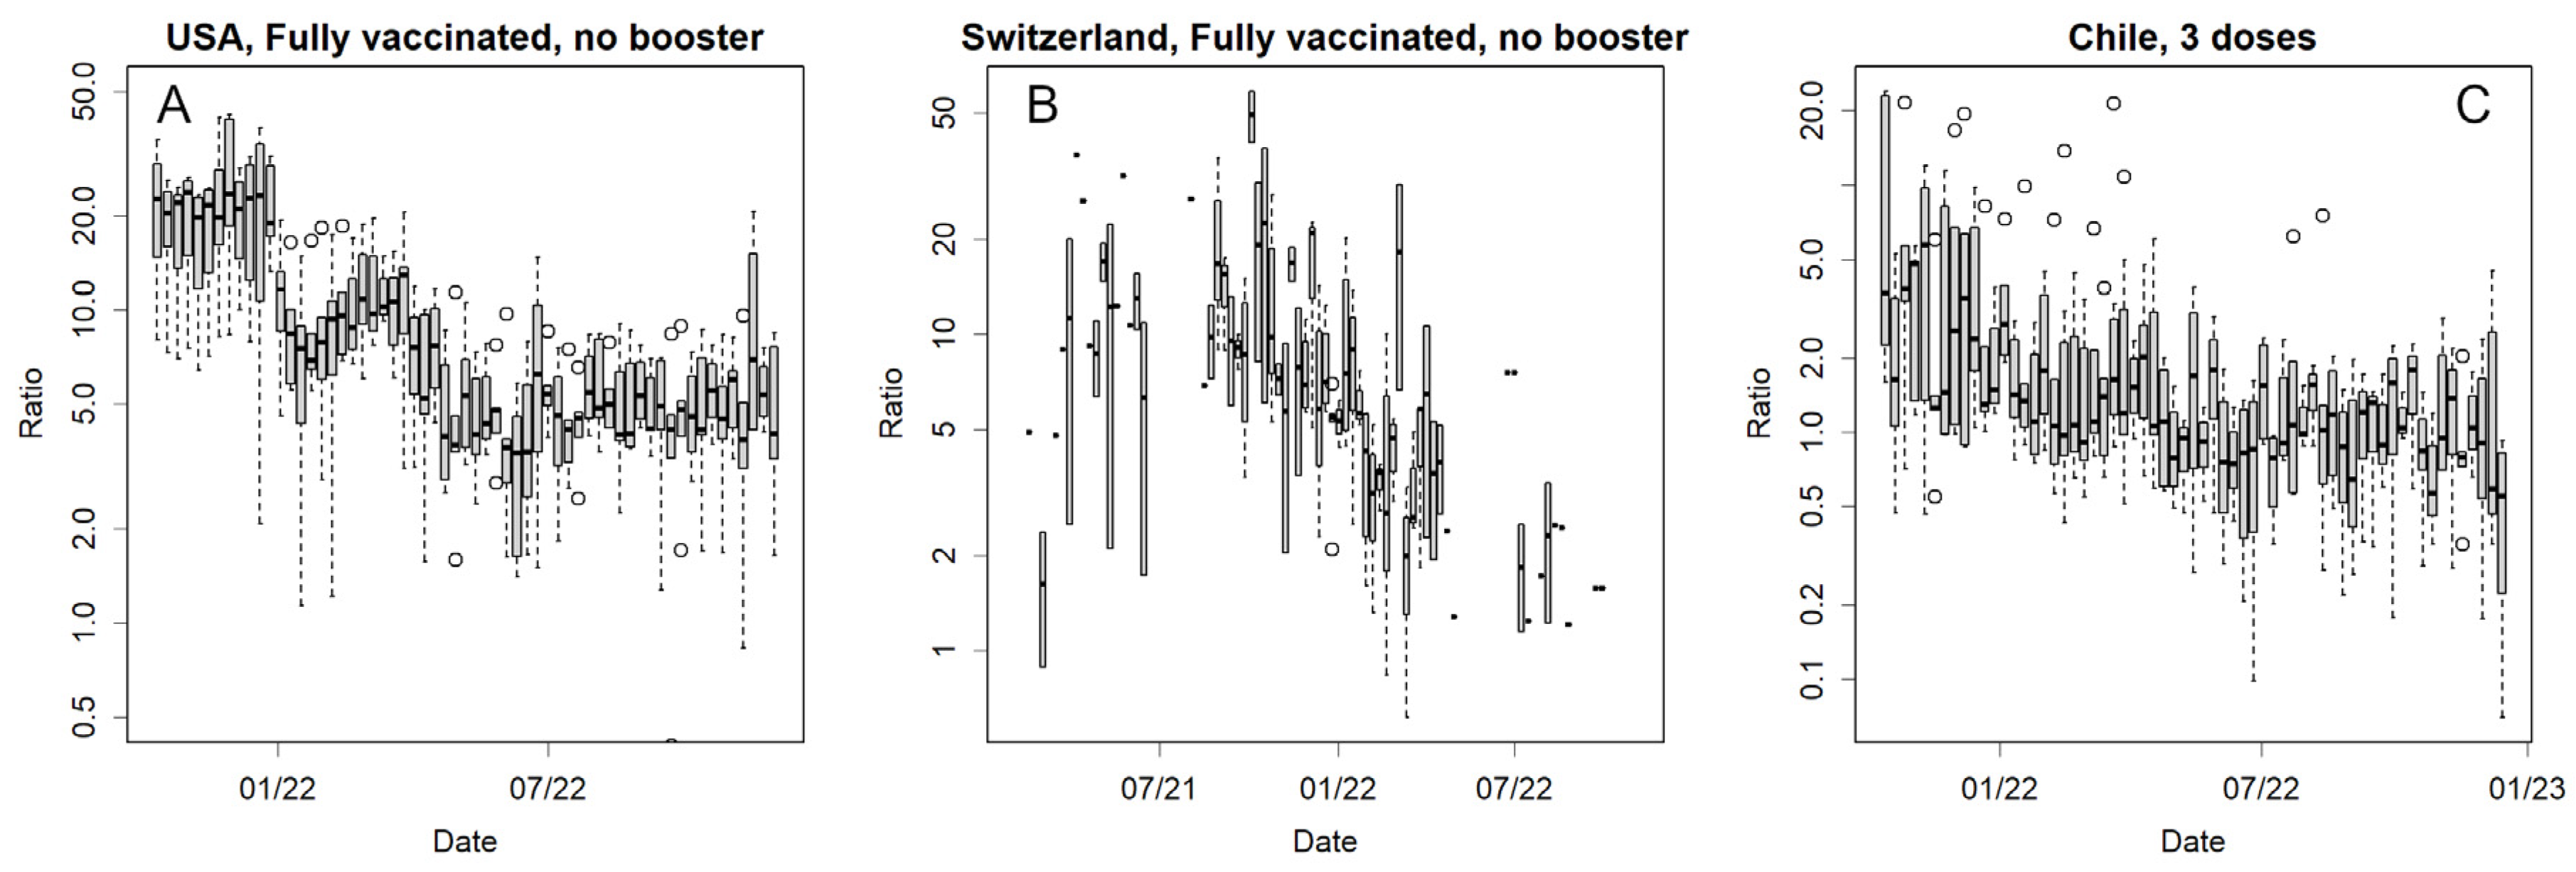
To compare the mortality rates with and without vaccination, mortality ratios were calculated as follows: r = ratiowithout / ratiowith. As the data were collected by age, the ratios were calculated for each age group and displayed in a boxplot. Because mortality rates vary on a logarithmic scale, this ratio is also presented on a logarithmic axis. When one of the ratios was zero, r became incalculable or zero; as the amount of data was insufficient, these were omitted.

3. Results

3.1. Reliability of observations

Before the detailed investigation, a concern has to be recognised; data published by the World Health Organization (WHO) would be a deviation from reality, and the magnitude of this deviation varies enormously from country to country. For example, Japan has a relatively low number of PCR tests [11], which leads to a much lower estimate of the number of positive cases. The actual number of deaths estimated from excess deaths is approximately six times higher than the published figures [6] , and the same may be true for confirmed cases. What about other countries? Many people in the USA, the UK, and Sweden may now be immune. However, reports in these countries were only half of the record for Iceland (Table S1). Concerns exist on testing not being performed properly, especially when the number of infections has been high [24, 25]. Surveillance in these countries should consider the results of near-random sampling, not the whole number. Especially, India and South Africa have even smaller proportions reported, suggesting that perhaps only < 10 % of the population was investigated. Surveillance in these countries probably does not cover a random sample but may be limited to the wealthy. If this is the case, the data cannot be compared to those of other countries. Conversely, Iceland is considered well-inspected [8, 9]. These differences should be considered hereafter.

3.2. Global data as an example.

See Figure 1A for global data illustration on how to look at the figures. Large epidemics occurred in Alpha and Delta, but Omicron, which is thought to have finally acclimatised to humans [20], causing the largest epidemics with three waves in 2022–2023; the second wave involved many countries such as in Oceania, and the third sharp peak wave was mainly in China (Figure S1 S–U).
Figure 1B summarises the mortality rate, that is, the number of deaths compared to confirmed cases; this is the number of deaths divided by the number of people infected 18 days earlier (the average peak delay). This rate has changed on a logarithmic scale from approximately 20 % at the beginning of the pandemic to 2 % in 2021 as medical care responded to the disease. It decreased by an order of magnitude with the Omicron variant outbreak [26], but then increased again and is approximately 0.5 % in 2023. The apparent partial overlap between the decrease in mortality and vaccination coverage was coincidental. In strict terms, no effect was observed until vaccination coverage was close to 100 %, and by the time this reached 120 %; mortality had fallen (Figure 1C, green line). Causality is unlikely to explain this unusual phenomenon. However, the increase in Omicron confirmed cases and the decrease in mortality correlated well (Figure 1C, black line).

3.3. Country responses

Countries' response to COVID-19 vary widely, but can be classified into several categories. Typical examples are as follows.
Countries that took the necessary measures
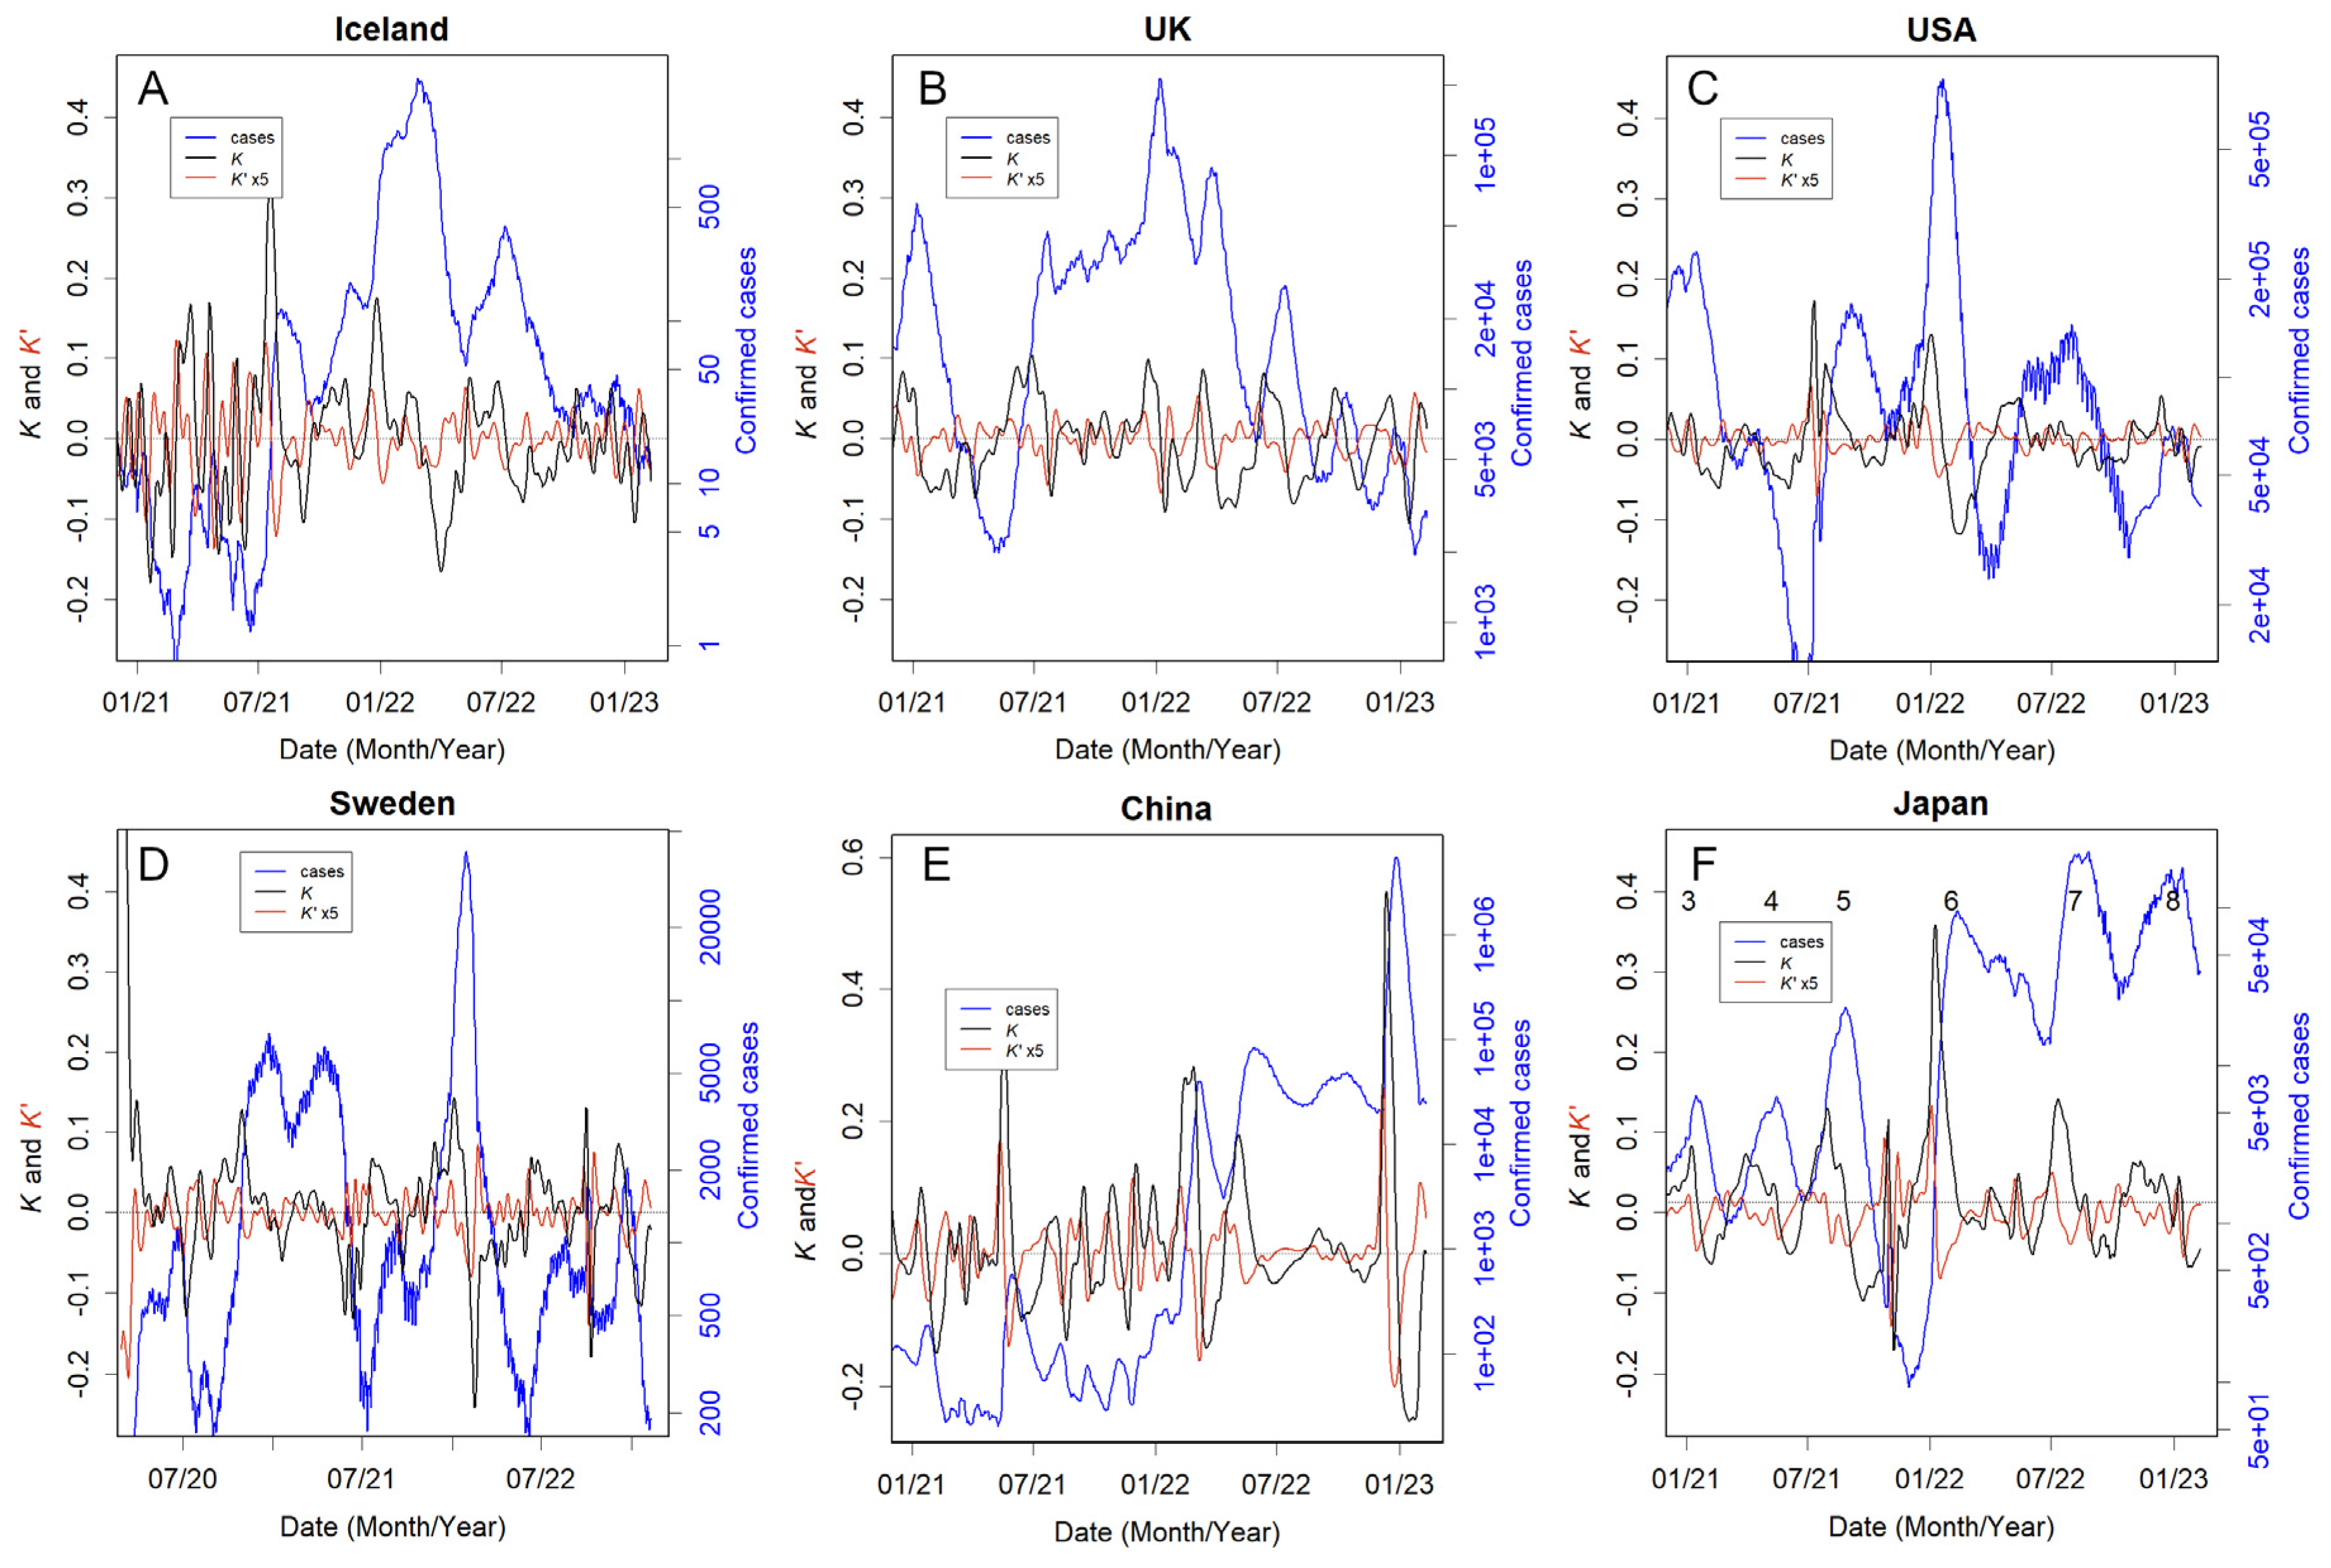
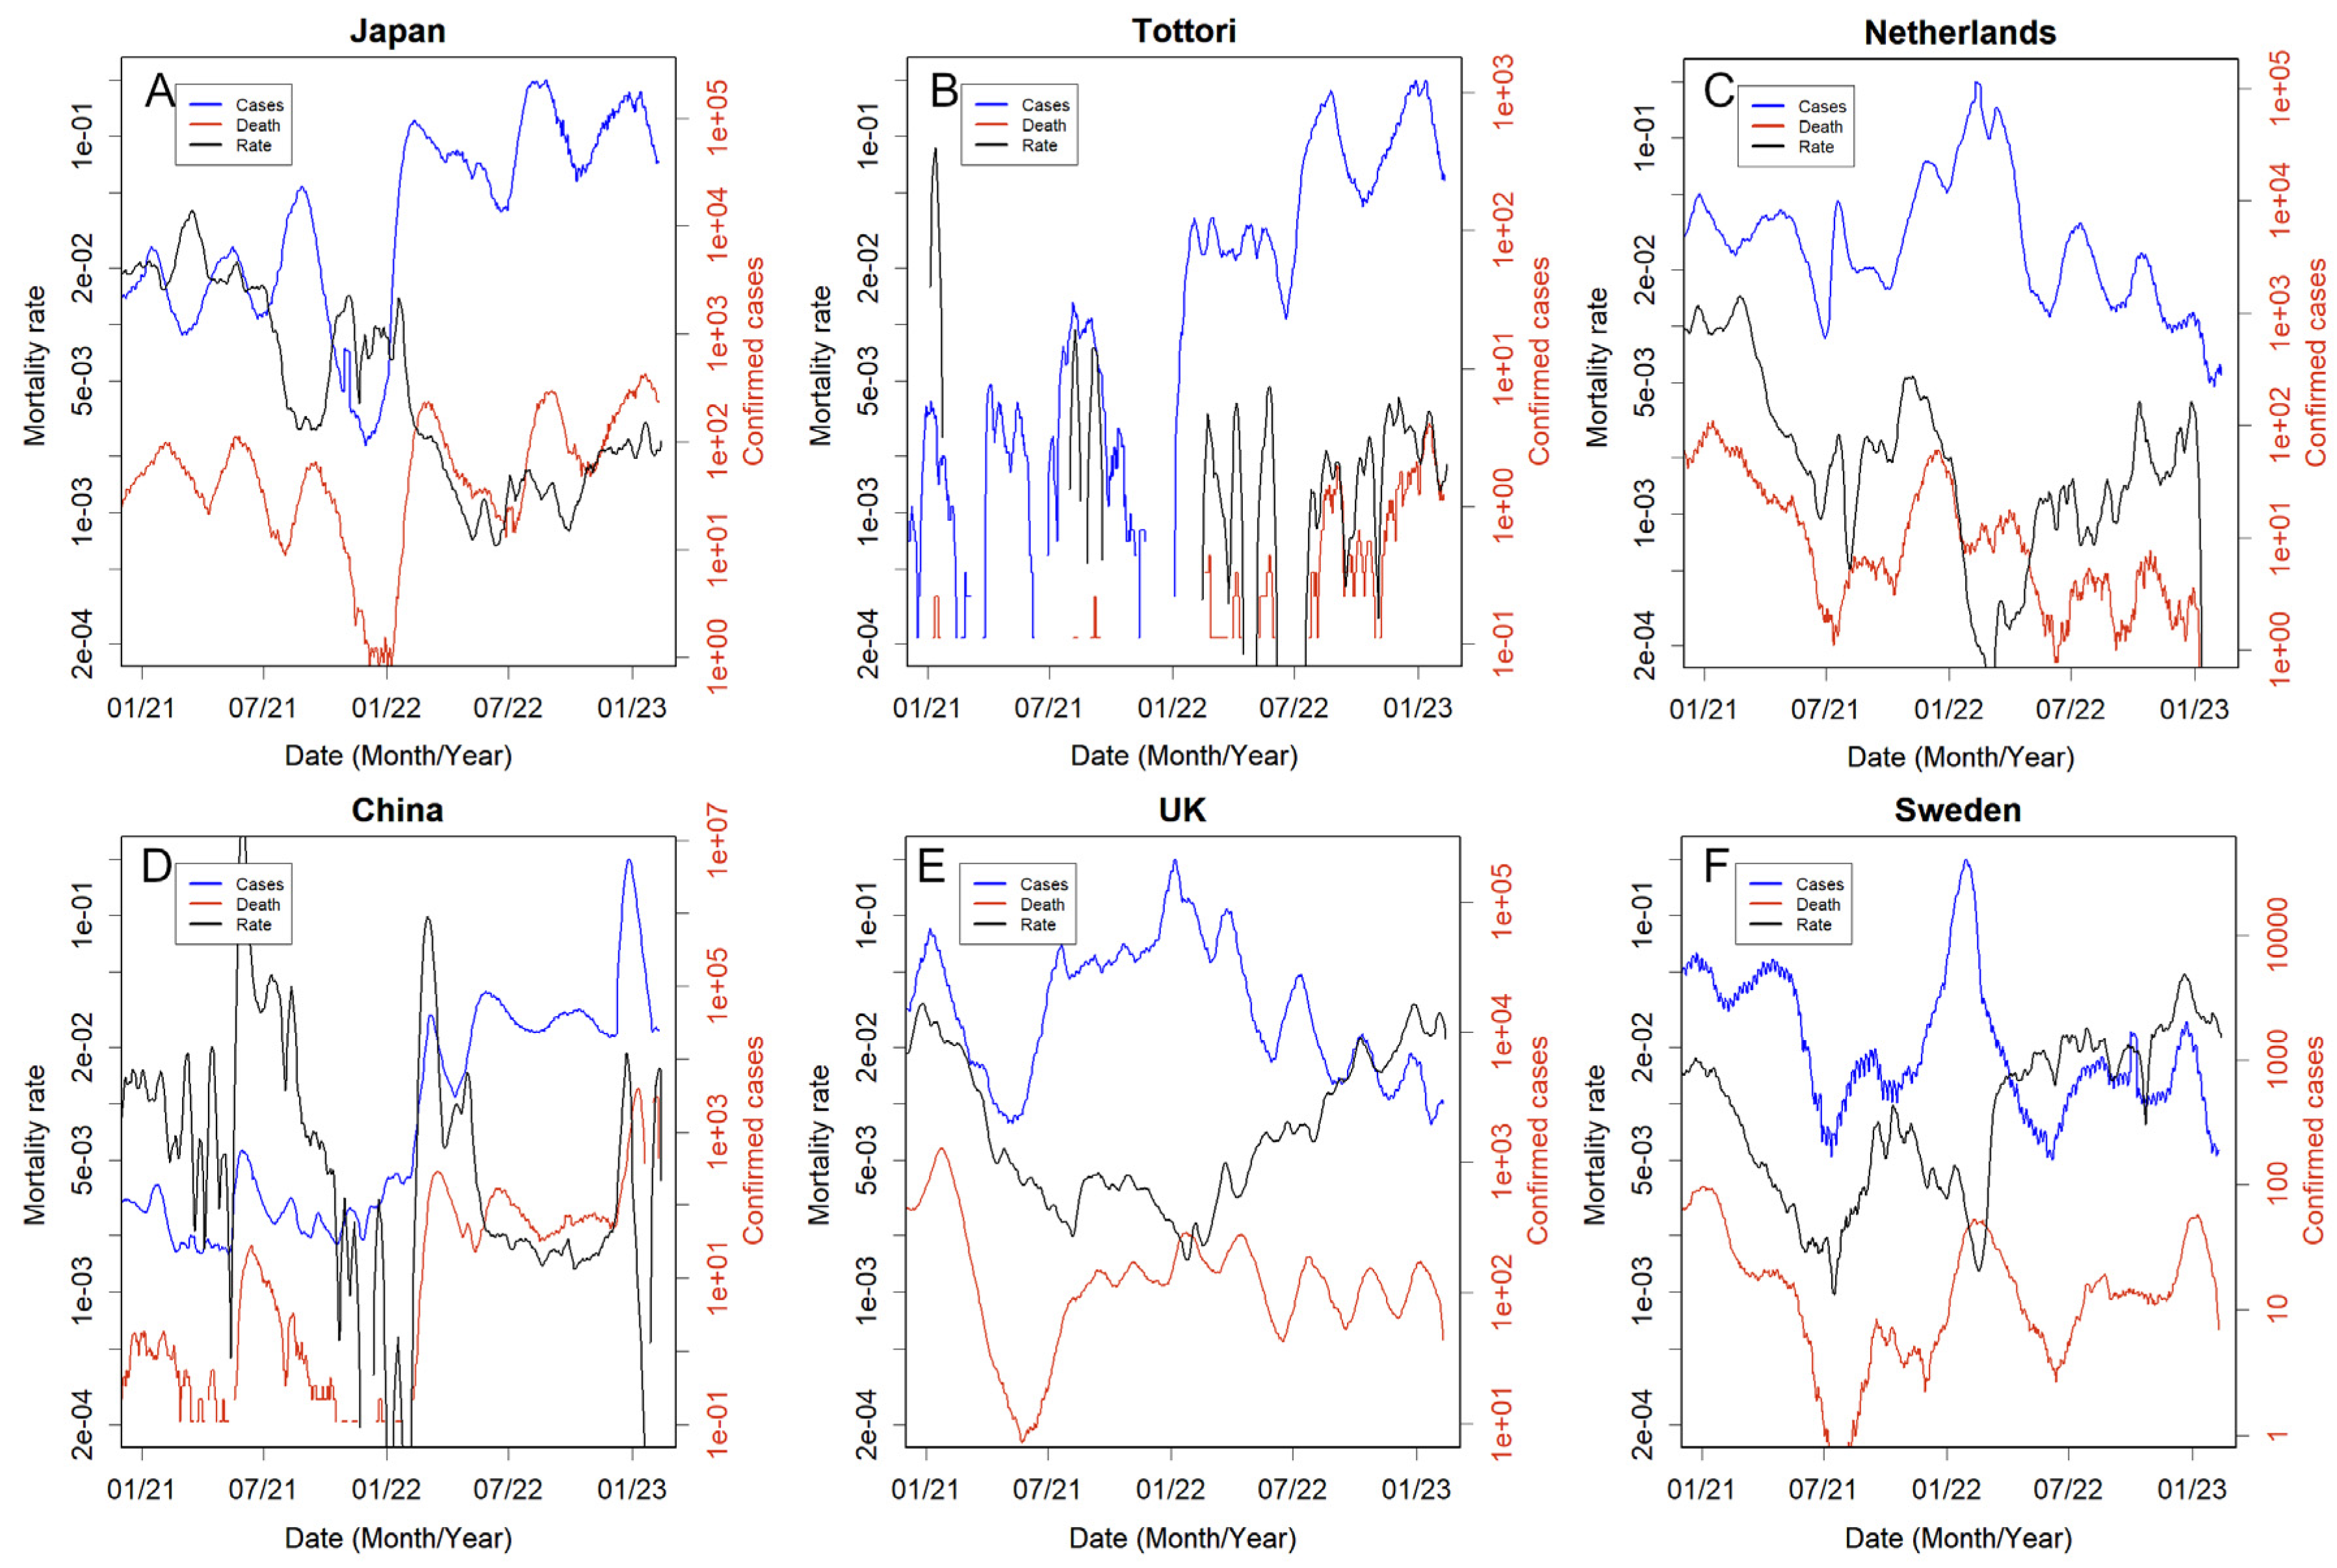
The basic principle of infection control is to prevent the emergence of new spreaders. Because no vaccine was available to reduce new infections (Figure 1B) [26-28], this can only be achieved by isolating spreaders from susceptible populations [29]. This requires testing to determine who is infected and the people with whom they have come in contact with, which, in the case of COVID-19, requires constant PCR testing [25, 30-32]. Facilities are required to treat patients in isolation. The Iceland and Tottori prefectures in Japan are probably the best examples that have been able to implement both practices for a long time (Figure 2A and S1K). Even when K increased in these countries and regions, it converged relatively quickly. This means that the logarithmic increase takes less time, therefore the number of infected people is less likely to increase. Taiwan is undoubtedly another country that continues to adopt this ideal approach [33]. Unlike Iceland and Tottori, which have relatively small populations, Taiwan has a population of over 20 million; therefore, any country should be able to learn from Taiwan [7]. The Netherlands (Figure 3C), Israel, and Switzerland (Figure S2 H and P) would be included in this group. In particular, the low mortality rate in the Netherlands could be largely due to the prevalence of a less lethal variant of mink origin in 2021 [19]. Among the countries analysed, France and Germany performed well. These countries have succeeded in keeping both the number of people infected and death rate low (Figure S2 D and E). The fact that the percentage of infected people is approximately 50 % is evidence of the relatively low level of missed detection (Table S1).

3.4. Countries that could not take the necessary measures or made no attempt to do so

Leaders in the USA and the UK failed to apply scientific knowledge [34, 35]. This led to several continuous outbreaks (Figure 2B and 2C). Sweden became notorious and was criticised for doing nothing from the beginning [15]. However, after the Delta variant outbreak, the infection subsided in Sweden, probably because the public took self-defence measures such as social distancing (Figure 2D). However, the Omicron variant is so infectious hence could overcome this self-defence mechanism; therefore, this has caused a major epidemic. Since the first wave in these countries was so large and many people probably became immune, the second and third waves were smaller, and another major epidemic became unlikely (Figure S3C). Russia is probably part of this group, with high mortality rates remaining throughout the pandemic (Figure S2M).
Incidentally, viral genome sequencing is unrelated to finding and isolating patients, and therefore does not help prevent epidemics. It helps to find new variants, and Omicron was discovered late because it occurred in a country where no such efforts had been made [20]. However, whatever variants arise, the work that must be done, finding and isolating patients, remains unchanged. Indeed, sequence banks are flooded with almost identical the USA and the UK data, but it is unreasonable to go so far with sequencing. Instead, it would be more reasonable to investigate samples from non-sequenced countries. Eventually, new variants arising in these countries will cross borders.

3.5. People defended themselves without recourse to the country

The same was true in Japan, where the leadership took only unscientific, and ad hoc measures [11]. People stopped cooperating with quarantine because the infected people were left alone in hotels without proper medical assistance [36, 37]. This is why people have protected themselves. It has become customary for people to wear masks in public. Therefore, it is assumed that a significant proportion of the Japanese population has never been exposed to this disease; in fact, the results of antibody tests using blood samples from blood donations are only approximately 40% positive. [38]. Three distinct waves characterise the Omicron outbreak; many people are still susceptible and the quarantine system is not rigorous, it can be affected by outbreaks from the neighbouring countries (Figure 2E, 2F). Chile may have had a similar process in that it relied too much on vaccines, but the people protected themselves. Chile succeeded in lowering K between infections, which is probably the result of self-defence (Figure S1C). Perhaps, many people are still not immune (Figure S3E) ([38].

3.6. Countries that relied too heavily on lockdowns

Several countries had strict lockdowns but could not maintain their policies. After the lockdowns were lifted, K immediately increased, and many infected people were detected (Figure 2E, S1A, S1L). The most dramatic rise was in China, where K reached 0.56, a tremendous rate with a doubling time of only 1.8 days, which was the highest ever recorded. However, the exact number is unknown as they have already stopped counting strictly (Figure 2E). Reports suggest that approximately 90 % population has been infected [39-41]. Moreover, there is a significant dissociation from the numbers that can be confirmed from WHO statistical data (Table S1). In addition to lifting lockdown policies, these countries have abandoned checking the exact daily status of the infection [1].

3.7. What difference do the policies make?

Differences in the measures altered the death toll. However, when looking at these data, one needs to consider how well they reflect reality. For example, the data from India and China may be inaccurate (Table S1). The actual number for Japan is thought to be at least six times the reported number [6], which would be 0.3–0.4 % death in the population; the eighth wave (the third wave of Omicron) is even more poorly measured [42, 43], and the figure could be even higher [44]. In the USA, this may be higher [6, 24, 25]. In contrast, Iceland's 0.064 and Tottori’s 0.044 % are probably more reliable.
Mortality rates were not constant but varied on a logarithmic scale (Figure 1B, 3, and S2). This is due to the prevailing variant’s characteristics at that time and the changing burden on medical personnel. This is probably why mortality tends to increase as the epidemic grows. As shown in Figure 3 and Figure S2, the only epidemic in which the mortality rate decreased was during the first Omicron epidemic. The mortality rate has increased in other epidemics; the second and third waves of Omicron increased the mortality rate (Figure 1B). Furthermore, in July-August 2021, when the Tokyo Olympics was being held in Japan, medical resources were taken up by the Olympic Games, resulting in an almost ten-fold increase in mortality rate. (Figure 3A). In contrast, the mortality rate in Tottori remained consistent at approximately 0.1 % (Figure 3B, Table S1). There is a stark contrast, even within the same country [45].
Since quitting the zero-COVID policy, Australia and New Zealand seem to have abandoned the proper counting of patients or death [1, 46]. While the number of patients is huge, the mortality rates are counted low (Figure 3C and 3D, S2L); how is this possible? Unfortunately, a large number of deaths have been reported [47-49]. When the Omicron variant slipped through the strict lockdown and became an epidemic, the mortality rate temporarily increased to 10 %; this reduced incredibly soon and remained at a favourable 0.2 %. However, after the end of the zero-COVID policy, when the death count was last published, it had increased to approximately 5 %; this is a level often seen in medical collapses [16].

3.8. Vaccine Effectiveness

Vaccines are no longer effective in preventing infections (Figure 1B); however, do they still reduce mortality? Few published data are available to compare the mortality rates with and without vaccines worldwide: Japan ([50], the USA, Switzerland, and Chile [22]. Among these countries, Chile predominantly uses the multivalent vaccine (Sinovac Biotech Ltd., China), whereas the remaining use mRNA vaccines. An independent site compiled the data [22] that can be referred to, but neither country is very active in publishing raw data; hence, statistical tests could not be performed. Figure 4 and Figure S4 show the number of deaths as the ratio of vaccinated/unvaccinated individuals in these countries (logarithmic axes). In the USA, Switzerland, and Chile, mortality rates differed largely during the Delta epidemic (Figure 4, S4). The exception was Japan, in which data were published only once during the Delta outbreak (Figure S4A) and showed no significant differences (not shown). With Omicron, smaller differences remained in the USA (Figure S4 B and C); however, this difference was no longer evident in Switzerland (Figure S4D and E), and disappeared in Chile (Figure 4 and S4F-H).

3.9. Convergence of the epidemics

In several countries, a major epidemic has become unlikely, probably because many people are already infected and immune, although this does not mean all people. According to the SIR model, an epidemic will end, leaving certain populations uninfected [16]. This is illustrated in Figure S3, where epidemics are expressed as real numbers rather than logarithms. However, it could be difficult to determine whether an epidemic has run its course based solely on the patient count data. For instance, in India, although the epidemic seemed to have been controlled (Figure S3B), in March 2023, K increased again, and the number of confirmed cases is currently rising (Figure S1G). Whether this is because the new strain has slipped past acquired immunity or because there are still many uninfected individuals remain unclear from these data alone.

4. Discussion

Strict policies such as lockdowns were unsuitable for controlling the pandemic, which would be a long struggle (Figure 3D, S2A, S2L). Furthermore, a soft landing strategy is required to lift strict policy [12]. Isolating infected people can also be achieved through a lockdown; however, this places a heavy burden on the population, and it should be noted that Iceland did not opt for this [8]. Naturally, many citizens will oppose a lockdown, which will put pressure on politicians [51]. The leaders of Australia, New Zealand, and China, who had well-controlled epidemics by strict lockdowns, withdrew their Zero-COVID policy [10, 13, 14]. This led to an epidemic (Figure 3C, 3D, S2A); it is likely that people accustomed to the lockdown had no means of self-defence. Some countries have stopped tracking their number of patients [1]. In contrast, Sweden still does this, so the mortality rate can be inspected; however, other dispirited governments could abandon all that needs to be done. This is another disadvantage of lockdown. The successful experience of containing the infection will lead to neglecting the essential need to establish a method for detecting patients. This not only makes early treatment impossible but also damages infection control after the lifting of the lockdown.
The mRNA vaccine, an entirely new technology [52], has effectively prevented older variants [11]. However, it was ineffective against newer variants such as Delta and Omicron (Figure 1B); such variants have gone through selection pressure of the vaccines and are in vogue. Altering the mRNA sequence was required [53]; in a molecular biology sense, it was supposed to be a simple operation [52], but it took much longer than expected, and the new antigens were not effective. This is probably a task with difficult problems that can only be known by the person concerned, and this should be remembered as it is difficult to keep on changing the vaccine design for changes in viruses. Hence, mRNA vaccines can only be relied upon for a short period, and different policies are required.
mRNA vaccines are expected to reduce the severity of illness and mortality; however, this appears to be largely unrealised [26, 54, 55]. The reduction in mortality rates was probably due to the low lethality of the early Omicron variant [26] and not due to the vaccines (Figure 1C). In some countries, mRNA vaccines up to the Delta variant might have been able to reduce mortality (Figure 4). However, this effect was much weaker for the Omicron variant, although we wanted to obtain more data to confirm this. Especially in the USA, the situation is somewhat unique; there would be a difference in access to healthcare between those who received free and easily available vaccines and those who did not. The latter must include many anti-vaccine people [56], who never trust modern healthcare. It is easy to imagine that delayed medical intervention for infections with the highly virulent Delta variant would increase mortality. This readily presumed difference confounds the epidemiological estimates. Therefore, the results [57] should not be taken for granted. Indeed, at least on a global scale, the Delta variant was in epidemic proportions when vaccination coverage reached 100 %, but mortality was only marginally reduced at this stage (Figure 1C and S2U).
Reducing the number of anti-vax [58] people is also a task for the government. Public trust in the government reduces each time the government implements counterproductive measures, which may lead to growing distrust in healthcare, and the number of anti-vax people will probably increase. Such a situation was observed in Japan. A group of experts, who are supposed to give their opinions to the government (but are rarely listened to), recommend that people stay away from densely populated areas and wear masks; however, the anti-vax people protest these recommendations. They say that they do not need expert opinions and that they should decide for themselves on how to live their lives. Unfortunately, if these individuals are infected, they will spread the virus, and if it is too late, they will die. To avoid an increase in the number of these people, it is essential to inform and educate them closely and not overwhelm them. For the mandatory quarantine of infected people, there must be a legal backing. Of course, it would not make sense to isolate patients without adequate medical treatment. Moreover, continuing to recommend ineffective vaccines will further undermine their confidence.
Why governments have not been proactive in publishing data on mortality and vaccination despite their importance to public health is unnatural and questionable. If vaccines really reduced mortality, the greatest publicity for vaccination would come from these data. In Japan, despite the government's aggressive promotion [59], there is now a surplus of mRNA vaccines that are being discarded [60]. If the effect of the reduction in mortality has already been lost, this would be an inconvenient truth for the government, which has been requested to explain the huge unaccounted budgets [59-62]. Vaccines have lost their efficacy in preventing epidemics (Figure 1B). If vaccines do not reduce mortality, then there are no benefits left but only risks [63-65] in present vaccinations.
It should also be noted that infectivity increases even during a pandemic (Figure 1A). This reduces the validity of effective measures in the early days, such as distancing, masking, vaccination, and lockdown. The first SARS-CoV-2 in this epidemic was not a human virus; rather, it could have been a bat virus that had been maintained in Vero cells and had become infectious to primates. In the process of human-human infections, the virus rapidly mutates to acclimate to humans in several directions [17, 18], one of which is Omicron [20], the variant with the highest infectivity. This variant reduced the mortality rate, but this was coincidental because the virus was originally asymptomatic in many people; hence, weakening the virus is not subject to selective pressure. We should not always count on such good fortune. If the next pandemic were influenza H5N1, for example, it would be a mutant that could infect mammals, pass through an intermediate host, such as a pig, and then infect humans [66]. In this case, the virus changes rapidly among humans [19], altering its epitopes and increasing its infectivity. However, if we can converge in the initial stage, we can avoid a pandemic before it occurs. This is the only stage in which a lockdown should be implemented. Therefore, a system that can quickly identify and alert the public about new infectious diseases is required.
The epidemic has subsided in some countries (Figure 2 and S3). SARS-CoV2 has several conserved open reading frame (ORF)s [17, 20]; this is a major difference from influenza, where all ORFs mutate at equal rates [67]. Presumably, SARS-CoV2 cannot repeat reinfection, such as influenza, over the decades. As people become less immune, what is needed would be multivalent vaccines, especially ones that can be used by developing countries [19, 20].
Data on daily changes in confirmed cases are important for fully ending the epidemic. As the number of infected individuals has declined, several countries have stopped reporting daily data [1]. In the USA, for example, data are reported only once a week; in Australia and New Zealand, this has become even more irregular. This is a serious public health problem because an accurate K cannot be estimated without data. This causes not only the rapid increase but the decrease is unmonitored to maintain the decreasing state. According to the SIR model, the number of patients decrease exponentially [16]. However, this phenomenon was not observed in these countries. Although the numbers are declining, small epidemics still recur, resulting in patient numbers ranging from tens to several thousand (Figure 2B, 2C, S1A, and S1L). The exponential decrease is fast at the beginning, but becomes increasingly slower. Complete convergence is difficult to achieve if the government cannot maintain the motivation to keep the K low. While we would like to see the development of effective vaccines and certain drugs, the government should not depend on them, but do what needs to be done first. The only way to ultimately end this problem is to continue identifying and isolating patients, a task that should be the government's responsibility.
The inability to contain causes problems, because the remaining patients include a larger proportion of vulnerable people. They could be those with underlying diseases who have carefully avoided infection, and those who fail to acquire immunity and become infected repeatedly. This was also likely to occur in individuals who had been vaccinated many times [68]. Therefore, they are more likely to be critically ill [69]. This disease can cause systemic symptoms [70] and long-lasting sequelae [2-5, 71] in more than 10 % people, and this rate is likely to become more dismal in the future as the proportion of vulnerable people increases. The UK and Sweden may not have enough patients to cause a medical collapse now; however, their mortality rates have remained high, approximately 2 % (Figure 3E, 3F). Even in the USA, where there may be a wider choice of medical care, the mortality rate is 1 % (Figure S2R), which was quite high compared to the global data (Figure 1B). There is no other way to save vulnerable people but to bring the COVID-19 epidemic to a complete halt.
Many countries have estimated the COVID-19 pandemic to be smaller than reality, albeit to varying degrees (Table S1). It is likely that the detections were not performed on time, which is a failure in terms of testing and isolation. Although the survey was probably closer to random sampling, there was a crucial difference in that the sample size was unknown. Therefore, the total number of patients and deaths is not necessarily known. In particular, most African countries probably do not investigate or respond to cases of infection; therefore, the number of reported cases in Africa is so low [1]. These can only be estimated in some way. A promising method is the estimation of excess deaths [6, 47-49]. However, this estimation is disputed; indeed, there is no evidence that the deceased were COVID-19 patients. For example, a stroke victim may have died because they did not receive timely medical care. However, that person would probably have been saved during regular times, and this could be considered a death caused by the COVID-19 pandemic.
The damage is an order of magnitude greater if we do not have a leader who pays proper attention to public health or at least takes expert opinion (Table S1) [34, 35, 45]. This can be seen from the ten-fold increase in mortality rates in Japan, where many healthcare resources were allocated to host the Olympic games (Figure 3A). This does not depend on the country’s principles. There should be a system through which the scientific community can adequately advise the government. However, in Japan, this system does not work satisfactorily. In January 2023, Japan had over 10,000 recorded deaths, which should be times higher [6, 44]. Nevertheless, the government has made a cabinet decision to exempt COVID-19 patients from quarantine and is campaigning for people to stop wearing masks [72-74]. In addition to limiting the number of PCR tests, the government abandoned counting cases, stating that it would announce the number of deaths after two months [75], thus hiding the issues from the people. Additionally, they are still pushing forward with mRNA vaccination [59]. How unscientific these are is beyond dispute [63-65, 68, 76-78]; these unscientific policies will definitely affect many patients, including vulnerable ones. Clearly, the government does not want to take responsibility for public health. One of the desired roles of experts is to examine the policies and appeal to voters so that they do not elect inappropriate leaders. The removal of unscientific politicians should probably be the immediate measure undertaken for managing public health effectively.

5. Conclusions

Large epidemics must be avoided because they lead to a shortage of medical resources, which can cause further damage. K should be monitored daily to detect and properly control an outbreak. K increases with the epidemic; however, reducing it as quickly as possible prevents the epidemic from becoming large. The most important step is to identify and isolate the patients. Despite many efforts, it will take a long time before a vaccine or specific drug is created; therefore, we should not place too much hope on these measures. Government officials should take appropriate action to complete these tasks without significantly burdening citizens. Scientists should provide appropriate advice on policies that must be respected.

Supplementary Materials

The following supporting information can be downloaded at Figshare: https://doi.org/10.6084/m9.figshare.24197481

Funding

This research received no external funding.

Data Availability Statement

All the data is available from [1]. The R-code used is available from the supplement.

Acknowledgments

The authors would like to thank Editage (www.editage.com) for English language editing.

Conflicts of Interest

The authors declare no conflict of interest.

References

  1. WHO. WHO Coronavirus (COVID-19) Dashboard 2023. Available from: https://covid19.who.int/data.
  2. Davis HE, McCorkell L, Vogel JM, Topol EJ. Long COVID: major findings, mechanisms and recommendations. Nature Reviews Microbiology. 2023. [CrossRef]
  3. Subramanian A, Nirantharakumar K, Hughes S, Myles P, Williams T, Gokhale KM, et al. Symptoms and risk factors for long COVID in non-hospitalized adults. Nature Medicine. 2022;28(8):1706-14. [CrossRef]
  4. Bach, K. New data shows long Covid is keeping as many as 4 million people out of work 2023. Available from: https://www.brookings.edu/research/new-data-shows-long-covid-is-keeping-as-many-as-4-million-people-out-of-work/.
  5. Belluck, P. Long Covid Is Keeping Significant Numbers of People Out of Work, Study Finds 2023. Available from: https://www.nytimes.com/2023/01/24/health/long-covid-work.html.
  6. COVID-19 Excess Mortality Collaborators. Estimating excess mortality due to the COVID-19 pandemic: a systematic analysis of COVID-19-related mortality, 2020-21. Lancet. 2022;399(10334):1513-36. Epub 20220310. doi: 10.1016/s0140-6736(21)02796-3. PubMed PMID: 35279232; PubMed Central PMCID: PMCPMC8912932.
  7. Hale, E. How Taiwan used simple tech to help contain Covid-19 2022. Available from: https://www.bbc.com/news/business-60461732.
  8. Kolbert, E. How Iceland beat the coronavirus 2021. Available from: https://www.newyorker.com/magazine/2020/06/08/how-iceland-beat-the-coronavirus.
  9. Mackenzie, J. How Iceland clamped down to conquer coronavirus 2021. Available from: https://www.bbc.com/news/world-europe-56412790.
  10. Aljazeera. WHO says China’s zero-COVID strategy unsustainable 2022. Available from: https://www.aljazeera.com/news/2022/5/10/who-says-chinas-zero-covid-strategy-unsustainable.
  11. Konishi T. Effect of control measures on the pattern of COVID-19 Epidemics in Japan. . PeerJ. 2021;9:e12215. [CrossRef]
  12. Cowling B. The impact of ending ‘zero COVID’ in China. Nature. 2023 05 January 2023. https://www.nature.com/articles/d41591-023-00001-1.
  13. Deutsche Welle. Coronavirus: New Zealand abandons 'zero-COVID' strategy 2021. Available from: https://www.dw.com/en/coronavirus-digest-new-zealand-drops-zero-covid-strategy/a-59396717.
  14. BBC. Why has Australia switched tack on Covid zero? 2021. Available from: https://www.bbc.com/news/world-australia-58406526.
  15. Frans, E. Did sweden’s controversial covid strategy pay off? In many ways it did – but it let the elderly down: The Conversation; 2022. Available from: https://theconversation.com/did-swedens-controversial-covid-strategy-pay-off-in-many-ways-it-did-but-it-let-the-elderly-down-188338.
  16. Konishi, T. COVID-19 Epidemics Monitored Through the Logarithmic Growth Rate and SIR Model. J Clin Immunol Microbiol. 2022;3(3):1-45. [CrossRef]
  17. Konishi, T. Progressing adaptation of SARS-CoV-2 to humans. Chem-Bio Informatics Journal. 2022;22:1-12. [CrossRef]
  18. Konishi T. Continuous mutation of SARS-CoV-2 during migration via three routes at the beginning of the pandemic. . PeerJ 2022;10:e12681. [CrossRef]
  19. Konishi, T. SARS-CoV-2 mutations among minks show reduced lethality and infectivity to humans. PLoS ONE. 2021;16:e0247626. [CrossRef]
  20. Konishi, T. Mutations in SARS-CoV-2 are on the increase against the acquired immunity. PLoS ONE. 2022;17:e0271305. [CrossRef]
  21. MWLW, Japan. New corona vaccination results 2023. Available from: https://www.mhlw.go.jp/stf/seisakunitsuite/bunya/vaccine_sesshujisseki.html.
  22. Our World in Data. How do death rates from COVID-19 differ between people who are vaccinated and those who are not? 2021. Available from: https://ourworldindata.org/covid-deaths-by-vaccination.
  23. R Core Team. R: A language and environment for statistical computing. Vienna, Austria: R Foundation for Statistical Computing; 2020.
  24. Qasmieh SA, Robertson MM, Teasdale CA, Kulkarni SG, Jones HE, McNairy M, et al. The prevalence of SARS-CoV-2 infection and long COVID in US adults during the BA.4/BA.5 surge, June–July 2022. Preventive Medicine. 2023:107461. [CrossRef]
  25. Park S, Marcus GM, Olgin JE, Carton T, Hamad R, Pletcher MJ, et al. Unreported SARS-CoV-2 Home Testing and Test Positivity. JAMA Network Open. 2023;6(1):e2252684-e. [CrossRef]
  26. Stowe J, Andrews N, Kirsebom F, Ramsay M, Bernal JL. Effectiveness of COVID-19 vaccines against Omicron and Delta hospitalisation, a test negative case-control study. Nature Communications. 2022;13(1):5736. [CrossRef]
  27. Kuhlmann C, Mayer CK, Claassen M, Maponga T, Burgers WA, Keeton R, et al. Breakthrough infections with SARS-CoV-2 omicron despite mRNA vaccine booster dose. The Lancet. 2022. [CrossRef]
  28. Staff, T. Israeli trial, world’s first, finds 4th dose ‘not good enough’ against Omicron: The Times of Israel; 2022. Available from: https://www.timesofisrael.com/israeli-trial-worlds-first-finds-4th-dose-not-good-enough-against-omicron/.
  29. Centers for Disease Control and Prevention. Transmission-Based Precautions 2023. Available from: https://www.cdc.gov/infectioncontrol/basics/transmission-based-precautions.html.
  30. Chu VT, Schwartz NG, Donnelly MAP, Chuey MR, Soto R, Yousaf AR, et al. Comparison of Home Antigen Testing With RT-PCR and Viral Culture During the Course of SARS-CoV-2 Infection. JAMA Internal Medicine. 2022;182(7):701-9. [CrossRef]
  31. Wakita M, Idei M, Saito K, Horiuchi Y, Yamatani K, Ishikawa S, et al. Comparison of the clinical performance and usefulness of five SARS-CoV-2 antibody tests. PLoS ONE. 2021;16:e0246536.
  32. Yamamoto M, Okazaki K, Kitai Y, Shinohara K, Yukawa S, Noguchi T, et al. Comparison of six antibody assays and two combination assays for COVID-19. Virology Journal. 2022;19(1):24. [CrossRef]
  33. Medicine JHU. Taiwan 2023. Available from: https://coronavirus.jhu.edu/region/taiwan.
  34. Parker CF, Stern EK. The Trump Administration and the COVID-19 crisis: Exploring the warning-response problems and missed opportunities of a public health emergency. Public Adm. 2022. Epub 20220329. doi: 10.1111/padm.12843. PubMed PMID: 35601345; PubMed Central PMCID: PMCPMC9115435.
  35. Head, M. Boris Johnson’s pandemic legacy – where he went wrong managing COVID (and some things he got right) 2022. Available from: https://theconversation.com/boris-johnsons-pandemic-legacy-where-he-went-wrong-managing-covid-and-some-things-he-got-right-189666.
  36. Hamada K, Miki I. Hotel patients in COVID-19 complain of a harsh and anxious life under house arrest: "If my condition suddenly changes here, I'm afraid I won't survive." 2020. Available from: https://www.businessinsider.jp/post-211965.
  37. Takata, N. East Japan pref. to pay over $50K to family of COVID-19 patient found dead after systemic flaw 2021. Available from: https://mainichi.jp/english/articles/20210907/p2a/00m/0na/005000c.
  38. MWLW, Japan. A survey of the actual antibody retention rate of novel coronavirus using residual blood samples for testing at the time of blood donation. 2023. Available from: https://www.mhlw.go.jp/content/10906000/001070846.pdf.
  39. CNBC. China says Covid outbreak has infected 80% of population 2023. Available from: https://www.cnbc.com/2023/01/21/china-says-covid-outbreak-has-infected-80percent-of-population.html.
  40. Yong, N. China Covid: More than 88 million people in Henan infected, official says: BBC; 2023. Available from: https://www.bbc.com/news/world-asia-china-64208127.
  41. The Guardian. 90% of people in China province infected with Covid, says local health official: Guardian; 2023. Available from: https://www.theguardian.com/world/2023/jan/09/life-is-moving-forward-china-enters-new-phase-in-covid-fight-as-borders-open.
  42. NHK. Corona What will change with the all-knowing review? 2022. Available from: https://www.nhk.or.jp/shutoken/newsup/20220825b.html.
  43. Murata, T. High Death Toll in 8th Wave "Caused by More Infections than Reported" Volunteer Expert Analysis 2023. Available from: https://mainichi.jp/articles/20230222/k00/00m/040/380000c.
  44. MWLW, Japan. Preliminary Vital Statistics January 2023 2023 [cited 2023 26 Mar]. Available from: https://www.mhlw.go.jp/toukei/saikin/hw/jinkou/geppo/s2023/dl/202301.pdf.
  45. Yomiuri Shinbun. Corona deaths somehow the most in Osaka, 3 factors compared to Tokyo...Prefectures continue to be at the mercy of mutant stocks. 2023. Available from: https://www.yomiuri.co.jp/national/20220904-OYT1T50064/.
  46. 1 News. Australia amassed nearly 20,000 more deaths last year than expected, and experts say Covid-19 is largely to blame. 2023. Available from: https://www.1news.co.nz/2023/03/06/experts-blame-covid-after-nearly-20000-extra-australian-deaths/.
  47. The Guardian. Covid temporarily reduced Australia’s average life expectancy and lifted death rates to historic highs 2023. Available from: https://www.theguardian.com/australia-news/2023/jan/06/covid-reduced-australias-average-life-expectancy-and-lifted-death-rates-to-historic-highs.
  48. Pandemic. Excess severity in Australia and New Zealand 2023. Available from: https://pandem-ic.com/excess-severity-in-australia-and-new-zealand/.
  49. Clark-Dow, E. Deaths in New Zealand up by 10% in 2022, impacted by Covid-19 2023. Available from: https://www.stuff.co.nz/national/health/300811491/deaths-in-new-zealand-up-by-10-in-2022-impacted-by-covid19.
  50. MWLW, Japan. Number of positive cases and deaths from novel coronavirus infection by age group - also examining vaccination by age group - (July 2021) 2021. Available from: https://www.mhlw.go.jp/content/10900000/000826597.pdf.
  51. Human Rights Watch. China: Free ‘White Paper’ Protesters 2023. Available from: https://www.hrw.org/news/2023/01/26/china-free-white-paper-protesters.
  52. Chaudhary N, Weissman D, Whitehead KA. mRNA vaccines for infectious diseases: principles, delivery and clinical translation. Nature Reviews Drug Discovery. 2021;20(11):817-38. [CrossRef]
  53. WHO. Interim Statement on COVID-19 vaccines in the context of the circulation of the Omicron SARS-CoV-2 Variant from the WHO Technical Advisory Group on COVID-19 Vaccine Composition (TAG-CO-VAC). 2022.
  54. Wisnivesky JP, Govindarajulu U, Bagiella E, Goswami R, Kale M, Campbell KN, et al. Association of Vaccination with the Persistence of Post-COVID Symptoms. Journal of General Internal Medicine. 2022;37(7):1748-53. [CrossRef]
  55. Reardon, S. Long COVID risk falls only slightly after vaccination, huge study shows. Natue. 2022. [CrossRef] [PubMed]
  56. Roberts HA, Clark DA, Kalina C, Sherman C, Brislin S, Heitzeg MM, et al. To vax or not to vax: Predictors of anti-vax attitudes and COVID-19 vaccine hesitancy prior to widespread vaccine availability. PLoS ONE 2022;17(2):e0264019. [CrossRef]
  57. Jonson AG, Linde L. & Ali AR, et al. COVID-19 Incidence and Mortality Among Unvaccinated and Vaccinated Persons Aged ≥12 Years by Receipt of Bivalent Booster Doses and Time Since Vaccination. MMWR Morb Mortal Wkly Rep. 2023;72:145–52. [CrossRef]
  58. Hotez, PJ. Will anti-vaccine activism in the USA reverse global goals? Nature Reviews Immunology. 2022;22(9):525-6. [CrossRef]
  59. Nikkei Shinbun. Corona Vaccinations for the Elderly to Begin in May, Ministry of Health, Labor, and Welfare Japan 2023. Available from: https://www.nikkei.com/article/DGXZQOUA221560S3A220C2000000/.
  60. NHK. Why? New COVID-19 vaccines expired and discarded one after another 2023. Available from: https://www3.nhk.or.jp/news/html/20220428/k10013603311000.html.
  61. Nikkei Shinbun. Corona reserve fund of 12 trillion yen, 90% of the use of which cannot be tracked. Transparency is an issue. 2022. Available from: https://www.nikkei.com/article/DGXZQOUA143WV0U2A410C2000000/.
  62. J-cast news. Corona budget of 16 trillion yen is a suspicious destination. Huge facilities are not used, and benefit fraud is frequent. 2022. Available from: https://www.j-cast.com/trend/2022/05/31438429.html?p=all.
  63. Zhou P, Shi Z-L. SARS-CoV-2 spillover events. Science. 2021;371(6525):120-2. [CrossRef]
  64. Hyogo Medical Practitioners Association. The State's New COVID-19 Response Filled with Scientific Neglect 2022. Available from: http://www.hhk.jp/hyogo-hokeni-shinbun/backnumber/2022/1015/100002.php.
  65. Fraiman J, Erviti J, Jones M, Greenland S, Whelan P, Kaplan RM, et al. Serious adverse events of special interest following mRNA COVID-19 vaccination in randomized trials in adults. Vaccine. 2022;40(40):5798- 805. Epub 20220831. doi: 10.1016/j.vaccine.2022.08.036. PubMed PMID: 36055877; PubMed Central PMCID: PMCPMC9428332.
  66. Imai M, Watanabe T, Hatta M, Das SC, Ozawa M, Shinya K, et al. Experimental adaptation of an influenza H5 HA confers respiratory droplet transmission to a reassortant H5 HA/H1N1 virus in ferrets. Nature. 2012;486(7403):420-8. [CrossRef]
  67. Konishi, T. Re-evaluation of the evolution of influenza H1 viruses using direct PCA. Scientific Reports. 2019;9(1):19287. [CrossRef]
  68. Irrgang P, Gerling J, Kocher K, Lapuente D, Steininger P, Habenicht K, et al. Class switch toward noninflammatory, spike-specific IgG4 antibodies after repeated SARS-CoV-2 mRNA vaccination. Science Immunology. 2023;8(79):eade2798. [CrossRef]
  69. Bowe B, Xie Y, Al-Aly Z. Acute and postacute sequelae associated with SARS-CoV-2 reinfection. Nature Medicine. 2022;28(11):2398-405. [CrossRef]
  70. Normandin E, Rudy M, Barkas N, Schaffner SF, Levine Z, Padera RF, et al. High-depth sequencing characterization of viral dynamics across tissues in fatal COVID-19 reveals compartmentalized infection. Nature Communications. 2023;14(1):574. [CrossRef]
  71. Sumi T, Harada K. Immune response to SARS-CoV-2 in severe disease and long COVID-19. iScience. 2022;25(8):104723. [CrossRef]
  72. Shinbun, T. The Division over Masks? The government says it's a personal decision...but can it be removed in Japan, a society of peer pressure? 2023. Available from: https://www.tokyo-np.co.jp/article/228322.
  73. TBS. Behind Prime Minister Kishida's Decision to "No Masks by G7": TBS; 2023. Available from: https://newsdig.tbs.co.jp/articles/-/299633?display=1.
  74. MHLW, Japan. Wearing a mask is based on personal discretion 2023. Available from: https://www.mhlw.go.jp/content/001056979.pdf.
  75. Mainichi Shinbun. Death toll to be announced in 2 months at the earliest, MHLW due to transition of COVID-19 to category 5. 2023. Available from: https://mainichi.jp/articles/20230326/ddm/001/040/122000c.
  76. Ollila H, Partinen M, Koskela J, Borghi J, Savolainen R, Rotkirch A, et al. Face masks to prevent transmission of respiratory infections: Systematic review and meta-analysis of randomized controlled trials on face mask use. PLoS ONE 2022;17(12):e0271517. [CrossRef]
  77. Howard J, Huang A, Li Z, Tufekci Z, Zdimal V, Westhuizen H-Mvd, et al. An evidence review of face masks against COVID-19. PNAS. 2021;118 (Perspective):e2014564118.
  78. Li H, Yuan K, Sun Y-K, Zheng Y-B, Xu Y-Y, Su S-Z, et al. Efficacy and practice of facemask use in general population: a systematic review and meta-analysis. Translational Psychiatry. 2022;12(1):49. [CrossRef]
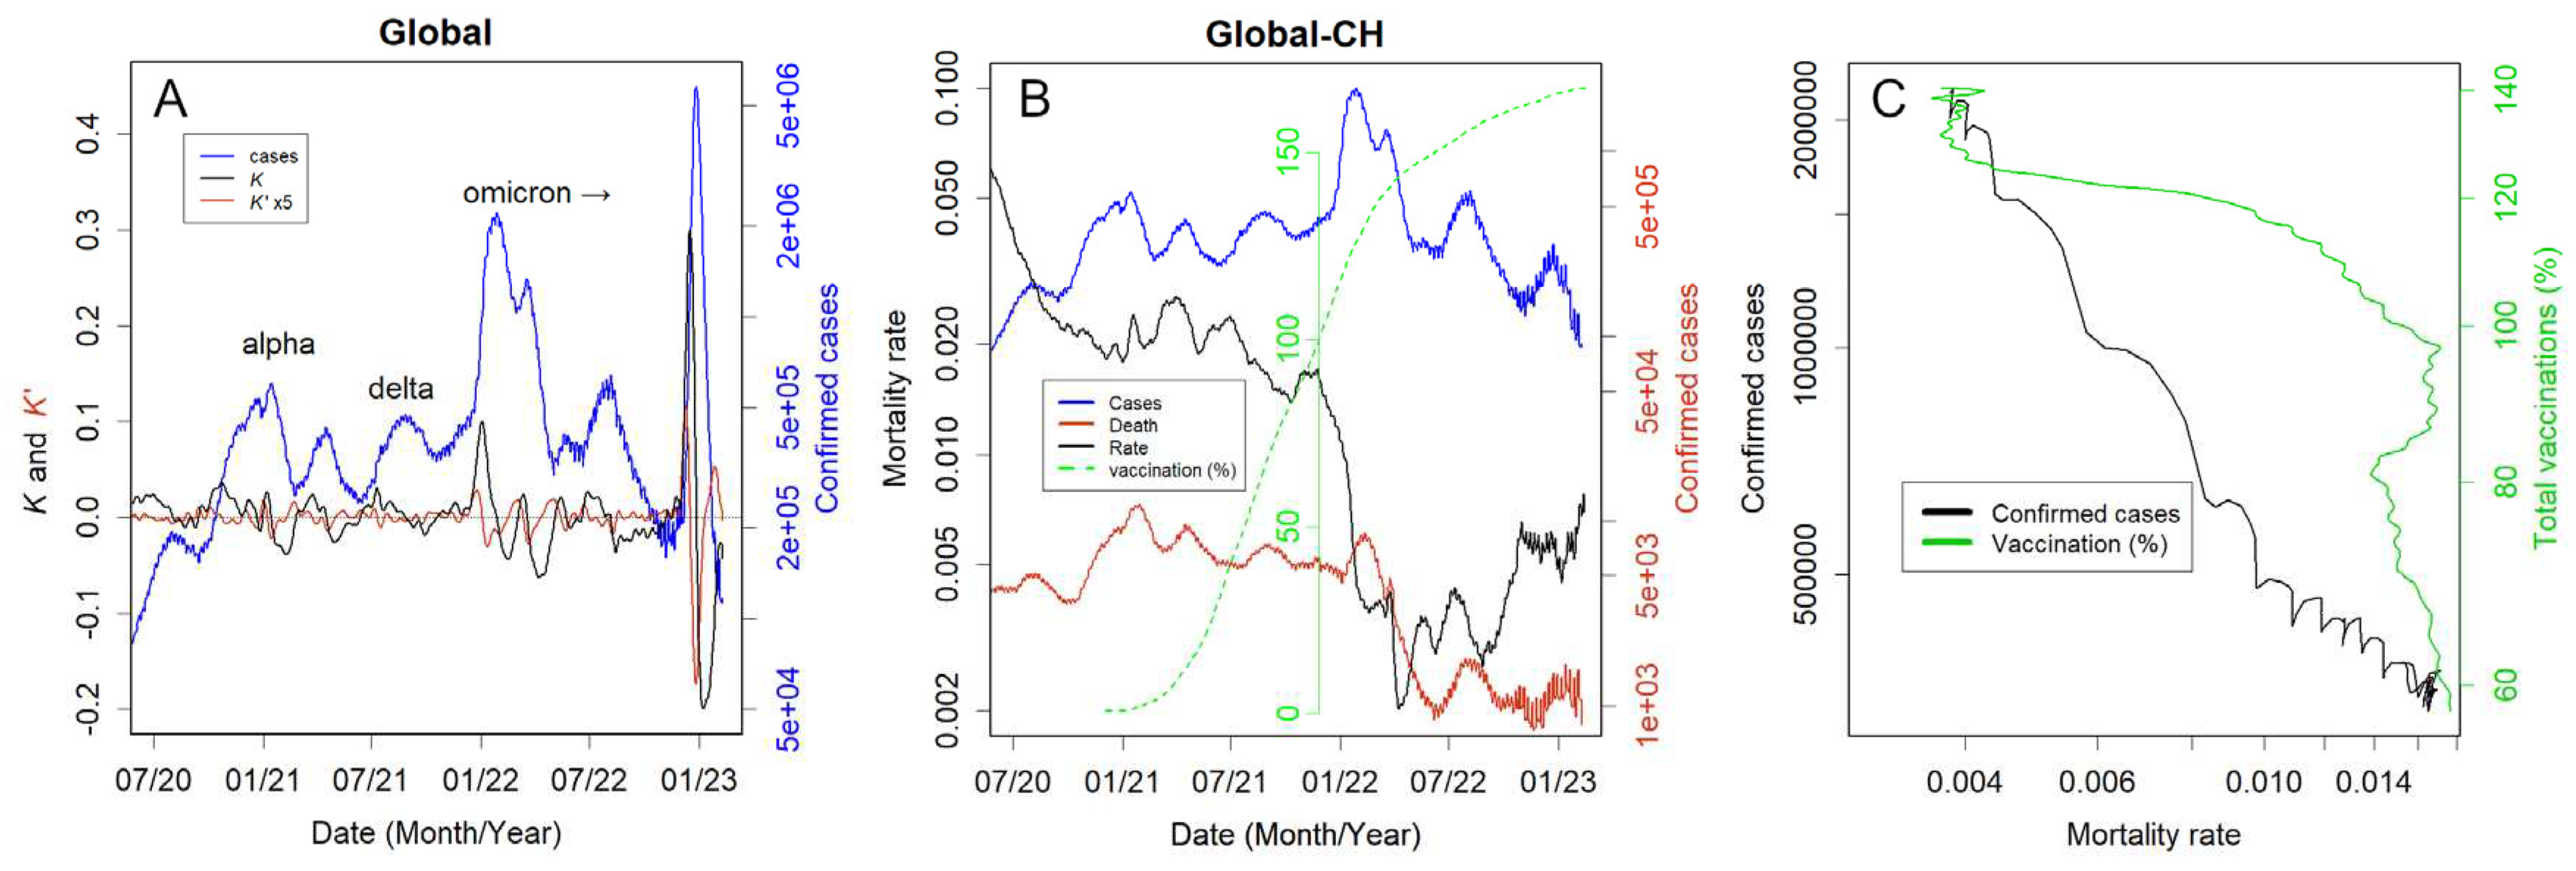
Figure 1. Summary of the global epidemic. (A) Confirmed cases of the epidemic (blue, right axis, logarithmic) and K (black, left axis). Confirmed cases are clearly reflected in weeks after K rises or falls. The third wave of Omicron, when K was at its highest, is almost exactly the same as the Chinese data. Red is dK/dt, which rapidly shows changes in K. (B) Number of deaths (red, right axis) and mortality rate (black, left axis). Since data on the number of deaths are unavailable, China is excluded. Hence the third wave of Omicron almost disappeared (blue, right axis). The green dashed line is the number of vaccinations (per 100 persons). (C) Change in mortality rates (x-axis, logarithmic) against the prevalence of the Omicron variant (black, left axis, logarithmic) and against change in vaccination rates (green, right axis, logarithmic).
Preprints 86400 g001
Figure 2. Confirmed cases for each country. See Figure S1 for data for other countries. (A) Iceland: Note the smaller level on the right axis; K became temporarily large but quickly converged, preventing the logarithmic increase phase from being long. (B) UK, (C) USA, and (D) Sweden: the Omicron epidemic of 01/2022 was huge, and might have infected many people who remained susceptible. Therefore, the second and third wave became smaller. (E) China: the large and rapid third wave of Omicron 01/2023 appeared just after the lift of strict lockdowns. (F) Japan: There have been eight waves so far. The measurement of the eighth wave appeared to be somewhat inaccurate, perhaps because it did not clearly confirm the rise in K. There could still be many susceptive people, so the three waves 6, 7, and 8 were equally large.
Preprints 86400 g002
Figure 3. Number of deaths (red, right axis, logarithmic) and mortality rate (black, left axis, logarithmic). (A) Japan: In 07-08/2021, when the Tokyo Olympics was held, the mortality rate increased 10 times the previous level. (B) Tottori Prefecture (Japan) and (C) Netherlands. The mortality rates are stable and low, remaining around 0.1%. (D) China: Large epidemics have been observed since the lockdowns were lifted. Despite this, mortality rates have not increased, which is probably an error due to neglected measurements. (E) UK and (F) Sweden: After the Omicron outbreak, the number of infections decreased, but the mortality rates rose to 2%, which is four times the global average.
Preprints 86400 g003
Figure 4. Comparison of mortality rates r with and without vaccination. (A) the USA and (B) Switzerland, no booster vaccinations. (C) Chile, comparison between (zero or one) and three doses. For other data, see Figure S4.
Preprints 86400 g004
Disclaimer/Publisher’s Note: The statements, opinions and data contained in all publications are solely those of the individual author(s) and contributor(s) and not of MDPI and/or the editor(s). MDPI and/or the editor(s) disclaim responsibility for any injury to people or property resulting from any ideas, methods, instructions or products referred to in the content.
Copyright: This open access article is published under a Creative Commons CC BY 4.0 license, which permit the free download, distribution, and reuse, provided that the author and preprint are cited in any reuse.
Prerpints.org logo

Preprints.org is a free preprint server supported by MDPI in Basel, Switzerland.

Subscribe

© 2024 MDPI (Basel, Switzerland) unless otherwise stated