Preprint
Article

Electron Swarm Parameters of Alcohols from Electron Collision Cross–Sections

Altmetrics

Downloads

136

Views

61

Comments

0

Submitted:

27 September 2023

Posted:

28 September 2023

You are already at the latest version

Alerts
Abstract
The rationalization and modeling of an electric discharge in a fluid require the knowledge of electron swarm parameters. In this work, transport coefficients of alcohols, including methanol, ethanol, propanol, and butanol are reported. The electron energy distribution function, mean energy, reduced mobility, and diffusion coefficient, are calculated using the two-term expansion of the electron Boltzmann equation in the frame of BOLSIG+ and the Monte Carlo collision code METHES. For such, experimental and theoretical values of the electron-alcohol collision cross-section, covering a range of electron impact energy from 1 eV to 1000 eV, are employed. A temperature of 300K, reduced fields E/N between $1-10^4$ Td (1Td = $10^{-21}~\rm Vm^2$), and Plasma density of $10^{19}~\rm m^{-3}$ were used in simulations. The calculated coefficients are compared with data available from previous studies.
Keywords: 
Subject: Physical Sciences  -   Atomic and Molecular Physics

1. Introduction

In the modelling of low-temperature plasma (LTP) induced by an electric discharge in gases, several ingredients are essential. The kinetic model couples all the species concentration evolution considered in the mixture, while the electron collision cross-sections quantify the interactions between electrons and the mixture components. The electronic energy distribution function (EEDF) can be obtained by solving the electron Boltzmann equation (BE). In contrast, Plasma fluid equations are functions of swarm parameters like diffusion, the reduced ionization coefficients, and the drift velocity [1]. The analysis of the latter parameters gives also a deeper understanding of the various types of discharges in gases, including Townsend discharges, afterglows, and breakdown with noble or atmospheric gases [2]. The electron parameters can be obtained by averaging different quantities related to the electron impact cross-sections over the EEDF [3]. These collisional data are essential input quantities for calculating the EEDF using kinetic [4] or statistical approaches [5].
Plasmas in alcohol have experienced a growing interest in several areas. One of the most important technological uses of Methanol, Ethanol, Propanol, and Butanol is their exploitation in combustion engines [6]. There, the combustion is commonly initiated by an electric discharge from a spark plug. Plasmas in alcohols are also used as sources of molecular hydrogen [7], in medical applications [8], and material synthesis [7,9]. These applications have motivated studies devoted to measuring the cross sections for electron-alcohols collisions [10,11,12,13,14,15]. However, there is a lack in the Literature on swarm parameters for these alcohols.
The calculation of transport coefficients by numerical means dates back to 1970 when Monte Carlo Collision (MCC) simulation and solutions of Boltzmann equation (BE) were used for such purposes. Some of these tools are found in open-source form, benefiting the studies about LTP. Some of them are are BOLTZ [16], NOMAD [17], ELEDIF [18], BOLSIG+ [4,19], EEDF [20], METHES [21], Magboltz [22], MultiBolt [23] and LoKI-B [24]. In this paper, we used BOLSIG+ (BE) and METHES (MCC) software because they accept electron scattering cross sections, in the same format as the LXCat database [25]; besides they are widely used in previous studies.
Thus, this work aims to calculate the electron swarm parameters in several alcohols, using previously reported collision cross-sections. The paper is organized as follows, the Methodological details and a brief survey of the input parameters is presented in Section 2, the calculated EEDF, diffusion coefficients, mean energies, drift velocities, and reduced ionization coefficients are reported and compared with available data in Section 3. The Conclusions are given in Section 4.

2. Methodology

2.1. Computational Methods

Plasmas electron transport properties can theoretically be obtained according to the electric field in two distinct ways. The first method directly solves the electron Boltzmann Equation (BE) by some means of approximation, such as Two-Term Approximation (TTA) [4,18,26,27]. The second method tracks the random motion of electron bunches and collision with neutral particles by Monte Carlo Code (MCC) [21,23,28]. The TTA technique is used in BOLSIG+ software that is widely used by researchers in the Low-Temperature Plasma (LTP) area, several physical models allow its use in many different working conditions, namely: electron drift and diffusion under the influence of electric and magnetic fields at any angle with each other; density-gradient expansion allowing calculating the transverse and longitudinal bulk/flux swarm parameters; The Influence of Electron-Electron Collisions on the first anisotropy; HF excitement; Pulsed Townsend (PT) and Steady State Townsend (SST) electron density growth due to non-conservative electron scattering mechanisms.
For electronic collisions, EEDF represented by f, is obtained from solving the Boltzmann Equation (1):
f t + v · f e m E · V f = C [ f ]
where v is the electronic speed vector, E is the electric field, C [ f ] accounts for changes in f due to the collisions with the species [4], e electron charge and m electron mass.
Since solving the Boltzmann equation directly is a highly challenging task, it can be expanded in spherical coordinates, and the binomial approximation method can be employed to simplify the complexity. In this context, the distribution function, denoted as “f,” can be expanded as follows:
f ( v , t , z , cos θ ) f 0 ( v , t , z ) + f 1 ( v , t , z ) cos θ
Here, θ represents the angle between the electron velocity vector and the direction of the electric field, while f 0 and f 1 correspond, respectively, to the homogeneity and heterogeneity of the electron energy distribution function, your solution provides valuable foundational data for obtaining various electron transport parameters [29].
v d = μ E
ε = 0 ε 1 / 2 f 0 d ε
μ N = γ 3 0 ε Q f 0 ε d ε
D T N = γ 3 0 ε Q f 0 d ε
D L N = D T N E N γ 3 0 ε Q g 0 ε d ε μ N E N 0 ε 1 / 2 g 0 d ε
α k N = γ ( μ N ) ( E / N ) 0 ε Q k f 0 d ε
Swarm parameters can be comprehended by considering the spatiotemporal progression of a singular electron avalanche within an unchanging, stable electric field E. In the BOLSIG+ software, these parameters are obtained via a set of mathematical equations. The mean energy in Equation (4) is determined by integrating the electron energy ε with the isotropic portion of the electron distribution function f 0 , which is the zero th-order term in the spherical harmonics expansion of the velocity space. The quantity γ = ( 2 e / m e ) 1 / 2 , where e and m e represent the electron charge and mass, respectively, and N is the gas density. The Gaussian probability density function characterizing the avalanche is propelled by a center-of-mass velocity Equation (3) that is determined by the electron mobility Equation (5), which includes the effective total momentum-transfer cross-section Q , including superelastic and electron-ion Coulomb collisions. The avalanche undergoes both transverse and longitudinal diffusion processes, with diffusion coefficients D T Equation (6) and D L Equation (7), respectively, that depend on the first-order component of the density-gradient expansion of the distribution function g 0 , which is a perturbation of f 0 due to the electron density gradient. The reduced Townsend coefficient Equation (8) determines the first Townsend ionization coefficient and the total number of electrons created per unit length, which is described by the cross-section Q x , which is the reduced excitation coefficient for process x [1,4].
ε = 1 T m e 2 k = 1 N e t 0 t f v k ( t ) 2 d t
w = d d t r
D = 1 2 d d t ( r r ) 2
w ˜ = 1 T k = 1 N e t 0 t f v k ( t ) d t
D ˜ = k = 1 N e 1 T t 0 t f r k ( t ) v k ( t ) d t 1 T t 0 t f r k ( t ) d t · 1 T t 0 t f v k ( t ) d t
The MCC Method is employed in the METHES program that calculates transport parameters, such as velocity w and diffusion coefficient D for flux Equations (10) and (11) and bulk Equations (12) and (13) respectively, reaction rates, and EEDF, mean energy Equation (8) is derived by time-averaging the energies of all electron trajectories for arbitrary gas mixtures where positions r, velocities v, through the code written object-oriented in Matlab.

2.2. Input Data

Both solvers use electron-neutral collisions such as elastic, inelastic, ionization, and Attachment Collisions. These collision sets can be accessed via the LXcat open-access plasma data exchange project [25]. Although users can download files from the LXcat database or create their files according to the LXcat format to obtain data for specific species, cross-section data for alcohols were not available on the platform. Therefore, for the study, files were created containing cross-sectional data for alcohols, ensuring that the input formats of the software used were respected, with experimental and theoretical data. It is worth emphasizing that the primary focus of our study was not centered around the renormalization of cross-sections. Instead, our intention was to assess the predictive capabilities of the available cross-sections within the Bolsig+ and METHES codes. The utilization of renormalization, while feasible, would entail a significant allocation of additional effort and resources. Moreover, such an approach could potentially deviate from the core objective of our research, which is to evaluate the predictive capacities of the existing cross-sections.
Experimental data on the Total Cross Section (TCS) resulting from elastic scattering with Methanol, Ethanol, 1-Propanol, and 1-butanol at intermediate impact energies have been collected from previous research conducted at the laboratory located at the Federal University Juiz de Fora, Brazil, using the electron transmission method Silva et al. [10,11] and Gomes et al. [12] have reported these findings in recent publications. It is recommended to use the elastic momentum transfer instead of TCS. Currently, the presented data do not cover the energy range equivalent to the one used here. When using this data, there were no significant changes observed. However, for the calculation of the drift velocity, any variation in the total momentum transfer cross-section is noticeable. In the energy range where we have experimental data, the values coincide with TCS. The research group has also presented data on the Total Ionization Cross Sections (TICS) of Methanol, Ethanol, 1-Propanol, and 1-Butanol in the 10-100 eV impact electron energy range, which were obtained from their previous studies [13,14,15].
In addition, cross-sectional measurements were carried out for the four lowest integral electron impact excitation states of Methanol at 1 3 A , 1 1 A , 2 3 A , and 2 1 A states for incident electron energies ranging from 9 to 20 eV and scattering angles of 5° to 130°, as well as for Ethanol’s excitation of the 1 3 A and 1 1 A states and 2 3 A + 1 3 A and 2 1 A + 2 1 A , with the excited states being determined by transitions and identified by singlet and triplet excitations, as demonstrated in the works of Varela et al. [30] and Hargreaves et al. [31].
To provide context for these experimental results, theoretical cross-sectional values from the work of Bharadvaja et al. [32] were used, covering an energy range of 1 to 5000 eV. The inelastic ionization cross-sections were calculated using the Binary-Encounter-Bethe method, and the elastic and inelastic cross-sections were combined incoherently to determine the Total Cross Section. Theoretical values for excited states and rotational states were also obtained from the aforementioned experimental publications. A set of cross-sections of experimental and theoretical data are presented in Figure 1.
The process of electron attachment was not present and would have a substantial impact on the outcomes. Electron attachment is pivotal in capturing electrons, influencing insulation properties, and contributing to the formation of anions. Its absence would disrupt the balance of charged species, altering plasma behavior, ionization rates, and subsequent reactions. This would lead to deviations in both computational predictions and experimental observations, ultimately affecting the overall behavior of the electronegative gas and its interactions with charged particles.

3. Results and Discussion

The results presented here were obtained by the BOLSIG+ (B+) and METHES (MT) following parameters the temperature of gas 300K, pressure 1 Torr (1 Torr = 133.322 Pa), reduced fields (E/N) between 1 10 4 Td (1Td = 10 21 V m 2 ) and Plasma density 10 19 m 3 . Electrons number were not fixed ranging from 10 4 to 10 7 in the calculations using METHES. There were no adjustments to the cross sections and we did not use the uncertainties in the experimental values, because we are making a comparison between the experimental (X) and theoretical (T) data sets and their results between the software. Issues about the efficiency of the software can be found elsewhere, and will not be addressed here [33,34]. It has been reported in studies that address the determination of swarm parameters through the BOLSIG+ software that there is a limitation of results up to a maximum reduced field (E/N) of 3 x 10 3 Td, whereas in our work we used up to 1 x 10 4 Td. Values above this limit exhibit a larger discrepancy compared to those obtained at low and medium fields. However, we retained these results for comparison with experimentally obtained values, as even though they showed divergences in values, the data presented coherent profiles with the experimentally obtained data.

3.1. Electron Energy Distribution Function

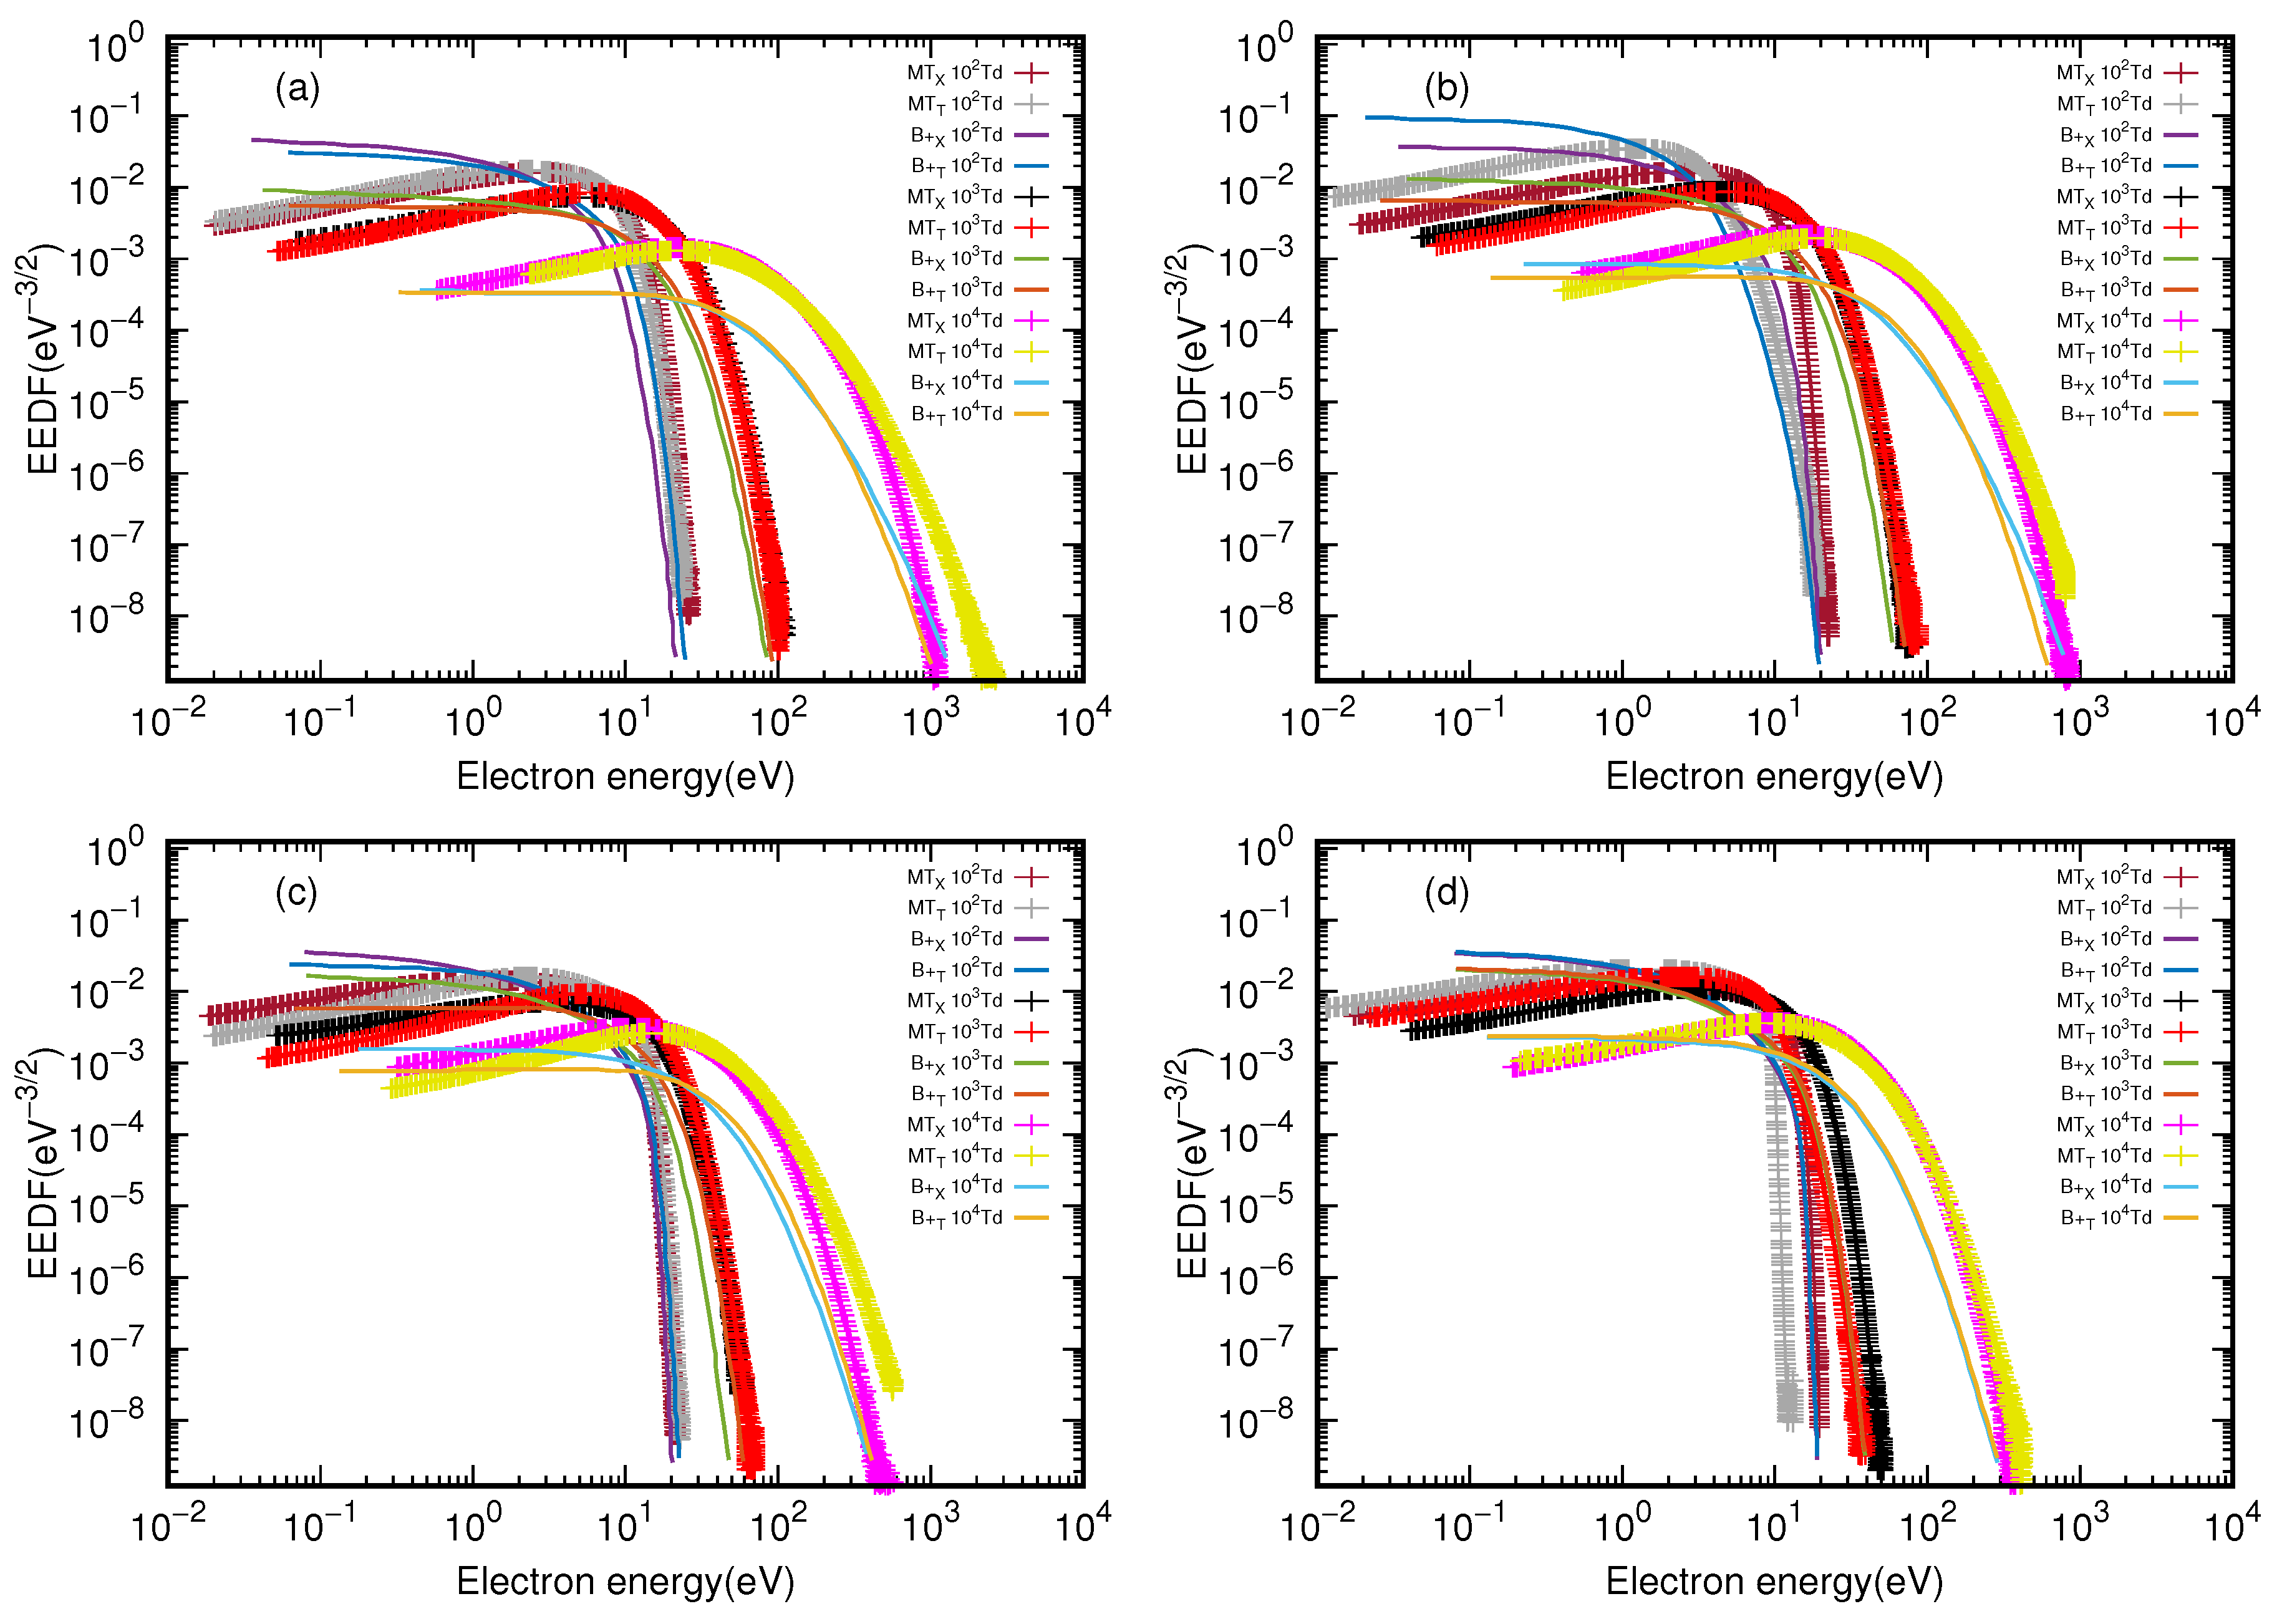
The data presented here in Figure 2 differ from other works that make comparisons between the software used, the curves for EEDF are not coincident, presenting a particular discrepancy in values between software and values of experimental and theoretical cross-sections. It was considered three values of reduced field (uniform field in the z-direction) 10 2 Td, 10 3 Td e 10 4 Td, that is, we focused more on the high reduced field. For the range below 30 eV, the Total cross section is the most contributive for all the alcohols, and for Propanol we have no information on excited states. Much of the discrepancy presented in the results of BOLSIG+ in comparison with METHES is known for the small anisotropy approximation breaks down and the motion of electrons is strongly driven by the externally applied electric field. The presence of a strong electric field has a double effect: it increases the contribution of inelastic collisions and sets a preferential direction in the motion of the electrons [35] as we can see in the presented results where a difference is already expected for electrons with high energies.
The results are close between the measurements with experimental and theoretical values for the BOLSIG+ and METHES. The significant difference in results between the software BOLSIG+ and METHES is particularly evident across all alcohols in the low and medium-energy regions. There is a lack of experimental cross-section data in the low energy limit. Thus leaving such a region for numerical extrapolations. The behavior of the EEDFs obtained by METHES shows a peak that is not followed by the results obtained by the BOLSIG+ in all the alcohols for electronic energies above 20 eV, the results are coincident only diverging for the fields of 10 4 Td, since its greatest discrepancy is for Methanol, among the other molecules there is proximity. This behavior was already expected given that METHES shows that increasing the number of considered Legendre polynomial terms to N = 10 is superior to the calculation performed by the two-term BE solver BOLSIG+ as previously discussed [33].

3.2. Diffusion Coefficient

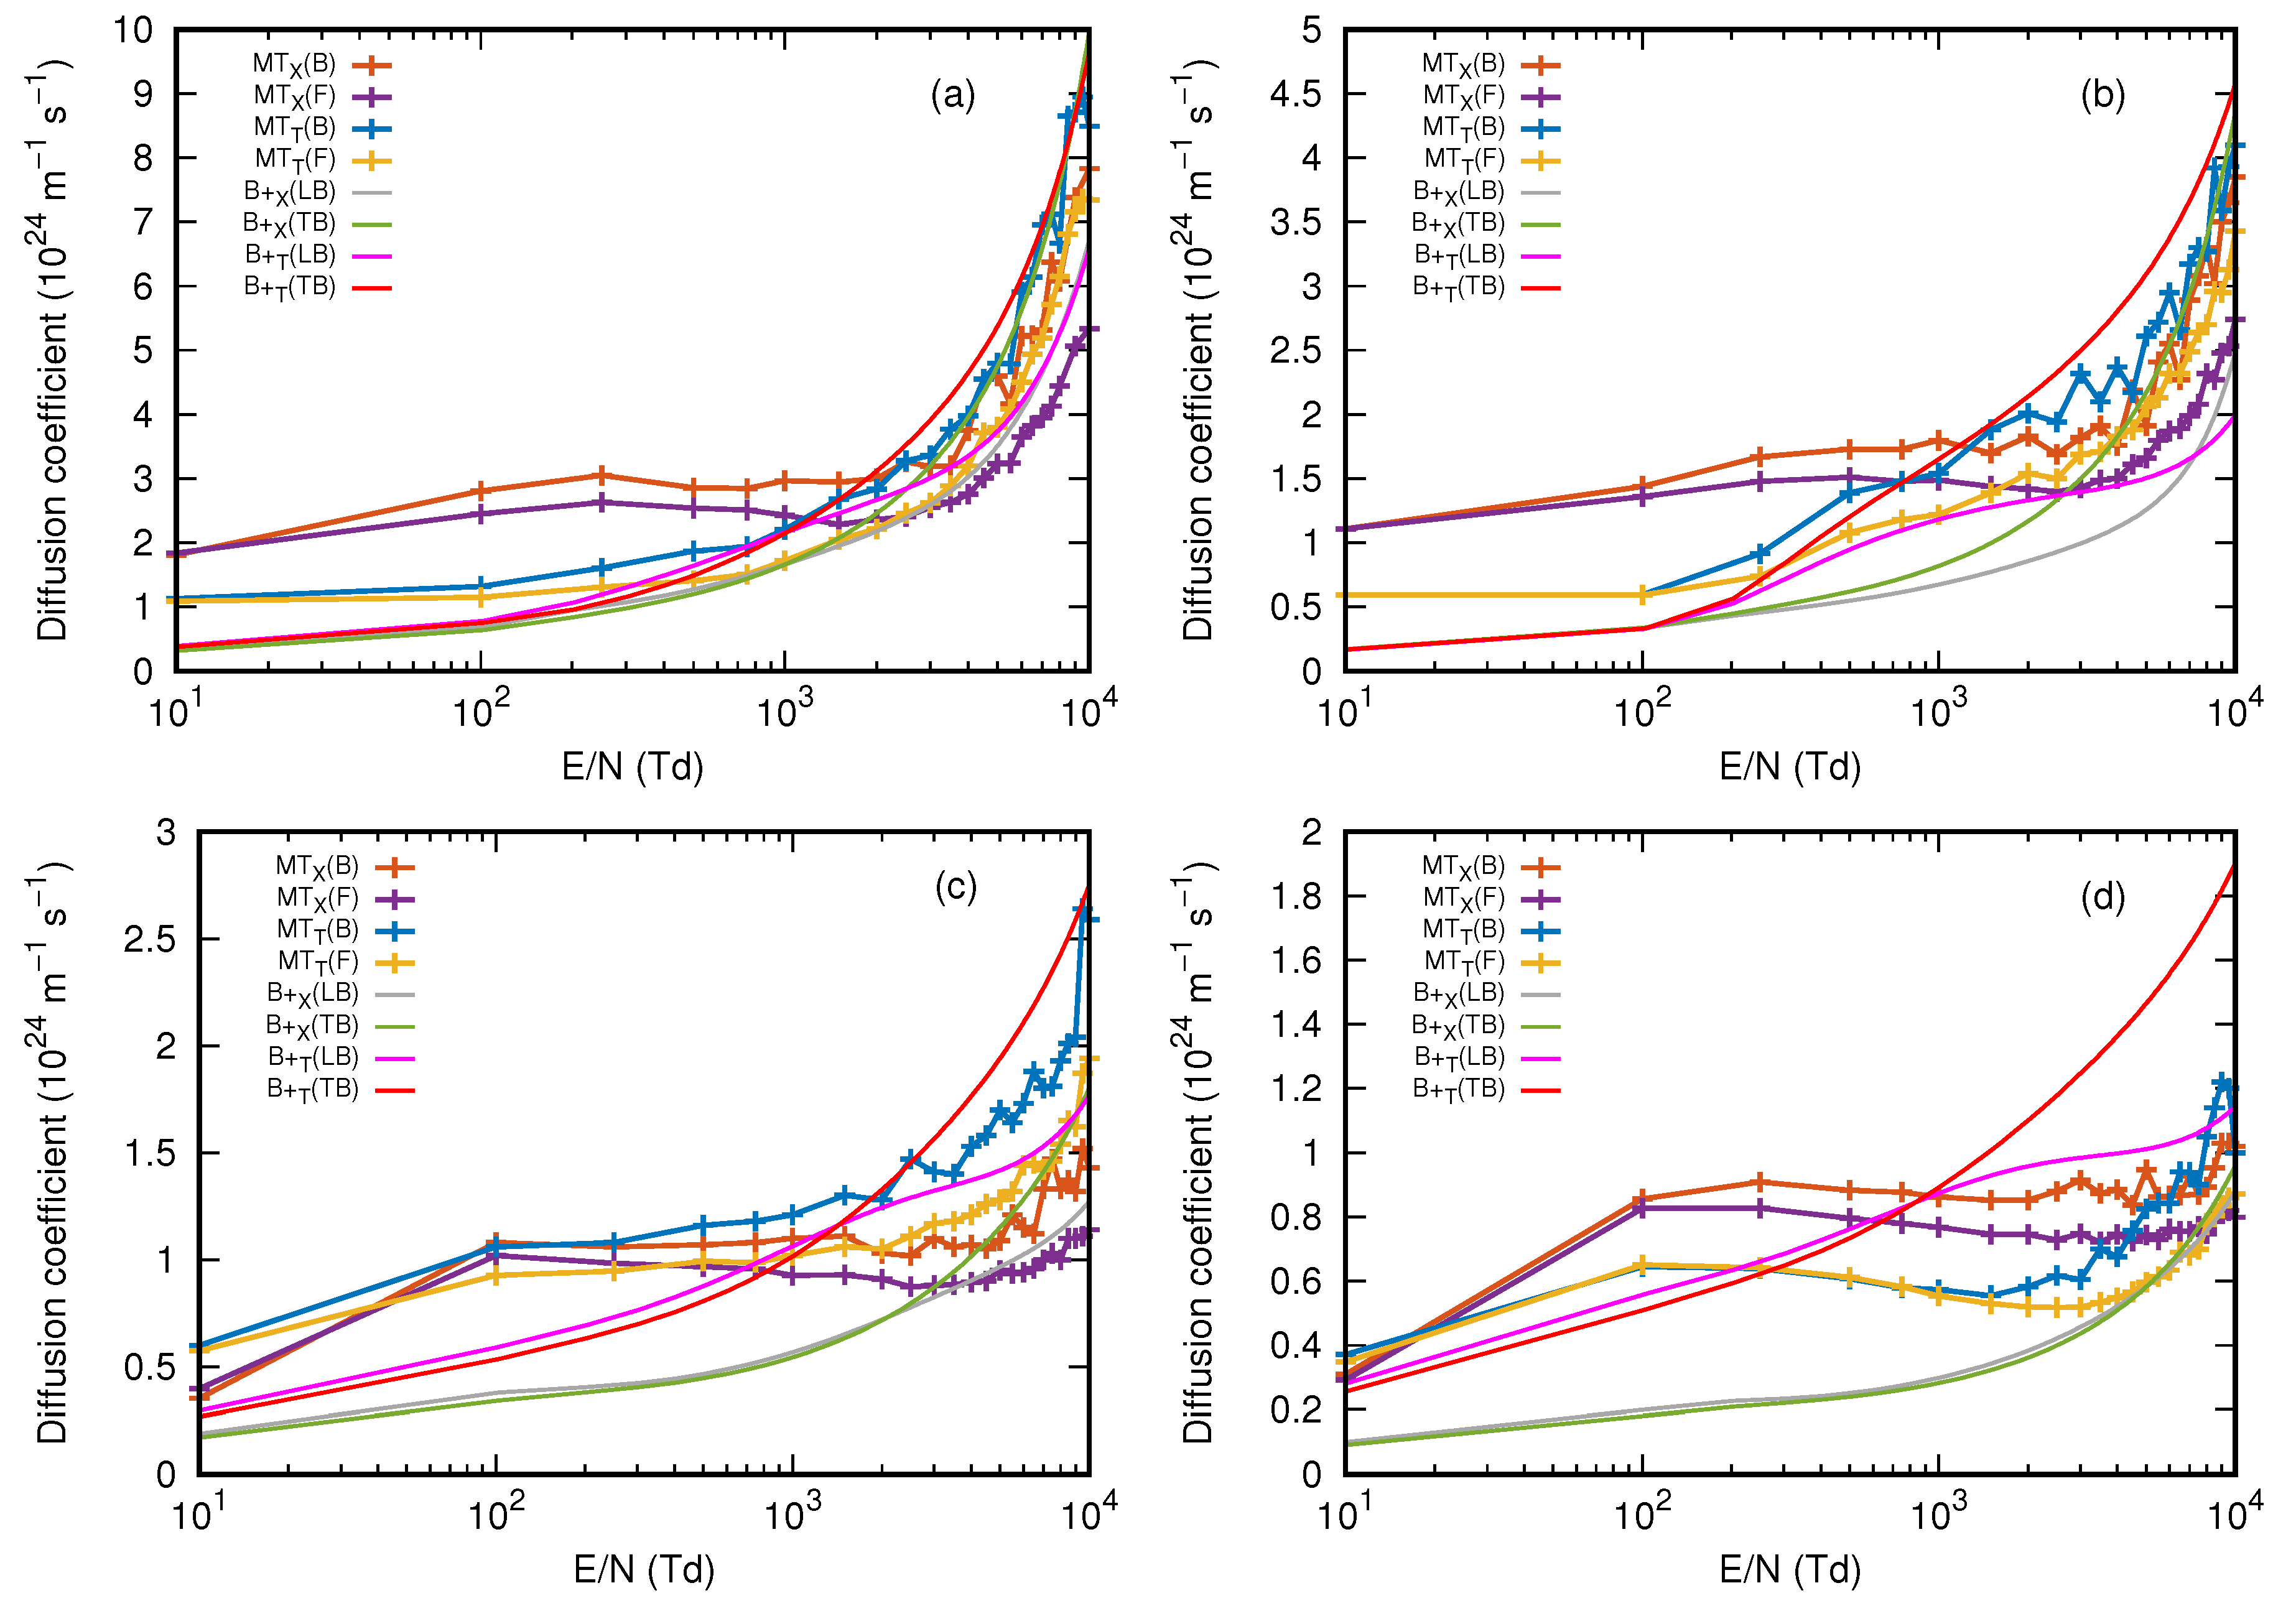
For the results presented for the Longitudinal Diffusion Coefficient ( D L ) and Transversal Diffusion Coefficient ( D T ) , in Figure 3, experimental results are not reported, where we can only analyze the results presented by the software used. There is a notable difference for the E/N field range between 10 Td and 200Td, where for all the alcohol molecules the values of diffusion coefficient are lower when obtained by BOLSIG+ up to E/N 10 3 Td, which is not reported for other molecules [21], and when the E/N values are more significant than 10 3 Td there is an instability in the data obtained by METHES. The deviations presented in the comparison of METHES and BOLSIG+ can be attributed to the inaccuracy of the two-term approximation of the Boltzmann equation, which is more significant for diffusion than for the drift velocity. We must also emphasize the contribution of inelastic collisions for larger values of E/N when the distribution function deviates substantially from isotropy in velocity space, which does not happen for low values of E/N becoming more evident the need for elastic cross section and excitation [36]. For the experimental cross-section values, the diffusion coefficient in METHES is higher for Methanol and Ethanol between 10 Td and 10 3 Td, with the theoretical results, the curve profile is very close, and the discrepancy between the values is not large, with the values diverging above 200 Td. The results of the alcohols Propanol and Butanol which do not have experimental excitation cross-section data show there was a more significant divergence in the values presented in both software. The research conducted by Alves et al.[1] has illustrated that there exist discrepancies in the values of a certain parameter among molecules that are listed in divergent research groups. In particular, the Reduced Longitudinal Diffusion Coefficient values for Helium and Neon molecules have been found to exhibit fluctuations ranging from 5% to 12% across the databases that are accessible at Lxcat.

3.3. Mean Energy

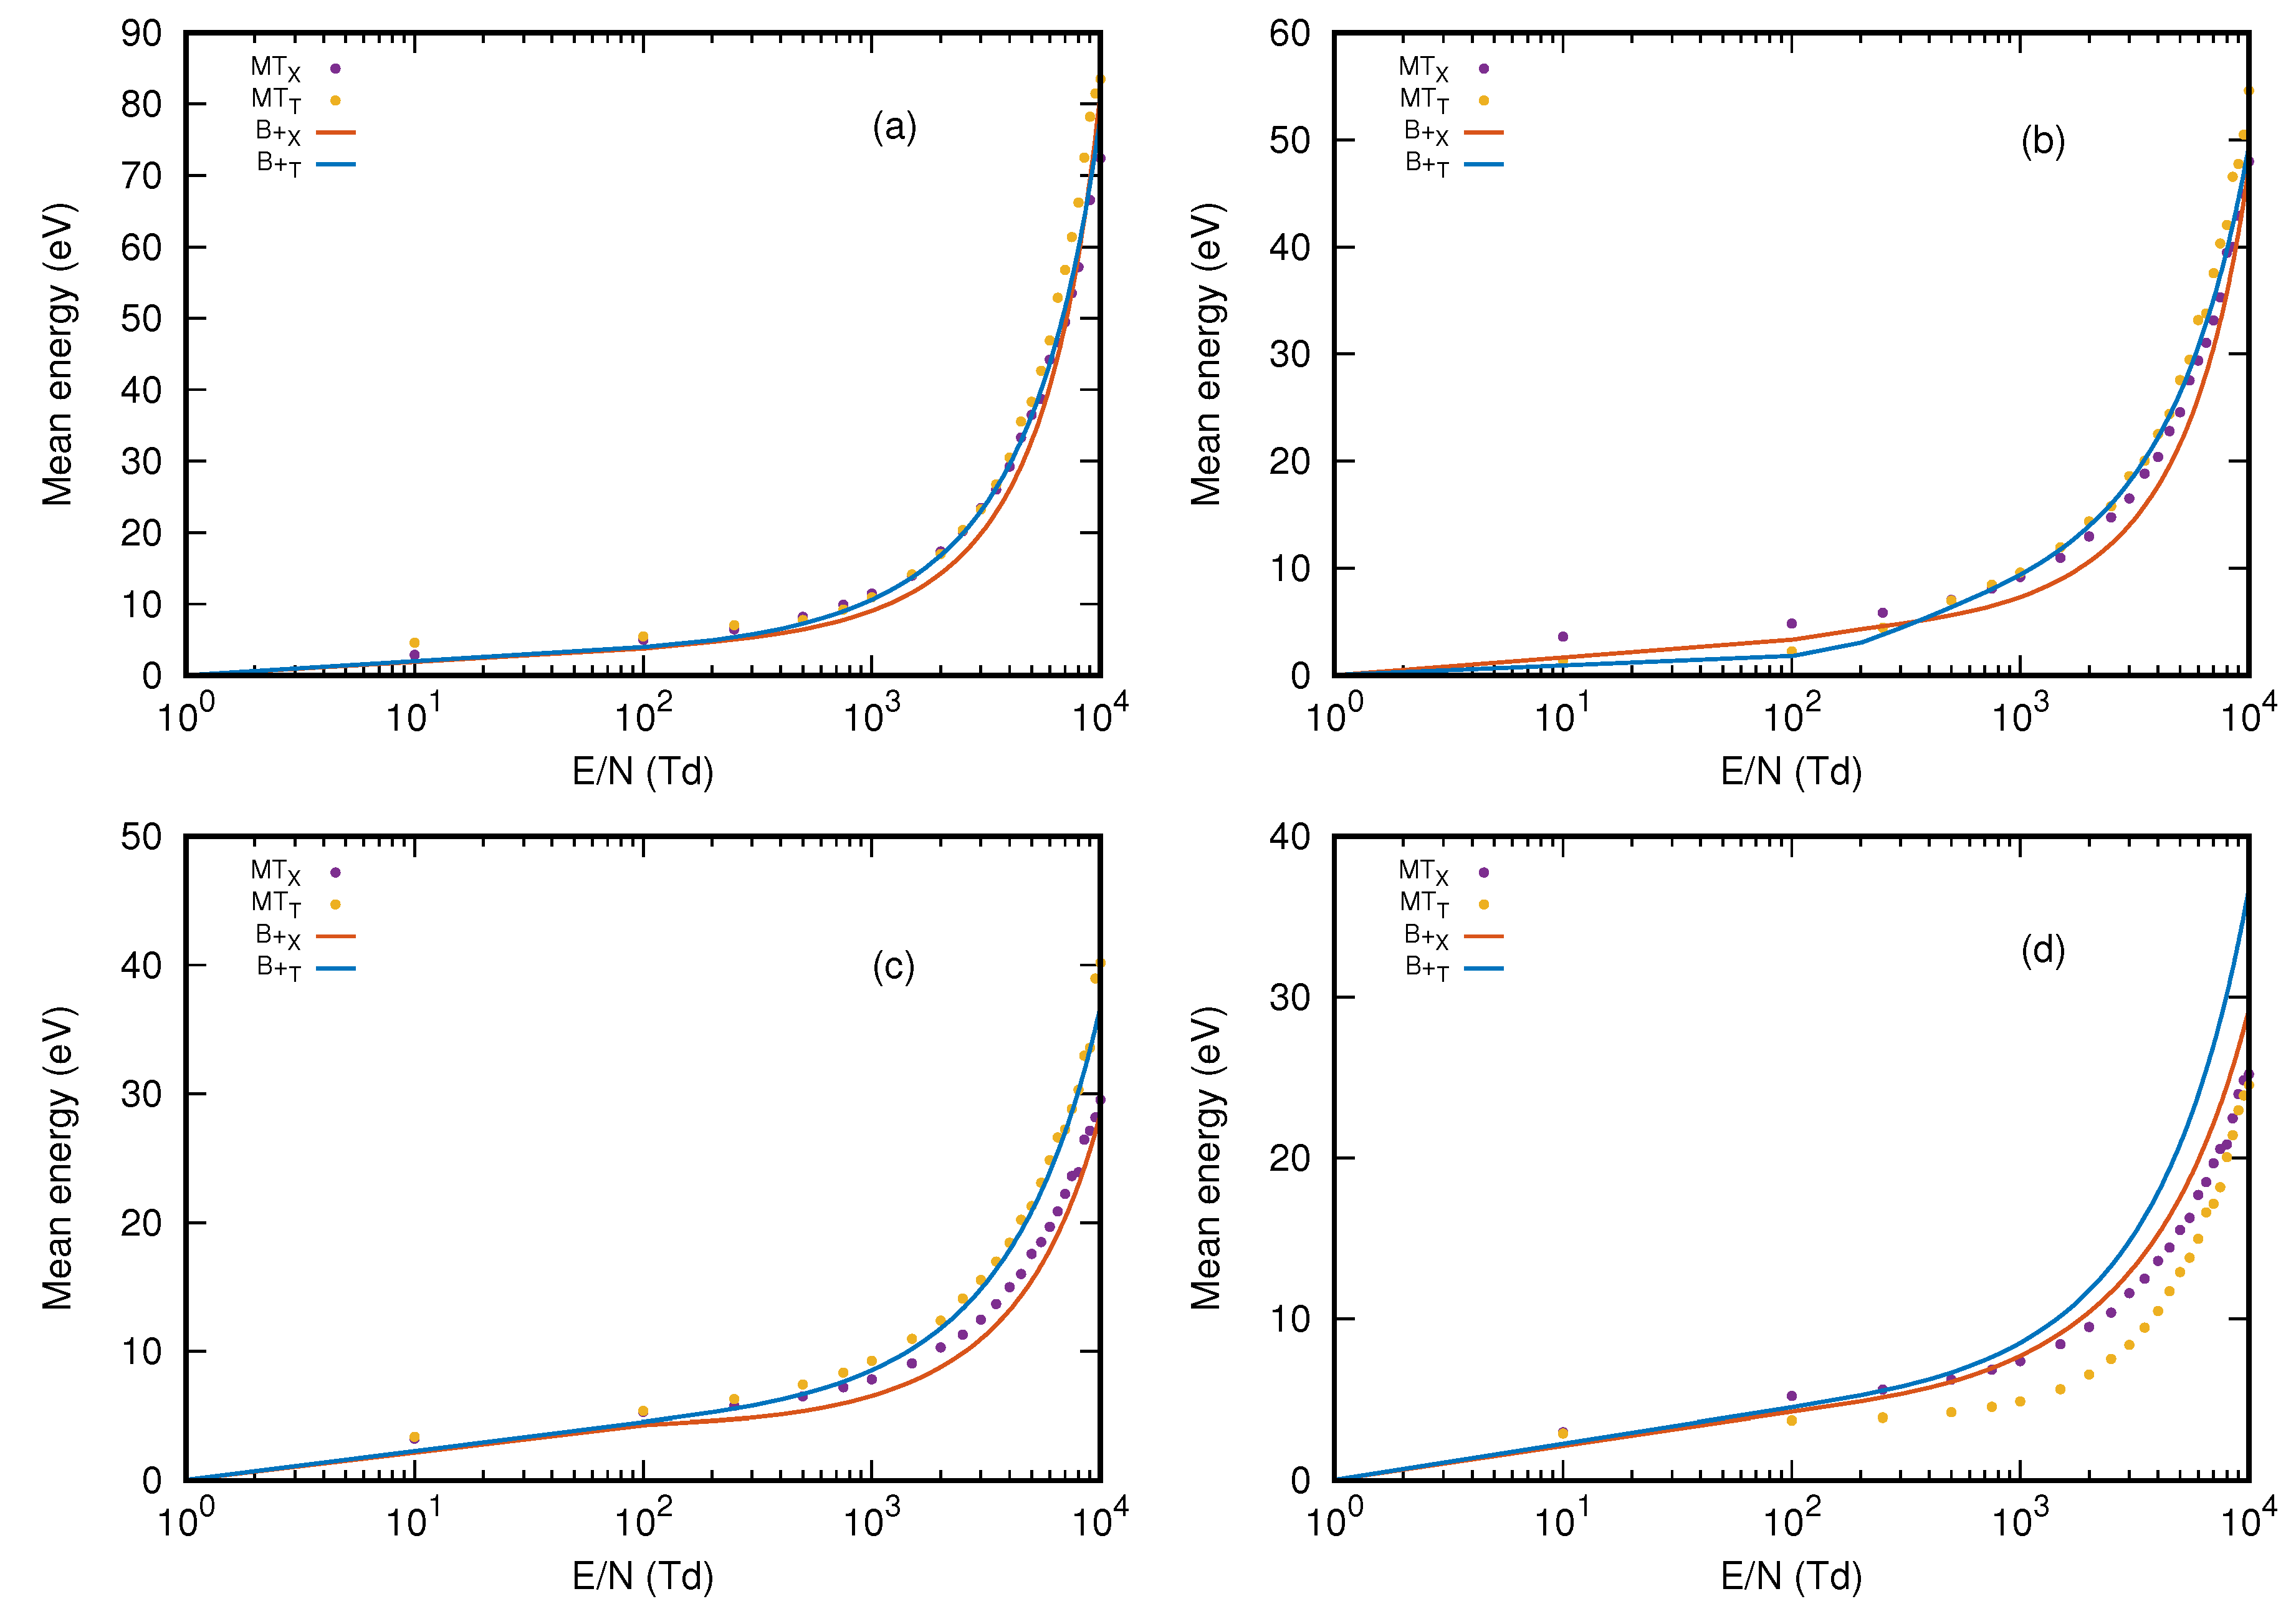
In Figure 4 are displayed the values for mean energy, we do not see many discrepancies between the results obtained by both BOLSIG+ and METHES. The difference in the case will be restricted to the quality of the cross-section data where for Methanol and Ethanol, whose data set is bigger there is little difference, whereas, for the molecules of Propanol and Butanol, there is a particularity for cross-sections without the excitation and attachment data. As in the molecule of Propanol, the data profile is perfect with a little discrepancy in what happens for the experimental data set of Butanol, but this is not seen when we use theoretical data that do not have their experimental counterparts, showing that the insertion of such data increases the discrepancy between the software. The rate of increase of the mean energy varies with E/N, reflecting the energy dependence of the cross sections for electrons, where the elastic cross-section is predominant for all molecules, and in the case of the insertion of theoretical data of excitation and rotational is shown a significant difference for Butanol.

3.4. Drift Velocity

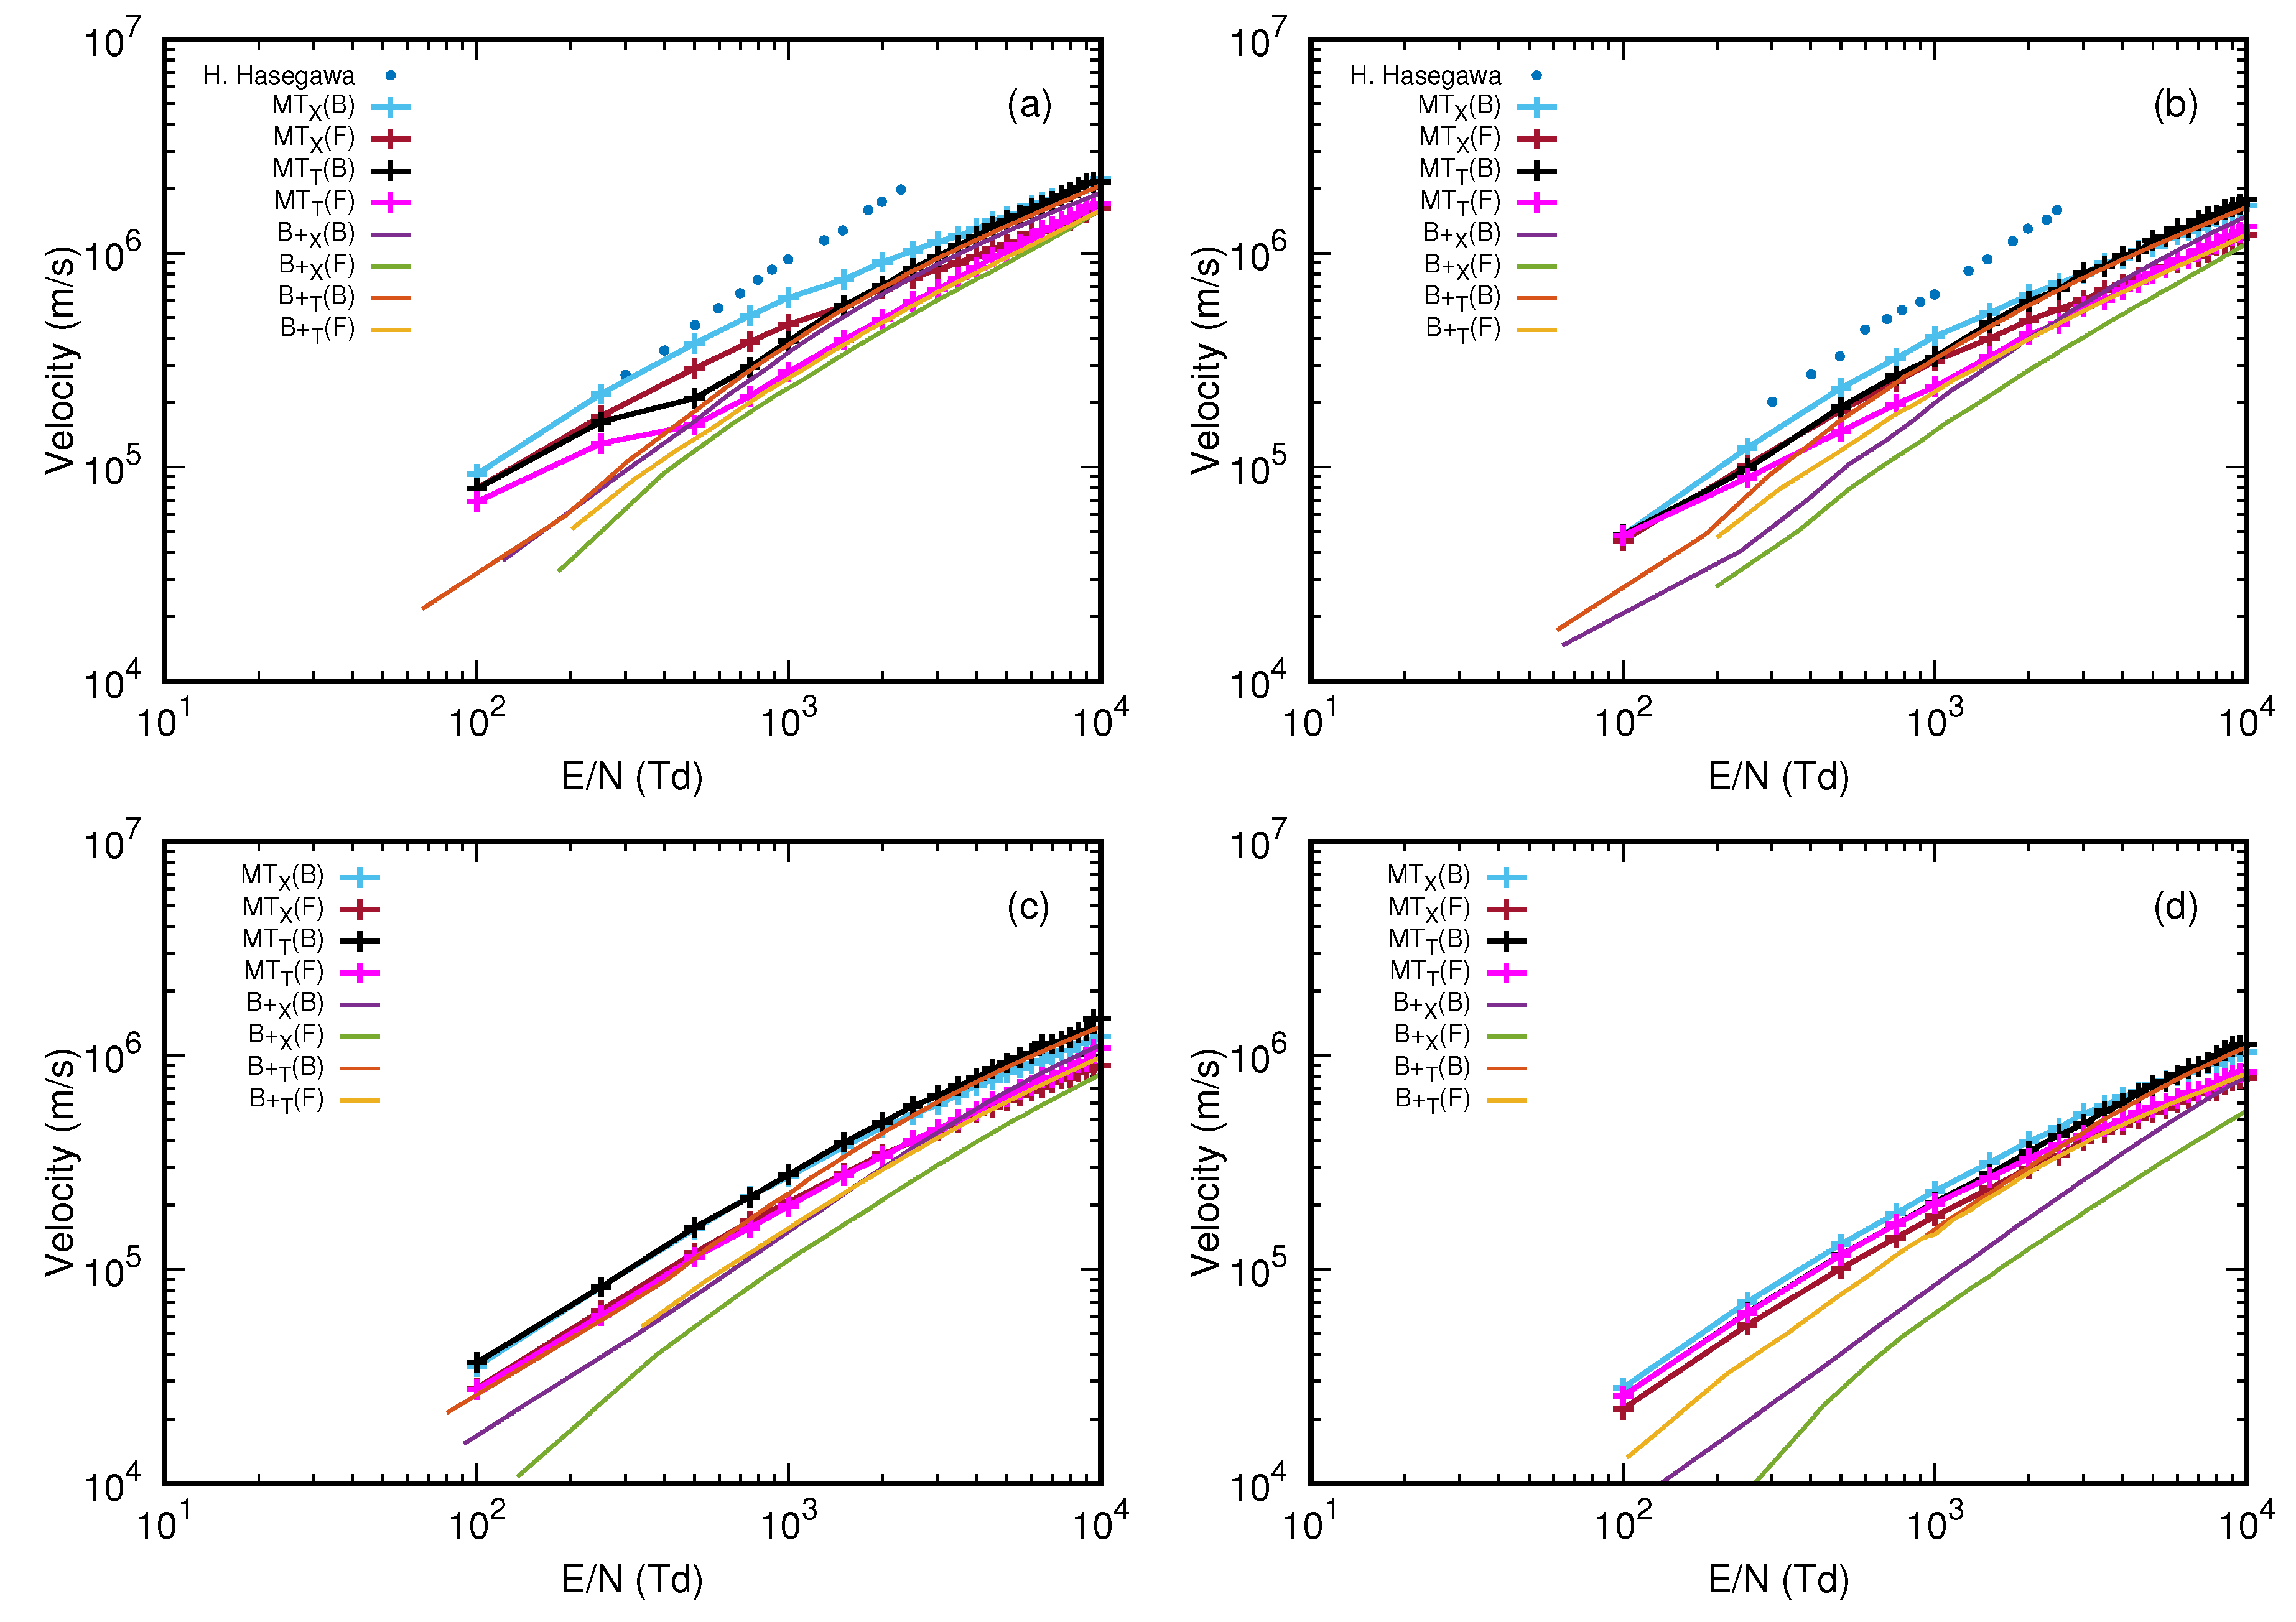
The results for bulk and flux drift velocity of the alcohols are presented in Figure 5. The values obtained with METHES are better than those obtained with BOLSIG+, compared with experimental values obtained by Hasegawa and Date [37] for Methanol and Ethanol molecules, whereas the theoretical values are far below the experimental ones for these two molecules, having its greatest variation for the values obtained by BOLSIG+ flux, where the experimental cross-section data set generated results that were lower than the experimental values of drift velocity one order of magnitude. The closest results were obtained with METHES Bulk and experimental cross-section set. We have to keep the pressure at 1 Torr during the whole cycle, in the experimental values reported a variation from 0.1 to 9.0 Torr depending on the method used in the measurements. There are also experimental results for low E/N of methanol presented by Cottrel [38], the values for drift velocity for Propanol and Butanol are not reported for high E/N being presented for low E/N in the work of Peisert and Sauli [39], where we can identify a similarity between the data obtained for the different molecules, that according to the increase of x carbon number and y hydrogen number CxHyOH, there is a decrease in the drift velocity, the profile that is also maintained for the values obtained for both software and set of cross-section, the influence of the increase of the Total cross-section is identified between the molecules. Allied with the performance of the software for high E/N, we have the cross-section with little data, the lack of the electron attachment affects directly, to push the center of mass forward, increasing the bulk drift velocity [36].

3.5. Reduced Ionization Coefficient

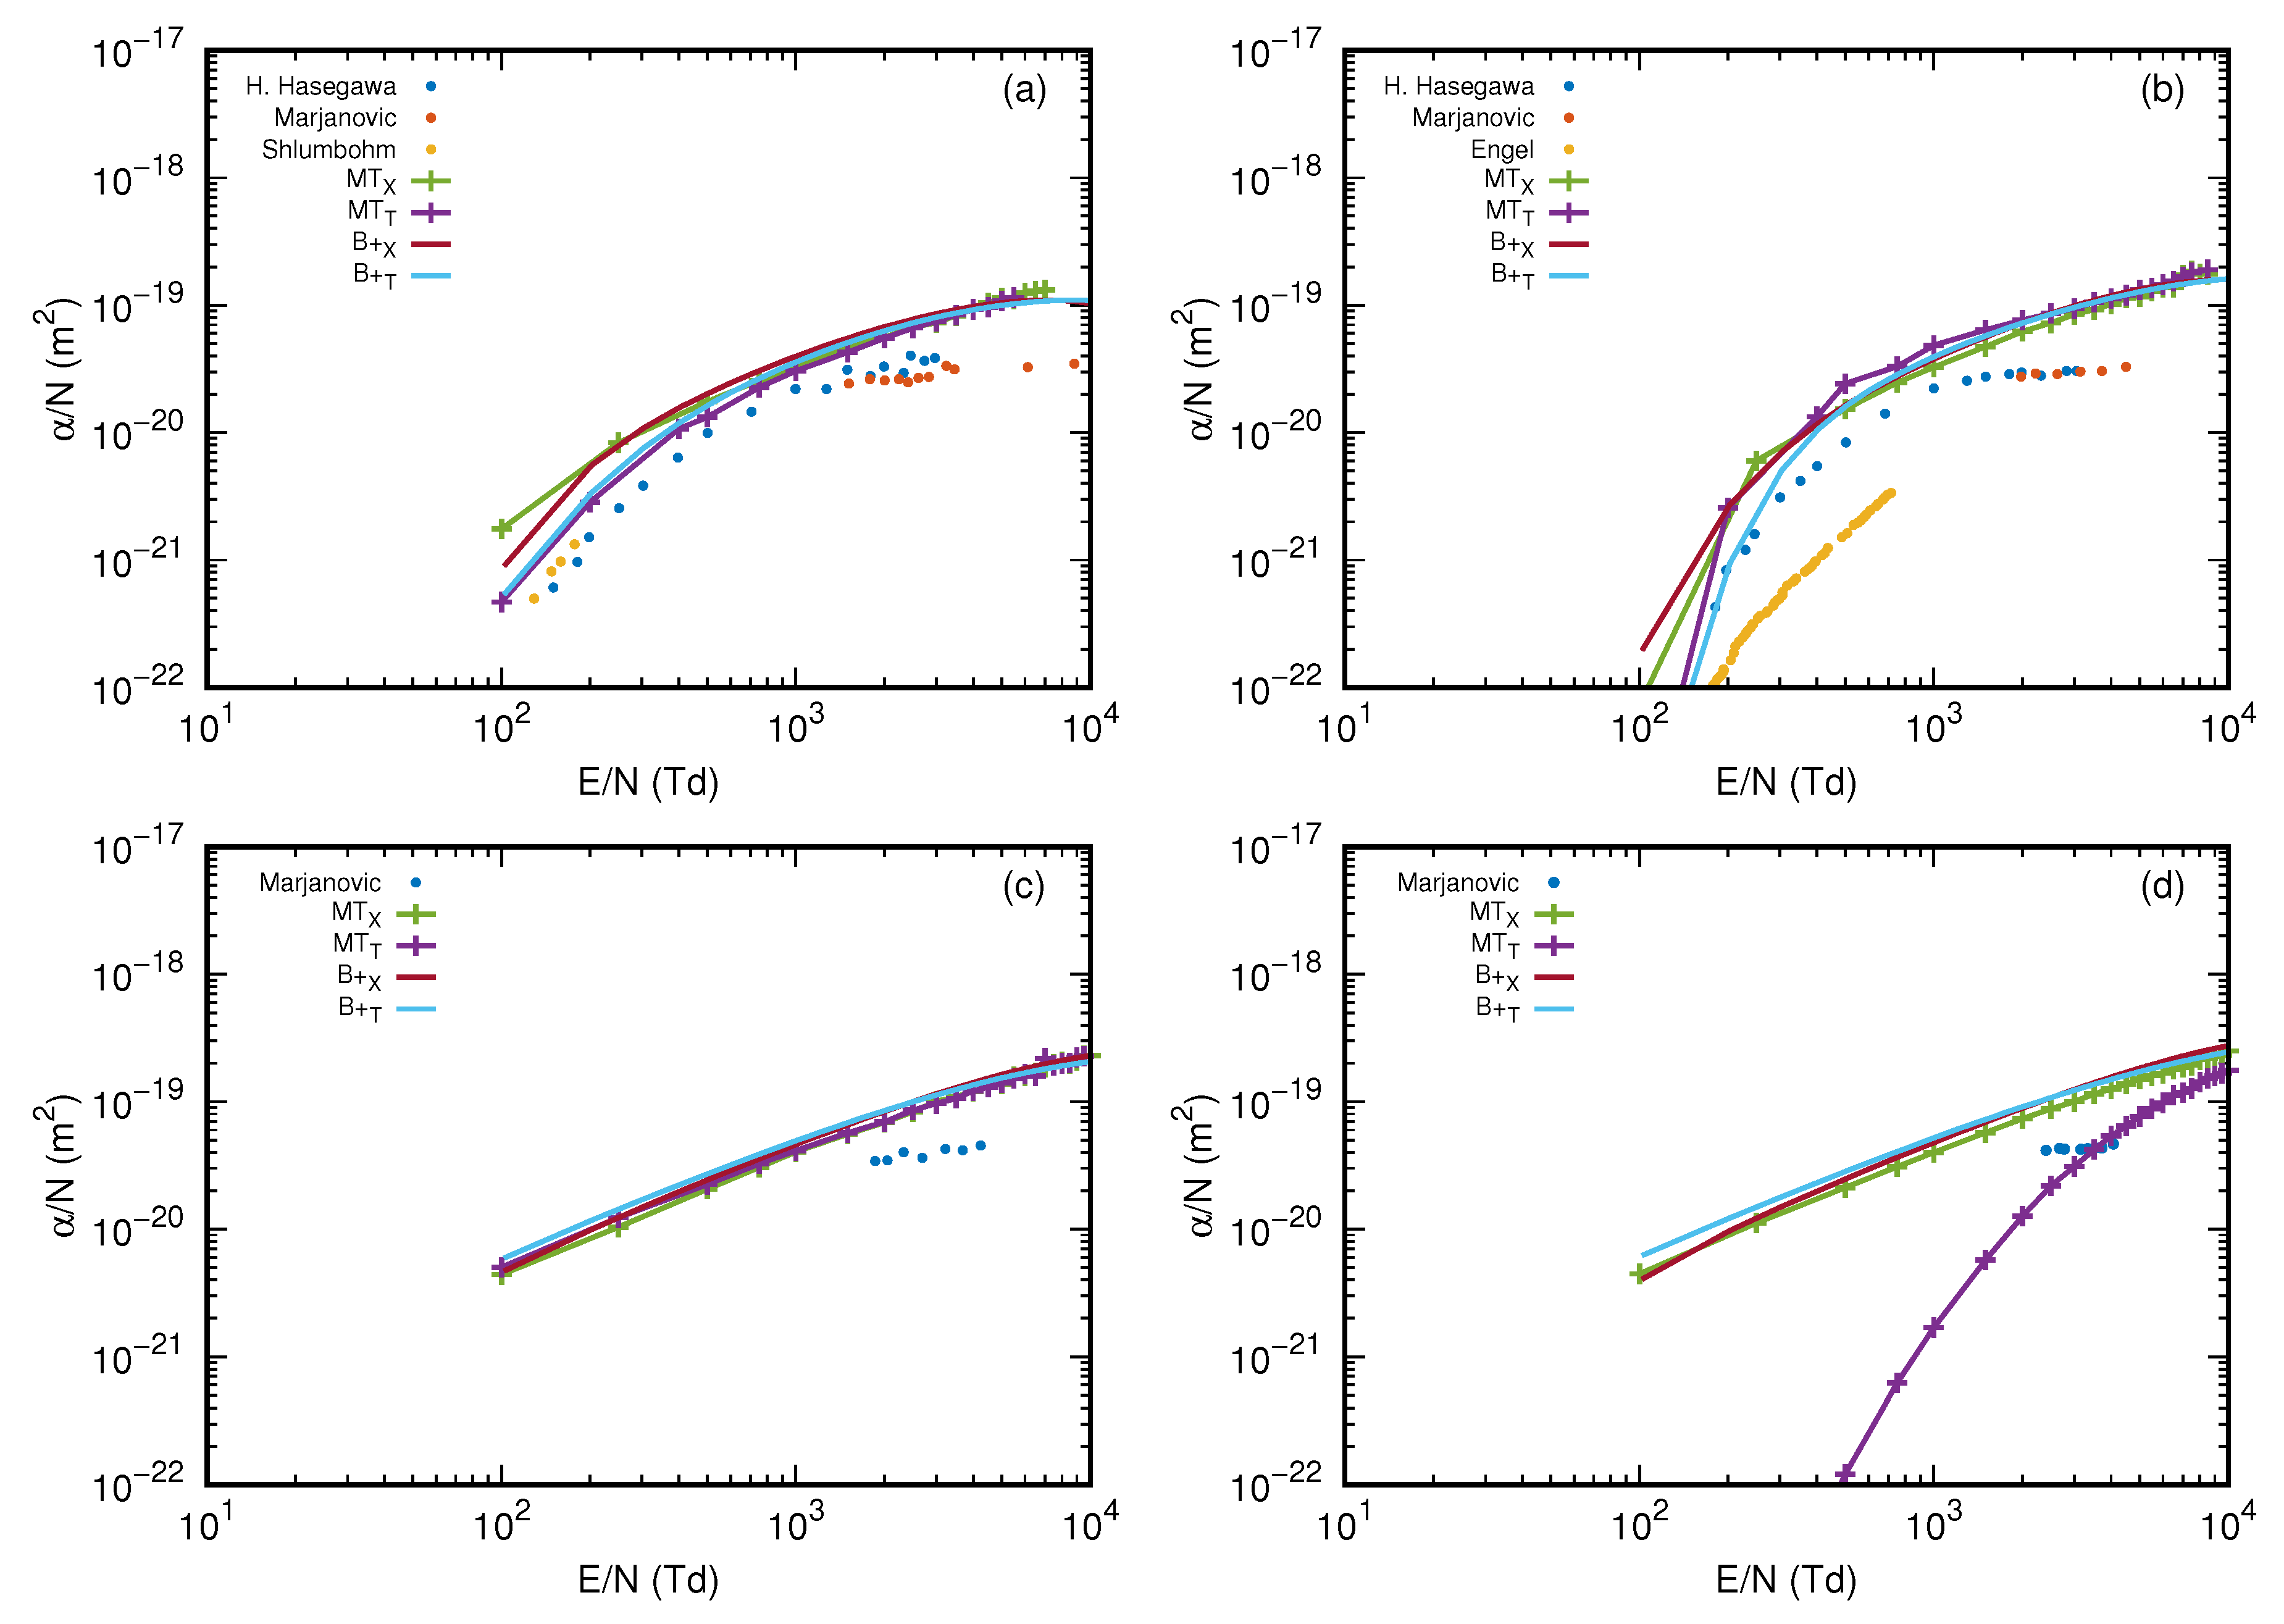
For the reduced ionization coefficient, we have experimental values reported in the literature for all the studied alcohols with E/N values from 130 Td and with a maximum of 8800 Td [37,40,41,42]. There is a good agreement in the profile of the obtained data presented in Figure 6 for methanol and ethanol which have a better-defined cross-section set in the range where the calculations were performed. The calculated values are higher than those experimentally obtained, and the sets of theoretical cross-sections presented a better agreement than the experimental ones, a fact already noted in the other parameters. It is worth mentioning the results acquired with BOLSIG+ for the Ethanol molecule, where the profile of the theoretical set for E/N up to 1000 Td agrees acceptably. a comparison between the experimentally determined data of Marjanovic and the calculated values of propanol and butanol molecules was conducted. The software-generated outcomes demonstrated a consistent overestimation of the corresponding experimental values. Another trend replicated by the calculations was the influence of the molecule size for methanol and ethanol the values are slightly lower than propanol and butanol in the same E/N range. The theoretical cross-section set for butanol when calculated using METHES showed a curve with much closer values, this set has cross-section values for excited and rotational states. To calculate the reduced ionization coefficient ( α /N) of METHES, Equation (14) was used
α = W 2 D L W 2 D L 2 ν e f f D L
where D L is the longitudinal diffusion coefficient, ν e f f is the effective ionization frequency (equal to ionization frequency minus attachment frequency), and W is the bulk drift velocity, which gives the velocity of the center-of-mass of the electron cloud, parameters already obtained and demonstrated [43].

4. Conclusions

This article presents calculations of the transport coefficients of alcohols using the BOLSIG+ and METHES software. The simulations employed both experimental and theoretical cross-sections for a more complete description of alcohol properties. Notably, the study reveals differences in the results obtained from the software and those from experimental and theoretical cross-sections. The theoretical results, comprising a wider energy range, closely approximate the values obtained from experiments involving electron swarm parameters, namely, drift velocity and reduced ionization coefficient. The study also emphasizes the importance of employing detailed cross-section sets in achieving reliable and accurate simulation results. The electron swarm procedure heavily relies on expert knowledge and entails labor-intensive iterative manual fine-tuning. Recent strides in artificial intelligence have shown promise in addressing this challenge [44,45]. In this paradigm, a substantial array of physically relevant cross-sections is generated, subsequently yielding swarm data corresponding to these cross-sections through the application of a Boltzmann solver. Neural networks can then establish an inverse correlation between swarm data and cross-sections. Notably, while the prospects of renormalization for enhancing predictive precision are acknowledged, its incorporation may potentially introduce intricacies beyond the initial research scope. Our focus was to assess extant cross-sections without introducing further complexities, with the overarching goal of providing a comprehensive evaluation of the prevailing data within the context of Bolsig+ and METHES frameworks. Furthermore, the data reported for the very first time are recommended for studies of electric discharges in mixtures containing the alcohols here studied, and similar technological applications.

Acknowledgments

Financial support from Conselho Nacional de Desenvolvimento Científico e Tecnológico (CNPq) and Coordenação de Aperfeiçoamento de Pessoal de Nível Superior (CAPES) - Finance Code 001 is acknowledged. We are grateful to Prof. M.C.A. Lopes for facilitating experimental values of cross sections used in this work.

Conflicts of Interest

The authors declare no conflict of interest to disclose.

References

  1. Alves, L.; Bartschat, K.; Biagi, S.; Bordage, M.; Pitchford, L.; Ferreira, C.; Hagelaar, G.; Morgan, W.; Pancheshnyi, S.; Phelps, A.; et al. Comparisons of sets of electron–neutral scattering cross sections and swarm parameters in noble gases: II. Helium and neon. J. Phys. D Appl. Phys. 2013, 46, 334002. [Google Scholar] [CrossRef]
  2. Yang, W.; Meng, X.; Zhou, Q.; Dong, Z. Boltzmann equation studies on electron swarm parameters in Townsend breakdown of copper vapor plasma using independently assessed electron-collision cross sections. AIP Adv. 2019, 9, 035041. [Google Scholar] [CrossRef]
  3. Alves, L.L. Fluid modelling of the positive column of direct-current glow discharges. Plasma Sources Sci. Technol. 2007, 16, 557. [Google Scholar] [CrossRef]
  4. Hagelaar, G.; Pitchford, L.C. Solving the Boltzmann equation to obtain electron transport coefficients and rate coefficients for fluid models. Plasma Sources Sci. Technol. 2005, 14, 722. [Google Scholar] [CrossRef]
  5. Longo, S.; Capitelli, M. A simple approach to treat anisotropic elastic collisions in Monte Carlo calculations of the electron energy distribution function in cold plasmas. Plasma Chem. Plasma Process. 1994, 14, 1–13. [Google Scholar] [CrossRef]
  6. Göktaş, M.; Balki, M.K.; Sayin, C.; Canakci, M. An evaluation of the use of alcohol fuels in SI engines in terms of performance, emission and combustion characteristics: A review. Fuel 2021, 286, 119425. [Google Scholar] [CrossRef]
  7. Münzer, A.; Xiao, L.; Sehlleier, Y.H.; Schulz, C.; Wiggers, H. All gas-phase synthesis of graphene: Characterization and its utilization for silicon-based lithium-ion batteries. Electrochim. Acta 2018, 272, 52–59. [Google Scholar] [CrossRef]
  8. Uchiyama, H.; Ishikawa, K.; Zhao, Q.L.; Andocs, G.; Nojima, N.; Takeda, K.; Krishna, M.C.; Ishijima, T.; Matsuya, Y.; Hori, M. others. Free radical generation by non-equilibrium atmospheric pressure plasma in alcohol–water mixtures: an EPR-spin trapping study. J. Phys. D Appl. Phys. 2018, 51, 095202. [Google Scholar] [CrossRef]
  9. Bodnar, W.; Schiorlin, M.; Frank, A.; Schulz, T.; Wöhrl, N.; Miron, C.; Scheu, C.; Kolb, J.; Kruth, A. Synthesis of graphene-related carbon nanoparticles from a liquid isopropanol precursor by a one-step atmospheric plasma process. Appl. Surf. Sci. 2020, 514, 145926. [Google Scholar] [CrossRef]
  10. Silva, D.; Tejo, T.; Muse, J.; Romero, D.; Khakoo, M.; Lopes, M. Total electron scattering cross sections for methanol and ethanol at intermediate energies. J. Phys. B At. Mol. Opt. Phys. 2009, 43, 015201. [Google Scholar] [CrossRef]
  11. da Silva, D.; Gomes, M.; Ghosh, S.; Silva, I.; Pires, W.; Jones, D.; Blanco, F.; Garcia, G.; Buckman, S.; Brunger, M.J.others. others. Total cross sections for electron scattering by 1-propanol at impact energies in the range 40-500 eV. J. Chem. Phys. 2017, 147, 194307. [Google Scholar] [CrossRef]
  12. Gomes, M.; Da Silva, D.; Fernandes, A.; Ghosh, S.; Pires, W.; Jones, D.; Blanco, F.; García, G.; Brunger, M.; Lopes, M. Electron scattering from 1-butanol at intermediate impact energies: Total cross sections. J. Chem. Phys. 2019, 150, 194307. [Google Scholar] [CrossRef]
  13. Nixon, K.; Pires, W.; Neves, R.; Duque, H.V.; Jones, D.; Brunger, M.; Lopes, M. Electron impact ionisation and fragmentation of methanol and ethanol. Int. J. Mass Spectrom. 2016, 404, 48–59. [Google Scholar] [CrossRef]
  14. Pires, W.; Nixon, K.; Ghosh, S.; Neves, R.; Duque, H.; Amorim, R.; Jones, D.; Blanco, F.; Garcia, G.; Brunger, M. others. Electron impact ionization of 1-propanol. Int. J. Mass Spectrom. 2017, 422, 32–41. [Google Scholar] [CrossRef]
  15. Ghosh, S.; Nixon, K.; Pires, W.; Amorim, R.; Neves, R.; Duque, H.V.; da Silva, D.; Jones, D.; Blanco, F.; Garcia, G. others. Electron impact ionization of 1-butanol: II. Total ionization cross sections and appearance energies. Int. J. Mass Spectrom. 2018, 430, 44–51. [Google Scholar] [CrossRef]
  16. Thomson, R.; Smith, K.; Davies, A. Boltz: A code to solve the transport equation for electron distributions and then calculate transport coefficients and vibrational excitation rates in gases with applied fields. Comput. Phys. Commun. 1976, 11, 369–383. [Google Scholar] [CrossRef]
  17. Rockwood, S.; Greene, A. Numerical solutions of the Boltzmann transport equation. Comput. Phys. Commun. 1980, 19, 377–393. [Google Scholar] [CrossRef]
  18. Morgan, W.; Penetrante, B. ELENDIF: A time-dependent Boltzmann solver for partially ionized plasmas. Comput. Phys. Commun. 1990, 58, 127–152. [Google Scholar] [CrossRef]
  19. Hagelaar, G. Brief documentation of BOLSIG+ version 03/2016. Laboratoire Plasma et Conversion dEnergie (LAPLACE), Universit Paul Sabatier 2016, 118. [Google Scholar]
  20. Dyatko, N.; Kochetov, I.; Napartovich, A.; Sukharev, A. EEDF: The software package for calculations of Electron Energy Distribution Function 2015.
  21. Rabie, M.; Franck, C. METHES: A Monte Carlo collision code for the simulation of electron transport in low temperature plasmas. Comput. Phys. Commun. 2016, 203, 268–277. [Google Scholar] [CrossRef]
  22. MAGBOLTZ, M. Fortran program. MAGBOLTZ, SF Biagi, Versions 2019, 8. [Google Scholar]
  23. Biagi, S. Monte Carlo simulation of electron drift and diffusion in counting gases under the influence of electric and magnetic fields. Nuclear Instruments and Methods in Physics Research Section A: Accelerators, Spectrometers, Detectors and Associated Equipment 1999, 421, 234–240. [Google Scholar] [CrossRef]
  24. Tejero-del Caz, A.; Guerra, V.; Gonçalves, D.; Da Silva, M.L.; Marques, L.; Pinhao, N.; Pintassilgo, C.; Alves, L. The LisbOn KInetics Boltzmann solver. Plasma Sources Sci. Technol. 2019, 28, 043001. [Google Scholar] [CrossRef]
  25. Pancheshnyi, S.; Biagi, S.; Bordage, M.; Hagelaar, G.; Morgan, W.; Phelps, A.; Pitchford, L. The LXCat project: Electron scattering cross sections and swarm parameters for low temperature plasma modeling. Chem. Phys. 2012, 398, 148–153. [Google Scholar] [CrossRef]
  26. Kumar, K. The physics of swarms and some basic questions of kinetic theory. Phys. Rep. 1984, 112, 319–375. [Google Scholar] [CrossRef]
  27. Robson, R.; Ness, K. Velocity distribution function and transport coefficients of electron swarms in gases: spherical-harmonics decomposition of Boltzmann’s equation. Phys. Rev. A 1986, 33, 2068. [Google Scholar] [CrossRef]
  28. Fraser, G.; Mathieson, E. Monte Carlo calculation of electron transport coefficients in counting gas mixtures: I. Argon-methane mixtures. Nuclear Instruments and Methods in Physics Research Section A: Accelerators, Spectrometers, Detectors and Associated Equipment 1986, 247, 544–565. [Google Scholar] [CrossRef]
  29. An, Y.; Su, M.; Hu, Y.; Hu, S.; Huang, T.; He, B.; Yang, M.; Yin, K.; Lin, Y. The Influence of Humidity on Electron Transport Parameters and Insulation Performance of Air. Front. Energy Res. 2022, 9. [Google Scholar] [CrossRef]
  30. Varela, K.; Hargreaves, L.; Ralphs, K.; Khakoo, M.; Winstead, C.; McKoy, V.; Rescigno, T.; Orel, A. Excitation of the 4 lowest electronic transitions in methanol by low-energy electrons. J. Phys. At. Mol. Opt. Phys. 2015, 48, 115208. [Google Scholar] [CrossRef]
  31. Hargreaves, L.; Khakoo, M.; Winstead, C.; McKoy, V. Excitation of the lowest electronic transitions in ethanol by low-energy electrons. J. Phys. At. Mol. Opt. Phys. 2016, 49, 185201. [Google Scholar] [CrossRef]
  32. Bharadvaja, A.; Kaur, S.; Baluja, K.L. Study of electron collision from bioalcohols from 10 to 5000 eV. Eur. Phys. J. D 2019, 73, 1–11. [Google Scholar] [CrossRef]
  33. Stephens, J. A multi-term Boltzmann equation benchmark of electron-argon cross-sections for use in low temperature plasma models. J. Phys. D Appl. Phys. 2018, 51, 125203. [Google Scholar] [CrossRef]
  34. Haefliger, P.; Franck, C. Detailed precision and accuracy analysis of swarm parameters from a pulsed Townsend experiment. Rev. Sci. Instruments 2018, 89, 023114. [Google Scholar] [CrossRef]
  35. Vialetto, L.; Longo, S.; Diomede, P. Benchmark calculations for electron velocity distribution function obtained with Monte Carlo Flux simulations. Plasma Sources Sci. Technol. 2019, 28, 115015. [Google Scholar] [CrossRef]
  36. Mirić, J.; Bošnjaković, D.; Simonović, I.; Petrović, Z.L.; Dujko, S. Electron swarm properties under the influence of a very strong attachment in SF6 and CF3I obtained by Monte Carlo rescaling procedures. Plasma Sources Sci. Technol. 2016, 25, 065010. [Google Scholar] [CrossRef]
  37. Hasegawa, H.; Date, H. Study of electron transport in hydrocarbon gases. J. Appl. Phys. 2015, 117, 133302. [Google Scholar] [CrossRef]
  38. Cottrell, T.; Pollock, W.; Walker, I.C. Electron drift velocities in quadrupolar and polar gases. Trans. Faraday Soc. 1968, 64, 2260–2266. [Google Scholar] [CrossRef]
  39. Peisert, A.; Sauli, F. Drift and diffusion of electrons in gases: a compilation (with an introduction to the use of computing programs). Technical report, Cern. 1984. [Google Scholar]
  40. Marjanović, J.; Marić, D.; Malović, G.; Petrović, Z.L. Effective ionization coefficients for low current dc discharges in alcohol vapours at low pressure. Eur. Phys. J. D 2021, 75, 1–7. [Google Scholar] [CrossRef]
  41. Schlumbohm, H.; Angew, Z. Physik 1959, 11, 156–159.
  42. von Engel, A. Ionized Gases; Clarendon Press 1965, p. 325.
  43. Vass, M.; Korolov, I.; Loffhagen, D.; Pinhao, N.; Donkó, Z. Electron transport parameters in CO2: scanning drift tube measurements and kinetic computations. Plasma Sources Sci. Technol. 2017, 26, 065007. [Google Scholar] [CrossRef]
  44. Stokes, P.W.; Casey, M.J.; Cocks, D.G.; de Urquijo, J.; García, G.; Brunger, M.J.; White, R.D. Self-consistent electron–THF cross sections derived using data-driven swarm analysis with a neural network model. Plasma Sources Sci. Technol. 2020, 29, 105008. [Google Scholar] [CrossRef]
  45. Jetly, V.; Chaudhury, B. Extracting electron scattering cross sections from swarm data using deep neural networks. Mach. Learn. Sci. Technol. 2021, 2, 035025. [Google Scholar] [CrossRef]
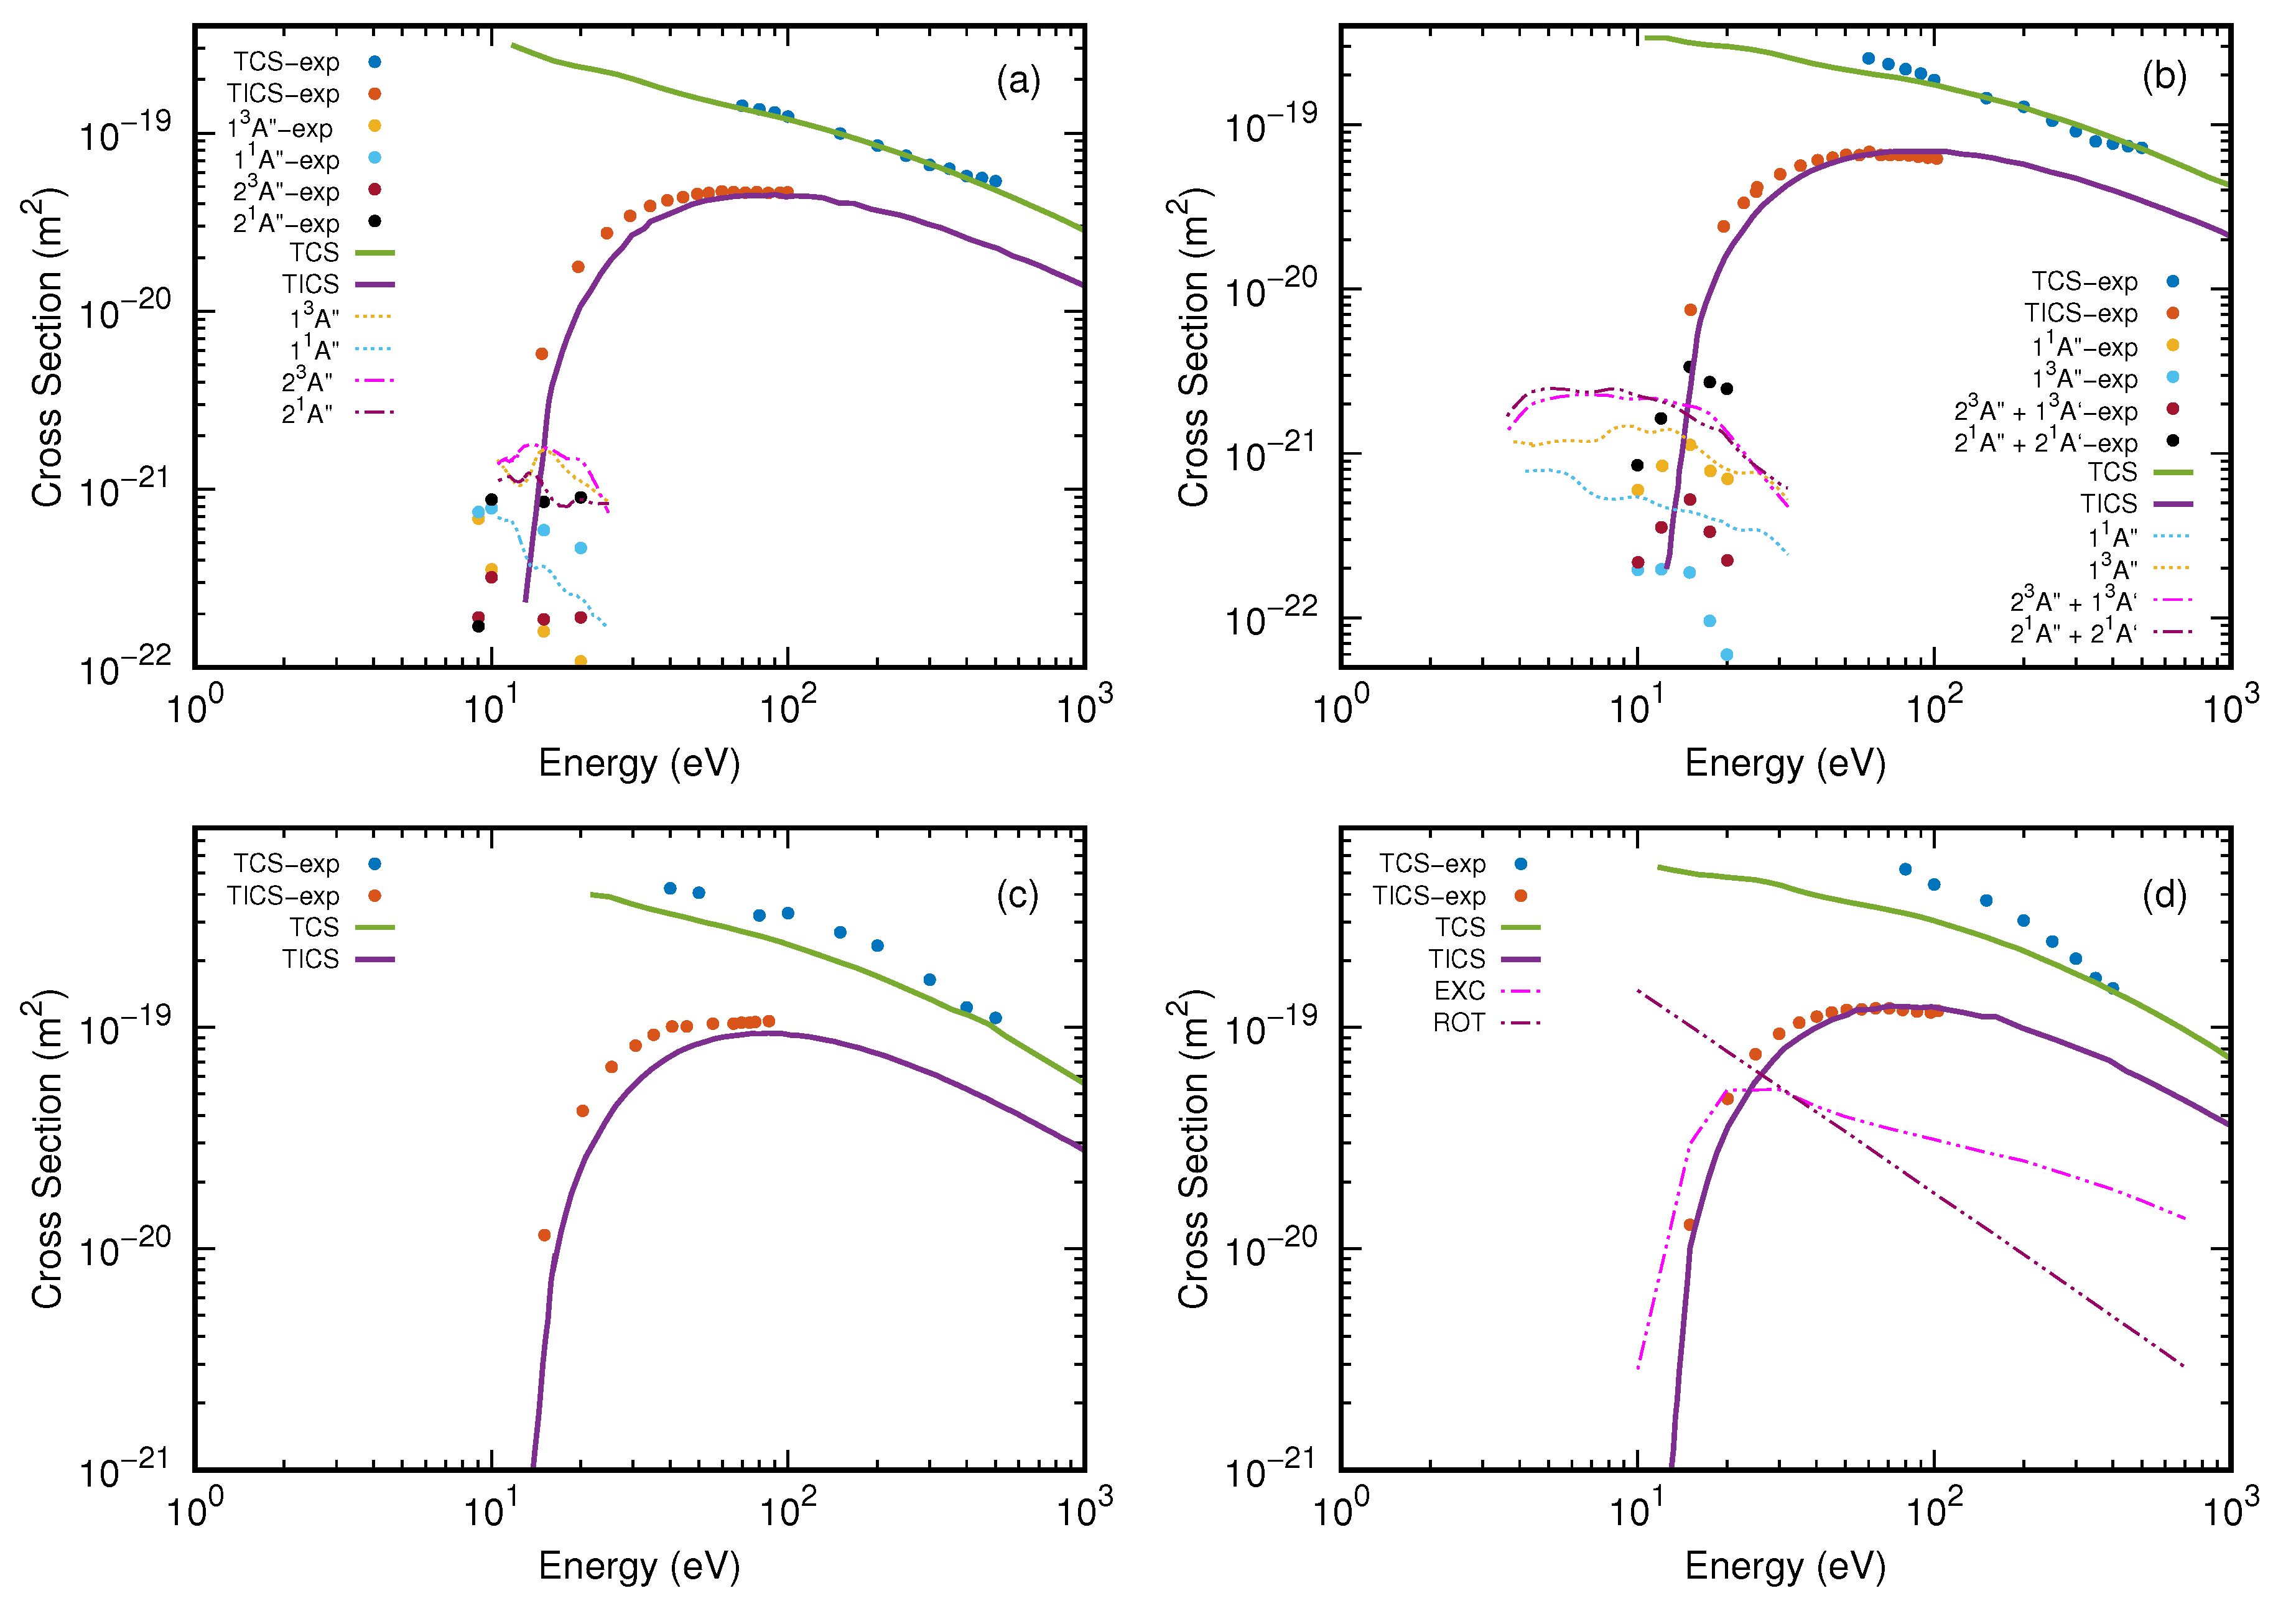
Figure 1. Set of cross-sections, Total Cross Section (TCS), Total Ionization Cross Sections (TICS), integral electron impact excitation states. Solid circles experimental data, Solid lines, and dashed lines theoretical data. (a) Methanol, (b) Ethanol, (c) Propanol, (d) Butanol.
Preprints 86378 g001
Figure 2. EEDF in (a) Methanol, (b) Ethanol, (c) Propanol, (d) Butanol as a function of Electron energy (eV) for reduced fields 10 2 Td, 10 3 Td e 10 4 Td, (solid lines from BOLSIG+ (B+), and solid line-point from METHES (MT), subscript (T) theoretical and (X) experimental data set cross-section)
Preprints 86378 g002
Figure 3. Diffusion Coefficient for (a) Methanol, (b) Ethanol, (c) Propanol, (d) Butanol as a function of E/N, (solid lines from BOLSIG+ (B+), and solid line-point from METHES (MT), subscript (T) theoretical and (X) experimental data set cross-section, (B) Bulk and (F) Flux Diffusion Coefficient from METHES, (LB) Bulk Longitudinal and (TB) Bulk Transversal Diffusion Coefficient from BOLSIG+).
Preprints 86378 g003
Figure 4. Mean energy for (a) Methanol, (b) Ethanol, (c) Propanol, (d) Butanol as a function of E/N, (solid lines from BOLSIG+ (B+), and solid circle from METHES (MT), subscript (T) theoretical data set and subscript (X) experimental data set cross-section).
Preprints 86378 g004
Figure 5. Drift velocity for (a) Methanol, (b) Ethanol, (c) Propanol, (d) Butanol as a function of E/N, (solid lines from BOLSIG+ (B+), and solid line-point from METHES (MT), subscript (T) theoretical and (X) experimental data set cross-section, (B) Bulk and (F) Flux Drift velocity, solid circles experimental data from Hasegawa and Date [37].
Preprints 86378 g005
Figure 6. Reduced ionization coefficient for (a) Methanol, (b) Ethanol, (c) Propanol, (d) Butanol as a function of E/N. (solid lines from BOLSIG+ (B+), and solid line-point from METHES (MT), subscript (T) theoretical and (X) experimental data set cross-section, solid circles experimental data from Hasegawa and Date [37], Marjanović et al. [40], Schlumbohm and Angew [41] and Engel [42]
Preprints 86378 g006
Disclaimer/Publisher’s Note: The statements, opinions and data contained in all publications are solely those of the individual author(s) and contributor(s) and not of MDPI and/or the editor(s). MDPI and/or the editor(s) disclaim responsibility for any injury to people or property resulting from any ideas, methods, instructions or products referred to in the content.
Copyright: This open access article is published under a Creative Commons CC BY 4.0 license, which permit the free download, distribution, and reuse, provided that the author and preprint are cited in any reuse.
Prerpints.org logo

Preprints.org is a free preprint server supported by MDPI in Basel, Switzerland.

Subscribe

© 2024 MDPI (Basel, Switzerland) unless otherwise stated