Submitted:
28 September 2023
Posted:
29 September 2023
You are already at the latest version
Abstract
Keywords:
1. Introduction
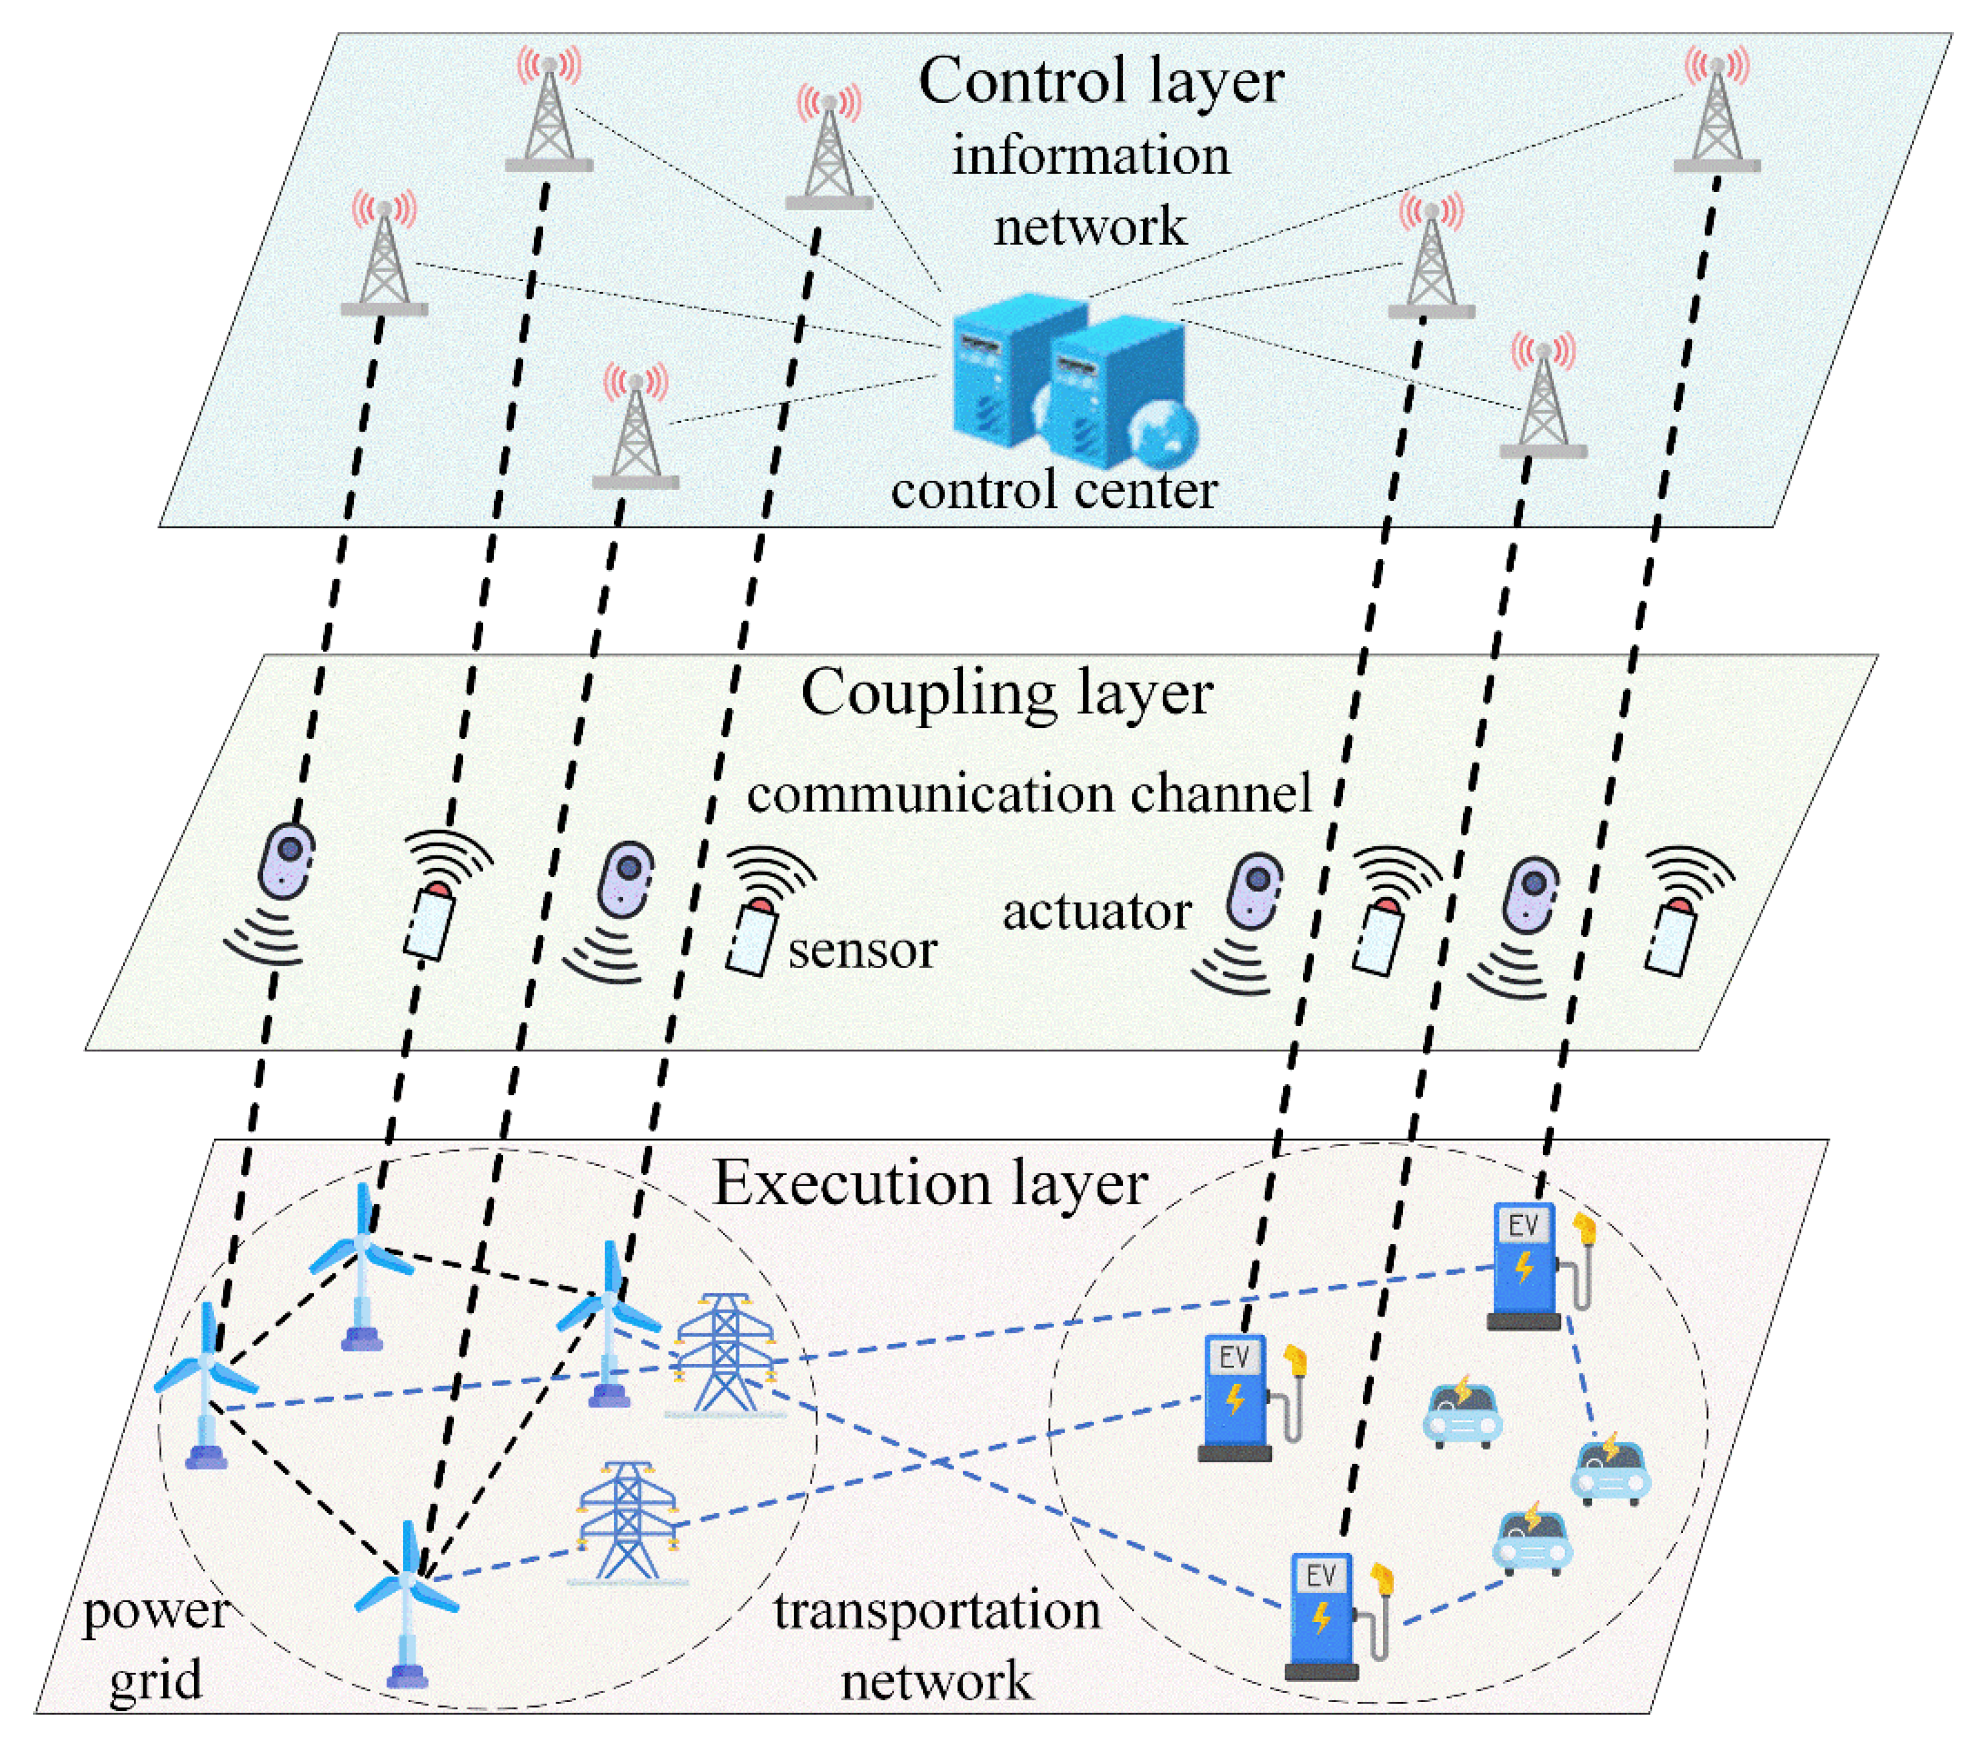
- Focusing on the charging behavior of electric vehicles, a TNCS model is established to reveal the underlying interaction mechanisms.
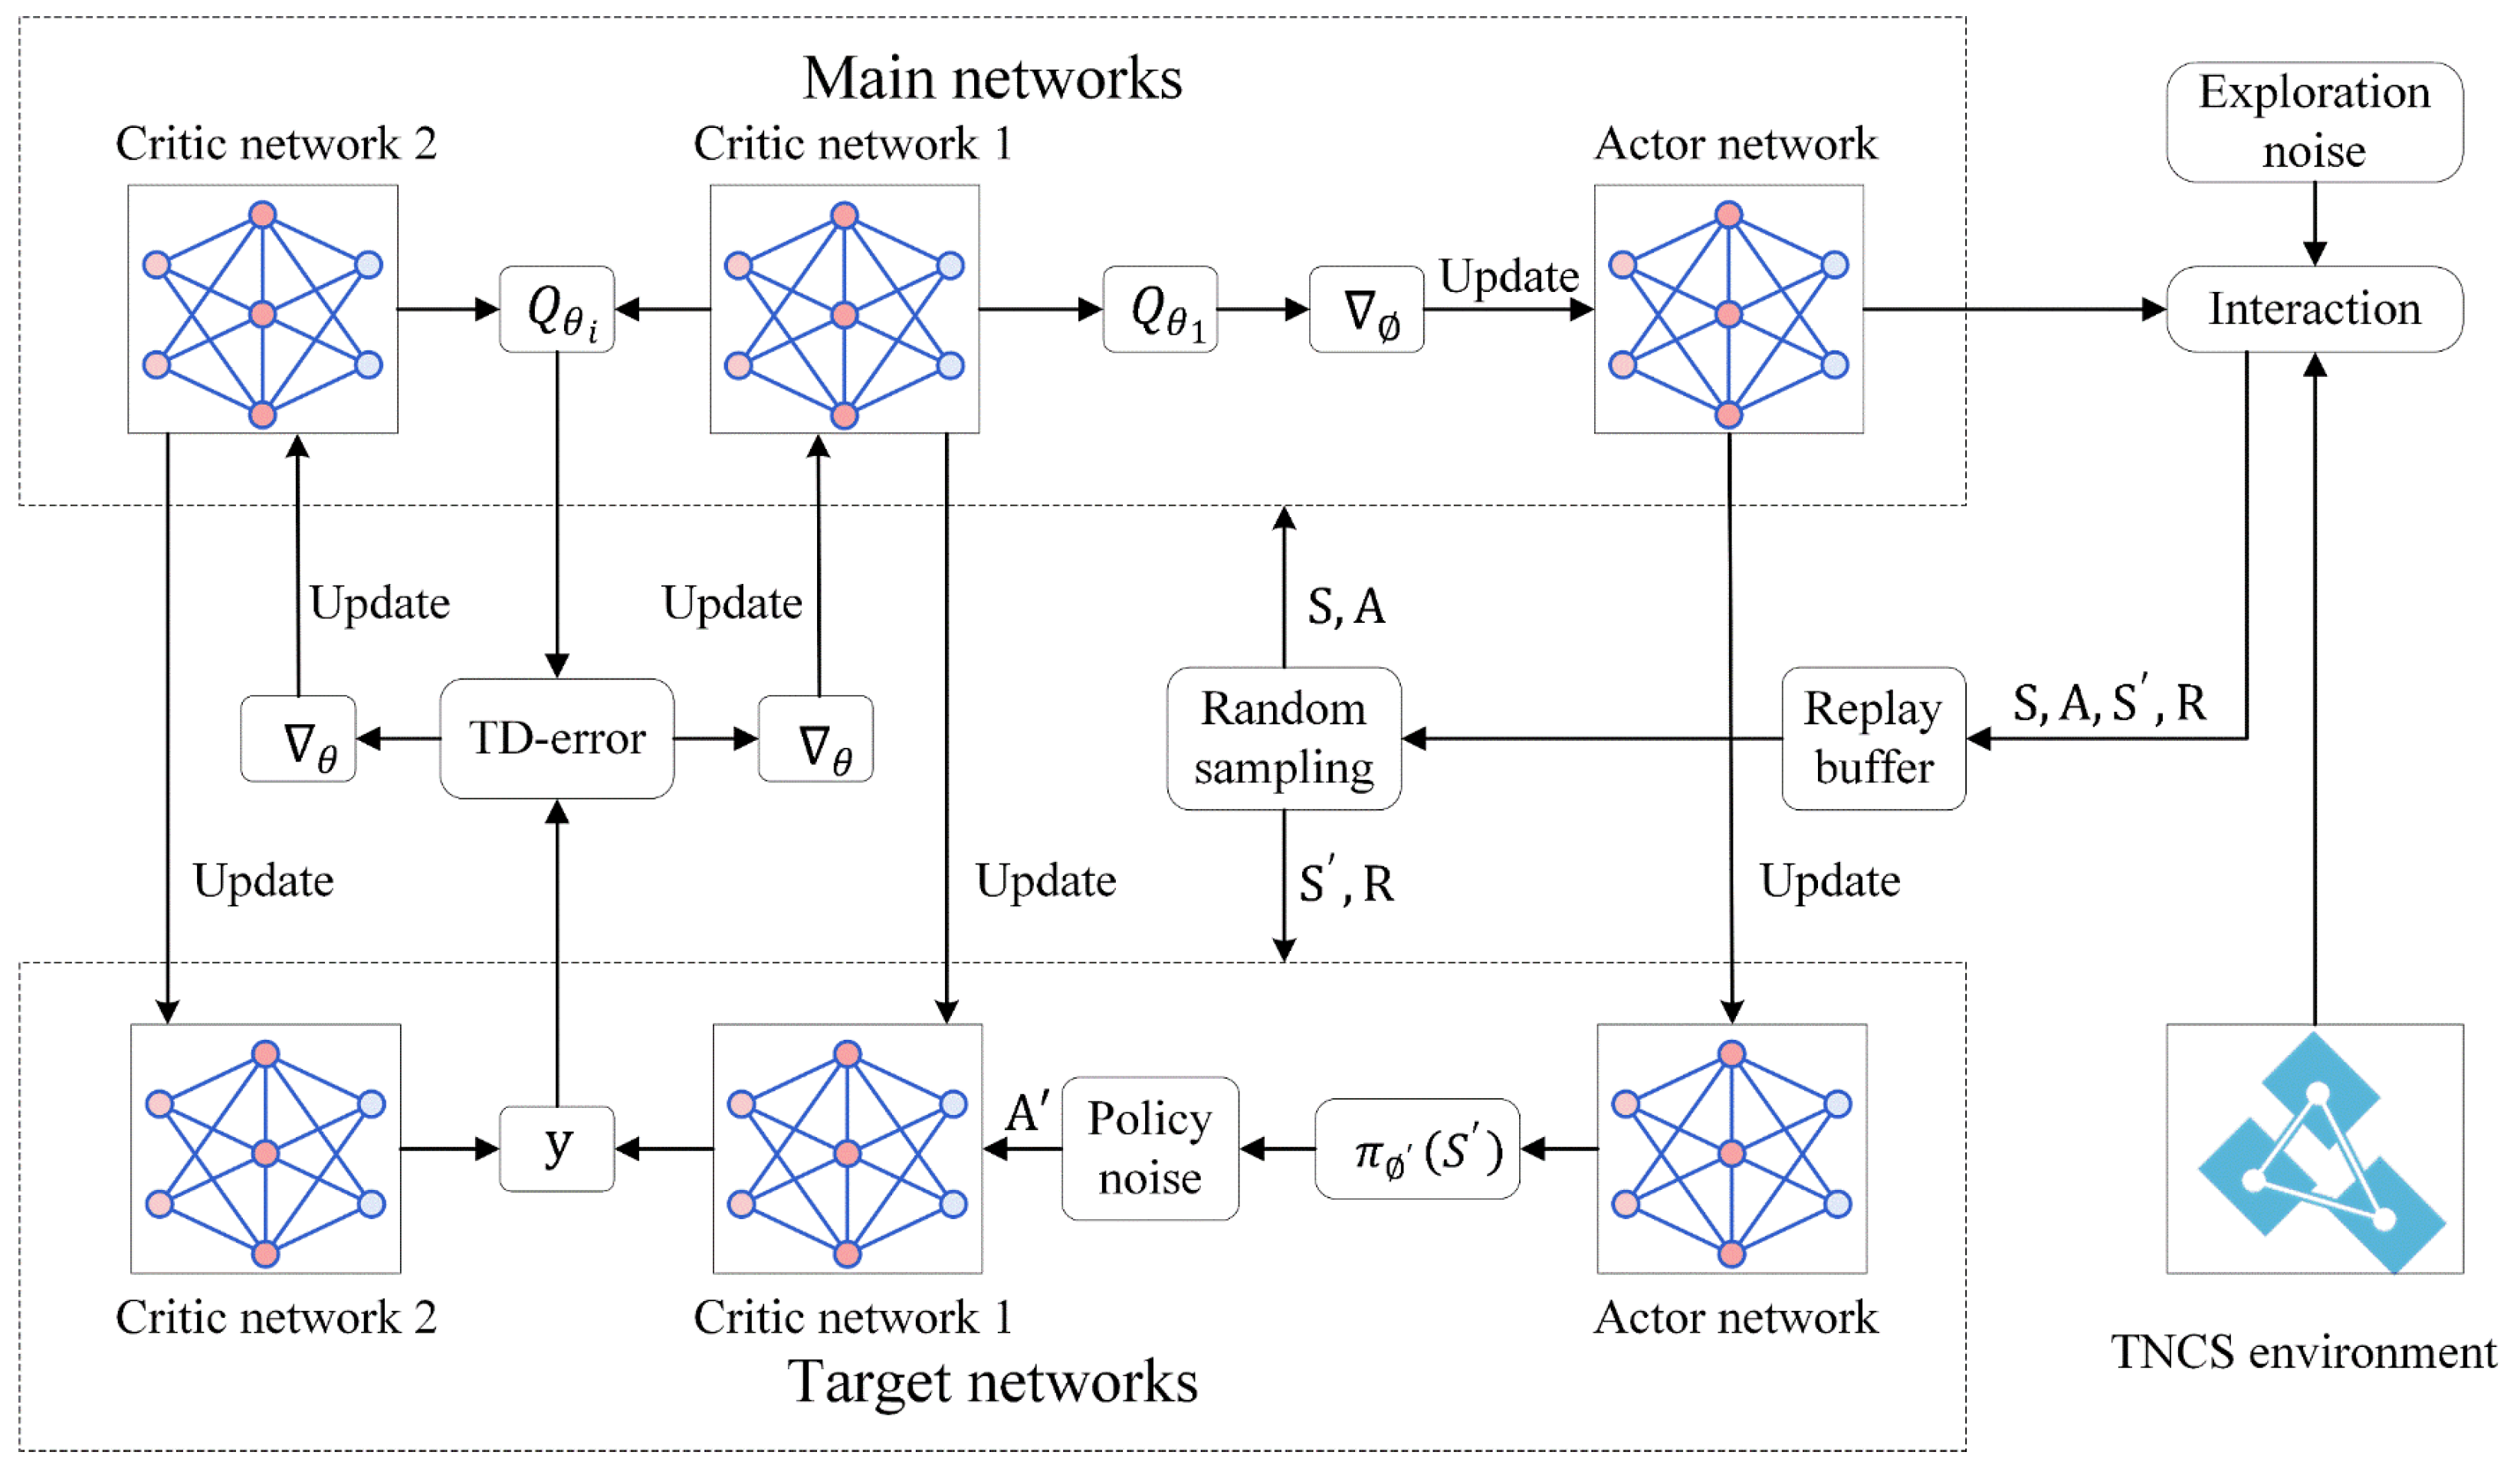
- An efficient fault recovery method for TNCS is proposed, incorporating an improved TD3 algorithm and considering communication delays. By designing and improving the TD3 algorithm, the uncertainties and security issues in the restoration process are considered, leading to the design of an effective recovery algorithm. In addition, the resilience of the algorithm is evaluated by introducing DoS attacks in the context of power grid faults. Lastly, the efficacy of the proposed recovery method is demonstrated through simulation experiments.
2. Methods
2.1. Modeling
2.1.1. Overall Framework
2.1.2. Execution Layer
2.1.3. Coupling Layer
2.1.4. Control Layer
2.2. Fault Recovery Method
2.2.1. Design of Restoration Model
2.2.2. Design of Restoration Algorithm
3. Experiments and Results
3.1. Experimental Settings
3.2. Small-scale Power Grid Faults
3.3. Large-scale Power Grid Faults
3.4. Communication Faults
4. Conclusions
Author Contributions
Acknowledgments
Conflicts of Interest
References
- Yang, T.; Guo, Q.; Sheng, Y. Urban integrated electric-traffic network collaboration from perspective of system coordination. Automation of Electric Power Systems 2020, 44, 1–9. [Google Scholar]
- He, Z.; Xiang, Y.; Liao, K. Demand, form and key technologies of integrated development of energy-transport-information networks. Automation of Electric Power Systems 2021, 45, 73–86. [Google Scholar]
- Hu, Q.; Ding, H.; Chen, X. Analysis on rotating power outage in California, USA in 2020 and its enlightenment to power grid of China. Automation of Electric Power Systems 2020, 44, 11–18. [Google Scholar]
- Sun, H.; Xu, T.; Guo, Q. Analysis on blackout in Great Britain power grid on August 9th, 2019 and its enlightenment to power grid in China. Proceedings of the CSEE 2019, 39, 6183–6192. [Google Scholar]
- Zhang, Y.; Xie, G.; Zhang, Q. Analysis of 2·15 power outage in Texas and its implications for the power sector of China. Electric Power 2021, 54, 192–198. [Google Scholar]
- Yan, D.; Wen, J.; Du, Z. Analysis of Texas blackout in 2021 and its enlightenment to power system planning management. Power System Protection and Control 2021, 49, 121–128. [Google Scholar]
- Hu, Y.; Xue, S.; Zhang, H. Cause analysis and enlightenment of global blackouts in the past 30 years. Electric Power 2021, 54, 204–210. [Google Scholar]
- Wu, J.; Chen, Z.; Zhang, Y. Sequential recovery of complex networks suffering from cascading failure blackouts. IEEE Transactions on Network Science and Engineering 2020, 7, 2997–3007. [Google Scholar] [CrossRef]
- Han, O.; Chen, Z.; Ding, T. Power system black-start restoration model considering wind power uncertainties[J/OL]. Power System Technology 2022, 1–15. [Google Scholar]
- Pang, K.; Wang, Y.; Wen, F. Cyberphysical collaborative restoration strategy for power transmission system with communication failures. Automation of Electric Power Systems 2021, 45, 58–67. [Google Scholar]
- Li, Z.; Xue, Y.; Wang, H. A dynamic partitioning method for power system parallel restoration considering restoration-related uncertainties. Energy Reports 2020, 6, 352–361. [Google Scholar] [CrossRef]
- Arif, A.; Wang, Z.; Wang, J. Power distribution system outage management with co-optimization of repairs, reconfiguration, and DG dispatch. IEEE Transactions on Smart Grid 2017, 9, 4109–4118. [Google Scholar] [CrossRef]
- Liu, T.; Zhu, Y.; Sun, R. Resilience-enhanced-strategy for cyber-physical power system under extreme natural disasters. Automation of Electric Power Systems 2021, 45, 40–48. [Google Scholar]
- Sun, L.; Liu, W.; Chung, C. Improving the restorability of bulk power systems with the implementation of a WF-BESS system. IEEE Transactions on Power Systems 2018, 34, 2366–2377. [Google Scholar] [CrossRef]
- Yang, Z.; Sun, L.; Ding, M. Optimization strategy for start-up sequence of generation units considering critical restoration paths. Electric Power Construction 2019, 40, 28–35. [Google Scholar]
- Xiang, Y.; Ding, Z.; Zhang, Y. Power system reliability evaluation considering load redistribution attacks. IEEE Transactions on Smart Grid 2016, 8, 889–901. [Google Scholar] [CrossRef]
- Che, L.; Liu, X.; Shuai, Z. Cyber cascades screening considering the impacts of false data injection attacks. IEEE Transactions on Power Systems 2018, 33, 6545–6556. [Google Scholar] [CrossRef]
- Che, L.; Liu, X.; Li, Z. False data injection attacks induced sequential outages in power systems. IEEE Transactions on Power Systems 2018, 34, 1513–1523. [Google Scholar] [CrossRef]
- Wang, Q.; Pipattanasomporn, M.; Kuzlu, M. Framework for vulnerability assessment of communication systems for electric power grids. IET Generation, Transmission & Distribution 2016, 10, 477–486. [Google Scholar]
- Huseinović, A.; Mrdović, S.; Bicakci, K. A survey of denial-of-service attacks and solutions in the smart grid. IEEE Access 2020, 8, 177447–177470. [Google Scholar] [CrossRef]
- Tan, S.; Sun, J.; Wan, L. A DoS attack intensity-aware adaptive critic design of frequency regulation for EV-integrated power grids. International Journal of Electrical Power & Energy Systems 2023, 145, 108656. [Google Scholar]
- Li, X.; Jiang, C.; Du, D. A Novel State Estimation Method for Smart Grid Under Consecutive Denial of Service Attacks. IEEE Systems Journal 2022, 17, 513–524. [Google Scholar] [CrossRef]
- Zhang, B.; Dou, C.; Yue, D. Attack-defense evolutionary game strategy for uploading channel in consensus-based secondary control of islanded microgrid considering DoS attack. IEEE Transactions on Circuits and Systems I: Regular Papers 2021, 69, 821–834. [Google Scholar] [CrossRef]
- Gao, Q.; Du, Z.; Gi, Y. Resilient load frequency control for multi-area interconnected power system under denial-of-service attacks. Electric Power Construction 2023, 44, 54–62. [Google Scholar]
- An, X.; Sun, H.; Zhang, X. Analysis and lessons of Texas power outage event on February 15, 2021. Proceedings of the CSEE 2021, 41, 3407–3415. [Google Scholar]
- Li, M.; Sun, L.; Ma, Y. An optimization strategy for generator start-up sequence after blackouts considering the cyber system fault. Electric Power 2022, 55, 146–155. [Google Scholar]
- Fujimoto, S.; Hoof, H.; Meger, D. Addressing function approximation error in actor-critic methods[C]//International conference on machine learning. PMLR, 2018: 1587-1596.
- Xie, S.; Girshick, R.; Dollár, P. Aggregated residual transformations for deep neural networks[C]//Proceedings of the IEEE conference on computer vision and pattern recognition. 2017: 1492-1500.
- Wang, Q.; Wu, B.; Zhu, P. ECA-Net: Efficient channel attention for deep convolutional neural networks[C]//Proceedings of the IEEE/CVF conference on computer vision and pattern recognition. 2020: 11534-11542.
- Mnih, V.; Kavukcuoglu, K.; Silver, D. Human-level control through deep reinforcement learning. nature 2015, 518, 529–533. [Google Scholar] [CrossRef]
- Sutton, R.S.; McAllester, D.; Singh, S. Policy gradient methods for reinforcement learning with function approximation. Advances in neural information processing systems 1999, 12. [Google Scholar]
- Lillicrap, T.P.; Hunt, J.J.; Pritzel, A. Continuous control with deep reinforcement learning. arXiv preprint arXiv:1509.02971, 2015.
- Liu, Y.; Gu, X. Skeleton-network reconfiguration based on topological characteristics of scale-free networks and discrete particle swarm optimization. IEEE Transactions on Power Systems 2007, 22, 1267–1274. [Google Scholar] [CrossRef]
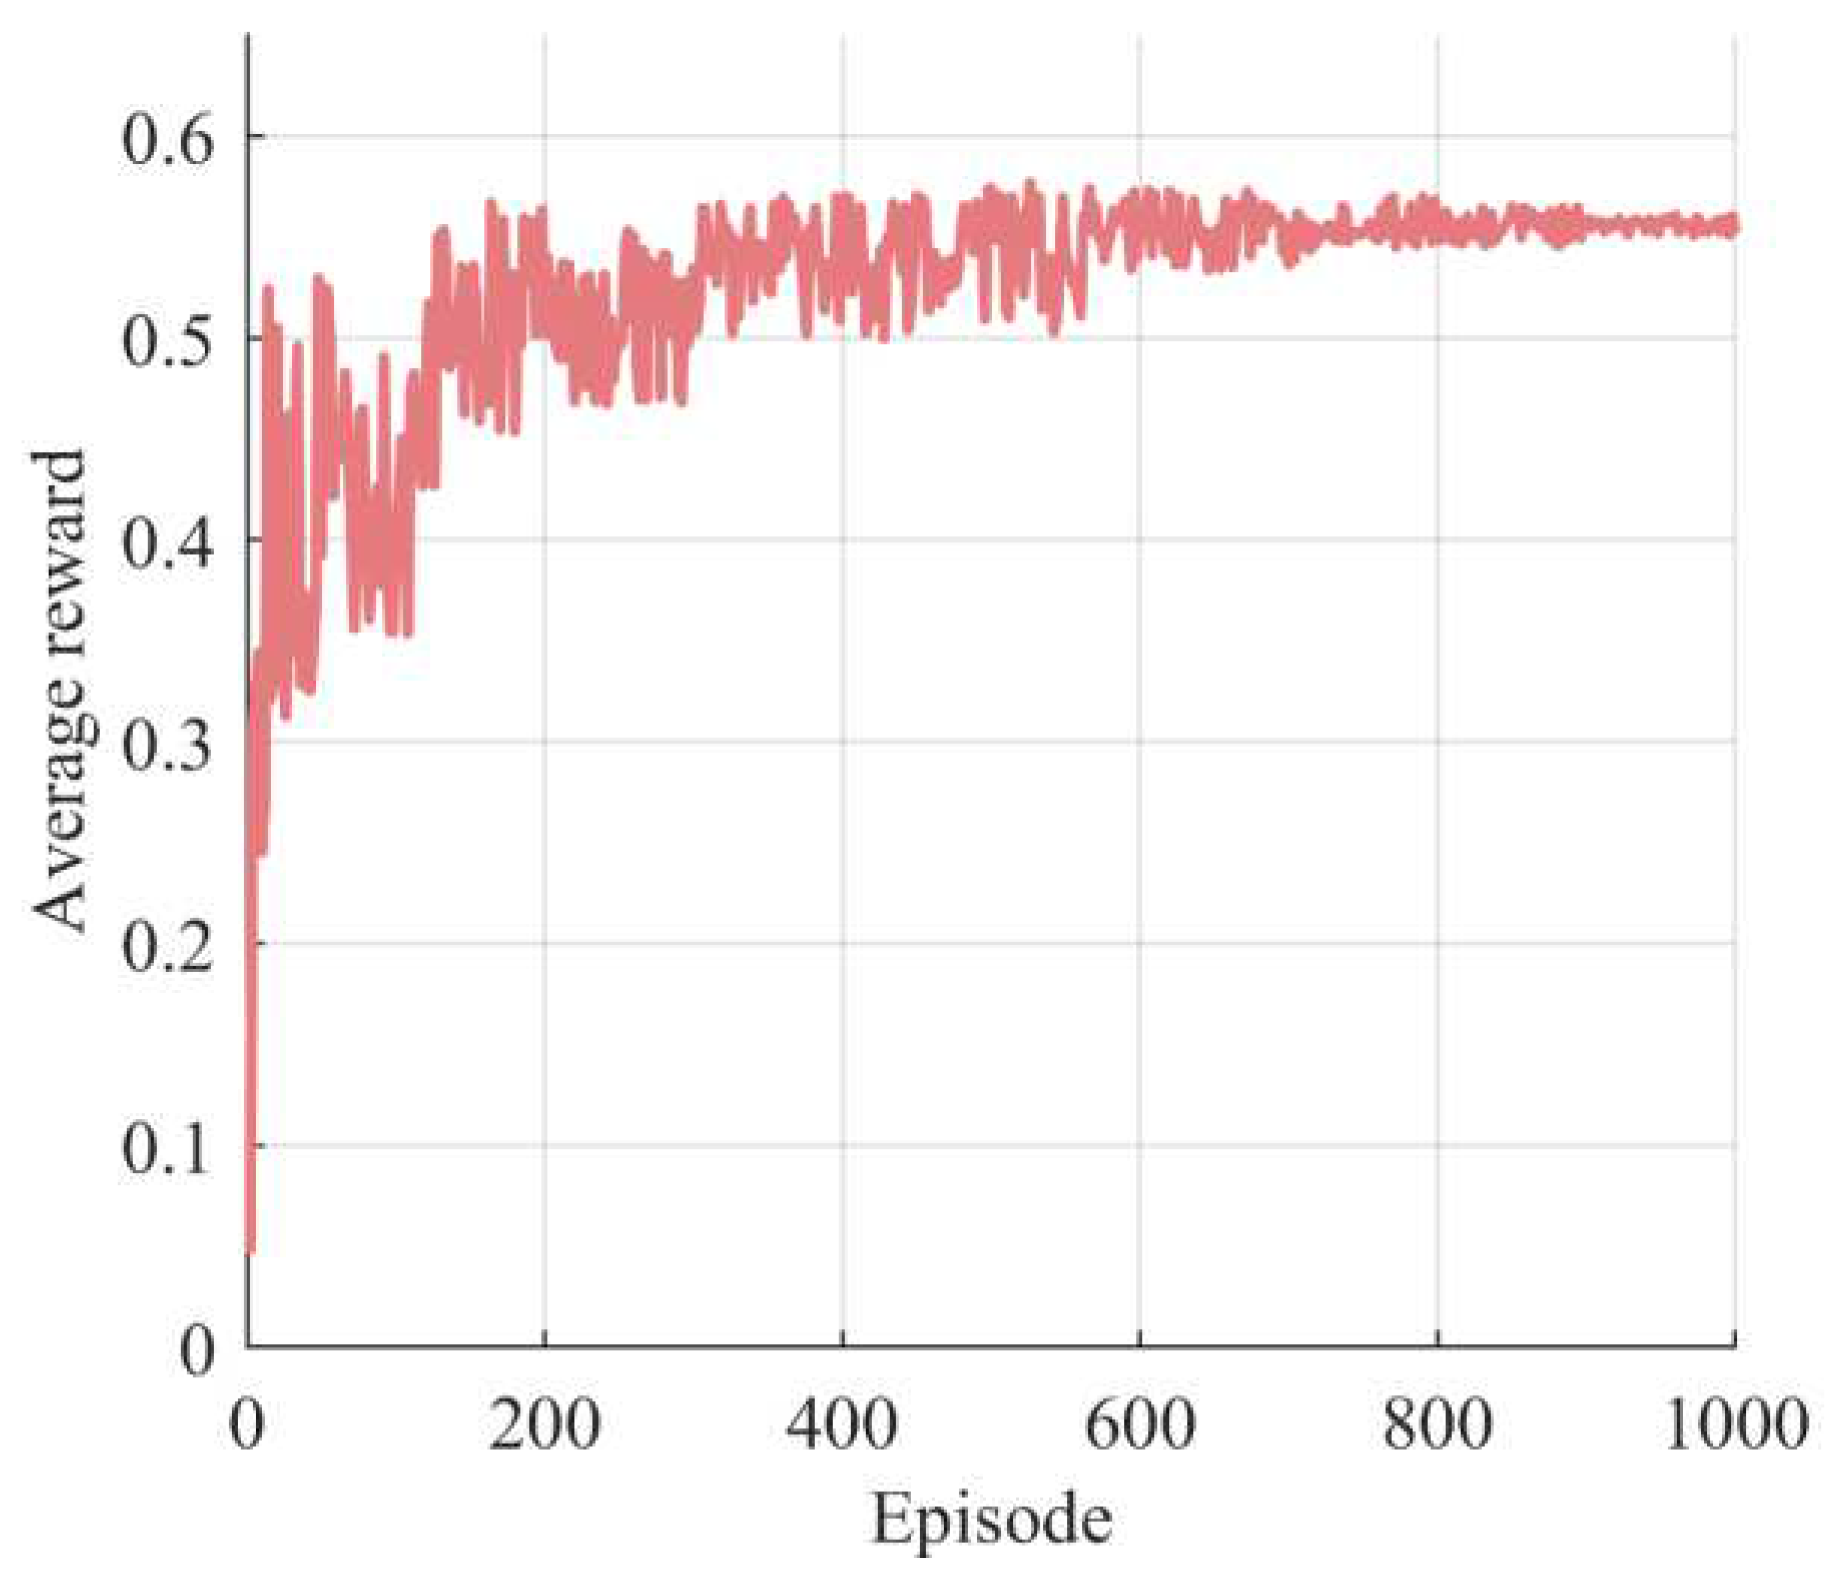
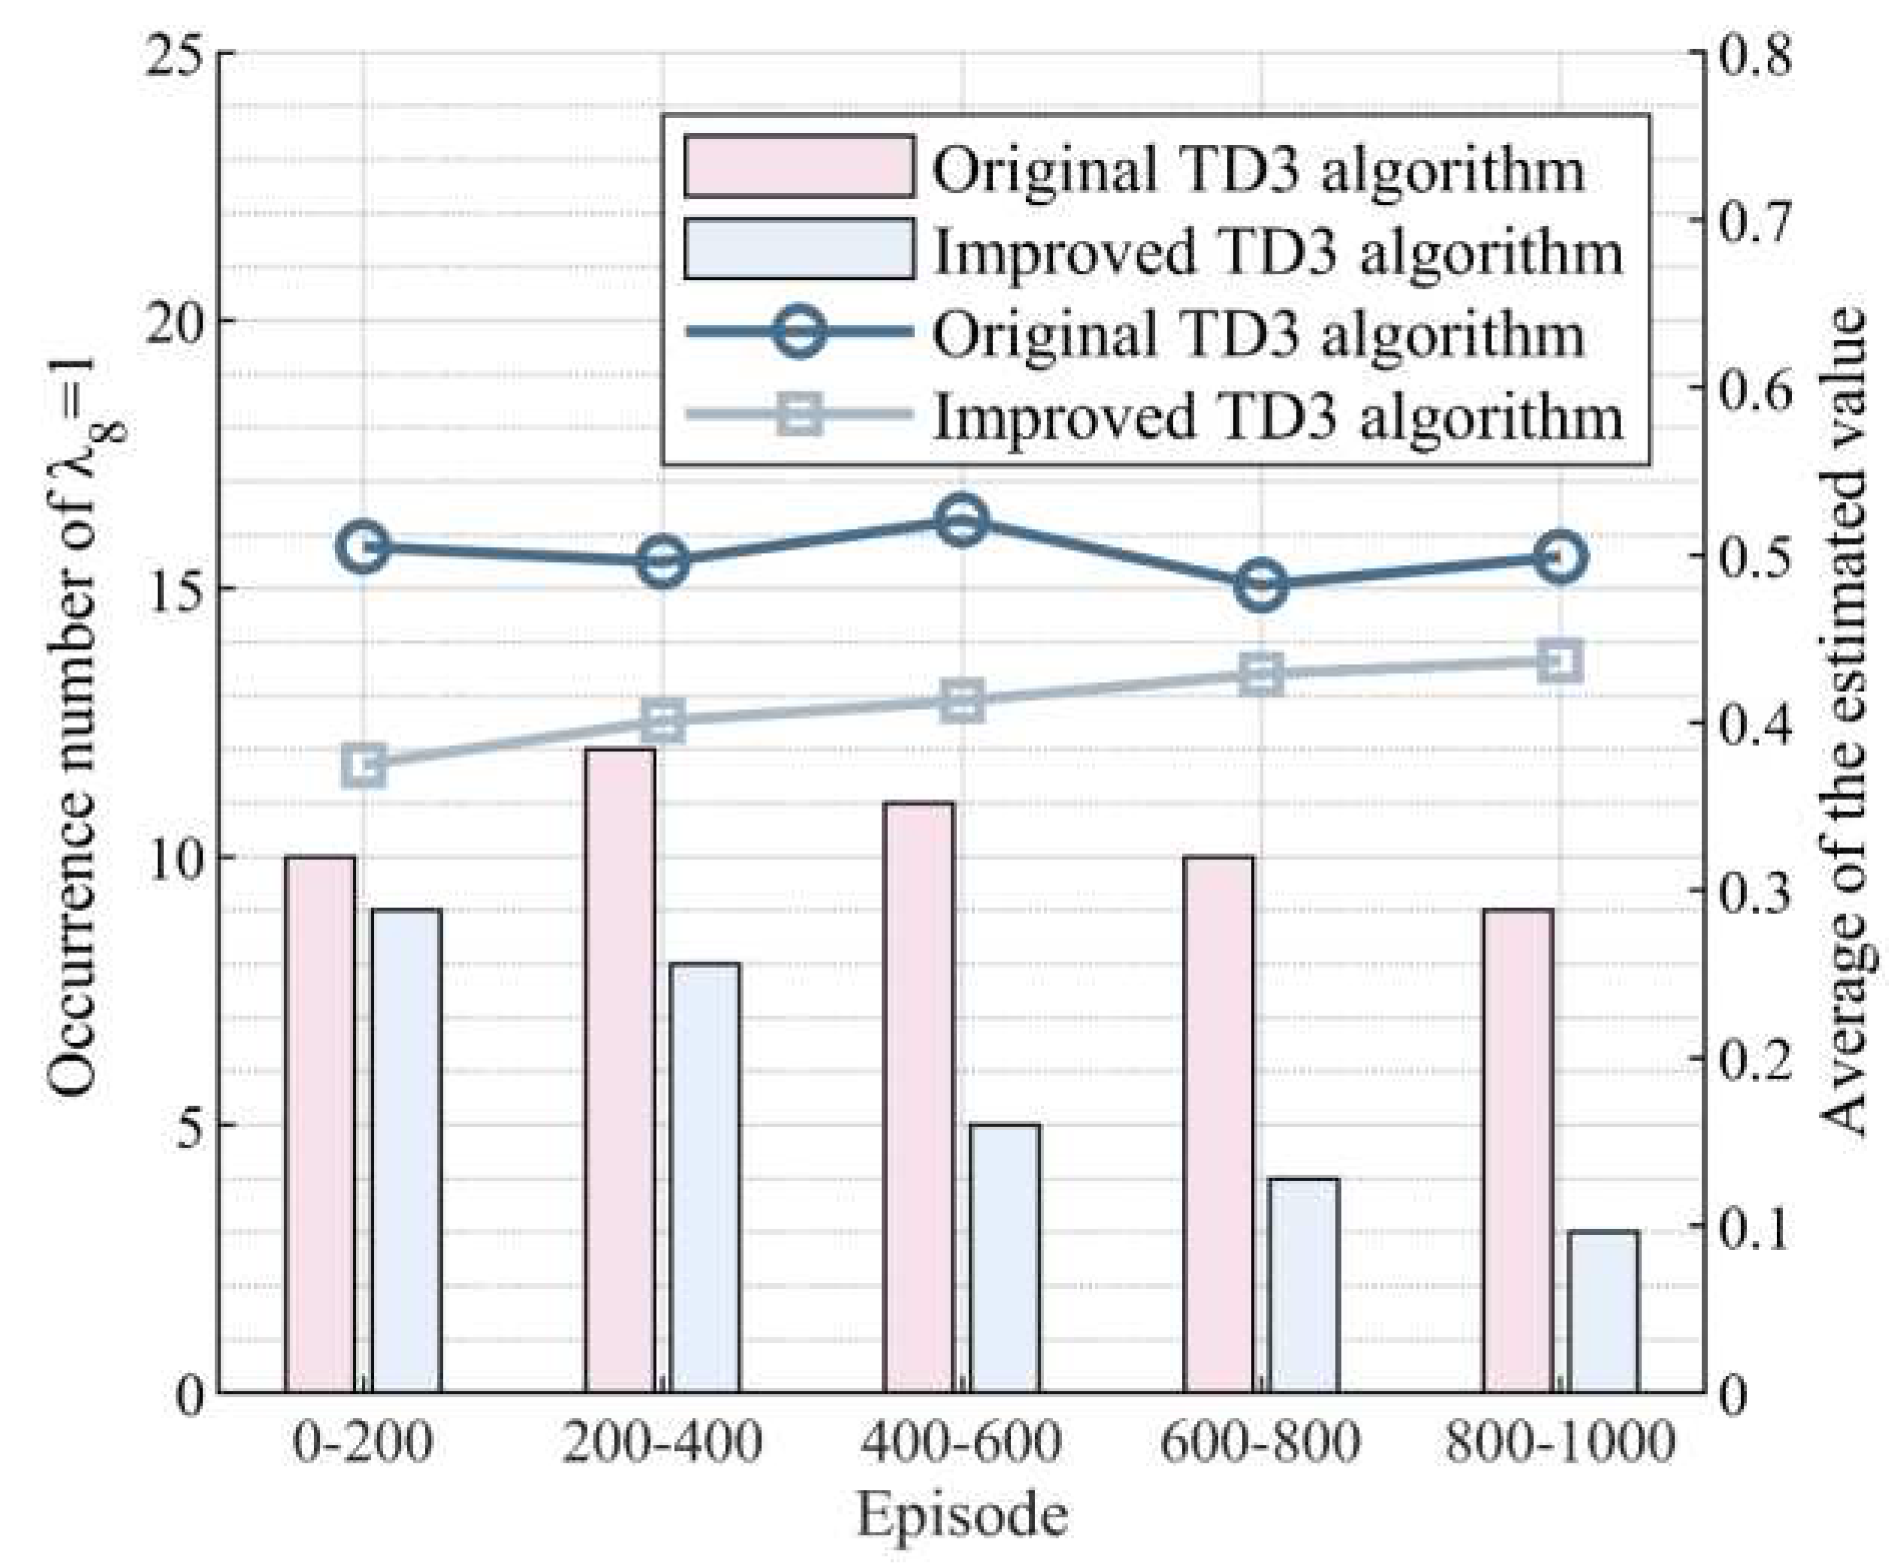
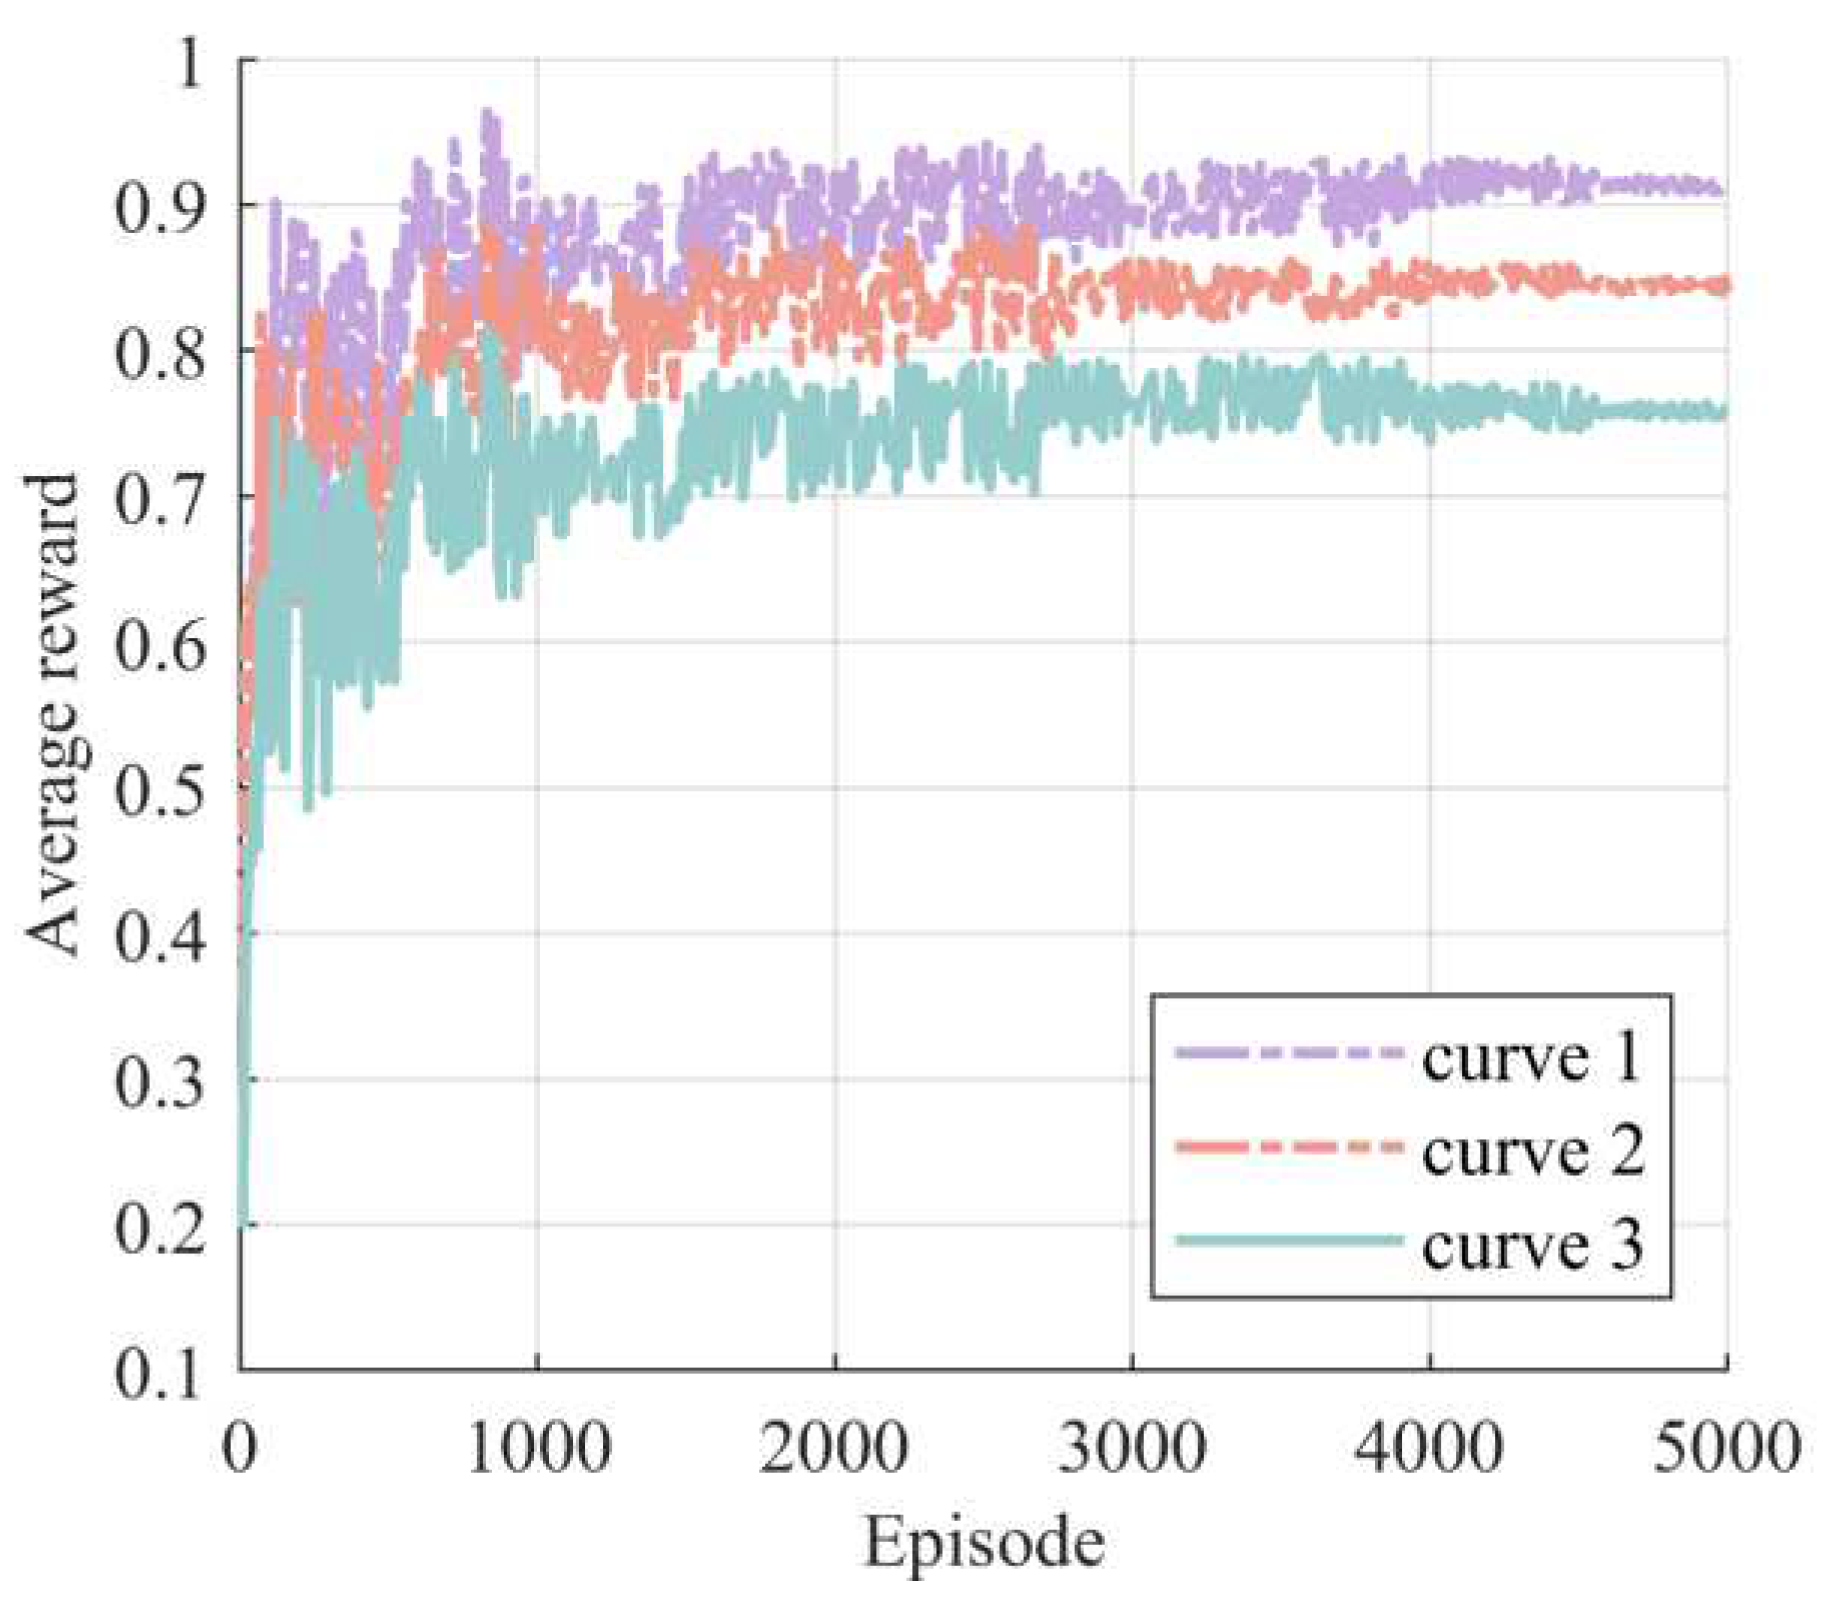
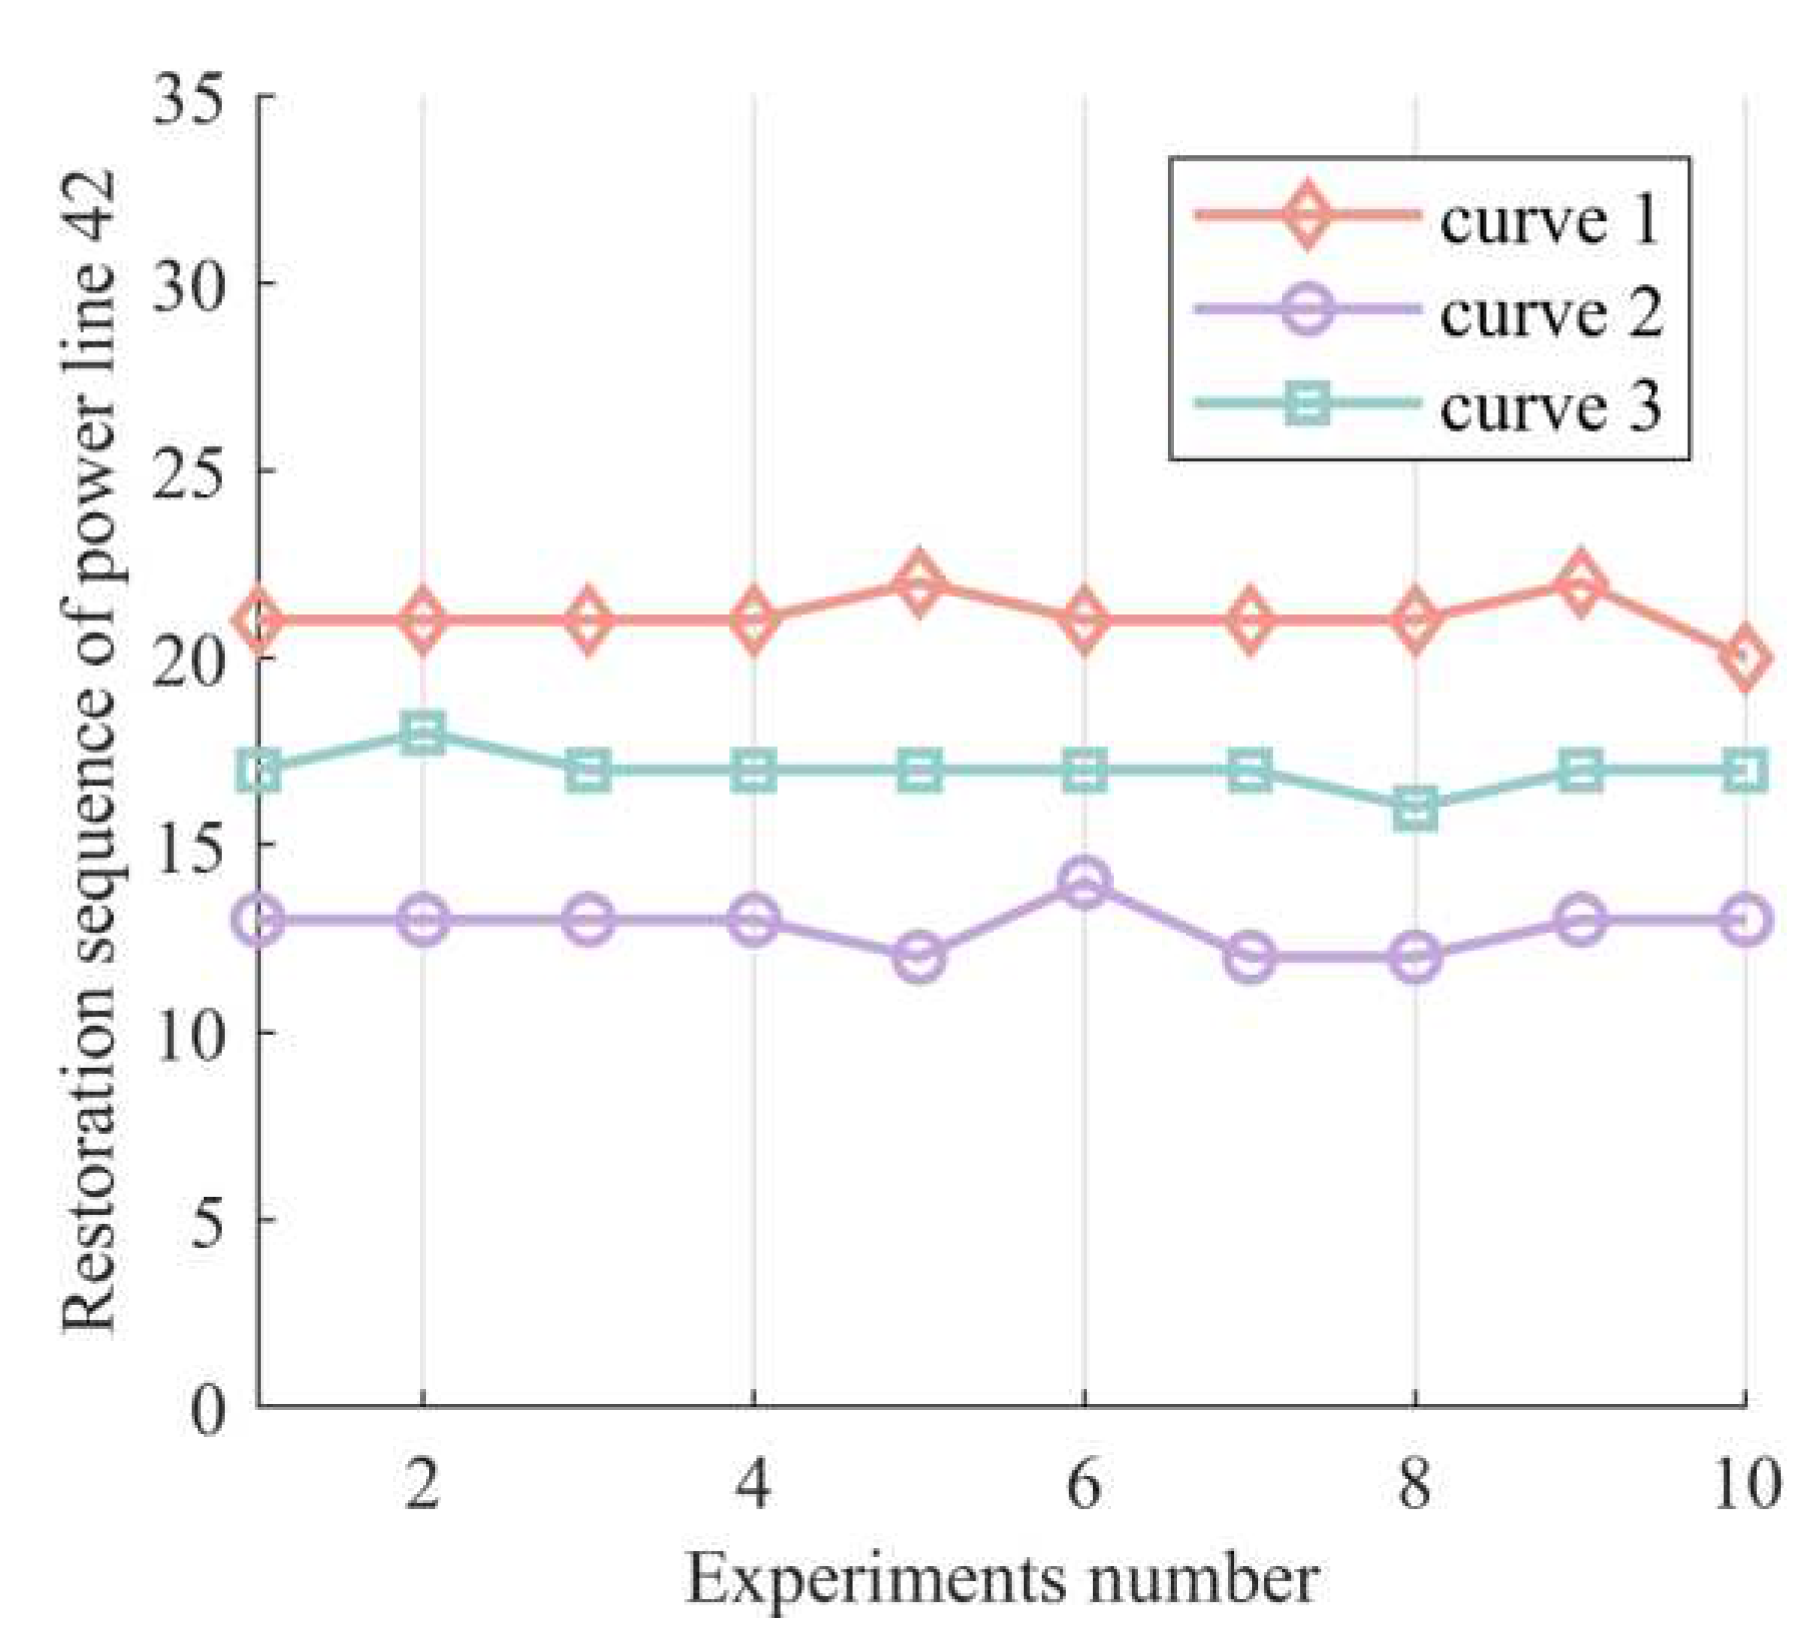
| Steps | Power grid lines and nodes | |
|---|---|---|
| 1 | 1、31、2 | |
| 2 | 36、6 | |
| 3 | 33、4 | |
| 4 | 37 | |
| 5 | 32 | |
| 6 | 34 |
| Scheme | Restoration sequence | Restoration benefit(MW) |
|---|---|---|
| 31、36、33、37、32、34 | 2.8239 | |
| 33、36、37、32、31、34 | 2.2689 | |
| 31、32、34、37、36、33 | 2.3564 | |
| 36、32、34、31、33、37 | 2.3901 | |
| 34、33、36、32、31、37 | 2.1032 | |
| 31、37、32、34、36、33 | 2.2946 |
| Algorithm | Performance metrics | |
|---|---|---|
| Restoration benefit (MW) | Convergence time (s) | |
| Ours | 12.3968 | 14763 |
| GA | 10.4519 | 15192 |
| PSO | 9.7987 | 14580 |
| DQN | 10.4832 | 17244 |
| AC | 10.8751 | 16848 |
| DDPG | 11.7285 | 16416 |
| TD3 | 12.3812 | 16211 |
| ) | |||||
|---|---|---|---|---|---|
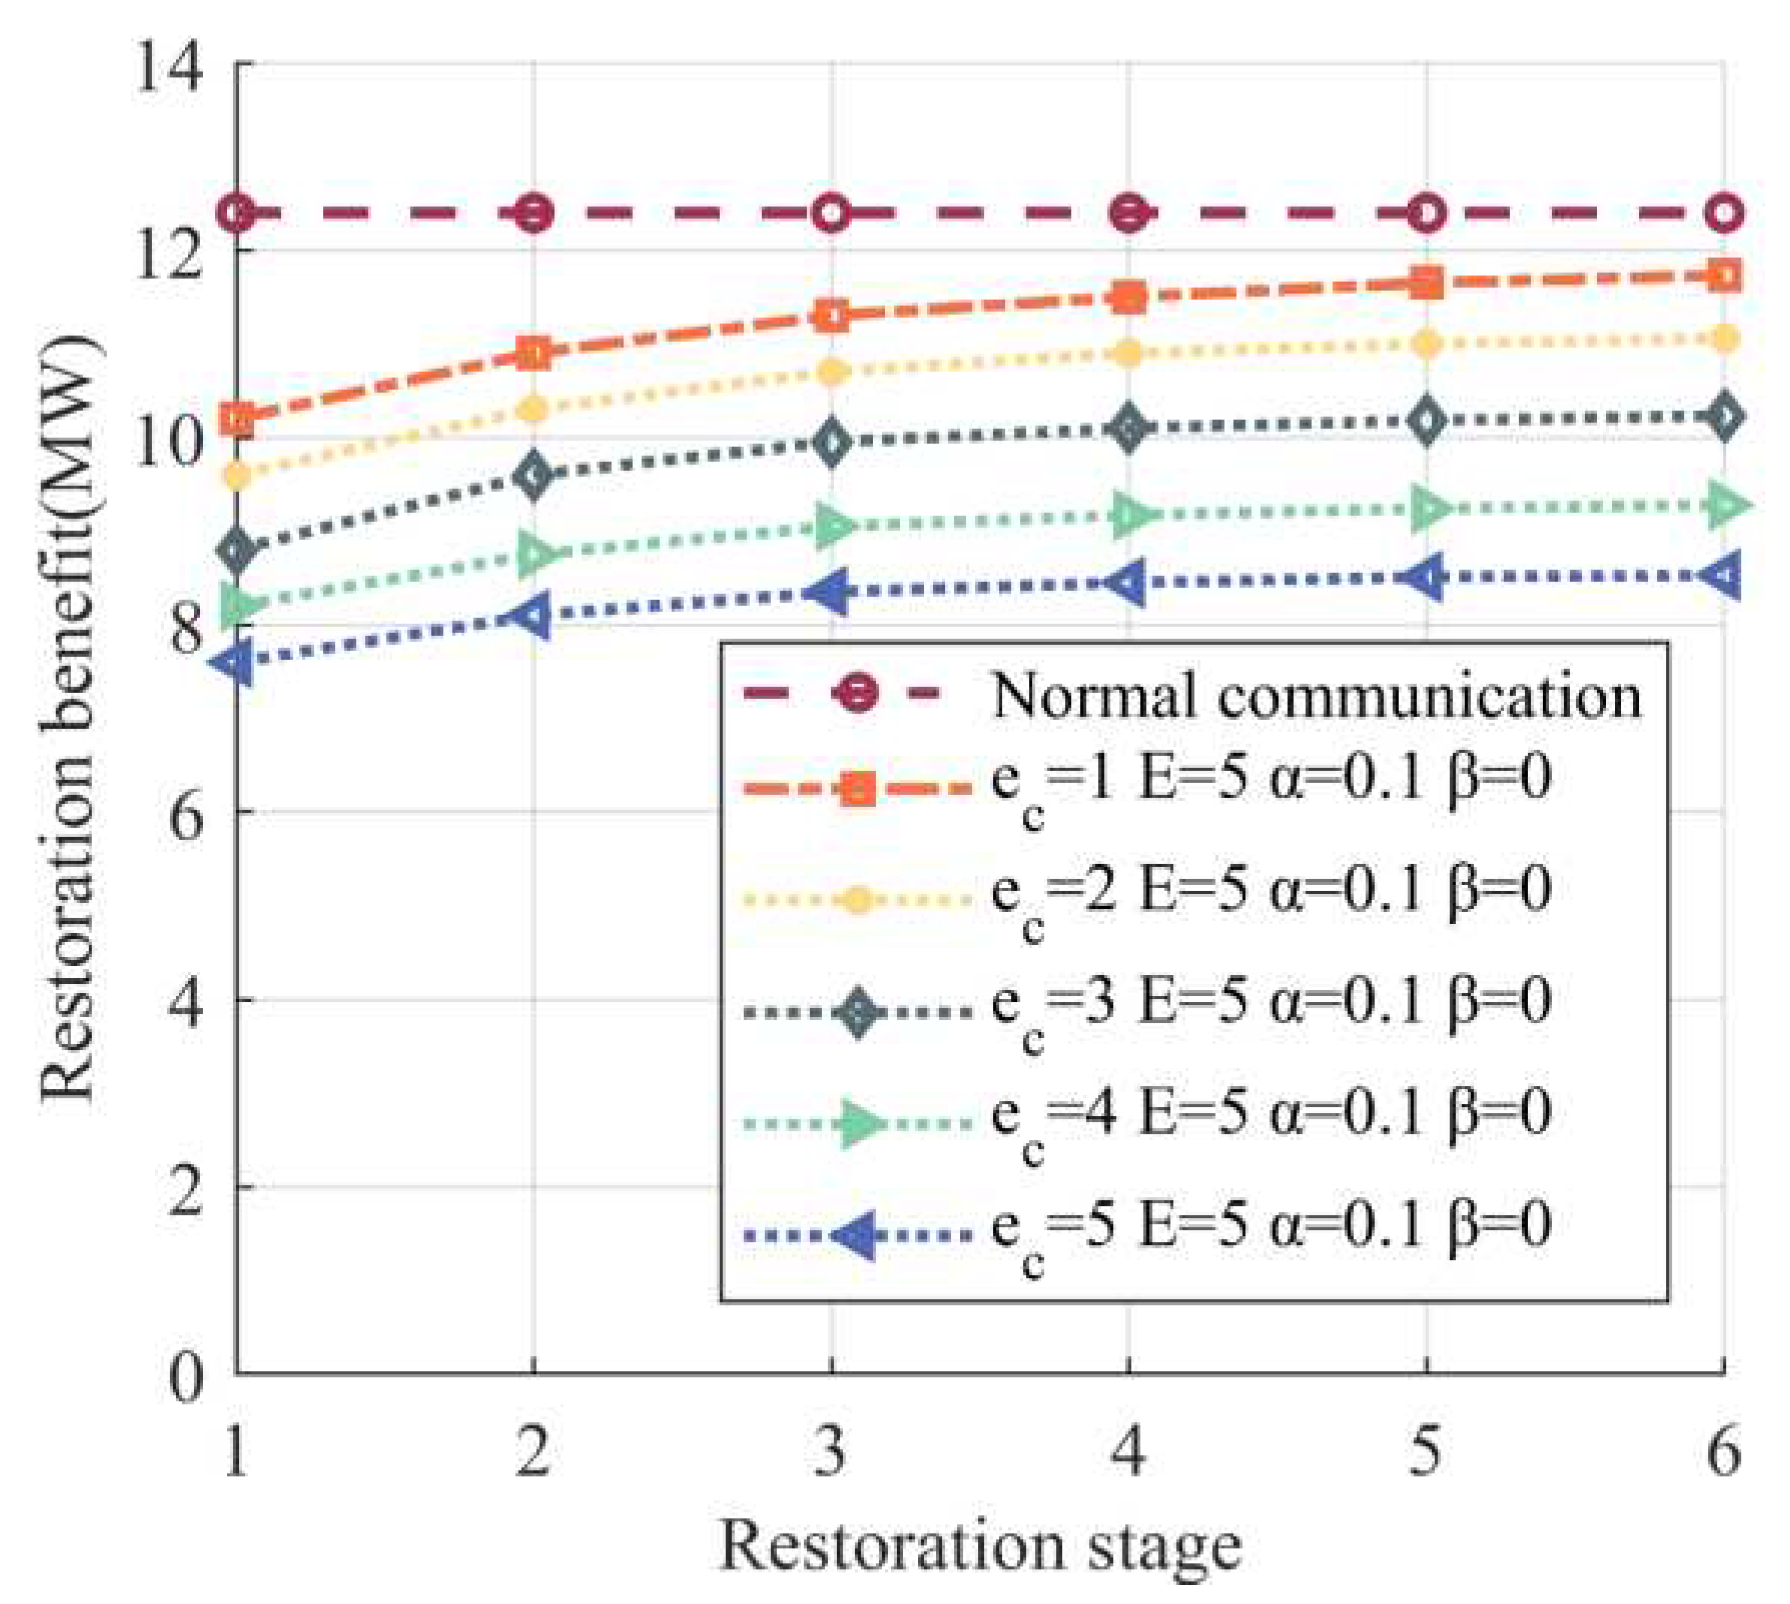
| 1 | 11.252 | 10.955 | 10.705 | 10.457 | 10.207 |
| 2 | 11.873 | 11.590 | 11.401 | 11.159 | 10.915 |
| 3 | 12.312 | 12.065 | 11.823 | 11.577 | 11.321 |
| 4 | 12.510 | 12.267 | 12.030 | 11.780 | 11.531 |
| 5 | 12.627 | 12.371 | 12.120 | 11.878 | 11.652 |
| 6 | 12.800 | 12.550 | 12.231 | 11.990 | 11.730 |
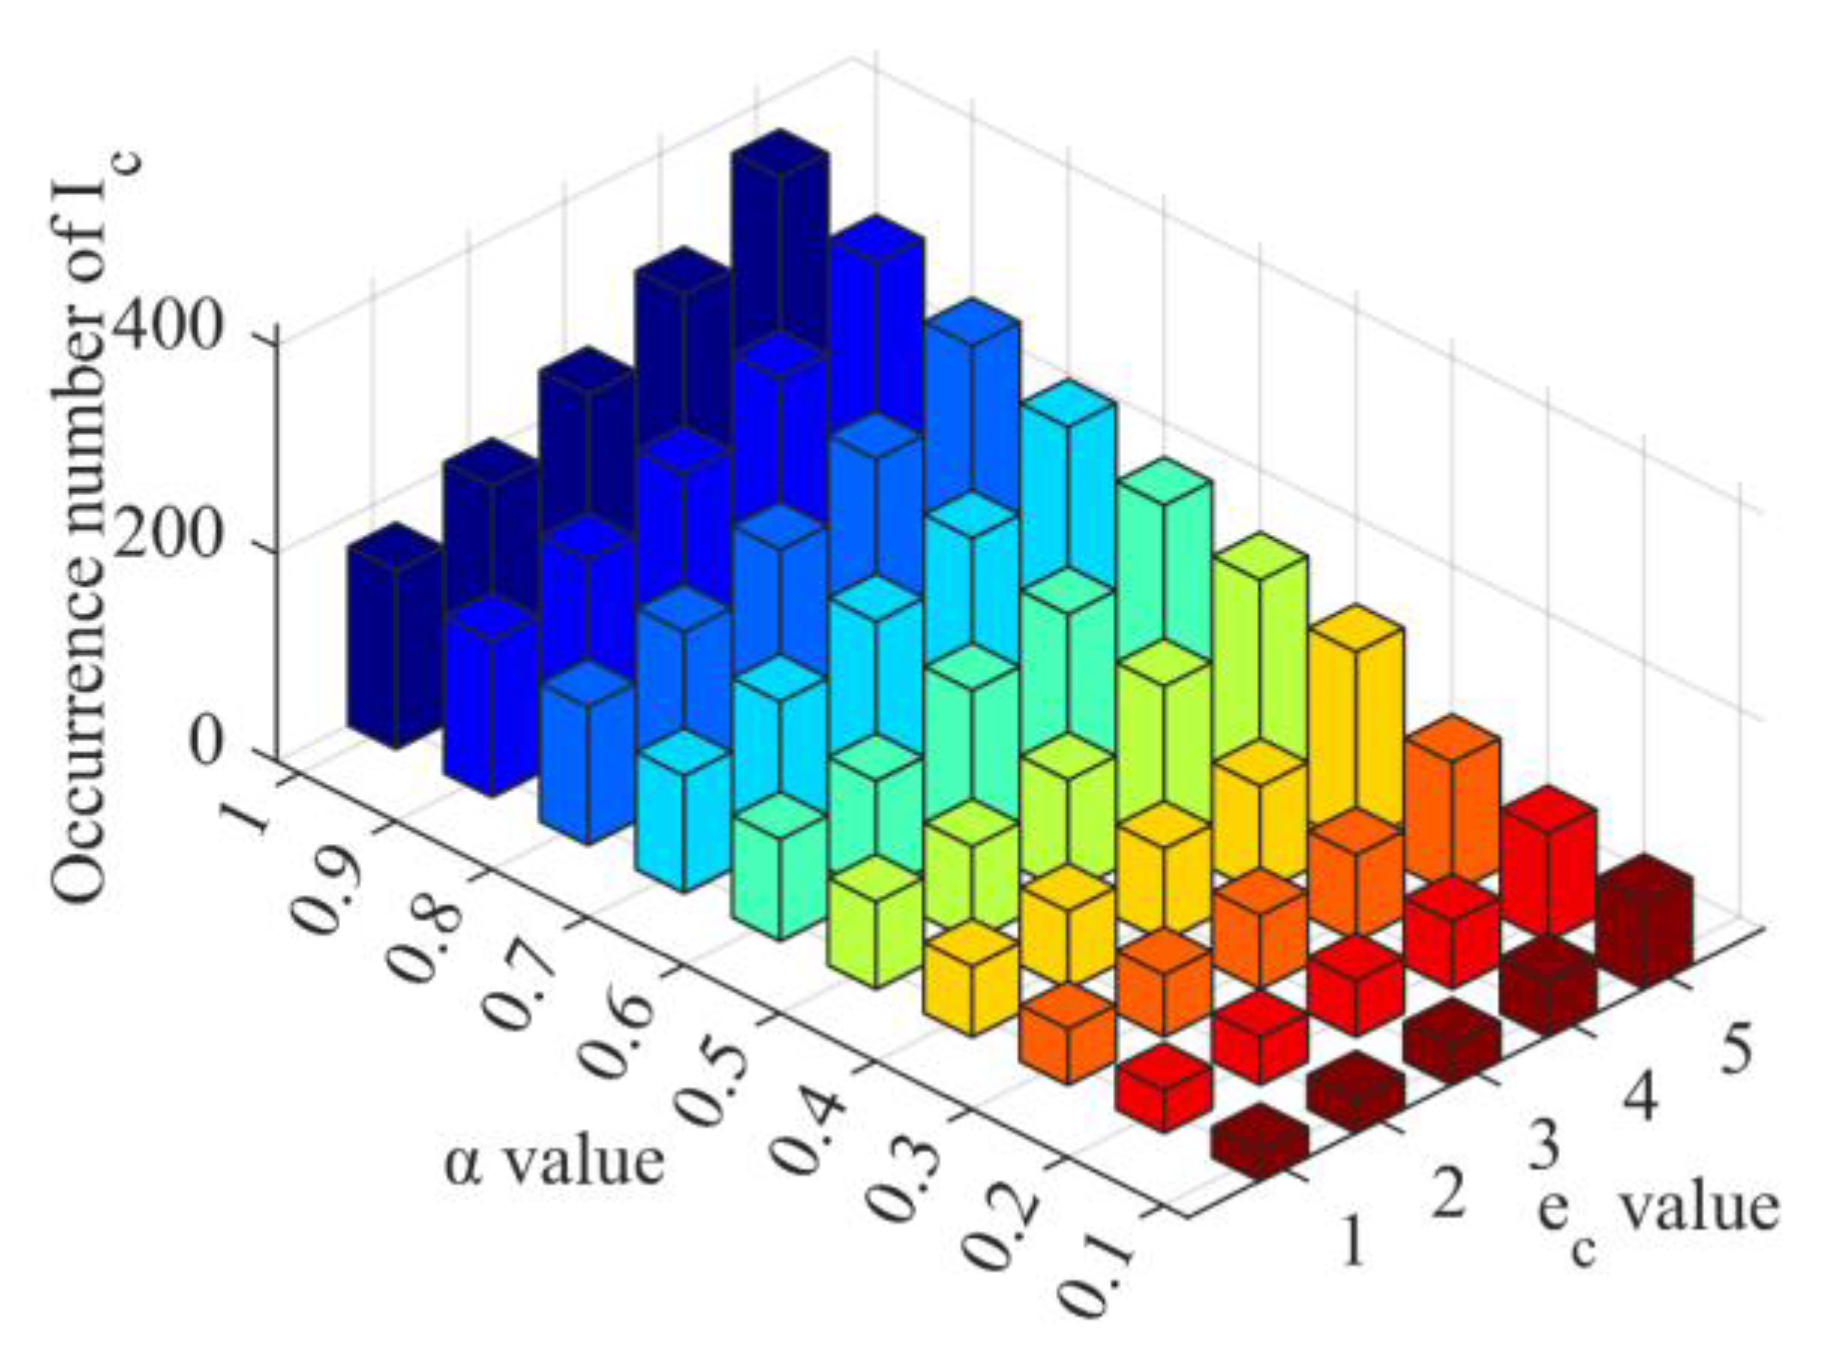
| value | average occurrence number | Difference ratio |
|---|---|---|
| 1 | 258.6 | 0 |
| 0.9 | 229.4 | 11.29% |
| 0.8 | 202.6 | 11.68% |
| 0.7 | 177.4 | 12.44% |
| 0.6 | 153.2 | 13.64% |
| 0.5 | 129.2 | 15.67% |
| 0.4 | 104.2 | 19.35% |
| 0.3 | 78.8 | 24.38% |
| 0.2 | 65.0 | 17.51% |
| 0.1 | 55.5 | 14.62% |
Disclaimer/Publisher’s Note: The statements, opinions and data contained in all publications are solely those of the individual author(s) and contributor(s) and not of MDPI and/or the editor(s). MDPI and/or the editor(s) disclaim responsibility for any injury to people or property resulting from any ideas, methods, instructions or products referred to in the content. |
© 2023 by the authors. Licensee MDPI, Basel, Switzerland. This article is an open access article distributed under the terms and conditions of the Creative Commons Attribution (CC BY) license (http://creativecommons.org/licenses/by/4.0/).


