Preprint
Article

Measurement of the Diffusion Coefficient of Xenon in Self-Sintered Nanopore Graphite for Molten Salt Reactor

Altmetrics

Downloads

83

Views

38

Comments

0

A peer-reviewed article of this preprint also exists.

  † The two authors contributed equally to this study and share first authorship.

This version is not peer-reviewed

Submitted:

28 September 2023

Posted:

29 September 2023

You are already at the latest version

Alerts
Abstract
The economics and safety of reactors can be affected by the diffusion of fission products into graphite. Xenon (Xe) fission products diffusing into the graphite is the most critical neutron absorber and poison that can slow down or stop the chain reaction. The transport parameters for inhibiting the xenon diffusion in graphite are therefore the utmost scientific problem. Self-sintered nanopore-isotropic (~ 40nm) graphite (SSNG) derived from green pitch coke can decrease Xe diffusion into the graphite. In this study, a method for measurement of diffusion coefficients of fission products diffusion in graphite by Rutherford backscattering spectrometry (RBS) was reported. The SSNG substrates were implanted with Xe at a dose of 4.8×10¹⁵ ions/cm2 and energy of 7 MeV. The RT-implanted samples were annealed in a vacuum at 650°C for 9 h. The implanted and annealed samples were characterized by RBS. The diffusion coefficient D(Xe,650°C) is 6.49×10⁻²⁰ m2/s. The results indicate the excellent ability to inhibit Xe diffusion of the SSNG and present significance in designing and evaluating the safety of nuclear reactors.
Keywords: 
Subject: Chemistry and Materials Science  -   Materials Science and Technology

1. Introduction

Graphite in molten salt reactors (MSRs) as a moderator/reflector, structural material as well as accommodation for fission products (FPs). The LiF-BeF2-UF4-ThF4 fuel salt in MSRs serves as both a heat transfer storage medium and a fuel carrier. They are located in the same circuit and are in direct contact with graphite. As a result, decay reactions of fission products occur throughout the primary loop as well. Some of these fission products are gaseous and cause the mixture to form bubbles in the fluid[1,2]. Most of the gaseous fission products are noble gases that will bubble out of the fuel salt mixture. The large neutron absorption cross-section of the 135Xe isotope diffusing into the graphite reduces the neutron economy and multiplication capability of the reactor[3,4]. In addition to this, the graphite dust containing FPs entering the main circuit and causing localized ultra-high temperatures will pose a fatal threat to the operational stability and safety of the reactor, and will also pose a major challenge to nuclear graphite reprocessing, decommissioning, etc. Prior studies have indicated that graphite with pore diameters of less than 100 nm could effectively prevent the liquid fluoride salt and Xe135 penetration.
A series of graphite with pore sizes below 100 nm was prepared in our research group. In particular, self-sintered nanopore-isotropic graphite (SSNG) prepared from green pitch coke by the isostatic pressing method has a high graphitization degree and good irradiation properties[5,6], with potential for use in MSRs. However, the diffusion behavior of implanted Xe in SSNG has not been investigated. To the best of our knowledge, there are almost no reports on the diffusion coefficient of xenon in nanoporous graphite. Gaining a comprehensive understanding of the interactions between FPs and graphite, especially the diffusion behavior of xenon (Xe135-based) in graphite, is important to guide the design of MSRs.
This study investigates the diffusion behavior of Xe26+ in the SSNG for the first time. The diffusion coefficient of xenon ions in nanoporous graphite (~ 40nm) is calculated by Rutherford backscattering spectroscopy (RBS). The implanted SSNG samples were subjected to high temperature diffusion experiments at the MSR operating temperature (650°C), and the experimental diffusion data of practical significance were measured.

2. Experimental

2.1. Specimen preparation and irradiation

The green pitch coke was produced by a pressure-assisted semi-carbonization process. The as-prepared green coke blocks were subsequently wet ground in a ball mill to obtain a powder with an average size of 2.5 μm to ensure sufficient sintering activity. The slurry was then dried at 100 °C for about 3 hours to completely remove the solvent before being pulverized again in a mill to obtain the desired powder. These powders were then molded into green bodies through isostatic compaction under a pressure of 100 MPa at room temperature. Subsequently, the green bodies were carbonized in a nitrogen atmosphere at a heating rate of 20°C/min, reaching a temperature of 1000°C and maintaining it for 2 hours. Finally, the graphitization treatment was conducted under argon at temperatures up to 2600°C, with a heating rate of 50°C/h. Then the self-sintered nanopore-isotropic (~ 40nm) graphite (SSNG) was prepared.
The SSNG specimens were cut into 5.0×5.0×1.0 mm3 pieces for Xe26+ irradiation. All samples were polished and ultrasonically cleaned before irradiation. The samples were irradiated at room temperature by 7 MeV Xe26+ ion beams to a fluence of 4.8 × 10¹⁵ ions/cm2 on a terminal of the 320 kV high-voltage experimental platform equipped with an electron cyclotron resonance ion source in the Institute of Modern Physics, Chinese Academy of Science.

2.2. Characterizations

The implanted SSNG samples were loaded into quartz tubes and sealed, and then the sealed quartz tubes were placed in a muffle furnace and subjected to isothermal annealing at 650°C for 9 h. The diffusion behavior of Xe in SSNG due to annealing was investigated using Rutherford backscattering spectrometry (RBS) with 2 MeV He+. An analysis current of 15 nA and a scattering angle of 165° were used with a total charge of 8 μC. The resulting RBS profiles were fitted with Gaussian line shape fitting.

3. Results and discussion

Rutherford backscattering spectrometry (RBS) is a highly effective technique for elemental analysis and depth analysis technique of surface layers and thin films of solids, especially for the analysis of heavy elements on light elemental matrices.[7-9]. This non-destructive testing method is simple to perform and widely used for determining the thickness of thin films and the relative content of matrix elements. Due to its straightforward sample preparation, ease of operation, and reliable analytical results, RBS plays a crucial role in interdisciplinary research fields such as materials science, microelectronics, thin film physics, and energy[10-14].
Figure 1 shows the energy channel numbers and yields of SSNG graphite before and after isothermal annealing at 650°C for 9 h. It can be seen that the Xe26+ peak broadens after 9 h of annealing, indicating that Xe26+ diffuses after constant temperature annealing. The diffusion model is similar to a "sandwich" structure, as shown in Figure 2. Firstly, Xe26+ is injected into the graphite at a certain depth, and there is a Xe26+ thickness layer under this depth, while the graphite injection side is considered to have almost no Xe26+ residence, which is the model for determining the diffusion coefficient by ion injection, and the diffusion coefficient is obtained by the change of Xe26+ residence layer thickness before and after annealing. Therefore, the diffusion coefficient D can be obtained directly from the data of the half height width (FWHM) of the concentration distribution peaks of Xe26+ elements in the labeled layer before and after isothermal annealing. for the FWHM values, the Gauss peak function is required to fit the calculation to the distribution peaks of Xe in the RBS energy spectrum. The fitted peaks and FWHM values are obtained, and the fitting results are shown in Figure 1.
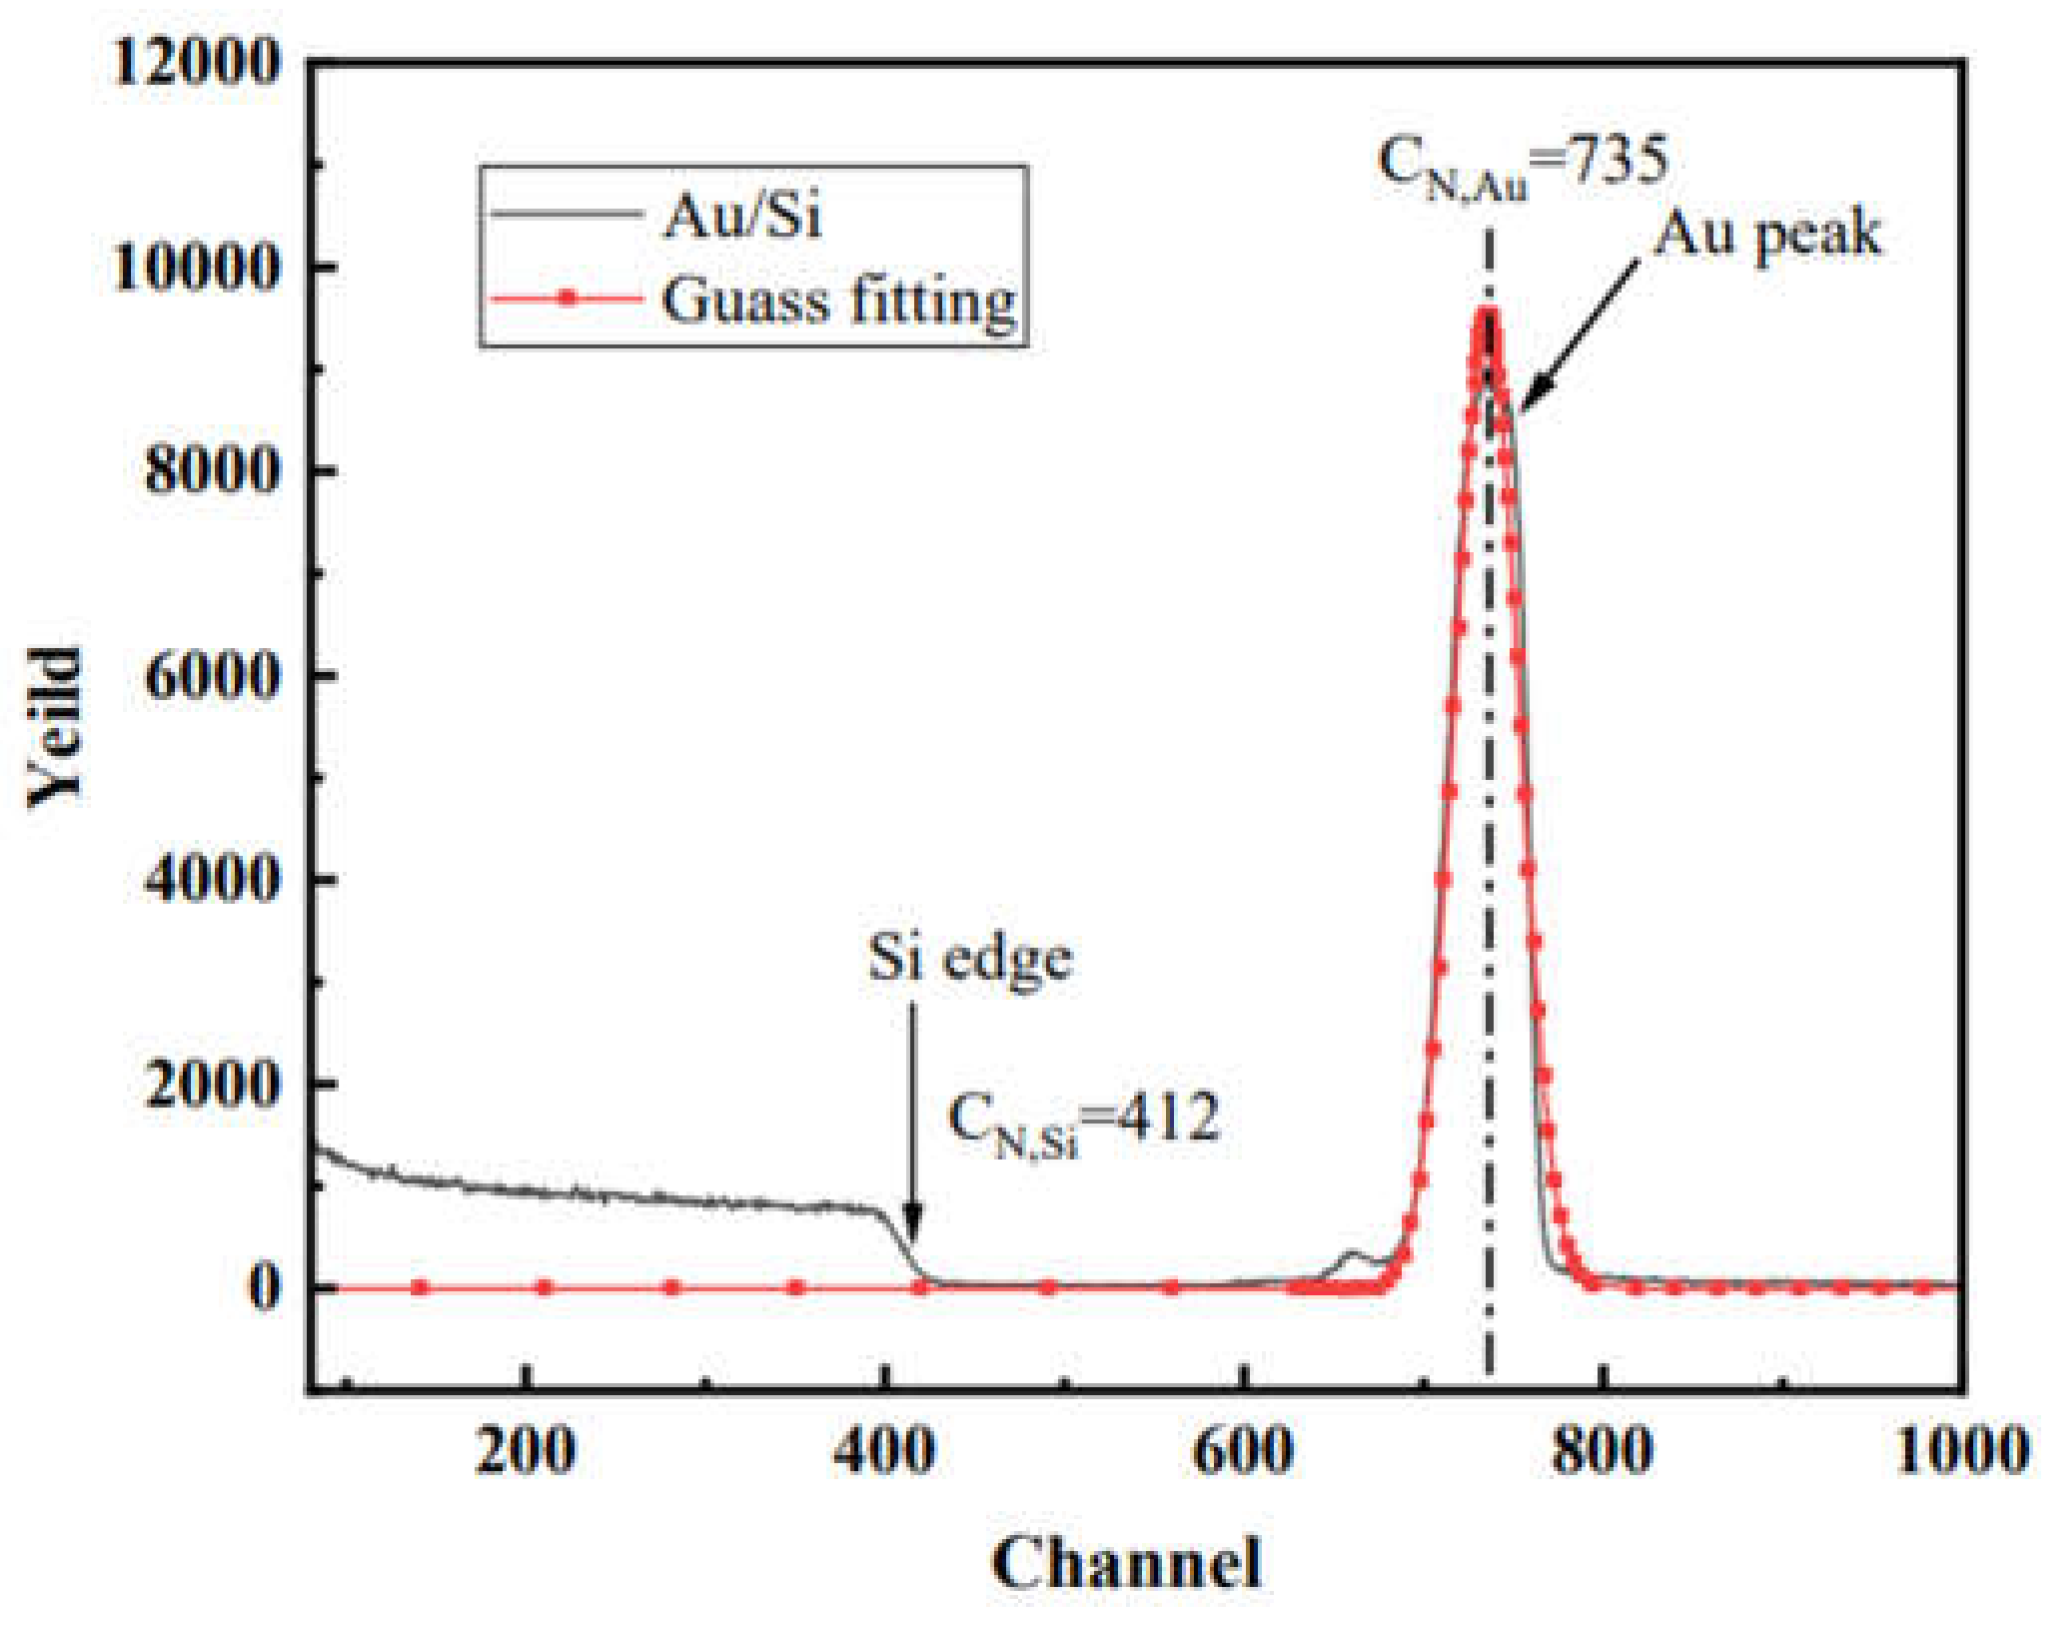
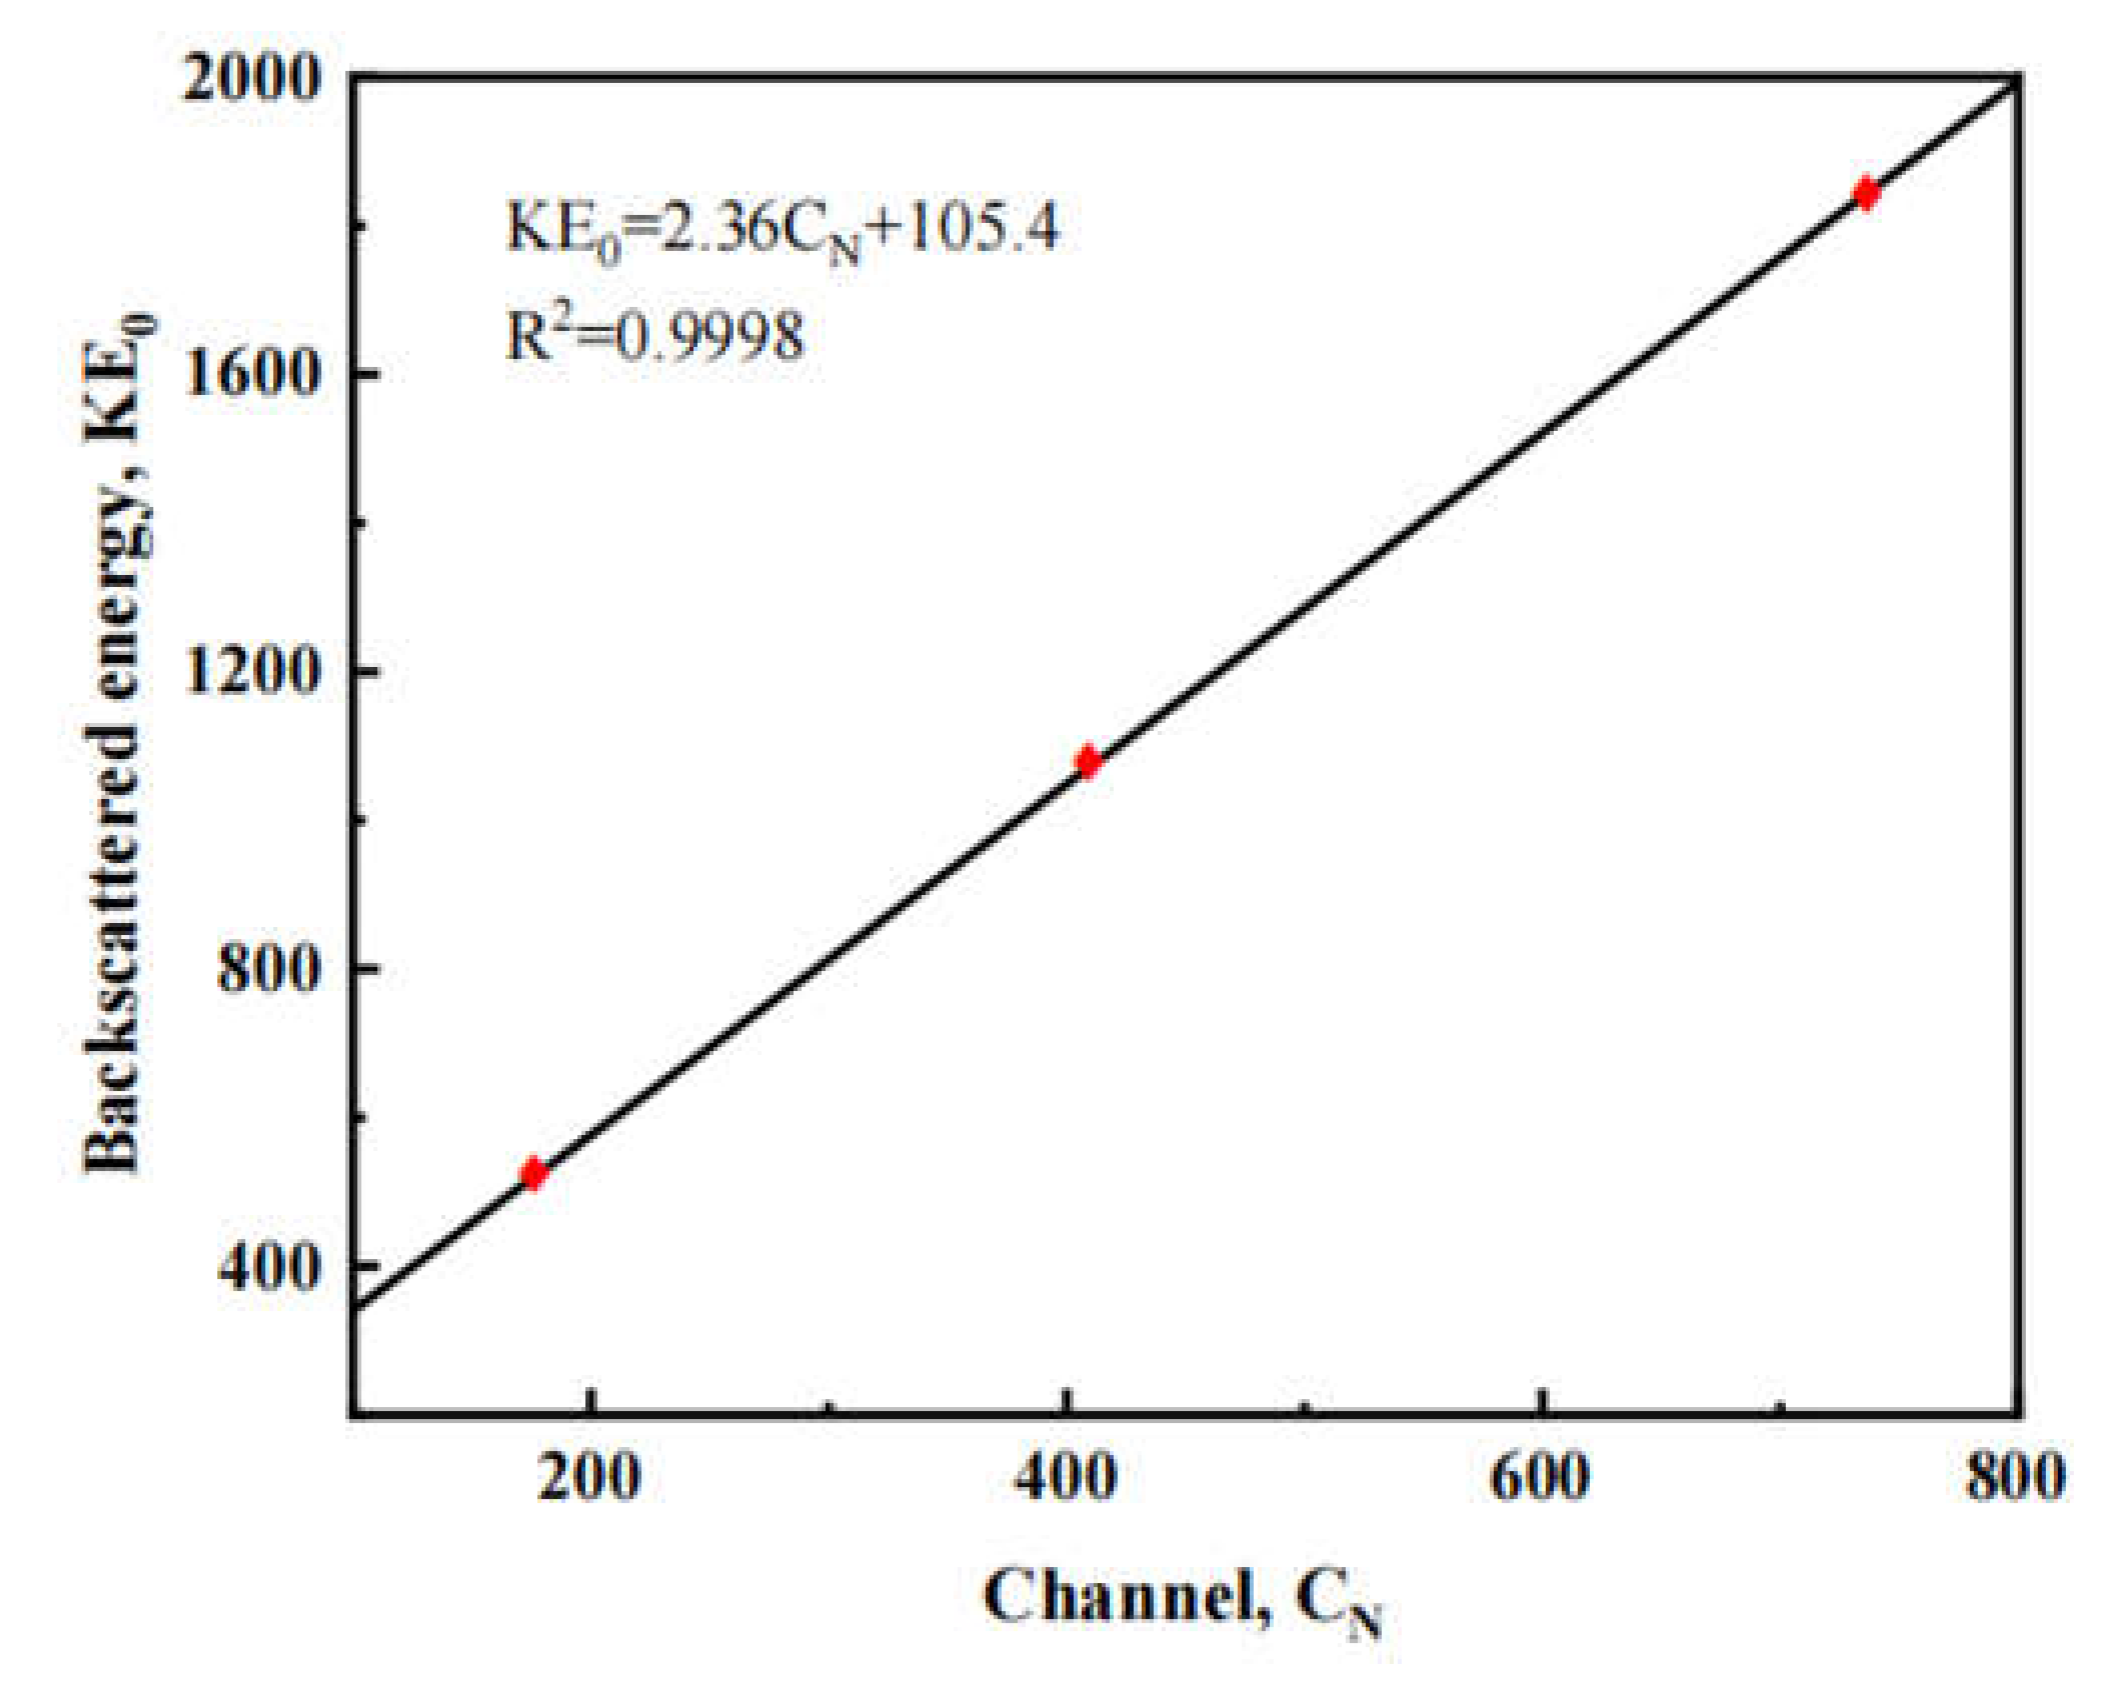
The diffusive migration of xenon in graphite is simulated using classical Fickian diffusion kinetics and (effective) diffusion coefficients. The (effective) diffusion coefficient elaborated here combines all the fundamental transport coefficients due to physical and chemical phenomena (trapping, adsorption, graphite inhomogeneities, etc.) into one parameter, which is consistent with the approach used in contemporary fuel performance modeling. The diffusion experiment assumes that the rectangular flake sample is homogeneous and does not deviate from the ideal geometry, that the concentration of xenon on the graphite surface is zero (t > 0), and that the concentration of injected xenon is determined by the half-peak width of the xenon peak in the RBS plot of the xenon ion. However, to get the accurate diffusion coefficient, the detection system should also be calibrated with the energy scale using the Si sheet coated with Au film layer to correct the energy scale of the detection system and reduce the experimental error, and the calibration spectrum is shown in Figure 3 and Figure 4. The linear calibration equation is obtained from equations (14) and (15): KE0=ACN+B; the energy scale parameters of the detector with energy of 2 MeV (4He+) are obtained by the relationship between the energy channel number and kinematic factor of the calibration samples Au, Si, and C: A=2.36 keV/ch, B=105.4 keV, and then the relationship between channel number and concentration of xenon The relationship between energy and concentration is converted. After obtaining the thickness of the injected xenon ion layer by blocking the cross-section factor, the diffusion coefficient of xenon was calculated by the diffusion equation, and the diffusion coefficient of Xe26+ at 650°C was calculated to be D(Xe,650°C) = 6.49 × 10⁻²⁰ m2/s.
The mathematical model of isotropic material diffusion in this study is based on the assumption that the rate of transfer of diffusing material per unit area through the cross-section is proportional to the measured concentration gradient perpendicular to the cross-section [15].
F = D C x
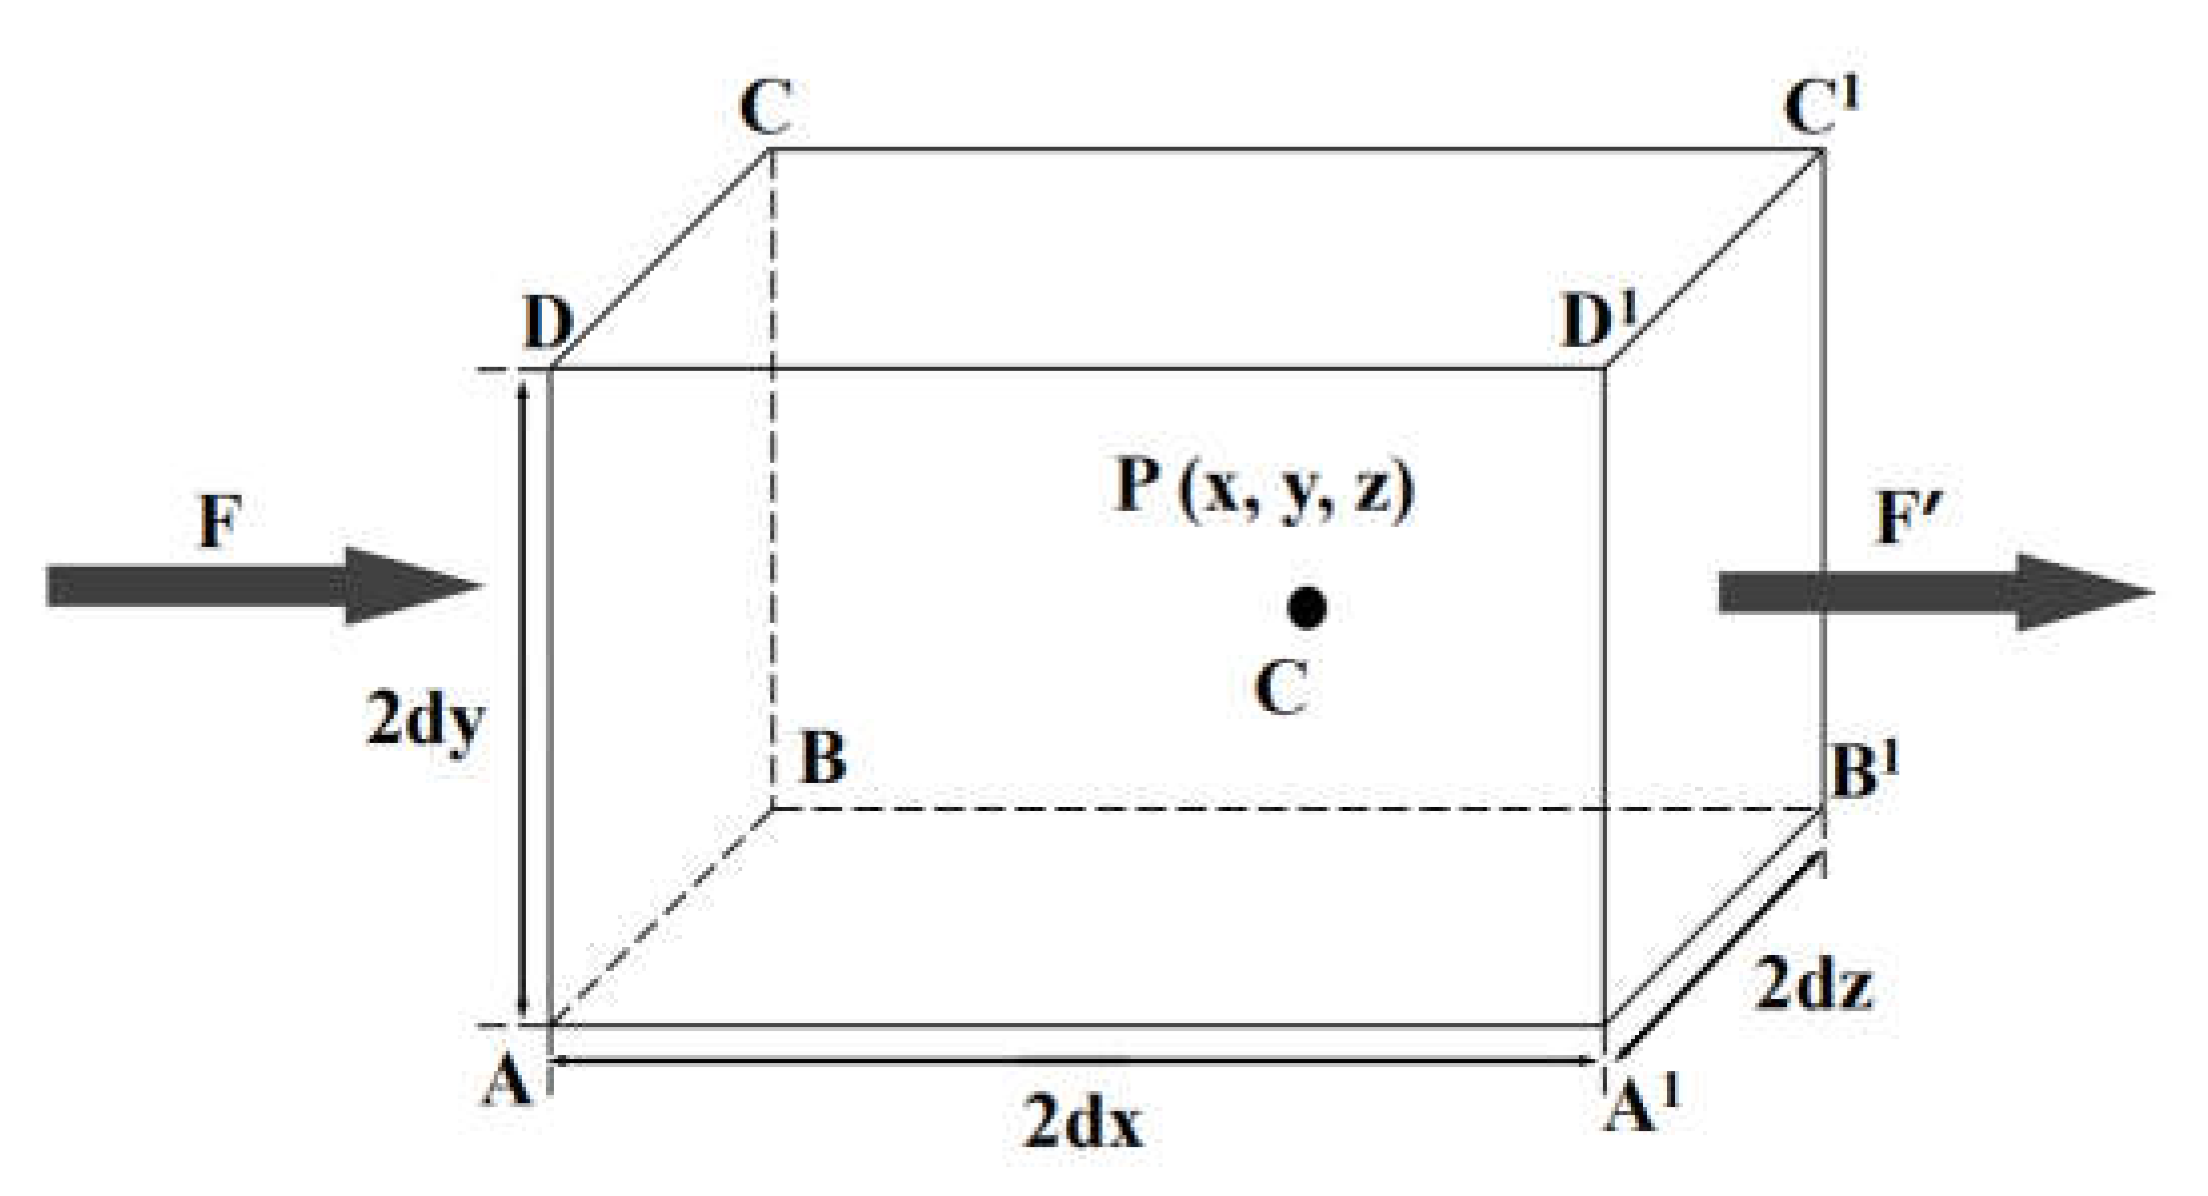
In Equation (1), F is the transfer rate through the unit area, C is the concentration of the diffusing substance (Xe26+), D is the diffusion coefficient, and x is the spatial coordinate measured perpendicular to the cross-section. Equation (1) is known as Fick's first law of diffusion. To obtain the diffusion solution for this study, Fick's second diffusion law must be used. Assume a rectangular strip of unit cross-sectional area with the x-axis passing through the center. Its dimensions are shown in Figure 5.
Suppose that at the center of the rectangular bar, P (x, y, z), the concentration of the substance is C. The mass of the diffuser entering the rectangular bar in the x-dx plane through the ABCD plane is:
4 d y d z F x F x x d x
where Fx is the transfer rate through the corresponding plane per unit area P. The amount of diffusive material lost through face A1B1C1D1 is:
4 d y d z F x + F x x d x
Equation (2) - (3) yields:
8 d x d y d z F x x
Similarly, equations (5) and (6) are obtained.
8 d x d y d z F y y
8 d x d y d z F z z
The increase of diffusible material in the cell can be given by equation (7):
8 d x d y d z C t
If the total amount of incoming diffusion material is equal to the increase of diffusion material in the cell, equation (8) is obtained from equations (4), (5), (6), and (7).
C t + 2 F x x 2 + 2 F y y 2 + 2 F z z 2
Equation (9) can be obtained from equations (8) and (1).
C t = D 2 C x 2 + 2 C x 2 + 2 z 2
If the diffusion is one-dimensional, i.e., the concentration gradient is only in the x-direction; equation (9) is deformed to obtain equation (10).
C t = D 2 C x 2
The equation (10) is known as Fick's second law. The quantitative measurement of the rate at which a diffusion process occurs is expressed as a diffusion coefficient. For a one-dimensional diffusion process, the diffusion coefficient can be defined as the rate of transfer of the diffusing substance within a segment of units, divided by the spatial gradient of the concentration at that segment 3. If the rectangular bars in Figure 1 represent SSNG graphite specimens implanted with Xe26+, equation (10) can be solved by equation (11).
C x , t = 2 π D t 1 2 1 0 C 0 y e y x 2 4 D t + e y x 2 4 D t d y
In equation (1), C is the concentration of Xe26+ and t is time. When time t=0, C0(x)=C(x,0) represents the initial iodine profile (i.e., the iodine profile before diffusion occurs). The profile measurement at t=0 can be approximated by equation (12).
C 0 x = K π D t 0 1 2 e x 2 4 D t 0
In equation (1), K and t0 are adjustable constants. Using the boundary condition lim x 0 d d x C x , t = 0 , it is simplified with equation (12) and (11) to equation (13).
C x , t = K π D t + t 0 1 2 [ E X 2 ( 4 D t 0 + 4 D t ) ]
If a profile W(t) is defined in such a way that C ( W , t ) = 1 2 C ( 0 , t ) then equation (13) becomes equation (14)[16];
W t 2 = 4 D t l n 2 + W 0 2
Equation (14) can be used to obtain the diffusion coefficient, D. A plot of W t 2 versus t yields the diffusion coefficient (slope). The diffusion coefficient can be obtained by determining the slope 4Dln(2) of the unitary primary function, and W t 2   is determined using the FWHM of the Xe26+peak. To obtain the activation energy E, the Arrhenius equation can be used.
D = D 0 e x p ( E a R T )
In equation (15), D is the diffusion coefficient, D0 is the pre-exponential factor, E is the activation energy, T is the absolute temperature and k is the gas constant.

4. Conclusions

(1) The "sandwich" model is considered to be a feasible way to calculate the xenon ion diffusion coefficient. The RBS energy spectrum of Xe26+ injected into SSNG shows the xenon distribution peak of xenon ion with a near Gaussian distribution. and the Xe26+ peak still has a near-Gaussian distribution after diffusion, suggesting that the broadening of the SSNG graphite-injected xenon profile after annealing is related to Fickian diffusion.
(2) The diffusion coefficient was measured by injecting Xe26+ at a dose of 4.8×10¹⁵ ions/cm2 into SSNG at room temperature and annealing the expansion at a constant temperature of 650°C for 9 h. The concentration of xenon was determined by the value of FWHM of Xe26+ peak half height width on the RBS energy spectrum before and after isothermal annealing. The diffusion coefficient of Xe26+ ions was measured by Rutherford backscattering (RBS) for the first time after isothermal annealing at 650°C for 9 h. The diffusion coefficient D(Xe,650°C) = 6.49×10⁻²⁰ m2/s, which shows that the nanopore graphite SSNG has an excellent ability to inhibit xenon diffusion.

Acknowledgments

This work was financially supported by the National Natural Science Foundation of China (No. 52072397, No. 12305339); Institute of Coal Chemistry, Chinese Academy of Sciences (No. SCJC-XCL202209); DNL Cooperation Fund, CAS (DNL202012).

References

  1. Haubenreich, P.N.; Engel, J.R. Experience with the Molten-Salt Reactor Experiment. Nuclear Applications and Technology 1970, 8, 118–136. [Google Scholar] [CrossRef]
  2. Price, T.; Chvala, O.; Bereznai, G. A dynamic model of xenon behavior in the Molten Salt Reactor Experiment. Ann. Nucl. Energy 2020, 144, 107535. [Google Scholar] [CrossRef]
  3. Scott, D.; Eatherly, W.P. Graphite and Xenon Behavior and their Influence on Molten-Salt Reactor Design. Nuclear Applications and Technology 1970, 8, 179–189. [Google Scholar] [CrossRef]
  4. Dunkle, N.; Chvala, O. Effect of xenon removal rate on load following in high power thermal spectrum Molten-Salt Reactors (MSRs). Nucl. Eng. Des. 2023, 409, 112329. [Google Scholar] [CrossRef]
  5. Zhao, H.C.; He, Z.; Liu, Z.J.; Song, J.L.; Tsang, D.K.L.; Zhang, H.Y. Self-sintered nanopore-isotropic graphite derived from green pitch coke for application in molten salt nuclear reactor. Ann. Nucl. Energy 2019, 131, 412–416. [Google Scholar] [CrossRef]
  6. Zhang, H.Y.; Song, J.L.; Tang, Z.F.; He, Z.; Liu, X.D. The surface topography and microstructure of self-sintered nanopore graphite by Xe ions irradiation. Appl. Surf. Sci. 2020, 515, 146022. [Google Scholar] [CrossRef]
  7. Čajko, K.O.; Lukic-Petrovic, S.; Ćelić, N.; Noga, P.; Vaňa, D.J.A.S.S. Influence of different metal concentrations on the morphology of Ag–As2Ch3 thin films analyzed by Rutherford Backscattering Spectrometry and Energy Dispersive Spectroscopy. Appl. Surf. Sci. 2020, 510, 145430. [Google Scholar] [CrossRef]
  8. Claessens, N.; Delabie, A.; Vantomme, A.; Vandervorst, W.; Meersschaut, J. Probing the spatial dimensions of nanoscale patterns with Rutherford backscattering spectrometry. Nucl. Instrum. Methods Phys. Res. Sect. B-Beam Interact. Mater. Atoms 2023, 540, 174–181. [Google Scholar] [CrossRef]
  9. Bodunrin, J.O.; Oeba, D.A.; Moloi, S.J. Exploring the Impact of Fe-Implantation on the Electrical Characteristics of Al/p-Si Schottky Barrier Diodes. Electronic Materials 2023, 4, 95–109. [Google Scholar] [CrossRef]
  10. Cheema, D.A.; Danial, M.O.; Hanif, M.B.; Alghamdi, A.S.; Ramadan, M.; Khaliq, A.; Khan, A.F.; Subhani, T.; Motola, M. Intrinsic Properties and Future Perspective of HfO2/V2O5/HfO2 Multi-Layer Thin Films via E-Beam Evaporation as a Transparent Heat Mirror. Coatings 2022, 12. [Google Scholar] [CrossRef]
  11. Chiari, M.; Melon, B.; Salvestrini, L.; Fonseca, M.; Alves, E.; Jesus, A.P. Measurement of proton induced γ-ray emission cross sections on Al from 2.5 to 4.1MeV. Nucl. Instrum. Methods Phys. Res. Sect. B-Beam Interact. Mater. Atoms 2014, 332, 355–358. [Google Scholar] [CrossRef]
  12. Laricchiuta, G.; Vandervorst, W.; Meersschaut, J. High-sensitivity Rutherford backscattering spectrometry employing an analyzing magnet and silicon strip detector. Nucl. Instrum. Methods Phys. Res. Sect. B-Beam Interact. Mater. Atoms 2019, 439, 59–63. [Google Scholar] [CrossRef]
  13. Qi, M.B.; Lian, P.F.; Li, P.D.; Zhang, H.Y.; Cheng, J.X.; Wang, Q.B.; Tang, Z.F.; Pan, T.J.; Song, J.L.; Liu, Z.J. Diffusion Behavior of Iodine in the Micro/Nano-Porous Graphite for Nuclear Reactor at High Temperature. C 2023, 9. [Google Scholar] [CrossRef]
  14. Gao, J.; Huang, H.F.; Liu, J.Z.; Lei, Q.T.; Wang, C.J.; Han, Z.B.; Yang, G.; Li, Y. Helium release and lattice swelling in nickel foil irradiated by multiply-energy helium ions. Nucl. Instrum. Methods Phys. Res. Sect. B-Beam Interact. Mater. Atoms 2019, 450, 108–113. [Google Scholar] [CrossRef]
  15. Mukhawana, M.B.; Theron, C.C.; Malherbe, J.B.; Van der Berg, N.G.; Botha, A.J.; Grote, W.; Wendler, E.; Wesch, W.; Chakraborty, P. Behavior of iodine implanted in highly oriented pyrolytic graphite (HOPG) after heat treatment. Nucl. Instrum. Methods Phys. Res. Sect. B-Beam Interact. Mater. Atoms 2012, 273, 65–67. [Google Scholar] [CrossRef]
  16. Rocchini, M.; Chiari, M.; Pasquali, E.; Nannini, A.; Hadyńska-Klęk, K.; Sona, P.; Bazzacco, D.; Benzoni, G.; Camera, F.; Czelusniak, C.; et al. Applications of Rutherford backscattering analysis methods to nuclear physics experiments. Nucl. Instrum. Methods Phys. Res. Sect. B-Beam Interact. Mater. Atoms 2021, 486, 68–72. [Google Scholar] [CrossRef]
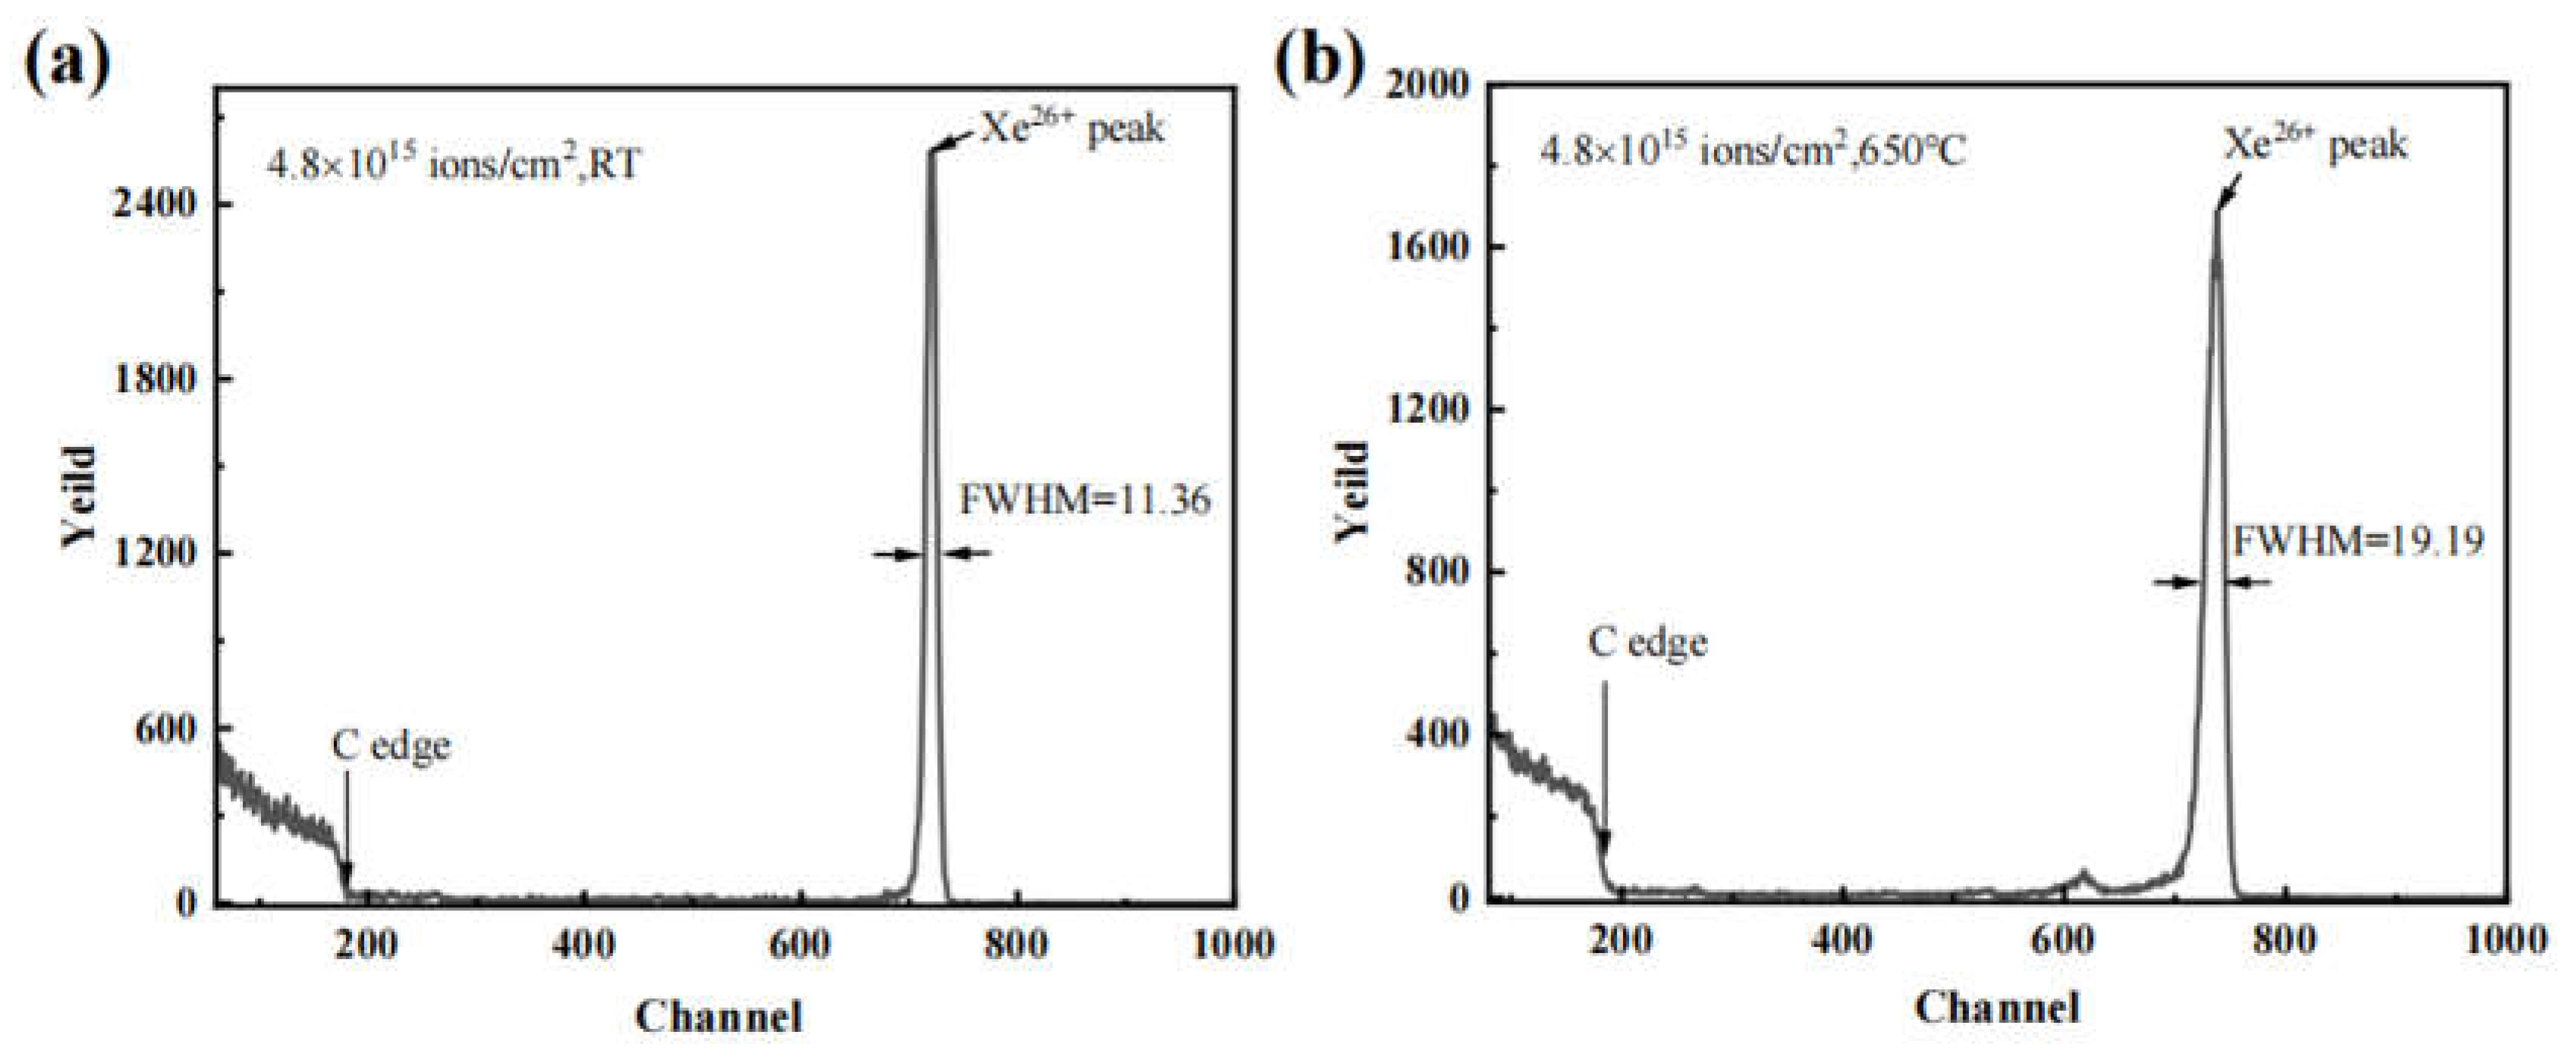
Figure 1. Rutherford backscattering spectroscopy (RBS) spectra of (a) Xe26+ implanted into SSNG at room temperature (RT) and (b) SSNG after injection of Xe26+ was held at 650°C for 9 h.
Preprints 86401 g001
Figure 2. Schematic diagram of the change of the injected layer after isothermal annealing of Xe26+ injected into SSNG graphite.
Preprints 86401 g002
Figure 3. RBS spectra of Au-coated Si sheets used to calibrate the energy scale of the detection system.
Preprints 86401 g003
Figure 4. A calibration plot for estimating the surface position for carbon and depth profile for Xe26+ implanted in SSNG.
Preprints 86401 g004
Figure 5. Schematic representation of a rectangular bar used to derive Fick’s law.
Preprints 86401 g005
Disclaimer/Publisher’s Note: The statements, opinions and data contained in all publications are solely those of the individual author(s) and contributor(s) and not of MDPI and/or the editor(s). MDPI and/or the editor(s) disclaim responsibility for any injury to people or property resulting from any ideas, methods, instructions or products referred to in the content.
Copyright: This open access article is published under a Creative Commons CC BY 4.0 license, which permit the free download, distribution, and reuse, provided that the author and preprint are cited in any reuse.
Prerpints.org logo

Preprints.org is a free preprint server supported by MDPI in Basel, Switzerland.

Subscribe

© 2024 MDPI (Basel, Switzerland) unless otherwise stated