3.1. Analysis of system structure and stability
The geometric structural optimizations were carried out for the intrinsic Zn
16O
16 supercell model, as well as doped Zn
15Nd
1O
16 and Zn
14Nd
2O
16 supercell models, and
Table 1 lists the intrinsic ZnO (i-ZnO) and doped ZnO system’s cell parameters. According to the analysis, as the concentration of Nd doping increased, the cell parameters of the doped system became larger and the volume also increased, indicating a lattice mismatch between Nd
3+ and ZnO. In accordance with the theory of quantum chemistry, the ionic radius of Nd
3+ (0.0983 nm) is bigger in contrast with that of Zn
2+ (0.074 nm), the system will have a greater volume after replacing Zn
2+ with Nd
3+. In addition, after doping, the repulsion between the excess positive charges of Nd
3+ is improved. Due to these two factors, the system volume after impurity doping will become greater and the lattice distortion will occur.
To further verify the doping system’s stability and the intricacy of Nd doping, the formation energy
Ef of the Nd-doped ZnO system was computed with the following equations [19, 20]:
where,
and
are the total energy of the doped and i-ZnO system, containing the same numbers of atoms,
is the number of Nd atoms,
is the number of replaced Zn atom,
and
are the chemical potentials of Nd and Zn (at T = 0 K), respectively. The calculated formation energies are also summarized in
Table 1. The formation energy
Ef of the Nd-doped ZnO system was negative and reduced with the rise of doping concentration, indicating easier doping.
3.2. Analysis of energy band structure
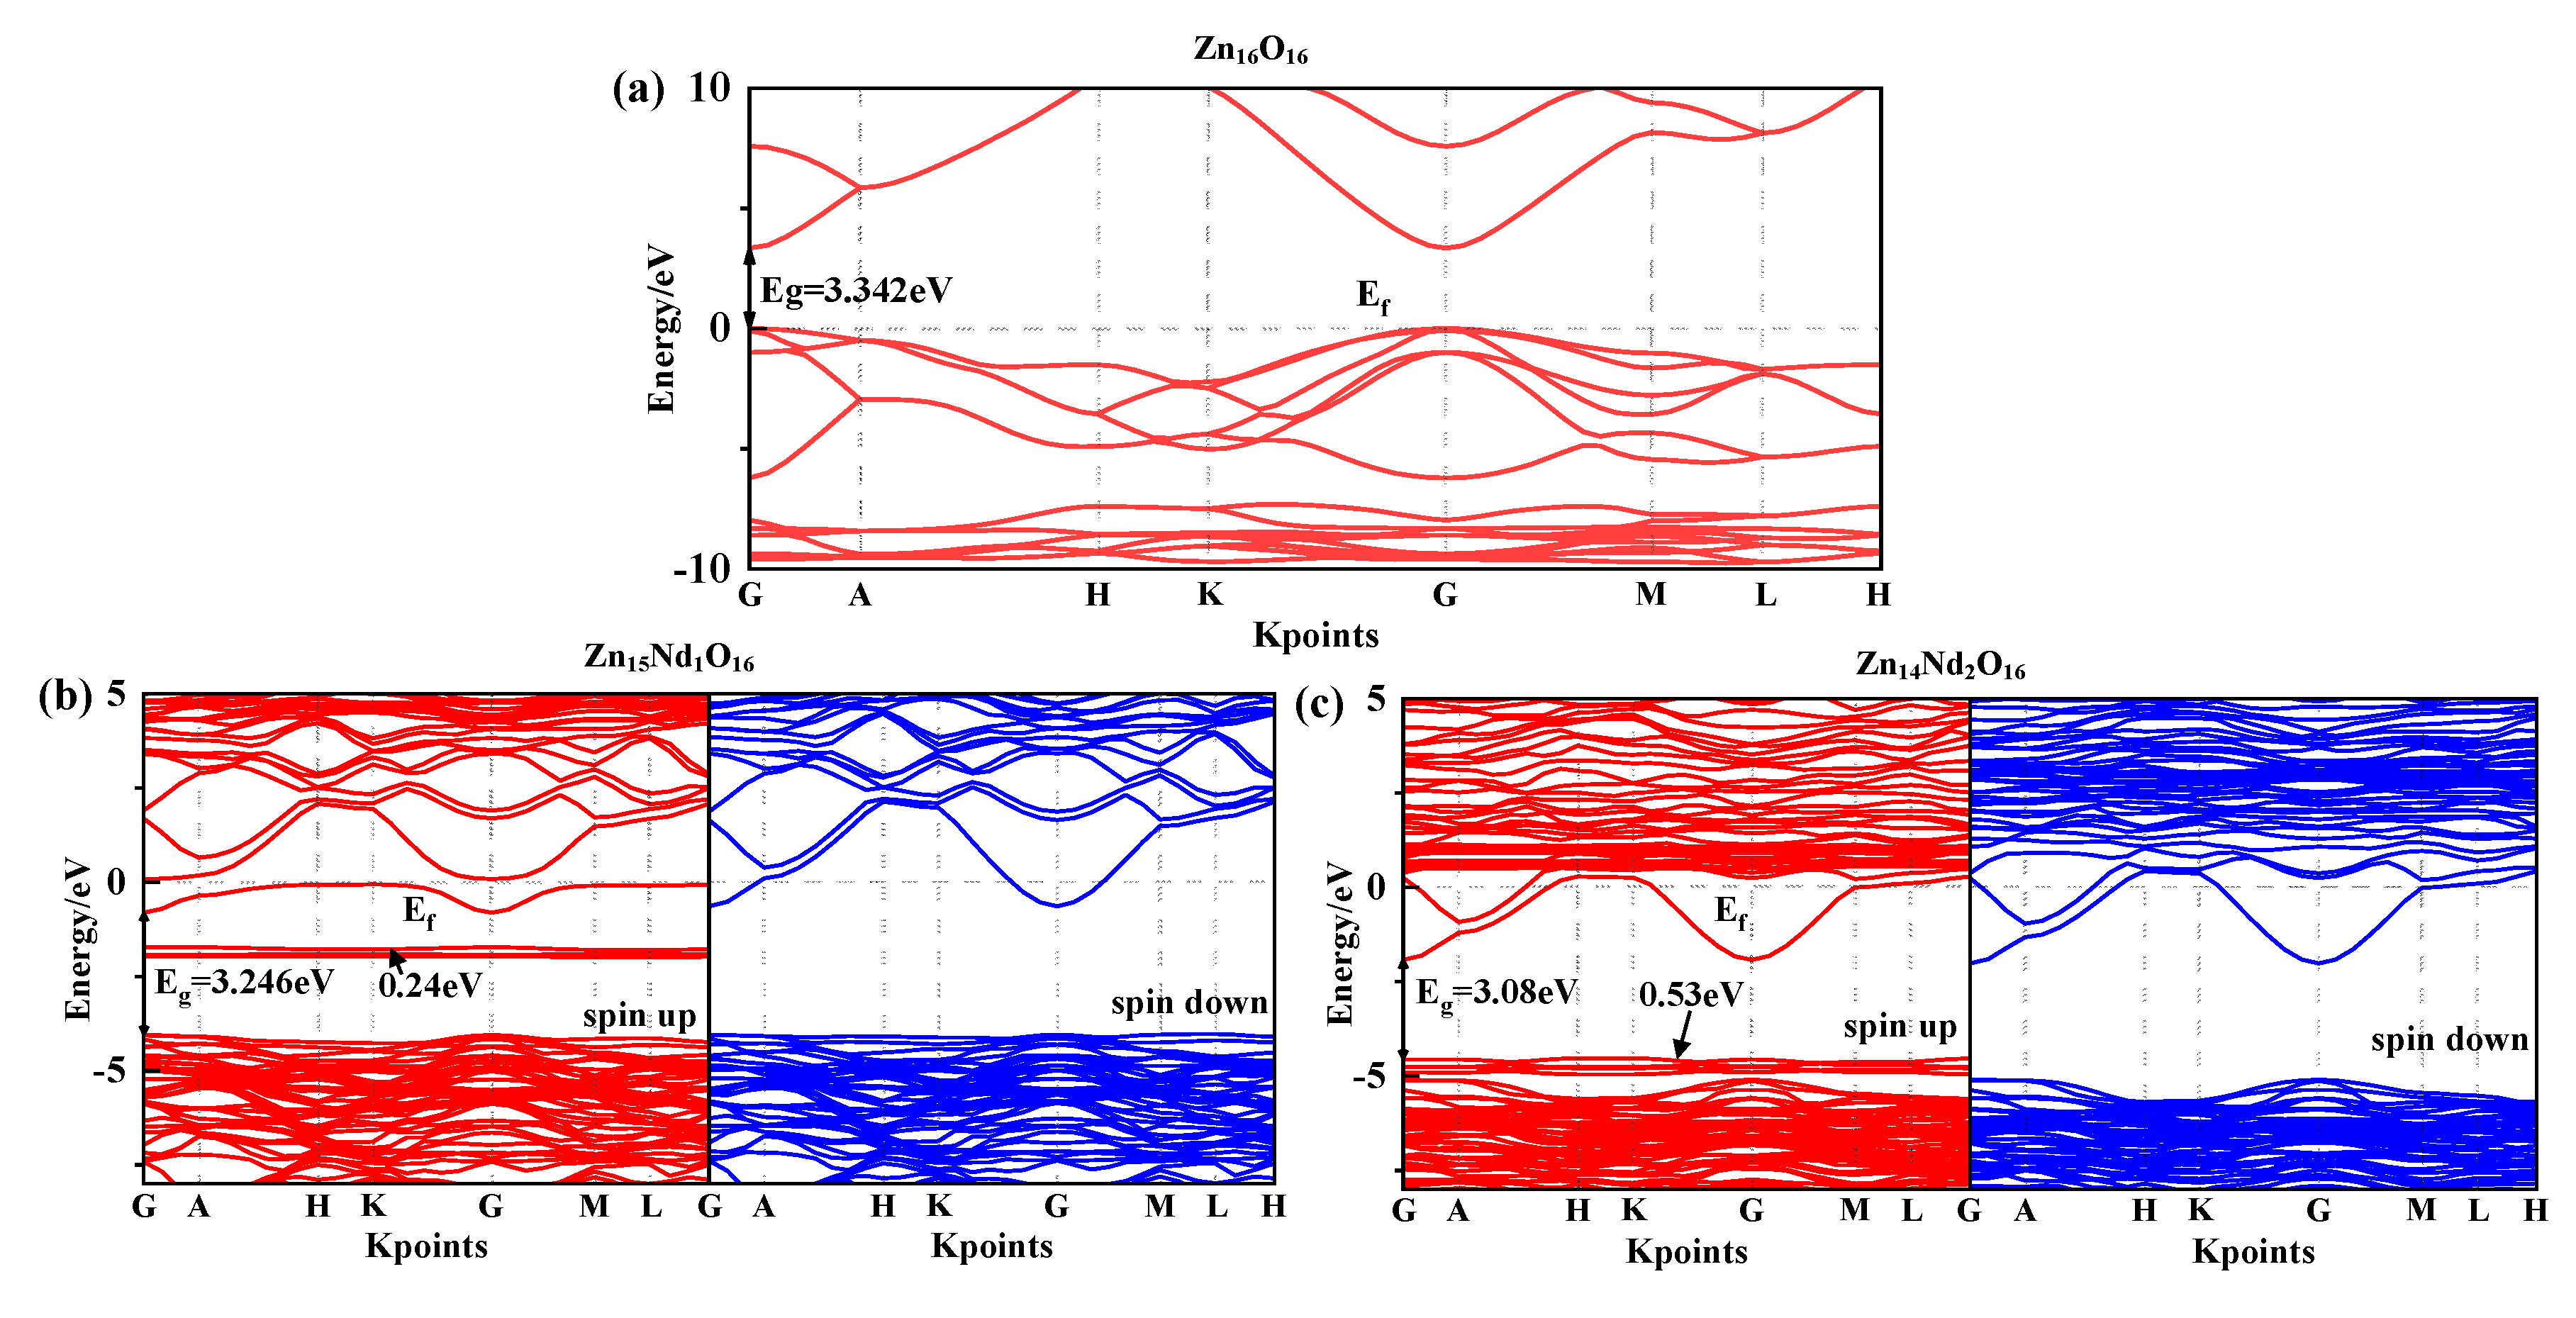
Under spin polarization conditions, the structure of the spin-up (SU) and spin-down (SD) energy band in i-ZnO and Nd-doped ZnO systems are illustrated in
Figure 2, and Fermi level of 0 eV is represented by the dotted line E
f. The high symmetry points of the band structure were located at G(0.0, 0.0, 0.0), A(0.0, 0.0, 0.5), H(-0.333, 0.667, 0.5), K(-0.333, 0.667, 0.0), M(0.0, 0.5, 0.0), and L(0.0, 0.5, 0.5). The i-ZnO’s band structure diagram is depicted in
Figure 2(a). Employing the modified GGA+U method, the calculated bandgap value for i-ZnO was 3.34 eV, which is essentially consisten with the experimental finding of 3.37 eV [
18]. Therefore, the selected U parameter was reliable. Furthermore, the top of the valence band (VB) and the bottom of the conduction band (CB) were positioned at the G points, and the transition type was G-G, indicating that i-ZnO is a direct bandgap semiconductor. Besides, the SU and SD bands of the i-ZnO system have the same structure, and there was no occurrence of a spin-splitting phenomenon, demonstrating that the i-ZnO material does not reveal magnetic characteristics.
Figure 2(b) and (c) are the diagrams of the SU and SD band structure of Nd-doped ZnO systems under spin polarization conditions. The bandgap values of Zn
15Nd
1O
16 and Zn
14Nd
2O
16 were 3.25 eV and 3.08 eV, respectively, indicating that the bandgap decreases with the increase of Nd doping concentration. This will be conducive to improving the doped system’s optical and electronic transport properties. The VB’s top and the CB’s bottom of Zn
15Nd
1O
16 and Zn
14Nd
2O
16 were positioned at point G, and the transition type was G-G, indicating that Nd-doped ZnO is a direct bandgap semiconductor. In the energy bands of Zn
15Nd
1O
16, a deep donor impurity energy level) was generated at 1.69 eV from the CB, and the ionization energy was large. From the density of states (DOS) in
Figure 3(b) and (c), the impurity energy level had a primary contribution from Nd-4f state electrons, some of the impurity energy levels coincided with the Fermi level, and the trapping effect was significant. The trap effect has the effect leads to the accumulation of non-equilibrium carriers on the impurity energy level [
21], which reduces the electron-hole recombination velocity and increases luminous efficiency concurrently. The impurity energy level shifted to lower energy with the increase of Nd doping concentration. In the energy band of Zn
14Nd
2O
16, a shallow main impurity energy level was produced at the VB’s top, and the number of impurity energy levels increased, meaning that the number of electrons that underwent level transitions increased. The photoexcited electrons absorbed lower energy and were transferred from the VB to the impurity energy level, and then absorbed lower energy again and further transferred from the impurity energy level to the CB’s bottom, resulting in an increased photocatalytic activity and realized the redshift of the absorption spectrum. The Fermi level in the band structure of Zn
15Nd
1O
16 and Zn
14Nd
2O
16 systems entered the CB, because the Nd atom lost 3 valence electrons of its 5d and 6s states, whereas the valence state of Zn in ZnO was +2. Nd introduced excess carriers (electrons) that occupied the CB energy level below the Fermi level. These carriers were degenerated and the doped system became n-type degenerate semiconductors, indicating that the conductivity and the metallicity of the Nd-doped ZnO system are enhanced. In addition, the structures for the SU and SD energy bands of the Nd-doped ZnO system were different, resulting in spin splitting, demonstrating that Nd-doped ZnO is magnetic and possesses electromagnetic transport properties.
3.3. Analysis of density of states
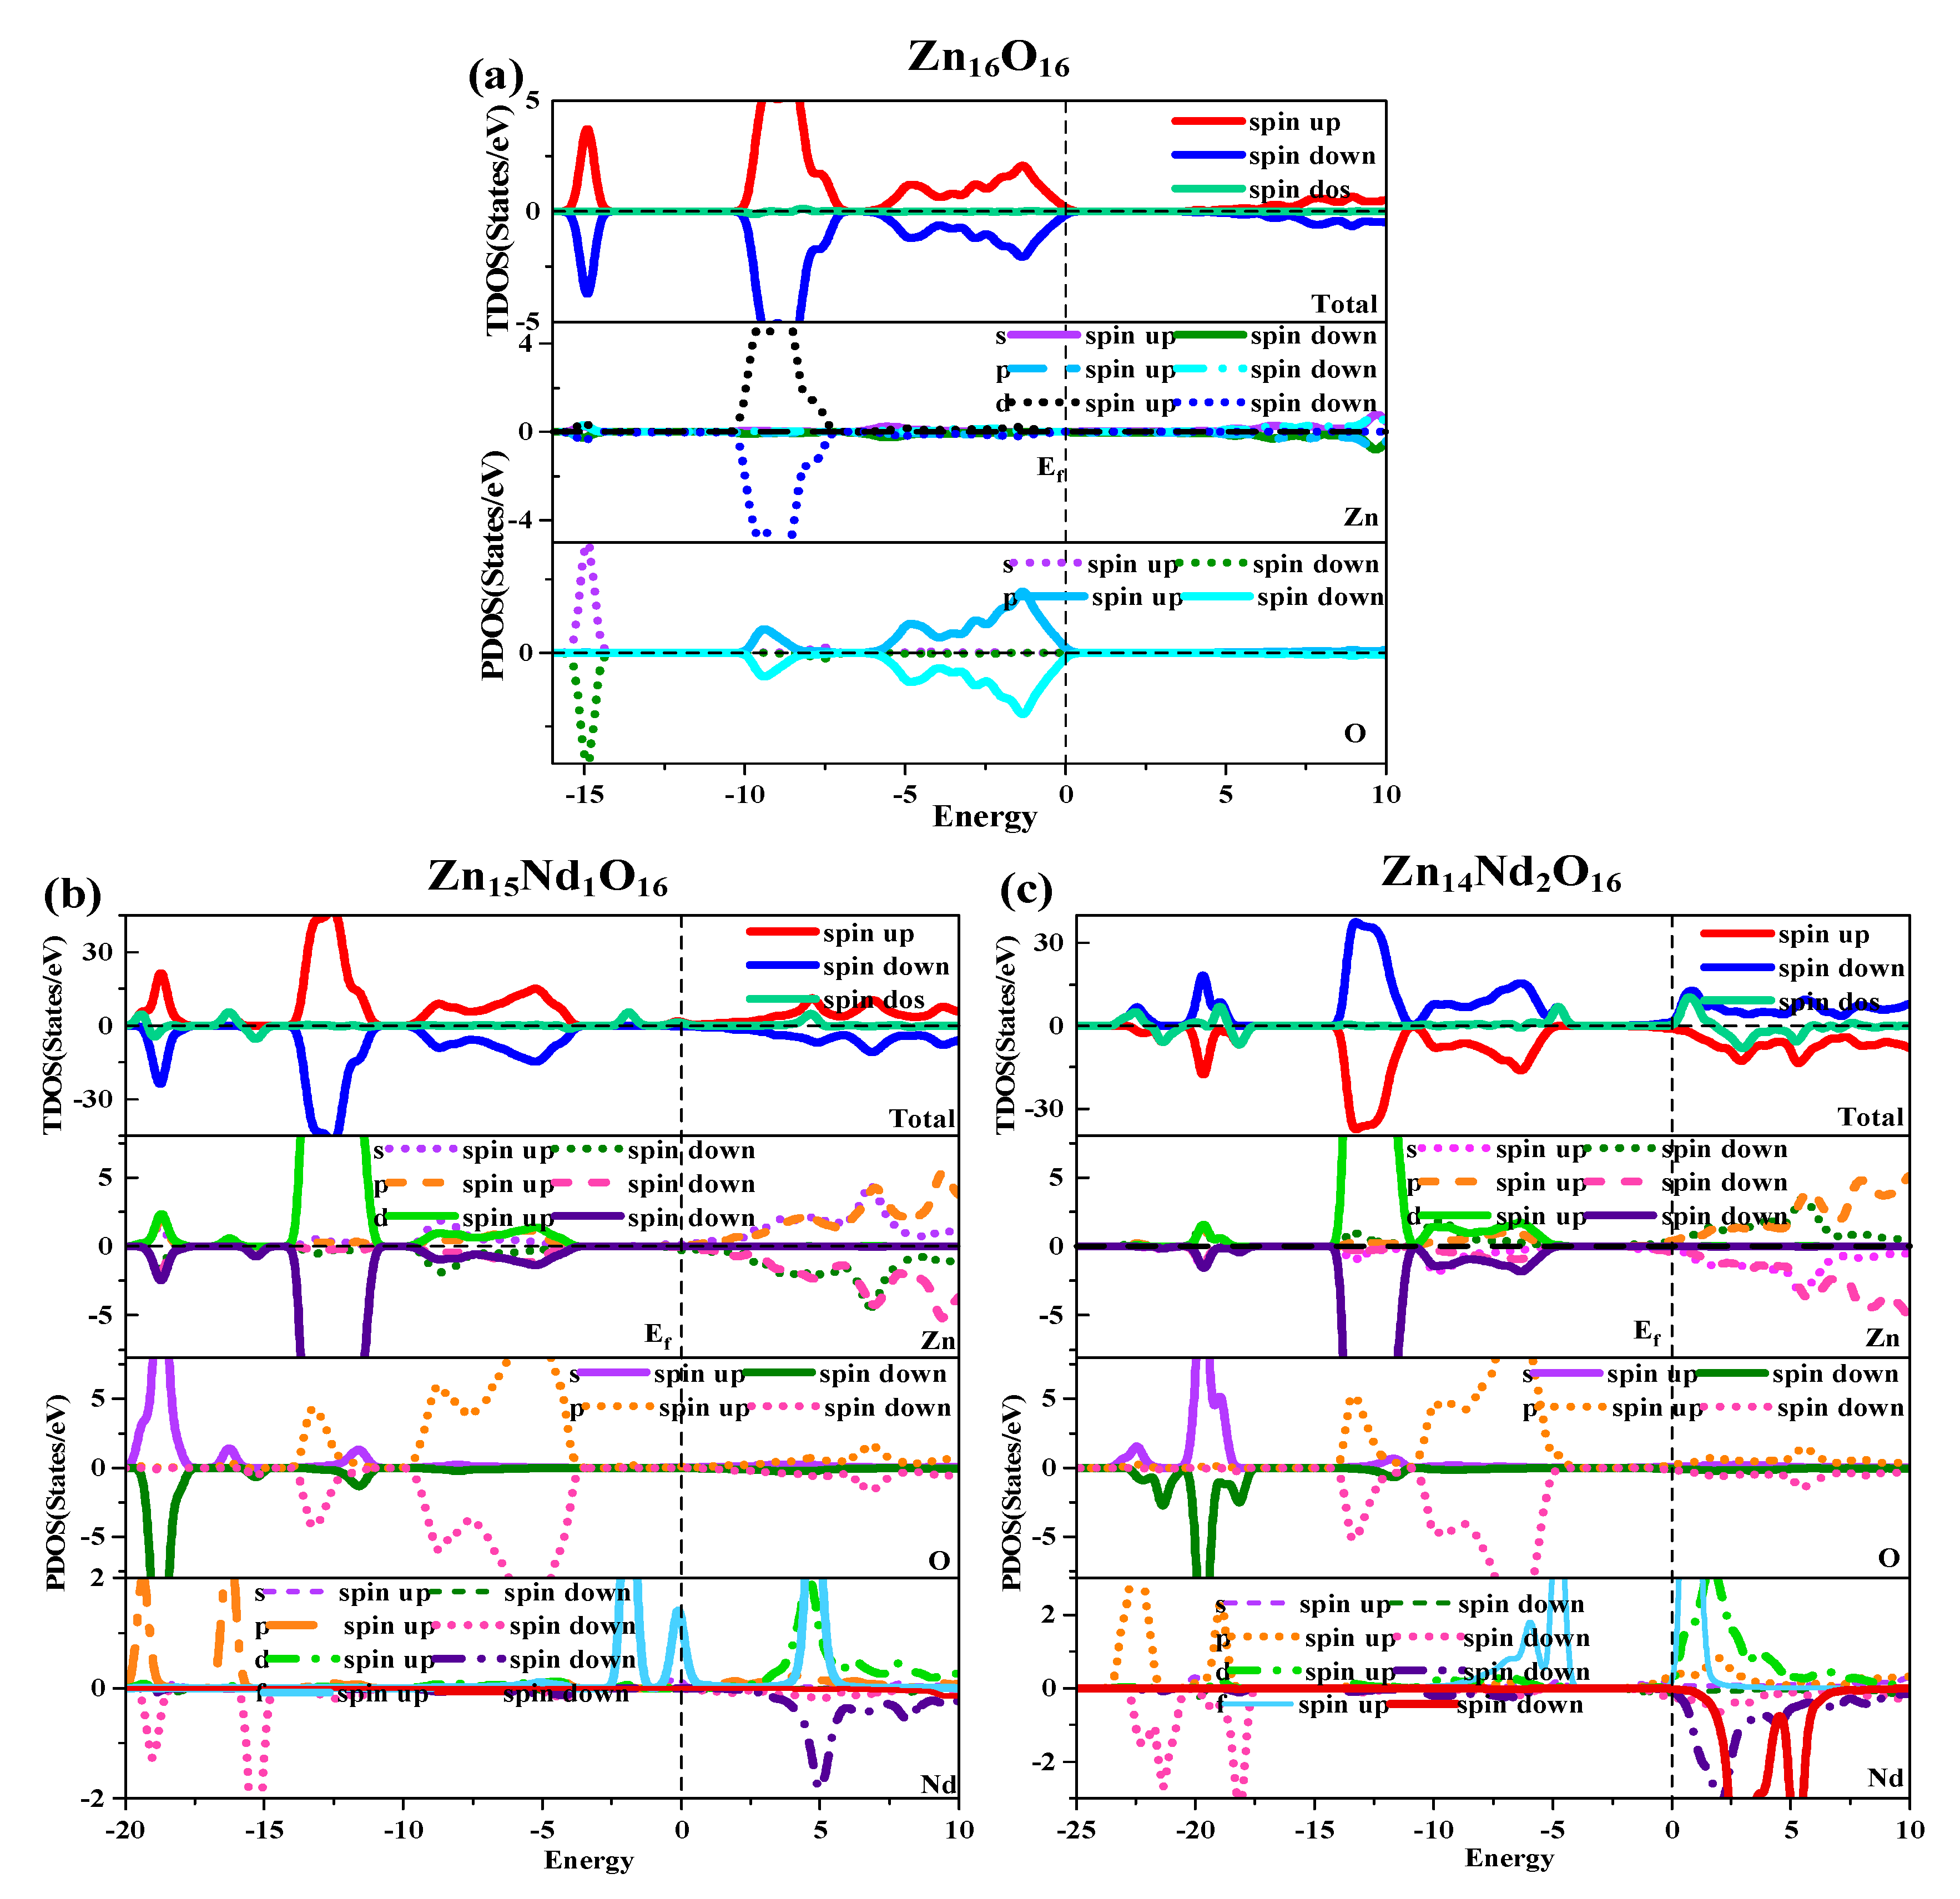
Under spin polarization conditions, the total (TDOS) and partial (DOS) of i-ZnO and Nd-doped ZnO are shown in
Figure 3. The GGA+U method corrected the interaction between electrons in atomic orbitals. The DOS distributions of the Zn-3d state and O-2p state in the VB near the Fermi level were noticeably divided, leading to the broadening of the VB, the weakening of p-d hybridization, and the moving of the O-2p state energy band in the direction of low energy. Therefore, the bandgap was widened and consistent with the experimental results. The deep VB (-15.8 eV, -14.3 eV) had a contribution from O-2s states, and it is strongly localized. The VB (-10.3 eV, -6.9 eV) had a contribution from the Zn-3d state and some O-2p state. Since Zn-3d state and O-2p state were strongly hybridized, strong Zn-O bonds were created. The upper VB (-6.3 eV, 0 eV) had a contribution from O-2p state electrons, while the CB had a contribution from Zn-4s and 3p state electrons. Additionally, it was discovered that the Zn-4s state determined the bottom position of the i-ZnO’s CB, and the O-2p state determined the top position of the i-ZnO’s VB. Thus, when the Zn and O atoms combined, electrons of these two states interacted to form a chemical bond, and the O-2p state contributed the majority. Furthermore, the total DOS of SU and SD orbitals were completely symmetric for i-ZnO, and the net spin DOS was zero, indicating that i-ZnO material does not exhibit magnetic characteristics.
Figure 3(b) and (c) illustrate the TDOS and PDOS of Nd-doped ZnO. At the top of VB, the repulsion of the anti-bonding Zn-3d state and O-2p state caused the shift of the VB towards the high-energy direction, while the interaction between the bonding Zn-3p state and O-2p state led to the shift of the VB in the direction of low energy. Because the bonding effect was greater in contrast with the anti-bonding effect, the VB moved in the direction of low energy. Concurrently, the CB experiences a more significant reduction, resulting in a narrower bandgap for the Nd-doped ZnO system. Moreover, the Fermi level entered the CB, leading to a band-tail effect, which is conducive to improving the doped system’s optical and electronic transport properties. The doping of Nd introduced strongly localized states in the CB, which were separately contributed by Nd-5d and Nd-4f electrons. The concentration of CB carriers increased, and electrons underwent degeneracy, showing n-type degenerate semiconductor characteristics. The doping of Nd primarily involved the hybridization of Nd-5d and Nd-4f states, which had a significant impact on the DOS at the VB top, forbidden band, and CB bottom of the doped system. The energy region (20 eV, -17.7 eV) had a primary contribution from O-2s, Zn-3d, and Nd-5p state electrons, (-14.2 eV, -10.9 eV) had a primary contribution from Zn-3d and O-2p state electrons, and (9.6 eV, -3.7 eV) had a primary contribution from Zn-3d, and O-2p state electrons. The impurity energy level of forbidden band had a primary contribution from Nd-4f state electrons. The CB’s localized state had a primary contribution from the hybridization of Nd-5d and Nd-4f state electrons. For Zn
15Nd
1O
16 and Zn
14Nd
2O
16 systems, the TDOS curves of the SU and SD orbitals were asymmetric, so the net spin density of states was not zero. The SU state of the Nd-4f state was completely occupied, while the SD state has empty below the Fermi level. The spin splitting was obvious. The Nd-4f state electrons had a net magnetic moment (MM), and the SU and SD orbitals of the O-2p state electrons were asymmetric, indicating that Nd-doped ZnO has obvious magnetic characteristics and electromagnetic transport capability.
3.4. Analysis of orbital charges
The Mulliken population analysis was used to describe the transfer of charge after bonding between atoms[
22]. Under spin polarization conditions, the Mulliken charge distribution of i-ZnO and Nd-doped ZnO systems are depicted in
Table 2. From the table, in i-ZnO, the Zn atom had a strong capacity to release electrons, resulting in a +0.93 positive charge, while the O atom had a strong capacity to gain electrons, resulting in -0.93 negative charge, primarily owing to the electronic transfer from Zn-4s state to O-2p state. Besides, in i-ZnO, the number of SU and SD electrons in each orbital of Zn was the same as that of O, indicating that i-ZnO was not magnetic, which is consistent with the band structure analysis finding in section 3.2 and the state density analysis finding in section 3.3.
In the Nd-doped ZnO system, the doped atom transforms into a center that is positively charged and has properties of donor impurities as a result of losing electrons. For the Zn15Nd1O16 system, the Nd atom lost electrons, resulting in a +1.05 positive charge, the Zn atom lost electrons, resulting in a +0.88 positive charge, while the O atom gained electrons, resulting in a -0.99 negative charge, due to the electronic transfer from Nd-6s and Nd-4f states to Zn-3p and O-2p states. For the Zn14Nd2O16 system, the number of electrons lost by two Nd atoms decreased, resulting in +1.01 and +0.87 positive charge in total, the number of electrons lost by Zn atoms increased, resulting in +0.92 positive charge, and the number of electrons obtained by O atoms correspondingly decreased, resulting in -0.88 negative charge. The distribution of O-2s and 2p electrons remained almost unchanged after Nd doping, indicating that the Nd-O chemical bond was relatively stable. The Nd atom has a higher number of positive charge, indicating that the Nd atom contributed more electrons due to the difference between the valence electron of Nd and that of Zn. Furthermore, the findings revealed that the charge numbers of spin-up and spin-down orbitals of Zn15Nd1O16 and Zn14Nd2O16 systems were different, demonstrating that Nd-doped ZnO materials were magnetic, which is in line with the band structure analysis finding in section 3.2 and state density analysis finding in section 3.3.
3.7. Optical properties
The semiconductors’ optical properties have a strong link to the electronic structure. The bulk materials’ optical properties are typically examined in the linear response region employing the dielectric functions (DFs). Thus, the DFs, absorption coefficients, reflectivities, and energy loss functions (ELFs) were calculated to systematically analyze the influence of the doping of Nd on the optical properties of ZnO. In accordance with the description of direct transition probability and Kramers-Kronig dispersion relation, the imaginary part
and real part
of the crystal DF, absorption coefficient, reflectivity, and ELF can be derived and the results are presented below (See Refs. [25-27] for detailed derivation process):
where, is the vacuum’s dielectric constant, is the vacuum’s wavelength, is the Planck constant, and are the CB and VB, respectively, BZ denotes the first Brillouin zone, is the electron wave vector, is the unit direction vector of the vector potential , is the transition matrix’s element, is the electromagnetic frequency, is the reflectivity, and are the intrinsic energy level of the CBs and VBs, respectively, is the ELF and is the absorption coefficient.
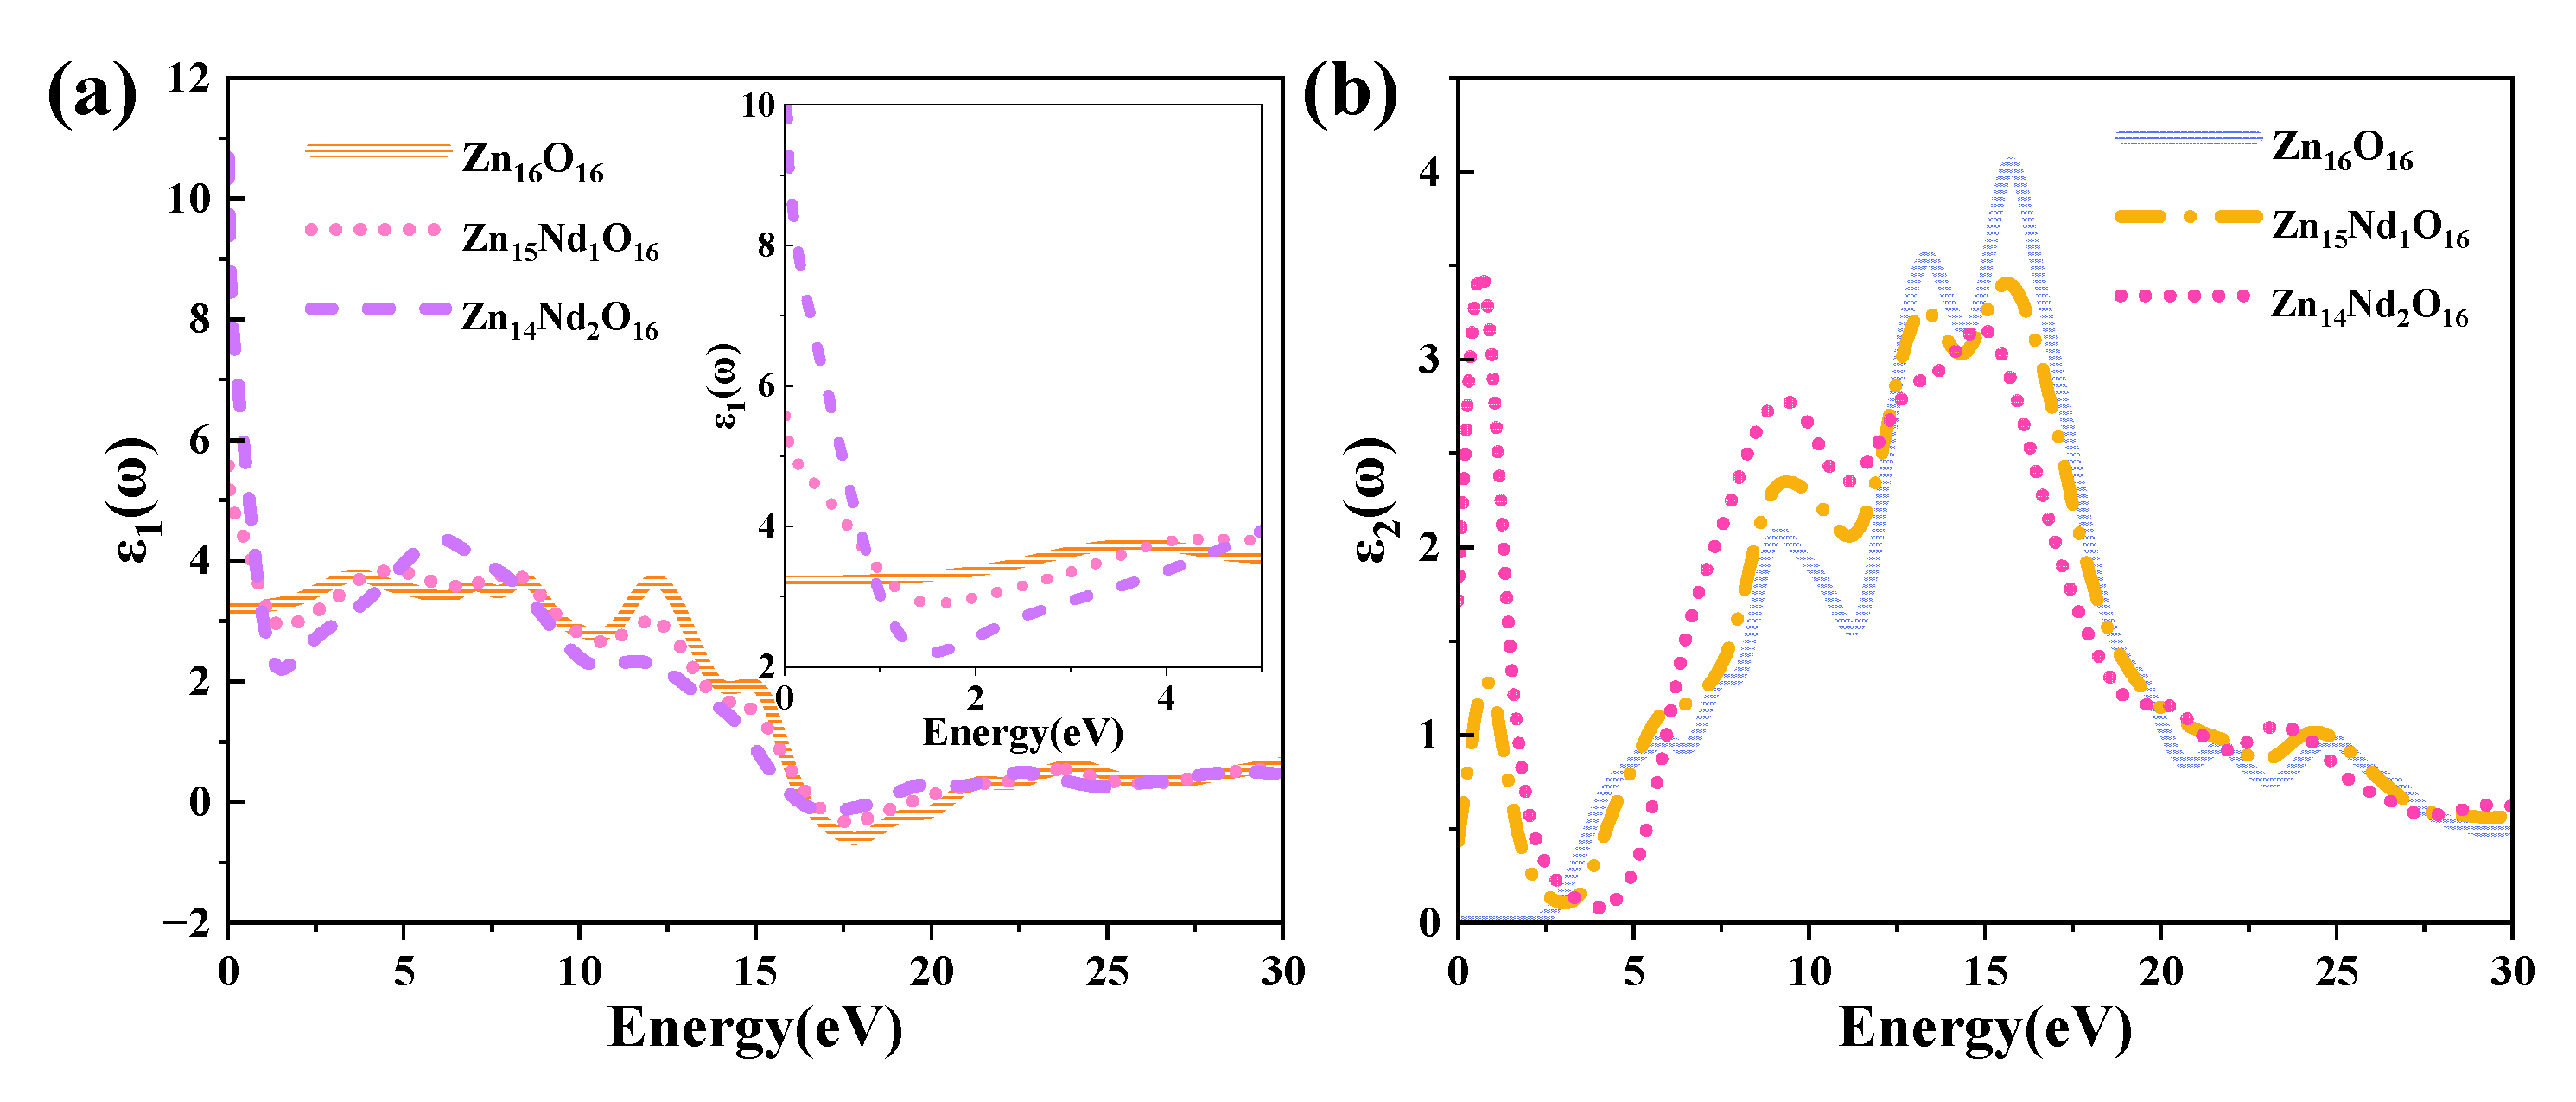
The DF curves of i-ZnO and Nd-doped ZnO systems are depicted in
Figure 5.
Figure 5 (a) presents the curves of the DF’s real part. The average static dielectric constant of i-ZnO, Zn
15Nd
1O
16, and Zn
14Nd2O
16 were 3.21, 5.58, and 10.70, respectively. in contrast with i-ZnO, the dielectric constants of these doped systems all increased, indicating that Nd doping enhanced the polarization of the system and prolonged the lifetime of photoelectrons in the CB, indicating that Nd doping improved the photocatalytic performance of the system. With the rise of the doping concentration, the photocatalytic performance was enhanced. The average static dielectric constant of the Zn
14Nd
2O
16 system was the largest, demonstrating that its photocatalytic activity was the best.
The curves of the DF’s imaginary part are depicted in
Figure 5 (b). Four dielectric peaks were visible in the imaginary part of the i-ZnO’s DF. The first peak positioned at 5.82 eV was primarily caused by electronic transitions from the O-2p state at the VB’s top to the Zn-4s state at the CB’s bottom. The second peak positioned at 9.15 eV was primarily owing to electronic transitions from Zn-3d and O-2s states in the VB far away from the Fermi surface to O-2p and Zn-3d states at the VB’s top. The third peak positioned at 13.33 eV was primarily derived from the electronic transitions from the Zn-3d, O-2s, and O-2p states in the VB away from the Fermi surface to the Zn-4s state at the CB’s bottom. The fourth peak positioned at 15.71 eV was primarily attributed to the electronic transitions from O-2s, Zn-3d, and Zn-4s states in the VB far away from the Fermi surface to the O-2p state at the VB’s top. After Nd doping, a new peak near 0.7 eV emerged, primarily owing to the electronic transitions from the impurity levels in the bandgap to the CB’s bottom. According to the PDOS in
Figure 3, in the Nd-doped ZnO system, the first peak was primarily produced by the electronic transitions from the impurity level of the Nd-4f state coinciding with the Fermi surface to the Zn-4s state at the CB’s bottom. With the increase in doping concentration, the peak value and the transition probability increased. Compared to i-ZnO, the peaks around 5.82 eV and 9.15 eV of Nd-doped ZnO systems were shifted towards the high energy direction (blueshift), with an increased peak value. The peaks near 13.33 eV and 15.71 eV were shifted towards the low energy direction (redshift), with a decreased peak value.
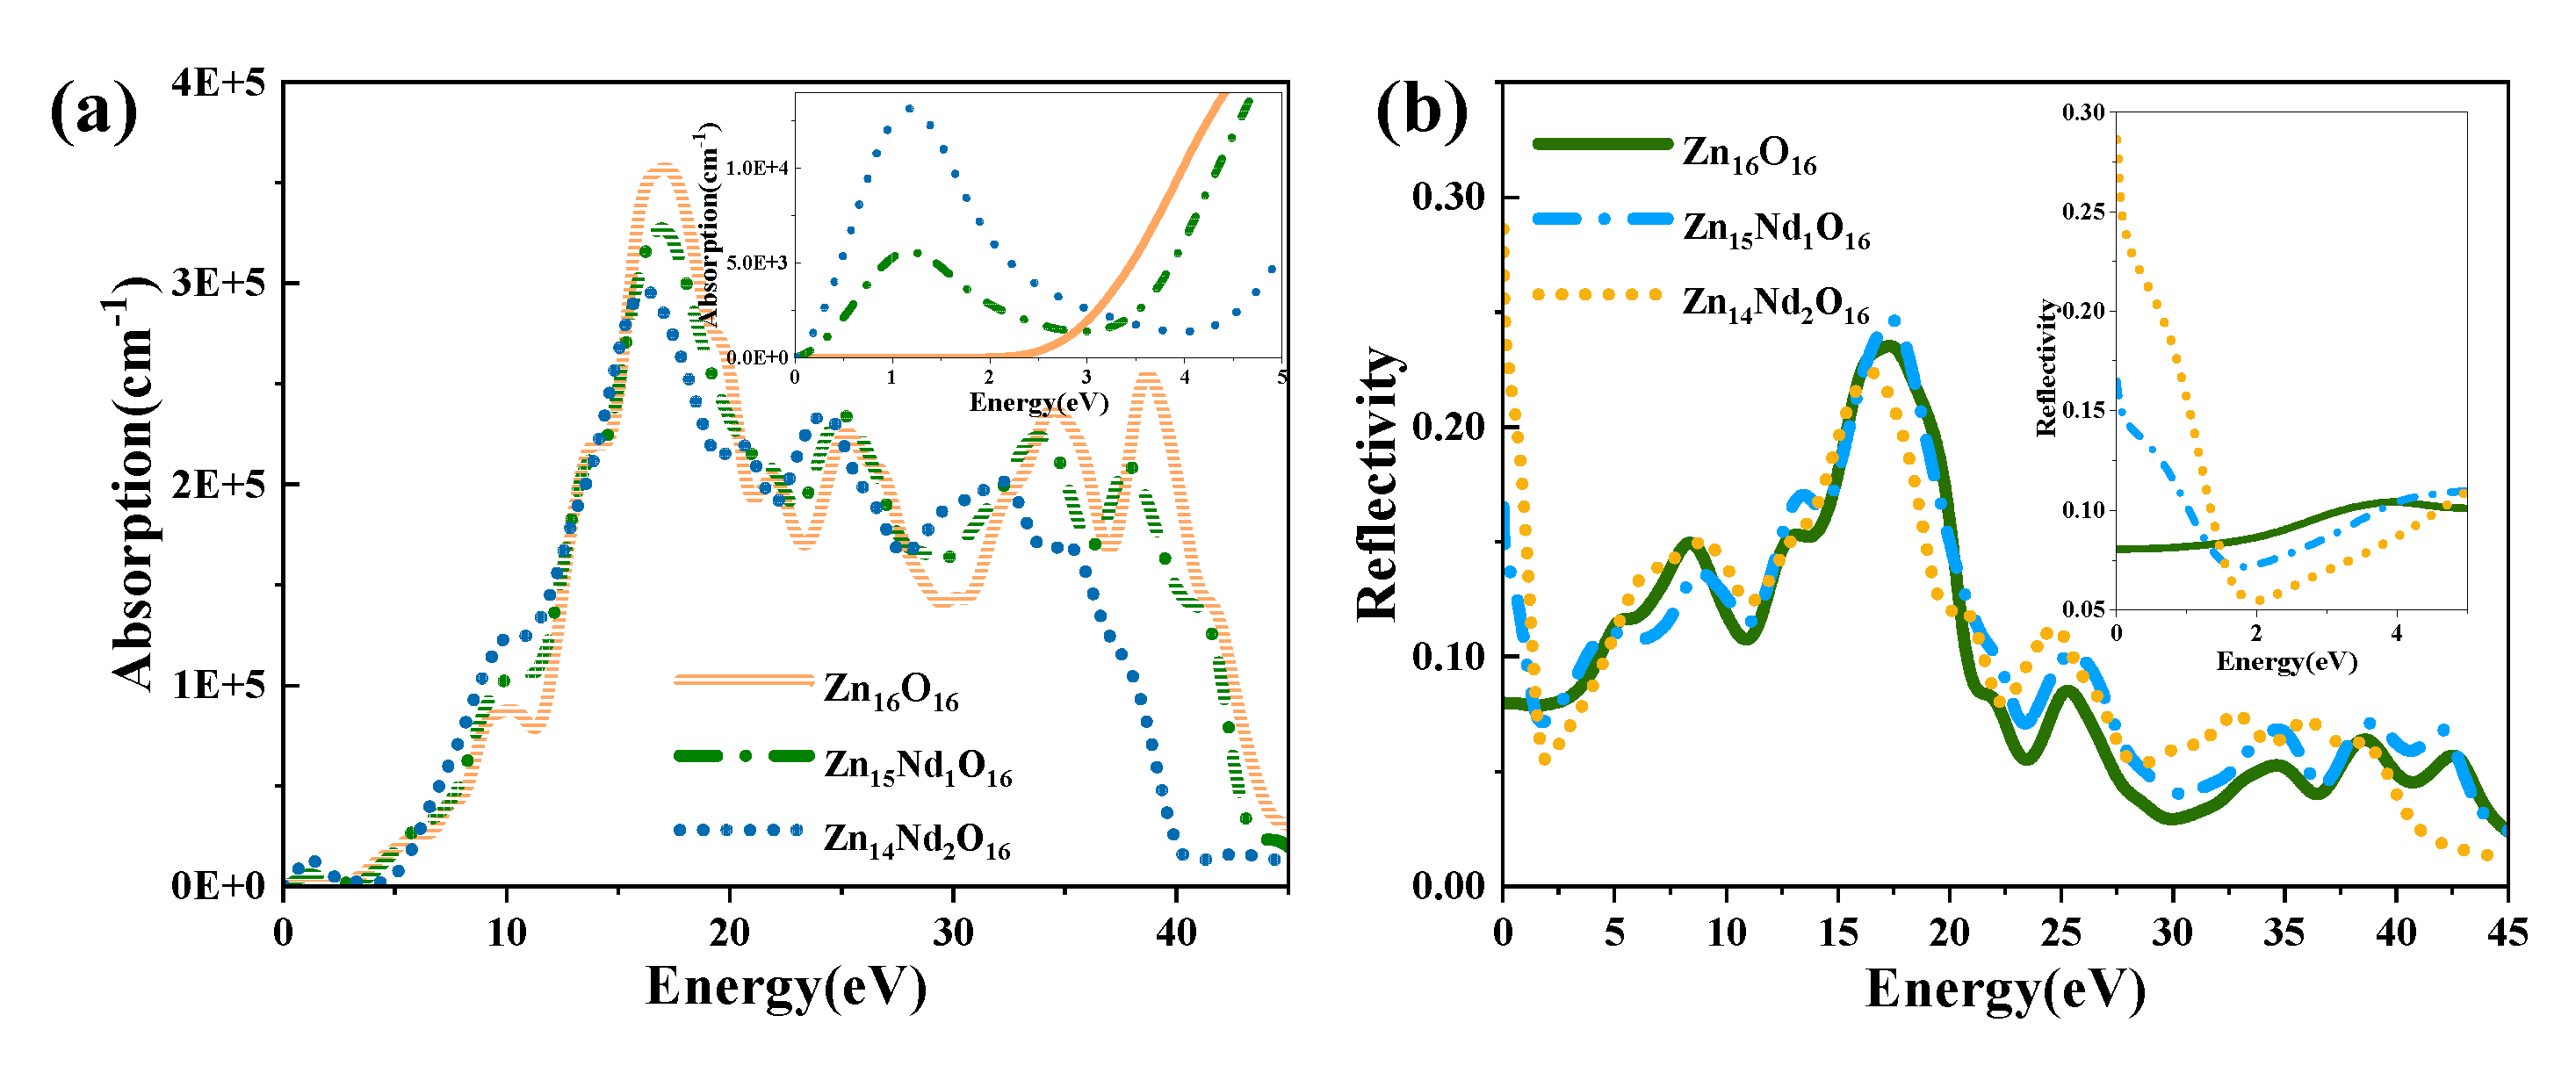
The absorption and reflection spectra of i-ZnO and Nd-doped ZnO systems are presented in
Figure 6.
Figure 6(a) displays the absorption spectra that were calculated using equations (6). The absorption coefficient was 10
5 cm
-1, and the absorption edge of i-ZnO located around 3.30 eV denoted the onset of intrinsic absorption, which investigates the important ZnO’s optical properties. The absorption coefficient undergoes a sharp enhancement in the order of 10
5 with the rise of photon energy, meaning strong optical absorption occurred. The direct transition began, and the absorption edge of Nd-doped ZnO moved towards the high energy direction, resulting in a blueshift. This was induced by the introduction of several carriers (electrons) by donor atoms of Nd. In addition, the Fermi level entered the CB, leading to the Burstein-Moss effect [28, 29]. In the visible region (1.63 eV-3.10 eV), the i-ZnO’s optical absorption was extremely marginal and almost non-existent, while the Nd-doped ZnO system’s optical absorption was significantly enhanced. This was ascribed to the formation of a deep impurity energy level partially coinciding with the Fermi level in the forbidden band after doping, which significantly improved the photocatalytic performance of ZnO. The optical absorption intensity of Zn
14Nd
2O
16 was the greatest, signifying that the photocatalytic activity of this system was the best. The maximum optical absorption intensity was achieved at around 16.7 eV. Compared with i-ZnO, the maximum light absorption peak was shifted towards the low energy direction, resulting in an obvious redshift. As the doping concentration increased, the redshift phenomenon became more pronounced, expanding the infrared absorption range of ZnO. On the basis of the PDOS diagram in
Figure 3, the maximum absorption peak was produced by electronic transitions from the O-2s state in the deep VB to the CB’s bottom.
Figure 6 (b) shows the curves for the reflectivity of i-ZnO and Nd-doped ZnO systems, which were determined using equations (5). The static reflectivity R (0) of i-ZnO was 0.08, while R (0) of Zn
15Nd
1O
16 and Zn
14Nd
2O
16 were 0.17 and 0.29, respectively. In the range of 16 eV to 20 eV, the reflectivity was high. For i-ZnO, the highest reflectivity of 0.24 was reached at 17.2 eV. The highest reflectivity was 0.25 at 17.4 eV for Zn
15Nd
1O
16 and 0.22 at 16.5 eV for Zn
14Nd
2O
16. The maximum reflectivity of i-ZnO and Nd-doped ZnO systems appeared in the ultraviolet region, and the magnitude was approximately 0.2. With the rise of Nd doping concentration, the reflectivity peak decreased; the reflectivity peak of the single-Nd-doped ZnO system was larger than that of i-ZnO, and the peak underwent a blueshift; and the reflectivity peak of dual-Nd-doped ZnO system was less than that of i-ZnO, and the peak underwent a redshift. In the low-energy region, the reflectivity of the Nd-doped system was higher than that of i-ZnO. Some photons are reflected, some are absorbed, and the remaining portion is transmitted through the substance as they travel through it. Therefore, , the absorption coefficient and reflectivity increased in the region of low energy for Nd doped ZnO, and decreased the transmittance. However, the absorption coefficient and reflectivity decreased in the high-energy region, while the transmittance increased in the ultraviolet region.
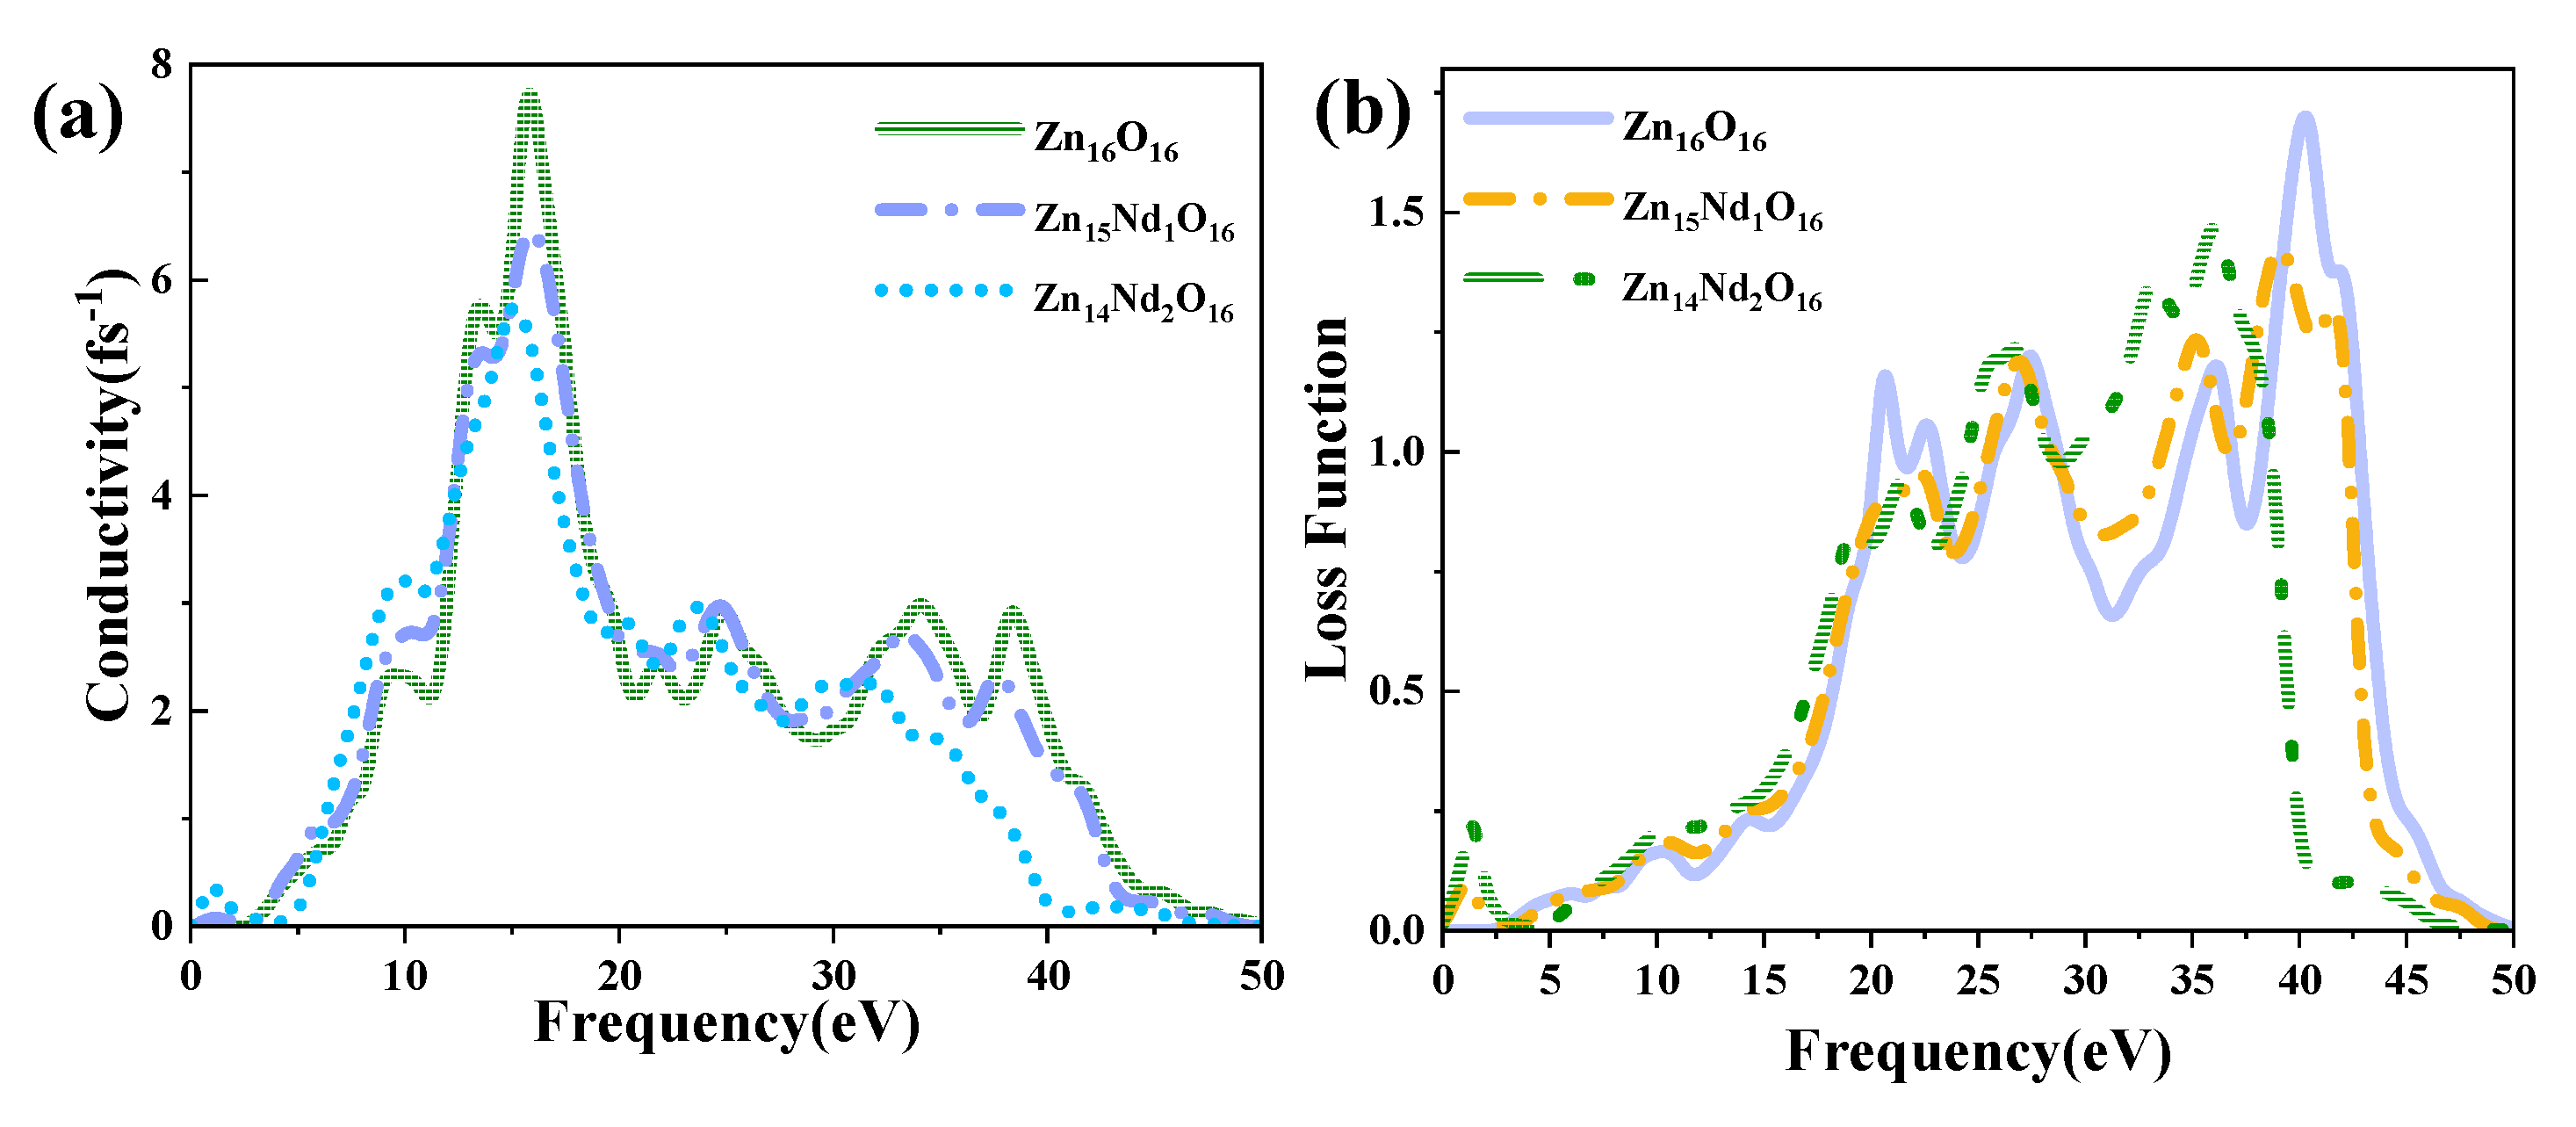
Figure 7 (a) shows the PC for i-ZnO and Nd-doped ZnO systems, corresponding to the imaginary part
of DFs (
Figure 5 (b)). In the range of 10 eV to 20 eV, i-ZnO and Nd-doped ZnO systems showed high conductivity, and the PC reached its maximum value near 15 eV. The peak values of i-ZnO, Zn
15Nd
1O
16 and Zn
14Nd
2O
16 were 7.71 fs
-1, 6.47 fs
-1, and 5.72 fs
-1, respectively. In the visible region, the PC of i-ZnO and Nd-doped ZnO systems increased with the rise of the energy of incident photons. Comparing the peak PC of all systems in the low energy region, the PC of the Nd-doped ZnO system was larger compared to that of i-ZnO, which was owing to the increase of the electron density of Nd-4f state at the doped system’s Fermi level, resulting in the increase of the PC in the region of low energy. However, the PC of all systems was small, and as the number of Nd atoms increased, the peak was shifted to the left, indicating that Nd doping improved the PC of ZnO semiconductors in the visible region.
Figure 7(b) displays the ELF of i-ZnO and Nd-doped ZnO systems. The plasma frequencies of i-ZnO, Zn
15Nd
1O
16, and Zn
14Nd
2O
16 were 40.29 eV, 39.10 eV, and 36.08 eV, respectively. With the rise of Nd doping concentration, the peak value was redshifted, and the intensity was weaker than that of the i-ZnO system.
3.8. Magnetic. properties
Rare earth elements have large MM and strong orbital anisotropy, and can possibly improve the magnetic properties of doped ZnO semiconductors. According to Dhar
et al. [
30], Gd-doped GaN has a huge MM, and it is envisaged that the coupling between the 4f state electrons of rare earth ions and the host’s electrons can produce stable ferromagnetism, which was conducive to the study of ZnO magnetism. ZnO consists of a large number of s electrons and presents n-type conductivity. By using the spin polarization computational method, we calculated the magnetic coupling and total MM of the intrinsic and Nd-doped ZnO systems (
Table 4), as well as the atomic MM and orbital MM (
Table 5). Analysis shows that the total MM of i-ZnO was equal to 0 μB, indicating that the Zn
16O
16 system was non-magnetic, which has consistency with the band structure analysis finding in section 3.2 and the state density analysis result in section 3.3. The sum of the absolute values of MM of the Nd-doped ZnO system was not equal to zero, demonstrating that the doped system was magnetic. The total MM of Zn
15Nd
1O
16 and Zn
14Nd
2O
16 systems were 3.75 μB and 5.97 μB, respectively, and with the rise of concentration of Nd doping, the total MM of the doped system increased, showing obvious ferromagnetism.
From
Table 5 and referring to
Figure 1(b) and (c) for the atomic positions, in Zn
15Nd
1O
16, the atomic MM of the Nd atom was 3.79 µB, the orbital MM of Nd-4f, Nd-4d, and Nd-5s orbitals were 3.67 µB, 0.07 µB, and 0.06 µB, respectively, the atomic MM of surrounding Zn atoms was about 0.01 µB, the orbital MM of Zn-4s orbital was about 0.01 µB, the atomic MM of surrounding O atoms was about -0.03 µB, the orbital MM of O-2s and O-2p orbitals was about -0.01 µB and -0.02 µB, respectively; in Zn
14Nd
2O
16, the atomic MM of two Nd atoms were 3.06 µB and 3.08 µB, respectively, the orbital MM of Nd-4f and Nd-4d orbitals were 2.96 µB, 0.07 µB, respectively, the atomic MM with a single surrounding Zn atom was about -0.01 µB, the orbital MM of Zn-4s orbital was about -0.01 µB, the atomic MM of O atom was about -0.02 µB, the orbital MM of O-2s and O-2p orbitals were about -0.01 µB and -0.01 µB, respectively. We concluded that the total MM of Zn
15Nd
1O
16 had a primary contribution from Nd-4f, Nd-4d, and Nd-5s orbitals, as well as O-2s, O-2p, and Zn-4s orbitals near Nd atoms, while the magnetism of Zn
14Nd
2O
16 primarily came from the coupling between two Nd atoms and O atoms, wherein Nd-4f orbital contributed the most. Additionally, it was found that the coupling between Nd and Zn was FM, and the coupling between Nd and O was AFM.
The above conclusions indicate that the magnetism of the Nd-doped ZnO system originated from the double exchange mechanism caused by orbital-spin interaction[31-33], that is, the anisotropic exchange of Nd atoms. In addition, according to the Goodenough-Kanamori rule, since Nd-4f orbital is in a semi-full state, its ferromagnetism is significant [34, 35], and the electrons of Nd-4f orbital are localized electrons that contribute to magnetism, and these localized electrons couple with the conductive electrons in surrounding orbitals such as Zn-3p, O-2s, and O-2p orbitals, and conductive electrons are spin-polarized, resulting in different densities of the SU and SD electrons, thus the spin polarization direction of electrons in Nd-4f orbital is determined and spin transport is realized. Therefore, Nd-doped ZnO systems show FM characteristics, which can be further verified by the partial-wave density analysis of the doped system.
To reveal the Nd doping effect on the ZnO’s magnetic properties more intuitively, the diagram of TDOS in
Figure 3 was analyzed.
Figure 3 (a) shows that the value of the net DOS of i-ZnO was 0, and the curves of the SU and SD TDOS of i-ZnO are absolutely symmetrical, demonstrating that i-ZnO is non-magnetic.
Figure 3(b) and (c) present that the values of the DOS of Zn1
5Nd
1O
16 and Zn
14Nd
2O
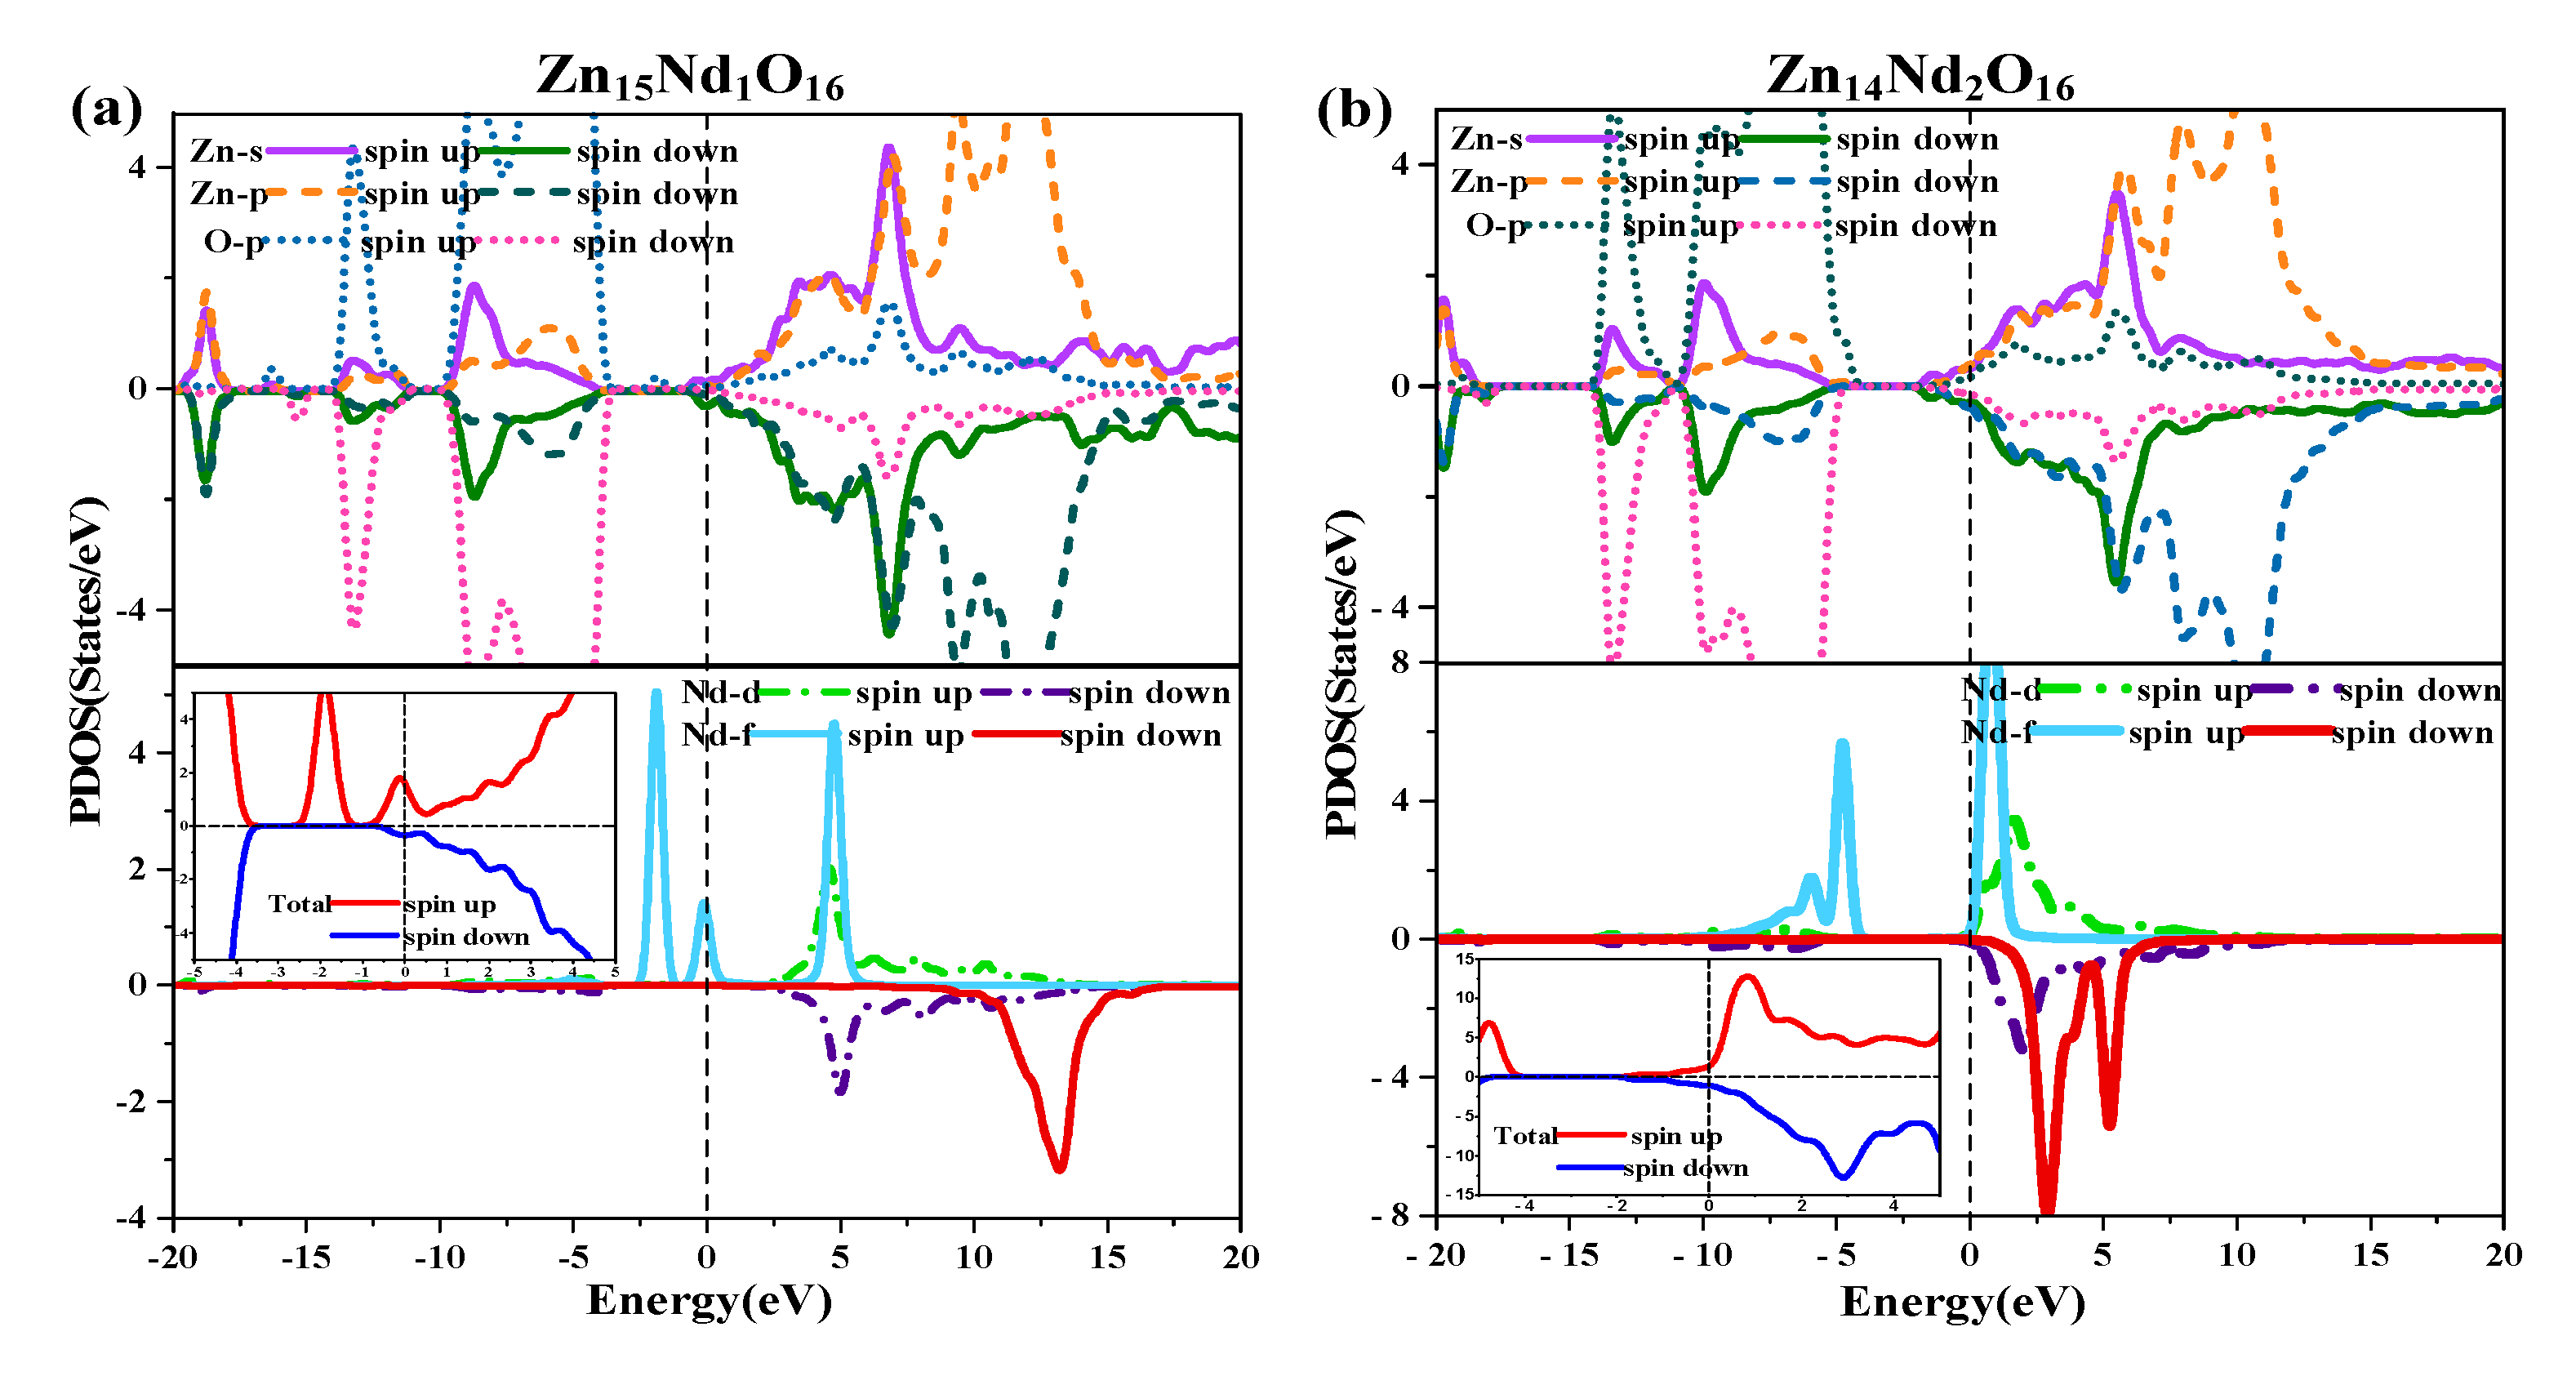
16 systems were not zero, indicating that the curves of the SU and SD TDOS of the Nd-doped ZnO systems were not completely symmetrical. There was a variation in the number of electrons in the SU and SD directions, demonstrating that the doped system had a net MM, which is consistent with the analysis findings of the total MM. Further analysis of the PDOS in
Figure 8 shows that the magnetism of Zn
15Nd
1O
16 and Zn
14Nd
2O
16 was derived from the spin exchange of Nd-4f, Nd-4d, Zn-4s, and Zn-3p states at the CB’s bottom, and the spin exchange of Nd-4f, Nd-4d, and O-2p states at the VB’s top and was caused by the strong hybridization of Nd-4f, Nd-4d, O-2p, Zn-4s, and Zn-3p states near Fermi surface. Among them, the Nd-4f state showed the most notable spin-splitting phenomenon. With the increase of Nd doping concentration, the spd-f hybridization became more intense, and the spin polarization phenomenon became more pronounced, indicating that the net MM was larger.
Since Zn
15Nd
1O
16 and Zn
14Nd
2O
16 systems all exhibited ferromagnetism, indicating that the electrons in such systems underwent spin polarization. Spin polarizability p is generally considered the variation between the DOS of majority carriers (
) and the normalized DOS of minority carriers (
) at the Fermi surface [
36].
The spin polarizability and the magnetization strength M have the following relationship,
where
µB is the Bohr magneton.
Further the TDOS near the Fermi surface in
Figure 8, the number of majority carriers
at the Fermi surface in Zn
15Nd
1O
16 and Zn
14Nd
2O
16 > 0, while that of minority carriers
was almost 0, so the spin polarizability was close to 100%. The number of majority carriers
above the Fermi surface in Zn
14Nd
2O
16 > 0, while that of minority carriers
was close to 0, so the spin polarizability was less than 100%, indicating that Nd-doped ZnO systems had dilute magnetic semiconductor (DMS) properties.
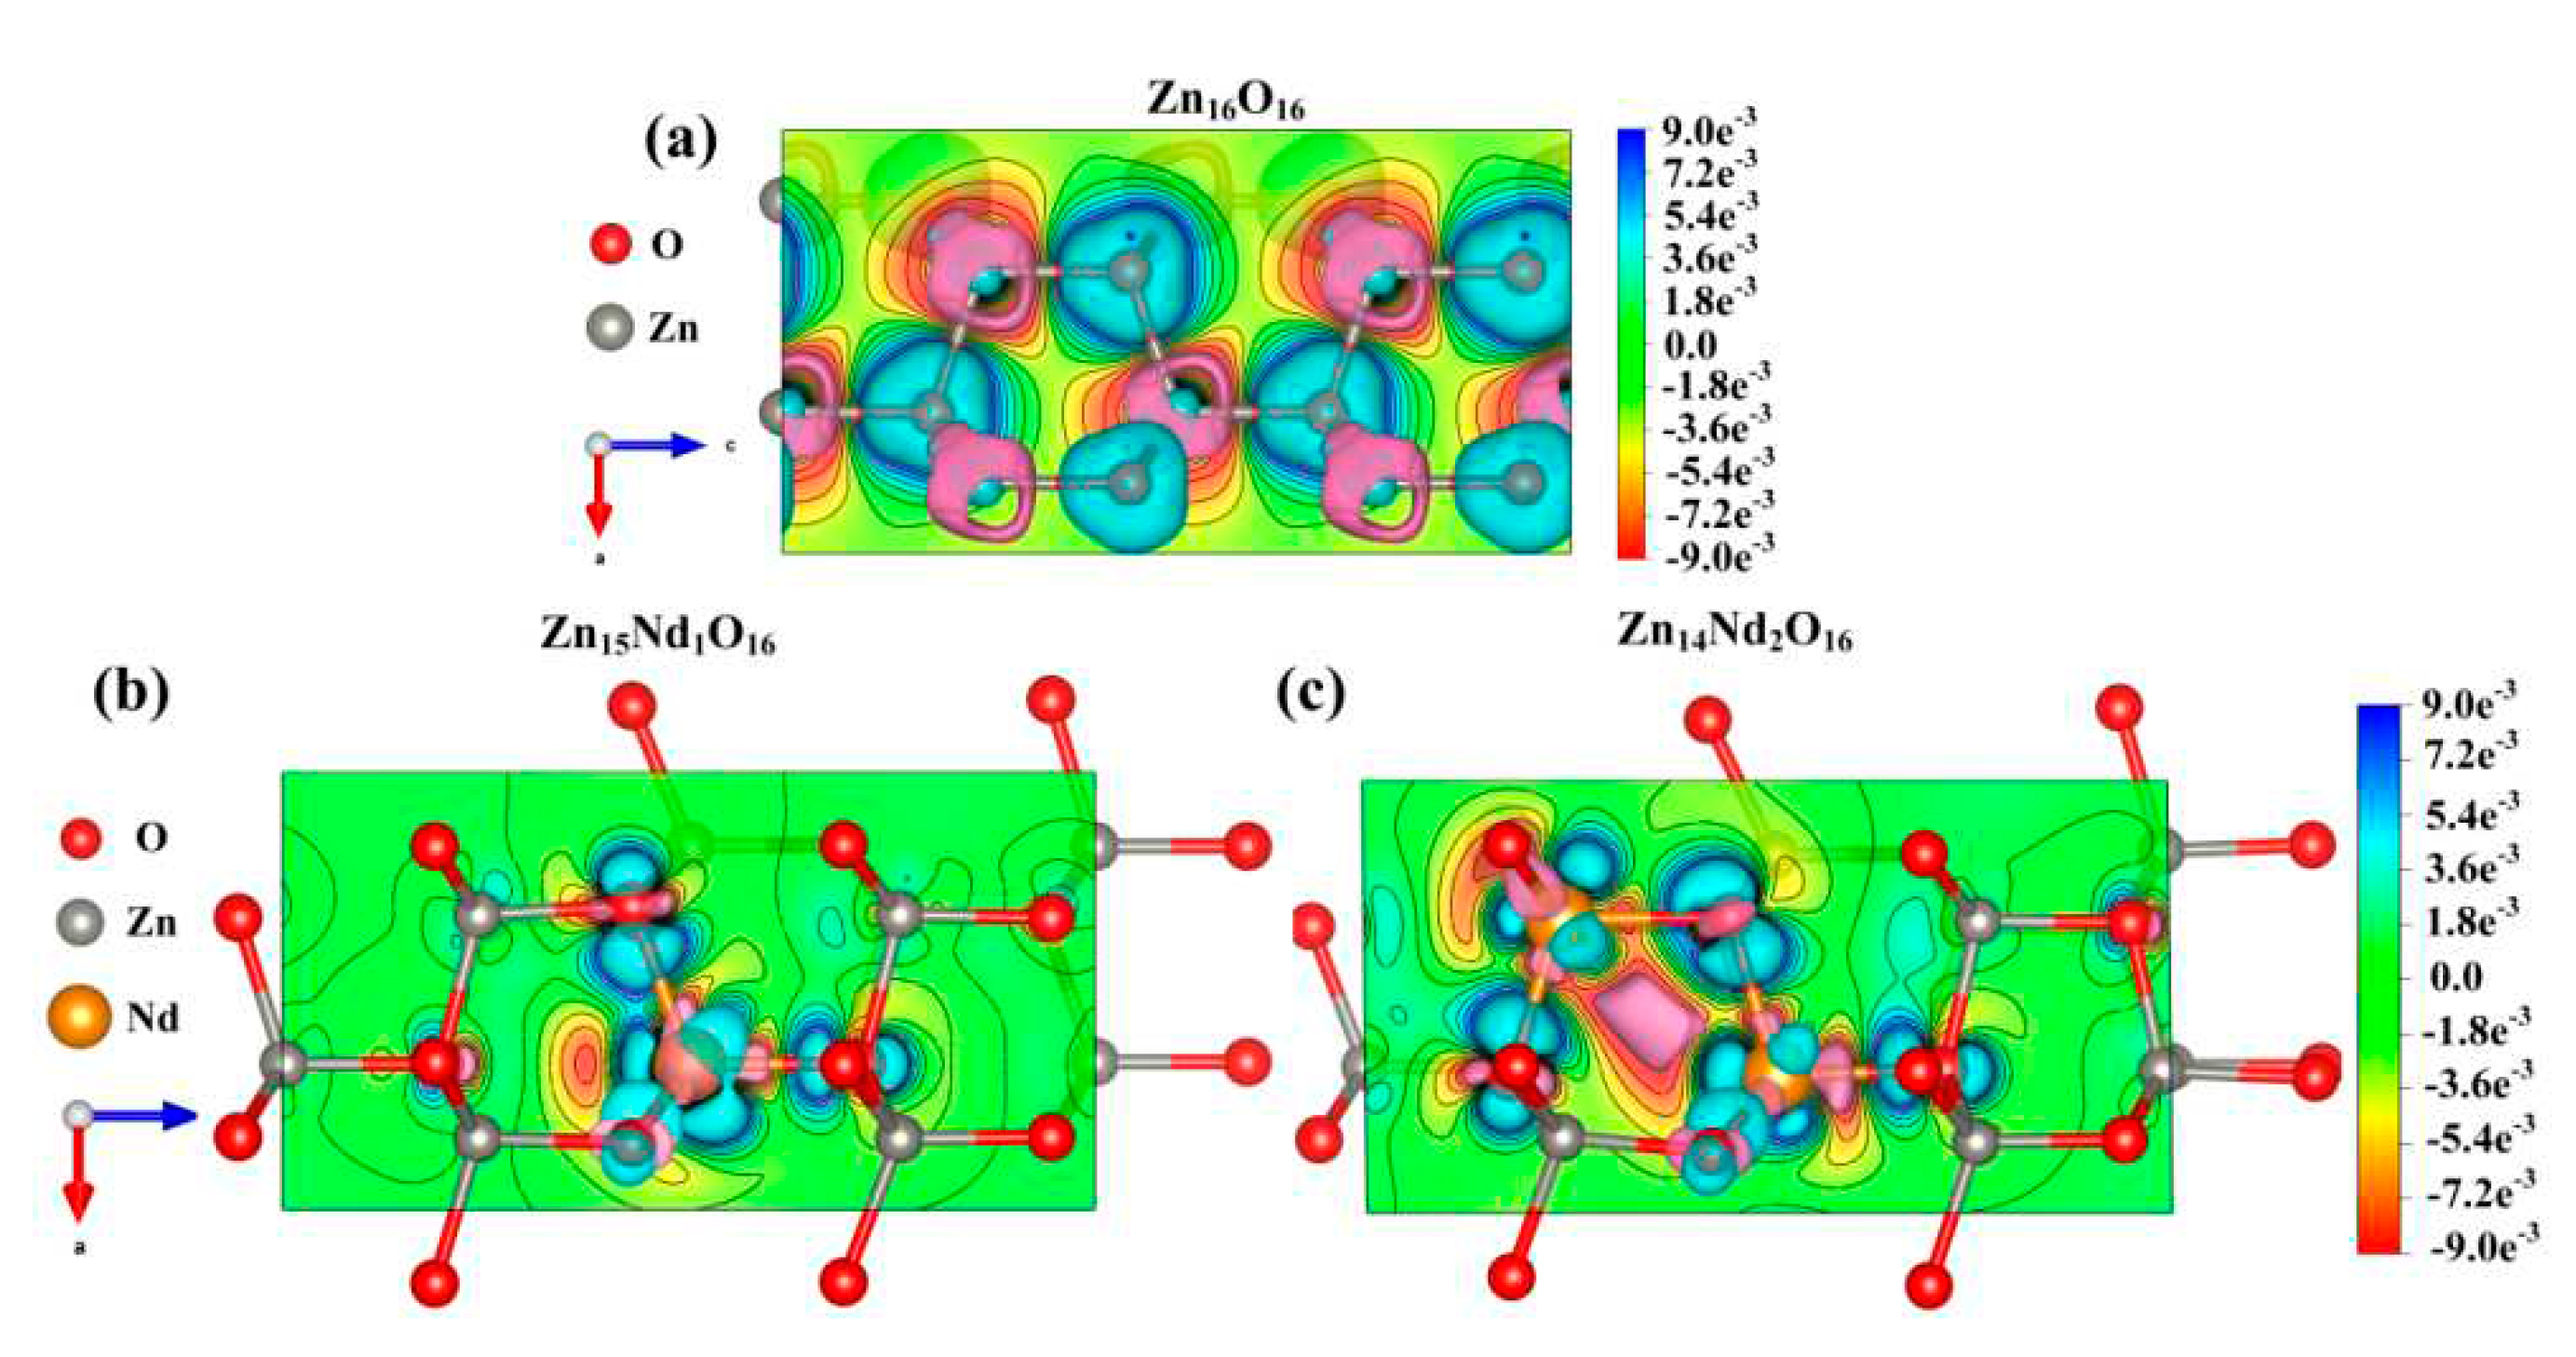
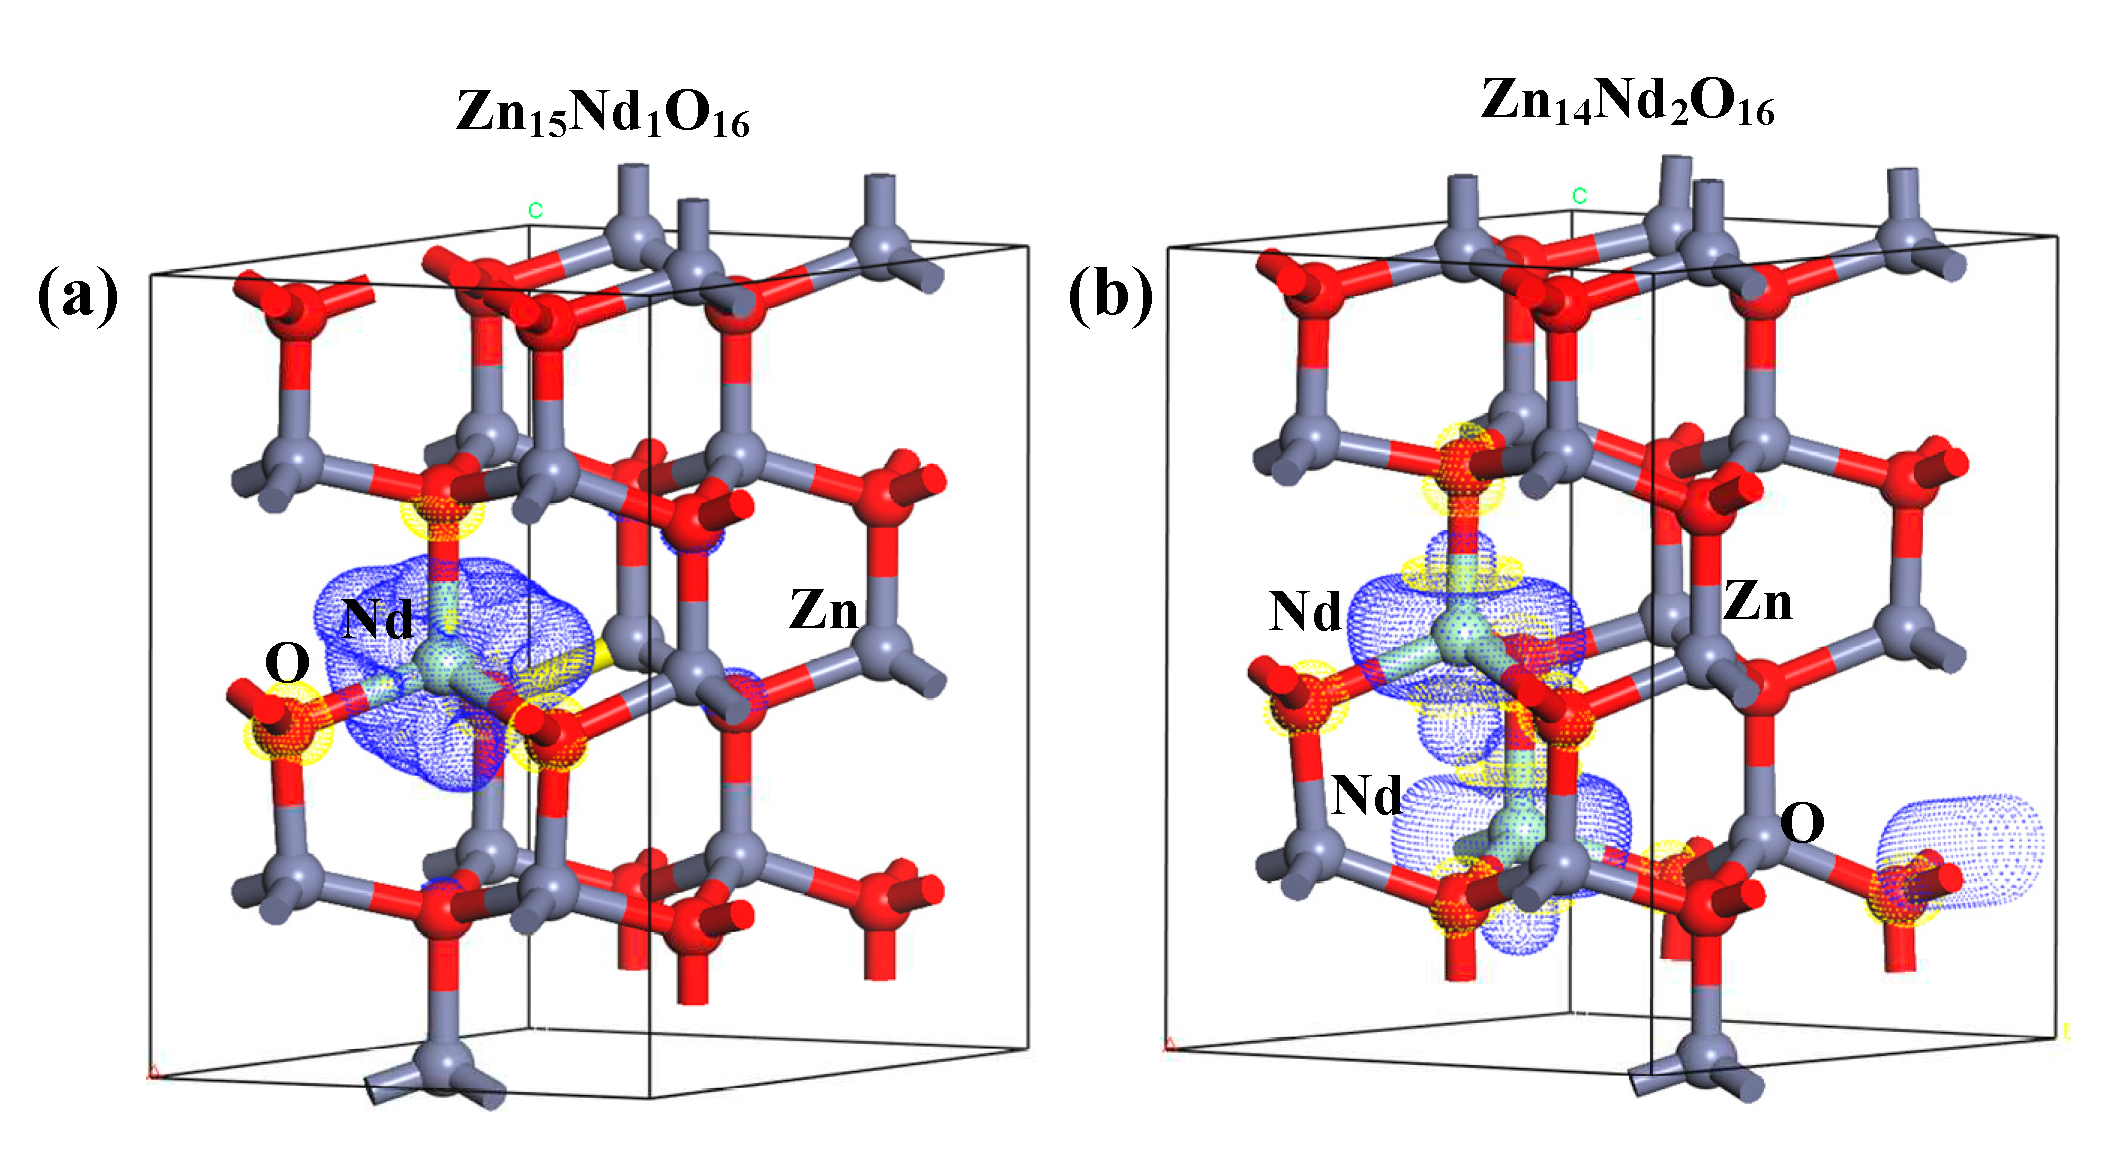
The net spin density distributions of Zn
15Nd
1O
16 and Zn
14Nd
2O
16 systems were computed, and the findings are presented in
Figure 9. The blue signifies the positive spin-charge density, and the yellow signifies the negative spin-charge density, with a unit of ± 0.008 e/Å. Nd atom and its nearby O atoms were AFM coupled, while the Nd atom and its nearby Zn atoms were FM coupled, indicating that the total MM of the doped system had primary contribution from spin-polarized Nd atom(s) and surrounding spin-polarized Zn and O atoms, which has consistency with the findings of atomic and orbital MM analysis.

