Preprint
Review

Demand-Oriented Review of Dynamic Energy Loss Monitoring System for Primary School Buildings through Micro-Environmental Data Monitoring and Occupant Behavior Analysis

Altmetrics

Downloads

92

Views

14

Comments

0

A peer-reviewed article of this preprint also exists.

This version is not peer-reviewed

Submitted:

28 September 2023

Posted:

30 September 2023

You are already at the latest version

Alerts
Abstract
The utilization of primary school buildings is multifaceted, primarily due to the high occupancy density, varying thermal preferences among occupants, diverse indoor activities (such as walking, sports, and conversation), and a constant flow of individuals entering and exiting the building. This results in frequent opening and closing of external windows and doors and fluctuations in internal heat gain. Consequently, frequent interactions between the indoor and outdoor microenvironments lead to energy losses. This study conducts a comprehensive literature review on building energy loss stemming from occupant behavior and the interactions between indoor and outdoor microenvironments. Furthermore, it proposes a dynamic real-time monitoring system based on a computer data capture and visualization platform foundation for building energy loss. The research methods include data crawling, data association rule mining, and data association analysis. The research findings yield a universally applicable and informative building energy-saving design theory based on extensive data analysis. Additionally, the system presents information on occupants' behavior and the microclimate data of indoor and outdoor environments on a computer screen, facilitating human-machine communication and enabling timely adjustments to design strategies for new buildings and operation and maintenance strategies for existing buildings.
Keywords: 
Subject: Engineering  -   Architecture, Building and Construction

1. Introduction

In 2020, China set forth the ambitious goal of achieving carbon neutrality by 2060 and peaking CO2 emissions by 2030 [1]. Given that buildings represent a significant source of energy consumption [2,3,4,5], their role in achieving this “double-carbon” goal cannot be overstated. Of all building types, public buildings consume the most energy. At present, public buildings in China consume 2.4 and 3 times more energy than urban and rural residential buildings, respectively [2]. Public buildings can be classified based on the size of their total floor areas into large (i.e., 2000 square meters or greater) and ordinary (i.e., less than 2000 square meters) public buildings [6]. Large public buildings mainly consist of commercial buildings and office complexes, characterized by stable operating conditions with few or no operable external windows. The control of the indoor environment primarily relies on active equipment such as central air conditioning, while the types of indoor occupants’ activities, such as slow walking and talking, are relatively simple. Consequently, the entire energy flow is relatively straightforward, with energy-efficient esign primarily focused on the envelope structure and heating, cooling, and ventilation equipment [7,8,9]. In contrast, ordinary public buildings mainly consist of schools, libraries, and single office buildings. The operating conditions of such public buildings exhibit greater variability due to the presence of openable external windows and a variety of indoor occupant activities, including collective behaviors such as indoor exercises, loud reading, conversation, and group discussions, which result in a diverse range of energy transfers [10,11,12].
The typical characteristics of ordinary public buildings are particularly prominent in the context of educational buildings, such as kindergartens, primary schools, and university buildings. Educational building stock in China has expanded significantly in recent years [13]. Specifically, the stock area of school buildings in China in 2020 has reached approximately 3.1 billion square meters, which accounts for 24% of the overall public building stock and 50% of the ordinary public building stock [14]. Given the significantly higher occupant density of educational buildings, which primarily include active children and teenagers, than other types of public buildings, it is crucial to consider the unique features of educational buildings when designing energy-efficient buildings. Furthermore, unlike other public buildings with centralized flow of people in terms of time, school buildings have a constant flow of people, resulting in more frequent opening of exterior doors and more complicated energy transfer processes. The collective behaviors of children in educational buildings, such as group reading and activities, have also led to higher internal heat gain and temperature, which can further encourage frequent window-opening behaviors under constant heating. As a result, it is essential to address these unstable aspects when designing energy-efficient school buildings [15,16].
Currently, limited research has been conducted on the energy consumption patterns of educational buildings in China. Literature reports that the overall energy consumption levels of educational buildings range from 20-40kWh/m2∙a [17,18,19,20], with heating and cooling energy accounting for a significant portion (64-80%) of the total energy consumption [21]. Additionally, its overall energy consumption level is roughly half that of office and commercial buildings. However, it is important to note that comparing the energy consumption levels between school buildings and other public facilities using annual averages may not be appropriate due to differences in occupancy patterns. It is commonly believed that educational buildings consume less energy because they are not occupied for two and a half months of the year due to winter and summer vacations. However, this is not the case in reality. For example, in the southern provinces of China, such as Zhejiang, Fujian and Guangdong, air conditioning is typically used from May to October, and if one-and-a-half months of summer vacation are removed, air conditioning is used for three-and-a-half months in school buildings. Similarly, in northern regions, the heating period in winter lasts from November to March, and when the one-month winter vacation is removed, the heating period of educational buildings also extends to three months.
Based on comparisons of energy consumption per unit area during the occupied period, the levels of energy consumption in educational buildings are found to be similar to those of other types of public buildings [22]. For instance, during the heating period in winter, average energy consumption for office buildings in Tianjin is approximately 170kWh/m2 [22], whereas the energy consumption during the same period for 270 school buildings located in the same area is roughly 140kWh/m2 [21], accounting for 82% of the former and exceeding 50%. During summer and transitional seasons, lower energy consumption in educational buildings, compared to other public buildings, can be attributed to the reduced indoor comfort resulting from limited use of active control devices such as air conditioning and fresh air filters [23]. This results in many school students and teachers relying solely on natural ventilation through open windows and electric fans for cooling purposes.
Along with the development of the economic level and the increasing concern for group health, parents and students have more stringent requirements for indoor environmental quality. As a result, more and more classrooms are installing air conditioners, air purifiers, and fresh air systems. The energy consumption level of school buildings is anticipated to increase gradually due to the large building stock, high occupant density, continuous occupant movement flow, and significant indoor heat gains. Therefore, it is crucial to research energy-saving design and control strategies tailored to school building characteristics.
Currently, energy losses in buildings are a crucial contributor to increasing energy consumption and carbon emissions of buildings [24]. Typically, building energy losses occur in the winter and summer (significant temperature difference between indoor and outdoor). The energy loss caused by conduction through the building envelope (external walls, windows, doors, roofs, and other physical objects) is referred to as solid conduction energy loss. The energy loss caused by air convection through the gaps in the windows and doors is referred to as convective energy loss. The magnitude of these two types of energy losses depends mainly on the difference between indoor and outdoor temperature, the heat transfer performance of the envelope, and the number of indoor and outdoor air changes, and their values are typically fixed under specific working conditions (indoor and outdoor temperatures and building airtightness levels are assumed to be fixed values) [25].
In addition to the aforementioned categories of energy losses, there exists an additional form of energy dissipation that arises from the interplay between building occupants and the indoor/outdoor microenvironments. For example, energy loss is caused by opening external windows during indoor heating or cooling or by not reducing the heating amount when the indoor heat gains increase. In buildings with high pedestrian flow, external doors will be opened frequently. However, the way and direction of the opening fail to consider the surrounding microenvironment, resulting in cold air backflow in winter or cooling air outflow in summer. The energy loss mentioned above is called dynamic energy loss because it occurs in a dynamic process. It is primarily caused by the excessive usage of external windows and doors, which results in frequent interaction between indoor and outdoor environments.
Nowadays, for solid conduction and convection energy losses, researchers have more precise methods and tried-and-true techniques to reduce such losses, such as increasing the insulation thickness and enhancing the airtightness of windows and doors [26,27]. However, current studies do not have precise ways to quantify dynamic energy losses, and there are no effective control strategies to limit such losses. First, dynamic energy losses typically occur in a dynamic process, and it is difficult to estimate their loss values. For example, the opening of windows and doors, the occupants’ activities, and the outdoor wind speed and direction are constantly changing, and such changes significantly affect such losses. Current quantification methods, such as software simulation and mathematical model calculation, are based on the assumption of steady-state conditions (doors and windows are constantly open or closed, and occupants’ density and indoor and outdoor temperature are fixed values); therefore, it is impossible to develop effective control strategies from the perspective of building design and operation.
To sum up, it is necessary to conduct research on energy conservation in school buildings due to the rapid expansion of stock areas and the rising trend of energy consumption in school buildings. An essential aspect of tapping and releasing the energy-saving potential of school buildings is departing from the conventional method of energy conservation and emission reduction in buildings and focusing on the dynamic energy loss caused by indoor-outdoor microenvironment interaction and user behaviors.

2. Literature review on dynamic energy losses of buildings

Searching the major databases (Scopus, Web of Science) with keywords such as “microenvironment” and “occupants’ behavior” reveals that related studies can be categorized into three groups (Table 1): (1) occupants’ behavior studies pertaining to energy-consuming terminals such as lamps, air conditioners, and televisions; (2) occupants’ behavior studies related to building fabrics such as windows and shading devices; (3) occupants’ behaviors prediction models. These three types of studies cover both residential and public buildings. Office buildings are the sole concentration of the research on public buildings.
The first type of research investigates the relationship between energy-using terminals and the energy consumption of unoccupied buildings. Al-Mumin et al. discovered that most Kuwaitis do not turn off their lamps when they leave a room [28]. Wood and Newborough proposed that modifying user behavior with household appliances could reduce energy consumption in UK residential buildings by 15% [29]. Mahdavi et al. revealed the relationship between lighting-related user behavior and office building indoor and outdoor environments [30]. In commercial buildings, Masoso and Grobler found that energy consumption was higher during the non-occupied period than the occupied period, primarily because people left computers and lights on when they were not working [31]. Pedro et al. discovered that lighting-related user behaviors significantly affected the indoor environment more than outdoor climate conditions [32]. Azizi et al. and Almeida et al. found that inappropriate user behavior regarding computers and lamps can result in greater energy consumption in certified green buildings than in non-certified green buildings [33,34].
The second type of research focuses on the user behavior associated with building fabrics such as exterior windows, shading devices, and ventilation louvers. This behavior is typically driven by the indoor comfort environment, with CO2 concentration, temperature, and humidity being the most relevant parameters. For example, Rijal et al. discovered that people adjust the indoor environment by opening windows even when the air conditioner is on [35]. Chen et al. found that indoor and outdoor temperatures, indoor CO2, and PM2.5 concentrations in naturally ventilated buildings are the main factors influencing users’ window-opening behavior [36]. Nicol found that the main reasons why people adjust exterior windows and shading devices are related to indoor thermal comfort and air quality [37]. At the same time, such user behaviors significantly contribute to the increase in building energy consumption [38,39,40]. Hong et al. summarized the recent progress and limitations of research on the impact of occupant behavior on residential building energy consumption. It concluded that there is a high degree of variability in the operation of windows, shades, and blinds in buildings and that these operations affect thermal comfort, indoor air quality, and building energy consumption [41]. Heebøll et al. found that the effectiveness of increasing ventilation rates through window openings is primarily influenced by outdoor conditions, including the location of the school (urban or rural), climatic conditions (wind speed and direction, outdoor temperature), and the extent to which students and teachers are accustomed to opening windows [42].
The third type of research focuses mainly on establishing simulation models through collecting user behavior data and implementing mathematical calculations; these models enable researchers to forecast building energy consumption more correctly [43,44,45,46,47]. The most renowned case of this type of research is Annex 66: “the project of Definition and Simulation of Occupant Behavior in Buildings,” undertaken by the International Energy Agency (IEA) from November 2013 to May 2018. The primary outcome of this project was the development of predictive models of occupant behavior to analyze the effect of occupant behavior on building energy consumption using software simulations [48,49,50,51]. Annex 66 presented some solutions for occupant behavior definition, simulation design, and data collection. However, the project admits that three main challenges remain for such research [51].
(1) There is a need to find a reliable and cost-friendly method of collecting large amounts of data. The data collection methods for the project were questionnaire research, scenario simulation, and interview transcription. Such methods’ time and financial expenses are significant, and the data collected are limited and only represent some behaviors.
(2) The behavioral prediction model was not able to take indoor occupants’ interactions into consideration, i.e., the accuracy of the prediction models is impacted by the energy transfer generated by people performing different activities in the room (playing games, talking, etc.).
(3) The project fails to form guidelines or standards for the practical application of predictive models concerning investment, efficiency, and energy policy formulation.
In addition to the Annex 66 topic, additional studies have also developed predictive models for the window-opening behavior of occupants [52,53,54,55]. For example, Wang and Greenberg used energy-plus to simulate different types of window-opening behavior in an office building to analyze the impact on building energy use and thermal comfort and to optimize window-opening strategies to reduce building energy consumption [56]. Cedeno Laurent et al. investigated the effect of user window-opening behavior on energy consumption in university dorms. They found that the effect of different window-opening operation modes on simulated energy consumption was significant [57]. By simulating the behavior of occupants of a residential building in Iran in different climate zones, Yousefi et al. discovered that their different window-opening behavior patterns could result in a 20% variation in energy consumption [58]. Pan et al. used a Gaussian distribution model to predict the window-opening behavior of office buildings, which can more accurately predict the state of office building windows [59]. Daniel et al. discovered that the assumptions of energy use behavior in existing energy consumption simulations are inaccurate; thus, they advocated that user behavior patterns accurately reflect occupant behavior to better match the actual situation [60]. Mori et al. explored the behavioral drivers of occupants in the tropics. They concluded that user window opening is one of the most critical adaptive behaviors affecting the tropics’ indoor thermal comfort and home energy consumption [61]. Meanwhile, several typical daily patterns of window opening, air conditioner use, and fan use were extracted separately. A predictive model of window opening patterns was developed by logistic regression analysis.
The following findings emerged as the most significant by reviewing the abovementioned studies.
(1) Early studies mainly concluded that user behavior could influence building energy consumption, with quantitative means relying on energy recording devices (e.g., electricity meters) and failing to distinguish the corresponding energy losses caused by different user behaviors. Later research emphasized the collection of user behavior data for the development of behavior prediction models.
(2) There are many papers on user behavior but less on interactions between indoor and outdoor microenvironments. Most published research disregards the impact of indoor-outdoor micro-environmental interactions on the energy consumption of buildings.
(3) The majority of research on energy-consuming terminals (lamps, appliances) is undertaken in residential buildings. In contrast, all research on public buildings is conducted in office buildings, and there is no literature on educational buildings.
(4) There are more studies on exterior windows but no studies on exterior doors.
(5) In 2018, the number of relevant studies began to decrease, and the research on this topic entered a low level.
In China, it has been suggested in the literature that studies divorced from user behavior cannot fundamentally achieve the energy efficiency goal in buildings [62]. The use of windows and doors [63], air conditioners [64,65,66], and lighting [67,68] by occupants has a substantial impact on building energy consumption. The importance of occupants’ behavior has been overlooked for a long time in building energy efficiency, while the emphasis has been on the optimization and innovation of various technologies and equipment [69]. Studies should be carried out independently according to location, climate zone, and building type to accurately forecast occupants’ behavior in buildings [70]. Existing studies in China can also be divided into three categories (Table 2).
The first category analyzed the factors influencing occupants’ behavior [71,72,73]. For example, Jian et al. discovered that the energy usage of air conditioners could be significantly influenced by the occupants’ comfort tolerance temperature [74]. Zhou et al. [75], Chen et al. [76], and Li et al. [77] all found that occupants’ thermal comfort preference is the main factor influencing the opening of building exterior windows. However, most of these studies have not quantified occupants’ behavior (e.g., window opening duration and magnitude). The second type of study quantified the energy losses associated with occupants’ behavior [78,79]. Unfortunately, the methods employed mainly consisted of surveys, behavioral records, and measurements of energy-using terminals (e.g., electricity meters), and many dynamic factors were not considered. Thus, the accuracy of their results is low. Pan et al. analyzed the influence of office building occupants on Beijing’s window opening rate by considering environmental factors (indoor and outdoor temperature, outdoor PM2. 5 concentration) and non-environmental factors (personal preference). They discovered that these influences could impact indoor occupants’ window-opening behavior, contributing to the study of occupants’ window-opening behavior model in office buildings [80]. Ma et al. studied the effect of hazy weather on residential window-opening behavior and the feasibility of a combined strategy with air purification [81]. Owing to China’s vast area and large population, it is still worthwhile to further explore the specific factors that influence the window-opening behavior of Chinese indoor occupants in future studies.
Similar to Annex 66, the third type of research focuses on collecting occupants’ behavior data and developing behavior prediction models for simulation software [82]. For example, Zhou and Fu calculated the opening and closing of building exterior windows in 95 cities during the transition season and created a model to forecast window opening status [83]. Chen developed a combined model of window opening behavior and building energy consumption using multiple linear regression to estimate heat loss from window opening in office buildings in severe cold regions [84]. Liu et al. studied the actual monitoring of people’s window-opening behavior in seven residential buildings in Zigong City and categorized the user behavior into three significantly different typical window-opening behaviors, namely, habitual window-opening type, high-intensity window-opening type, and habitual window-closing type; and established a binary regression prediction model for high-intensity window-opening behavior in summer based on this, with a prediction accuracy of 86% [85]. Yao simulated and analyzed the indoor wind environment of residential dwellings in hot summer and cold winter regions and proposed a window-opening method to enhance the quality of the indoor living environment [86]. Based on the actual window openings of five residential buildings in Changchun, Han et al. identified the characteristics and drivers of window-opening behavior in residential buildings in severe cold regions, analyzed the data obtained from the actual measurements using logistic regression analysis, and then obtained a regression model of indoor occupant window opening behavior in residential buildings in Changchun during the winter with an accuracy of 76.7 % [87]. Park et al. discovered that in the spring and autumn, office building occupants depended mainly on regulated window states for natural ventilation to achieve a comfortable workplace atmosphere [88]. Gu et al. examined the association between indoor-outdoor environmental parameters (temperature, CO2 concentration, humidity, and PM concentration) and the window status of one office building in Xi’an by using a binary logistic regression model [89].
By reviewing studies in China, the main findings are summarized as follows.
(1) There are few relevant papers in China, as only 170 studies were found in the most extensive database CNKI over the past two decades.
(2) The current studies are mainly on residential and office buildings, and the studies on educational buildings are blank.
(3) The quantitative accuracy of existing studies is low, and they cannot accurately reflect the relationship between occupants’ behavior and energy consumption.
(4) Due to the low accuracy of the data related to user behavior, the behavior prediction model is only applicable for reference.

3. Research hypothesis

3.1. Research gap identification

As noted in Section 2, the diversity of public building utilization is primarily attributable to the high occupancy density, the variety of indoor activities (walking, sports, conversation), and the constant flow of people entering and exiting the building. Hence, public buildings’ external windows and doors are frequently opened and closed, and the internal heat gains change often. As a result, the inside and outside micro-environment interacts frequently, leading to energy losses. School buildings, as ordinary public buildings with educational functions, have the most significant characteristics listed above. Through the literature review, it is found that current studies both in China and other countries are facing problems with data collection and data accuracy. Thus, this study proposes a dynamic real-time monitoring system based on the computer data capture and visualization platform foundation for building energy consumption. This system presents occupants’ behavior information and the microclimate data of inside and outside environments on the computer screen. Additionally, building designers and operation managers can timely alter the building operation and maintenance strategies to reduce building energy losses.
This study overcomes the limitations of previous research regarding the inaccurate estimation of energy consumption in educational buildings. In contrast to previous research, the present study introduces an energy loss control system that relies on real-time monitoring of multiple variables to enhance the accuracy of energy loss calculations. The term “multiple variables” encompasses all variables associated with energy loss, such as indoor and outdoor air temperature, door and window opening time and duration, and heat generation from indoor activities. Prior studies primarily relied on estimating single-variable data. For instance, some studies accurately monitored user behavior in opening windows but employed hypothetical indoor and outdoor temperatures (typically indoor heating or cooling and outdoor average temperatures) when converting to energy loss calculations. Furthermore, such single-variable estimation is inadequate in accounting for the interaction of multiple variables. By contrast, the energy loss monitoring system proposed in this study acquires dynamic and real-time data on multiple variables, resulting in accurate energy loss calculations within one second rather than an extended period. During the calculation process, the system can automatically account for the interaction of multiple variables using scientific algorithms, thereby ensuring the accuracy of the resulting energy loss estimates. This study integrates a variety of contemporary advanced analysis methods and research tools (data capture, data association mining, and visualization techniques) to develop an exploration logic that supports the optimal combination of multiple variables and ultimately uses a lightweight model to build a visualization operating system for building energy efficiency design and control strategies. As a result, such an operating system can significantly improve the accuracy and efficiency of quantifying dynamic building energy losses and scientifically determine the optimal design and operation strategies for buildings under certain situations. Ultimately, this study aims for low energy consumption, explores the intrinsic mechanism of action between dynamic energy loss of buildings and multiple variables, forms a universally applicable mathematical model of building energy-saving design, and provides a theoretical foundation for the low-energy design of educational buildings. Therefore, the theoretical research outcomes of this research have substantial guiding significance. Moreover, the visualization operating system presents the complicated mechanism of dynamic energy loss of buildings. The whole process is fully automated by computer, which is fast and accurate. To sum up, the dynamic real-time monitoring system proposed by this research has high practical application value and can be universally promoted.

3.2. Technical support and workflow of the dynamic monitoring system

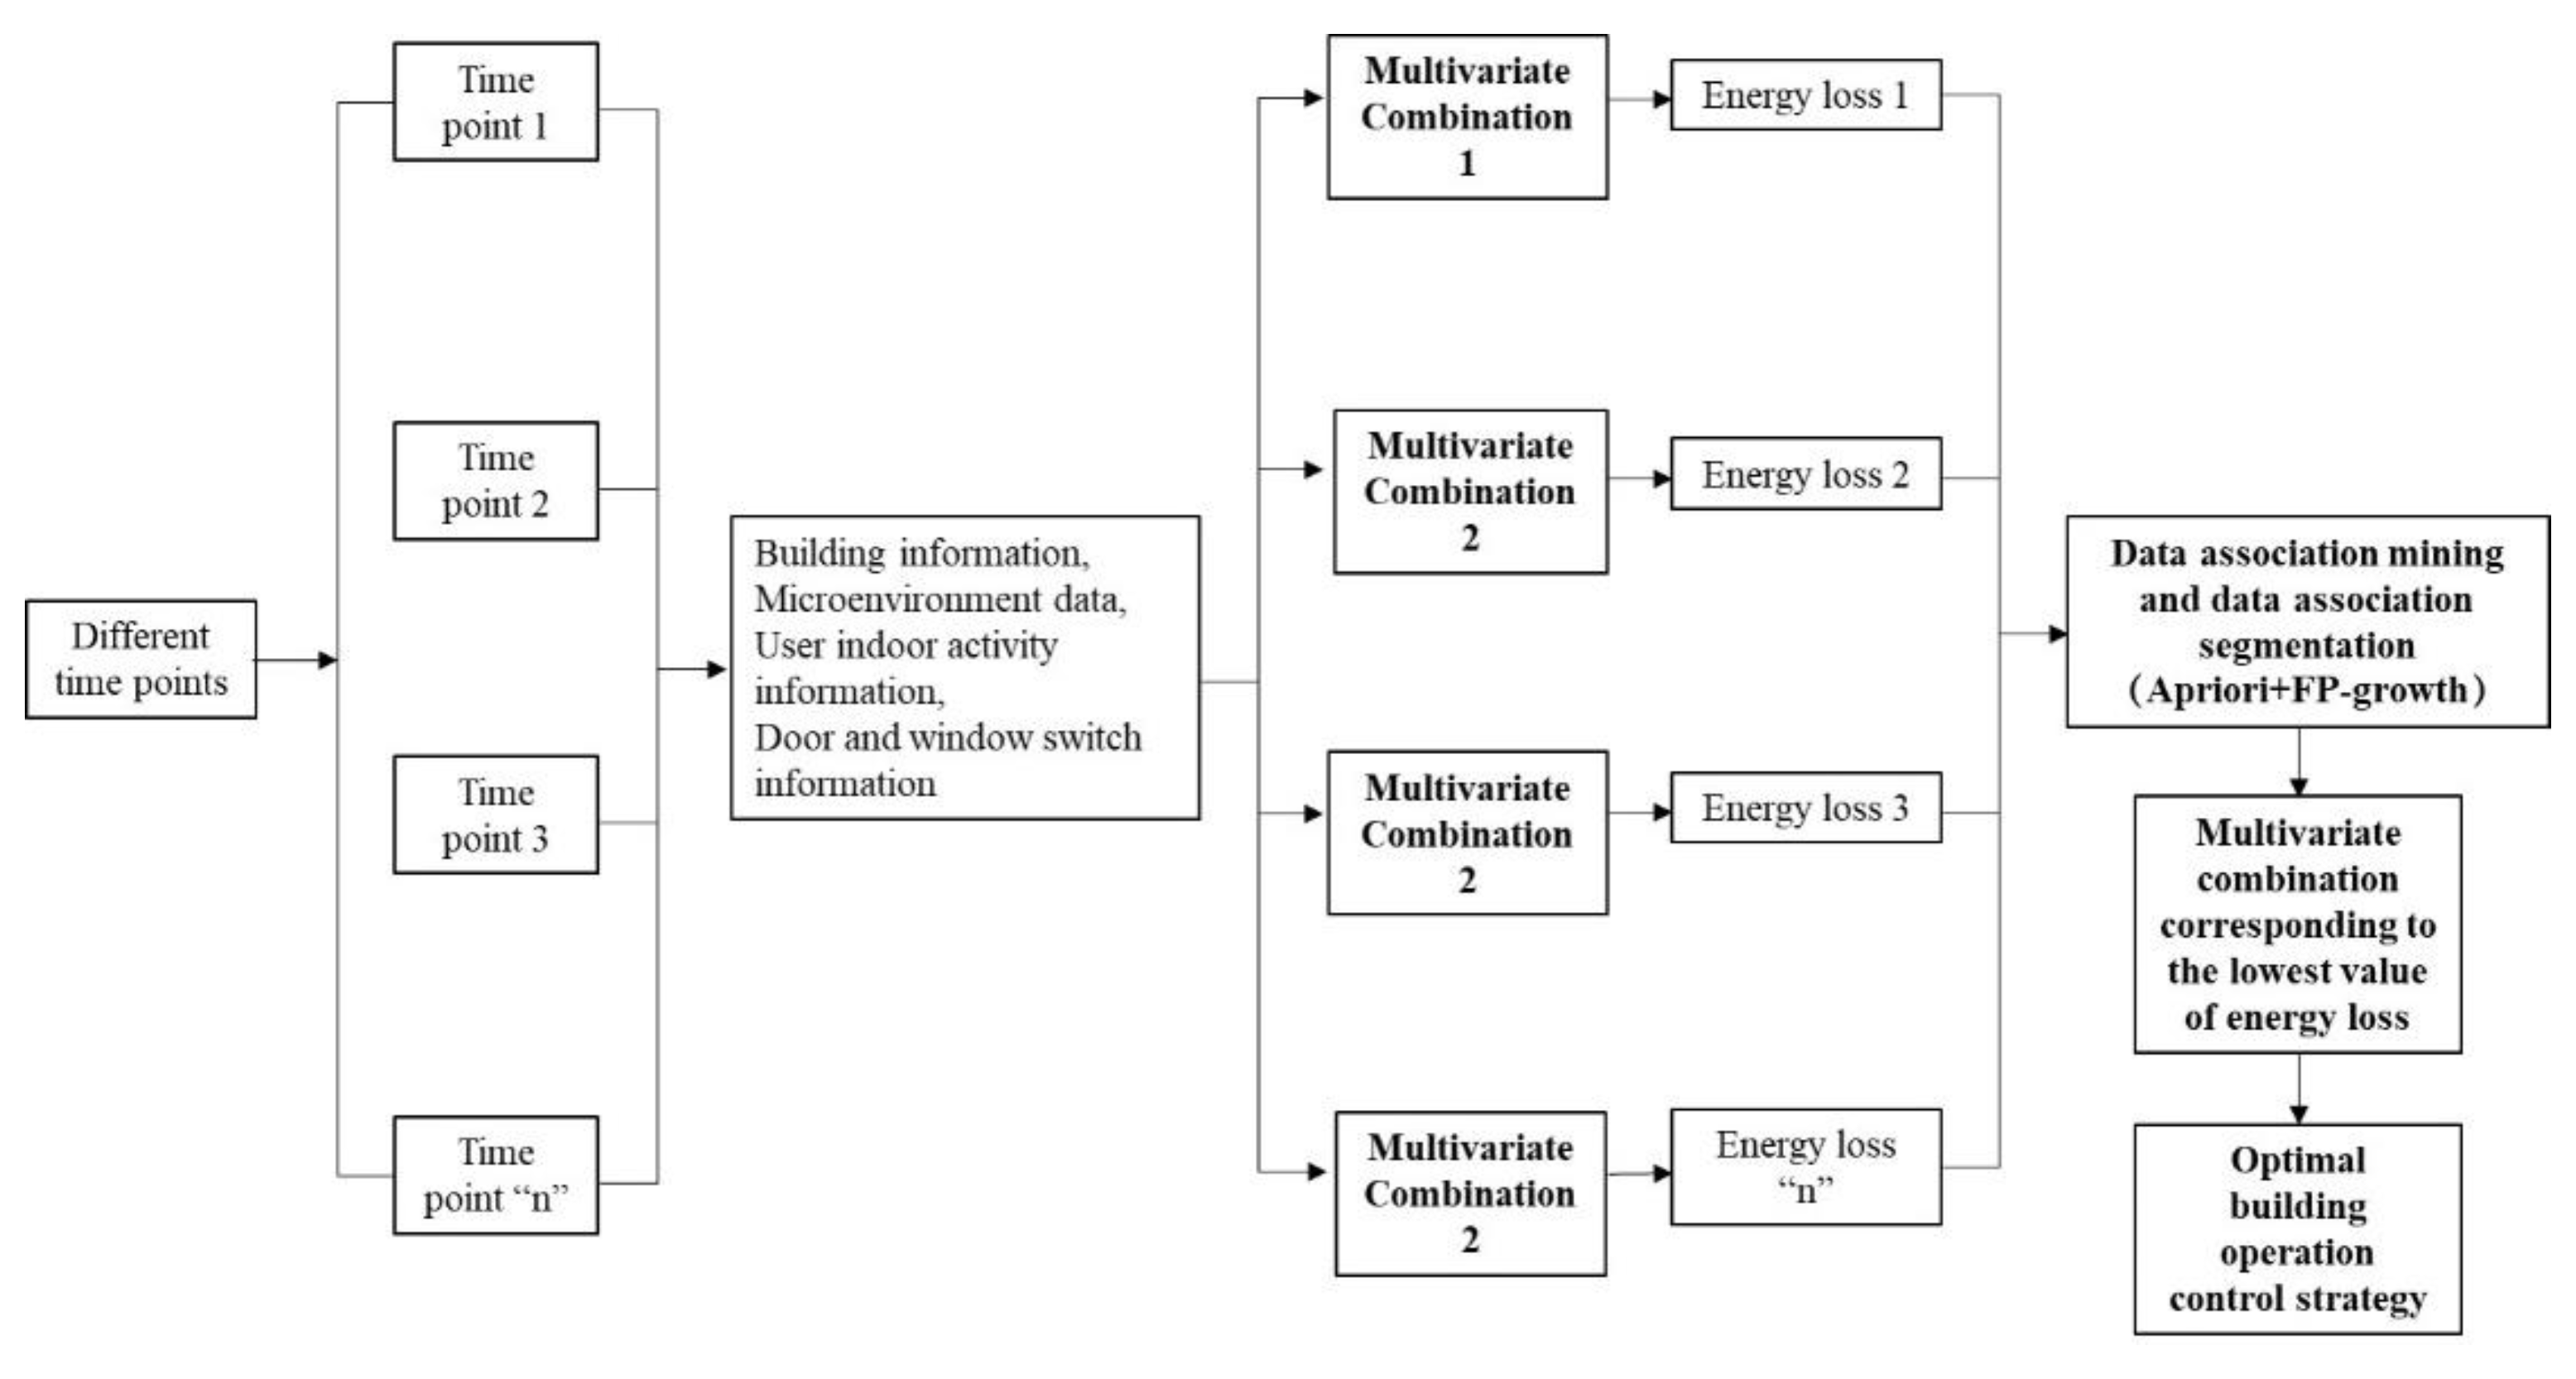
In recent years, simulation tools for calculating building energy consumption have proliferated. Nevertheless, these simulations assume steady-state operating conditions, and their results do not accurately reflect building energy consumption [90,91,92]. With the advancement of data transmission and computer technology, however, more and more invisible, unmeasurable, and volatile data are becoming available. Specifically, (1) real-time data monitoring and wireless transmission technologies allow changes in a building’s indoor and outdoor microenvironment to be saved and uploaded to a cloud server at any time and from any location; for example, variables such as indoor heat, indoor and outdoor temperature, and wind speed and direction can be captured by sensors at any time and displayed on a computer screen through format conversion; (2) The conventional approach of data correlation analysis may construct a mathematical model of the intrinsic relationship between gathered data and dynamic energy loss, and quantify the value of dynamic energy loss. For instance, in the winter, by monitoring the length and magnitude of the opening of exterior doors, as well as the wind speed and temperature of the air entering the room, it is possible to calculate the quantity of cold air entering the room when exterior doors are opened, and thus the corresponding energy loss. (3) Utilizing data correlation analysis algorithms, mathematical models of the relationship between building energy-efficient design and various variables can be developed [93,94,95]. Nowadays, the most prevalent algorithms are the Apriori and FP-growth algorithms, which can perform correlation mining analysis on a vast amount of data and seek the optimal multivariate combination for problem resolution. This study can establish the theory and method of building energy-saving design and contribute to developing architectural design theory by using such scientific algorithms. (4) The development of visualization technology realizes the real-time display of dynamic monitoring data on a computer screen, enabling architects and engineers to interact with a computer to detect problems in the building design and operation process promptly to modify the design and control strategies and achieve the goal of reducing building energy consumption [96,97,98,99,100]. Figure 1 shows the workflow of the dynamic real-time visualized monitoring system. In summary, the future of building design and operation is not merely the control of individual devices or variables but rather comprehensive decisions based on analyzing massive amounts of data. The development and popularity of existing technologies, such as real-time monitoring technology, correlation algorithms, wireless transmission technology, cloud-based data storage, and automatic control, make this research feasible.

3.3. Data capture based on smart sensors

The data collection of this study relies mainly on intelligent sensors. Approximate sensors must be chosen based on the various data types and their characteristics. For example, magnetic suction angle sensors can be used for swing doors and windows (in the case of sliding doors and sliding windows, scale sensors can be used) to record the amplitude of opening outdoor doors and windows and to calculate the total opened areas. Wind speed and wind direction sensors can be utilized to measure the velocity and direction of air movement indoors and outdoors. Face capture sensors and behavior recognition sensors can be used to determine the number of occupants and type of activities within a room. Table 3 provides a summary of the primary studied variables, suitable sensor types, and their output data formats.
This research is committed to obtaining precise analysis results through extensive data analysis. Traditional sensor data collection and analysis rely on manual work, which is time-consuming. This study set up a cloud data processor to capture various sensor data online in real-time and perform energy consumption quantification and visualization operations through format conversion. The accuracy of the data must be ensured in two ways: (1) The accuracy of the sensor used must match the requirements of scientific research, and it needs to be regularly calibrated prior to use; (2) The collected data variables can be assembled by compiling the data frequency distribution table or drawing the frequency distribution plots to identify outliers. To address abnormal values, it is required to compare and verify with multiple devices to determine the cause of the abnormality and prevent a reduction in the overall data’s precision.
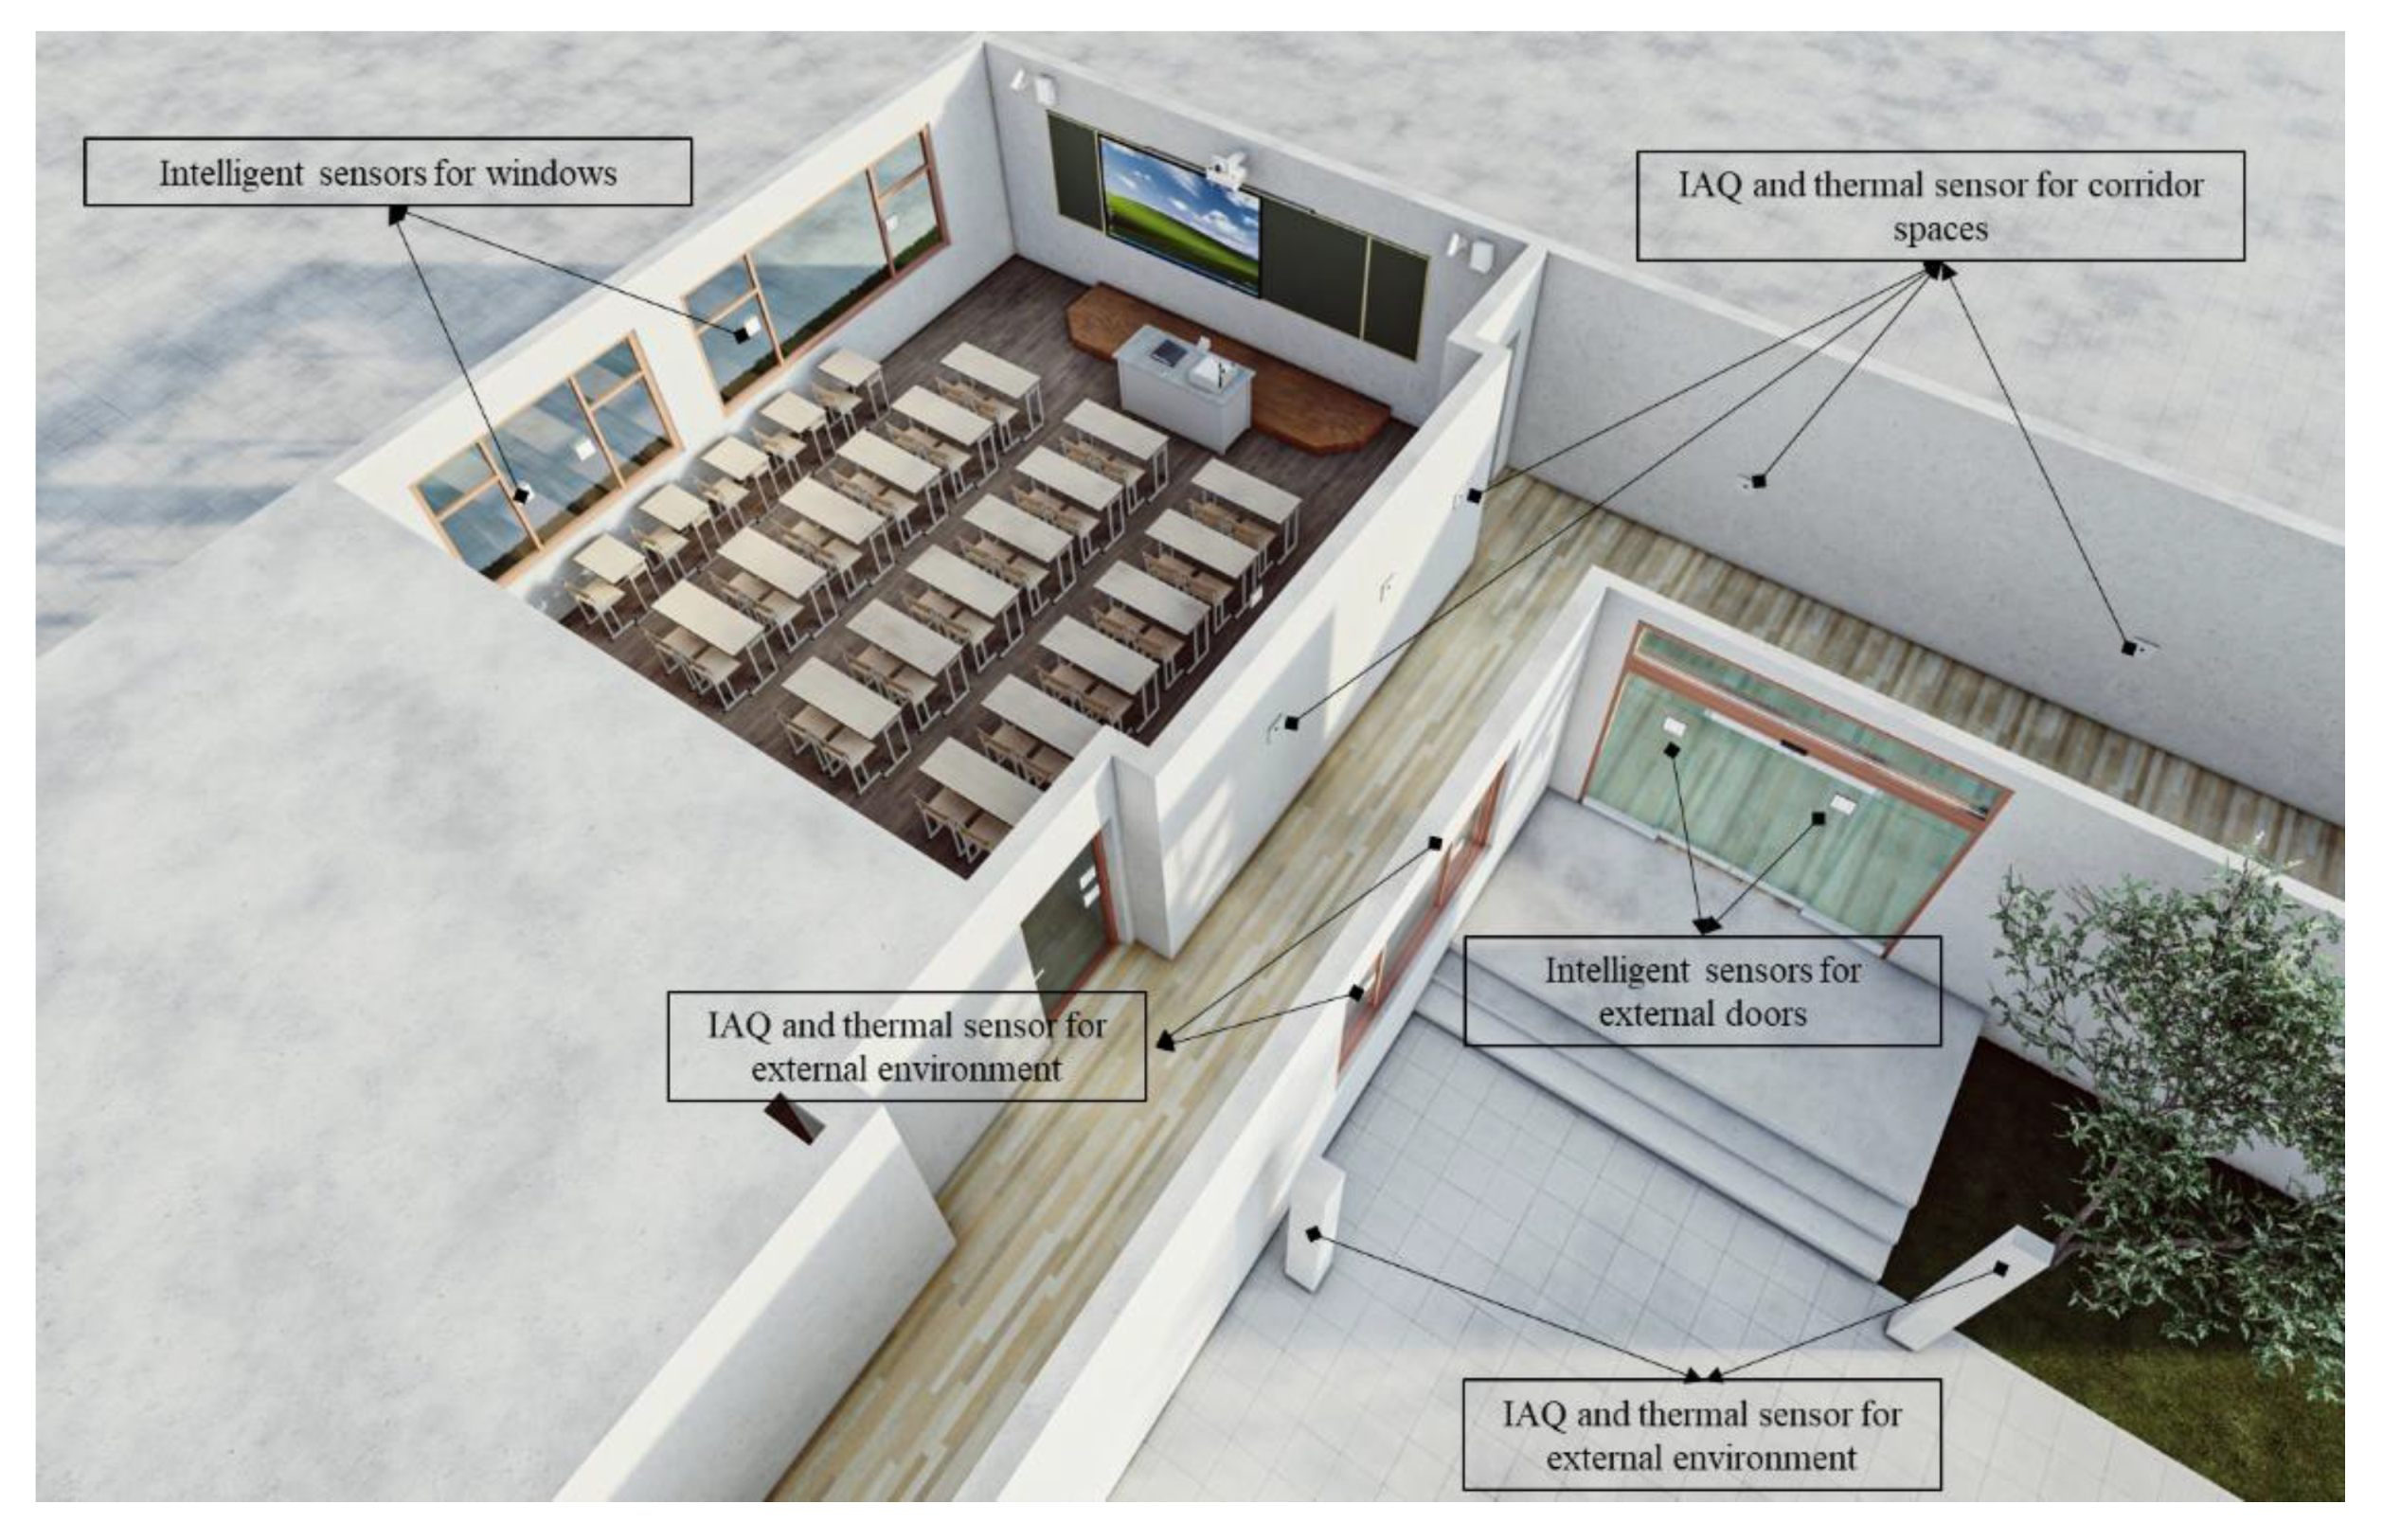
Figure 2 and Figure 3 are three-dimensional diagrams of a typical classroom. The range in which sensors must be installed consists mainly of classrooms, corridors, and outdoor areas adjacent to exterior doors. The building and its surroundings are separated into grids (based on the same or similar air temperature, velocity, and direction within a cell). The intelligent wireless sensors are deployed at each spot. The monitoring time can span 24 hours or be decided by the building’s occupancy schedule. Figure 4 and Figure 5 depict some of the sensors utilized in this study. The relevant national departments of China have verified the quality of these sensors, and the precision of the data they produce is sufficient for scientific research.

3.4. Reverse and positive thinking for existing and future school buildings, respectively

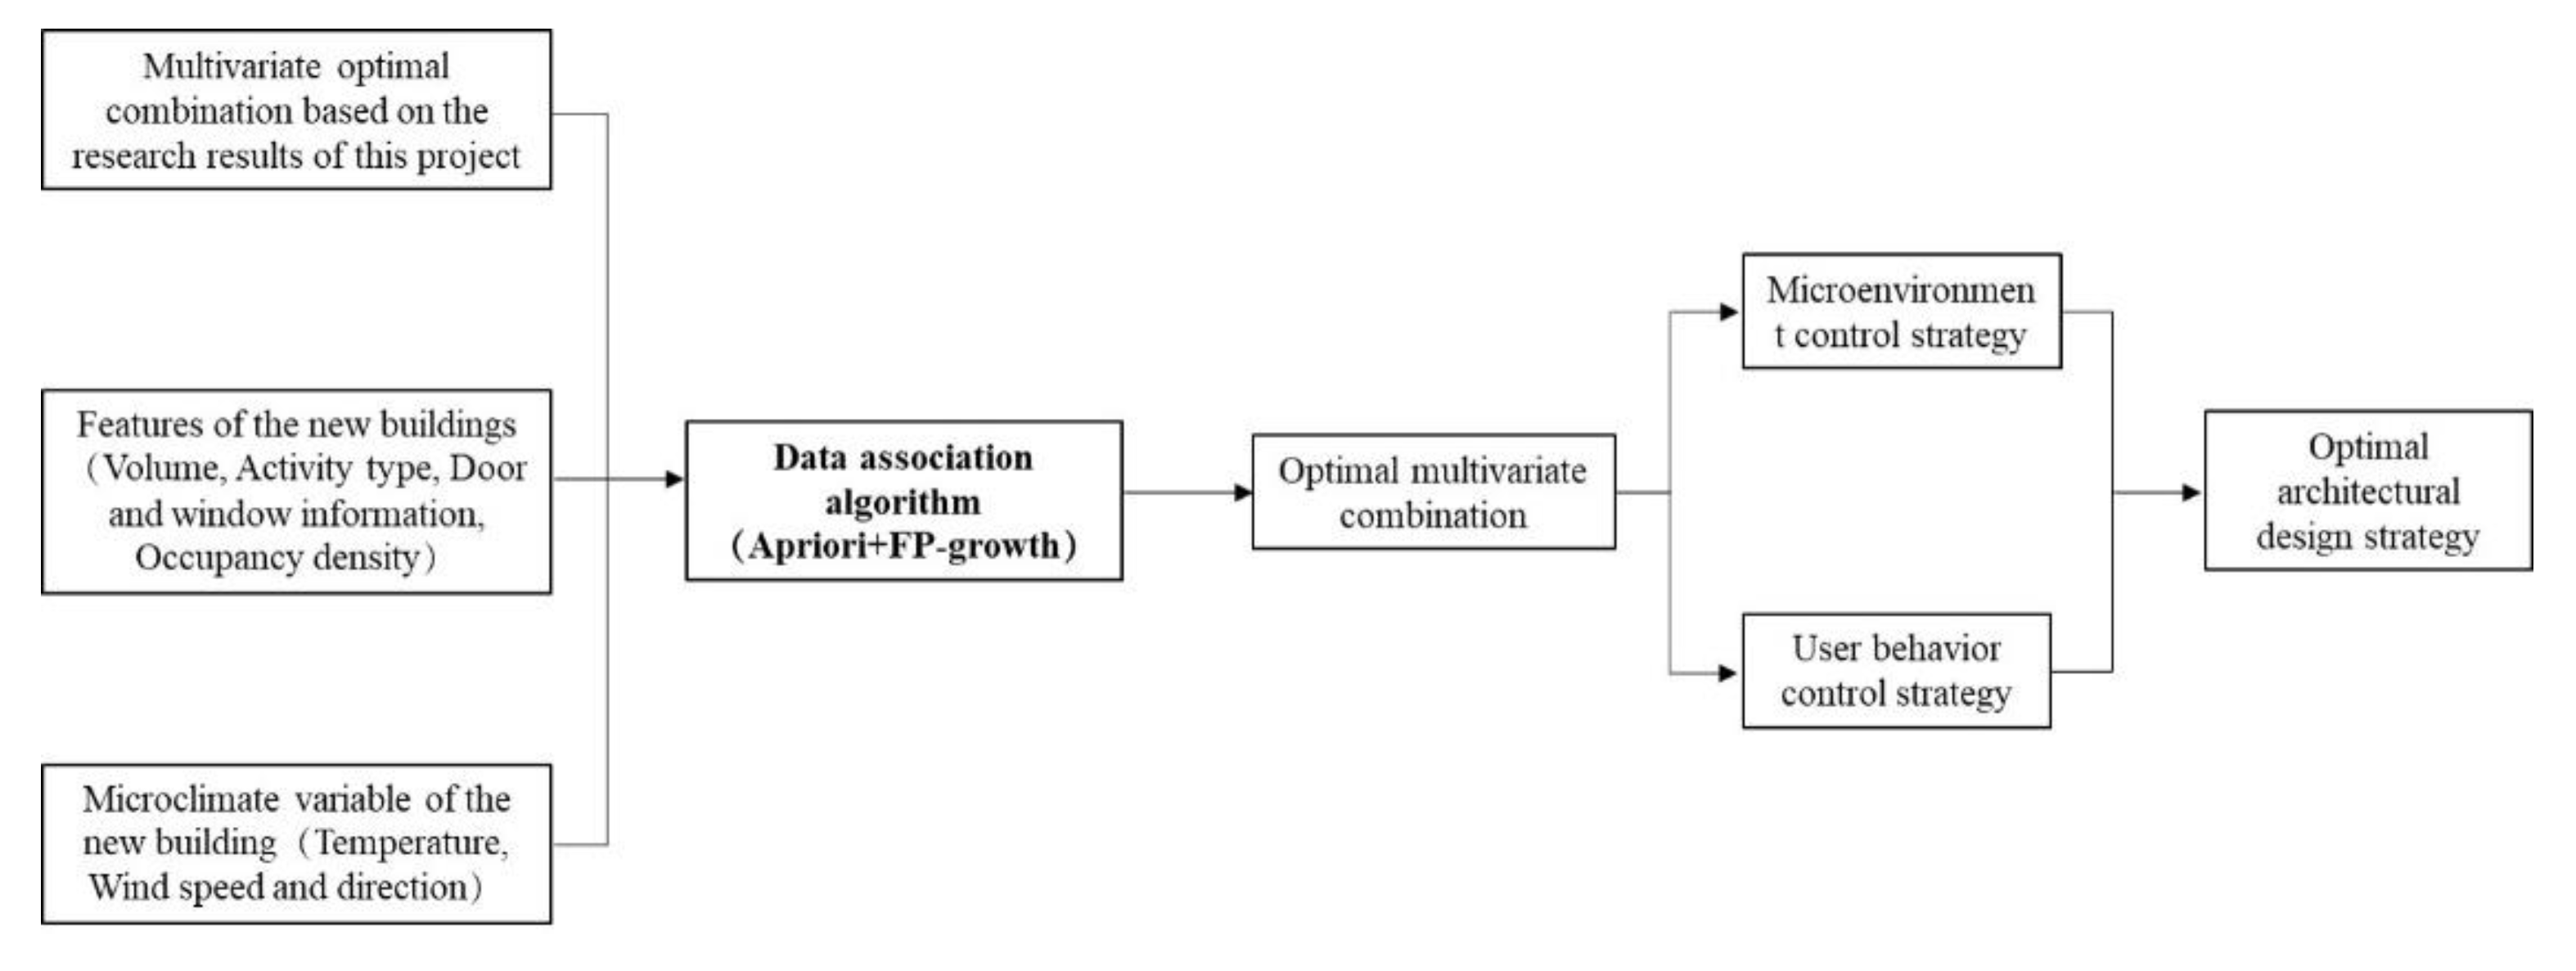
This research intends to use a data association mining algorithm (Apriori algorithm) and an association analysis algorithm (FP-growth algorithm). Both algorithms can find frequent item sets in multivariate combinations. The variable values corresponding to the frequency sets are the optimal combinations of control variables for buildings under specific microenvironments and user behavior conditions. In reality, the FP-growth algorithm is more efficient than the Apriori algorithm; nonetheless, the Apriori algorithm is more adaptable and has a broader range of applications. Based on their benefits, this study will cross-validate the two algorithms to determine the ideal algorithm for the dynamic real-time visualized monitoring system. In this study, there are two ways to seek the optimal mathematical theoretical model under multivariable conditions: (1) using reverse thinking for existing school buildings (Figure 6); (2) using positive thinking for future school buildings (Figure 7). The objective of reverse thinking is to explore the mathematical theory and logical connection between multivariable and building energy-saving in the built environment. Hence, it is a multivariable data collection and analysis for the status quo of educational buildings. Positive thinking is implemented based on the universal applicability of this study’s findings while also considering the unique factors of new buildings to determine the optimal strategy for the energy-saving design of school buildings. Besides microenvironment and user behavior information, the new building feature variables include building attribute variables such as building volume size (shape coefficient), orientation, location, occupants’ density, and number and placement of entrances and exits. Therefore, in the process of positively exploring the optimal combination of multiple variables, more variables are involved than in the process of reverse exploration.
It is worth noting that the standardization of primary school buildings in China is a fundamental prerequisite for applying the mathematical model established in the proposed system to the design of new buildings. Primary school buildings are characterized by standardized features, including classroom sizes, student numbers per classroom, user age and behavior habits, building orientation, and window and door dimensions, which are often similar or identical. Additionally, the mathematical model is established based on the collection of extensive data from existing buildings, which reflects their real-world usage and can be used to predict the energy loss of future buildings. During the design phase, the 3D model of a new building can be imported into the proposed energy loss monitoring system, which provides optimization suggestions based on the energy loss control strategies stored in the system derived from existing building data. Therefore, the system effectively controls the energy loss of new buildings during the design phase. Based on the monitoring data, the system conducts real-time monitoring of existing buildings and proposes control strategies to reduce energy loss. The system may suggest optimization suggestions for the building during the design phase, such as altering the position of doors and windows to minimize the impact of outdoor environmental factors on the indoor environment. For existing buildings, the system may focus on optimizing operational strategies, such as adjusting the heating supply when the indoor temperature increases or recommending opening doors facing different directions in different seasons.

3.5. Expected visual operation interface

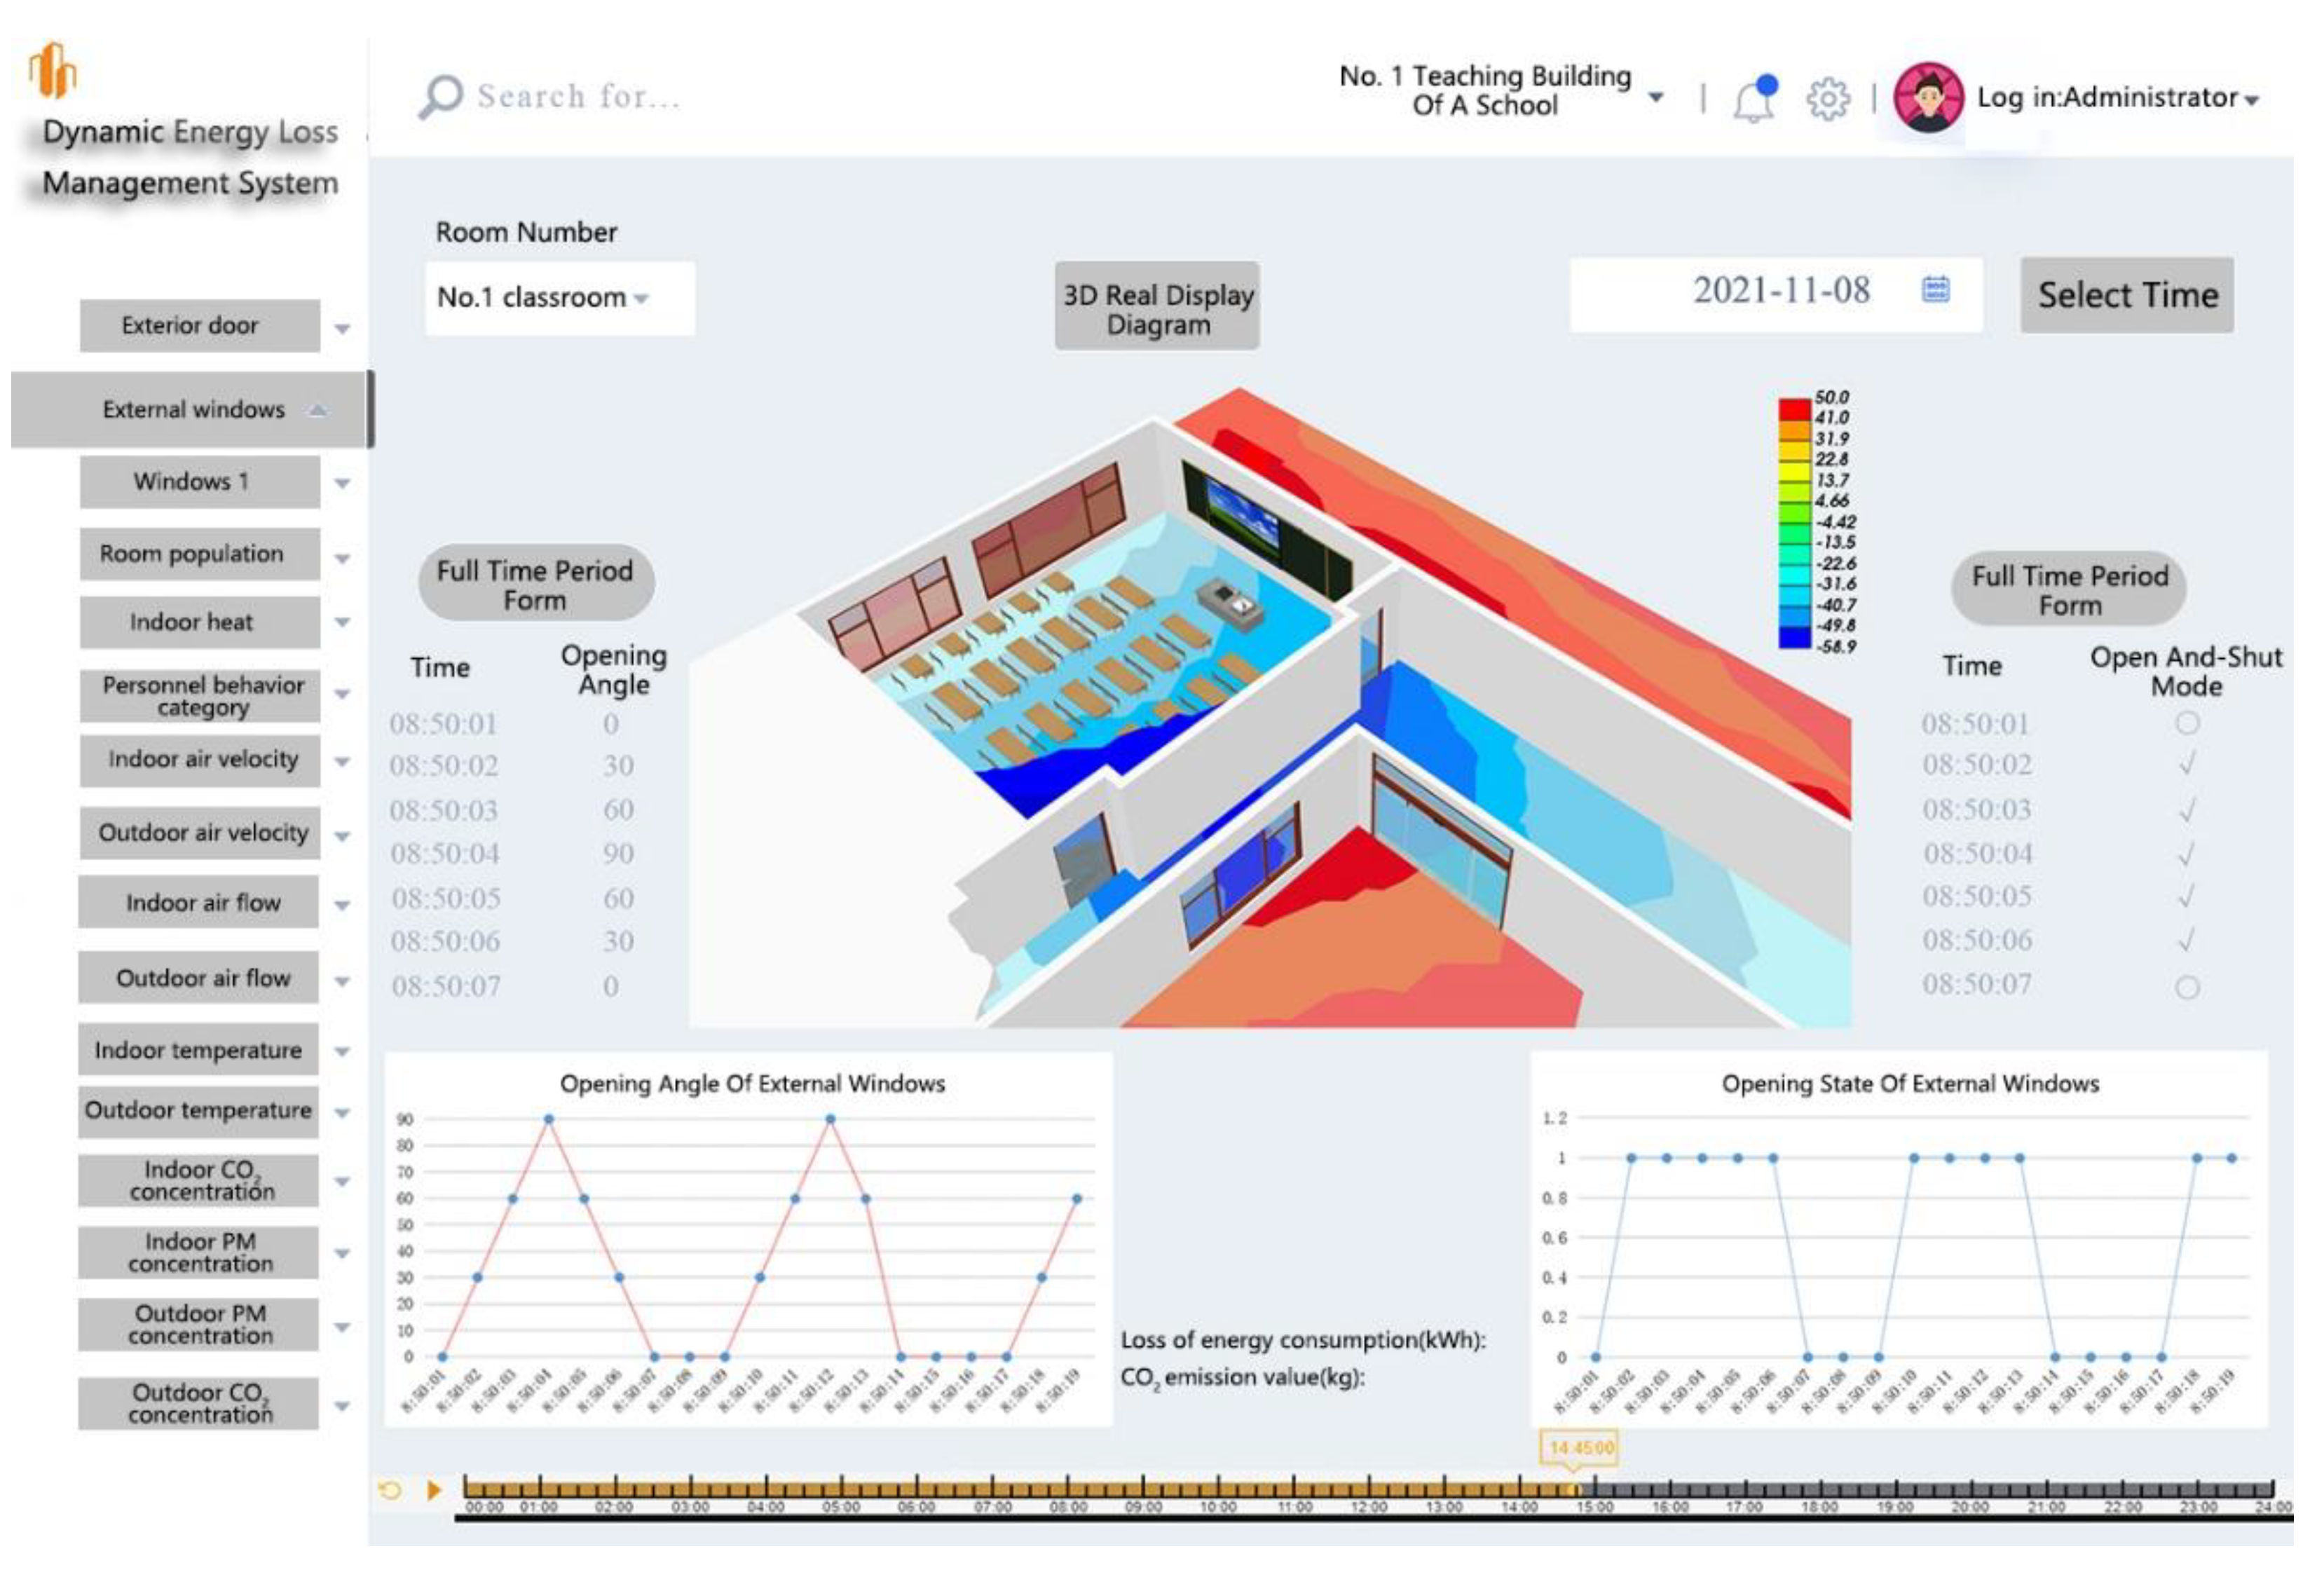
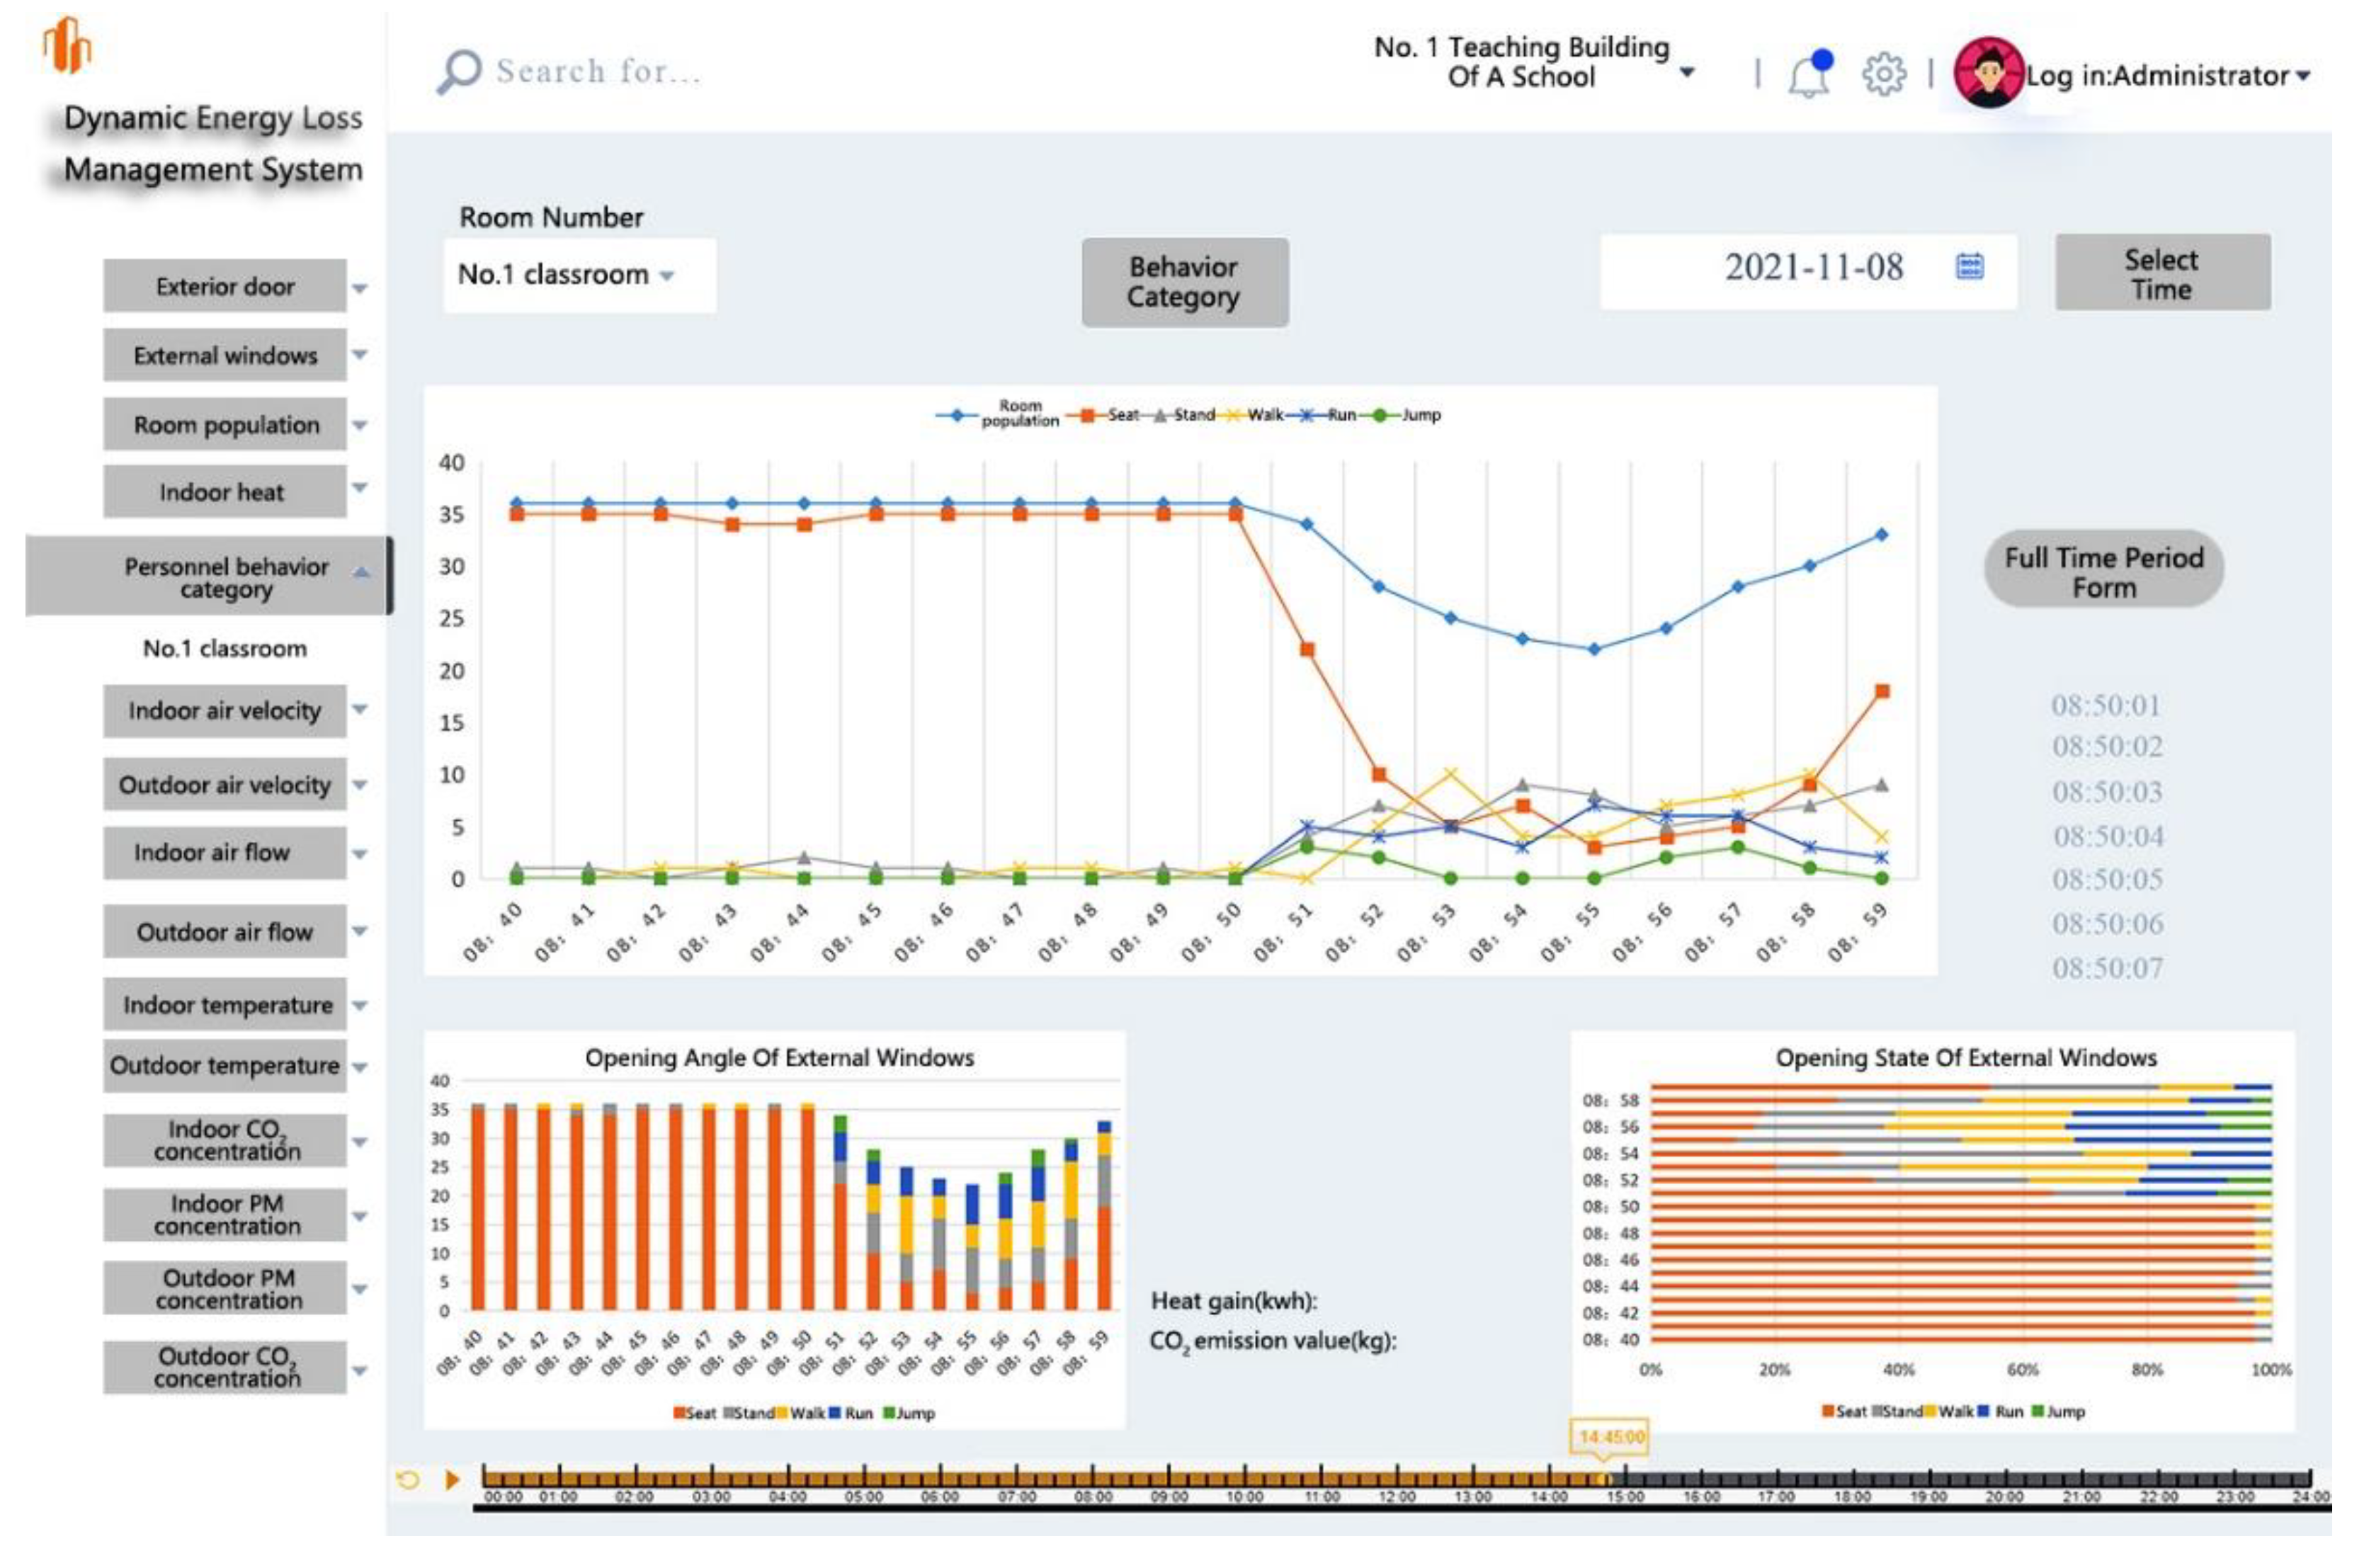
According to the previous discussion, establishing the visualization platform operating system is based on intelligent sensor data collection, LoRa technology wireless transmission, Python language program, WebGL framework construction, Three.js rendering engine, and lightweight model technologies. Figure 8 and Figure 9 depict two examples of the interface of the expected visual operating system. A multivariate data selection box based on environmental data and occupant behavior information is displayed on the left. The user can directly click on the variable that needs to be comprehended. Simultaneously, the real-time value corresponding to the selected variable and the dynamic change over a certain period (24 hours, one month) can be directly displayed on the right side. The middle part of Figure 8 depicts the real-time dynamic change cloud map of the monitoring spaces in indoor and outdoor environments. With this map, architects may more accurately predict the changes in future school buildings’ indoor and outdoor microenvironments in the real world. It can also have an intuitive understanding of the real-time dynamic changes in existing educational buildings’ internal and external environments. The lower part of the middle interface provides the graphic relationship between single or multiple variables and energy loss given by the visual control system, which is convenient for researchers to use. Simultaneously, the system can directly provide the value of energy loss and the corresponding carbon emission value, as well as theoretical mathematical models that can be used to optimize building design and operation.

4. Conclusions and future work

This study began by conducting a literature review using the keywords “occupants’ behavior” and “microenvironment” to identify the main problem in the existing research: the building dynamic energy loss related to occupants’ behavior and indoor-outdoor microenvironment cannot be accurately quantified. Concurrently, it is discovered that there is no relevant research on school buildings. Thus, this study presents a dynamic real-time monitoring system based on a data capture and visualization platform for building heat loss. This system displays monitored data on the computer screen regarding the occupants’ behavior and the indoor-outdoor environments’ microclimate conditions.
In addition, building designers and operation managers can modify building operation and maintenance procedures promptly to minimize energy loss. This study overcomes the limitations of previous research regarding the inaccurate estimation of energy consumption in educational buildings by employing real time multivariate data capture and automatic computer calculations to quantify the dynamic energy loss in real-time and displaying it on a visualization platform to help researchers identify and unlock the energy-saving potential of educational buildings. This study integrates several contemporary advanced analysis methods and research tools to develop an exploration logic that supports the optimal combination of multiple variables and ultimately uses a lightweight model to create a visualization operating system for building energy efficiency design and control strategies. Thus, such an operating system can considerably increase the accuracy and efficiency of quantifying dynamic building energy losses and scientifically determine the optimal design and operation strategies for buildings under certain circumstances.
This study aims to investigate the intrinsic mechanism of action between dynamic energy loss of buildings and multiple variables, form a universally applicable mathematical model of building energy-saving design, and provide a theoretical foundation for the low-energy design of school buildings.
Future research should refine using sensors for data collection so that each variable may be precisely manipulated. It must also be investigated whether mathematical theory models can be constructed using algorithms other than the Apriori and FP-growth algorithms. Also, the economic benefit of the dynamic energy loss monitoring system must be considered in greater detail, as the economic benefit is tied to the system’s promotional value.

Author Contributions

Zhen Peng: Conceptualization, Methodology, Writing-Original draft preparation, Project Administration. Yanan Yu: Visualization, Investigation, Validation. Rui Guan: Visualization, Formal Analysis, Review and Editing.

Funding

This research was funded by Natural Science Foundation of Shandong Province, grant number: ZR2022QE280.

Conflicts of Interest

The authors declare no conflict of interest.

References

  1. Zhao, X., Ma, X., Chen, B., Shang, Y., & Song, M. (2022). Challenges toward carbon neutrality in China: Strategies and countermeasures. Resources, Conservation and Recycling, 176, 105959. [CrossRef]
  2. Jiang, Y. (Ed.). (2020). (rep.). Annual Development Research Report on Building Energy Efficiency in China 2019 (pp. 1–420). Beijing: China Construction Industry Press.
  3. Pérez-Lombard, L., Ortiz, J., & Pout, C. (2008). A review on buildings energy consumption information. Energy and buildings, 40(3), 394-398. [CrossRef]
  4. Chen, S., Li, N., Guan, J., Xie, Y., Sun, F., & Ni, J. (2008). A statistical method to investigate national energy consumption in the residential building sector of China. Energy and Buildings, 40(4), 654-665. [CrossRef]
  5. Juan, X., & Weijun, G. (2018). Analysis on energy consumption of rural building based on survey in northern China. Energy for sustainable development, 47, 34-38. [CrossRef]
  6. Hong, T. (2009). A close look at the China design standard for energy efficiency of public buildings. Energy and Buildings, 41(4), 426-435. [CrossRef]
  7. Saroglou, T., Meir, I. A., & Theodosiou, T. (2017). Quantifying energy consumption in skyscrapers of various heights. Procedia environmental sciences, 38, 314-321. [CrossRef]
  8. Oldfield, P., Trabucco, D., & Wood, A. (2009). Five energy generations of tall buildings: an historical analysis of energy consumption in high-rise buildings. The Journal of Architecture, 14(5), 591-613. [CrossRef]
  9. Lotfabadi, P. (2014). High-rise buildings and environmental factors. Renewable and Sustainable Energy Reviews, 38, 285-295. [CrossRef]
  10. Delzendeh, E., Wu, S., Lee, A., & Zhou, Y. (2017). The impact of occupants’ behaviours on building energy analysis: A research review. Renewable and sustainable energy reviews, 80, 1061-1071. [CrossRef]
  11. Masoso, O. T., & Grobler, L. J. (2010). The dark side of occupants’ behaviour on building energy use. Energy and buildings, 42(2), 173-177. [CrossRef]
  12. Kang, H., Lee, M., Hong, T., & Choi, J. K. (2018). Determining the optimal occupancy density for reducing the energy consumption of public office buildings: A statistical approach. Building and Environment, 127, 173-186. [CrossRef]
  13. Jiang, Y. (Ed.). (2022). (rep.). Annual Development Research Report on Public Building Energy Efficiency in China 2022 (pp. 160–170). Beijing: China Construction Industry Press.
  14. Ministry of Education of China. (2021). Statistical Bulletin on the Development of National Education in 2020. Retrieved March 16, 2023, from http://www.moe.gov.cn/jyb_sjzl/sjzl_fztjgb/202108/t20210827_555004.html.
  15. Pereira, L. D., Raimondo, D., Corgnati, S. P., & Da Silva, M. G. (2014). Energy consumption in schools–A review paper. Renewable and Sustainable Energy Reviews, 40, 911-922.
  16. Alam, M., & Devjani, M. R. (2021). Analyzing energy consumption patterns of an educational building through data mining. Journal of Building Engineering, 44, 103385. [CrossRef]
  17. Xie, Z., Ruan, Y., Sun, K., Huang, J., & Liu, H. (2020). Study on energy consumption of public buildings in Qingdao based on statistical date. Architecture Technology, 51(06), 662-665.
  18. Wu, W., Xu, Q., Feng, J., Xu, w., & Zhi, J. (2021). Analysis of 2020 annual energy consumption date in Shanghai public buildings energy monitoring system. Shanghai Energy Conservation, 2021(07), 673-678.
  19. Yu, F., Wu, F., & Cao, F. (2020). Analysis on Energy Consumption Status of Existing Public Buildings in Hangzhou. Zhejiang Construction, 37(03), 53-56.
  20. Qiu, Z & Ni, W. (2020). Statistical Analysis of Energy Consumption of Public Buildings in Wuxi City. Building Energy Efficiency, 48(06), 84-88.
  21. Xing, J., Chen, J., & Ling, J. (2015). Energy consumption of 270 schools in Tianjin, China. Frontiers in Energy, 9, 217-230. [CrossRef]
  22. Li, Y., Yang, B., Li, C., Li, H & Li, H. (2016). Investigation and analysis of energy consumption of office buildings and commercial buildings in Tianjin. Building Technology, 14, 94-96.
  23. Jiang, J., Wang, D., Liu, Y., Xu, Y & Liu, J. (2019). Experimental study on relationship between indoor temperature and learning efficiency of primary and middle school students in winter. Heating Ventilating & Air Conditioning, 49(05), 99-105+85.
  24. Berardi, U., Tronchin, L., Manfren, M., & Nastasi, B. (2018). On the effects of variation of thermal conductivity in buildings in the Italian construction sector. Energies, 11(4), 872. [CrossRef]
  25. Sørensen, L. S. (2013). Heat transmission coefficient measurements in buildings utilizing a heat loss measuring device. Sustainability, 5(8), 3601-3614. [CrossRef]
  26. Kempton, L., Daly, D., Kokogiannakis, G., & Dewsbury, M. (2022). A rapid review of the impact of increasing airtightness on indoor air quality. Journal of Building Engineering, 57, 104798. [CrossRef]
  27. Ibrahim, M., Ghaddar, N., & Ghali, K. (2012). Optimal location and thickness of insulation layers for minimizing building energy consumption. Journal of Building Performance Simulation, 5(6), 384-398. [CrossRef]
  28. Al-Mumin, A., Khattab, O., & Sridhar, G. (2003). Occupants’ behavior and activity patterns influencing the energy consumption in the Kuwaiti residences. Energy and buildings, 35(6), 549-559. [CrossRef]
  29. Wood, G., & Newborough, M. (2003). Dynamic energy-consumption indicators for domestic appliances: environment, behaviour and design. Energy and buildings, 35(8), 821-841. [CrossRef]
  30. Mahdavi, A., Mohammadi, A., Kabir, E., & Lambeva, L. (2008). Occupants’ operation of lighting and shading systems in office buildings. Journal of building performance simulation, 1(1), 57-65. [CrossRef]
  31. Masoso, O. T., & Grobler, L. J. (2010). The dark side of occupants’ behaviour on building energy use. Energy and buildings, 42(2), 173-177. [CrossRef]
  32. da Silva, P. C., Leal, V., & Andersen, M. (2013). Occupants’ interaction with electric lighting and shading systems in real single-occupied offices: Results from a monitoring campaign. Building and Environment, 64, 152-168. [CrossRef]
  33. Azizi, N. S. M., Wilkinson, S., & Fassman, E. (2015). Do occupants in green buildings practice better energy saving behaviour in computer usage than occupants in conventional buildings? Journal of Green Building, 10(4), 178-193.
  34. Almeida, L., Tam, V. W., Le, K. N., & She, Y. (2020). Effects of occupant behaviour on energy performance in buildings: a green and non-green building comparison. Engineering, Construction and Architectural Management, 27(8), 1939-1962. [CrossRef]
  35. Rijal, H. B., Tuohy, P., Nicol, F., Humphreys, M. A., Samuel, A., & Clarke, J. (2008). Development of an adaptive window-opening algorithm to predict the thermal comfort, energy use and overheating in buildings. Journal of Building Performance Simulation, 1(1), 17-30. [CrossRef]
  36. Chen, W., Ding, Y., Bai, L., & Sun, Y. (2020). Research on occupants’ window opening behavior in residential buildings based on the survival model. Sustainable Cities and Society, 60, 102217. [CrossRef]
  37. Nicol, J. F. (2001). Characterizing occupant behavior in buildings. Towards a stochastic model of occupant use of windows, light, blinds, heater and fans. In Proceedings of building simulation 01, an IBPSA Conference.
  38. Santin, O. G., Itard, L., & Visscher, H. (2009). The effect of occupancy and building characteristics on energy use for space and water heating in Dutch residential stock. Energy and buildings, 41(11), 1223-1232. [CrossRef]
  39. Herkel, S., Knapp, U., & Pfafferott, J. (2008). Towards a model of user behaviour regarding the manual control of windows in office buildings. Building and environment, 43(4), 588-600. [CrossRef]
  40. Schweiker, M., & Shukuya, M. (2009). Comparison of theoretical and statistical models of air-conditioning-unit usage behaviour in a residential setting under Japanese climatic conditions. Building and Environment, 44(10), 2137-2149. [CrossRef]
  41. Hong, T., Taylor-Lange, S. C., D’Oca, S., Yan, D., & Corgnati, S. P. (2016). Advances in research and applications of energy-related occupant behavior in buildings. Energy and buildings, 116, 694-702. [CrossRef]
  42. Heebøll, A., Wargocki, P., & Toftum, J. (2018). Window and door opening behavior, carbon dioxide concentration, temperature, and energy use during the heating season in classrooms with different ventilation retrofits—ASHRAE RP1624. Science and Technology for the Built Environment, 24(6), 626-637.
  43. Jones, R. V., Fuertes, A., Gregori, E., & Giretti, A. (2017). Stochastic behavioural models of occupants’ main bedroom window operation for UK residential buildings. Building and Environment, 118, 144-158. [CrossRef]
  44. Rouleau, J., & Gosselin, L. (2020). Probabilistic window opening model considering occupant behavior diversity: A data-driven case study of Canadian residential buildings. Energy, 195, 116981.
  45. Andersen, R., Fabi, V., Toftum, J., Corgnati, S. P., & Olesen, B. W. (2013). Window opening behaviour modelled from measurements in Danish dwellings. Building and environment, 69, 101-113. [CrossRef]
  46. Fabi, V., Andersen, R. K., & Corgnati, S. (2015). Verification of stochastic behavioural models of occupants’ interactions with windows in residential buildings. Building and Environment, 94, 371-383. [CrossRef]
  47. Barthelmes, V. M., Becchio, C., Fabi, V., & Corgnati, S. P. (2017). Occupant behaviour lifestyles and effects on building energy use: Investigation on high and low performing building features. Energy Procedia, 140, 93-101. [CrossRef]
  48. Peng, C., Yan, D., Wu, R., Wang, C., Zhou, X., & Jiang, Y. (2012, June). Quantitative description and simulation of human behavior in residential buildings. In Building simulation (Vol. 5, pp. 85-94). Tsinghua Press. [CrossRef]
  49. Hetherington, J., Roetzel, A., & Fuller, R. (2015). The impact of occupant behaviour on residential greenhouse gas emissions reduction. Journal of Green Building, 10(4), 127-140. [CrossRef]
  50. Gaetani, I., Hoes, P. J., & Hensen, J. L. (2016). Occupant behavior in building energy simulation: Towards a fit-for-purpose modeling strategy. Energy and Buildings, 121, 188-204. [CrossRef]
  51. Yan, D., Hong, T., Dong, B., Mahdavi, A., D’ Oca, S., Gaetani, I., & Feng, X. (2017). IEA EBC Annex 66: Definition and simulation of occupant behavior in buildings. Energy and Buildings, 156, 258-270. [CrossRef]
  52. Shi, S., & Zhao, B. (2016, April). Occupants’ interactions with windows in 8 residential apartments in Beijing and Nanjing, China. In Building Simulation (Vol. 9, pp. 221-231). Tsinghua University Press. [CrossRef]
  53. Yao, M., & Zhao, B. (2017). Window opening behavior of occupants in residential buildings in Beijing. Building and Environment, 124, 441-449. [CrossRef]
  54. Mo, H., Sun, H., Liu, J., & Wei, S. (2019). Developing window behavior models for residential buildings using XGBoost algorithm. Energy and Buildings, 205, 109564. [CrossRef]
  55. Jeong, B., Jeong, J. W., & Park, J. S. (2016). Occupant behavior regarding the manual control of windows in residential buildings. Energy and buildings, 127, 206-216. [CrossRef]
  56. Wang, L., & Greenberg, S. (2015). Window operation and impacts on building energy consumption. Energy and Buildings, 92, 313-321. [CrossRef]
  57. Cedeno Laurent, J. G., Samuelson, H. W., & Chen, Y. (2017, December). The impact of window opening and other occupant behavior on simulated energy performance in residence halls. In Building Simulation (Vol. 10, pp. 963-976). Tsinghua University Press. [CrossRef]
  58. Yousefi, F., Gholipour, Y., & Yan, W. (2017). A study of the impact of occupant behaviors on energy performance of building envelopes using occupants’ data. Energy and Buildings, 148, 182-198. [CrossRef]
  59. Pan, S., Han, Y., Wei, S., Wei, Y., Xia, L., Xie, L., ... & Yu, W. (2019). A model based on Gauss Distribution for predicting window behavior in building. Building and Environment, 149, 210-219. [CrossRef]
  60. Daniel, L., Soebarto, V., & Williamson, T. (2015). House energy rating schemes and low energy dwellings: The impact of occupant behaviours in Australia. Energy and Buildings, 88, 34-44. [CrossRef]
  61. Mori, H., Kubota, T., Antaryama, I. G. N., & Ekasiwi, S. N. N. (2020). Analysis of window-opening patterns and air conditioning usage of urban residences in tropical southeast Asia. Sustainability, 12(24), 10650. [CrossRef]
  62. Liu, B., Niu, R., & Wei, S. (2017). An Analysis of the Use of Air Conditioners in Summer in Beijing. Architectural Journal, 000(003), 114-117.
  63. Ren, J., Zhou, X., An, J., Yan, D., Shi, X., Jin, X., ... & Tang, L. (2020). A Comparative Analysis of Window Operating Behavior in Three Different Open-plan Offices in Nanjing. Architectural Journal, 36(12), 54-61. [CrossRef]
  64. Zhu, G., Zhang, X., & Yan, D. (2006). Effects of Operation Mode of Air Conditioning on Energy Consumption of Heating and Air Conditioning in Residential Buildings. Journal of Chongqing Jianzhu University, 05, 119-121.
  65. Zhao, Q., Lin, J., Huang, Z., & Duan, M. (2017). Impacts of Occupant Behavior Pattern on Air-Condtioning Energy Consumption of Rural Residential Buildings in Chongqing. Refrigeration & Air Conditioning, 31(06), 627-635.
  66. Zhou, X., Yan, D., An, J., & Hong, T. (2014). Comparison and Analysis of Energy Consumption of Four Office Buildings in China and the United States. Building Science, 30(06), 55-65.
  67. Luo, T., Yan, D., Jiang, Y., & Zhao, J. (2017). Study on Lighting Energy Simulation Method for Office Buildings (Part I). Building Science, 33(04), 101-109.
  68. Luo, T., Yan, D., Jiang, Y., & Zhao, J. (2017). Study on Lighting Energy Simulation Method for Office Buildings (Part II). Building Science, 33(06), 123-129.
  69. Yan, D., Feng, X., Wang, C., Hong, T., William O’ Brien., H.Burak Gunay., ... & Ardeshir Mahdavi. (2015). Current State and Future Perspective of Occupant Behavior Simulation in Buildings. Building Science, 31(10), 178-187.
  70. He, D., Huang, Y., & Ding, Y. (2014). Systematically Analysis and Study on Technical Measures of Energy Savings for Typical Public Buildings in Chongqing. Journal of Chongqing Jianzhu University, 16(04), 112-116.
  71. Qiu, S., Li, A., & Zhang, X. (2008). Behavioural energy efficiency: Analysis of the opening rate of naturally ventilated residential windows in Xian. Proceedings of the Annual Railway HVAC Academic Conference, 117-120.
  72. Zhang, J. (2011). Study on the Influence of Building Height and Orientation on Natural Ventilation Behavior of Users in Offices. Huazhong Architecture, 29(08), 50-53.
  73. Chen, W., & Li, S. (2011). The Investigation of Thermal Comfort and the Occupant Behaviour Models of Window Control during Summer Season of Hot Summer/ Cold Winter Region. Refrigeration, 30(02), 76-81.
  74. Jian, Y., Li, Q., Bai, Z., & Kong, X. (2011). Study on Influences of Usage Behavior of Residential Air Handling Unit on Energy Consumption in Summer. Building Science, 27(12), 16-19+86. [CrossRef]
  75. Zhou, X., Liu, T., Shi, X., & Jin, X. (2018). Case study of window operating behavior patterns in an open-plan office in the summer. Energy and Buildings, 165, 15-24.
  76. Chen, S., Zhang, H., & Ge, J. (2018). Feature Analysis of Use Behavior of Air Conditioners in the University Research Building. Architecture & Culture, 000(009), 170-172.
  77. Li, J., Fu, L., & Di, H. (2008). Test and analysis of heat loss through open windows in heated residential rooms. Heating Ventilating & Air Conditioning, 38(003), 111-113.
  78. Chen, B., Qin, Y., Yang, Y., & Zhu, C. (2018). Test analysis of window opening and closing behaviour in heated residential rooms and building energy consumption. West Leather, 40(08), 28.
  79. Li, J., Fu, L., & Di, H. (2020). Research on personnel window opening behavior based on Logistic regression and average Bayesian network models. Heating Ventilating & Air Conditioning, 50(09), 135-140+121.
  80. Pan, S., Xu, C., Wei, S., Tarek MHassan., Xie, L., Xiong, Y., & Pieterde Wilde. (2015). Research on the Occupant Window Opening Behaviour in an Office Building in Beijing. Building Science, 31(10), 212-217.
  81. Ma, H., Shao, X., Liang, C., Wang, H., Wu, C., LI, X., & Ma, Y. (2016). Feasibility analysis on combination strategies of window ventilation and air cleaners in residential buildings under haze weather. Heating Ventilating & Air Conditioning, 46(02), 18-23.
  82. Yan, D., Feng, X., Wang, C., Hong, T., William O’Brien., H. Burak Gunay., ... & Ardeshir Mahdavi. (2015). Current State and Future Perspective of Occupant Behavior Simulation in Buildings. Building Science, 31(10), 178-187.
  83. Zhou, T., & Fu, Y. (2020). A machine learning-based method for predicting window opening and closing behaviour during the transition season. China City Press, 205-210.
  84. Fabi, V., Andersen, R. V., Corgnati, S. P., & Olesen, B. W. (2013). A methodology for modelling energy-related human behavior: Application to window opening behavior in residential buildings. Building Simulation, Vol. 6, pp. 415-427.
  85. Liu, Y., Wang, X., Cui, Y., Wei, S., & Pan, S. (2021). Measurement and Modelling of Occupants’ Window Opening Behavior in Residential Buildings in the Hot Summer and Cold Winter Regions in Summer. Journal of human settlements in West China, 36(05), 15-23.
  86. Yao, X. (2019). Simulation and Contrastive Analysis of Indoor Wind Environment in Two Different Windows in Hot Summer and Cold Winter Areas. Architecture & Culture, 01, 37-38.
  87. Han, X., Wang, C., Pan, S., Qin, M., Zhang, H., Liu, Y., & Wang, T. (2021). Field measurement and analysis of window opening behavior of residential buildings in severe cold region in winter. Journal of Jilin Jianzhu University, 38(02), 41-47.
  88. Piao, Y., Wang, C., Pan, S., Cui, T., Zhao, M., & Qi, J. (2020). Study on the window opening behavior of office buildings in the transition season of severe cold area. Journal of Jilin Jianzhu University, 37(02), 43-49.
  89. Gu, Y., Cui, T., Liu, Y., Pan, S., Liu, K., Yang, F., & Piao, Y. (2020). Theoretical and Field Measurement of Occupants’ Window Opening Behavior in an Office Building of Xian in a Season of Transition. Building Science, 36(12), 62-73.
  90. 90. Zhang, Shuai & Liu, Yan & Yang, Liu & Liu, Jiang & Hou, Liqiang. (2019). The difference between steady-state calculation and dynamic simulation for energy efficiency of residential buildings with different storeys in severe cold and cold zones. IOP Conference Series Earth and Environmental Science.
  91. Van der Veken, J., Saelens, D., Verbeeck, G., & Hens, H. (2004). Comparison of steady-state and dynamic building energy simulation programs. In Proceedings of the international Buildings IX ASHREA conference on the performance of exterior envelopes of whole buildings, Clearwater Beach, Florida 2004.
  92. Dalla Mora, T., Teso, L., Carnieletto, L., Zarrella, A., & Romagnoni, P. (2021). Comparative Analysis between Dynamic and Quasi-Steady-State Methods at an Urban Scale on a Social-Housing District in Venice. Energies, 14(16), 5164. [CrossRef]
  93. Cabrera, D. F. M., & Zareipour, H. (2013). Data association mining for identifying lighting energy waste patterns in educational institutes. Energy and Buildings, 62, 210-216. [CrossRef]
  94. Ashouri, M., Haghighat, F., Fung, B. C., Lazrak, A., & Yoshino, H. (2018). Development of building energy saving advisory: A data mining approach. Energy and Buildings, 172, 139-151. [CrossRef]
  95. Li, G., Hu, Y., Chen, H., Li, H., Hu, M., Guo, Y., ... & Sun, M. (2017). Data partitioning and association mining for identifying VRF energy consumption patterns under various part loads and refrigerant charge conditions. Applied energy, 185, 846-861. [CrossRef]
  96. Costa, A., Keane, M. M., Torrens, J. I., & Corry, E. (2013). Building operation and energy performance: Monitoring, analysis and optimisation toolkit. Applied energy, 101, 310-316. [CrossRef]
  97. Ruiz, L. G. B., Pegalajar, M. C., Molina-Solana, M., & Guo, Y. K. (2020). A case study on understanding energy consumption through prediction and visualization (VIMOEN). Journal of Building Engineering, 30, 101315. [CrossRef]
  98. Ellegård, K., & Palm, J. (2011). Visualizing energy consumption activities as a tool for making everyday life more sustainable. Applied Energy, 88(5), 1920-1926. [CrossRef]
  99. Mattinen, M. K., Heljo, J., Vihola, J., Kurvinen, A., Lehtoranta, S., & Nissinen, A. (2014). Modeling and visualization of residential sector energy consumption and greenhouse gas emissions. Journal of cleaner production, 81, 70-80. [CrossRef]
  100. Truong, H., Francisco, A., Khosrowpour, A., Taylor, J. E., & Mohammadi, N. (2017). Method for visualizing energy use in building information models. Energy Procedia, 142, 2541-2546. [CrossRef]
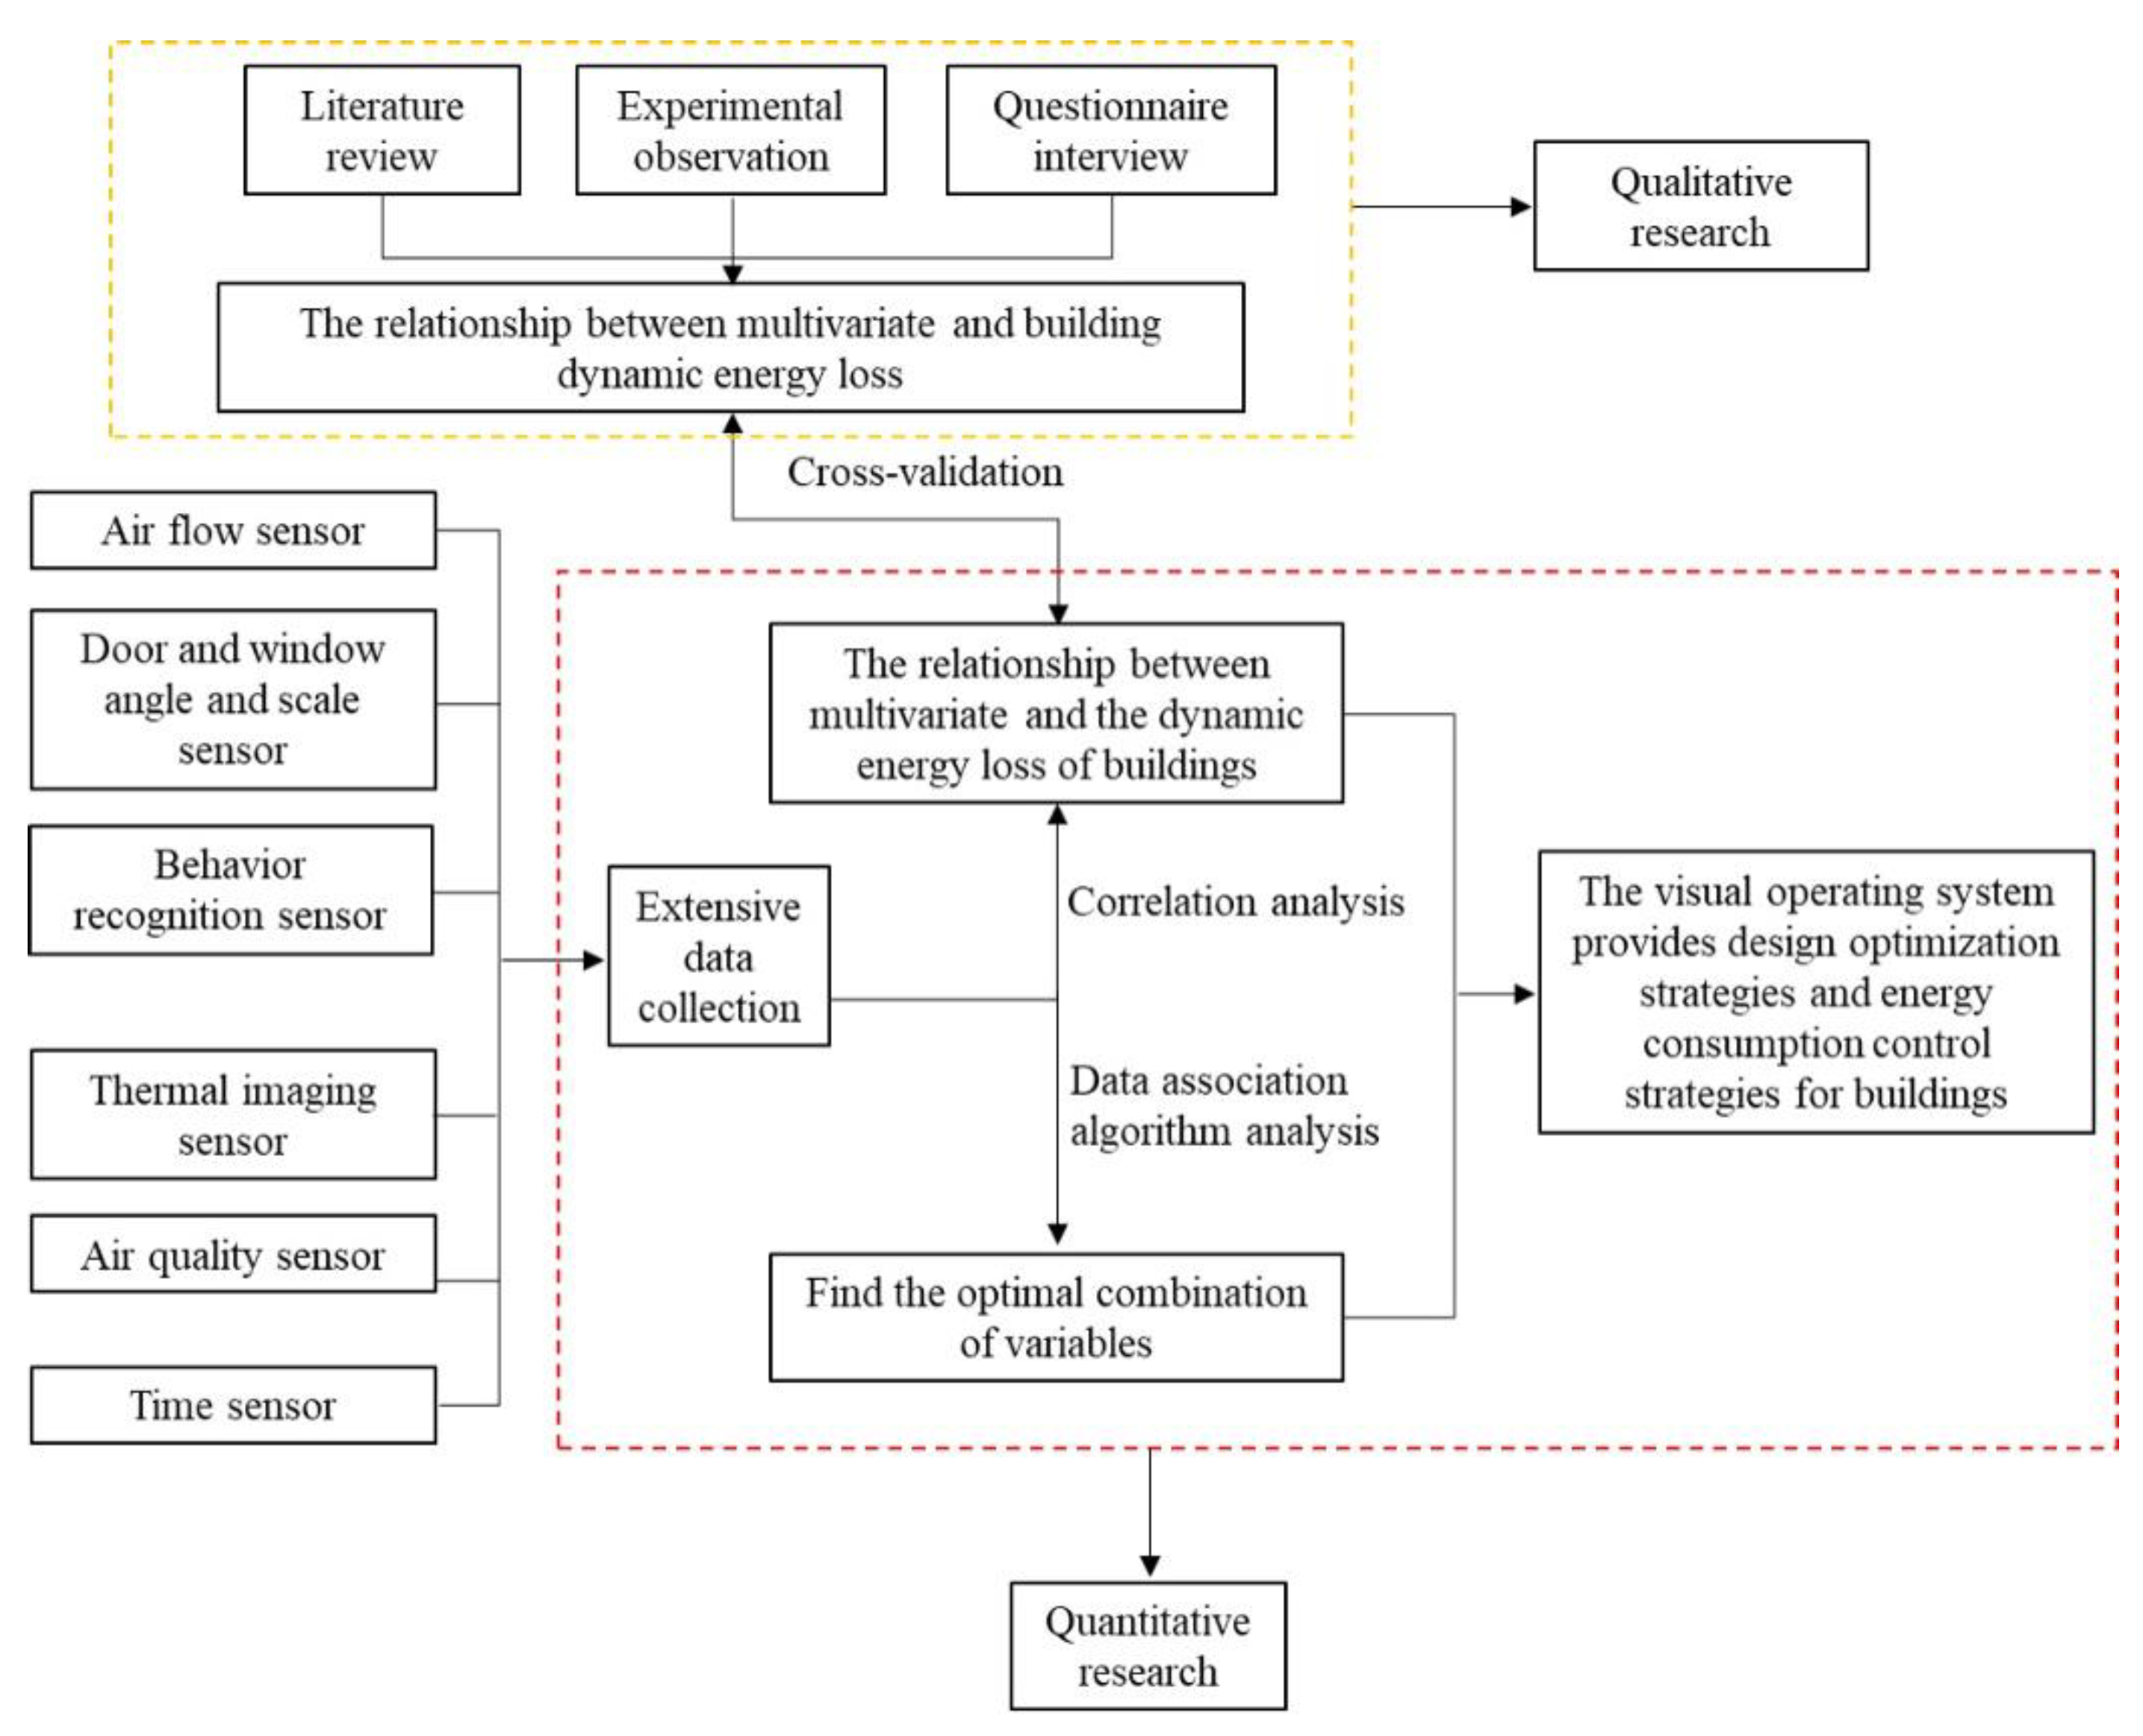
Figure 1. Workflow of the dynamic real-time visualized monitoring system.
Preprints 86419 g001
Figure 2. A typical primary school classroom.
Preprints 86419 g002
Figure 3. Sensor layout plan.
Preprints 86419 g003
Figure 4. Magnetic suction sensors (left) and web services gateway based on the LoRa (right).
Preprints 86419 g004
Figure 5. Indoor environment sensors.
Preprints 86419 g005
Figure 6. Reverse thinking for existing school buildings.
Preprints 86419 g006
Figure 7. Positive thinking for future school buildings.
Preprints 86419 g007
Figure 8. The expected operation interface for the dynamic real-time visualized monitoring system-external windows.
Preprints 86419 g008
Figure 9. The expected operation interface for the dynamic real-time visualized monitoring system-indoor types of activities.
Preprints 86419 g009
Table 1. Reviewed international studies and their main contents and outcomes.
Types References Main content Main outcomes
1 [28,29,30,31,32,33,34] Investigates the relationship between energy-using terminals and energy consumption in unoccupied buildings •  Public buildings consume more energy during non-occupied periods than occupied periods because people leave computers and lights on when not working.
•  Modifying user behavior with household appliances can reduce energy consumption in residential buildings.
2 [35,36,37,38,39,40,41,42] Focuses on user behavior related to building fabrics such as windows, shading devices, and ventilation louvers •  The indoor comfort environment is the main driving force behind occupants’ behavior, with parameters such as CO2 concentration, indoor temperature, and humidity being the most relevant.
•  People may adjust the indoor environment by opening windows even when the air conditioner is on.
3 [43,44,45,46,47,48,49,50,51,52,53,54,55,56,57,58,59,60,61] Focuses mainly on the establishment of simulation models through the collection of user behavior data and implementation of mathematical calculations •  There is a need to find a reliable and cost-friendly method of collecting large amounts of data.
•  The accuracy of behavior prediction models needs to be improved.
Table 2. Reviewed Chinese studies and their main contents and outcomes.
Types References Main content Main outcomes
1 [71,72,73,74,75,76,77] Analyse the factors that influence occupants’ behaviour. • Occupants’ comfort tolerance temperature and thermal comfort preference are significant factors in their behavior, such as opening windows.
2 [78,79,80,81] Quantified the energy losses associated with occupants’ behaviour. • The quantification methods employed mainly consisted of surveys, behavioral records, and measurements of energy-using terminals (e.g., electricity meters). Many dynamic factors were not considered; thus, the accuracy of their results is low.
3 [82,83,84,85,86,87,88,89] Focuses on collecting occupants’ behavior data and developing behavior prediction models for simulation software. • The accuracy of user behavior prediction models is low. Thus, it cannot accurately quantify the energy losses associated with user behavior.
Table 3. Studied variables, sensors and data formats.
Type of data Type of sensor Examples of data formats
External doors Duration of the opening Magnetic suction angle sensors Data format of magnetic suction angle sensors (for swing doors):
08:01:57-08:02:00,open,3s;
08:02:01-08:02:03,close,2s;
Data format of magnetic suction scale sensors (for sliding doors):
08:01:57,angle-0°;
08:01:58,angle-30°;
Magnitude of the Opening Magnetic suction angle sensors(swing doors); Magnetic suction scale sensors(sliding doors)
The airflow speed when the doors open and air is entering Air movement sensor m/s
External windows Duration of the opening Magnetic suction angle sensors The same as the data format for external doors
Magnitude of the Opening Magnetic suction angle sensors(swing doors); Magnetic suction scale sensors(sliding doors)
The airflow speed when the windows open and air is entering Air movement sensor m/s
Air Airflow speed Wind speed sensor m/s
Airflow direction Wind direction sensor N, S, W, E, SW
Indoor and outdoor air temperature Temperature sensor ℃,
Air pollutants Air quality sensor PMs(μg/m3)、CO2(PPM)
Occupants Number of occupants inside Face capture sensors No.
Type of activities Siting, walking, running, jumping, talking S-siting; W-walking; R-running; J-jumping; T-talking
Infrared imaging sensor W/p
Disclaimer/Publisher’s Note: The statements, opinions and data contained in all publications are solely those of the individual author(s) and contributor(s) and not of MDPI and/or the editor(s). MDPI and/or the editor(s) disclaim responsibility for any injury to people or property resulting from any ideas, methods, instructions or products referred to in the content.
Copyright: This open access article is published under a Creative Commons CC BY 4.0 license, which permit the free download, distribution, and reuse, provided that the author and preprint are cited in any reuse.
Prerpints.org logo

Preprints.org is a free preprint server supported by MDPI in Basel, Switzerland.

Subscribe

© 2024 MDPI (Basel, Switzerland) unless otherwise stated