
Submitted:
29 September 2023
Posted:
03 October 2023
You are already at the latest version
Abstract
De novo regeneration of Cannabis sativa L. (cannabis) using tissue culture techniques remains unreliable and infrequent. Conventional methods for the regeneration and transformation of cannabis have not achieved the reliability and replicability needed to be integrated into research and breeding programs. Protoplast systems are effective for gene expression studies, transformation and genome editing technologies, and opens the possibility of somatic hybridization to create interspecific hybrids. To date, leaf-derived protoplast have been isolated for transient gene expression studies, but attempts at protoplast-to-plant regeneration have not been reported. The present study aims to test the efficacy of using a callus culture system, as an abundant source for protoplast isolation and lays the groundwork for a protoplast-to-plant regeneration system. Using hypocotyl-derived callus cultures, which are known to have relatively greater regenerative potential, the efficacy of protoplast isolation and initial cell division were assessed. In this study, the effect of 2-aminoindane-2-phosphonic acid (AIP) in callus culture media and the effect of subculture frequency on protoplast yield were assessed. This study found that inclusion of AIP at 1 mM resulted in a 334% increase in protoplast yield compared with AIP-free medium, representing the first known use of AIP in cannabis tissue culture. Inclusion of AIP led to a 28% decrease in total soluble phenolics and 52% decrease in tissue browning compared to the control medium. Lastly, a two-phase culture system for protoplast regeneration was tested. At a concentration of 2.0×10^5 protoplasts per mL, division was observed, providing the first know report of cell division from cannabis protoplasts and setting the stage for future development of a protoplast-to-plant regeneration system.
Keywords:
protoplast
; Cannabis sativa
; regeneration
; AIP
; phenylpropanoid
; tissue culture
1. Introduction
The growing global trend toward legalization of Cannabis sativa L. (cannabis) has uncovered significant challenges related to its cultivation and application of modern biotechnological techniques. The species’ notable genetic variability, coupled with obscured pedigrees from clandestine breeding programs, contributes to the variable responses and unpredictable outcomes in various settings [1,2]. Plant tissue culture offers invaluable advantages for the industry, including germplasm preservation, propagation of disease-free planting material, and development of modern breeding technologies [3]. However, success relies on developing robust methods that work across diverse genotypes, which have yet to be standardized [1,2]. Despite some reports of high micropropagation and regeneration rates [4,5], their applicability across genotypes remains unverified [2]. Attempts to replicate successful methods have yielded inconsistent results and many authors have referred to cannabis as a relatively recalcitrant species [1,2,3,6,7]. Recent investigations into chemical [8], microsatellite [9,10], whole-genome [11] and epigenome variability [12] in cannabis used in some of these studies have revealed significant disparities compared to commercially relevant cultivars.
Cannabis regeneration methods, including somatic embryogenesis, have shown limited success [13]. As a result, transformation systems for the study of gene function or genetic improvement are not well developed in the species. An alternative approach to study gene function and expression dynamics is the use of plant protoplasts, where cells are stripped of their cell wall to release protoplasts. An advantage of protoplast systems is that it is relatively easy to introduce foreign materials such as plasmids into them, providing an ideal platform for transient gene expression studies or stable cell transformation/editing. Further, transformed/edited protoplasts can be used to regenerate whole plants, and since they are derived from a single cell, the regenerated plants are less likely to be chimeric than plants regenerated using other approaches [14]. Successful CRISPR-mediated transformation of protoplasts has been demonstrated in various commercial crops [15,16,17]. Recent trends in CRISPR methods involve synthesizing sgRNAs and Cas9 complexes in vitro and delivering them as ribonucleoproteins (RNPs) into single protoplasts, and resulting plants are often not classified as genetically modified organisms [15,16,17]. However, there are currently no reports of protoplast to plant regeneration in cannabis, limiting the application of these technologies in the species.
Another valuable application of plant protoplasts is somatic hybridization, in which protoplasts from two individuals can be fused, and the resulting fusion product can be regenerated into as hybrid plant. This technology can be used to create hybrids within species and alter the ploidy level, or even to overcome sexual barriers and produce interspecific hybrids between incompatible species. Protoplast fusion offers an intriguing potential in cannabis: generating hybrids with enhanced disease resistance and creating new plant varieties for commercial or medicinal use [20]. For example, in the citrus industry, somatic hybridization using protoplast fusion proved crucial for overcoming challenges posed by high heterozygosity, enabling the development of hybrids with desirable traits and even the fusion of sterile clones [18]. However, realizing these applications in cannabis necessitates a dependable protoplast-to-plant regeneration system, which has yet to be reported.
Despite its established utility in numerous other plant species, the practice of protoplast isolation and culture in cannabis remains in its early stages. The initial report of cannabis protoplast isolation came from Morimoto et al. [19]. However, these protoplasts were not cultured or regenerated, rather, they were employed in a study focused on cell death. For more than a decade, this report remained the sole mention of protoplast isolation in cannabis, but more recently several reports have emerged [14,20,21,22]. Beard et al. [14] contributed to this field by demonstrating transient gene expression using a high-CBD cultivar ‘Cherry x Otto II: Sweetened’, but no efforts were made to culture and regenerate the protoplasts obtained in this study. Following their study, there have been a few improved methods for protoplast isolation and transient gene expression, which have improved on the results initially presented by Beard et al. [14,21,22]. However, these advancements have concentrated solely on isolation and transient gene expression, leaving the crucial aspect of regeneration largely unexplored. Consequently, the pressing challenge in the protoplast-to-plant production process has shifted towards addressing the regeneration bottleneck [17].
While protoplasts have been successfully isolated from leaf tissue, reports detailing protoplast cell division, microcalli production, and regeneration have been conspicuously absent in the literature to date. Instead, existing methods have focused on transient gene expression studies using leaf derived protoplasts. Why these studies do not provide any insight into protoplast based regeneration systems is unclear; either it is beyond the scope of their study or attempts to move from isolation to cell division were unsuccessful. In plant regeneration, tissue selection is key, and more responsive tissues such as hypocotyls, may offer a more viable avenue for achieving regeneration [23,24]. Protoplast isolation depends on various factors, with cell wall digestibility standing out as a critical determinant. Plant cell walls are predominantly composed of cellulose, but derive significant resilience from the presence of lignin [25,26,27], with compounds like ferulic and chlorogenic acid identified as digestion-interfering agents [28]. To address this, targeted strategies have aimed to reduce lignin precursors produced by phenylalanine-ammonia lyase (PAL), leading to the discovery that competitive enzyme inhibitors such as 2-aminoindane-2-phosphonic acid (AIP) can be applied to improve protoplast isolation efficiency. AIP’s role in preventing oxidative browning in plant tissues is linked to its PAL-inhibiting activity, ultimately reducing monolignol subunits [25,26,27]. This reduction is believed to enhance cell wall digestibility. Notably, AIP’s application improved protoplast yield and the subsequent regeneration of morphologically normal explants in American elm callus [29,30,31], while prior studies involving American elm protoplasts from tissues like leaves and cotyledons failed to progress beyond the initial cell division or generate plants [32,33].
The focus of this study was to evaluate the effects of AIP on callus growth, protoplast isolation, and early cell division in C. sativa as a first step toward protoplast to plant regeneration in the species. The results demonstrate the benefits of AIP in improving protoplast isolation from cannabis callus and provide the first report of cell division from cannabis derived protoplasts. While further work is needed to overcome the recalcitrant nature of cannabis, these first steps provide a starting point to develop various protoplast based technologies for cannabis.
2. Results
Callus Culture Initiation, Digestibility and Protoplast Yield
Callus cultures were successfully established on LT-C and LT-AIP media within 2 months. Routine isolations were performed with a weekly or bi-weekly frequency beginning after week 10, as detailed in Section 3.1. Callus growth remained robust throughout the experiment, with LT-C calluses often exhibiting a browner and firmer appearance compared to LT-AIP calluses (Figure 1A). The ANOVA revealed that media significantly influenced protoplast yield (p<0.03; Table S3). With a 334% increase in protoplast yield for LT-AIP media compared to LT-C treatments being reported (5.39 × 10⁵ protoplasts/g vs. 1.24 × 10⁵ protoplasts/g ; Figure 2). Microscopic examination of LT-AIP-derived callus digests revealed fewer large clusters of undigested cells compared to LT-C callus digests, while LT-AIP digests contained numerous single undigested cells alongside protoplasts (Figure 1B,C). Neither the interaction between media and the subculture frequency (p=0.1369), nor the subculture frequency (p=0.9852) alone were found to have a significant effect on the yield (Table S3).
Total Soluble Phenolics and Tissue Browning
The influence of media and subculture frequency on phenolic compound accumulation was assessed through measurements of total soluble phenolics and tissue browning. Total soluble phenolics, quantified as GAE with the F-C assay, were impacted by media type (p=0.0053; Table S4). Callus grown on LT-AIP media exhibited an estimated 28% lower total soluble phenolic content compared to LT-C cultured callus (Figure 2B). Neither subculture frequency nor the interaction
between media and subculture frequency affected total soluble phenolics (p > 0.05; Table S4). Similarly, the 340 nm assay indicated that AIP inclusion in the medium reduced browning (p < 0.001), with a 52% reduction in browning associated with phenolics observed in the LT-AIP treatment compared to LT-C-sourced callus (Figure 2B). Browning attributed to soluble phenolics was not influenced by subculture frequency or the interaction between media and subculture frequency (p > 0.05; Table S5). Additionally, a Kendall tau-b ranked correlation (Table S6) revealed a weak negative correlation between protoplast yield and total soluble phenolics determined by the F-C assay. Likewise, there was a weak negative correlation between yield and tissue browning. Both the F-C assay and tissue browning assay results demonstrated a moderate positive correlation with each other.
Protoplast Viability and Culture
Protoplasts for culture were obtained from callus digests with a 100 mg callus to 5 mL enzyme ratio, as described earlier. To ensure sufficient protoplast volumes, these digests were scaled up to 600 mg fresh weight and 30 mL enzyme. The protoplast yield from LT-AIP-derived callus in the large digests surpassed that of the LT-C treatment by 206% (Table 1). Protoplast viability exceeded 90% in both treatments and showed no significant difference (Table 1).
Due to the lower yield observed in the LT-C treatment, protoplasts were exclusively cultured from the LT-AIP treatment. Culturing experiments tested densities of 0.5×10⁵, 1.0×10⁵, and 2.0×10⁵ protoplasts/mL. Low melting point agarose beads were cultured in liquid KM5/5 media with and without 10 µM AIP. Protoplasts cultured at a density of 2.0×10⁵ exhibited early signs of cell division, which were not observed at lower densities. Within 6 days of culture, indications of bulging cell membranes and the formation of peanut and pear-shaped cells became evident, along with initial dividing cells (Figure 3A–C). After approximately three weeks of culture, small cell clusters (microcalli) had developed (Figure 3E). However, around the three-week mark, protoplast growth ceased, and cell viability declined. Protoplasts cultured in KM5/5 with 10 µM AIP at a density of 2.0×10⁵ appeared to initiate cell division sooner than those in media without AIP. Cultures grown at 0.5×10⁵ showed no response, while cultures at 1.0×10⁵ exhibited limited cell division that was not sustained beyond one week.
3. Discussion
The findings of this study represent an important first step in the development of a protoplast-to-plant regeneration system and describes the first know report of early cell division from cannabis-derived protoplasts. Protoplast isolation in cannabis has received limited attention [14,19,20,21,24], and has primarily focused on their isolation from leaf tissues and subsequent use for transient gene expression studies [14,21,24]. Leaf tissues are a convenient source for protoplast isolation and are widely utilized in numerous species [35,39]. However, it’s worth noting that leaf tissues, despite their convenience, may not consistently exhibit the highest regenerative capacity. For instance, in the case of American elm, leaf-derived protoplasts demonstrated limited cell division and failed to progress into microcalli or plants [28,30,32,33]. In contrast, protoplasts derived from callus tissues exhibited more rapid and robust cell division, ultimately leading to whole plant regeneration [29]. Therefore, in the context of developing a successful protoplast-to-plant regeneration system for challenging species such as C. sativa, exploring callus-based methods holds promise for meeting specific experimental requirements. This publication represents the inaugural attempt at demonstrate protoplast isolation from callus cultures of C. sativa, outlines the improvements in yield offered by AIP application in this species, and reports the initial observation of cannabis protoplast division in culture.
Inducing cell differentiation and regeneration in cannabis callus cultures remains an ongoing challenge, despite the widespread success of callus induction media across a range of genotypes [2]. Notably, when compared to model species like Arabidopsis, or members of the Solanaceae family, yields from protoplast isolation in cannabis have only recently started to catch up [21,22]. Several studies have underscored the need to refine existing methods for protoplast isolation [14,21,24]. Given recent reports that cannabis hypocotyls have higher regenerative potential than other cannabis tissues [23,24,40], the presents study explored the potential of juvenile hypocotyl-derived callus as a source of protoplasts as a first step toward developing a protoplast-to-plant regeneration system. Importantly, the beneficial effects of AIP in callus culture medium are explored as a means of improving protoplast yield when compared with AIP-free medium. It was hypothesized that inclusion of AIP would result in the reduced accumulation of total phenolics and tissue browning in the callus cultures, which has previously been associated with improved protoplast yield and division [29,30,31]. The current study found that callus-derived protoplast yield increased by 334% over the control as a result of the inclusion of AIP in the medium (LT-AIP; containing 1 mM AIP; Figure 1 and 2). The use of AIP to make callus cultures amenable to protoplast isolation has been well studied in Ulmus americana, where protoplast yields from leaf tissues and their subsequent capacity for regeneration had been demonstrated [29]. In these studies, protoplast isolation increased as a result of AIP’s competitive inhibition of the phenylpropanoid pathway [29,30]. Inhibition of this pathway has been shown to reduce the production of cell wall strengthening monolignol subunits of lignin causing cell walls to be more easily broken down during the enzymatic digestion; therefore, releasing more protoplasts.
This study used the improved enzyme composition reported by Beard et al. [14], which included pectolyase and was found to significantly increase protoplast yield compared to a pectolyase-free enzyme mixture. While the yield achieved in this study (8.78×10⁴) did not attain the levels reported by Beard et al. [14] (2.27 × 10⁶) or the more recent publication by by Zhu et al. [22] (1.15 × 10⁷), this is likely a consequence of using callus rather than leaf tissue and potentially differences in genetic backgrounds of the plants. Nonetheless, despite the lower yields reported here, protoplasts derived from callus may be more suitable for specific applications, particularly those related to protoplast-to-plant regeneration systems. The improvements observed through the inclusion of AIP suggest that targeting cell wall composition offers another viable avenue for enhancing existing methods of cannabis protoplast isolation, in conjunction with other recently published protocol refinements [21,22].
In the present study, the accumulation of phenolic compounds was estimated using two established assays: the F-C assay and a ‘browning assay,’ which gauges absorbance at 340 nm in aqueous extracts. These assays were chosen for their demonstrated reliability in assessing phenolic compound accumulation in plant tissues and their capacity to monitor relative changes resulting from treatment effects [31,41,42]. The assays consistently indicated that callus grown in AIP-containing medium accumulated fewer total soluble phenolics and exhibited reduced browning compared to the control group. Specifically, the F-C assay revealed that AIP-treated callus exhibited an estimated 28% reduction in soluble phenolic content compared to the control, while the browning assay similarly demonstrated a 52% decrease in browning in AIP-grown tissues compared to the control. A previous study in callus cultures of Artemisia annua grown on AIP also recorded a drop in phenolics as measured using these assays, however the reduction in phenolics and browning were larger than the reductions reported here [31]. The larger reduction of phenolics and tissue browning in Artemisia callus compared with the present study is likely a result of numerous factors such as different starting material for the callus, different species and different PGRs used to induce and maintain callogenesis. Nevertheless, this discrepancy might also reflect the limitation of the assays employed for quantifying tissue browning and soluble phenolics.
The F-C assay, an established method for quantifying phenolic content, has received validation by AOAC International [38]. However, its indirect nature, measuring phenol oxidation under alkaline conditions and subsequent reaction with the F-C reagent, can lead to underreported results due to variations in phenolic compound properties and potential interference from non-phenolic compounds, including aromatic amines, ascorbic acid, and proteins [43,44]. As a result, the F-C assay, which benefits from ease of use and affordability, may underestimate total phenolic compounds compared to a more targeted and costly approach guided by high-performance liquid chromatography (HPLC) [44]. In contrast, the browning assay, which directly measures phenolics based on their absorbance profiles, may be less susceptible to such interferences [31]. This limitation of the F-C assay could explain the observed 28% reduction in total soluble phenolics between LT-C and LT-AIP media, compared to the 52% reduction in browning observed in the browning assay. Notably, the cultivation of callus in darkness reduces the likelihood of significant accumulation of interfering compounds, such as carotenoids and chlorophyll. These differences in assay sensitivity likely contribute to the weak to moderate correlation between yield and reduced phenolic content (Table S6). Regardless, the two assays demonstrated similar trends and supported the overall hypothesis.
The impact of subculture frequency on protoplast yield and quantifiable phenolics, as assessed by both assays, was negligible, despite qualitative observations favoring weekly subcultures for callus health. This suggests that AIP bioavailability in the culture medium remained sufficient for continuous competitive inhibition over a two-week period. Alternatively, rapid AIP uptake, combined with prolonged in vivo persistence, likely resulted in elevated endogenous AIP levels. Past studies indicate that AIP-induced phenotypes revert when AIP exposure ceases, implying either AIP degradation or increased PAL production without AIP [29]. Radiolabeled AIP studies could provide insights into its in vivo behavior. The study demonstrated that 1 mM AIP exposure effectively reduced PAL activity in cannabis calluses throughout the extended two-week culture.
Successful protoplast culture and regeneration conditions are highly species-specific, influenced by factors including nutrient availability, PGRs, agar type/concentration, osmolarity, and cell density [14,20,24,29,36,45]. This study focused on the inclusion of AIP in culture media and protoplast density in low-melting-point agarose beads. Several studies have highlighted the importance of cell density for inducing and sustaining cell division and eventual regeneration in protoplast [29,36,46]. Here we report the initial stages of protoplast division in cultures at a density of 2.0×10⁵ protoplasts/mL, but cell division was not observed at lower densities. Initial protoplast activity prior to division was characterized by irregular cell morphology such as bulging as well as the formation of pear and peanut shaped cells (Figure 3). Protoplasts cultured in KM5/5 medium with 10 µM AIP (cell density: 2.0×10⁵) exhibited increased initial activity. Previous work using the same culture system found this density optimal for cell division and regeneration in American elm [29].
In the current study, microcalli, or small clusters of dividing cells, were generated from protoplasts at a concentration of 2.0×10⁵ during the initial three weeks of culture. However, sustained cell division and viability were not observed beyond this period, and the reason for this decline remains unclear. Protoplast densities in the range of 105 cells per mL are frequently cited as a favourable density for protoplast division [29,45,46,47]. The present study found that density of 2.0×10⁵ resulted in initial cell divisions, but cell division was not sustained beyond three weeks, suggesting that cannabis may require altered conditions beyond three weeks to sustain microcalli development. The type of culture medium and the composition of plant growth regulators (PGRs) also play pivotal roles in protoplast regeneration. In this study, only KM5/5 media was explored for protoplast regeneration, and despite KM basal salts being known to promote protoplast growth at low densities [36], these results suggest that the formulation does not sustain cell division beyond the initial stages in cannabis or that other factors such as osmotic potential need to be altered as the calli develop. In addition, it is important to note that many basal salts commonly used in other species are not as successful in Cannabis [3]. The presence of cellular debris in the final isolate might have adversely affected regeneration, emphasizing the need for improvements in gradient purification methods. Recent reports have described methods for enhanced digestion using vacuum infiltration and a modified gradient purification [21,22]. However, it is important to note that neither of these methods addresses the competence of cells for regeneration; instead, they focus on the use of protoplasts for transient gene expression. To date, this study represents one of the first demonstrations of protoplast cell division from cannabis callus-derived protoplasts.
This study demonstrates the feasibility of isolating protoplasts from C. sativa callus cultures, coupled with a 334% enhancement in protoplast yield achieved through the incorporation of AIP in callus culture medium. AIP makes cell walls more susceptible to enzymatic degradation and protoplast isolation by reducing phenolic content and tissue browning, as confirmed by the F-C and 340 nm tissue browning assays. This suggests that AIP’s mode of action is conserved in cannabis. Notably, the two-phase culture system demonstrated cell division at a concentration of 2.0×10⁵ protoplasts per mL, marking the first known report of cell division from cannabis protoplasts. These findings lay the groundwork for future development in the areas of cannabis breeding and biotechnology such as the generation of interspecific hybrid, altered ploidy levels and the incorporation of transgenes.
4. Materials and Methods
Callus Culture Initiation
Callus cultures were established from etiolated hypocotyls of 3-week-old seedlings of Cannabis sativa cv “Finola”. The seeds were surface sterilized with a solution of 10% commercial bleach (5.25% sodium hypochlorite, Clorox, Brampton, ON) and 0.1% Tween 20 for 12 minutes, followed by three rinses with sterilized deionized water for 5 minutes each in a laminar airflow cabinet (Design Filtration Microzone, Stittsville, Canada). The surface sterilized seeds were germinated on a growth medium based on the method described in Hesami et al. 2021 [13]. This medium included 0.43× MS basal salt mixture with the van der Salm Modification (M5541, PhytoTech Labs, Lenexa, KS, USA), 2.3% sucrose (w/v), and 0.6% agar (w/v) (Fisher Scientific, Hampton, NH, USA). The seeds were germinated in the dark for 3 weeks.
Etiolated hypocotyl segments from the germinated seedlings were used to initiate callus cultures. Callus induction medium (LT-C media) consisted of MS (M524; Phytotechnology Laboratories) nutrients, 3% sucrose, 0.8% 132 type E agar (w/v) (Sigma Aldrich), 0.5 µM NAA (Sigma Aldrich), and 1.0 µM TDZ (Caisson Laboratories, Inc., Smithfield, UT) adjusted to a pH of 5.7 [2,34] and a modified version referred to as LT-AIP that contained 1 mM AIP (hydrochloride salt form; AmBeed, Arlington Heights, IL, USA). One cm-long hypocotyl segments were placed onto approximately 30 mL of either LT-C or LT-AIP medium in deep dish Petri dishes (VWR International, Mississauga, Canada). These Petri dishes were sealed with PVC film and incubated in the dark at 25 ℃ in a controlled environment growth chamber for 6 weeks to induce callus formation. After 6 weeks, the callus cultures were subcultured and maintained for an additional two weeks, resulting in a total callus initiation period of 2 months. Following this 2-month period, the LT-C and LT-AIP calluses were divided into two subgroups, each consisting of 5 replicates (Petri dishes; n=5). Each replicate contained 4 pseudoreplicate callus cultures. These cultures were subcultured onto fresh media either weekly (every 7 days) or bi-weekly (every 14 days) for 2 weeks before being used for protoplast isolation.
Enzyme Preparation for Protoplast Isolation
The enzyme solution used for protoplast digestion was freshly prepared for each digestion, following the procedure described by Yoo et al. [35] with slight modifications. Briefly, a solution containing 20 mM MES, 0.4 M mannitol, and 20 mM KCl was prepared using stock solutions [35] and adjusted to a pH of 5.7 with 1M KOH/HCl. The solution was then transferred to a beaker and gently heated to 70 ℃ with stirring for 3-5 minutes. Afterward, the temperature was reduced to 55 ℃, and cell wall-digesting enzymes were added gradually until fully dissolved, ensuring no clumping or frothing occurred. The enzyme solution comprised 1.25% (w/v) Cellulase “Onozuka” R-10 (Yakult Pharmaceutical Ind. Co., Ltd., Tokyo, Japan), 0.3% (w/v) Macerozyme R-10 (Yakult Pharmaceutical Ind. Co., Ltd.), and 0.075% (w/v) Pectolyase Y-23 (Kyowa Chemical Products Co., Ltd., Osaka, Japan), following the method by Beard et al. [14]. The solution was incubated at 55 ℃ for 10 minutes to inactivate DNAses and proteases and improve enzyme solubility. Subsequently, it was cooled to room temperature (approximately 25 ℃), and an aqueous solution of calcium chloride dihydrate (1M) was added to reach a final concentration of 10 mM. Finally, bovine serum albumin (BSA) was added from a 10% (w/v) stock to achieve a final concentration of 0.1%. The enzyme solution was then adjusted to a final volume of 60 mL using distilled water and filter-sterilized with a 0.2 µm nylon syringe filter.
Protoplast Digestion and Assessment
To evaluate the impact of AIP and subculture frequency on protoplast yield, a series of small-volume protoplast digestions were conducted, and the resulting protoplast yields were quantified. For each digestion, approximately 100 mg of the freshest, watery, pale to cream-colored callus was digested in 5 mL of the enzyme solution. An additional 100-300 mg of the same callus was set aside for total phenol analysis (refer to Section 3.5). The selected tissue was transformed into a soft paste by finely chopping the callus with sterile razor blades. The tissue slurry was then subjected to enzymatic digestion, which took place in 6-well, cell-culture grade, sterile polystyrene plates, kept in the dark for 16 hours on an orbital shaker. The shaker operated at 75 rpm at an ambient temperature of 25 ℃. Digestions were performed for all 5 replicates of each treatment and were repeated on a second day two weeks later, resulting in a final sample size of n=10. Each replicate represented a digestion carried out with callus sampled from a unique callus culture. After the 16-hour digestion period, the digests were examined under an inverted microscope (Axiovert 200; Carl Zeiss Canada Ltd., Toronto, Canada) to check for contamination and overall quality. Subsamples from each digestion were evaluated for protoplast density using a hemocytometer with a compound light microscope.
Protoplast Isolation and Culture
Callus tissues from each treatment were prepared as described above (Section 3.1). Each digestion was conducted in a 10 mm Petri dish (VWR International) using 15 mL of enzyme solution per 300 mg of callus tissue. After a 16-hour digestion, protoplast purification followed the method outlined by Beard et al. [14] with slight modifications. Petri dishes were examined under an inverted microscope (Axiovert 200) to confirm digestion and check for contamination. The enzyme solution was then filtered twice using a 70 µm and a 40 µm cell strainer in a sterile laminar flow hood. The filtrate was transferred to a screw cap tube and centrifuged at 1000 RPM (~178 G) for 10 minutes in a hanging bucket centrifuge (IEC HN-SII General Purpose Centrifuge, Needham Heights, MA, USA). The supernatant was removed, and the pellet was resuspended in 3 mL of a matrix solution, prepared as described in Section 3.2.
Protoplast purification was performed using a 60% (w/v) iodixanol (OptiPrep, Sigma-Aldrich, 1.32 g/mL) density gradient (Figure S1A). The protoplast suspension was mixed with a 40% OptiPrep working solution (WS; 0.4 M mannitol in OptiPrep) in a 3:2 ratio until homogenous. This mixture was then layered over a 20% OptiPrep solution (0.6 mL OptiPrep WS + 2.4 mL matrix solution) in a screw cap tube. The tube was centrifuged at 200 G for 10 minutes. Following centrifugation, the protoplast band at the interface between the 20% and 0% OptiPrep layer (Figure S1A) was carefully collected using a wide-mouthed micropipette tip and the volume of the band removed was recorded (Vband). A 30 µL aliquot was sampled for protoplast counting using a hemocytometer under a compound light microscope to determine their concentration (a). The total number of protoplasts (btotal) from the band was used to determine the protoplast yield (yproto), measured in protoplasts per gram of fresh callus weight (wfresh) as shown in Eq. 1 and 2.
A 100 µL aliquot was stained for cell viability with 2 mg/mL fluorescein diacetate (FDA; Sigma-Aldrich) at a ratio of 60 µL FDA per mL of sample and incubated in the dark for 10 minutes. Viability was assessed by counting the ratio of live protoplasts (based on fluorescence) to total protoplasts in three randomly selected locations on a prepared slide, using an inverted epifluorescence microscope equipped with a FITC/Bodipy/Fluo 3/DiO Filter Set (Chroma, Bellows Falls, VT, USA).
The protoplast band was then suspended in an equal volume of KM5/5 media comprised of Kao and Michayluk (KM) salts and vitamins [36] containing 10% (w/v) mannitol, 1% (w/v) sucrose, 500 mg/L MES, 5 µM BA and 5 µM NAA adjusted to a pH of 5.7 and centrifuged for 10 minutes at 178G. The supernatant was removed, and the protoplast pellet was resuspended in a volume equal to twice the target culture density using the KM5/5 media. This suspension was mixed with an equal volume of 1.6% (w/v) low melting point SeaPlaque agarose solution (Mandel Scientific, Guelph, ON, Canada) maintained at 38 ℃ to achieve the desired protoplast density. The mixture was transferred dropwise to a 6-well tissue culture-grade polystyrene plate with one drop (~100 µL) in each well. Subsequently, 1.5 mL of sterile KM5/5 media (with or without 10 µM AIP) was added to each well after the agarose beads had solidified (~20 minutes). The cultures (Figure S1B) were kept in the dark in a controlled environment growth chamber at 25 ℃ and regularly monitored for cell division. Various protoplast concentrations in the low melting point agarose beads were tested, ranging from 0.5×10⁵ to 2.0×10⁵ protoplasts/mL.
Total phenols and Browning Assay Extract Preparation
Extract preparation was adapted from the methods presented in Jones and Saxena [31]. Callus samples from weekly and bi-weekly subcultured cultures on LT-C and LT-AIP media were selected using the same criteria as for digestions. Samples ranged from 100 to 300 mg and were weighed with an analytical balance (Quintix® 124-1S, Sartorius, Göttingen, Germany), then flash-frozen with liquid nitrogen. For each treatment, callus sampling occurred on two separate occasions, totaling 10 replicates. Flash-frozen tissues were lyophilized for 24 hours (FreeZone 4.5 L Model 77510; Labconco, Kansas City, MO, USA). After lyophilization, the dry weight was recorded with the same analytical balance. Samples were finely ground in 2 mL snap cap microcentrifuge tubes using a SPEX SamplePrep 1600MiniG® bead homogenizer (SPEX, Metuchen, NJ, USA) at 1000 rpm for 40 seconds. An aliquot of extraction solvent (1:1:1 distilled water: methanol: acetone by volume) was added to each tube, maintaining a 1:10 dry weight-to-solvent ratio. Samples were vortexed for approximately 30 seconds and sonicated for 1 hour in an ice-cooled water bath at 27 ± 3 ℃. Tubes were then centrifuged for 6 minutes at 17700 g (Accupsin Micro 17, Fisher Scientific). The supernatant was transferred to a new 0.5 mL snap cap microcentrifuge tube, re-centrifuged to remove any particulates, and collected for phenolic assays.
Total Phenols and Browning Assay
Total phenols in callus were determined using a modified Folin-Ciocalteu (F-C) assay with a gallic acid (Sigma-Aldrich, St. Louis, MO) standard curve [31,37,38]. Each analysis day began with the preparation of a gallic acid stock solution (2 mg/mL) in extraction buffer, from which a 7-point standard curve in the range of 50 to 1000 µg/mL was established (Figure S2A). The analysis closely followed the method by Jones and Saxena [31], with minor adjustments. In a 96-well flat-bottomed microplate (C3370, Corning Inc., Corning, NY, USA), 100 µL of F-C Reagent (MP Biomedicals, Santa Ana, CA, USA) was added to each well, followed by a 10 µL aliquot of the extract. Wells with extraction buffer alone served as blank controls. Similar wells with varying concentrations of gallic acid standard were also prepared. Lastly, 80 µL of aqueous 0.25 M Na2CO3 was added to each well, with careful removal of any bubbles under gentle vacuum. The microplate was then incubated in the dark at 30 ℃ for 1 hour using a microplate spectrophotometer (Epoch 2, BioTek, Winooski, VT, USA). Following incubation, the plate underwent 20 seconds of orbital mixing, and the absorbance was measured at 765 nm [38].
Absorbance at 340 nm was measured as a proxy for tissue browning as previously reported in Jones and Saxena [31]. Ferulic acid (Sigma-Aldrich) was used as a standard to estimate the total phenolic content of the previously isolated extracts. Each analysis day began with the preparation of a ferulic acid stock solution (2 mg/mL) in extraction buffer, from which a 7-point standard curve in the range of 50 to 1000 µg/mL was established (Figure S2B). In a 96-well plate (Corning Inc.), 190 µL of extraction buffer was added to each well, followed by 10 µL aliquots of sample extracts, standards, or sample blanks. The plate underwent 20 seconds of orbital mixing, and absorbances at 340 nm of the samples were measured at 30 ℃ using a microplate spectrophotometer (BioTek). The standard curves demonstrated strong linearity (R2>0.99) for each standard curve between 50 µg/mL and 1000 µg/mL in both assays (Figure S2, Table S1 and Table S2)
Experimental Design & Statistical Analysis
To assess digestion efficiency, a two-way cross-classified factorial design with complete randomization was employed. The fixed effects of subculture frequency and the presence of AIP in the media, on protoplast yield (a proxy for digestion efficiency) was investigated as well as their interaction. The statistical model used for this factorial design was as follows:
Where:
- y represented the measured response variables (protoplast yield, total soluble phenolics, and browning)
- µ denoted the overall mean of the response variable
- frequency of subculture and AIP were considered as the fixed effects
- e is the residual error
Protoplast yield (protoplasts per gram of callus fresh weight) from digestions was determined for each treatment. A second identical yield determination was performed two weeks later, for a total of 10 replicates per treatment (n=10). All statistical analyses were carried out using SAS Studio software (v9.4, SAS Institute Inc., Cary, NC, USA). The ANOVA was performed using PROC GLIMMIX, with data being treated with a negative binomial distribution (DIST=negbin) and a log link function (link=log). Means were compared using the LSMEANS statement (α=0.05). Missing data were represented as ‘.’ in the dataset and were excluded from PROC GLIMMIX. Post-hoc Tukey-Kramer Tests were used to account for multiple comparisons. Visual representations of the data were created using Microsoft Excel® (Microsoft Corp., WA, USA).
Optical density readings, as described in Section 3.4 were quantified from regression curves generated from 7-point gallic acid or ferulic acid standard curves to measure total soluble phenolics or browning, respectively. Standard curves were run in triplicate and distributed evenly across the microplate, with a new standard curve prepared and run with each microplate. Eleven sample blanks were included on each plate, distributed throughout to address intra-plate variation. Samples were quantified in µg/mL gallic acid (F-C assay) or ferulic acid (browning assay) and converted to µg/g of fresh weight for data analysis.
The impact of media and subculture frequency on total soluble phenolics (expressed as µg of gallic acid equivalents (GAE) per gram of fresh callus weight) and tissue browning (expressed as µg of ferulic acid equivalents (FAE) per gram of fresh callus weight) was assessed using ANOVA with a post-hoc Tukey-Kramer Test. Prior to analysis, data were checked for normality. An analysis of residuals for the browning assay indicated non-homogenous variance. To address this, a correction to the R-side was applied, utilizing the variation within each media treatment to make it fixed-effect specific. The analysis of residuals for the F-C assay showed normality and a homogenous distribution and was processed without modification. Finally, the Kendall tau-b rank correlation between the yield (protoplasts per gram fresh weight) and total phenolics (measured by the F-C and browning assays) was obtained using the CORR procedure in SAS Studio software (v9.4).
Supplementary Materials
The following supporting information can be downloaded at the website of this paper posted on Preprints.org, Figure S1: Protoplast purification and culture system; Figure S2: Representative standard curves obtained for the F-C assay (A) and for the browning assay (B).; Table S1: Daily F-C assay calibration curves concentrations, coefficient of variation and linear regression equations.; Table S2: Daily browning assay calibration curves concentrations, coefficient of determination (R2) and linear regression equations.; Table S3: Results of the F-test from the ANOVA of the protoplast yield.; Table S4: Results of the F-test from the ANOVA of the F-C assay.; Table S5: Results of the F-test from the ANOVA of the browning assay.; Table S6: Kendall Tau-b correlation table.
Author Contributions
Conceptualization, A.S.M. and A.M.P.J.; Methodology, A.S.M. and A.M.P.J; Software, A.S.M.; Validation, A.S.M. and A.M.P.J.; Formal Analysis, A.S.M.; Investigation, A.S.M.; Resources, A.M.P.J.; Data Curation, A.S.M.; Writing—Original Draft Preparation, A.S.M.; Writing—Review & Editing, A.S.M. and A.M.P.J.; Visualization, A.S.M.; Supervision, A.M.P.J.; Project Administration, A.S.M. and A.M.P.J.; Funding Acquisition, A.M.P.J.
Funding
This research was funded by the Natural Sciences and Engineering Research Council of Canada, grant number RGPIN-2016-06252 awarded to A.M.P.J.
Data Availability Statement
All scripts used for data analysis have been uploaded to the Open Science Framework (OSF) under the following DOI: DOI 10.17605/OSF.IO/N9YJU at the following link: https://osf.io/n9yju/?view_only=16ed7dc2432a465499f5d31cc0c1a12c
Acknowledgments
We extend our sincere appreciation to Prof. Gale Bozzo at the University of Guelph for generously providing access to his invaluable expertise, reagents and the use of his microplate reader, which significantly contributed to the success of both assays in this study. Furthermore, we acknowledge that the research presented in this article is part of a broader body of work that was previously documented and extensively studied in a thesis submitted to the University of Guelph.
Conflicts of Interest
The authors declare no conflict of interest. The funder had no role in the writing of the manuscript, or in the decision to publish.
References
- Monthony, A.S.; Page, S.R.; Hesami, M.; Jones, A.M.P. The Past, Present and Future of Cannabis sativa Tissue Culture. Plants 2021, 10, 185. [Google Scholar] [CrossRef] [PubMed]
- Monthony, A.S.; Kyne, S.T.; Grainger, C.M.; Jones, A.M.P. Recalcitrance of Cannabis sativa to de novo regeneration; a multi-genotype replication study. PLoS One 2021, 16, e0235525. [Google Scholar] [CrossRef] [PubMed]
- Page, S.R.G.; Monthony, A.S.; Jones, A.M.P. DKW basal salts improve micropropagation and callogenesis compared with MS basal salts in multiple commercial cultivars of Cannabis sativa. Botany 2021, 99, 269–279. [Google Scholar] [CrossRef]
- Lata, H.; Chandra, S.; Khan, I.A.; Elsohly, M.A. Propagation through alginate encapsulation of axillary buds of Cannabis sativa L. - An important medicinal plant. Physiol. Mol. Biol. Plants 2009, 15, 79–86. [Google Scholar] [CrossRef] [PubMed]
- Lata, H.; Chandra, S.; Techen, N.; Khan, I.A.; ElSohly, M.A. In vitro mass propagation of Cannabis sativa L.: A protocol refinement using novel aromatic cytokinin meta-topolin and the assessment of eco-physiological, biochemical and genetic fidelity of micropropagated plants. J. Appl. Res. Med. Aromat. Plants 2016, 3, 18–26. [Google Scholar] [CrossRef]
- Wróbel, T.; Dreger, M.; Wielgus, K.; Słomski, R. Modified nodal cuttings and shoot tips protocol for rapid regeneration of Cannabis sativa L. J. Nat. Fibers 2020, 1–10. [Google Scholar] [CrossRef]
- Borbas, L.N.; Kurtz, L.E.; Lubell-Brand, J.D. A Comparison of Two Media Formulations and Two Vented Culture Vessels for Shoot Multiplication and Rooting of Hemp Shoot Tip Cultures. Horttechnology 2023, 33, 233–238. [Google Scholar] [CrossRef]
- Vergara, D.; Bidwell, L.C.; Gaudino, R.; Torres, A.; Du, G.; Ruthenburg, T.C.; Decesare, K.; Land, D.P.; Hutchison, K.E.; Kane, N.C. Compromised External Validity: Federally Produced Cannabis Does Not Reflect Legal Markets. Sci. Rep. 2017, 7, 1–8. [Google Scholar] [CrossRef]
- Schwabe, A.L.; McGlaughlin, M.E. Genetic tools weed out misconceptions of strain reliability in Cannabis sativa: implications for a budding industry. J. Cannabis Res. 2019, 1, 1–16. [Google Scholar] [CrossRef]
- Schwabe, A.L.; Hansen, C.J.; Hyslop, R.M.; McGlaughlin, M.E. Research grade marijuana supplied by the National Institute on Drug Abuse is genetically divergent from commercially available Cannabis. bioRxiv 2019, 7, 31–38. [Google Scholar] [CrossRef]
- Vergara, D.; Huscher, E.L.; Keepers, K.G.; Pisupati, R.; Schwabe, A.L.; Mcglaughlin, M.E.; Kane, N.C. Genomic evidence that governmentally produced Cannabis sativa poorly represents genetic variation available in state markets. bioRxiv 2021. [Google Scholar] [CrossRef]
- Boissinot, J.; Adamek, K.; Jones, A.M.P.; Normandeau, E.; Boyle, B.; Torkamaneh, D. Comparative Restriction Enzyme Analysis of Methylation (CREAM) Reveals Methylome Variability Within a Clonal In Vitro Cannabis Population. bioRxiv 2023. [Google Scholar] [CrossRef]
- Hesami, M.; Jones, A.M.P. Modeling and optimizing callus growth and development in Cannabis sativa using random forest and support vector machine in combination with a genetic algorithm. Appl. Microbiol. Biotechnol. 2021. [Google Scholar] [CrossRef] [PubMed]
- Beard, K.M.; Boling, A.W.H.; Bargmann, B.O.R. Protoplast isolation, transient transformation, and flow-cytometric analysis of reporter-gene activation in Cannabis sativa L. Ind. Crop. Prod. 2021, 164, 1–7. [Google Scholar] [CrossRef]
- Brandt, K.M.; Gunn, H.; Moretti, N.; Zemetra, R.S. A streamlined protocol for wheat (Triticum aestivum) protoplast isolation and transformation with CRISPR-Cas ribonucleoprotein complexes. Front. Plant Sci. 2020, 11, 1–14. [Google Scholar] [CrossRef]
- Malnoy, M.; Viola, R.; Jung, M.H.; Koo, O.J.; Kim, S.; Kim, J.S.; Velasco, R.; Kanchiswamy, C.N. DNA-free genetically edited grapevine and apple protoplast using CRISPR/Cas9 ribonucleoproteins. Front. Plant Sci. 2016, 7, 1–9. [Google Scholar] [CrossRef] [PubMed]
- Lin, C.S.; Hsu, C.T.; Yang, L.H.; Lee, L.Y.; Fu, J.Y.; Cheng, Q.W.; Wu, F.H.; Hsiao, H.C.W.; Zhang, Y.; Zhang, R.; et al. Application of protoplast technology to CRISPR/Cas9 mutagenesis: from single-cell mutation detection to mutant plant regeneration. Plant Biotechnol. J. 2018, 16, 1295–1310. [Google Scholar] [CrossRef]
- Grosser, J.W.; Gmitter, F.G. Protoplast Fusion and Citrus Improvement. In Plant Breeding Reviews; John Wiley & Sons, Inc.: Hoboken, NJ, USA, 1990; pp. 339–374. [Google Scholar]
- Morimoto, S.; Tanaka, Y.; Sasaki, K.; Tanaka, H.; Fukamizu, T.; Shoyama, Y.; Shoyama, Y.; Taura, F. Identification and characterization of cannabinoids that induce cell death through mitochondrial permeability transition in cannabis leaf cells. J. Biol. Chem. 2007, 282, 20739–20751. [Google Scholar] [CrossRef]
- Lazič, S. Isolation of Protoplasts from Hemp (Cannabis sativa L.), University of Ljubljana, 2020.
- Kim, A.L.; Yun, Y.J.; Choi, H.W.; Hong, C.H.; Shim, H.J.; Lee, J.H.; Kim, Y.C. Establishment of efficient Cannabis (Cannabis sativa L.) protoplast isolation and transient expression condition. Plant Biotechnol. Rep. 2022, 16, 613–619. [Google Scholar] [CrossRef]
- Zhu, P.; Zhao, Y.; You, X.; Zhang, Y.J.; Vasseur, L.; Haughn, G.; Liu, Y. A versatile protoplast system and its application in Cannabis sativa L. Botany 2023, 101, 291–300. [Google Scholar] [CrossRef]
- Galán-Ávila, A.; García-Fortea, E.; Prohens, J.; Herraiz, F.J. Development of a Direct in vitro Plant Regeneration Protocol From Cannabis sativa L. Seedling Explants: Developmental Morphology of Shoot Regeneration and Ploidy Level of Regenerated Plants. Front. Plant Sci. 2020, 11, 1–15. [Google Scholar] [CrossRef]
- Zhang, X.; Xu, G.; Cheng, C.; Lei, L.; Sun, J.; Xu, Y.; Deng, C.; Dai, Z.; Yang, Z.; Chen, X.; et al. Establishment of an Agrobacterium -mediated genetic transformation and CRISPR/Cas9-mediated targeted mutagenesis in Hemp ( Cannabis Sativa L.). Plant Biotechnol. J. 2021, 1–9. [CrossRef]
- Weng, J.K.; Chapple, C. The origin and evolution of lignin biosynthesis. New Phytol. 2010, 187, 273–285. [Google Scholar] [CrossRef] [PubMed]
- Wang, Y.; Chantreau, M.; Sibout, R.; Hawkins, S. Plant cell wall lignification and monolignol metabolism. Front. Plant Sci. 2013, 4, 1–14. [Google Scholar] [CrossRef]
- Fornalé, S.; Rencoret, J.; García-Calvo, L.; Encina, A.; Rigau, J.; Gutiérrez, A.; del Río, J.C.; Caparros-Ruiz, D. Changes In Cell Wall Polymers And Degradability In Maize Mutants Lacking 3′- And 5′- O -Methyltransferases Involved In Lignin Biosynthesis. Plant Cell Physiol. 2016, pcw198. [Google Scholar] [CrossRef]
- Butt, A.D. A general method for the high-yield isolation of mesophyll protoplasts from deciduous tree species. Plant Sci. 1985, 42, 55–59. [Google Scholar] [CrossRef]
- Jones, A.M.P.; Shukla, M.R.; Biswas, G.C.G.; Saxena, P.K. Protoplast-to-plant regeneration of American elm (Ulmus americana). Protoplasma 2015, 252, 925–931. [Google Scholar] [CrossRef]
- Jones, A.M.P.; Chattopadhyay, A.; Shukla, M.; Zoń, J.; Saxena, P.K. Inhibition of phenylpropanoid biosynthesis increases cell wall digestibility, protoplast isolation, and facilitates sustained cell division in American elm (Ulmus americana). BMC Plant Biol. 2012, 12, 1–11. [Google Scholar] [CrossRef]
- Jones, A.M.P.; Saxena, P.K. Inhibition of phenylpropanoid biosynthesis in Artemisia annua L.: A novel approach to reduce oxidative browning in plant tissue culture. PLoS One 2013, 8, 1–13. [Google Scholar] [CrossRef]
- Lange, D.D.; Karnosky, D.F. Techniques for high-frequency isolation of elm protoplasts. In Proceedings of the Proceedings of the Northeastern Forest Tree Improvement Conference; 1981; pp. 213–222.
- Redenbaugh, K.; Karnosky, D.F.; Westfall, R.D. Protoplast isolation and fusion in three Ulmus species. Can. J. Bot. 1981, 59, 1436–1443. [Google Scholar] [CrossRef]
- Lata, H.; Chandra, S.; Khan, I.A.; Elsohly, M.A. High Frequency Plant Regeneration from Leaf Derived Callus of High Δ 9 -Tetrahydrocannabinol Yielding Cannabis sativa L. Planta Med. 2010, 76, 1629–1633. [Google Scholar] [CrossRef]
- Yoo, S.-D.; Cho, Y.-H.; Sheen, J. Arabidopsis mesophyll protoplasts: a versatile cell system for transient gene expression analysis. Nat. Protoc. 2007, 2, 1565–72. [Google Scholar] [CrossRef] [PubMed]
- Kao, K.N.; Michayluk, M.R. Nutritional requirements for growth of Vicia hajastana cells and protoplasts at a very low population density in liquid media. Planta 1975, 126, 105–110. [Google Scholar] [CrossRef] [PubMed]
- Singleton, V.L.; Orthofer, R.; Lamuela-Raventós, R.M. [14] Analysis of total phenols and other oxidation substrates and antioxidants by means of folin-ciocalteu reagent. In Methods; 1999; Vol. 299, pp. 152–178.
- Kupina, S.; Fields, C.; Roman, M.C.; Brunelle, S.L. Determination of total phenolic content using the Folin-C assay: Single-laboratory validation, first action 2017.13. J. AOAC Int. 2019, 102, 320–321. [Google Scholar] [CrossRef]
- Bargmann, B.O.R.; Birnbaum, K.D. Positive fluorescent selection permits precise, rapid, and in-depth overexpression analysis in plant protoplasts. Plant Physiol. 2009, 149, 1231–1239. [Google Scholar] [CrossRef] [PubMed]
- Chaohua, C.; Gonggu, Z.; Lining, Z.; Chunsheng, G.; Qing, T.; Jianhua, C.; Xinbo, G.; Dingxiang, P.; Jianguang, S. A rapid shoot regeneration protocol from the cotyledons of hemp (Cannabis sativa L.). Ind. Crops Prod. 2016, 83, 61–65. [Google Scholar] [CrossRef]
- Peiser, G.; López-Gálvez, G.; Cantwell, M.; Saltveit, M.E. Phenylalanine ammonia lyase inhibitors control browning of cut lettuce. Postharvest Biol. Technol. 1998, 14, 171–177. [Google Scholar] [CrossRef]
- Downey, C.D.; Zoń, J.; Jones, A.M.P. Improving callus regeneration of Miscanthus × giganteus J.M.Greef, Deuter ex Hodk., Renvoize ‘M161′ callus by inhibition of the phenylpropanoid biosynthetic pathway. In Vitro Cell. Dev. Biol. - Plant 2019, 55, 109–120. [CrossRef]
- Gülçin, I. Antioxidant activity of food constituents: An overview. Arch. Toxicol. 2012, 86, 345–391. [Google Scholar] [CrossRef]
- Lester, G.E.; Lewers, K.S.; Medina, M.B.; Saftner, R.A. Comparative analysis of strawberry total phenolics via Fast Blue BB vs. Folin-Ciocalteu: Assay interference by ascorbic acid. J. Food Compos. Anal. 2012, 27, 102–107. [Google Scholar] [CrossRef]
- Lörz, H.; Larkin, P.J.; Thomson, J.; Scowcroft, W.R. Improved protoplast culture and agarose media. Plant Cell. Tissue Organ Cult. 1983, 2, 217–226. [Google Scholar] [CrossRef]
- Schween, G.; Hohe, A.; Koprivova, A.; Reski, R. Effects of nutrients, cell density and culture techniques on protoplast regeneration and early protonema development in a moss,Physcomitrella patens. J. Plant Physiol. 2003, 160, 209–212. [Google Scholar] [CrossRef]
- Khentry, Y.; Paradornuvat, A.; Tantiwiwat, S.; Phansiri, S.; Thaveechai, N. Protoplast isolation and culture of Dendrobium Sonia “Bom 17. ” Kasetsart J. - Nat. Sci. 2006, 40, 361–369. [Google Scholar]
Figure 1.
Callus cultures before and after digestion. A) Callus cultures grown on LT-AIP media (left) showing larger and lighter tissues than those growing on LT-C media (right). Scale bar = 2.5 cm. B) Digest of callus from LT-C, subcultured weekly, no protoplasts are visible, yield for this digest: 0 protoplasts/g fw. C) Digest of callus from LT-AIP, subcultured weekly, protoplasts are visible in yellow circles, yield for this digest ~2.08×10⁶ protoplasts/g fw.
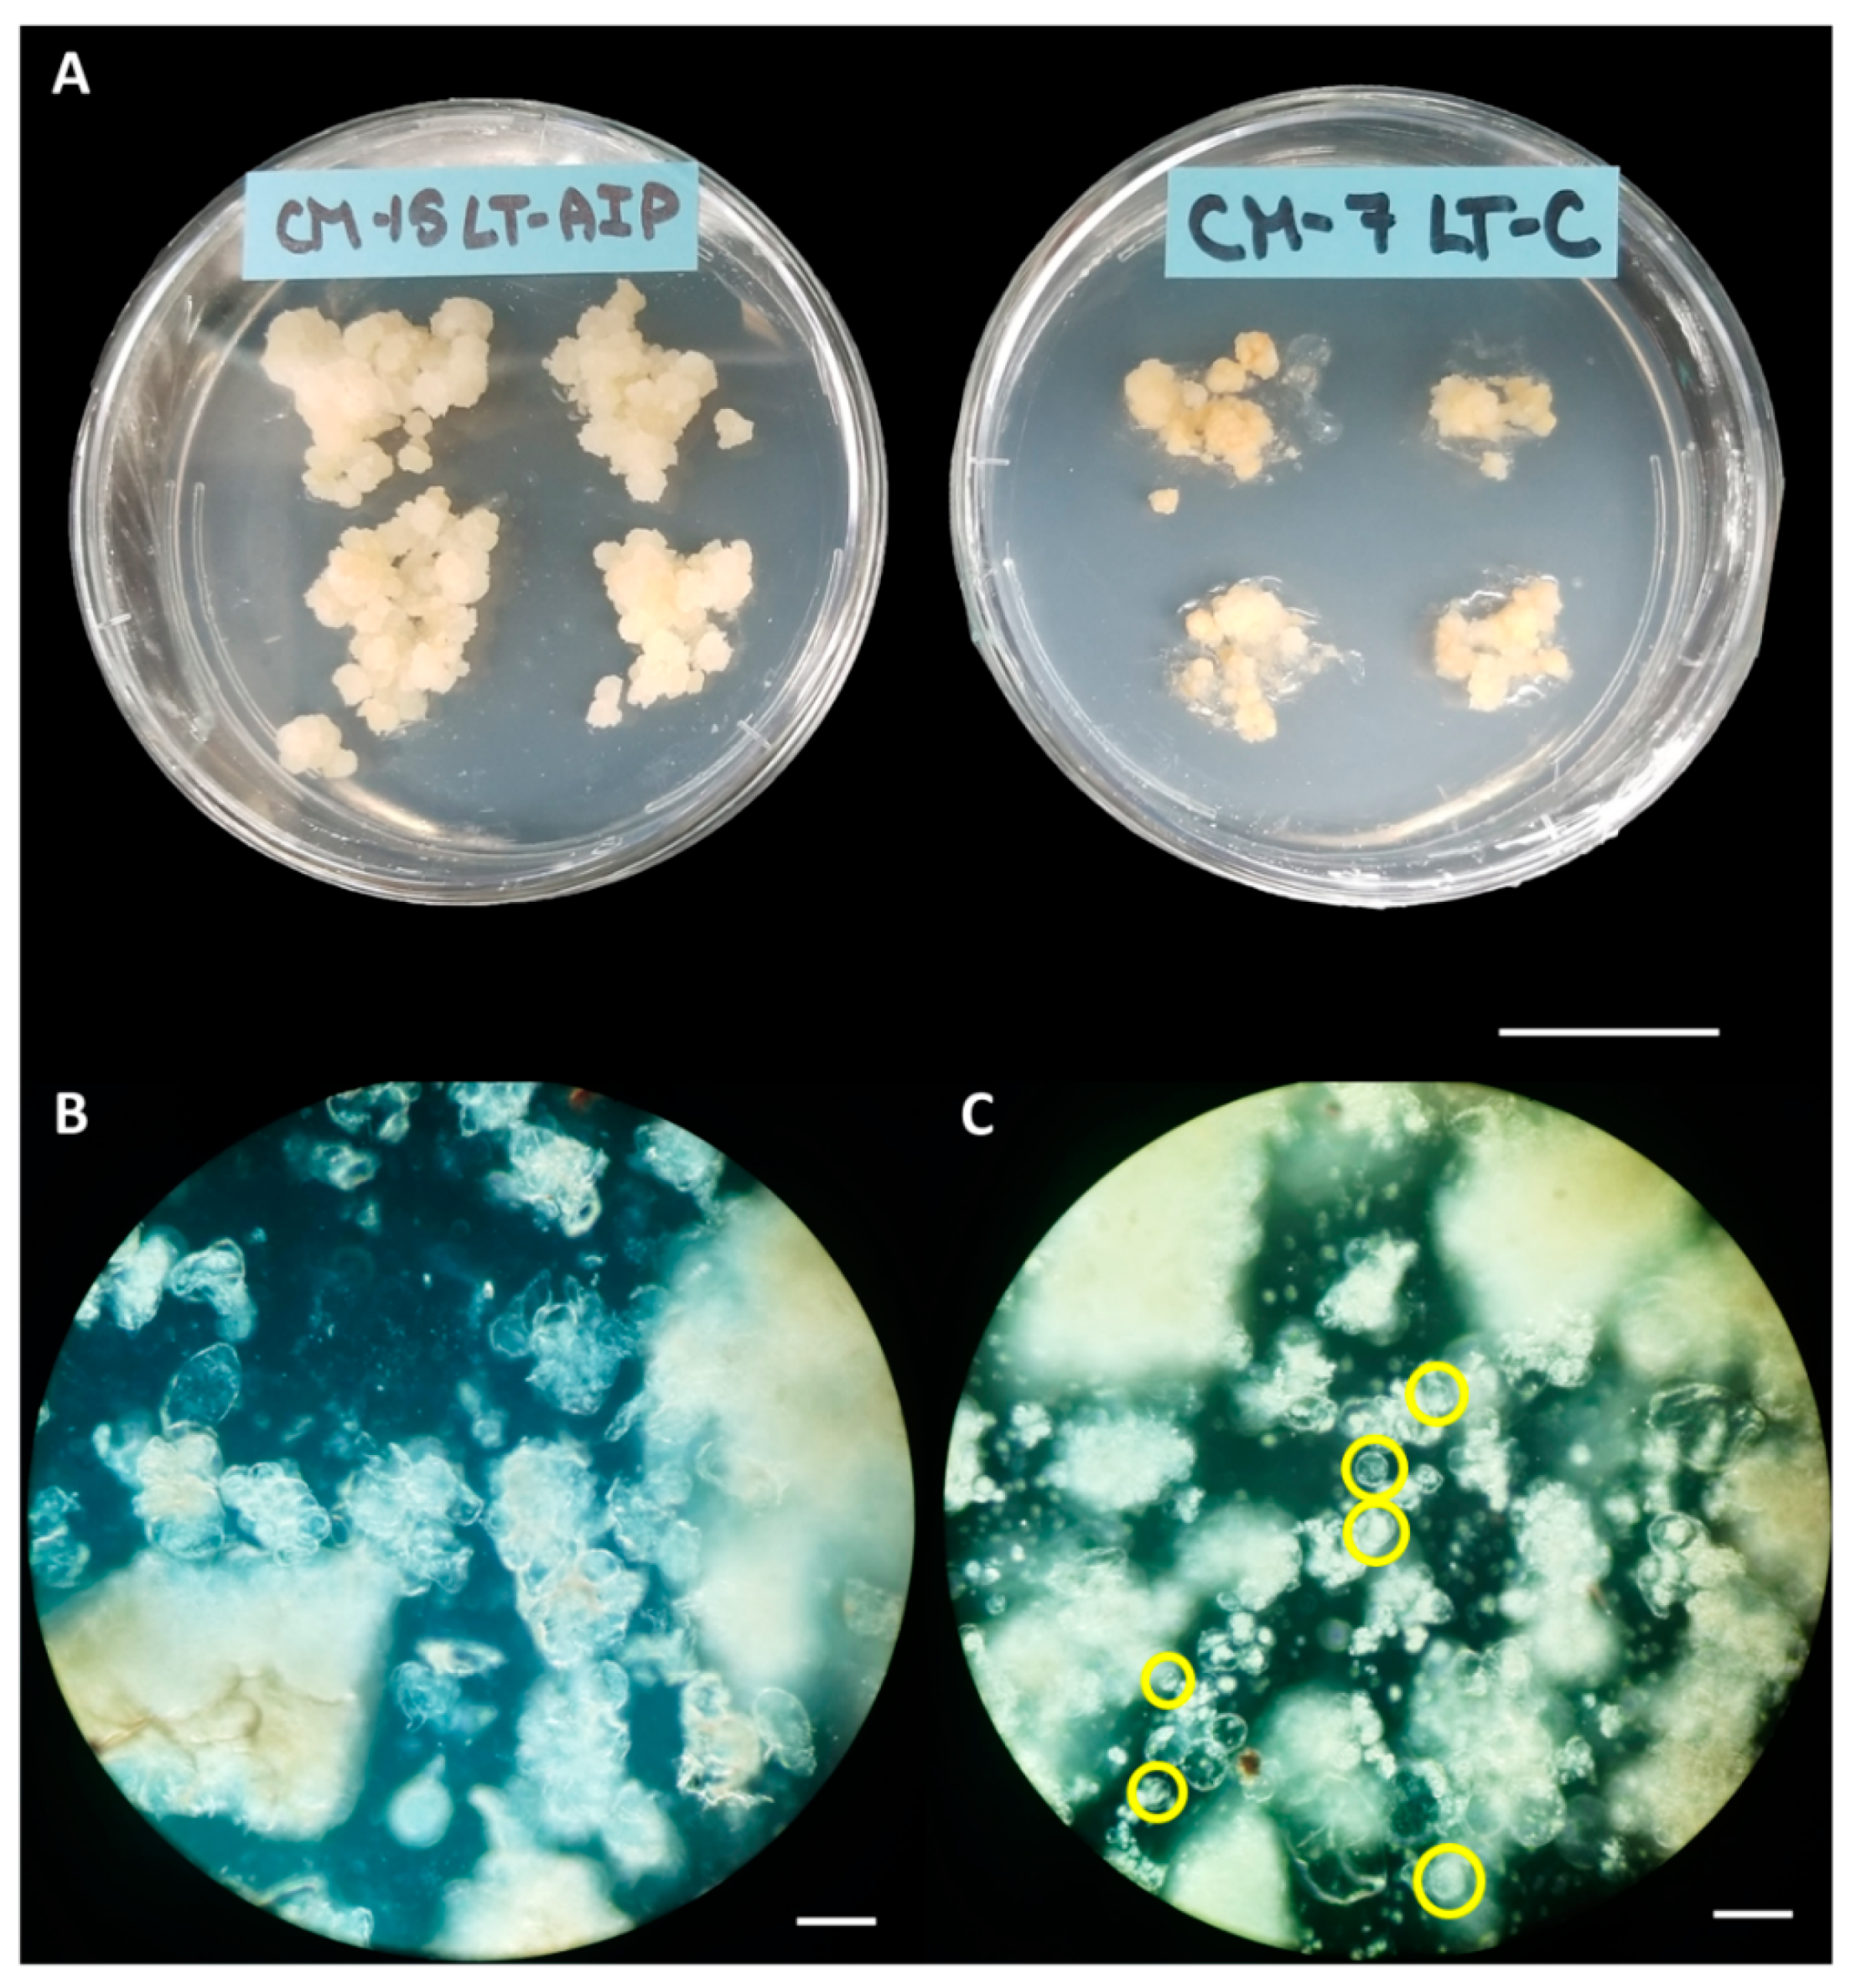
Figure 2.
Comparison of LT-C and LT-AIP media on protoplast yield and phenolic accumulation in callus tissues. A) Mean protoplast yield from callus cultures grown on LT-C and LT-AIP media pooled from both 1 and 2 week subculture frequencies (n=20). ANOVA revealed that only the media fixed effect significantly affected yield (p=0.0305). Yield is reported in protoplasts per gram of fresh callus weight (fw). Similar letters indicate no significant differences at p ˂ 0.05 (Tukey-Kramer test). Error bars show standard error of the mean. B) Averages of F-C assay (blue) and browning assay (red) results compared between media types. Total soluble phenolics (measured in µg of GAE - gallic acid equivalents) and tissue browning (measured in µg of FAE - ferulic acid equivalents) at an OD340 in callus cultures grown on AIP-free (LT-C) and AIP-containing media (LT-AIP) pooled from both subculture frequency groups (n=18). Error bars indicate standard error of the mean phenolic concentration for each media treatment, quantified in GAE or FAE. Bars with the same letter are significant at p<=0.05.
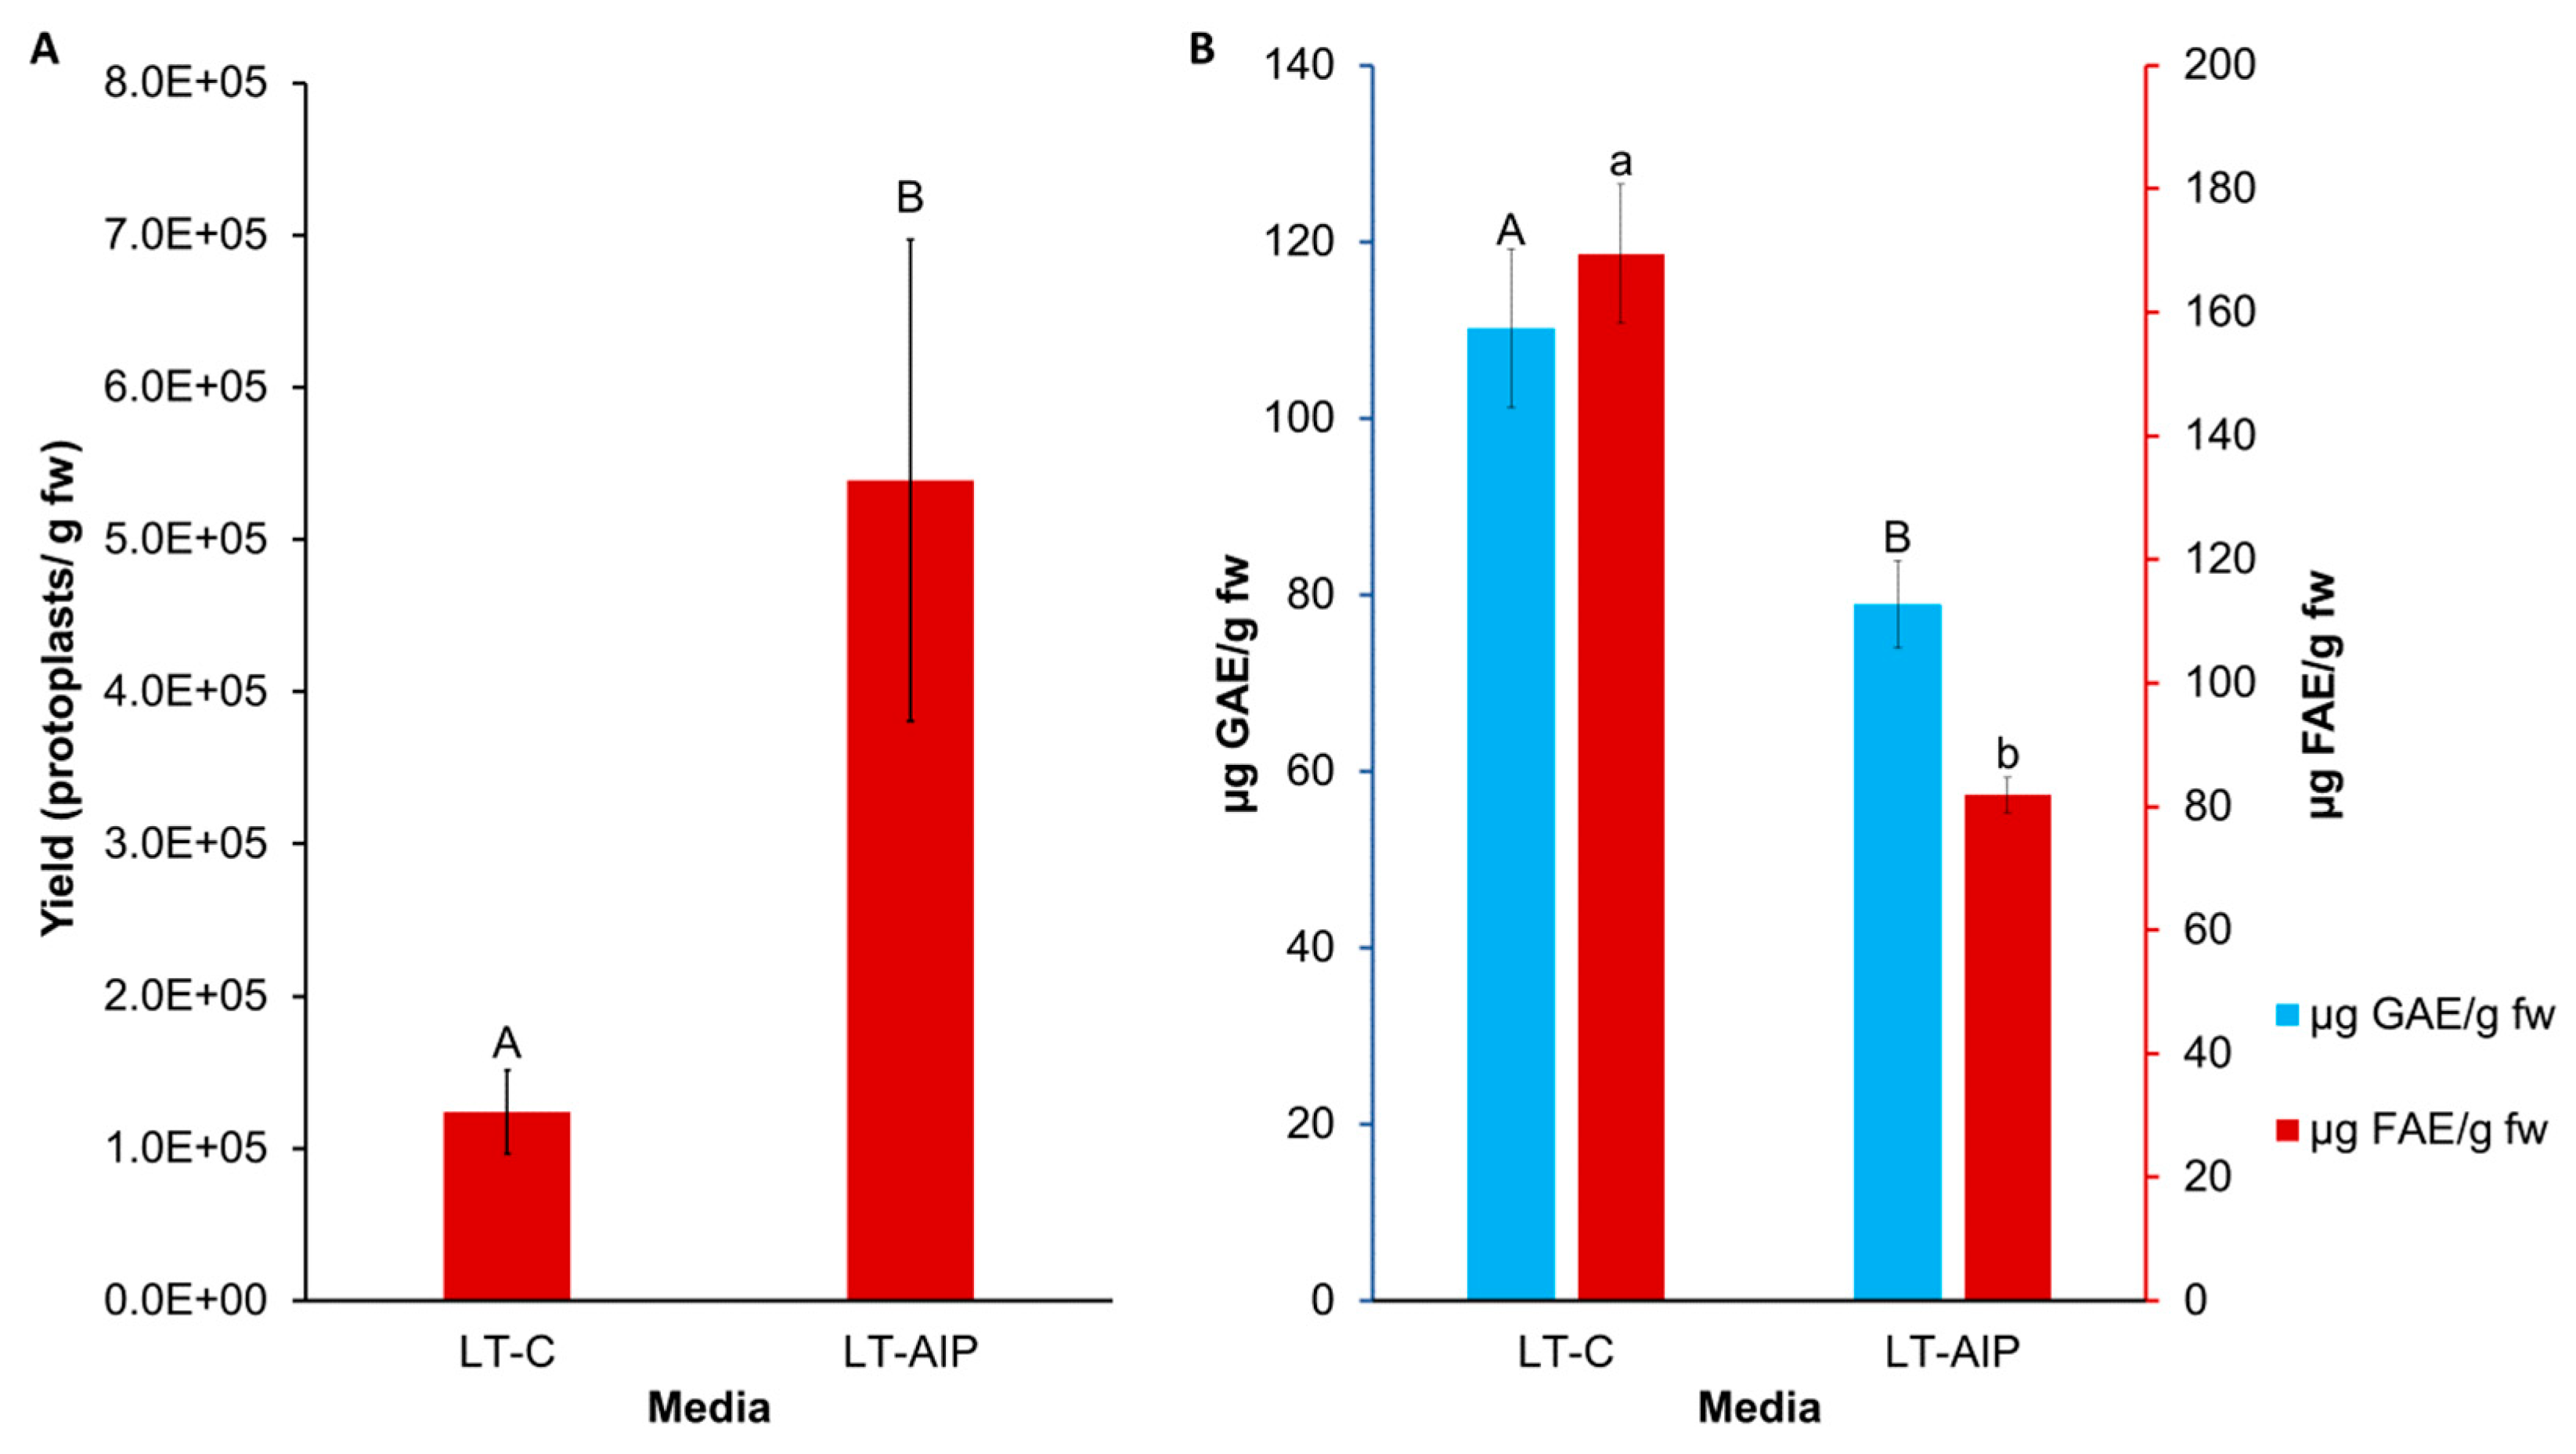
Figure 3.
Protoplasts cultured in low melting point agarose beads. A) 6-day post culture protoplasts in KM5/5 +10 µM AIP at a protoplast density of 2.0×10⁵ protoplasts per mL shows pear shaped cell. B) 6-day post culture protoplasts in KM5/5 +10 µM AIP at protoplast density of 2.0×10⁵ protoplasts per mL cell wall beginning to divide (center right) and next to it a protoplast (center left). C) 6-day post culture protoplasts in KM5/5 +10 µM AIP at protoplast density of 2.0×10⁵ protoplasts per mL. Right shows a protoplast dividing, left an intact protoplast. D) 19-day post culture dividing protoplast micro callus in KM5/5 +10 µM AIP at protoplast density of 2.0×10⁵ protoplasts per mL. scale bar = 50 µm.
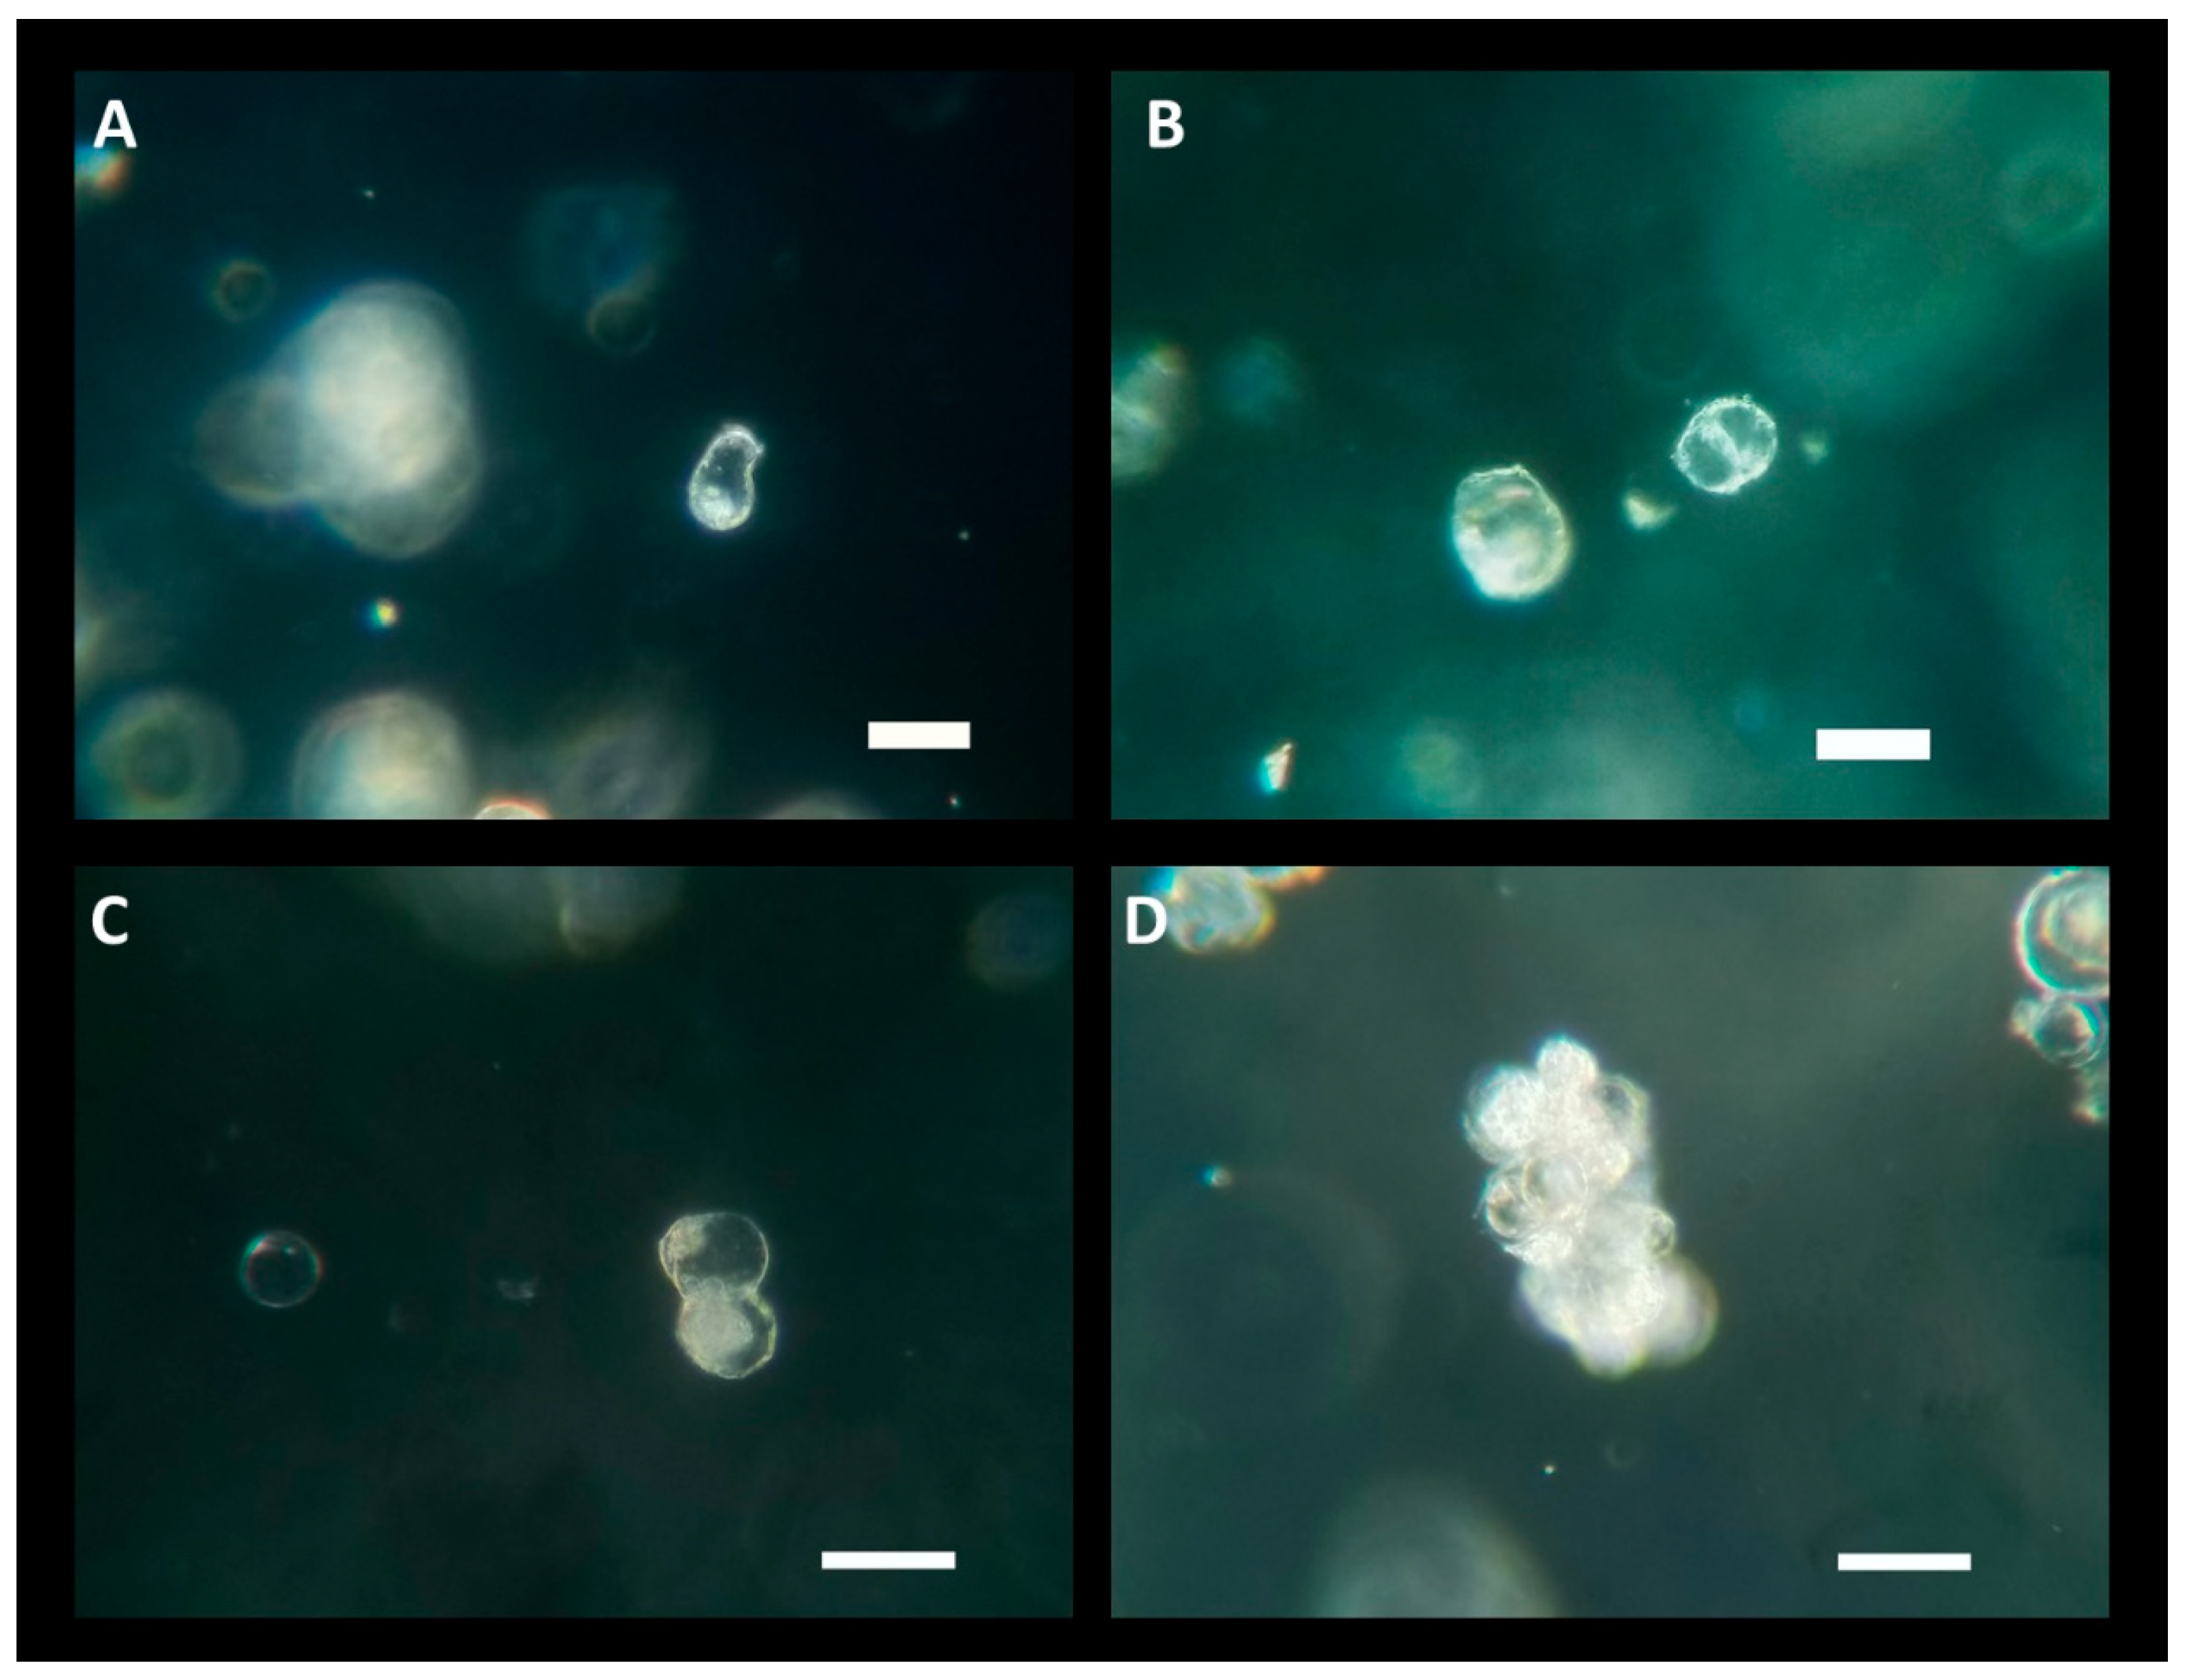

Table 1.
Average yield and viability pooled from weekly and biweekly digests used for determining viability and protoplast isolation for culture. Digests were done using 600 mg tissue per 30 mL of enzyme digest. Viability was determined from FDA stain of cells.
Table 1.
Average yield and viability pooled from weekly and biweekly digests used for determining viability and protoplast isolation for culture. Digests were done using 600 mg tissue per 30 mL of enzyme digest. Viability was determined from FDA stain of cells.
| Media | Yield (protoplasts/g fw) | Viability (%) |
|---|---|---|
| LT-C | 2.87×10⁴ ± 1.10×10⁴ | 95.5 ± 2.6 |
| LT-AIP | 8.78×10⁴ ± 3.9×10⁴ | 92.1 ± 5.3 |
Disclaimer/Publisher’s Note: The statements, opinions and data contained in all publications are solely those of the individual author(s) and contributor(s) and not of MDPI and/or the editor(s). MDPI and/or the editor(s) disclaim responsibility for any injury to people or property resulting from any ideas, methods, instructions or products referred to in the content. |
© 2023 by the authors. Licensee MDPI, Basel, Switzerland. This article is an open access article distributed under the terms and conditions of the Creative Commons Attribution (CC BY) license (http://creativecommons.org/licenses/by/4.0/).
Copyright: This open access article is published under a Creative Commons CC BY 4.0 license, which permit the free download, distribution, and reuse, provided that the author and preprint are cited in any reuse.


