1. Introduction
The mitochondrial respiratory chain is constituted by inner membrane-embedded respiratory complexes (RCs) (CI, NADH dehydrogenase; CII, succinate dehydrogenase; CIII, Cytochrome c reductase/bc1; CIV, cytochrome c oxidase) sequentially transferring reducing equivalents to dioxygen, which is reduced to H
2O [
1]. Part of the redox energy, thus made available, is harnessed by CI, CIII and CIV to pump protons from the matrix side to the intermembrane space thereby establishing an electrochemical proton gradient largely constituted by the electrical component ΔΨ
m [
2] The protonmotive force is, henceforth, utilized to drive endergonic reactions mainly the ATP synthesis by the H
+-F
oF
1-ATP synthase (CV).
The long-standing view of the RCs as independent entities functionally connected by the freely diffusible CoQ and cytochrome c as mobile redox carriers (fluid model) [
3] has been disputed in the last two decades by the emerged evidence that the mitochondrial respiratory chain complexes interact each other forming stable supercomplex (SC) assemblies with defined stoichiometric ratios (solid model) [
4]. However, neither model satisfactorily account for conflicting experimental evidence and the discrepancies are not yet solved [
5,
6]. The
in-situ identification of the fraction of the RCs organized in SCs is a challenging task and the occurrence of artifacts in the ex-situ experimental procedures cannot be ruled out.
An alternative model foresees a balanced distribution between free RCs and SCs with the two pools in a dynamic equilibrium (plastic model) [
7,
8,
9]. This opens the issue to the possibility that the balance between RCs vs SCs might be controlled by physiological/metabolic cues [
10].
An alternative to tackle the controversy is to make use of a functional approach. The flux control theory is a mathematical framework that enables to model the contribution of distinct enzymatic steps to the overall metabolic flux pursued by the pathway wherein those steps are components [
11,
12,
13]. Each step can be graded with a specific control coefficient ranging theoretically from 0 to 1 if its strength in controlling the overall flux varies from a negligible to an absolute contribution respectively. The control coefficient of a specific step can be assessed experimentally by comparing the activity of the overall flux with that of the isolated selected step both titrated independently with the same concentrations of a specific inhibitor of the enzymatic step. The “summation corollary” of the theory foresees that the sum of the control coefficients of all the steps contributing to the pathway must closely approach the unity [
11,
12]. If the sum of the control coefficients is higher than the unity this means that two or more enzymatic steps works in a functional complex (see
Supplemental Figure S1).
Identification of the enzymatic step(s) kinetically controlling the overall respiratory flux and, consequently, the oxidative phosphorylation (OxPhos) has been the object of extensive investigations within the framework of the “metabolic flux control theory” [
14,
15,
16]. The ensued results, however, provided inhomogeneous outcomes. The reasons of the discrepancies proved to relay on: i) the integrity of the biological sample utilized; ii) the choice of the respiratory substrate(s); iii) the energetic state of the mitochondrial membrane.
On this basis in previous studies in intact cells we reported that the sum of the control coefficients of the mitochondrial RCs significantly exceeded the unity value when the oxygen consumption rate was titrated with inhibitors of either one of CxI, CxII, CxIII, CxIV under uncoupled condition (i.e. in the presence of FCCP or valinomycin) or conditions utilizing the membrane potential (ΔΨ
m) (i.e. state III of respiration). Conversely under conditions preserving the ΔΨ
m (i.e. state IV of respiration or in the presence of the CV inhibitor oligomycin) the sum of CI-CIV control coefficients was below one [
17,
18]. Our interpretation was that the energy state of the mitochondrial inner membrane influences the formation of the SCs from a pool of isolated complexes. In particular, collapse of the ΔΨ
m promotes the assembly of CxI, CxIII and CxIV. This might be envisioned as an adaptive response of the OxPhos system to the cellular bioenergetics demand with enhancement of the ΔΨ
m taken as a signal of low protonmotive force-consuming F
oF
1-ATP-synthase activity. Under this condition supercomplexes would dis-assemble in their RCs constituent thereby slowing-dawn respiration and sparing reducing substrates. The opposite would occur if the protonmotive force is utilized (with substantial reduction of the ΔΨ
m for ATP synthesis). In this case formation of respirasomes is favoured with enhanced respiration to fulfil the greater energy needs.
Post-translational modification of proteins plays a well-recognized and amply documented important role for rapid and transient changes in the structure of a protein modulating enzyme activity as well as interfering or favouring protein-protein interactions. Recent extensive proteomic analysis has revealed a previously unexpected and wide range of post-translational modification of the mitochondrial proteome including all the components of the OxPhos machinery [
19]. Reversible phosphorylation of practically all the RCs has been reported to be the most common covalent modification [
20,
21,
22] consistent with the presence in mitochondria of kinases and phosphatases for both serine/threonine and tyrosine residues [
23,
24]. However, although, a large body of evidence is available about the functional impact of phosphorylation/dephosphorylation of individual RCs (some time conflicting) to the best of our knowledge only a few reports have directly or indirectly investigated the role of post-translational modifications in SC assembly and function.
In the present study we have extended our previous observations and carried out a systematic analysis on inhibitory-titration curves to investigate the impact of the cAMP/PKA signalling cascade on the distribution of the flux control coefficients among the protonmotive RCs and the influence on this of the membrane energy state.
3. Discussion
The notion of a supramolecular organization of the mitochondrial RCs is supported by convincing evidence. Since the first reports identifying aggregations of RCs under native electrophoresis [
4] the recent advance in cryo-EM analysis has contributed to assess structural details of the SCs/respirasomes architecture at atomic resolution [
32,
34]. Several aggregations of the complexes, with defined stoichiometries, have been identified with that containing one unit of complex I, a dimeric complex III and one unit of complex IV (complex II is not present) being the more abundant assembly formulation [
27]. Moreover, several biogenetic factors have been identified facilitating the SCs maturation [
35].
Acquisition of a supramolecular structure versus isolated units of the respiratory chain would confer additional functional properties such as facilitated electron transfer to the final acceptor O
2. This would reduce the risk of electron diversion/leak to O
2 with formation of potentially harmful reactive oxygen species [
35]. Notably, all the three complexes, I-III-IV, are redox-linked proton pumps, and perhaps the concerted locally generated transmembrane electrochemical potential could also modulate its chemiosmotic coupling with the H
+-F
oF
1-ATP synthase [
37].
Nevertheless, SCs coexist with a pool of isolated units of each of the RCs that would constitute a reservoir from where the SC biogenesis taps. There is no reason to consider this pool of isolated complexes not competent in transferring reducing equivalents by a random collision mechanism. This infers the suggestive possibility that the isolated RCs are in a dynamic equilibrium with SCs as indeed foreseen by a proposed “plastic” model of the respiratory chain [
7,
38]. Importantly, the prevailing metabolic state in the cell as well as the bioenergetic state of the membrane could shift the SCs vs isolated RCs balance to better cope with the actual cellular energetic needs [
10,
17,
18,
39].
Proving the occurrence of the above-mentioned balance is experimentally challenging. Indeed, all the current methodological approaches to detect the assembly state of the RCs rely on procedures that destroy the mitochondrial membrane integrity therefore obscuring any functional state of it.
An alternative approach is provided by applying the metabolic flux theory that assesses the specific contribution of individual enzymatic steps in intact cells under controlled different functional states. In the context of the mitochondrial respiratory chain the overall metabolic flux is given by the oxygen consumption rate fuelled by endogenous substrates and the easiest way to determine the individual contribution of the RCs is measuring the impact of their specific inhibition on the respiratory flux [
11,
12,
40]. The summation corollary of the theory foresees that summing up the control coefficients of all the individual enzymatic steps, contributing to a given metabolic flux, cannot exceed the unity value unless two or more individual enzymatic steps assemble in supramolecular units.
In the framework of the metabolic flux analysis our group showed in previous studies that the control coefficients of CI, CIII and CIV were markedly affected by the energy state of the mitochondrial membrane under condition mimicking different metabolic states [
17,
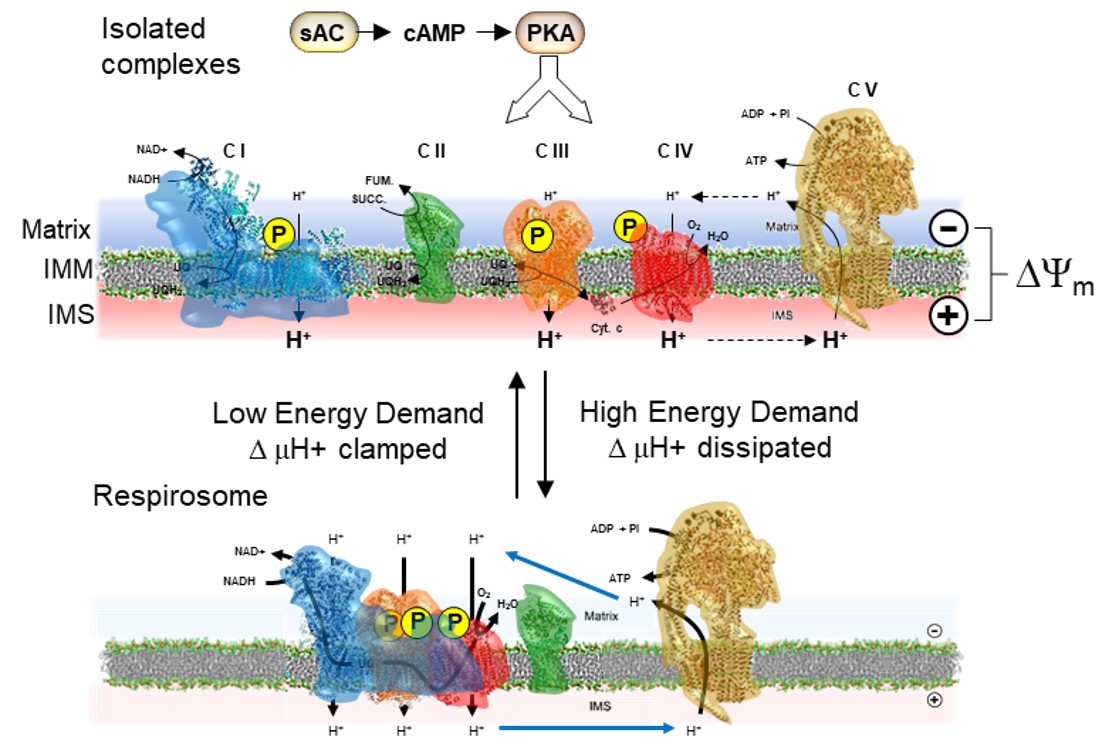
18]. Applying the above-mentioned summation corollary, we proposed a model thereby in the presence of an established respiration-mediated transmembrane electrochemical potential the RCs are prevalently in form of isolated units whereas under low or absent membrane potential the RCs assembles as respirasomes (see model in Figure 7).
The recent improvement of proteomic analysis of mitochondrial proteins is disclosing a previously unappreciated occurrence of many different post-translational covalent modifications including proteins of the OxPhos system [
19,
20] confirming and extending previously reported sporadic observations. These findings pave the way to the need to understand the impact of these modification on the structural/functional features of the proteins involved. The reversible phosphorylation of one or the other of the complexes of the OxPhos system is the better documented post-translational modification [
20,
21,
22,
23].
The present study aimed to verify if reversible covalent modifications had some effect in controlling the proposed balance between SCs and isolated RCs. We focused our attention on phosphorylations mediated by activation of the cAMP-PKA bio-signalling axis. Worth noting, standard protocol of cell culturing foresees the supplementation of serum in the culture media to preserve cell viability. However, the large number of growth factors present in the serum maintain constantly activated several signaling pathways including the cAMP-PKA axis that should be taken into account.
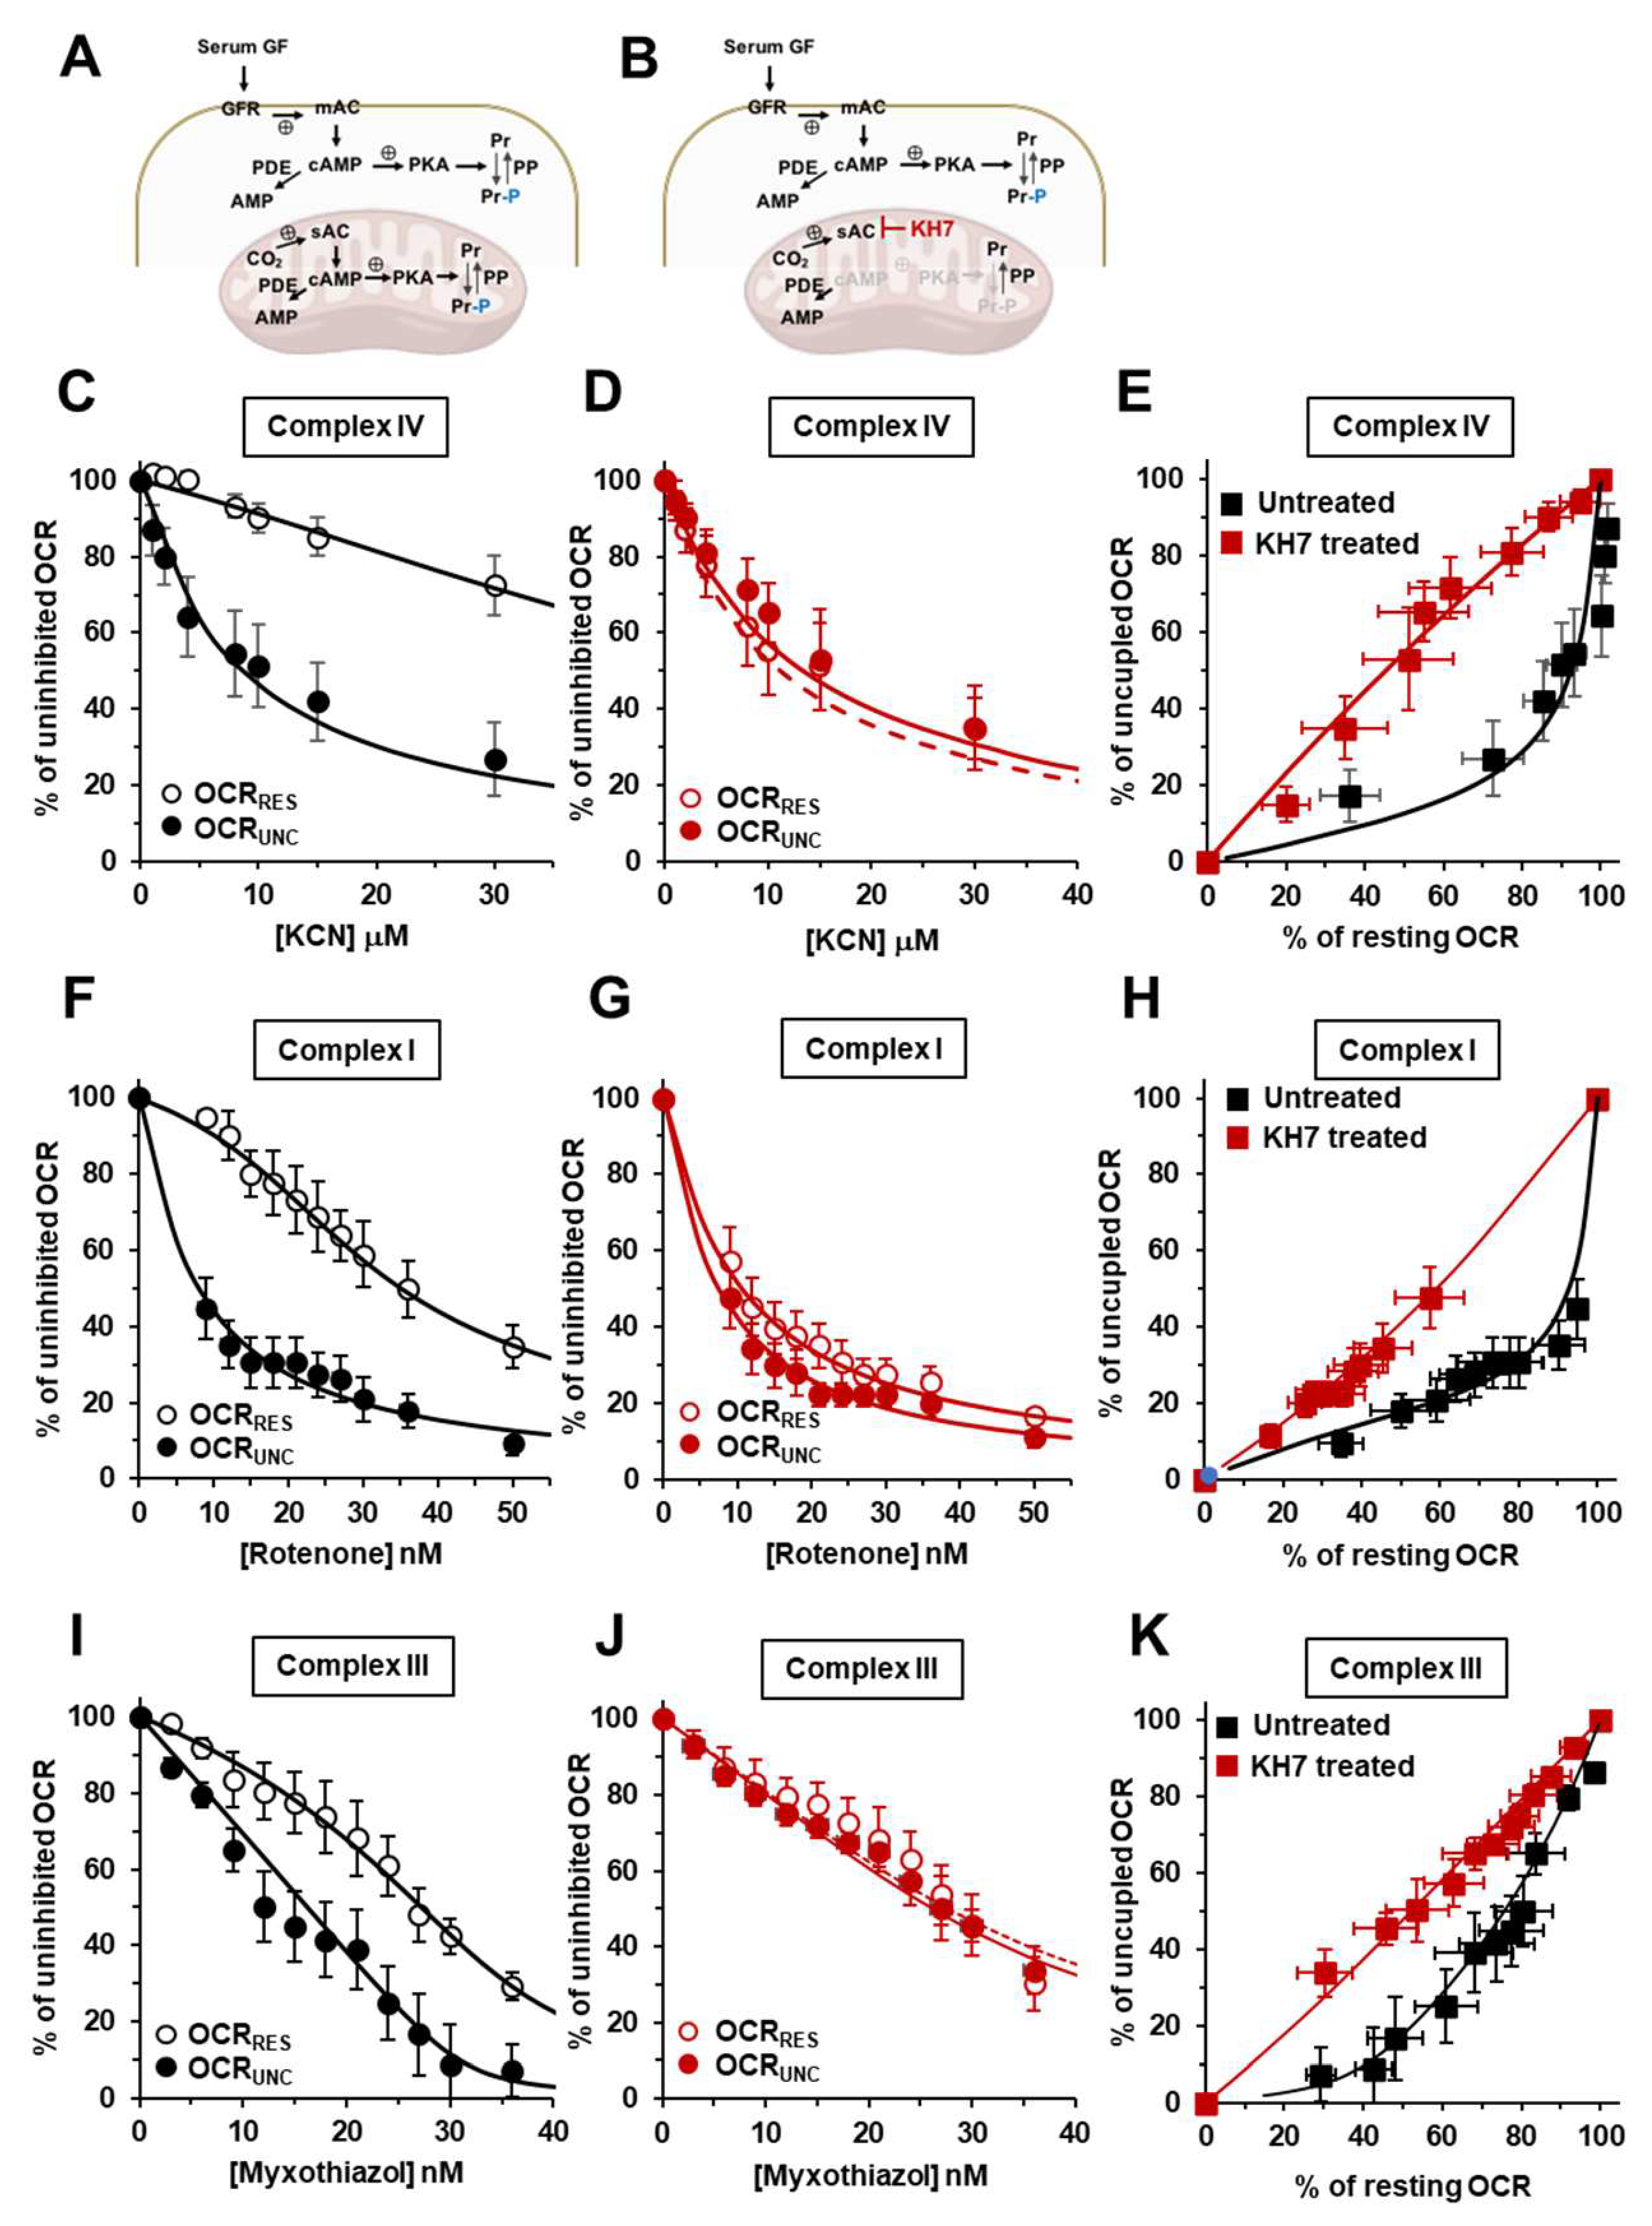
Herein we tested the effect of specific inhibitor of PKA on the mitochondrial respiratory activity of intact HepG2 cells and its impact on the inhibition titration profiles of complex IV using KCN as inhibitor, and two conditions were tested (i.e. under resting phosphorylating condition and under fully uncoupled condition elicited by the protonophore FCCP). The results attained clearly showed that inhibition of the PKA by H89 markedly affected the inhibition profile of complex IV on the resting overall respiratory flux thereby abolishing the differences otherwise observed in the untreated cells under the two functional conditions tested. We ascribed this effect to the dephosphorylation of respiratory chain complexes likely occurring by cellular protein phosphatases once PKA is inhibited. Interestingly, treatment of cells with the phosphodiesterase inhibitor IBMX, expected to enhance the PKA activation, did not result in significative differences either in the respiratory flux and in the KCN-related inhibitory profiles as compared with the untreated control cell. This confirmed that the composite mixture of factors present in the serum-supplemented culture medium ensures practically maximal up-stream activation of the PKA-related signalling pathway [
42,
43].
As several isoforms and intracellular compartmentalization of PKA, all inhibitable by H89, have been found, including intramitochondrial PKA [
24], we further investigated its possible specific involvement in the findings here reported. To this purpose we exploited the notion that activation of the mitochondrial PKA is dependent on the production of cAMP by sAC a distinct soluble isoform of the cytosolic transmembrane tmAC which is selectively inhibited by KH7 [
31]. Although sAC is not exclusively present in mitochondria it has been reported that if bioenergetic readouts are studied the consequences following KH7 treatment relies largely on the mitochondrial rather than the cytosolic sAC inhibition [
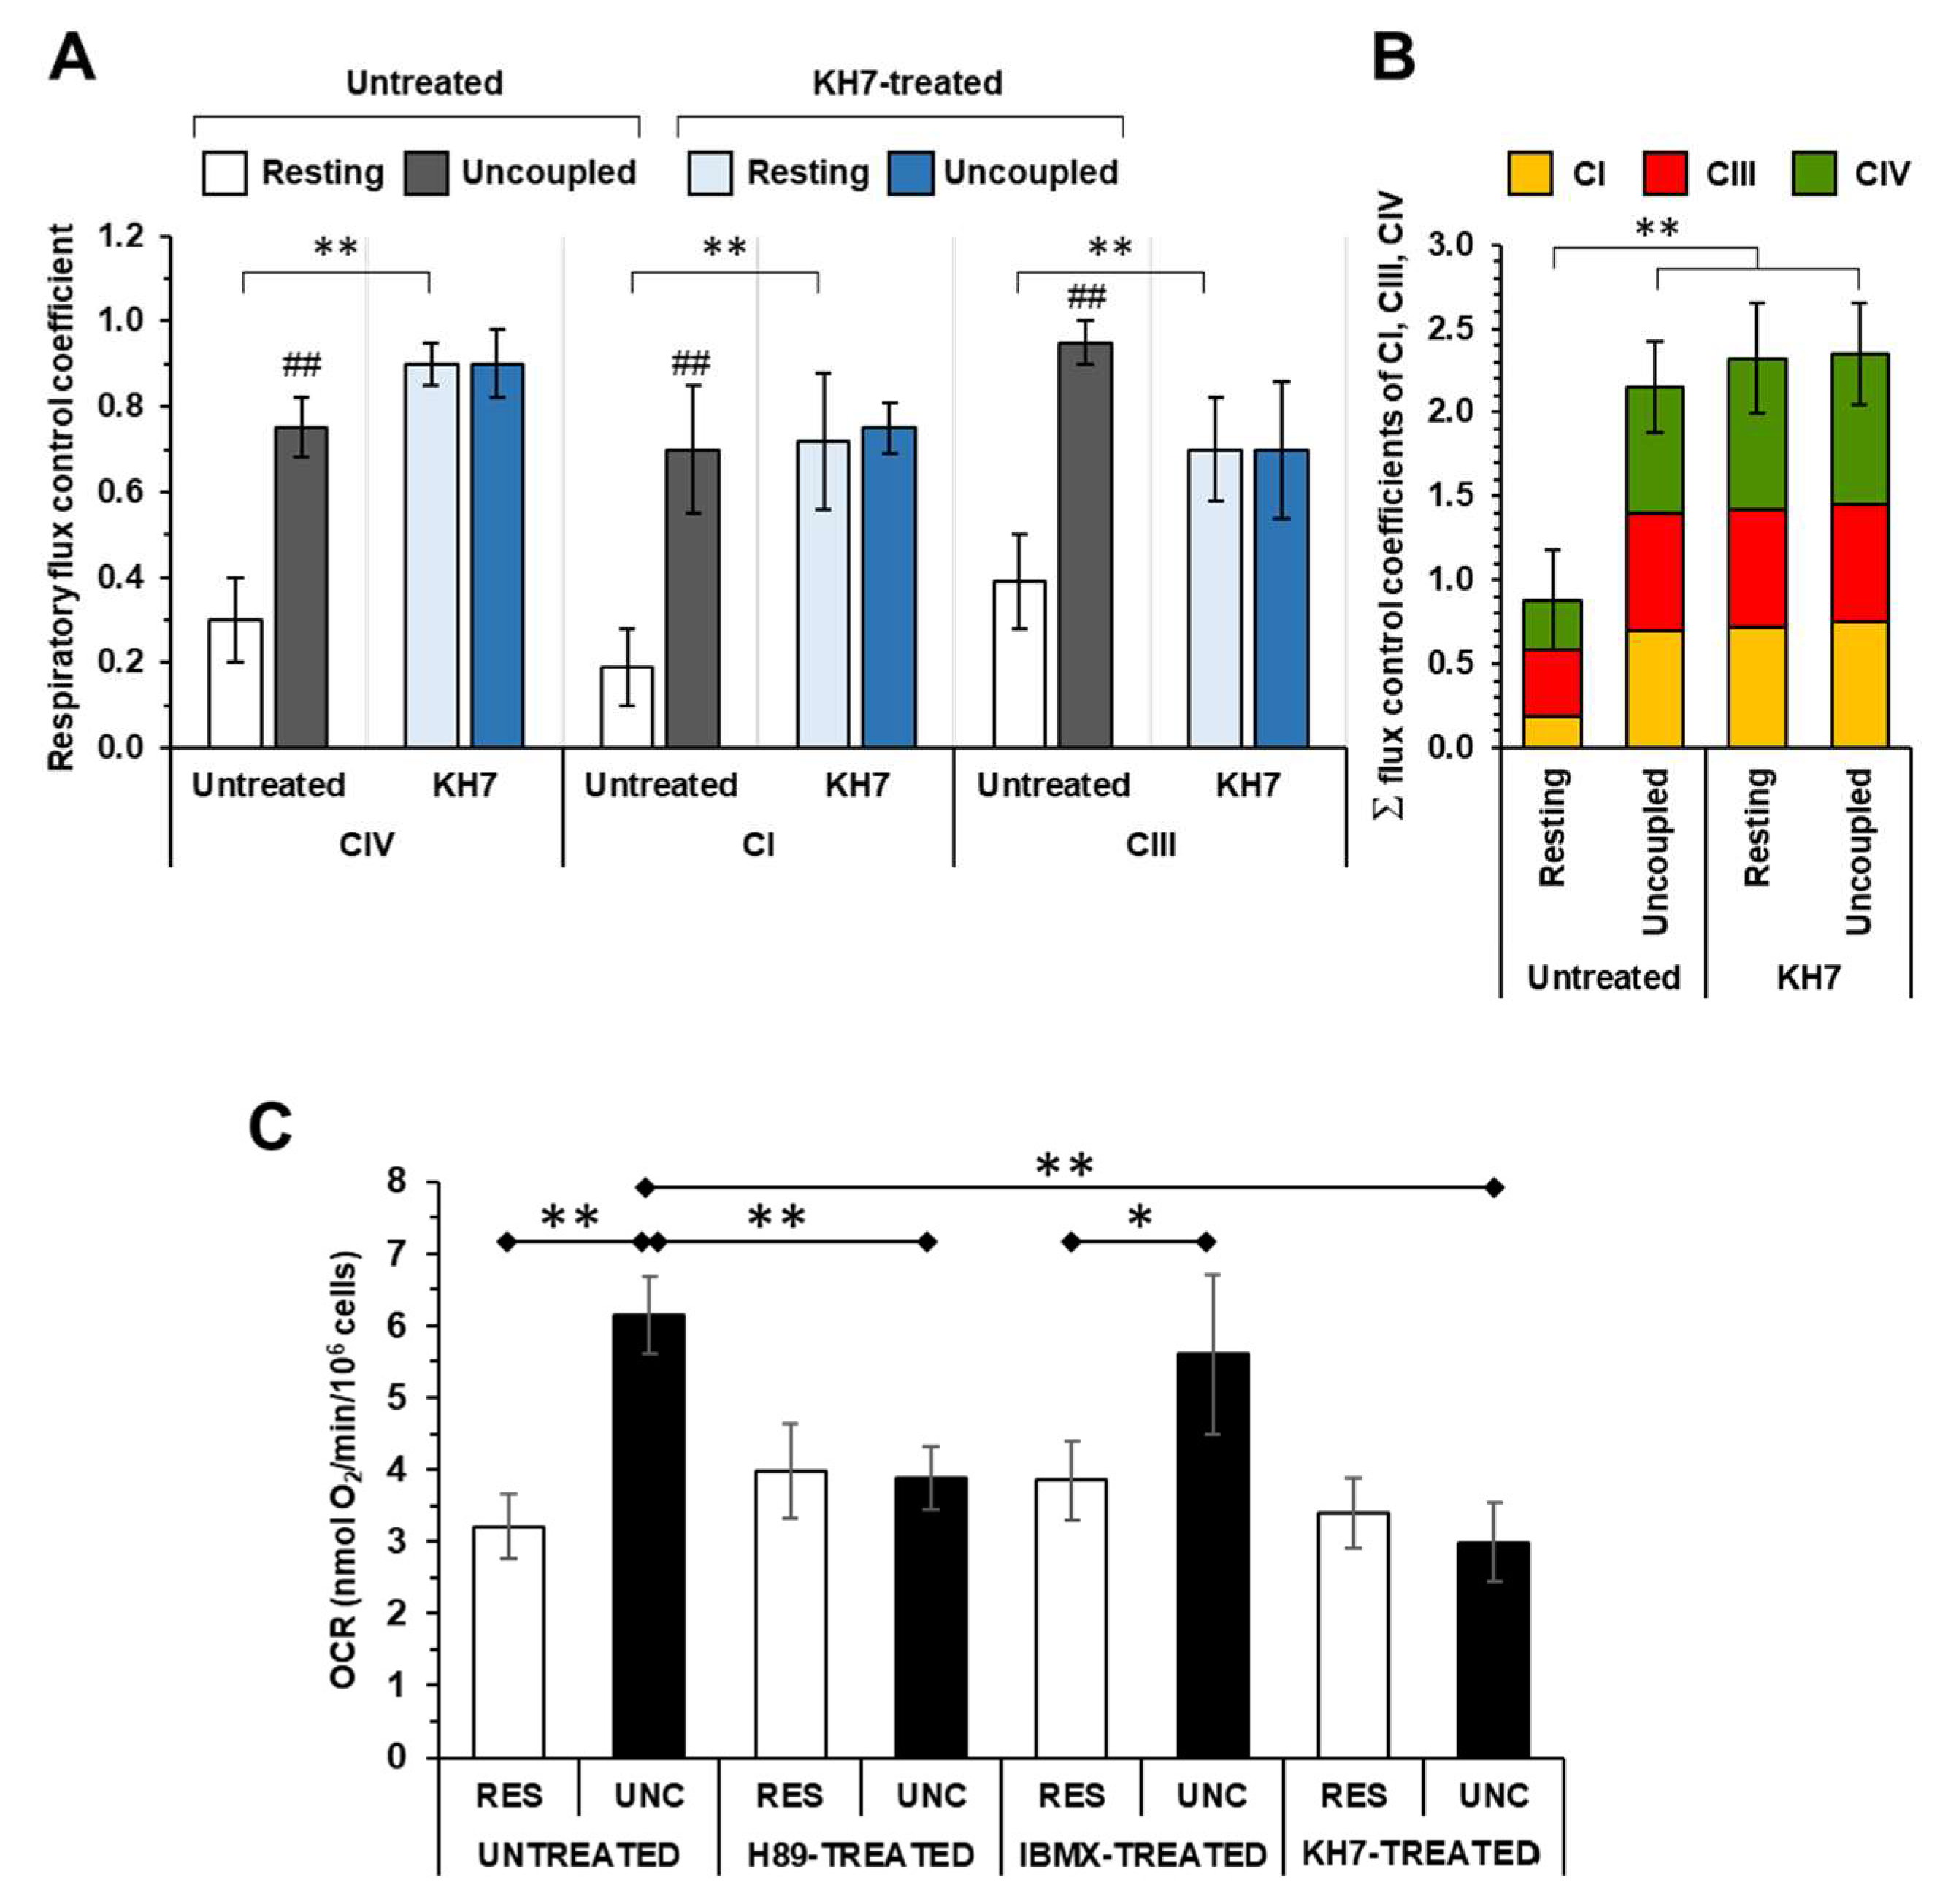
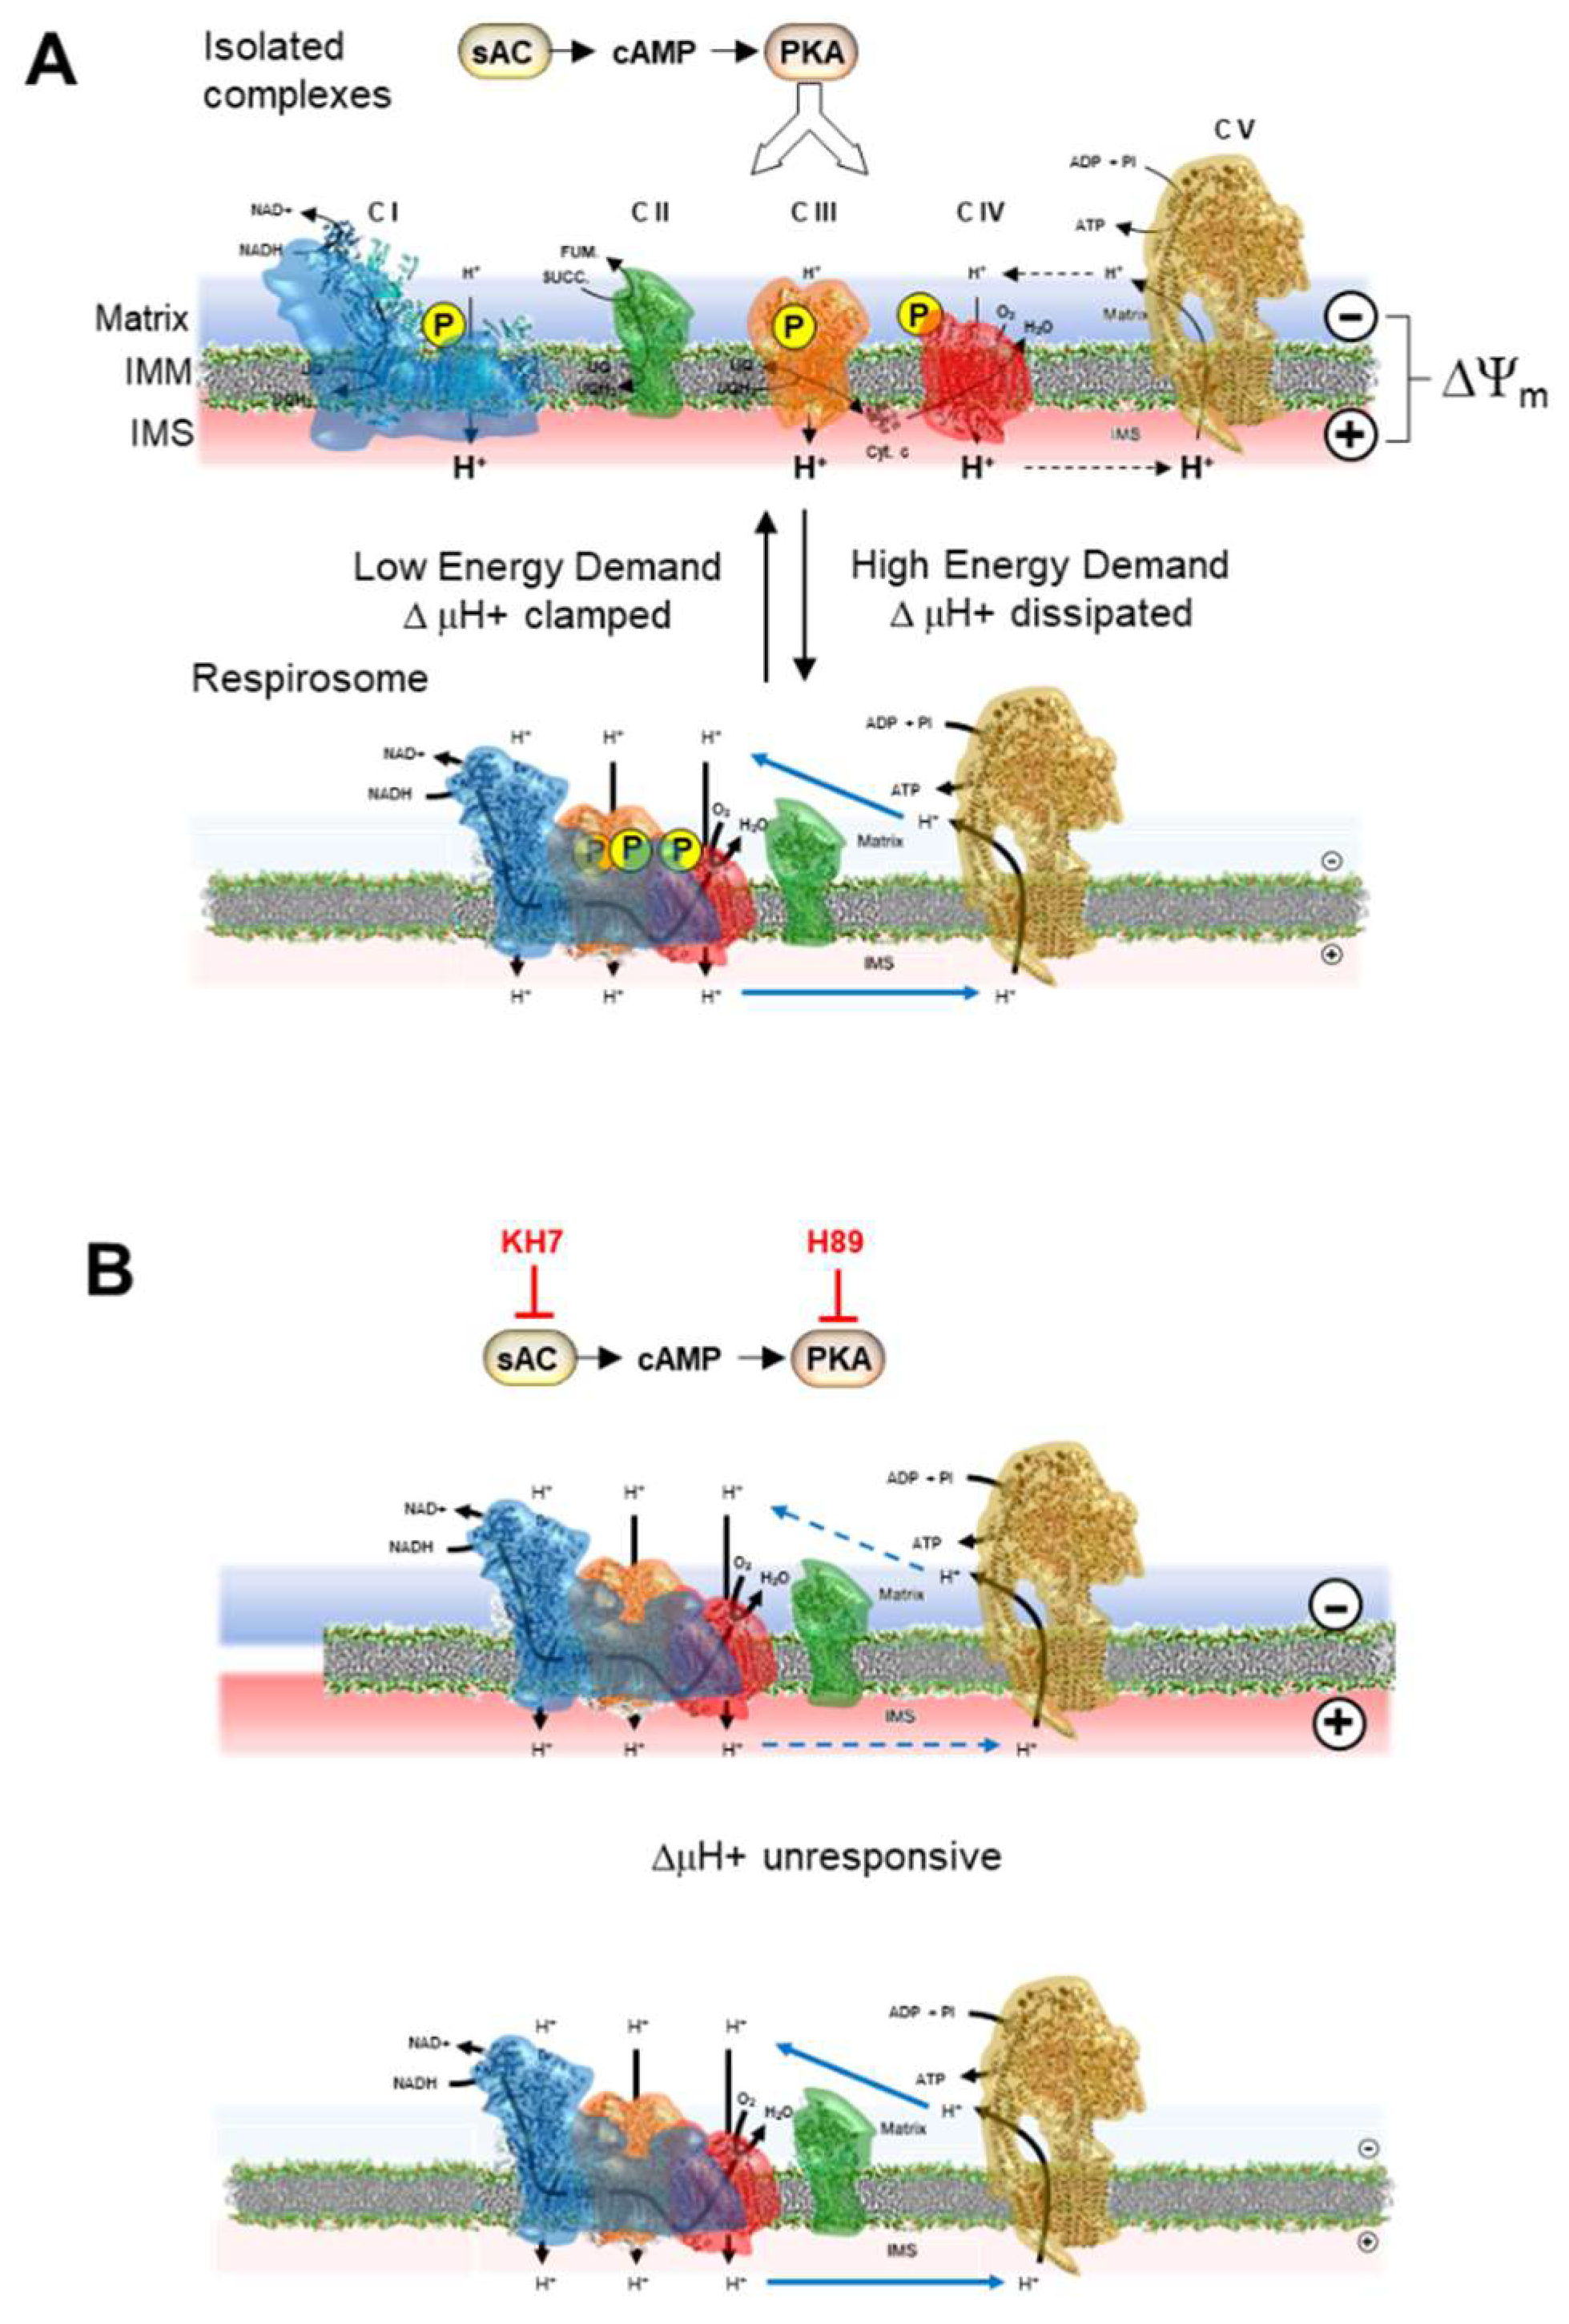
41]. Treatment of HepG2 cells with KH7 closely resembled what observed with H89 regarding the dampening of the relative resistance to KCN in the inhibitory profile under resting respiration and its superimposition to that under uncoupled respiration. Most notably, a similar result was observed when the analysis was extended to both complex I and III. Quantification of the control coefficients of CI, CIII and CIV on the overall respiratory flux and application of the summation principle enabled us to conclude that: a) under conditions favouring the phosphorylation state of the RCs, these were functioning as isolated units under coupled conditions but as SCs once respiration was uncoupled (a similar behaviour was observed following IBMX treatment); b) treatment with either the PKA inhibitor or the sAC inhibitor caused the RCs to function mainly as SCs also under coupled conditions (see the schematic model presented in
Figure 6). Our interpretation of the results attained agrees with a recent report showing that isoproterenol-mediated activation of the cAMP/PKA signaling cascade resulted in enhanced formation of SCs in H9c2 heart myoblast cell line [
44].
Treatment with drugs inhibiting the PKA-mediated axis resulted, as reported, in dampening of the maximal respiratory activity. Intriguingly the respiratory activity under coupled phosphorylating condition was apparently unaffected by either treatment with H89 or KH7 therefore resulting in complete abolishment of the respiratory reserve capacity. Of note, KH7 treatment fully preserved the respiration-driven ΔΨm under coupled conditions. One possible interpretation of this puzzling observation is that under resting condition the OxPhos system compensates the defective respiratory activity utilizing all the reserve available. The so stimulated respiratory activity would result ΔΨm-independent and might be consistent with the proposed shift of the RCs from the isolated random-collisioning state toward the more efficient SC state.
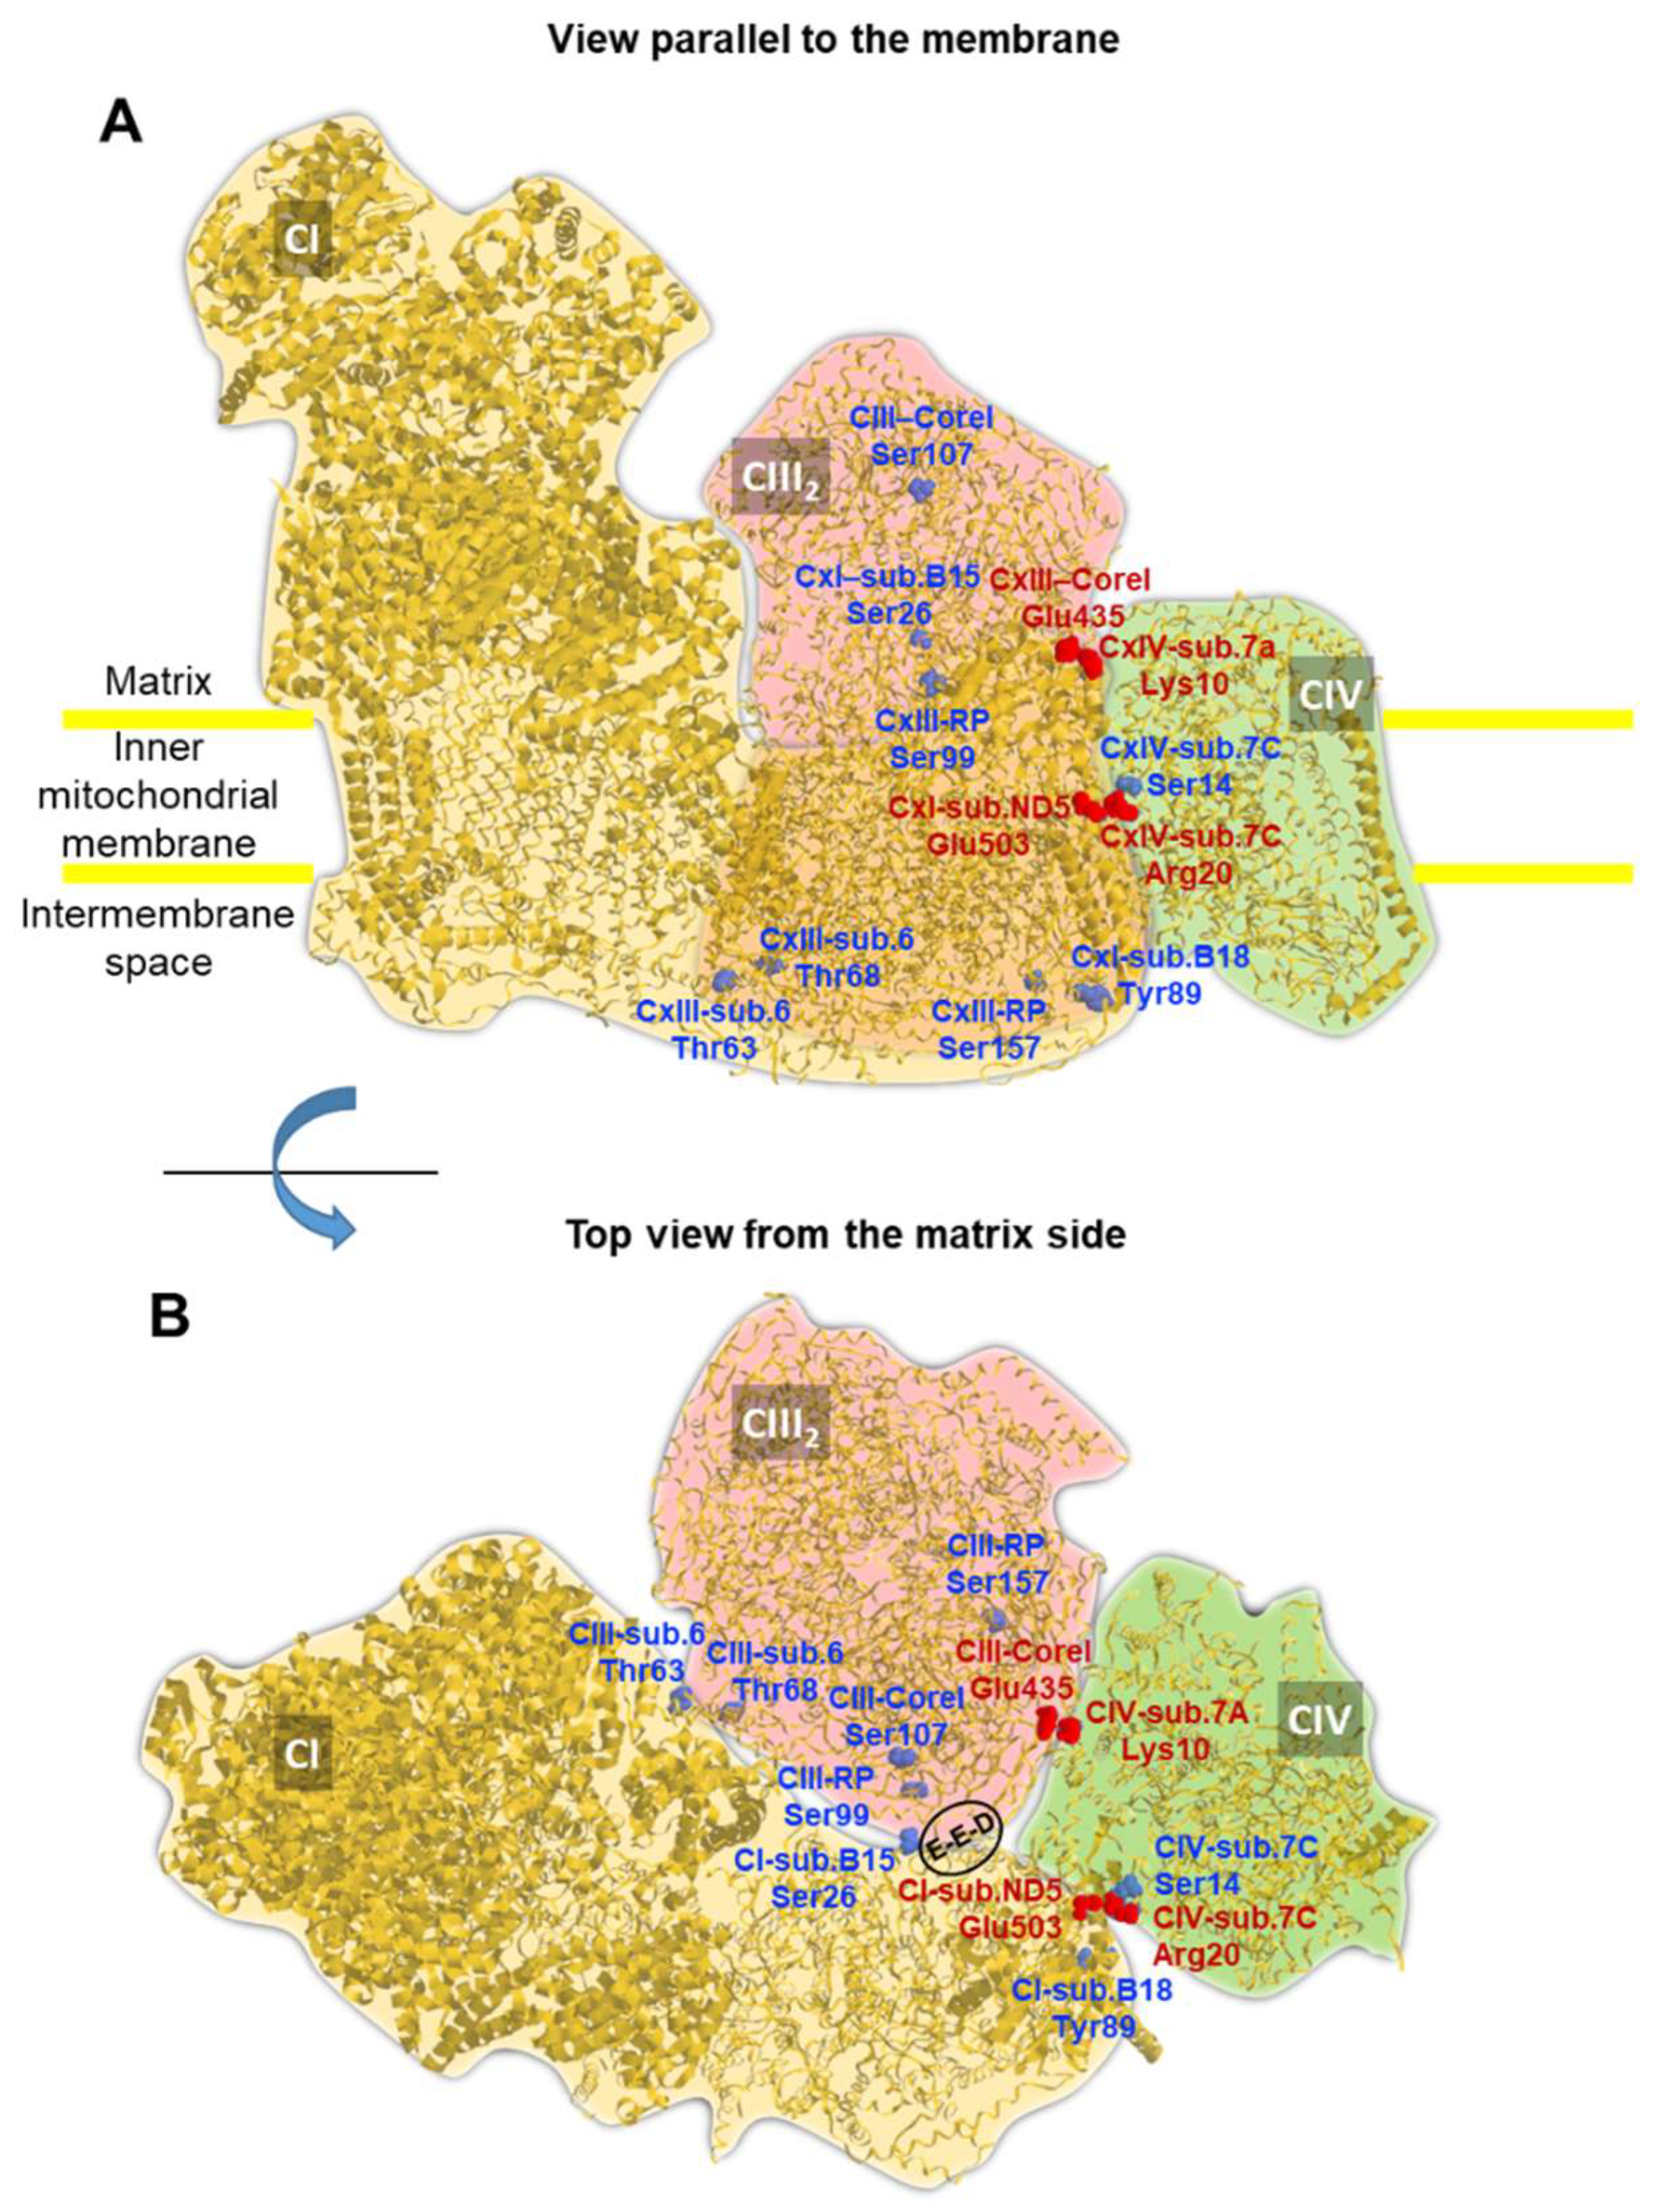
A limitation of this study is that although a much larger H89-sensitive immunoreactivity toward anti-P-serine was shown for high molecular weight SCs we did not identify directly the phosphorylatable residues involved. This will be the object of future investigations. However, exploration of the available cryo-EM structure of the CI,CIII
2,CIV respirasome to search for serine/threonine residues reported as target of PKA [
20] unveiled that most of them are mapped at the interlocked surfaces of the complexes and at contact sites among them largely exposed to the mitochondrial matrix side. Intriguingly, two phosphorylatable serines (i.e. Ser14 on sub. 7C of CIV and Ser26 on sub. NDUFB4/B15 of CI) are in close proximity to a salt bridge connecting CI to CIV or to a loop carrying three negative residues (i.e. Glu258-Glu259-Asp260) in the CIII-core I subunit recently reported to be essential in the stabilization of the respirasome CI/CIII
2/CIV [
39].
How the ΔΨ
m may influence the aggregation state of the RCs can, at the moment, be only object of speculation though computational MD modelling could be insightful. However, well known membrane voltage-sensitive ion channels offer a biophysical prototype demonstrating the impact of the electrical field nearby the membrane surface on the conformational change of membrane-embedded proteins [
45,
46]. Considering that in respiring mitochondria the electrical component of the proton-motive force has been estimated to reach values of up to 180 mV at the inner mitochondrial membrane [
2] (i.e. much larger than that measured at the plasma membrane of excitable cells) it is not surprising that it may exert strong electrostatic interactions with native or post-translationally added charges of protein residues resulting in large conformational changes [
47,
48].
All together the findings here reported, if confirmed by other more direct approaches, might unveil a hitherto unappreciated level of plasticity and resilience in the mitochondrial OxPhos system.
4. Materials and Methods
4.1. Cell culture.
Human hepatoma-derived cell line (HepG2 from ATCC – HB-8065) was grown in DMEM (Dulbecco's modified Eagle's medium) supplemented with 10% (v/v) foetal bovine serum to 70–80% confluence before harvesting. Drugs treatments: 2 hours with either one of 0.5 μΜ N-[2-((p-Bromocinnamyl)amino)ethyl]-5-isoquinolinesulfonamide (H89), 25 μΜ (E)-2-(1H-Benzo[d]imidazol-2-ylthio)-N′-(5-bromo-2-hydroxybenzylidene)propanehydrazide (KH7), 100 μΜ 3-Isobutyl-1-methylxanthine (IBMX), 10 μΜ Forskolin (FK); after incubation cells were detached from 150 mm-diameter Petri dishes with 2 ml of 0.05% trypsin/0.02% EDTA and washed in 20 ml of phosphate buffer saline (PBS), pH 7.4, with 5% (v/v) calf serum, centrifuged at 500xg, re-suspended in 200 μl of PBS, counted and immediately used. Cell viability, as determined by Trypan Blue exclusion, was typically never below 98%.
4.2. Respirometry
The oxygen consumption rate (OCR) was measured by high-resolution oxymetry (Oxygraph-2k, Oroboros Instruments or Oxygraph+ System, Hansatech Instruments Ltd) with Clark-type oxygen electrodes in a thermostatically controlled chamber equipped with a magnetic stirring device and a gas-tight stopper fitted with a narrow port for additions via Hamilton micro-syringes. Calibration of the instruments was made according to the manufacturer instructions. Measurements were carried out at 37 °C with about 2·106 HepG2 cells/ml suspended in 0.25 mΜ sucrose, 10 mΜ KH2PO4, 27 mΜ KCl, 40 mΜ Hepes, 1 mΜ MgCl2, 0.5 mΜ EGTA, 0.1% BSA, pH 7.1. Inhibitory titrations of the respiratory activities were performed under resting conditions (OCRRest) or under uncoupled condition in the presence of 0.5 μΜ FCCP (OCRUnc) by sequential additions of 0.5 μl of freshly prepared differently concentrated solutions of KCN (in ddH2O), myxothiazol (in ethanol), rotenone (in ethanol). Addition of the vehicle ethanol at the highest final volume attained following titration did not result in appreciable change in the OCR.
4.3. Metabolic flux control analysis.
The respiratory flux control coefficients (C
Jv,i) of the respiratory complexes I, III and IV were calculated by a non-linear regression analysis of the inhibitor-titration data set as developed in [
25,
26] and modified in [
17,
18] (fitting method). The derived non-linear equation correlating the percentage of the “global respiratory flux” to the inhibitor concentration [I] that we utilized:
depends on three parameters: K
D, which is the dissociation constant of the EI (enzyme-inhibitor) complex; E
0, which is the concentration of the active enzyme; c
Jv,i, which is the control coefficient of the inhibited enzymatic step (
i). The K
Ds used were: 25 μM for the CIV-CN complex; 0.1 μM for the CIII-myxothiazol; 0.4 μM for the CI-rotenone complex. The content of cytochrome c oxidase-aa
3 (CIV) and bc
1 complex (CIII) was evaluated by the dithionite-reduced minus air-oxidized differential spectra of HepG2 cell lysate resulting in 4.8 ±0.5 pmol CIV/10
6 cells (n=5; Δε
650–630nm=24 mΜ
−1 cm
−1) and 2.1 ±0.4 pmol CIII/10
6 cells (n=5; Δε
561–569 nm=20 mΜ
−1 cm
−1); thus values for E
0 of 0.0025 μM and 0.001 μM were imputed for CIV and CIII, respectively, at the prevailing experimental conditions (i.e. 2 x 10
6 HepG2 cells/ml). The amount of CI was assumed to be 0.8 pmol/10
6 cells (E
0=0.0004 μM) according to the relative respiratory chain complexes ratios computed in [
27]. The parameters c
Jv,i were estimated by best-fitting the inhibitory titration data set using the program GraFit 4.0.13 (Erithacus Software Ltd., Horley, Surrey, U.K.) enabling a tolerance range of ±50 % for the E
0s and K
Ds values. The accuracy of the fitting method was further tested for the CIV as in [
18].
4.4. Fluorimetric measurement ofΔΨm.
3-5 x 10
6 HepG2 cells in 2 ml of the respiration assay buffer (0.25 M sucrose, 10 mΜ KH
2PO
4, 27 mΜ KCl, 40 mΜ Hepes, 1 mΜ MgCl
2, 0.5 mΜ EGTA, 0.1 % BSA, pH 7.1) were assayed by oxymetry and treated with increasing concentrations of the plasma membrane permeabilizer digitonine (Dig) to assess the minimum amount of Dig inhibiting the resting respiratory activity. The amount of Dig chosen was for the fluorimetric analysis 20 μg/10
6 cells. For the fluorimetric measurement (by FP-6500, Jasco Analytical Instruments) 1.5-2.0 x 10
6 cells were preincubated for 20 min with the above reported concentration of Dig and pelleted at 1500-2000 rpm x 5 min. 2 ml of the buffer supplemented with 2 mΜ pyruvate plus 2 mΜ malate were placed in the fluorimeter cuvette (λ
ex 495 nm, λ
em 596 nm, medium gain) and four consecutive additions of 2.5 μΜ safranine O were injected, to calibrate the fluorescence signal; after than 1.5-2.0 x 10
6 cells (in 20 μL) were injected, causing progressive fluorescence quenching, followed after signal stabilization by addition of 0.4 μΜ FCCP causing full recovery of the safranine fluorescence. Estimation of the ΔΨ
m was performed as in [
18]. Briefly the following Nerst-derived equation was used:
with [S]
in standing for intramitochondrial concentration of safranine, estimated from the fluorescence difference before and after the addition of FCCP [
49] and [S]
out standing for extramitochondrial concentration of safranine O, estimated from the fluorescence signal before the addition of FCCP. The value used for the intramitochondrial volume was 3 μl/10
6 HepG2 cells as computed in [
18].
4.5. Blue native PAGE and Western blotting.
Mitochondrial-enriched fractions were obtained from HepG2 cells by differential centrifugation. Briefly, 10
8 cultured cells were harvested (by scraping) in 250 mΜ sucrose, 1 mΜ EDTA, 5 mΜ Hepes, 3 mΜ MgCl
2 (pH 7.4) supplemented with 10 μl/ml of protease inhibitors stock solution (SIGMA) and disrupted by tight teflon-glass homogenization; the homogenate was centrifuged at 1000 ×
g for 10 min and the resulting supernatant at 14,000 ×
g for 15 min. The resulting pellet was washed and finally re-suspended in a minimum volume of the same buffer supplemented with 0.6 g/g protein of dodecyl maltoside (DDM). Blue native-PAGE was performed in the presence of coomassie blu G250 as described in [
27] in a 5–12% acrylamide gradient and a picture of the resulting gel digitally acquired and stored. Hence the gel was transferred to nitrocellulose membrane using an immersion electrophoretic transfer cell (Bio-Rad) at 40 V overnight at 4 °C and blotted with mouse anti-phospho serine (P-ser) (Becton Dickinson, 1:1000) and HPR-conjugated anti-mouse IgG (Thermo Scientific, 1:20,000) as primary and secondary Ab, respectively, according to standard Western blotting procedure, and visualized by chemiluminescence (Chemidoc Imaging System).
4.6. Statistical analysis.
Data are reported as the mean (± standard error mean, SEM) of at least three independent experiments as indicated in the legend to Figures. Data were compared by an unpaired Student’s-t-test or, when necessary, by 2-way ANOVA followed by a post-hoc Bonferroni test. Differences were considered statistically significant with a p-values < 0.05. All analyses were performed using GraphPad Prism Software Version 5 (GraphPad Software Inc., San Diego, CA, USA).
Author Contributions
Conceptualization, N.C.; methodology, N.C. and R.S.; software, G.C.; formal analysis, A.Q.N.; investigation, R.S., O.C., M.R., A.Q.N., F.T., A.L. and G.Q.; data curation, R.S and O.C.; writing—original draft preparation, N.C.; writing—review and editing, R.S. and A.Q.N.; visualization, N.C. and G.C.; supervision, N.C. and R.S.; funding acquisition, R.S., C.P. and N.C. All authors have read and agreed to the published version of the manuscript.
Figure 1.
Effect of modulators of the cAMP-PKA signalling axis on the KCN inhibitory titrations of the mitochondrial respiratory activity in intact HepG2 cells. (A), (D) and (G) show schematically the signalling pathway object of the investigation under untreated condition (A) and in the presence of H89 (D) or IBMX (G); GF, growth factors; GFR, growth factor receptor; mAC, membrane adelylate cyclase; PDE, phosphodiesterase; PKA, protein kinase A; PP, protein phosphatase; Pr, proteins; Pr-P, phosphorylated proteins; sAC, soluble adelylate cyclase. Endogenous substrates-sustained respiration in HepG2 cells was assayed by high resolution oxymetry in the absence or presence of 1 μΜ FCCP as detailed in Materials and Methods. The oxygen consumption rates were measured after the addition of about 2 x 10⁶ cells/ml and titrated with increasing concentrations of KCN. The oxygen consumption rates (OCRs) are shown as percentage of the uninhibited OCR at the concentrations of KCN tested in untreated (B, C), H89-treated (0.5 μΜ x 2 hours) (E, F) and IBMX-treated (100 μΜ x 2 hours) (H, I) cells. In (B, E, H) the activity is shown under resting condition (OCRRES empty symbols) and under uncoupled conditions (OCRUNC, filled symbols) as mean values ± SEM of 5-7 independent biological replicates under each condition; the insets detail the titration curves at relatively low and intermediate concentrations of KCN with the dashed and continuous lines showing the best fitting according to the equation described in Materials and Methods. (C), (F) and (I) are plots of the OCRRES vs OCRUNC measured at the same concentrations of KCN with the continuous lines resulting from combination of those fitting the corresponding titration curves and the dotted thin line indicating the diagonal of the diagram. (J) Histogram showing the flux control coefficient (cJv,CIV) of complex IV on the respiratory activity under resting and uncoupled conditions in untreated and H89- and IBMX-treated cells; the values are means ± SEM of the parameter computed from best-fitting the single titration curves averaged in B, E and H; ***, p < 0.001. (K) Representative immunoblotting with anti-P-serine of mitochondrial extracted proteins separated by BN-native gel electrophoresis (shown on the right as stained by coomassie blu brilliant (CBB)-G250) as detailed in Materials and Methods. The histogram shows the densitometric analysis of the immunostained high molecular weight band as means ± SEM of three independent biological replicates under each condition; **, p < 0.005 (CTRL, untreated cells; H89-treated cells; FK, forskolin-treated cells).
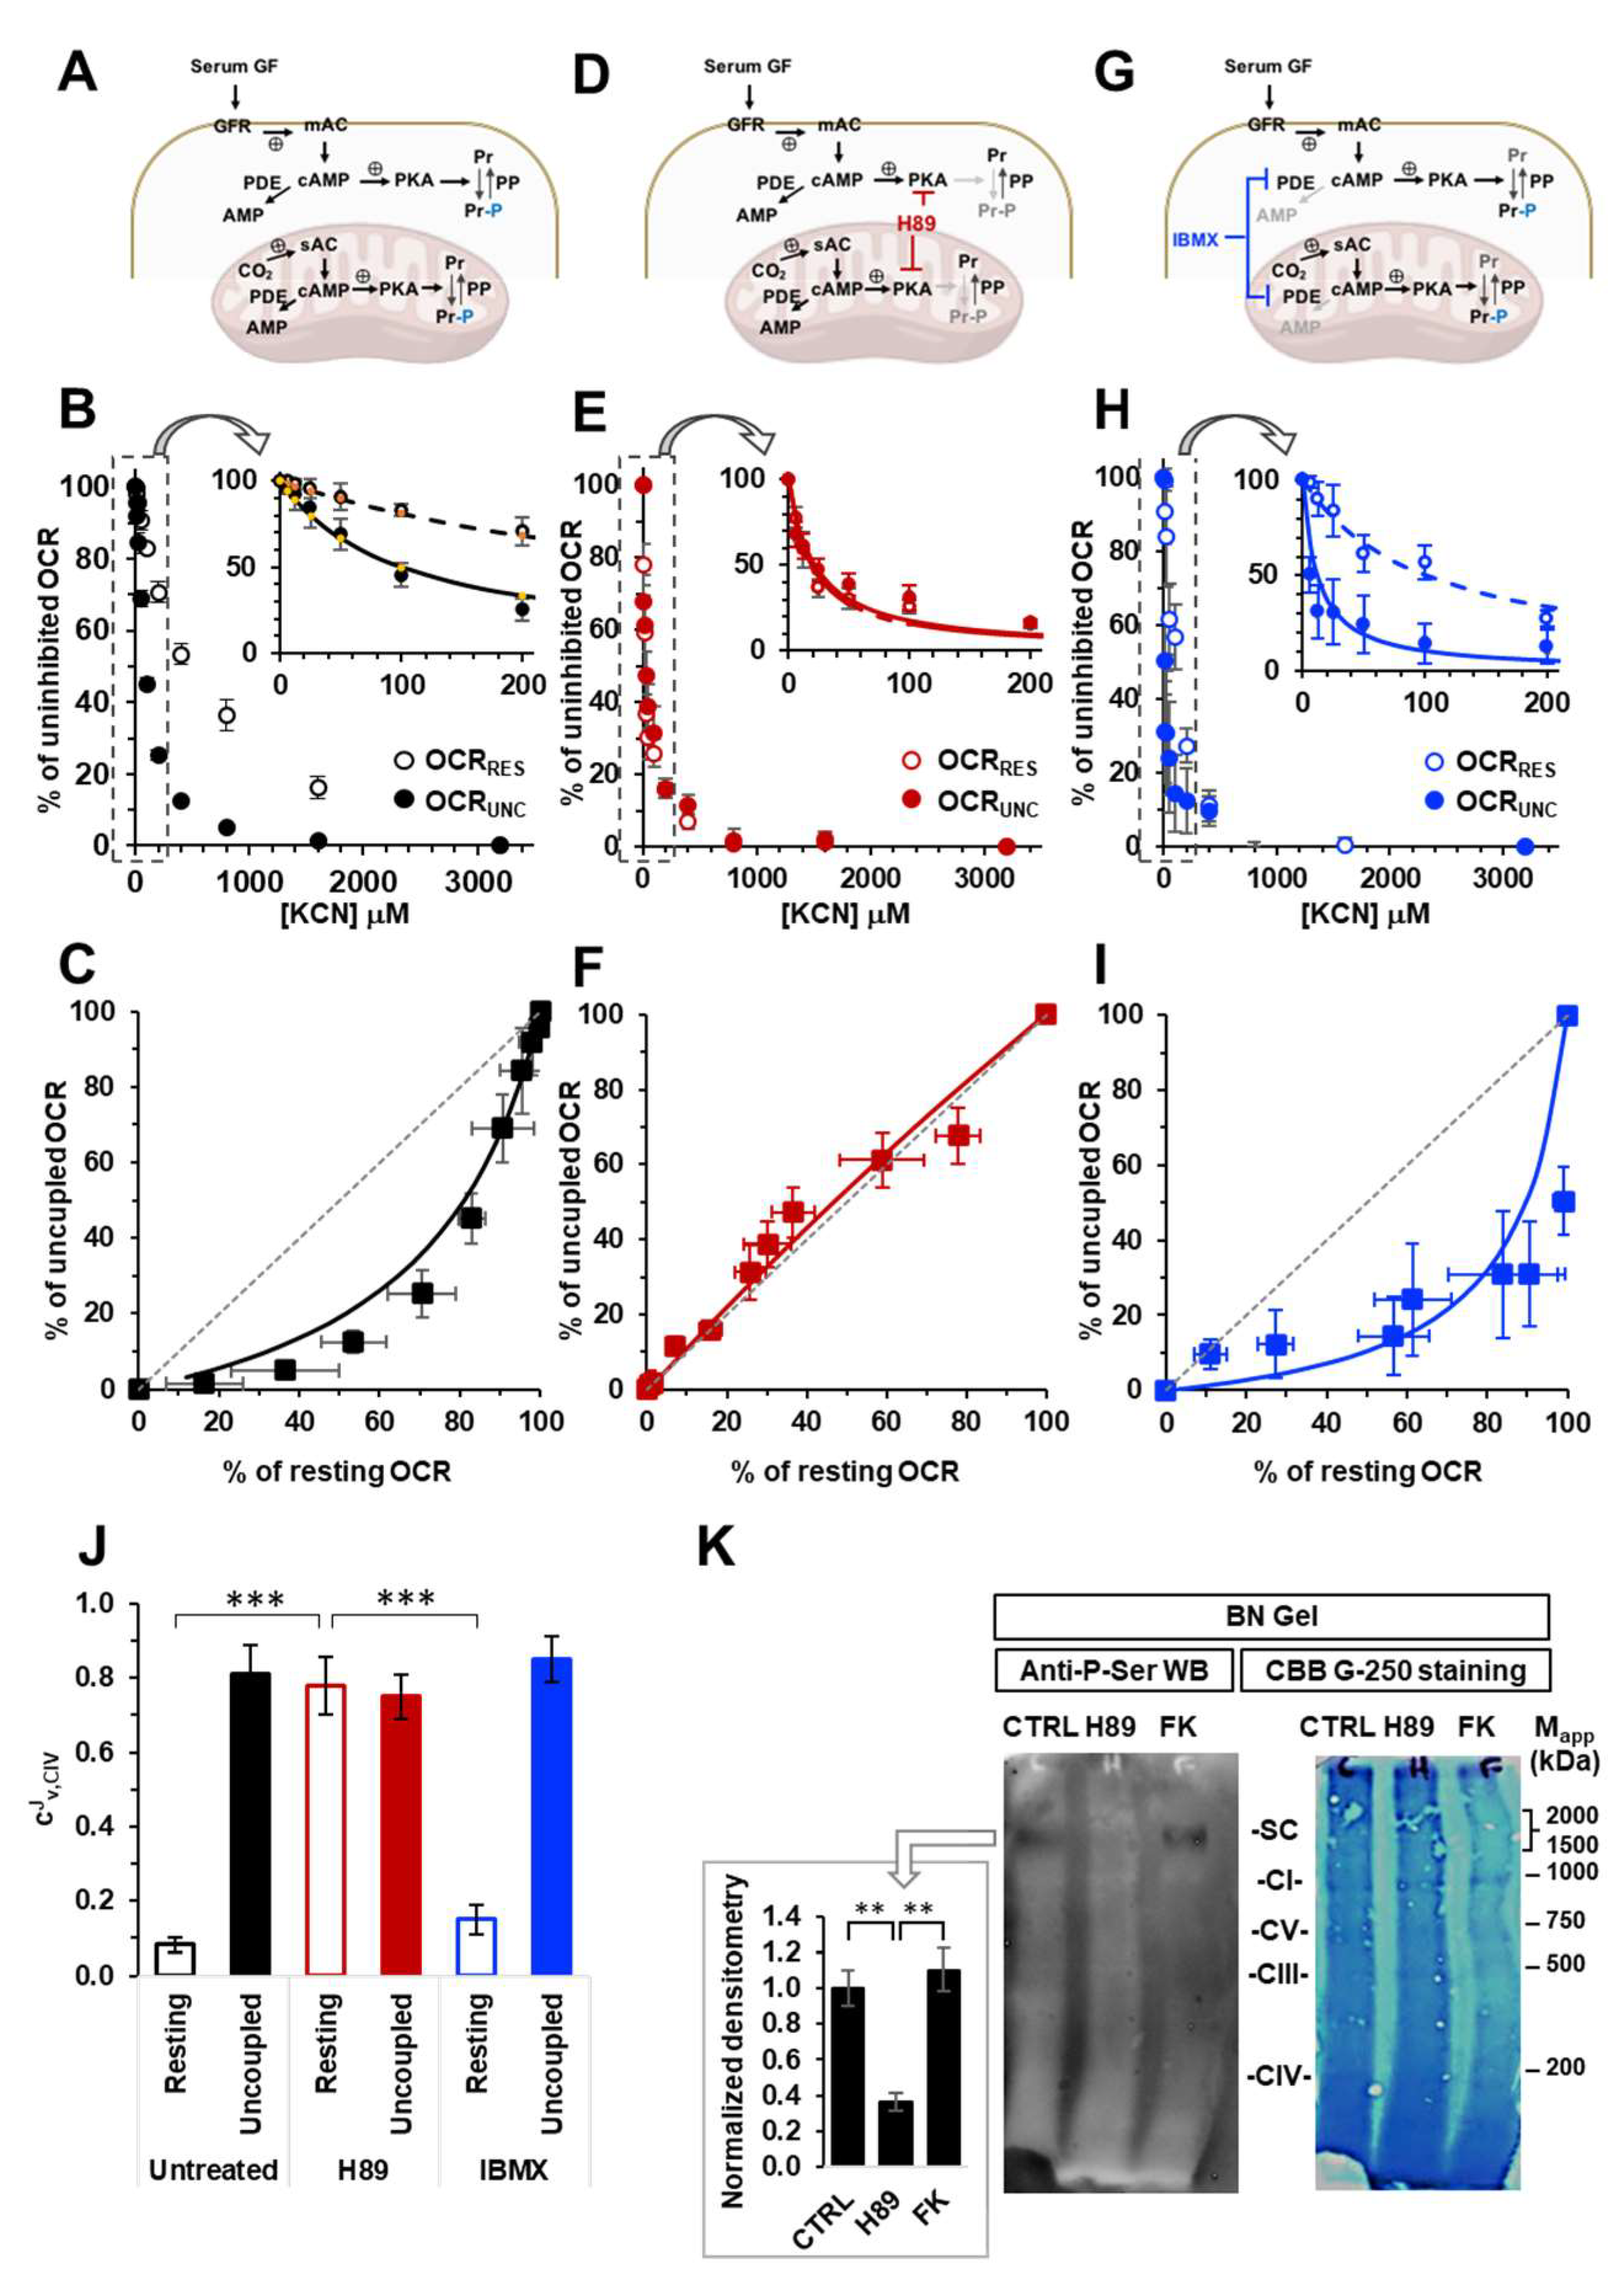
Figure 4.
Measurement of respiration-driven mitochondrial membrane potential in permeabilized HepG2 cells. (A) Representative oxymetric traces showing the protocol utilized to permeabilize plasma membrane in HepG2 cells. Trace (a): 2 x 10⁶ cells/ml were added to the assay buffer (detailed under Material and Methods) and supplemented as indicated with consecutive additions of digitonin (Dig); trace (b) 2 x 10⁶ cells/ml were pre-incubated with 15 mg/ml/106 cells of digitonin were suspended in the assay buffer and supplemented, where indicated, with 2 μΜ pyruvate plus 2 μΜ malate followed by injection of 2 mΜ rotenone plus 1 mΜ antimycin A. (B) Representative spectrophotometric traces for assessment of the mitochondrial membrane potential (ΔΨm) in untreated (blue line) and KH7-treated (red line) cells. Where indicated the assay buffer supplemented with pyruvate and malate was injected with four consecutive additions of 2.5 μΜ safranine O followed by addition of previously digitonin-permeabilized cells (2x10⁶/ml); after stabilization of the quenched fluorescence 0.5 μΜ FCCP was added. The fluorescence difference recorded before and after addition of FCCP is a measure or the respiration-driven ΔΨm generation; the histogram in the inset shows quantification in mV of the ΔΨm, as described in Materials and Methods, with the bars means ± SEM of 4 independent biological replicates.
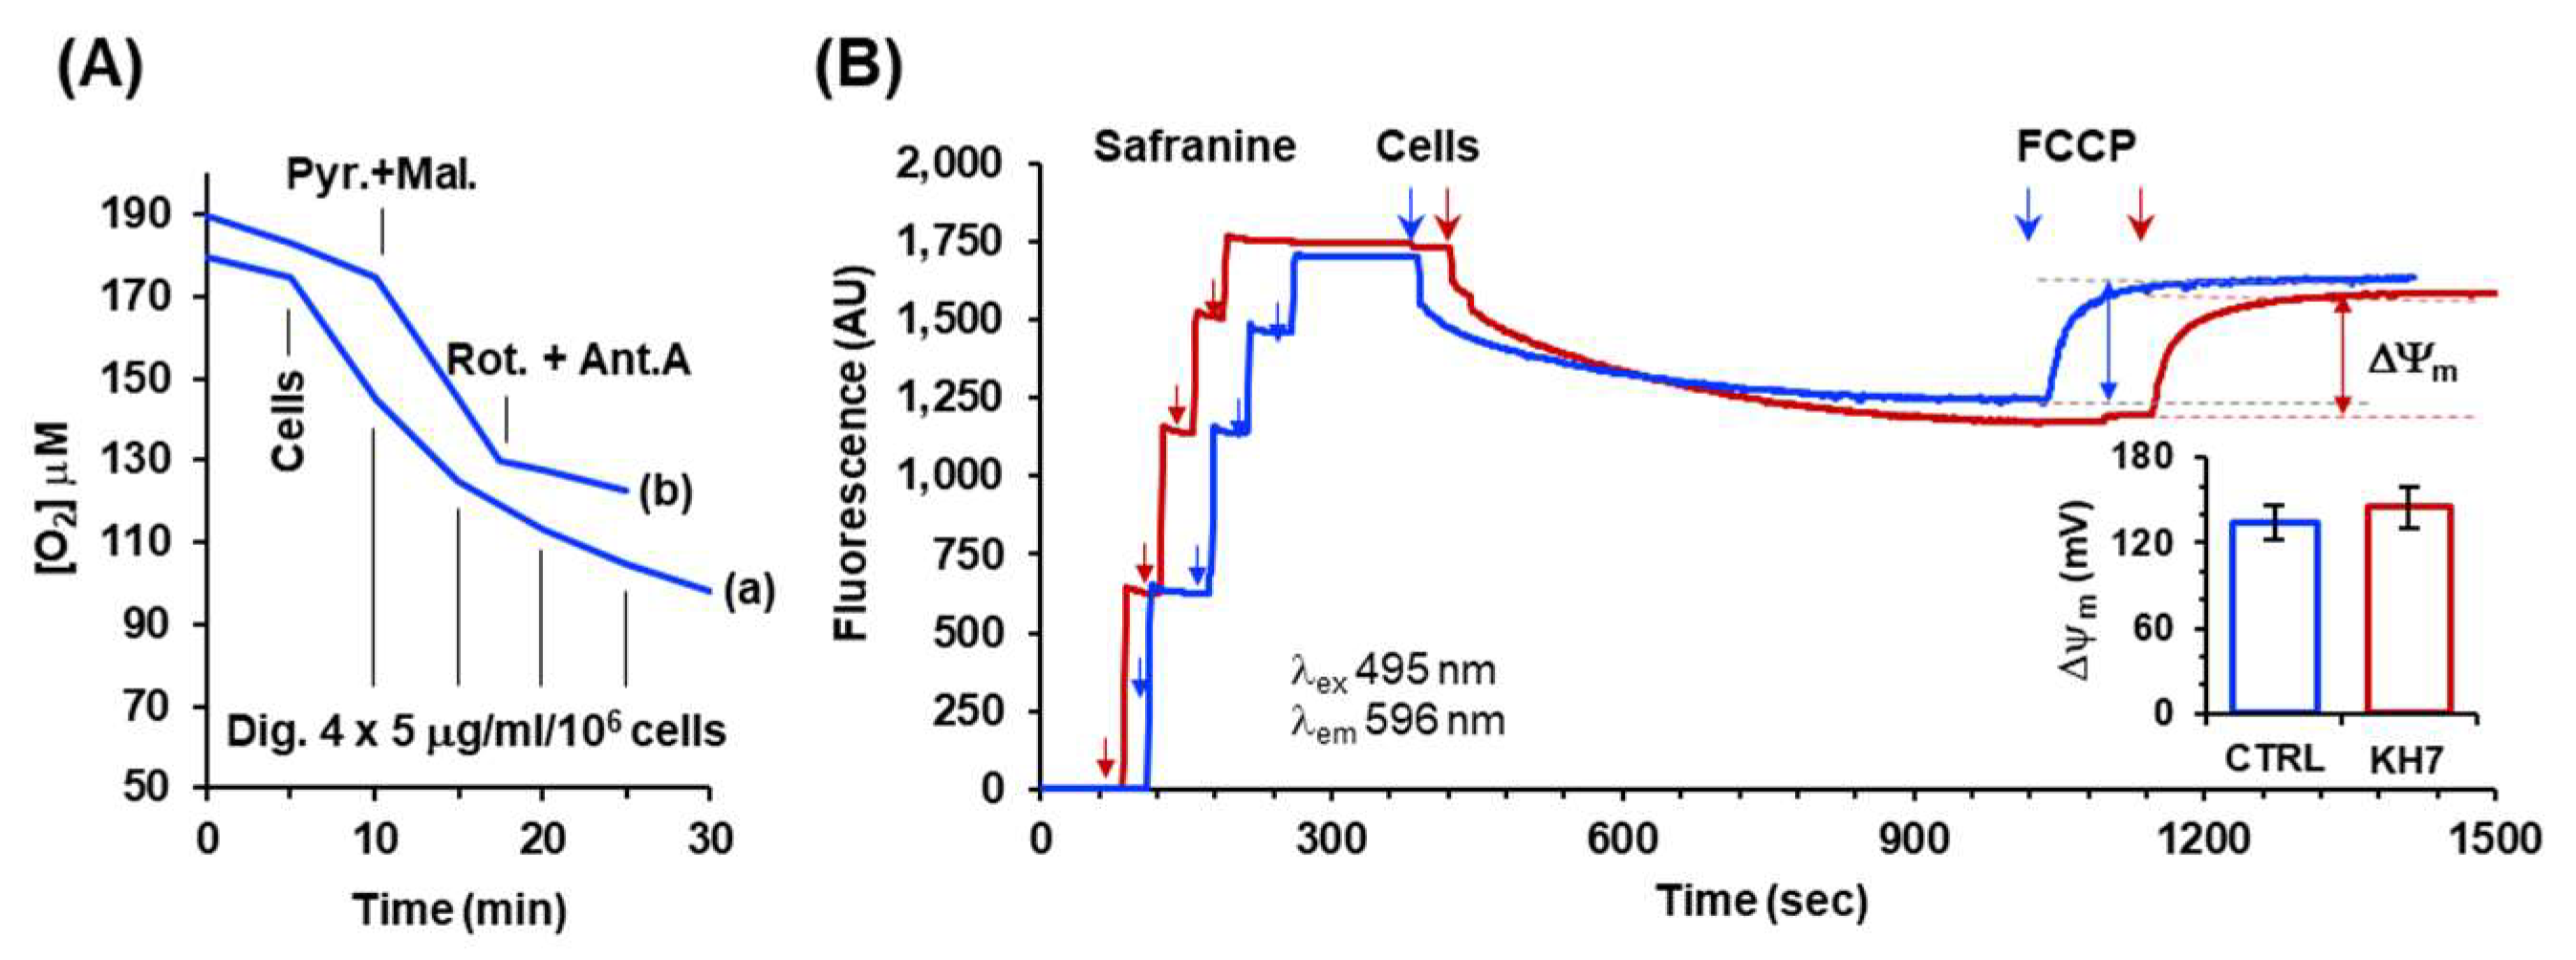
Figure 5.
Structure of the mitochondrial respirasome with localization of PKA-targetable residues. The cryo-EM-derived structure of the mitochondrial respiratory SC CI/CIII2/CIV from Sus scrofa is shown (pdb code 5GUP). The silhouette of the individual complexes is highlighted with different colours and the view parallel to the membrane (A) and the top view from the matrix side (B) are shown. Serine and threonine residues target of PKA are pinpointed in the structure (in blue) with indication of the complex-subunit of their location; the numbering of the residues corresponds to the primary sequence of the specific subunit in Homo sapiens after alignment to that of the porcine sequence. Two inter-complex salt bridges between complexes I-IV and III-IV are also shown in red. The encircled residues E-E-D indicate Glu258-Glu259-Asp260 in the Core I of CIII. See text for further details. The picture was drawn by RasTop 2.2 (geneinfinity.org/rastop/).
Figure 6.
PKA-mediated control of the respiratory chain complexes/supercomplex equilibrium in mitochondrial membrane. Pictorial representation of the model proposed in this study. The respiratory chain complexes are shown in their phosphorylated state under the action of the mitochondrial sAC/cAMP/PKA signaling axis (A) as able to change their aggregation state in function of the bioenergetic state of the membrane/metabolic demand with the isolated complexes state favored by the presence of a large electrochemical membrane potential (ΔμH+ largely contributed by ΔΨm) whereas formation of supercomplexes is elicited by low ΔμH+. In (B) it is highlighted that the inactivation of the signaling pathway and consequent dephosphorylation of the complexes causes their tendency to form supercomplexes irrespectively of the ΔμH+ extent. IMM, inner mitochondrial membrane; IMS, intermembrane space. See Discussion for further details.
