Preprint
Article

Photometric Monitoring of Electronic Cigarette Puff Topography

Altmetrics

Downloads

81

Views

51

Comments

0

A peer-reviewed article of this preprint also exists.

Keith Kolaczyk  †
,
Hao Jiang  *,†

  † These authors contributed equally to this work.

This version is not peer-reviewed

Submitted:

29 September 2023

Posted:

30 September 2023

You are already at the latest version

Alerts
Abstract
To study and monitor the adverse health consequences from using electronic cigarettes, a user’s puff topography, which are quantification parameters of the user’s vaping habits, plays a central role. In this work, we introduce a topography sensor to measure the mass of total particulate matter generated in every puff and to estimate the nicotine yield. The sensor is compact and low-cost, and is integrated into the electronic cigarette device to promptly and conveniently monitor the user’s daily puff topography. The topography sensor is comprised of a photometric sensor and a pressure sensor. The photometric sensor measures the mass concentration of the aerosol, based on scattering of near-infrared light from airborne particles, while the pressure sensor measures the flow rate. The topography sensor was experimented under various conditions with a wide range of atomizer power, puff duration, and inhalation pressure. The sensor’s accuracy was validated by comparing the sensor’s readings with reference measurements, and the results matched closely with the trends reported by existing studies on electronic cigarettes. An example application of tracking a user’s puff topography was also demonstrated. Our topography sensor holds great promise in mitigating health risks of vaping, and in promoting quality control of electronic cigarette products.
Keywords: 
Subject: Engineering  -   Bioengineering

1. Introduction

Electronic cigarettes (“e-cigarettes” or “e-cigs”) have been rapidly growing in popularity in recent years, which has raised a great deal of concern about the health risks associated with vaping [1,2,3,4,5,6,7,8,9,10,11,12,13]. A considerable amount of studies have reported carcinogenic compounds, and trace metals in e-cigarette aerosols [7,8,9,12,14,15,16,17,18,19,20,21,22]. In some cases, the concentrations of these harmful contents are even higher in e-cigarette aerosols than in traditional cigarette smokes [7,14,15,18,19]. Inhalation of these chemicals have been associated with the development of multiple negative health conditions, including but not limited to heart disease, lung cancer, stenosis, asthma, and hypertension [7,8,9,20]. Health risks of vaping have been reported to be an even more prevalent issue for youth and children [3,5,7,9,20,23,24].
In an e-cigarette aerosol, the actual amounts of various chemicals and the particle size distributions of airborne particles, known as particulate matter (PM), are determined by two main aspects: the e-cigarette device (hardware and e-liquid), and the user’s vaping habits. The generated e-cigarette aerosols depend on the e-cigarette device type (disposable, rechargeable, cartridge, pod, mod, etc.), e-liquid (compositions of propylene glycol, vegetable glycerin, flavoring agents, and nicotine, etc.), and e-cigarette brand/manufacturer [5,8,9,16,17,25,26,27,28]. E-cigarettes are often believed to be less lethal than combustible tobacco and to be beneficial for the cessation of traditional smoking. One study showed that the levels of certain carcinogens and toxicants in e-cigarette aerosols can be one to two orders of magnitude lower than traditional cigarette smokes [15]. However, due to the diversity and variety of e-cigarette products and the lack of manufacturing standards and quality controls, the actual e-cigarette aerosols can vary widely [5]. Poorly manufactured e-cigarettes and e-liquids can generate even more harmful constituents than traditional cigarettes [1]. Regulation of e-cigarette products is currently considered as a severe challenge by government agencies such as the U.S. Food and Drug Administration (FDA) [29].
Given a specific e-cigarette device and e-liquid, the e-cigarette aerosol properties and nicotine yields are further decided by the user’s personalized vaping habits, known as puff topography [18,25,30,31,32,33,34,35,36]. In general, a user’s e-cigarette puff topography can be quantified by parameters such as puff numbers, puff frequencies, inter-puff intervals, puff durations, puff flow rates, and puff volumes [25,30,31,36]. Several studies have investigated the puff topography and nicotine intake of different e-cigarette user groups [30,31]. Korzun et al. studied the effects of flow rates on toxicants in e-cigarette aerosols and e-liquid consumption [37]. Floyd et al. also reported the effects of flow rates on e-cigarette outputs [35,36].
From a broader perspective, puff topography should further include the user’s preferred device operational conditions [36]. Atomizer coil power, coil resistance, and coil temperature are known to strongly influence the e-cigarette aerosol outputs [25,32,36,38,39,40]. Zhao et al. studied the variations in e-cigarette aerosols under different coil temperatures [32]. Farsalinos et al. reported the change of users’ puff topography due to different power settings [34]. Floyd et al. revealed the effects of atomizer coil power on the particle size distribution and the ratio between finer and bigger particles [38]. Pourchez et al. studied the effects of atomizer coil power and e-liquid compositions on the aerosol output [41]. Mulder et al. demonstrated that the e-cigarette aerosol particle size distributions and nicotine yields are strongly dependent on the battery voltage and coil resistance [39]. Lechasseur et al. investigated the effects of coil temperature, coil power, and e-liquid types on the particle size distribution and lung deposition from e-cigarette aerosols [40].
To better understand the long-term adverse health consequences of vaping, it is essential to measure and track the personalized puff topography for all e-cigarette users. Many e-cigarette users’ puff topographies represent potentially harmful vaping fashions. For example, certain e-cigarette users have a strong nicotine craving and tend to overheat the e-liquids, which can cause the users to inhale very harmful carcinogenic constituents produced from thermal decomposition of e-liquids at too high temperatures [6]. If puff topography can be closely monitored puff by puff, users can be cautioned about such device misuse, and their vaping behaviors can potentially be modified towards healthier fashions. To mitigate the health risks of vaping, topography sensors built inside e-cigarettes that can monitor the user’s daily puff topography, are highly demanded. Such topography sensors must be compact, low-cost, and compatible with mainstream e-cigarettes. In existing e-cigarette devices, the puff number, puff frequency, inter-puff interval, and puff duration can all be attained by monitoring the activation of the atomizer. Some e-cigarette brands can also automatically measure the coil resistance and record the power setting of the coil. Built-in airflow sensors and pressure sensors are quite common in many e-cigarettes to activate the atomizer when the user inhales [2,5]. Such sensors can be used to monitor the puff flow rate and puff volume [36].
In existing studies on e-cigarettes, the properties of generated e-cigarette aerosols have been treated as a consequence resulting from the user’s puff topography [18,25,30,31,32,33,34,35,36]. Due to the aforementioned diversity of e-cigarette products and variations in vaping habits, direct measurements on the properties of e-cigarette output can potentially provide more valuable and reliable information than other parameters. Existing research methods typically implemented professional aerosol instruments or specially engineered topography devices to measure e-cigarette aerosols. Fast mobility particle sizer (FMPS), scanning mobility particle sizer (SMPS), and multi-stage micro-orifice uniform deposit impactor (MOUDI) were often implemented to measure the particle size distribution in e-cigarette aerosols [18,26,32,38,39,40,42]. Liquid chromatography/mass spectrometry (LC/MS), gas chromatography/mass spectrometry (GC/MS), and high-performance liquid chromatography (HPLC) were popularly used for chemical analysis of e-cigarette aerosols [23,25,30,39]. There are also established protocols for studying e-cigarette aerosols, developed by the Cooperation Centre for Scientific Research Relative to Tobacco (CORESTA) [43]. All these mentioned research methods require sophisticated, expensive, and bulky analytical instruments, and they are limited to studying e-cigarette aerosols in laboratories only. Several portable topography devices have been demonstrated, which allow in situ investigation of puff topography and aerosol properties [31,36,44]. Dunkhorst et al. implemented laser light polarization ratio method to measure the mass median diameter (MMD) of e-cigarette aerosols [44]. Floyd et al. developed a topography device based on Bernoulli flow cell to measure puff flow rate from differential pressure [36]. Although these topography devices opened up new possibilities to study puff topography in situ, they are not yet suitable to be integrated inside e-cigarettes for tracking users’ daily puff topography.
Due to the significance of e-cigarette aerosol properties, we suggest further broadening the concept of puff topography by including quantification parameters on aerosol properties, if such parameters can be directly measured from the e-cigarette device itself. Considering its implications on the health risks of vaping, it is potentially more crucial than all other existing puff topography parameters. Previously, our group introduced the concept of “smart e-cigarettes” with built-in aerosol sensors [45]. Using a sensor assembly comprised of a multi-wavelength photometric sensor and a gas sensor, the relevant aerosol properties, including the ratio between finer and bigger particles, the aerosol temperature, and the electrical resistance in response to volatile organic compounds (VOCs), were measured and tracked for every puff to analyze the user’s puff topography [45]. In this article, we introduce a new functionality of this topography sensor, which can measure the aerosol output, defined as the mass of total particulate matter (TPM), in each puff, and estimate the nicotine yield puff by puff. This "mass of TPM" is similar with the "mass of vaporized e-liquid (MVE)" or "mass loss per puff" in literature [35,46], and the differences will be discussed in later sections. In this article, we demonstrate the concept of our e-cig topography sensor, the construction of the prototype, the calibration and validation of the sensor’s responses, and the experimental results on various e-cigarette device settings and tracking one user’s puff topography.
The mass of TPM has been widely studied in association with puff topography. The majority of existing studies have implemented gravimetric approaches to measure e-liquid consumption by weighing the relevant e-cigarette components, such as the entire device, the cartomizer/clearomizer, or the filter pad for aerosol sample collections, before and after the puffs [6,18,25,30,34,35,37,38,39,46,47,48]. Several studies have directly measured the mass of TPM in the generated aerosols using analytical aerosol instruments [39,41,49]. Furthermore, external devices and experimental platforms have also been demonstrated. Wasisto et al. developed a piezoresistive cantilever sensor capable of measuring the mass of e-cigarette aerosols [50]. Dunkhorst et al. demonstrated the real-time monitoring of PM mass concentration of e-cigarette aerosols using wavelength-dependent mid-infrared light extinction [51], and polarization ratio method [44]. Wu et al. implemented photometric detections to measure e-cigarette aerosol concentrations using a laser beam in a scaled-model experiment [48]. These aforementioned examples are by far limited to in situ measurements of e-cigarette aerosols. It should be noted that none of the existing methodologies has enabled compact topography sensors built inside the e-cigarettes.
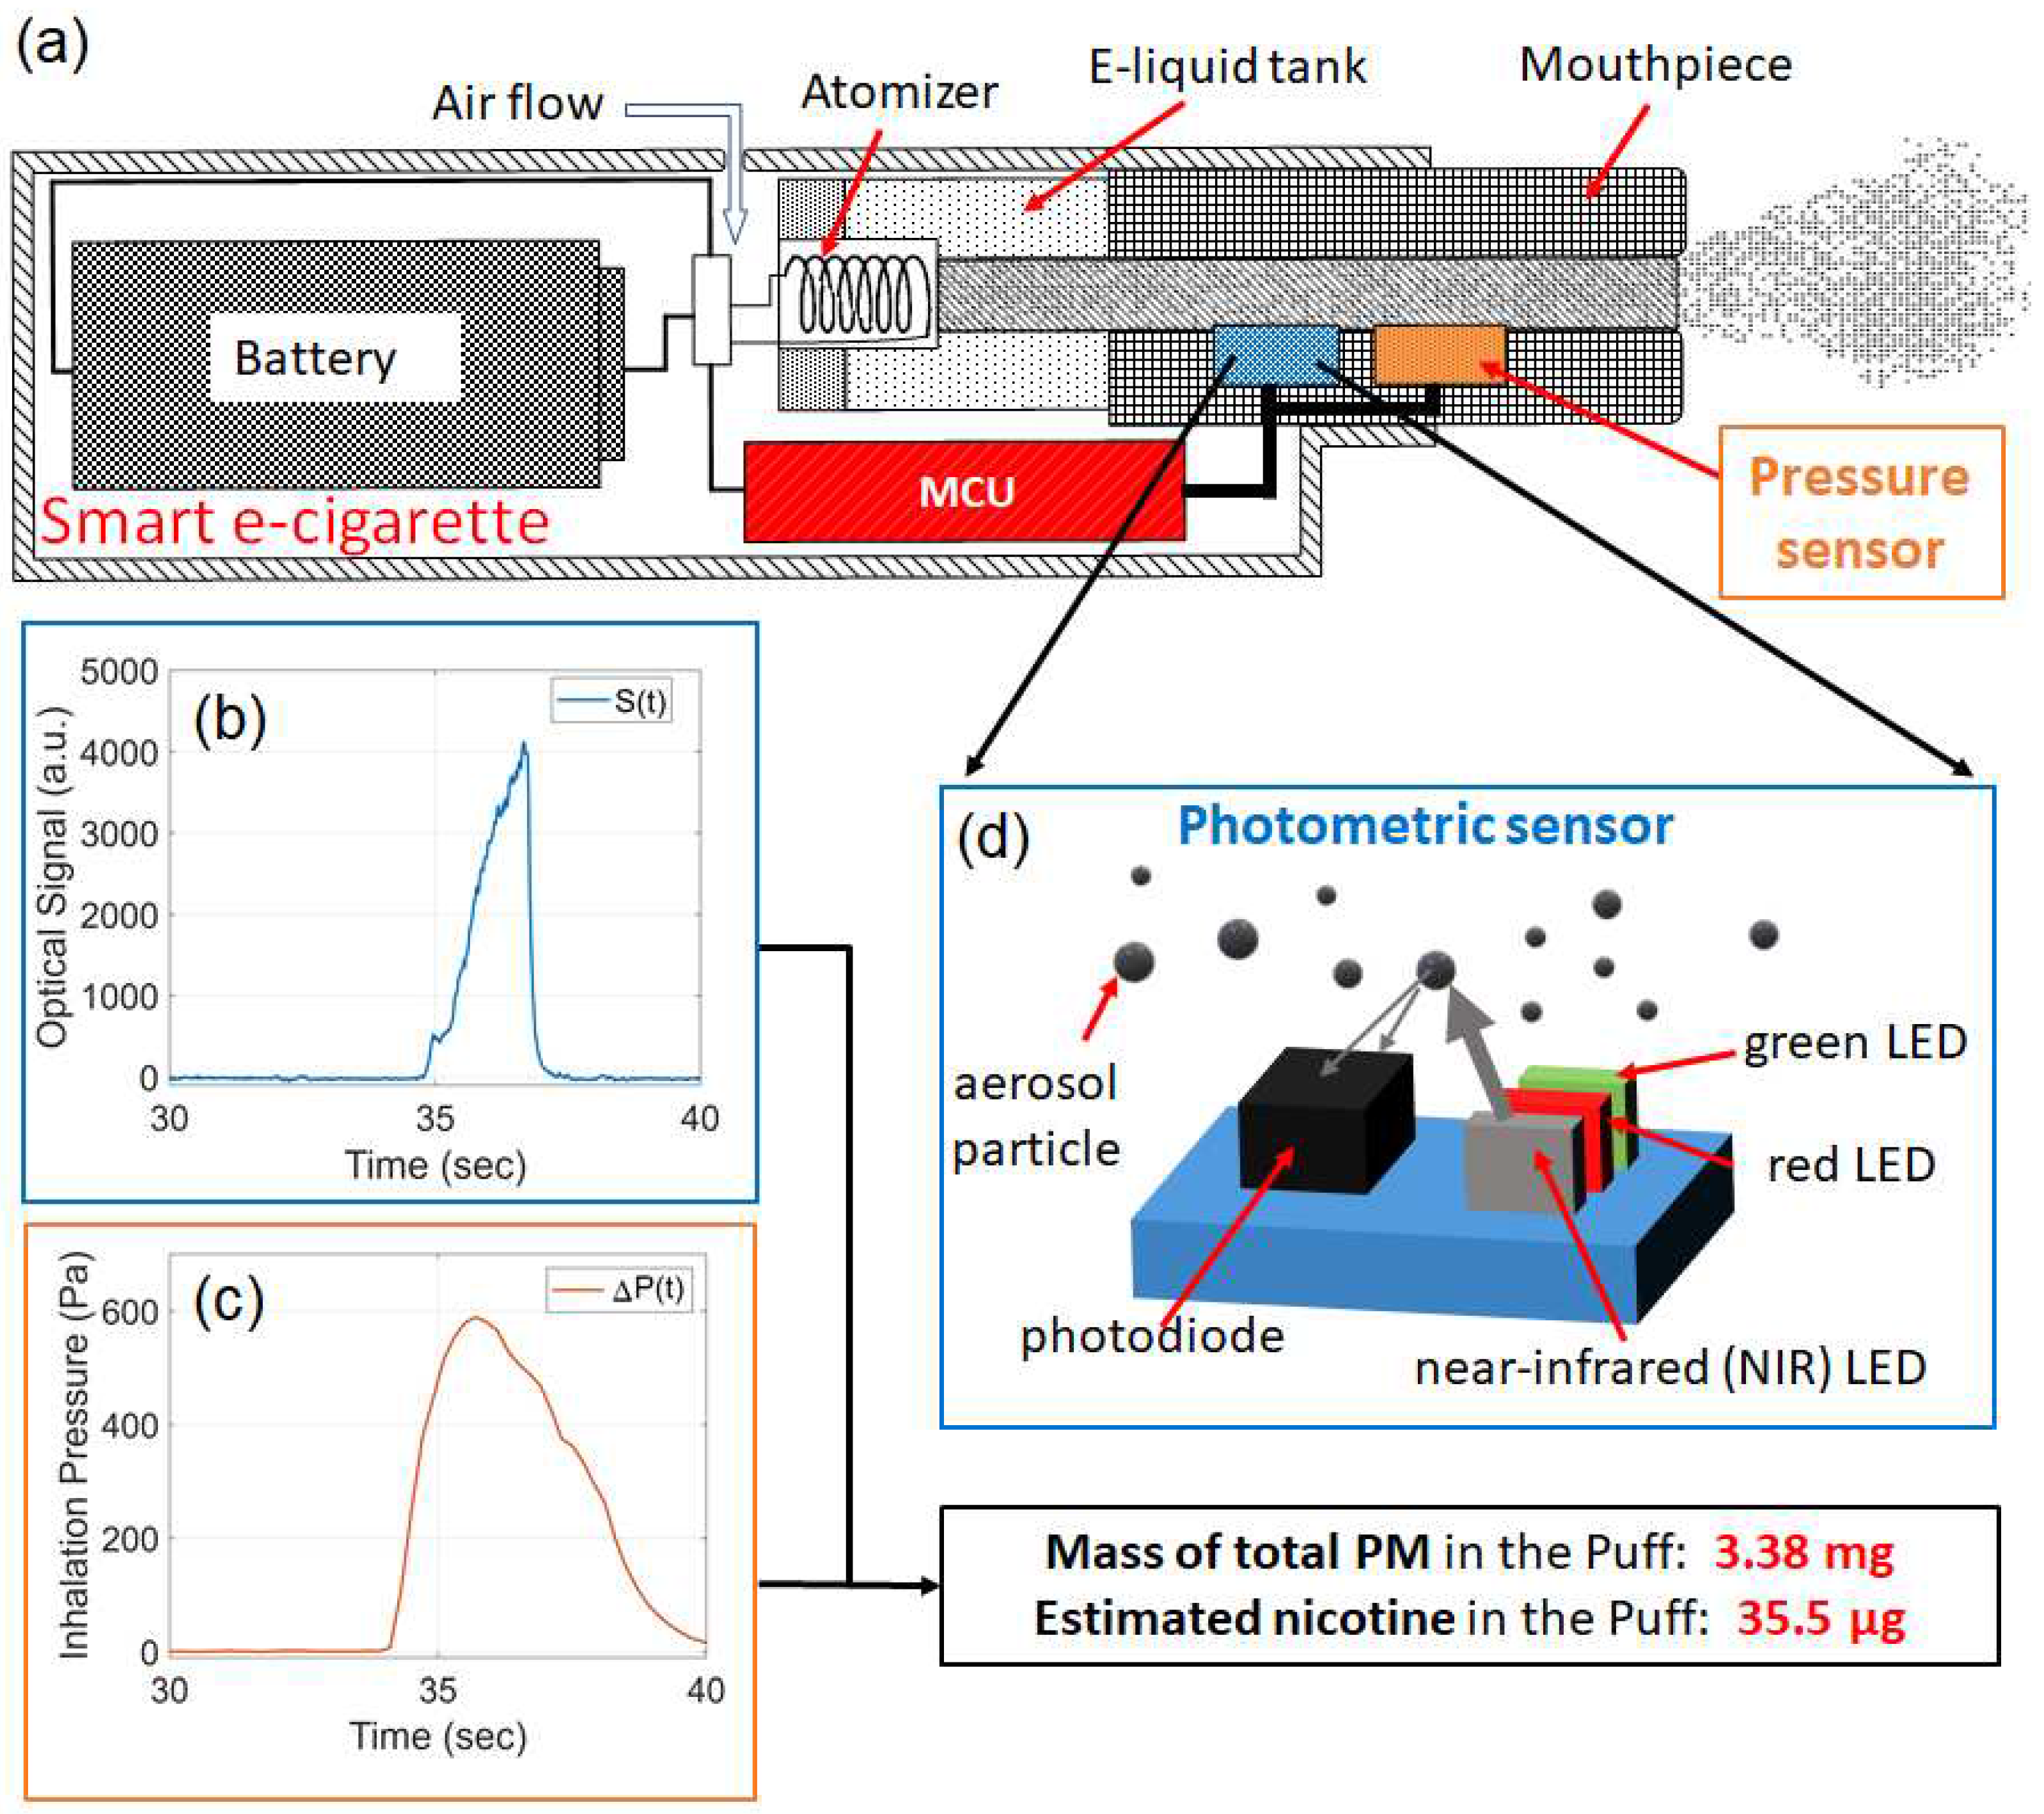
Figure 1. Working principle of the e-cig topography sensor. (a) Schematic of a "smart e-cigarette" equipped with a built-in topography sensor comprised of a photometric sensor, a pressure sensor, and a micro-controller unit (MCU). Example of (b) optical signal and (c) inhalation pressure collected from the photometric sensor and the pressure sensor, respectively. (d) Schematic of the photometric sensor for detecting an e-cigarette aerosol concentration.
Preprints 86539 g001
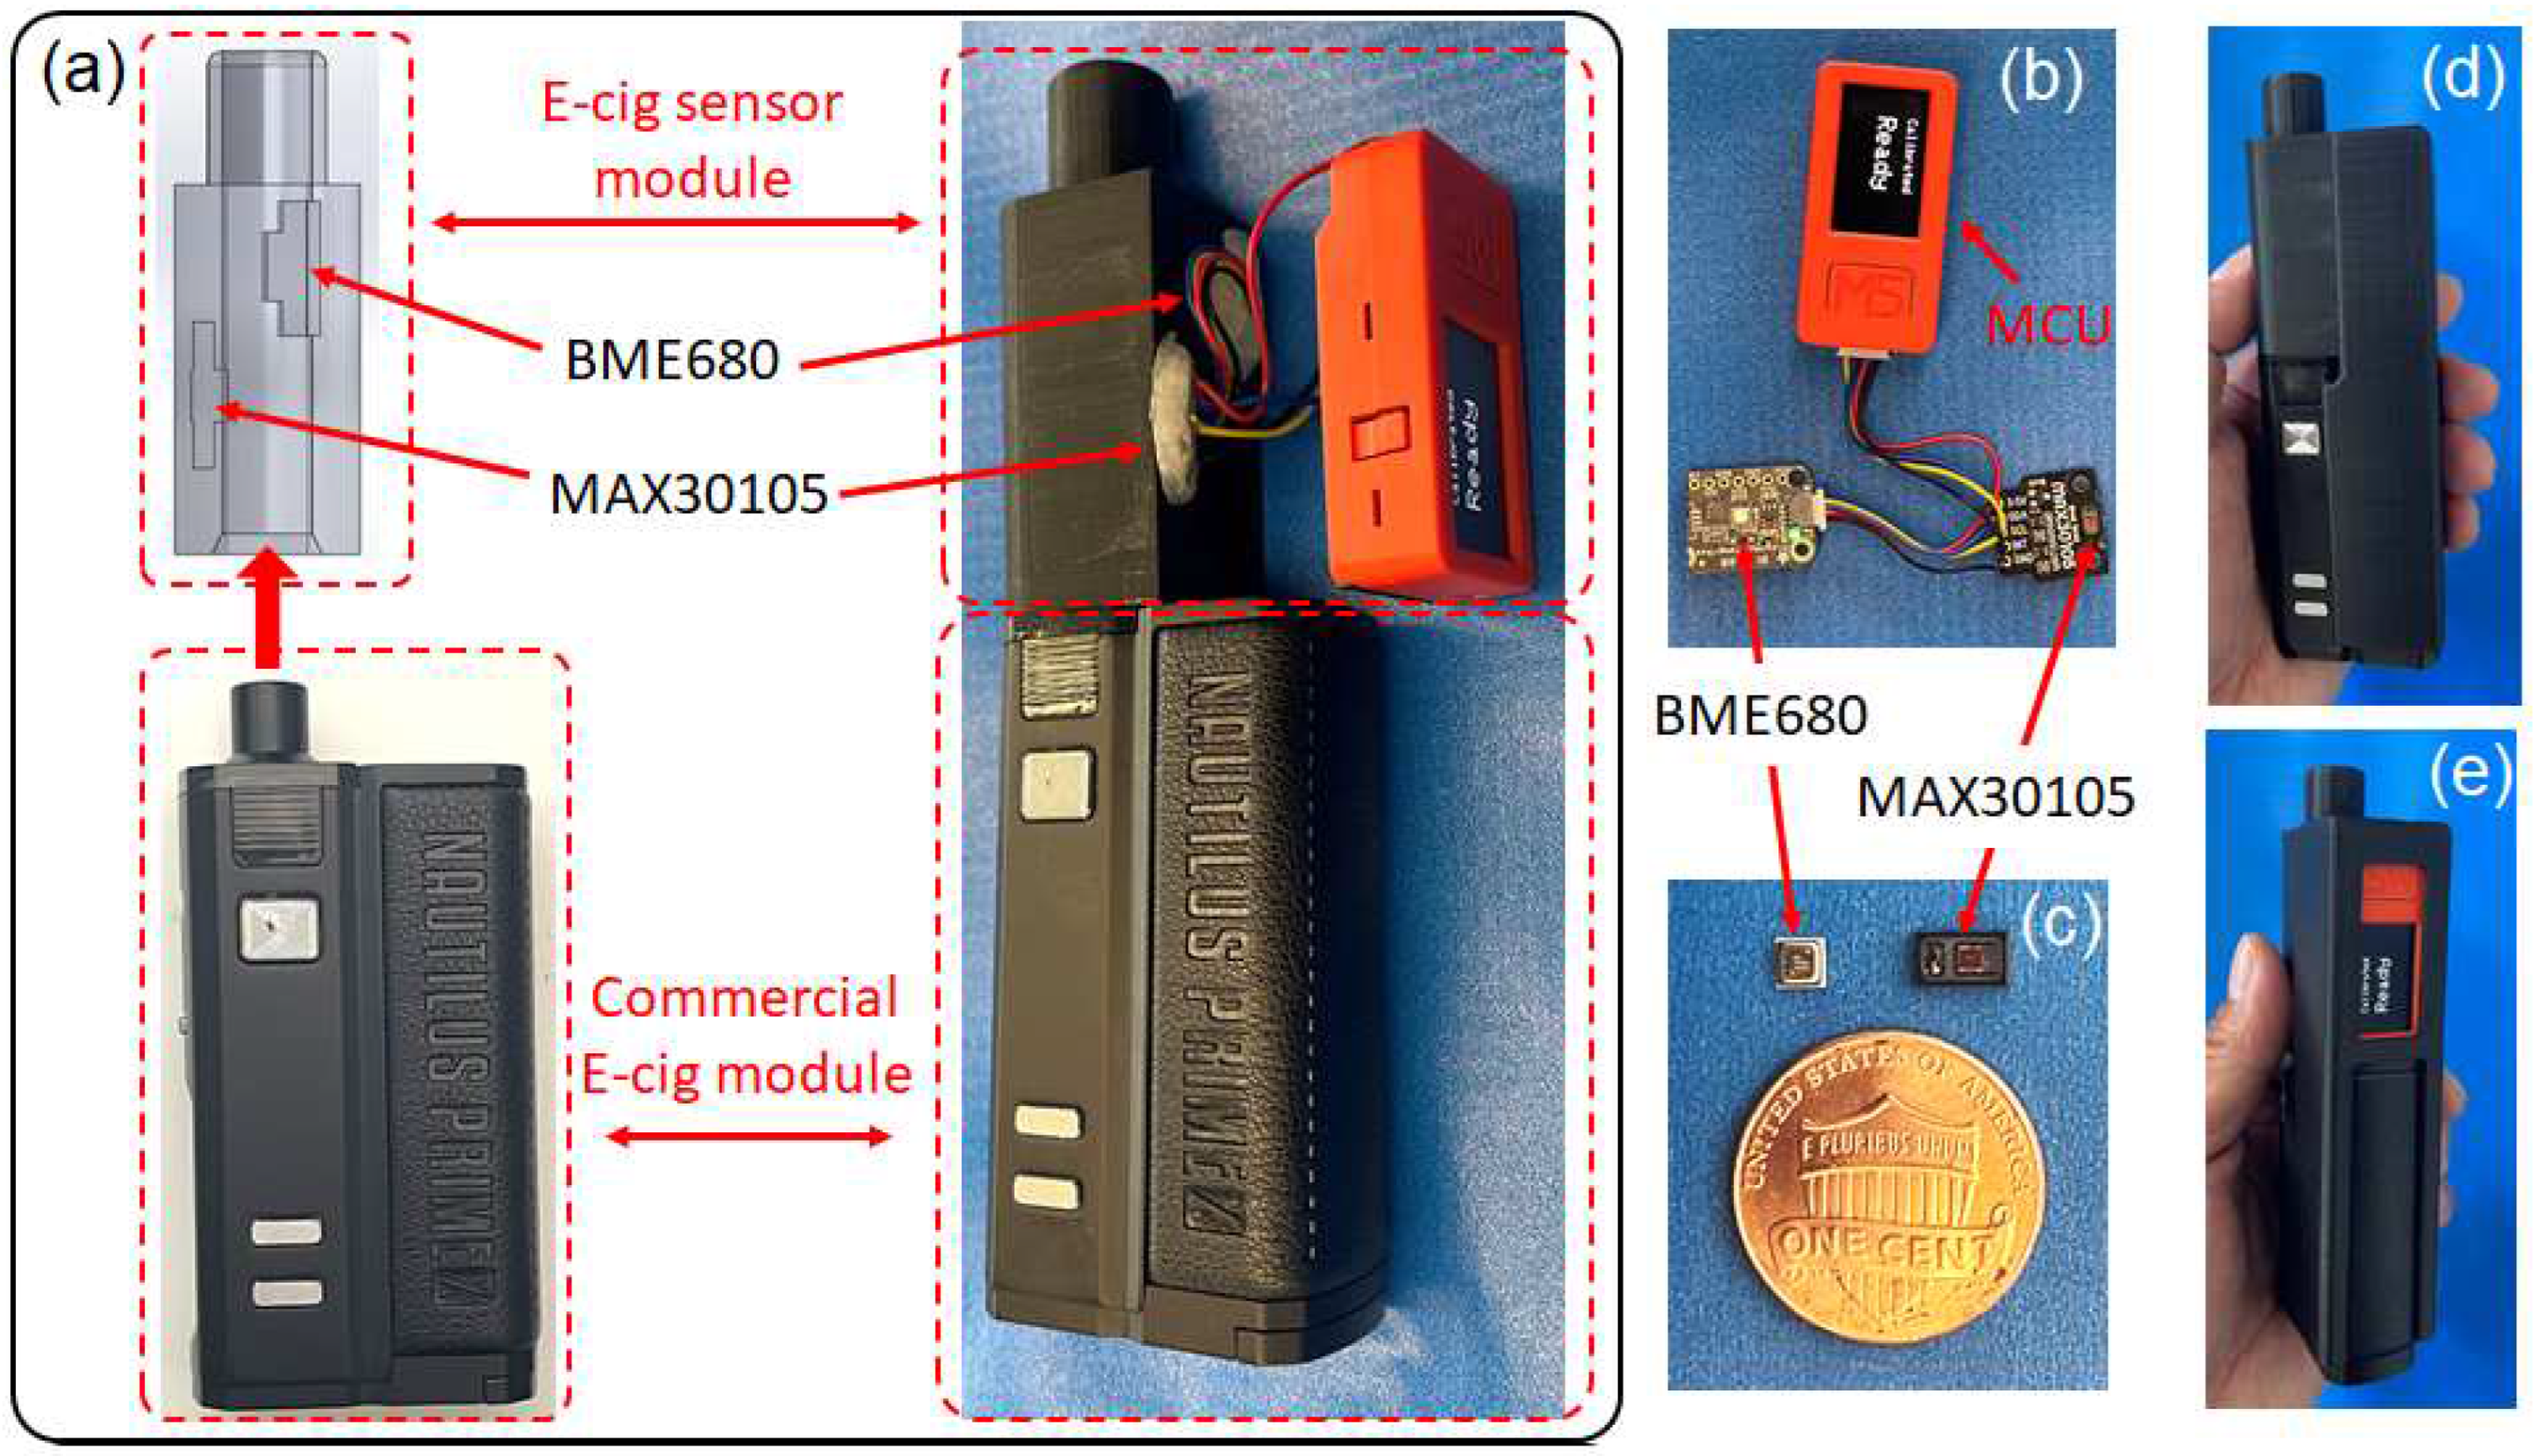
Figure 2. A prototype smart e-cigarette with an e-cig topography sensor. (a) Integration of the e-cig topography sensor assembly with a commercial e-cigarette module. (b) Photograph of the e-cig topography sensor assembly. (c) Photographs of the core components of the sensors, compared to the size of a U.S. penny coin. (d)(e) Photographs of the constructed smart e-cigarette prototype.
Preprints 86539 g002

2. E-cig Topography Sensor Working Principle

Figure 1 shows the working principle of our e-cig topography sensor which is integrated inside a smart e-cigarette device. A photometric sensor and a pressure sensor are both installed inside the aerosol delivery passage of the e-cigarette device to directly probe the aerosols from within the device. The purpose of the photometric sensor is to measure the real-time aerosol mass concentration, C ( t ) . The function of the pressure sensor is to monitor the real-time volumetric aerosol flow rate, Q ( t ) .
Mass of TPM in a puff, defined as as M p u f f , is given by:
M p u f f = C ( t ) Q ( t ) d t
where the integral is carried over the entire duration of the puff.
Photometric measurements for aerosols typically detect the intensity of light scattered from, or transmitting through, the aerosols, and the optical signal is then converted into a reading of mass concentration of the PM according to a known calibration curve [44,48,51,52,53]. In this work, the photometric sensor, as schematically shown in Figure 1d, is comprised of multiple LEDs and a photodiode. We detect the aerosol concentration C ( t ) through the optical signal S ( t ) of the near-infrared light (wavelength centered at 880 nm) scattered from the high-concentration airborne particles in e-cigarette aerosols. The optical signal S ( t ) is proportional to the optical power transmitted through the active area of the photodiode. Since the size of the active area is a constant value, the optical signal is proportional to the intensity of the scattered light. Figure 1b shows an optical signal acquired from one puff. Consider the simplest scenario of photometric measurement, C ( t ) is approximately proportional to S ( t ) , i.e.,
C ( t ) S ( t )
The pressure sensor measures the real-time absolute air pressure, given as P ( t ) , inside the aerosol delivery passage from a location between the atomizer and the mouthpiece. When a user draws a puff at the mouthpiece of the e-cigarette, a differential pressure, Δ P ( t ) , referred to as "inhalation pressure" in this article, is applied between the air inlet and the mouthpiece to drive the flow of aerosol across the atomizer. Consider the pressure at the air inlet being equal to the ambient air pressure P a m b , the inhalation pressure Δ P ( t ) = P a m b P ( t ) . Figure 1c shows the inhalation pressure acquired from the same puff associated with the optical signal in Figure 1b. Consider an e-cigarette aerosol is a pressure-driven turbulent flow, the flow rate is approximately proportional to the square root of the pressure drop [36,54]. For simplicity, if we ignore the effects of other factors such as aerosol temperature, humidity, and concentration, the relation between volumetric flow rate and inhalation pressure can be given as
Q ( t ) Δ P ( t )
Based on the relations given in Equations (2) and (3), the mass of TPM in the puff, M p u f f , in Equation (1) can be given by
M p u f f = α S ( t ) Δ P ( t ) d t
where α is a coefficient to be determined by calibrating the sensor according to known references. Based on M p u f f , the nicotine yield in the puff is estimated based on the weight concentration of nicotine in the e-liquid. For example, the sensor signals shown in Figure 1b,c have measured 3.38 mg mass of TPM and estimated 35.5 μ g nicotine yield, in the puff.

3. Materials and Methods

3.1. Prototype of E-cig Topography Sensor and Smart E-cigarette

Major components of our e-cig topography sensor assembly and a prototype of smart e-cigarette are shown in Figure 2. For the photometric sensor, this work implements a commercial optical sensor MAX30105 (manufactured by Maxim Integrated), which was pre-soldered on a breakout board (manufactured by Pimoroni). For the pressure sensor, we use a commercial gas sensor, BME680 (manufactured by Bosch) pre-soldered on a breakout board (manufactured by Adafruit). BME680 sensors have been used to detect gas-phase components in indoor e-cigarette aerosols that were released into a room [55]. In our previous work, we implemented the BME680 sensor to measure the temperature and VOCs of e-cigarette aerosols [45]. The micro-controller unit (MCU) used in this work is a M5-StickC-plus (manufactured by M5STACK), comprised of an ESP32 microprocessor (manufactured by Espressif), a built-in battery, a color display, push buttons, and a wireless communication module. The MCU was programmed using Arduino C. The MAX30105 and BME680 sensors were both connected with the MCU through inter-integrated circuit (I2C) communication protocol. The MCU was connected to a lab computer via Bluetooth to communicate all the sensor data wirelessly. The sensor’s reading was displayed on the screen of the MCU and the detailed data analysis was carried out using a MATLAB script. A photograph of the sensor assembly is shown in Figure 2b, and the integrated smart e-cigarette device based on a commercial e-cigarette module is demonstrated in Figure 2a.
Figure 2a shows the commercial e-cigarette module used in this work, an Aspire Nautilus Prime X vaping mod, equipped with a BP clearomizer comprising a BP sub-ohmic mesh coil. The labeled electrical resistance of the coil is 0.3 Ω , and the measured value is 0.29 Ω . The e-liquid used in this work is BB VAPES BRVND ENVY, with a labeled nicotine concentration of 11.75 mg/mL. The e-liquid has a labeled base material comprised of 70% vegetable glycerin (VG) and 30% propylene glycol (PG). The density of the e-liquid is about 1.12 g/mL, and the calculated weight concentration of nicotine is 1.05 wt% accordingly, which was used in estimating nicotine yield from the mass of TPM. The housing and retaining frame of the e-cig topography sensor were designed with SOLIDWORKS and 3-D printed using PLA plastic, as shown in Figure 2a. There are ports to house the sensor breakout boards to access the e-cigarette aerosol, and the aerosol passage at the center is connected to the mouthpiece of the e-cigarette module. All connections and ports were sealed with soft silicone to be air-tight. The constructed smart e-cigarette is larger than regular e-cigarette devices but is still sufficiently compact for a hand-held device, as shown in Figure 2d,e.

3.2. Sensor Signal Processing

Figure 1d shows the schematic of using MAX30105 sensor for conducting the photometric measurement of an e-cigarette aerosol. The three LEDs emit light at center wavelengths of 527 nm (green LED), 660 nm (red LED), and 880 nm (near-infrared LED), respectively. They are switched on/off in an alternating fashion such that only one color of light is detected by the photodiode at a time. The light absorbed in the active area of the photodiode generates a photocurrent, which is proportional to the optical power of light. The photocurrent is converted into a voltage signal, which is then digitized into an integer value using 14-bit analog-to-digital conversion. As a result, the output of the MAX30105 is a number which is proportional to the optical power absorbed by the photodiode. All three wavelengths have been individually tested in our experiments and the results from the near-infrared wavelength have been found to perform the best. Therefore, in this work, only the near-infrared wavelength is used.
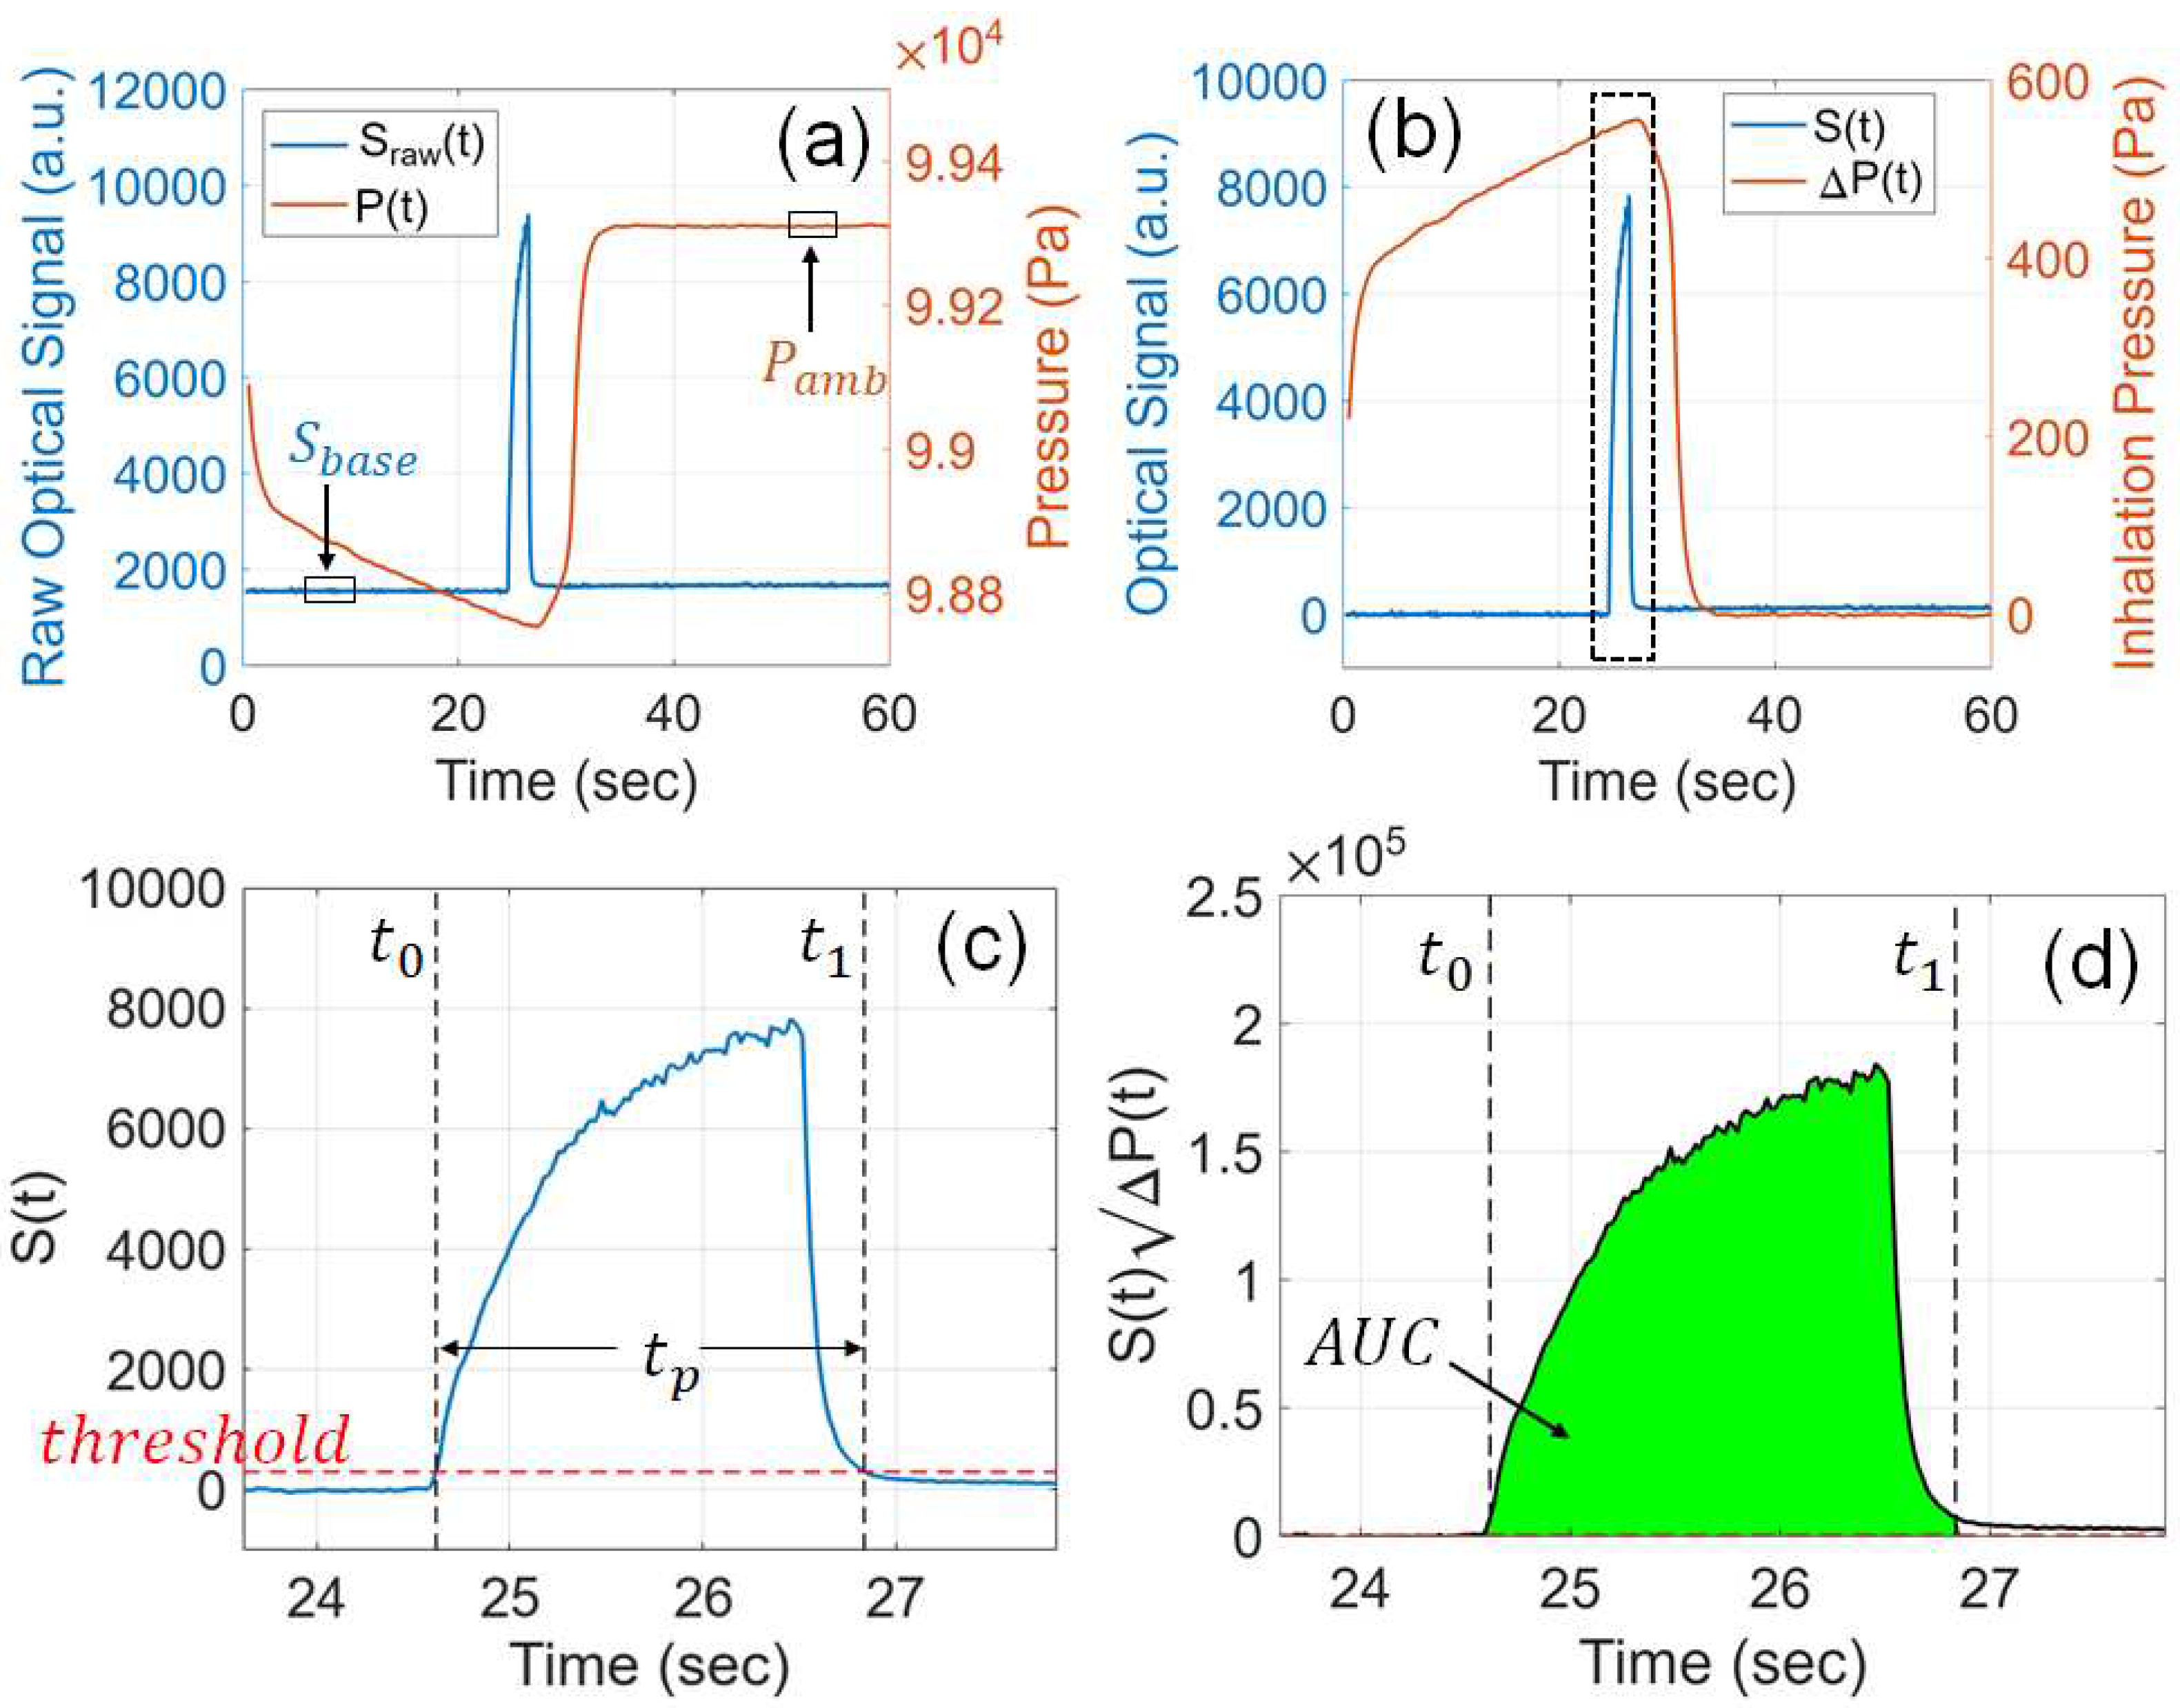
Figure 3a shows one raw optical signal, S r a w ( t ) , acquired from the sensor when testing the smart e-cigarette with the vaping machine. The data sampling rate of the optical signal is 50 Hz, and the sampling interval is 20 ms, which is sufficient to resolve the rising and falling optical signal triggered by the generated e-cigarette aerosol. For all experiments in this work, sensor signals were acquired for a duration of 60 sec. This duration is much longer than the practical puff duration of a regular e-cigarette puff, however, it is necessary for the purpose of synchronizing data acquisition sequence of the e-cig topography sensor with the control sequence of the vaping machine. At the beginning of the raw optical signal, there was no e-cigarette aerosol, and the baseline signal, S b a s e , was calculated by the average of S r a w ( t ) during the window between t = 5 sec and t = 10 sec (marked on Figure 3a). The actual optical signal, S ( t ) , shown in Figure 3b, was calculated by subtracting the baseline signal from the raw signal, i.e. S ( t ) = S r a w ( t ) S b a s e , in order to correct the sensor’s response to zero aerosol.
Similarly, the signal from the pressure sensor, P ( t ) , is also plotted in Figure 3a. The BME680 detects the air pressure through piezoresistors which can measure the mechanical stress or strain induced by a membrane displaced by the applied air pressure. The data sampling rate of pressure signal is 5 Hz, and the sampling interval is 200 ms. Since the sampling rate for pressure is lower than that for the optical signal, the acquired pressure signal was interpolated at the time steps of the optical signal. A negative pressure can be clearly observed when the aerosol is being drawn out of the device. The ambient pressure, P a m b was calculated by the average of P ( t ) during the window between t = 50 sec and t = 55 sec (marked on Figure 3a) after the pressure has reached the stable ambient pressure after the puff. The inhalation pressure, Δ P ( t ) , calculated as Δ P ( t ) = P a m b P ( t ) , is plotted in Figure 3b.
The e-cigarette aerosol is detected only when S ( t ) is above a threshold, as illustrated in the magnified view of signals in Figure 3c. In this work, a threshold of 300 is applied in all signal processing. Each puff lasts from time stamp t 0 to t 1 , which is located by the threshold. The puff duration is given by t p = t 1 t 0 . The puff duration measured in this approach is longer than the activation time of atomizer because the aerosol still lasts for a brief duration after the atomizer begins to cool down. Our definition of puff duration is slightly different from that given by CORESTA [43], but the insights that can be derived from the measured values are the same.
In the signal processing, the numerical calculation of mass of TPM, according to Equation (4), is carried out as
M p u f f = α t 0 t 1 S ( t ) Δ P ( t ) d t = α A U C
where A U C is the area under the curve (numerical integral) of S ( t ) Δ P ( t ) , as plotted in Figure 3d.
For all experiments in this work, this algorithm of signal processing was implemented into the MCU of the e-cig topography sensor through the Arduino C code. The measurement results were automatically displayed on the screen of the smart e-cigarette after each acquisition. The same algorithm was also applied when post-processing the collected sensor data using the MATLAB script.
Figure 3. Algorithm for sensor signal processing. (a) Raw signals collected from the photometric sensor and the pressure sensor. (b) Baseline-subtracted optical signal and inhalation pressure. (c) Determination of the puff duration with a threshold on the optical signal. (d) Calculation of the numerical integral of S ( t ) Δ P ( t ) during the identified puff.
Preprints 86539 g003

3.3. Vaping Machine and Reference Measurement
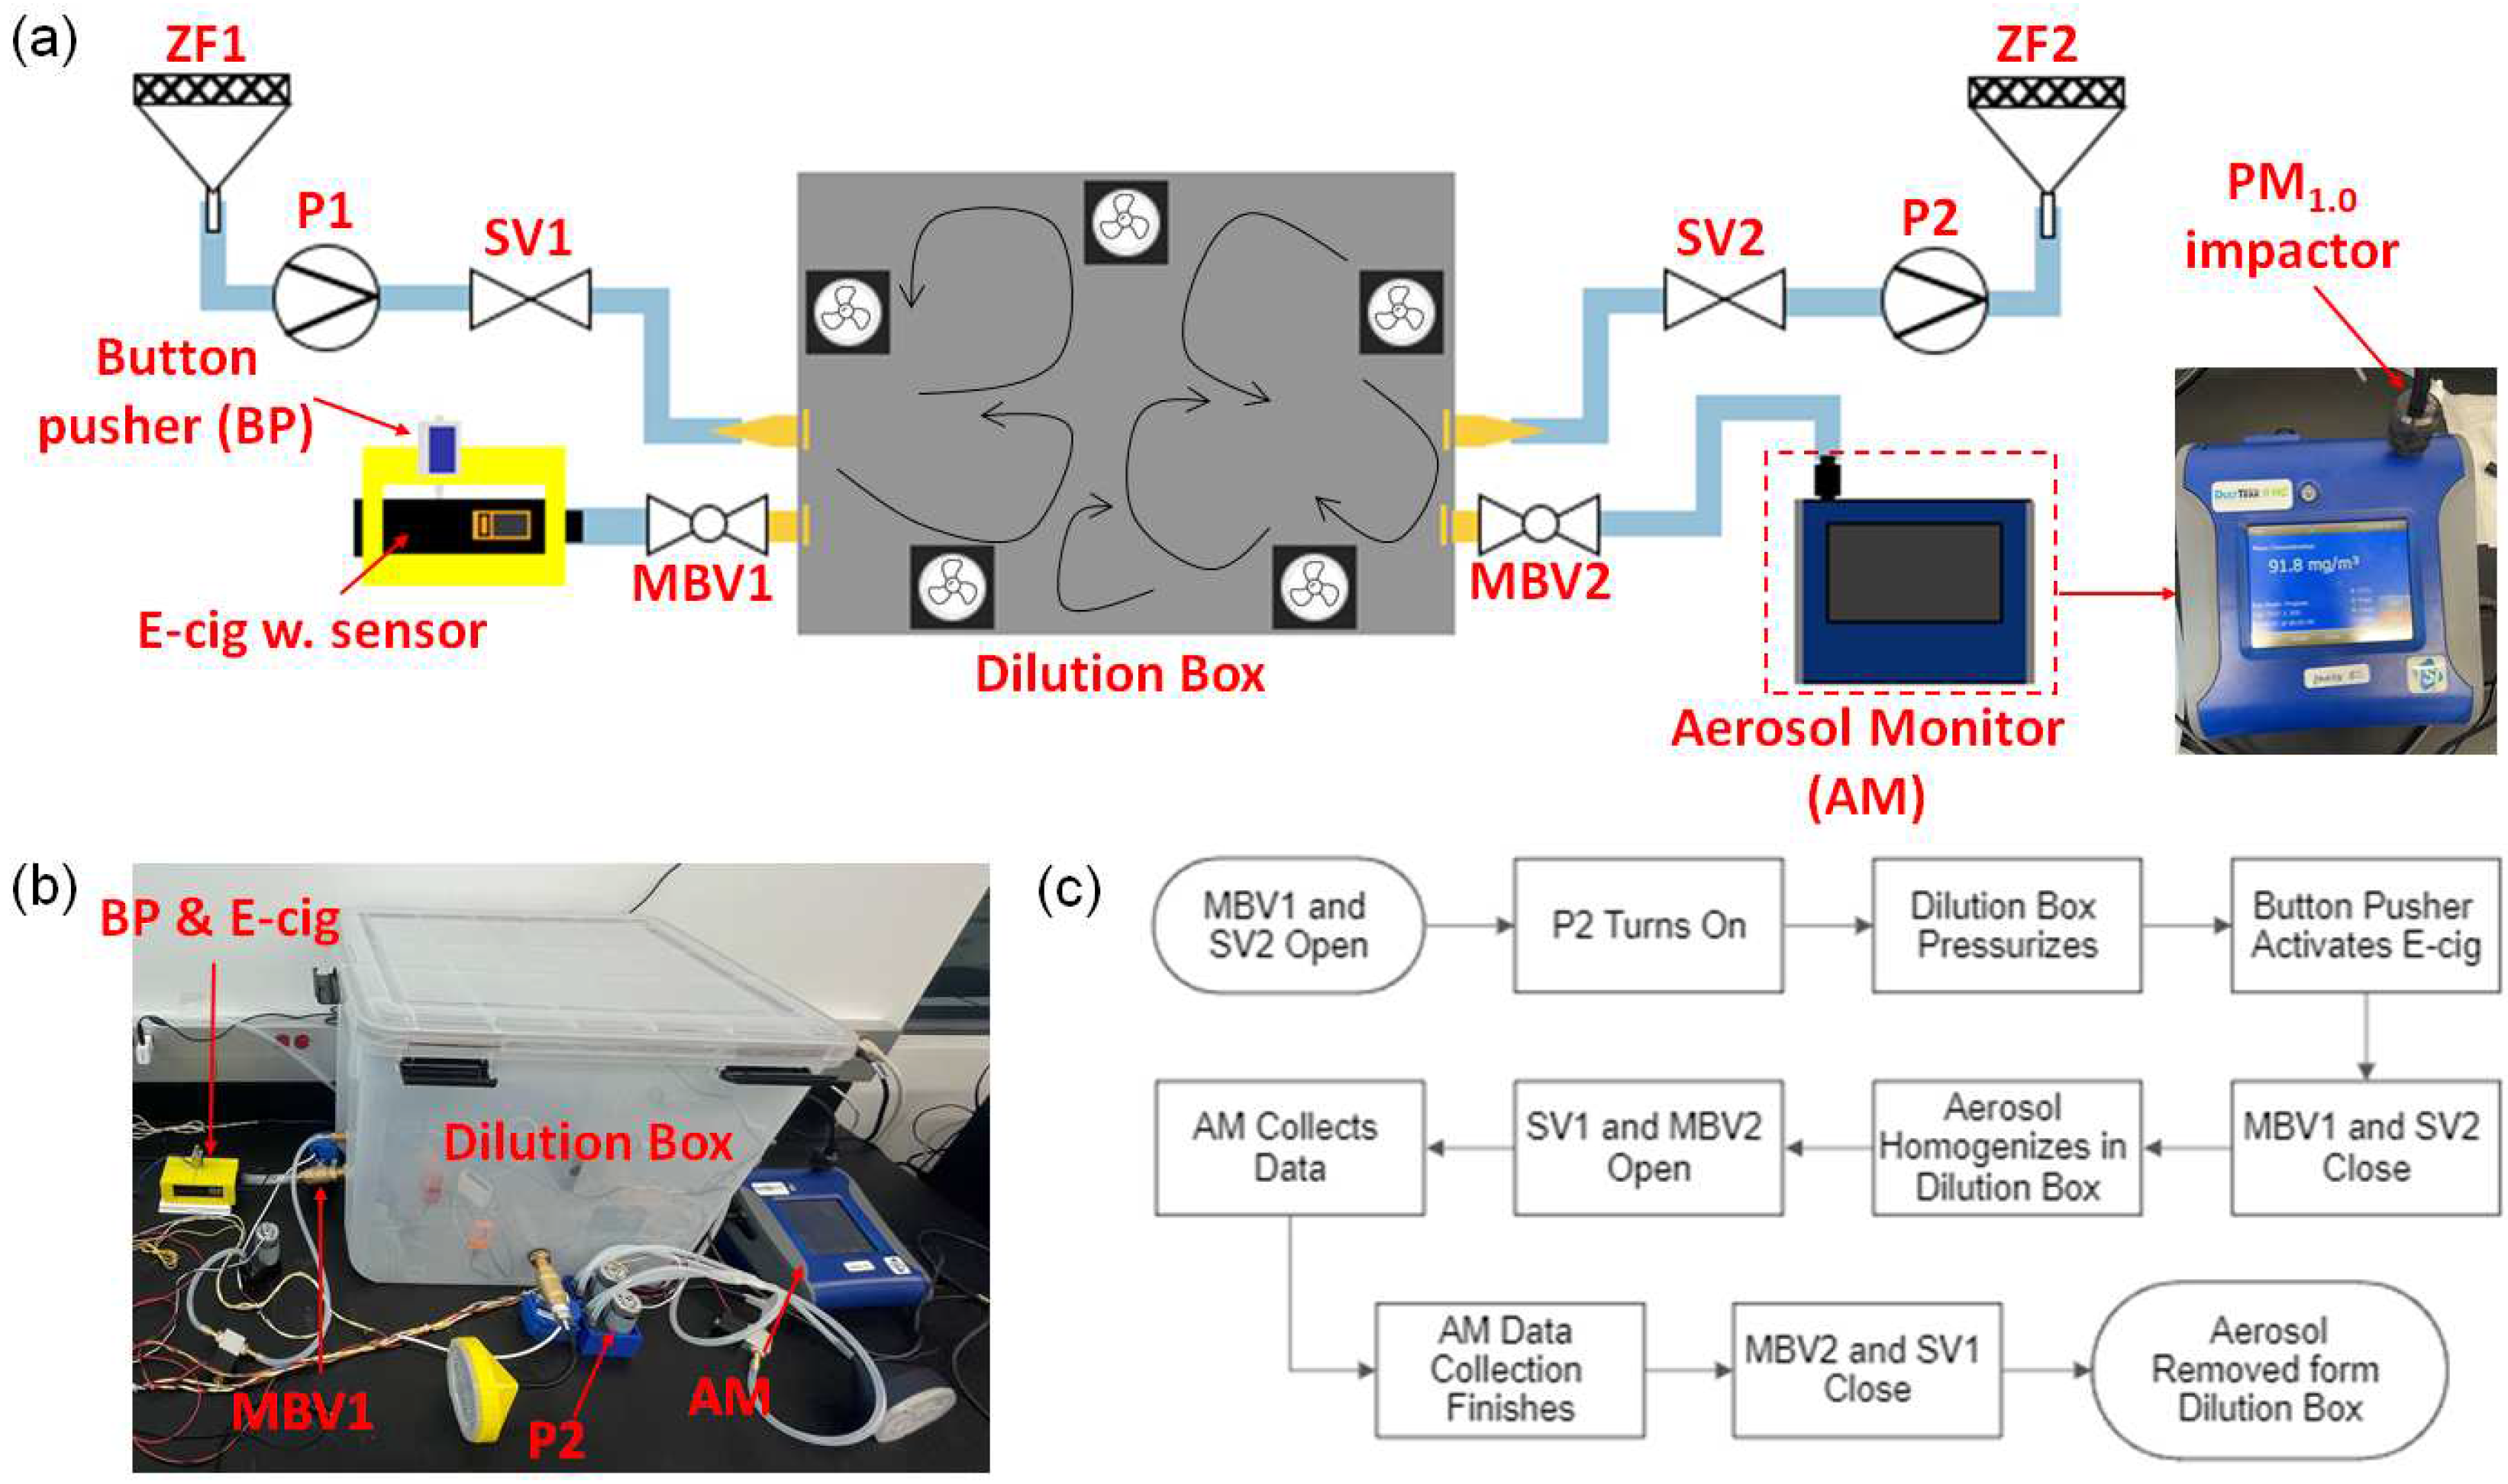
In order to calibrate and validate the response of our e-cig topography sensor, the mass of TPM in the e-cigarette aerosols need to be measured from both the e-cig topography sensor and a reference aerosol setup, simultaneously. In this work, we implemented a home-made vaping machine and a commercial aerosol monitor, DustTrak II 8530 (manufactured by TSI), in the reference measurement setup, as shown in Figure 4. The upper limit of the working range of the aerosol monitor (AM) is 400 mg/m 3 . Since the concentrations of e-cigarette aerosols are much higher than this limit, the generated e-cigarette aerosols must be diluted before the measurement. We implemented a dilution box, with a volume V b o x = 0.0946 m 3 , to dilute the aerosol by a factor ranging from 300 to 1000. For a given puff, all the PM in the generated e-cigarette aerosol was captured and homogenized inside the dilution box. The concept of our reference measurements based on aerosol dilution shares similarities with the experimental setup used by Sousan et al. [56]. Multiple fans were installed inside the dilution box to create chaotic flows to quickly homogenize the e-cigarette aerosol within 20 seconds, which was verified by readings from multiple miniature optical particle counters (PMSA003, manufactured by Plantower Technology) installed at different locations inside the dilution box.
The mass concentration of the diluted aerosol, C A M , was measured by the aerosol monitor. Accordingly, the reference measurement result of mass of TPM in each puff, M R e f , is calculated by
M R e f = C A M V b o x
A PM 1.0 impactor plate was installed at the inlet of the aerosol monitor to measure particles smaller than 1.0 μ m. According to existing studies, the PM in e-cigarette aerosols, when evaluated by mass concentration, are mostly fine particles [26,39,40,41,42,56]. In our experiments, we have tested both PM 1.0 impactor and PM 2.5 impactor, and found that PM 1.0 is at least 97% of PM 2.5 , which is consistent with the reported trends [42,56]. The aerosol monitor used in this work can detect particles as small as 0.1 μ m. Therefore, our reference measurements can effectively measure the mass concentration of PM in the particle size range of 0.1 μ m to 1.0 μ m. Based on the reported results, our detection range can effectively cover the total mass of PM in the e-cigarette aerosols [26,39,41,42,56]. Additional correction coefficients, which can be attained from gravimetric methods or more advanced aerosol instruments (such as SMPS), may be applied on our reference measurement results to further improve the accuracy. However, such improvements are expected to be marginal and the insights will not deviate from our findings based on this setup.
In our vaping machine, the switch button of the e-cigarette was automatically activated by a solenoid button pusher (BP), with a 3D-printed housing to fix the smart e-cigarette and the button pusher together. All the valves, pumps, and the button pusher were automatically controlled through relays, which were further controlled by a programmed Arduino Mega2560 MCU. In order to minimize the loss of e-cigarette aerosols in the tubing and valves, motorized ball valves (MBVs), with a wide inner diameter (ID) of 0.5 inch, were used as valves to pass aerosols, such as MBV1 and MBV2 marked in Figure 4a. For valves passing clean air, regular solenoid valves (SVs) with narrow passages were used, such as SV1 and SV2. Air pumps, P1 and P2, were installed to drive the flow of clean air, which had been filtered with HEPA zero filters (ZFs), such as ZF1 and ZF2.
A photograph of the experimental setup is shown in Figure 4b, with key components marked in the photograph. Figure 4c shows a flow chart of the control sequence used for every reference measurement. Before the measurement, clean air was filled inside the dilution box through ZF1, P1 and SV1 to purge all PM out of the box. When an acquisition sequence was activated by the Arduino Mega2560 MCU, valves MBV1 and SV2 opened, and P2 turned on to pump the air out of the dilution box to create a negative pressure in the dilution box. This negative pressure serves as the inhalation pressure mimicking a user’s inhalation. The peak inhalation pressure Δ P m a x was controlled by the duration of pumping, t v a c , in this step. When t v a c was varied from 28 sec to 112 sec, Δ P m a x changed from about 280 Pa to 600 Pa. Near the end of the pressurization, the button pusher was activated to push the switch button of the e-cigarette for the preset duration, t b t n . The generated e-cigarette aerosol was first measured by the e-cig topography sensor inside the e-cigarette device, and then passed through MBV1 to enter the dilution box. There was a delay of 1 sec from the end of the button pusher activation to the beginning of closing MBV1 to allow sufficient time to capture all generated aerosols in the dilution box. After all aerosol has been captured inside the dilution box, MBV1 and SV2 closed and the aerosol was mixed with clean air to get homogenized in the box for 20 sec. After the aerosol got homogenized in the dilution box, SV1 and MBV2 opened, and the aerosol monitor (AM) switched on to measure the mass concentration of the diluted aerosol at a flow rate of 3 L/min. After AM collected the data, valves MBV2 and SV1 closed, and the box was thoroughly cleaned by removing all aerosols inside the box. The cleanness of the air in the box was confirmed by the reading of particle counters inside the box. Then, the vaping machine was ready for the next measurement. After a few experiments, residues were observed on the inner wall of the box, however, these residues adsorbed on the wall will not affect the PM of the aerosol inside the box, which was also confirmed by the particle counters inside the box.
This control sequence for reference measurements was activated by the Arduino Mega2560 MCU while the data acquisition sequence of the e-cig topography sensor was triggered by the MCU on the sensor. In our experiments, these two sequences were started separately and manually. As a result, there can be a random time shift, up to 15 sec, between the two sequences. Ideally, the aerosol should begin to appear in the optical signal around the same time stamp for all experiments. However, due to this artifact of random time shift between two sequences, the signals can occur at a shifted time stamp, as can be seen from certain graphs of this article. To deal with this time shift, we acquired signals for a very long duration of 60 sec for each puff, which can ensure that the sensor signals are completely collected when the aerosol is generated through the vaping machine during this long time frame. It should be noted that such a long duration of acquisition is only necessary for synchronizing the two sequences to compare the sensor’s reading with the reference measurement. For practical applications of the e-cig topography sensor alone inside an e-cigarette, the duration of signal acquisition can be shortened into a few seconds or automatically adapted according to the user’s actual puff duration.
Figure 4. Experimental setup for reference measurements of mass of TPM in the puff. (a) Schematic of the experimental setup. (b) Photograph of the constructed setup with a home-made vaping machine. (c) Flow chart of the control sequences used in each measurement of e-cigarette aerosols.
Preprints 86539 g004

3.4. Sensor Calibration

The e-cig topography sensor’s response was calibrated according to the reference measurements. The goal of the calibration is to find a calibration coefficient, α , to make the sensor’s reading, M p u f f , match the reference measurement, M R e f . In our experiments of calibration, we used the following default configuration of the smart e-cigarette and the vaping machine: 30 W atomizer power, 2.0 sec button pusher duration, 54 sec pressurization time of the dilution box. From each experiment, the calibration coefficient was calculated based on the following equations:
M p u f f = M R e f
α = C A M V b o x / t 0 t 1 S ( t ) Δ P ( t ) d t
The experiments were repeated three times and the calibration coefficient was decided from the average of three trials. This coefficient was thereafter applied to the MCU of the e-cig topography sensor to directly measure the mass of TPM in each puff. The detailed results of calibration experiments are summarized in Table A2. For all experiments shown in this article, our sensor has been calibrated twice. Before the experiments on testing the atomizer power, puff duration, and inhalation pressure, the sensor was calibrated and the attained coefficient, α 1 = 3.5129×10 5 , was applied to these tests. After running over 100 puffs with this setting, the BME680 sensor was removed from the device to clean the deposits of e-liquid on the sensor surface, and then re-installed into the device. It was found that the re-installed sensor has slightly different air flow resistance and has to be calibrated again. The coefficient attained from the second calibration, α 2 = 3.3322×10 5 , was applied in the experiments for testing the cold atomizer coil and for tracking one user’s puff topography.

3.5. Sensor Validation

To validate the reading of our e-cig topography sensor and to study the effects of different device operating conditions and user vaping habits on the aerosol output, the smart e-cigarette was configured with various settings and tested in parallel with our reference measurement setup. The reading of the sensor, M p u f f , was directly compared with the reference measurement, M R e f , to evaluate the accuracy of our sensor. The effects of atomizer power, puff duration, and inhalation pressure, were individually experimented. The default settings of the smart e-cigarette and the vaping machine were given by: 30 W atomizer power, 2.0 sec button pusher duration, 54 sec pressurization time of the dilution box. For each set of experiments, one parameter of interest was changed while other parameters were kept at the default setting. Every given setting was tested three times. Statistic quantities, mean and standard deviation, were calculated from the results of three trials and used in the plots with error bars. In order to study the e-cigarette aerosols in steady state, before each set of experiments, the e-cigarette device was operated with 6 puffs to warm up the atomizer coil with inter-puff interval about 3.5 min. All the experimental results of these tests are summarized in Table A3, Table A4 and Table A5.

3.6. Effects of Atomizer Power

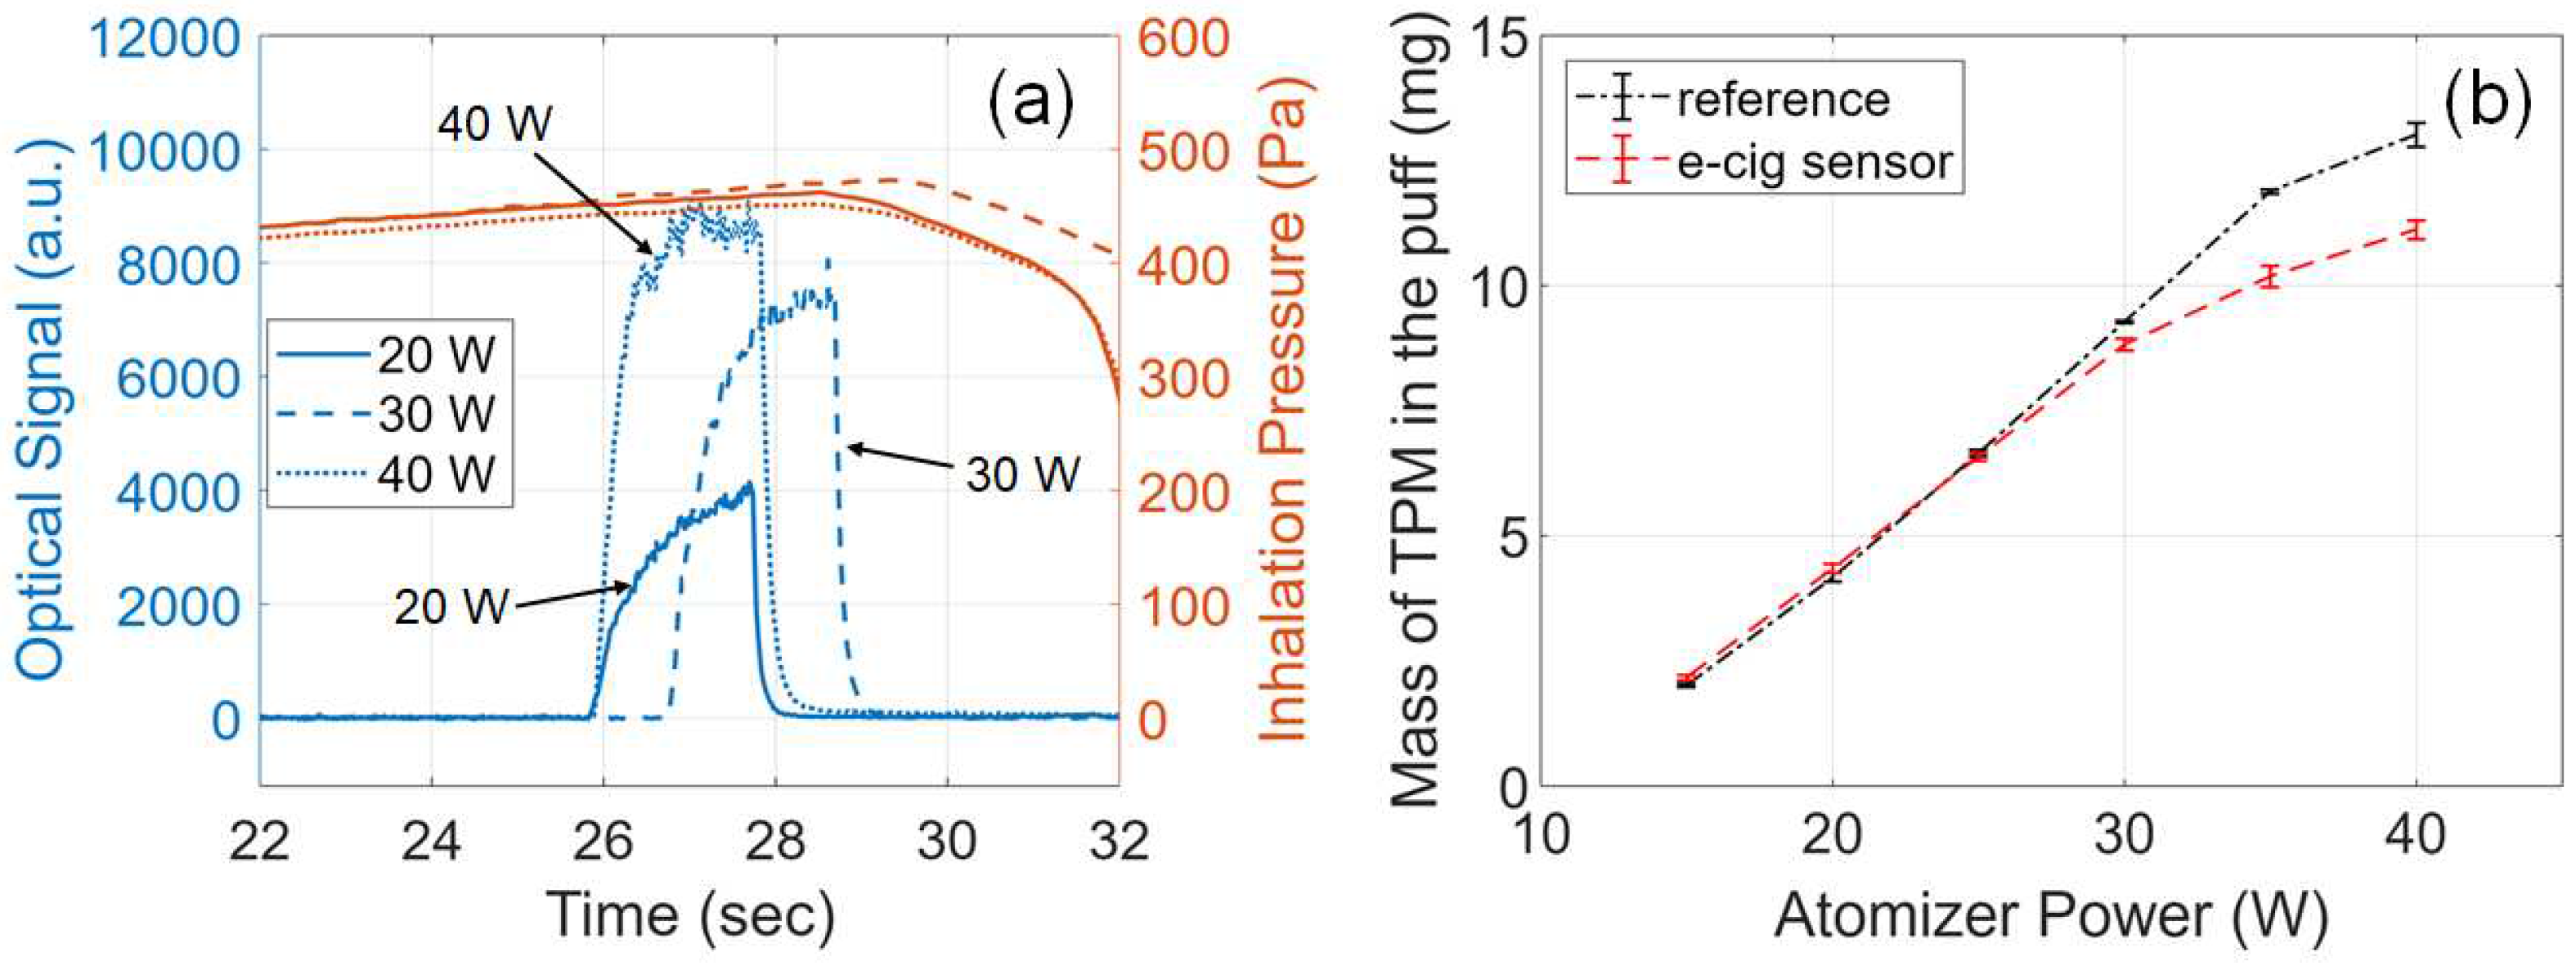
Atomizer power and coil resistance are two of the main factors influencing the PM generated by e-cigarettes. Studies have shown that higher powers produce aerosols with larger mass of TPM per puff [34,38,39,40,41]. To study the effects of atomizer power on the aerosol output, the e-cig topography sensor has been tested by varying the atomizer power from 15 W to 40 W. Other conditions were kept at the default setting: 2.0 sec button pusher duration, 54 sec pressurization time of the dilution box. Three experiments were carried out for each configuration and all results are plotted in Figure 5 and summarized in Table A3.
As shown in the curves plotted in Figure 5a, using a higher atomizer power, a stronger optical signal was attained, which means an e-cigarette aerosol of a higher concentration. In addition, the transient details of the optical signal also suggest that with a higher atomizer power, the aerosol concentration grows to the peak at a faster rate, which is consistent with the expectations as a higher atomizer power gives a higher rate of thermal energy transfer to vaporize the e-liquid. For each condition, the relation between the optical signal and inhalation pressure validates that our home-made vaping machine has consistent and precise controls on the button pusher and the inhalation pressure.
Figure 5b shows the mass of TPM measured from our e-cig topography sensor, compared with the reference measurements. Overall, the results of our sensor match very well with the trend of the reference measurements. For atomizer power lower than or equal to 30 W, the mass of TPM grows almost linearly with increasing atomizer power, which is consistent with the trend reported by Floyd et al. [38]. Particularly, in this range, the relative errors of individual measurements are mostly less than 9%. As listed in Table A3, only one data point, trial No. 3, has a relative error higher than 9%. For atomizer power above 30 W, both the reference and e-cig topography sensor show a nonlinear relation of the mass of TPM versus the power, which is consistent with the logarithmic relation reported by Pourchez et al. [41]. For this range, the relative errors of the e-cig topography sensor have increased into 11%-17%. We attribute this higher error to the optical signals from an aerosol concentration outside the calibrated range. The calibration of our sensor was essentially a single-point linear calibration, carried out at 30 W atomizer power, and the peak optical signal acquired during calibration was around 7500 (Table A2). When testing the atomizer power above 30 W, the peak optical signal has reached higher than 8000 (Table A3), and the optical signal has deviated from the linear dependence versus the aerosol concentration due to multiple scattering of light from high-concentration particles [53].
Figure 5. Effects of atomizer power on the e-cigarette aerosol output. (a) Example signals acquired from the e-cig topography sensor. Plots of sensor signals for different atomizer powers specified by line styles. Solid line: 20 W; dashed line: 30 W; dotted line: 40 W. (b) Mass of TPM in the puff measured from the e-cig sensor (red triangles) and from the reference setup (black circles) versus atomizer power.
Preprints 86539 g005

3.7. Effects of Puff Duration

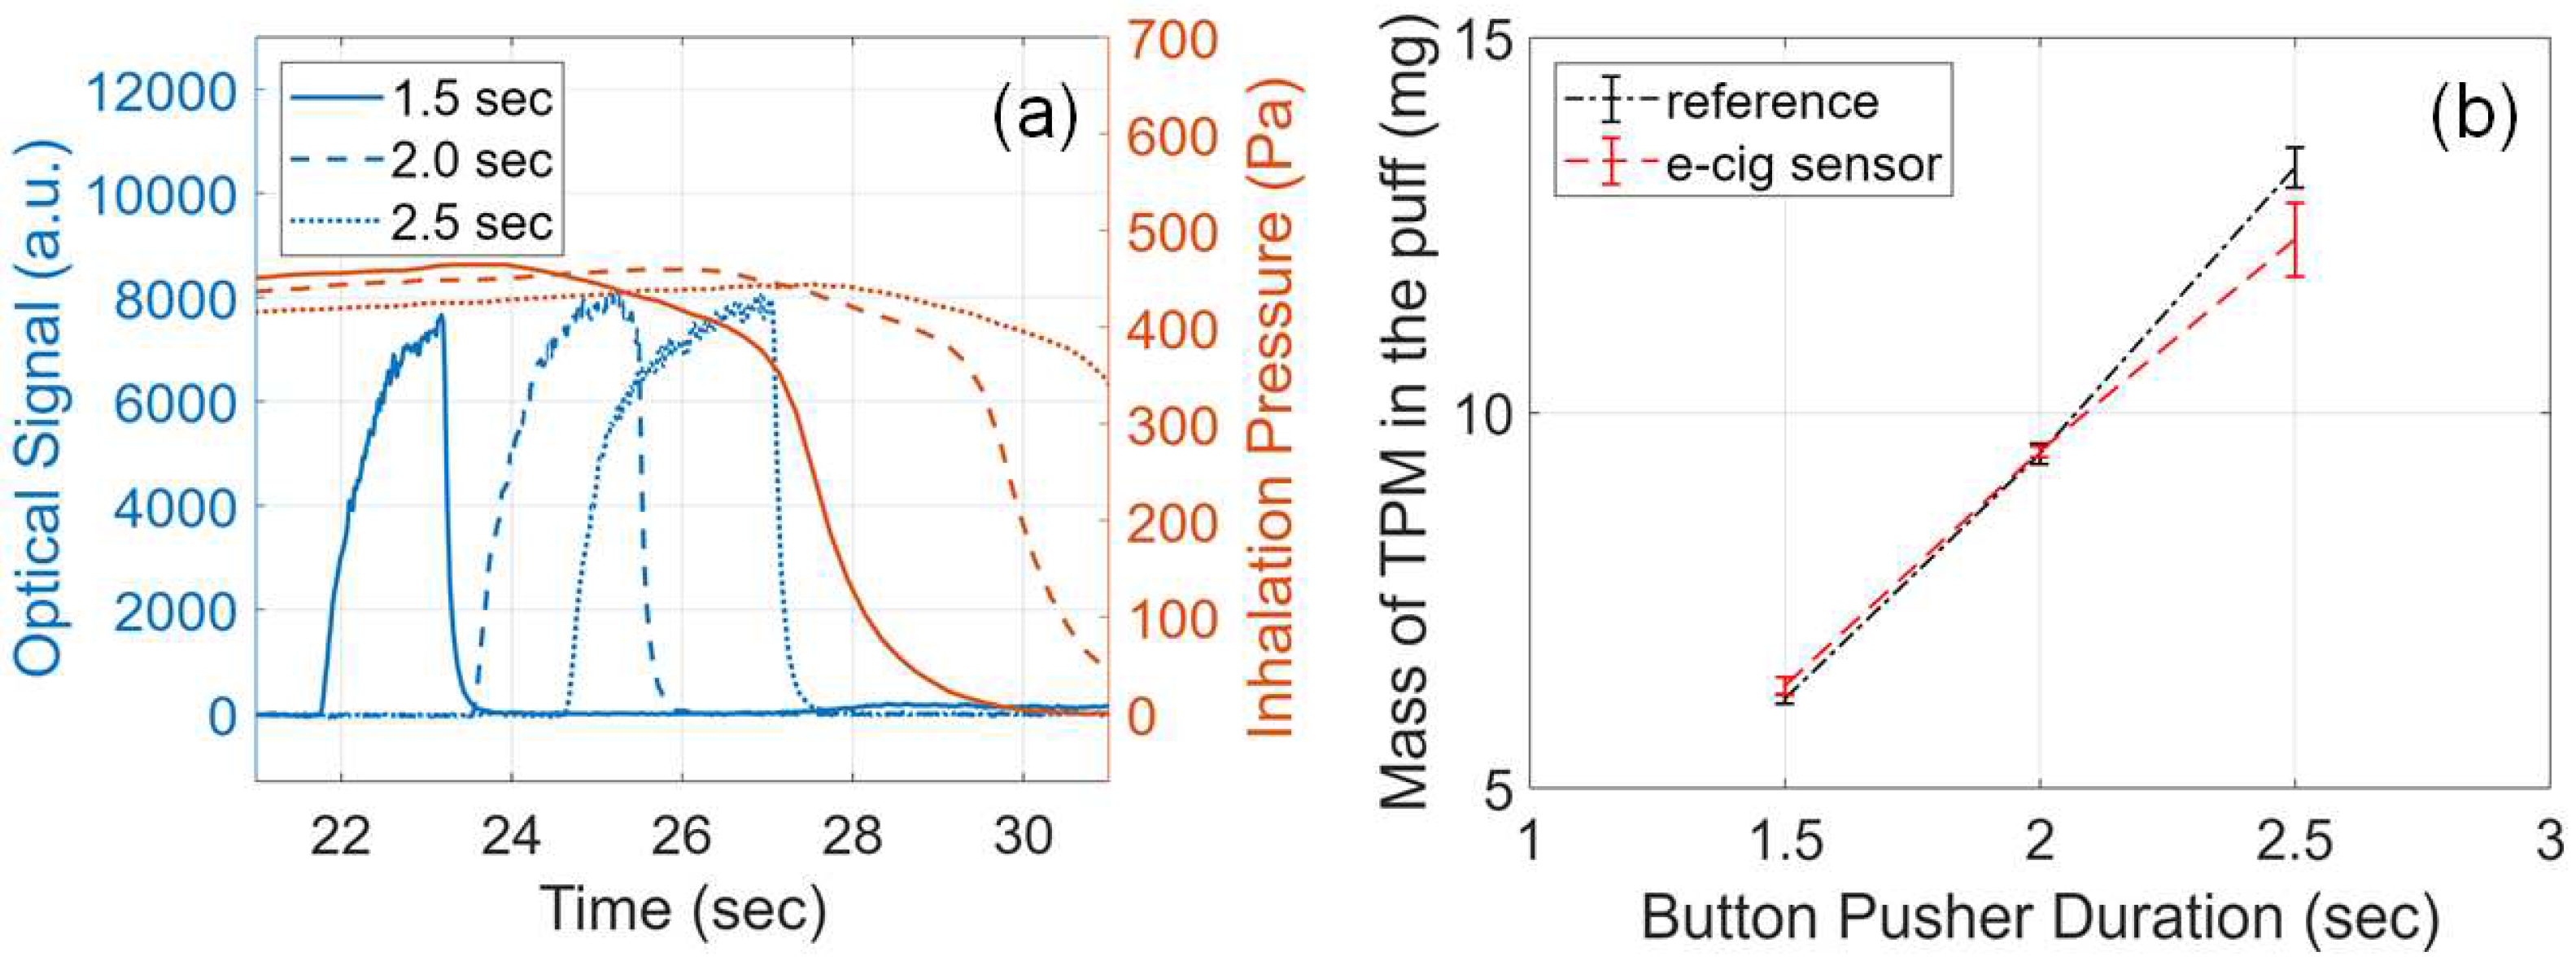
Puff duration affects the e-cigarette aerosol output significantly, as a longer puff duration can activate the atomizer for a longer period and generate more aerosol [26,32]. To study the effects of puff duration on the e-cigarette aerosol output, the e-cig topography sensor was tested by varying button pusher duration from 1.5 sec to 2.5 sec. Other conditions were kept at the default setting: 30 W atomizer power, 54 sec pressurization time of the dilution box. Three experiments were carried out for each configuration and all results are plotted in Figure 6 and summarized in Table A4.
As shown in Figure 6a, with a longer button pusher duration, a longer puff duration can be clearly observed from the wider peak in optical signal. From the data points plotted in Figure 6b, the mass of TPM almost grows linearly with longer button pusher duration, which is consistent with existing studies [26,32]. The data listed in Table A4 show that the relative errors of measurements are mostly less than 6%. Only one data point for 2.5 sec button pusher duration gives a relative error about 11%. This increased error is again related to the higher aerosol concentrations when the button was pressed for a longer duration, as can be seen from the peak optical signal.
Figure 6. Effects of puff duration on the e-cigarette aerosol output. (a) Example signals acquired from the e-cig topography sensor. Plots of sensor signals for different button pusher durations specified by line styles. Solid line: 1.5 sec; dashed line: 2.0 sec; dotted line: 2.5 sec. (b) Mass of TPM in the puff measured from the e-cig topography sensor (red triangles) and from the reference setup (black circles) versus button pusher duration.
Preprints 86539 g006

3.8. Effects of Inhalation Pressure

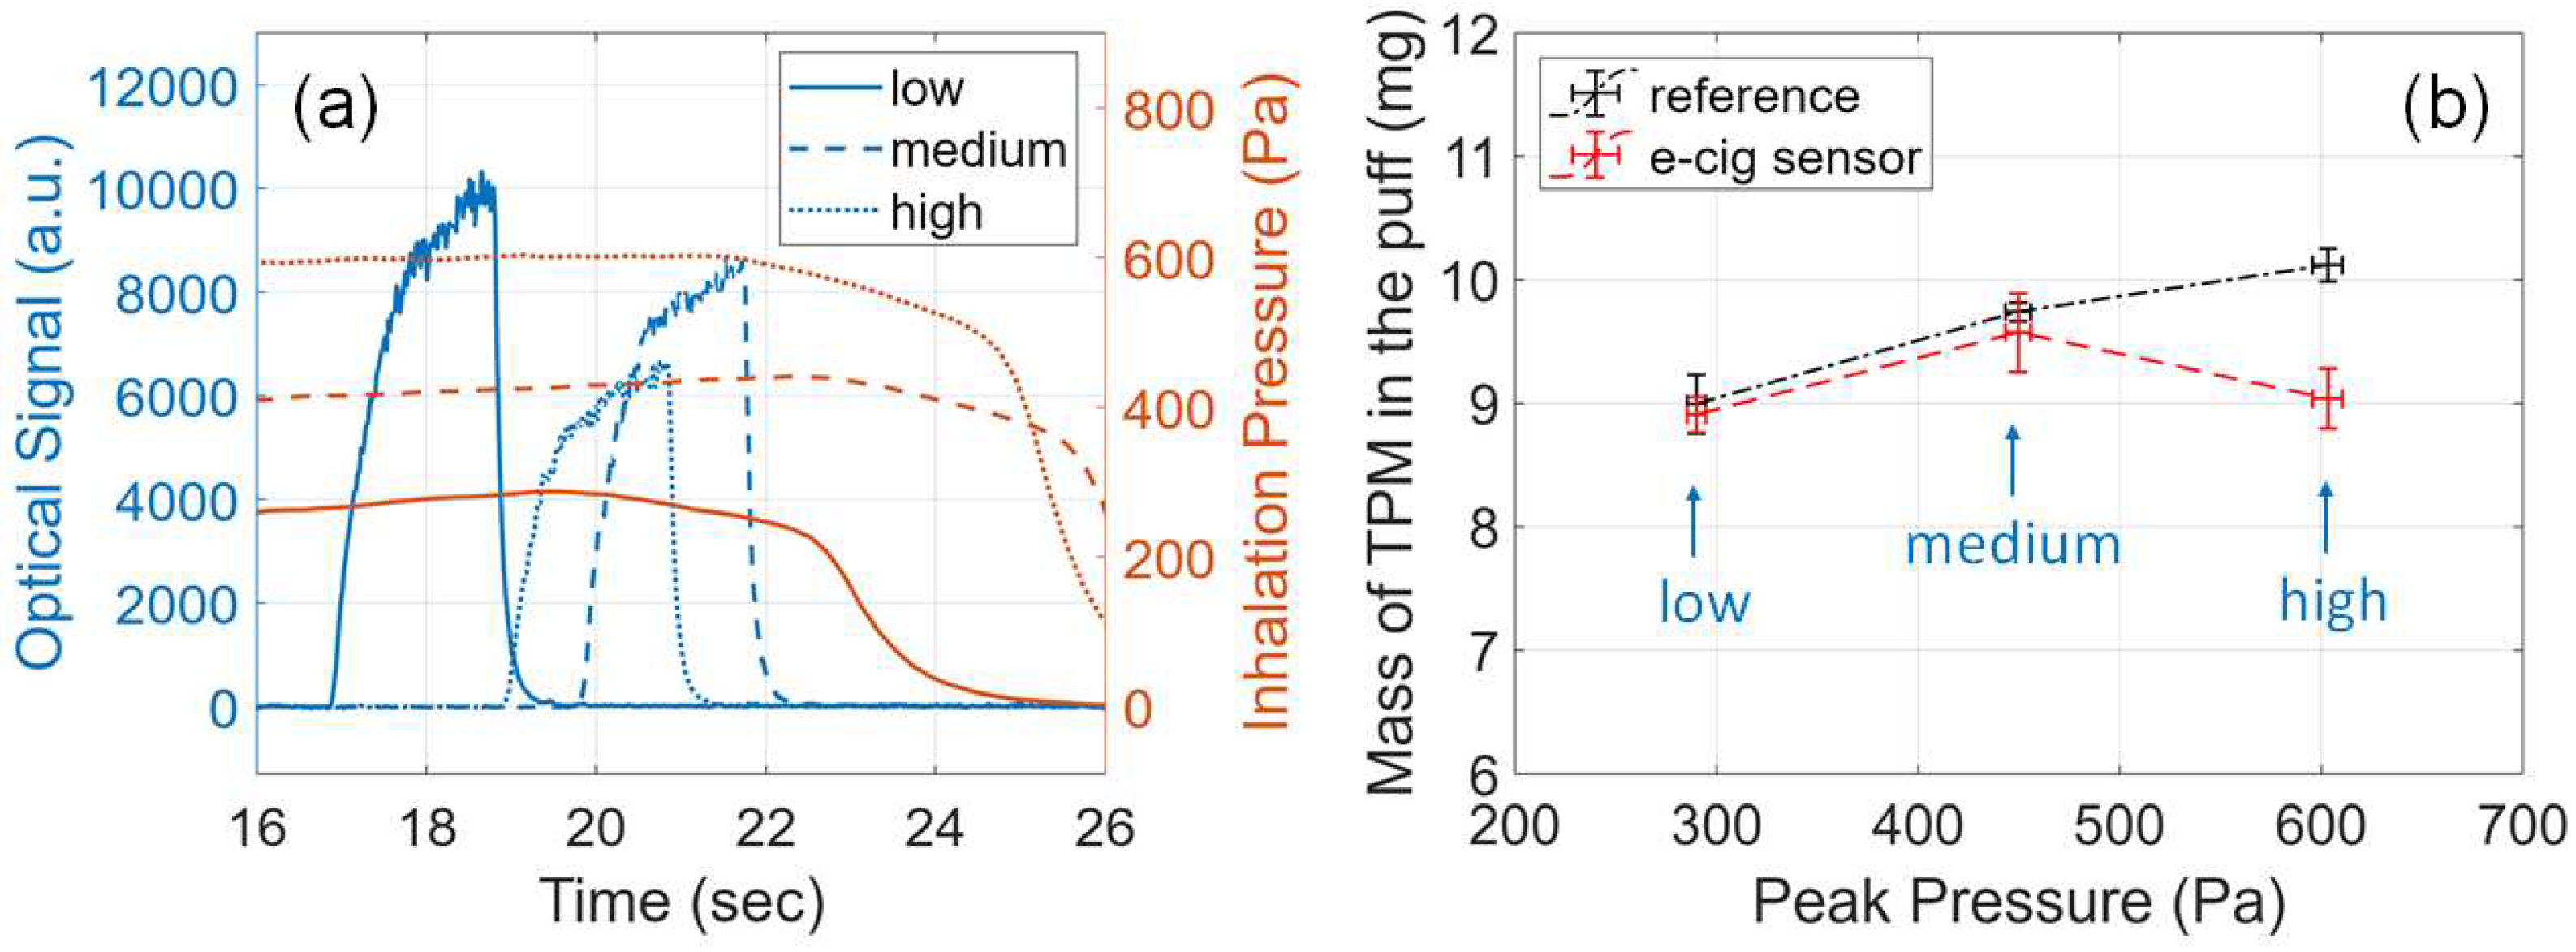
Given an e-cigarette device, the flow rate is determined by the inhalation pressure and the air flow resistance of the device [36,54]. To study the effects of flow rate on the e-cigarette aerosol output, the e-cig topography sensor has been tested with varying inhalation pressure from 300 Pa to 600 Pa. This range has been decided in order to match one user’s inhalation pressure when testing the smart e-cigarette device. The inhalation pressure was controlled through the aforementioned pressurization duration on the dilution box, from 28 sec to 112 sec. Under this range of testing conditions, the volumetric flow rate, measured using a flow meter installed inline with pump P2 in Figure 4a, was found to range roughly from 4.5 L/min to 7.5 L/min. Other conditions were kept at the default setting: 30 W atomizer power, 2.0 sec button pusher duration. Three experiments were carried out for each configuration and all results are plotted in Figure 7 and summarized in Table A5.
As shown in Figure 7a, low pressure (around 300 Pa), medium pressure (around 450 Pa), and high pressure (around 600 Pa), were applied to draw the puffs from the e-cigarette mouthpiece. With a lower pressure and therefore a lower flow rate, the optical signal was stronger, which suggests a higher aerosol concentration, because the generated e-cigarette aerosol was extracted at a lower flow rate. From the reference measurements plotted in Figure 7b, the mass of TPM increases with higher pressure (higher flow rate), which matches the reported trends related to flow rate [35,37]. As shown in Figure 7b and Table A5, for low and medium pressure, the readings of our e-cig topography sensor matched very closely with the reference measurements with relative error lower than 7%. For high pressure (high flow rate), the relative error increased into 9%-13% and the reading of our e-cig topography sensor deviates from the reference measurements. In this work, a simplified relation between flow rate and inhalation pressure, in Equation (3), was used. For higher pressure, this equation requires further corrections to improve the accuracy, which can be achieved by more precise data fitting in the calibration procedure [36].
Figure 7. Effects of inhalation pressure on the e-cigarette aerosol output. (a) Example signals acquired from the e-cig topography sensor. Plots of sensor signals for different inhalation pressures specified by line styles. Solid line: low pressure (around 300 Pa); dashed line: medium pressure (around 450 Pa); dotted line: high pressure (around 600 Pa). (b) Mass of TPM in the puff measured from the e-cig topography sensor (red triangles) and from the reference setup (black circles) versus peak inhalation pressure.
Preprints 86539 g007

3.9. Effects of Cold Atomizer Coil

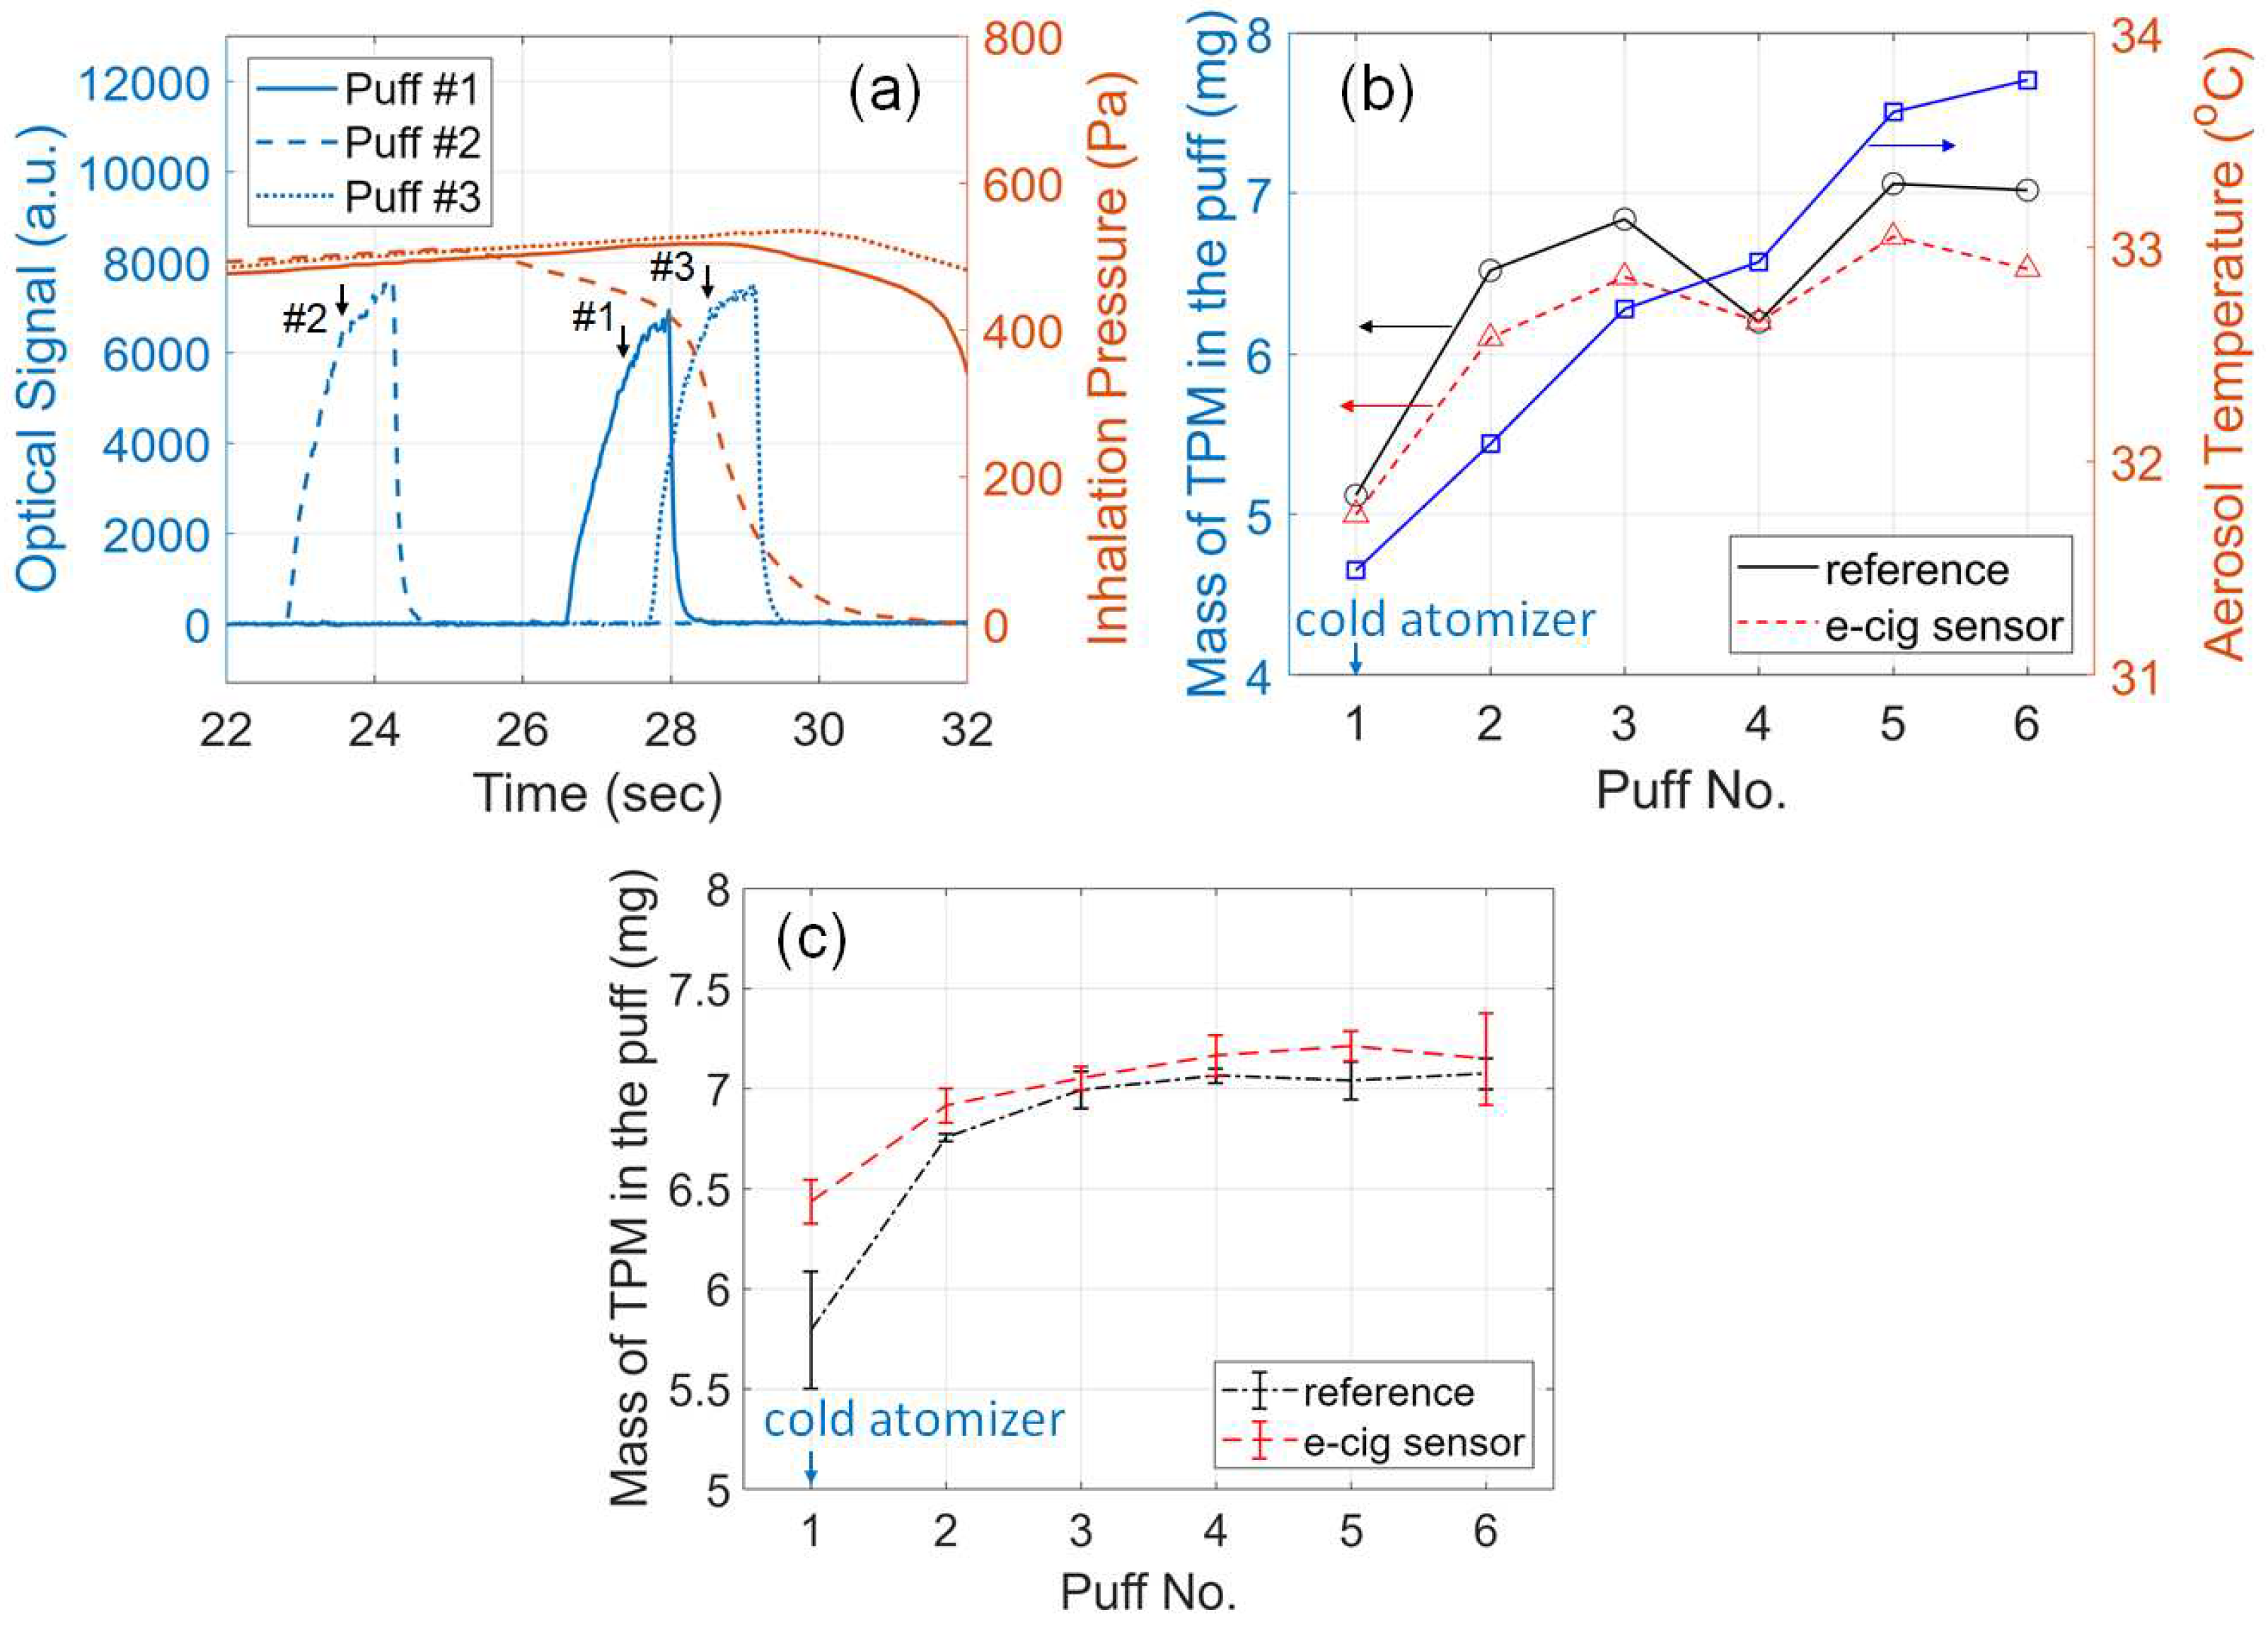
When an e-cigarette operates from a condition of a cold atomizer coil (at ambient temperature), referred to as "initial state", the aerosol output is significantly lower than that from a coil that has already been warmed up after a few puffs, known as "steady-state" [6]. To study the effects of the atomizer condition, the smart e-cigarette was tested starting from a condition when the atomizer coil was cold, and 6 puffs were experimented continuously with inter-puff interval of 3.5 min. The following setting was used for all the 6 puffs: 30 W atomizer power, 1.5 sec button pusher duration, 54 sec pressurization time of the dilution box. To investigate the temperature-related trends, the aerosol temperature was also collected from the BME680 sensor, using the approach as demonstrated in our previous work [45].
The sensor signals acquired from the first three puffs are shown in Figure 8a and the mass of TPM are given in Figure 8b. Starting from the cold atomizer coil, as more puffs were activated from the e-cigarette, the rising edges of the optical signals became steeper and reached higher amplitudes, as shown in the marked arrows. The mass of TPM in the first puff (for cold atomizer) was noticeably lower than that of the second puff and so on. The aerosol temperature also increased as the atomizer got warmer with more puffs. Both the trend of aerosol output and temperature are consistent with the reported studies [6]. The aerosol output reached the steady state after 5 or 6 puffs. Compared with the reference measurements, the e-cig topography sensor has clearly captured the trends as the atomizer coil gets warmed up. The relative error of the e-cig topography sensor’s reading is lower than 7%, in a level similar with the results in aforementioned tests. To test the repeatability of the trend, the experiments were repeated in another three cycles and the results were plotted in Figure 8c. The trend of increasing e-cigarette aerosol PM output as the atomizer coil gets warmed up can be clearly verified. For the cold atomizer (first puff), the sensor’s reading deviates from the reference measurements more than later puffs, probably due to the effects of air temperature inside the e-cigarette aerosol passage which is experienced by the optical sensor. The sensor was calibrated at the steady state, in which the optical sensor was in a warm environment. For the initial state (first puff), the temperature at the optical sensor was lower than that for the steady state (later puffs), which can cause the optical response to drift a little.
Figure 8. Effects of atomizer condition (cold or warmed-up coil) on the e-cigarette aerosol output. (a) E-cig topography sensor signals acquired during the first three puffs from the smart e-cigarette starting to operate from a cold atomizer coil. The rising edges of the optical signals are marked with arrows. (b) Mass of TPM in the puff measured from the e-cig topography sensor (red triangles), from the reference setup (black circles), and aerosol temperature (blue squares), versus puff number as the coil gets warmed up in one trial. (c) Mass of TPM versus puff number as the coil gets warmed up with experiments repeated in three cycles. Statistic quantities (mean and standard deviation), are plotted.
Preprints 86539 g008

3.10. Tracking a User’s Puff Topography
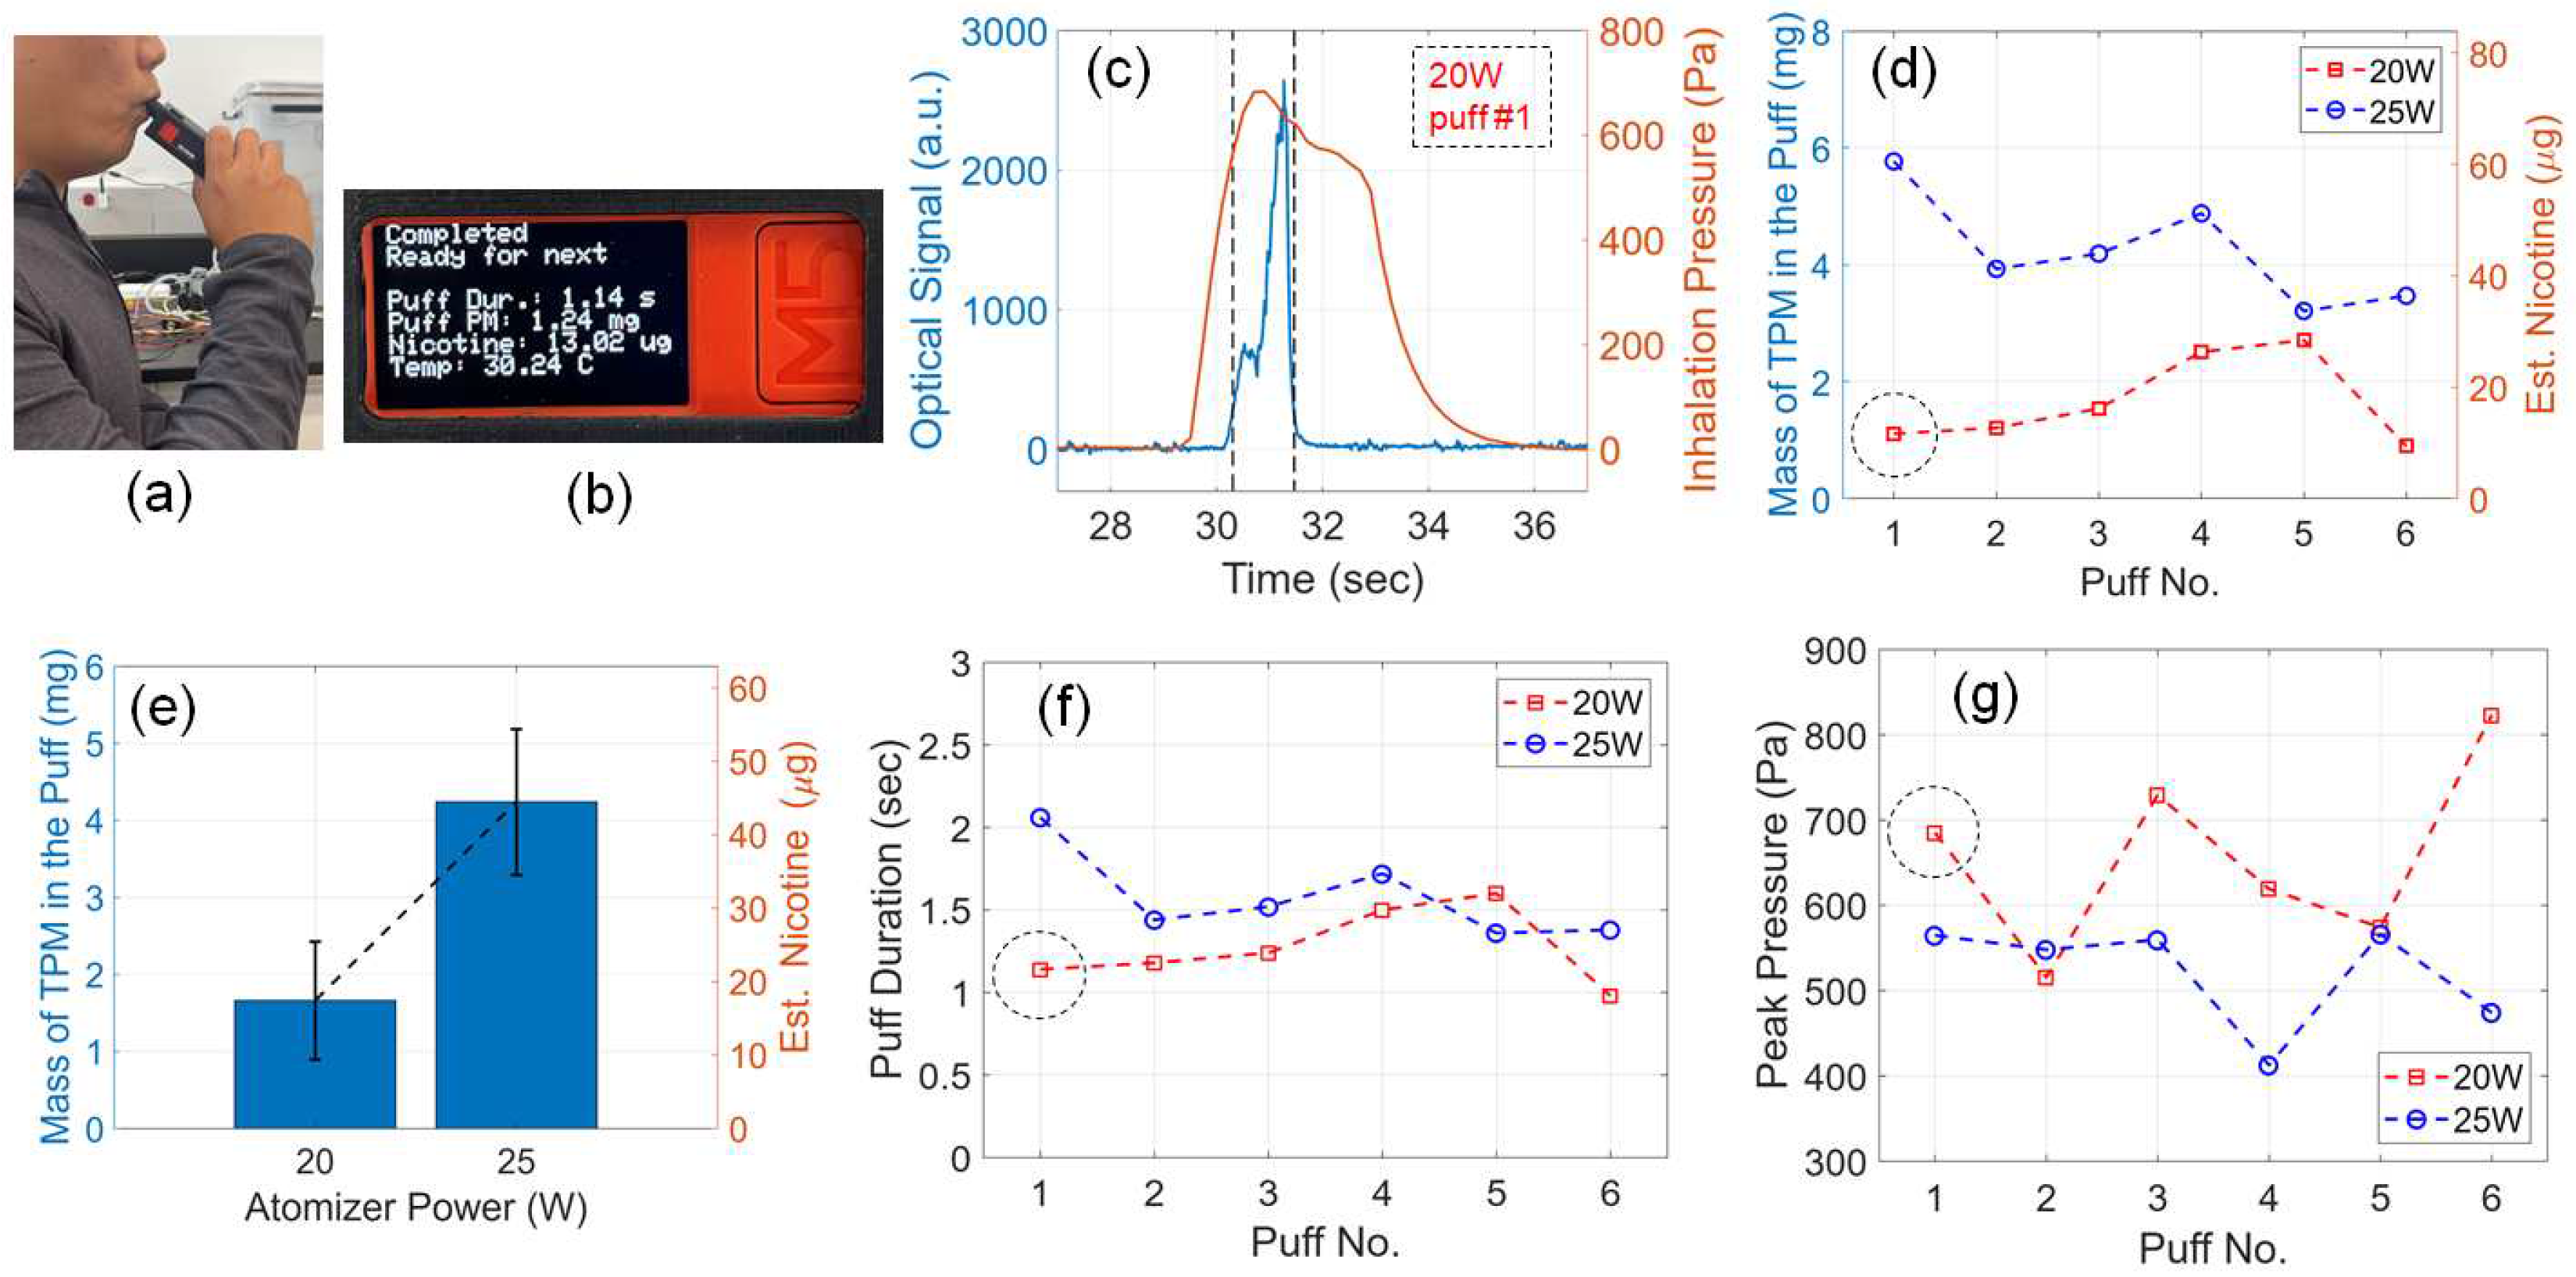
One goal of the e-cig topography sensor is to measure the aerosol output and nicotine yield in each puff, regardless of the device setting of the e-cigarette, the atomizer condition, and the user’s vaping habits. As a proof of concept, the smart e-cigarette was directly tested by a user, one author of this article, with the user’s consent, using the user’s preferred setting of 20 W and 25 W atomizer power, as shown in Figure 9a. For each power setting, the user carried out 6 puffs with the user’s own comfortable puff duration and inhalation pressure. After each puff, the e-cig topography sensor’s reading was displayed on the device, showing the puff duration, the mass of TPM in the puff, the estimated nicotine yield, and the aerosol temperature, as shown in Figure 9b.
Figure 9c shows the sensor signals acquired for the first puff under 20 W atomizer power. It should be noted that the profiles of the signals are different from those acquired when driven by the vaping machine, because of the different fashions in applying the inhalation pressure from the user, compared with that from the vaping machine. Figure 9d shows the aerosol output and nicotine yield for all the puffs. The nicotine yield was estimated based on the weight concentration of nicotine in the e-liquid using the aforementioned approach. For 20 W and 25 W atomizer power respectively, the statistic quantity of the attained 6 puffs was analyzed and plotted in Figure 9e. It can be clearly observed that, when the user applied a higher atomizer power, the aerosol output increased significantly. Such a simplified statistical analysis can provide valuable information on the user’s puff topography. According to the puff duration and peak pressure plotted in Figure 9f,g, the trends of aerosol output are consistent with the aforementioned results attained from the vaping machine, which validated the effectiveness of our e-cig topography sensor in tracking the user’s puff topography. One can observe that, the parameters that are controlled by the same user, including the puff duration and peak pressure, can vary over a wide range, puff after puff. In these tests, the user simply took all puffs naturally and didn’t intend to change the vaping pattern. Despite these variations, using our e-cig topography sensor, the mass of TPM and nicotine yield were conveniently tracked for every puff, which provided crucial information for evaluating the health risks in the user’s vaping habits.
Figure 9. Tracking a user’s puff topography with the e-cig topography sensor. Photograph of (a) the user testing the smart e-cigarette and (b) the display on the device showing the results after one puff. (c) Sensor signals acquired during the first puff for 20 W atomizer power. The data point for this acquisition is marked as dashed circles on the curves in (d)(f)(g). (d) Mass of TPM in the puff and estimated nicotine yield from multiple puffs using 20 W and 25 W atomizer power. (e) Statistical quantity (mean, and standard deviation) of user’s puff topography for using 20 W and 25 W atomizer power, respectively, attained from the puffs shown in (d). (f) Puff duration and (g) peak inhalation pressure acquired from the user’s puffs using 20 W and 25 W atomizer power.
Preprints 86539 g009

4. Discussion

Our e-cig topography sensor allows quantitative measurements of e-cigarette aerosols within the smart e-cigarette device, and such measurements were so far only carried out in well-equipped laboratories or using bulky topography devices. The results measured from our e-cig topography sensor matched well with the trends reported in existing studies, and the relative error is mostly lower than 9% for most of the trials. When examining all experimental results listed in Table A3Table A5, the summation of the mass of TPM measured by the e-cig topography sensor from all puffs is 296.87 mg while the reference measurement result is 314.48 mg, which suggests an overall relative error of about 5.60%. Considering the compactness and simplicity of the sensor, the achieved accuracy is remarkable. Based on the experimental results, our e-cig topography sensor has promptly, conveniently, and accurately monitored the mass of TPM puff by puff, over a wide range of settings for atomizer power, puff duration, and inhalation pressure, which has never been demonstrated from sensors integrated inside e-cigarettes before. The success of our topography sensor stems from the strategy of combining multi-parameter sensors for concurrent pressure and optical measurement, similar with the strategies demonstrated for other health-related sensor applications [57,58].
The capability of our e-cig topography sensor can open up new avenues to monitor all e-cigarette users’ daily puff topography and to mitigate health risks of vaping. With our e-cig topography sensor, the mass of TPM and nicotine yield in every puff can be closely tracked, regardless the setting of the device, the condition of the atomizer, and the user’s inhalation fashion. Particularly, on certain types of e-cigarette devices, atomizer power control does not exist, making it impossible to quantify how much particulate matter and nicotine can be inhaled by the user. Since our sensor directly measures the aerosols of the e-cigarette output, it can directly function with such e-cigarette devices to make quantitative measurements. From the perspective of regulation, our e-cig topography sensor can be used for quality control of e-cigarette products by comparing the measured mass of TPM with the predetermined ideal values for a given setting. When significant differences are detected, the user should be warned about the potentially malfunctioned device. For example, when the e-liquid is nearly empty in the tank and the atomizer is relatively dry, the mass of TPM in the generated e-cigarette aerosols will be different from normal. With our sensor, such a condition can be detected and the user will be notified. In addition, our e-cig topography sensor can also allow nicotine dose to be tracked for every puff. Such a feature can be very useful for special e-cigarette devices designed for cessation of smoking traditional tobacco.
In our work, the photometric measurement of the aerosol concentration is based on light scattering, and the mass concentration of aerosol is proportional to the intensity of scattered light, as illustrated in Figure 1. Alternatively, the aerosol concentration can also be measured using a light transmission configuration, in which the concentration is proportional to the absorbance based on Beer–Lambert’s Law. The transmission scheme will be investigated in our future work.
The "mass of TPM" measured from our topography sensor is similar with the "mass of vaporized e-liquid (MVE)" or "mass loss per puff" in literature [35,46], but there are also inherent differences. The vaporized e-liquid in each puff will form into PM and gas-phase components in the generated e-cigarette aerosol. Since our sensor is based on light scattering of near-infrared wavelength, only the PM significantly contributes to the optical signals and thus to the reading of our sensor. The scattering from gas-phase components is negligible, when compared to that from PM. The gas-phase components are important as they may contain VOC and other harmful gas-phase chemicals, but they cannot be captured by our sensor reported in this article. Such gas-phase components can potentially be measured using specialized gas sensors. Ideally, the e-cig topography sensor should include both PM sensing and gas sensing functionalities, which will be studied in our future work.
The optical signal and inhalation pressure shown in Figure 1b,c and Figure 9c were acquired from the human subject, who drew the puff from the device. The optical signal is determined by the concentration of the generated aerosol, which is further controlled by the activation of the atomizer coil. At the end of activation, the current is turned off and the atomizer coil cools down quickly. As a result, the aerosol output decreases sharply and gives a steep falling edge in the optical signal. The inhalation pressure reflects the human subject’s inhalation pattern, which vary among different users. At the end of the inhalation, the human subject tends to relax and therefore gives a gentle decreasing slope in the inhalation pressure.
One concern about our sensor’s performance is the adsorption of vaporized e-liquid on the surface of the optical sensor. From our experiments, we observed that the e-cigarette aerosol adsorbed on the optical sensor surface formed into a diffusing layer which reduced the optical power transmitted to the photodiode. After running the e-cigarette for a few puffs, this layer of e-liquid reached a steady state, which gave a stable optical loss. Since our sensor was calibrated in this steady state, the effects of optical loss through this diffusing layer were compensated. Another concern is the limit of detection of the sensor for measuring the mass of TPM. We have carried out experiments to estimate the limit of detection. We decreased the atomizer power to generate an aerosol with a smaller and smaller mass of TPM to find out the minimal mass that can be detected by the sensor. Based on these experiments, the limit of detection of our sensor is about 0.2 mg, which was attained using 8.5 W atomizer power, 2 sec button pusher duration, and 54 sec box pressurization time. The relative error between our sensor and the reference measurement is about 7.71%. It should be noted that, e-cigarette aerosols generated from the mod-type devices usually have a mass of TPM much higher than this limit.
There are still limitations in the prototype of e-cig topography sensor presented in this work. Firstly, as observed from the results in Figure 5, Figure 6 and Figure 7 and Table A3Table A5, the relative errors of the sensor’s readings, when compared with the reference measurements, grew into over 10% when either the optical signal or the inhalation pressure was too high. In this work, we implemented the simplistic mathematical model of the aerosol mass concentration versus optical signal and the flow rate versus inhalation pressure given in Equations (2) and (3), respectively. The calibration coefficient was treated as a constant, which was attained using single-point calibration procedures. With too high optical signal, the aerosol concentration is too high and multiple scattering will cause the optical signal to saturate. With too high inhalation pressure, the flow rate requires further corrections. These challenges can be solved by using more accurate mathematical models and advanced calibration procedures. In addition, the air temperature and the humidity can also affect the sensor’s reading. As previously mentioned, the air temperature can cause the optical sensor’s response to drift slightly. The humidity can affect the aerosol’s physical properties, which can also affect the reading. These parameters can potentially be monitored using BME680’s built-in temperature and humidity sensing functionalities to enable compensations on the effects of temperature and humidity. Secondly, the e-cig topography sensor’s calibration coefficient depends on the air flow resistance, as explained in Section 3.4. In this work, the sensor has to be calibrated again after the removal and re-installation of the sensor components, which have altered the air flow resistance slightly. This problem can be solved by accurately controlling the air flow resistance using specially designed orifices. Thirdly, since the breakout boards of sensors used in this prototype are in centimeter scale, the constructed smart e-cigarette is larger than regular e-cigarette devices, as shown in Figure 2d,e. The core components of the sensors are actually in millimeter scale as shown Figure 2c. Given a miniaturized circuit board optimally designed for the core sensor components, the size of the topography sensor can be scaled down into a few millimeters to directly fit into all main-stream e-cigarette devices or components, including compact vaping pods, cartomizers/clearomizers, and mouthpieces. Lastly, the e-cigarette aerosols can be further analyzed in parallel using analytical chemistry instruments to further study how different parameters affect the generated e-cigarette aerosols. These aforementioned potential approaches to improve our e-cig topography sensor will be investigated in our future work.
Different compositions of e-liquids, such as varying ratio of PG to VG, and different flavoring agents, can affect the particle size distribution and the concentrations of the generated e-cigarette aerosols. In our experiments, we have compared two different e-liquids, BB VAPES BRVND ENVY and BB VAPES BRVND KSPR, which have different flavors. After calibrating the sensor for the specific e-liquid, the sensor can deliver very consistent readings for that e-liquid. The calibration coefficients for these two e-liquids are different by about 8%. It should be noted that, this variation in calibration coefficient is comparable with the level of uncertainty of the sensor’s response versus reference measurements. Further experiments are needed to investigate the effects of different e-liquids, which will be our future work.

5. Conclusions

We introduced new quantification parameters, mass of total particulate matter and estimated nicotine yield, as part of e-cigarette puff topography. We demonstrated an e-cig topography sensor based on a photometric sensor MAX30105 and a pressure sensor BME680. All components were compact and built inside a smart e-cigarette prototype. The algorithm for sensor signal processing, the experimental setup for reference measurements, and the calibration of the sensor’s readings, were all presented. Our sensor was proven successful in measuring the e-cigarette aerosol output with an overall relative error of about 5.60%, for a wide range of atomizer power, puff duration, inhalation pressure, and atomizer condition. The sensor was also implemented to track a user’s puff topography, which can closely monitor the user’s vaping habits and intake of particulate matter and nicotine. The e-cig topography sensor can open up new avenues to study e-cigarettes and to mitigate adverse health consequences from vaping.

Author Contributions

Conceptualization, H.J.; methodology, K.K. and H.J.; software, K.K. and H.J.; validation, K.K. and H.J.; formal analysis, K.K. and H.J.; investigation, K.K. and H.J.; resources, H.J.; data curation, K.K.; writing—original draft preparation, H.J.; writing—review and editing, K.K. and H.J.; visualization, K.K. and H.J.; supervision, H.J.; project administration, H.J.; funding acquisition, H.J. All authors have read and agreed to the published version of the manuscript.

Funding

This research was funded by National Science Foundation Engineering Research Initiation (ERI) program under Award Number 2138534.

Institutional Review Board Statement

The study was conducted in accordance with the Declaration of Helsinki, and the protocol was approved by the Institutional Review Board of Lawrence Technological University.

Informed Consent Statement

Informed consent was obtained from all subjects involved in the study.

Data Availability Statement

The data presented in this study are available on request from the corresponding author H.J..

Acknowledgments

We acknowledge the kind supports from faculty members in Biomedical Engineering at Lawrence Technological University.

Conflicts of Interest

The authors declare no conflict of interest. The funders had no role in the design of the study; in the collection, analyses, or interpretation of data; in the writing of the manuscript; or in the decision to publish the results.

Abbreviations

The following abbreviations are used in this article:
E-CIG Electronic Cigarette
PM Particulate Matter
TPM Total Particulate Matter
MCU Micro-Controller Unit
VOC Volatile Organic Compound
LED Light Emitting Diode

Appendix A. List of Symbols and Tables of Experimental Data

Table A1. List of symbols used in the article.
Symbol Description
S ( t ) Baseline-subtracted optical signal measured by the photometric sensor
Δ P ( t ) Inhalation pressure measured by the pressure sensor
α Calibration coefficient
S m a x Peak optical signal
Δ P m a x Peak inhalation pressure
t p Puff duration measured from the optical signal
C ( t ) Mass concentration of the generated e-cigarette aerosol
Q ( t ) Volumetric flow rate of the generated e-cigarette aerosol
A U C Area under the curve of S ( t ) Δ P ( t )
M p u f f Mass of total particulate matter (TPM) in the puff, measured by the e-cig topography sensor
M R e f Reference mass of TPM in the puff, measured by the vaping machine and the aerosol monitor
C A M P M 1.0 concentration of the diluted aerosol in the box, measured by the aerosol monitor
V b o x Volume of the dilution box
t b t n Button pusher duration
t v a c Pressurization duration to pump air out of the dilution box to control the inhalation pressure
Table A2. Calibration of the e-cig topography sensor. Tests were carried out using 30 W atomizer power, 2.0 sec button-pusher duration, and 54 sec box pressurization.
No. Δ P m a x (Pa) S m a x (a.u.) C A M (mg/m 3 ) M R e f (mg) Cal. Coeff. α
1 485.5 7533.2 90.1 8.52 3.4743×10 5
2 462.9 7471.6 89.4 8.46 3.5497×10 5
3 444.9 7636.2 85.7 8.11 3.5146×10 5
First calibration coefficient  α 1 = 3.5129×10 5
4 514.9 8211.4 101.0 9.55 3.4034×10 5
5 509.7 8286.1 101.0 9.55 3.3361×10 5
6 508.7 8715.0 100.0 9.46 3.2571×10 5
Second calibration coefficient  α 2 = 3.3322×10 5
Table A3. Tests on the e-cig topography sensor for varying atomizer powers. Tests were carried out using 2.0 sec button-pusher duration, and 54 sec box pressurization.
No. Power (W) Δ P m a x (Pa) S m a x (a.u.) C A M (mg/m 3 ) M R e f (mg) M p u f f (mg) Relative error
1 15 454.0 2284.9 21.0 1.99 2.16 8.73%
2 15 473.4 2149.6 21.9 2.07 2.12 2.33%
3 15 484.9 2286.7 21.1 2.00 2.25 12.72%
4 20 462.1 4149.2 42.8 4.05 4.22 4.23%
5 20 456.4 4261.2 44.8 4.24 4.39 3.58%
6 20 448.8 4444.5 44.6 4.22 4.44 5.23%
7 25 457.3 6184.5 69.4 6.57 6.59 0.38%
8 25 456.8 6233.4 71.2 6.74 6.48 3.79%
9 25 471.0 6149.3 70.4 6.66 6.68 0.30%
10 30 467.4 7556.7 97.8 9.25 8.69 6.07%
11 30 458.5 7874.7 98.0 9.27 8.80 5.08%
12 30 472.8 8058.3 98.6 9.33 8.99 3.62%
13 35 487.8 8192.4 126.0 11.92 9.95 16.52%
14 35 483.6 8004.3 126.0 11.92 10.16 14.76%
15 35 466.4 8853.4 125.0 11.83 10.46 11.54%
16 40 451.5 9215.5 141.0 13.34 11.17 16.26%
17 40 451.5 9112.7 137.0 12.96 11.33 12.58%
18 40 445.2 8737.3 135.0 12.77 10.88 14.81%
Table A4. Tests on the e-cig topography sensor for varying button-pusher durations to test different puff durations. Tests were carried out using 30 W atomizer power, and 54 sec box pressurization.
No. t b t n (sec) Δ P m a x (Pa) S m a x (a.u.) C A M (mg/m 3 ) M R e f (mg) M p u f f (mg) Relative error
1 1.5 464.6 7664.5 65.3 6.18 6.20 0.37%
2 1.5 452.0 7913.4 66.3 6.27 6.43 2.52%
3 1.5 458.3 8247.9 64.8 6.13 6.47 5.55%
4 2.0 461.1 8327.1 99.1 9.37 9.50 1.33%
5 2.0 459.5 8107.2 98.9 9.36 9.40 0.47%
6 2.0 459.1 8508.0 102.0 9.65 9.58 0.72%
7 2.5 456.7 8627.5 144.0 13.62 12.96 4.86%
8 2.5 444.2 8090.0 140.0 13.24 11.77 11.13%
9 2.5 441.2 8430.8 137.0 12.96 12.22 5.71%
Table A5. Tests on the e-cig topography sensor for varying peak inhalation pressures. Tests were carried out using 30 W atomizer power, and 2.0 sec button-pusher duration.
No. t v a c (sec) Δ P m a x (Pa) S m a x (a.u.) C A M (mg/m 3 ) M R e f (mg) M p u f f (mg) Relative error
1 28 287.4 10314.8 91.6 8.67 8.82 1.78%
2 28 296.6 9544.0 97.5 9.22 8.80 4.59%
3 28 286.4 10254.4 96.2 9.10 9.11 0.10%
4 54 441.2 8605.3 102.0 9.65 9.77 1.25%
5 54 456.3 8512.9 104.0 9.84 9.83 0.09%
6 54 451.9 7900.1 103.0 9.74 9.13 6.30%
7 112 602.8 6652.7 105.0 9.93 8.70 12.41%
8 112 612.5 7143.7 108.0 10.22 9.25 9.46%
9 112 594.8 7144.5 108.0 10.22 9.17 10.25%

References

  1. Grana, R.; Benowitz, N.; Glantz, S.A. E-cigarettes: a scientific review. Circulation 2014, 129, 1972–1986. [Google Scholar] [CrossRef] [PubMed]
  2. Brown, C.J.; Cheng, J.M. Electronic cigarettes: product characterisation and design considerations. Tobacco Control 2014, 23, ii4–ii10. [Google Scholar] [CrossRef] [PubMed]
  3. Chapman, S.L.C.; Wu, L.T. E-cigarette prevalence and correlates of use among adolescents versus adults: a review and comparison. Journal of Psychiatric Research 2014, 54, 43–54. [Google Scholar] [CrossRef] [PubMed]
  4. Cameron, J.M.; Howell, D.N.; White, J.R.; Andrenyak, D.M.; Layton, M.E.; Roll, J.M. Variable and potentially fatal amounts of nicotine in e-cigarette nicotine solutions. Tobacco Control 2014, 23, 77–78. [Google Scholar] [CrossRef]
  5. Breland, A.; Soule, E.; Lopez, A.; Ramôa, C.; El-Hellani, A.; Eissenberg, T. Electronic cigarettes: what are they and what do they do? Annals of the New York Academy of Sciences 2016, 1394, 5–30. [Google Scholar] [CrossRef]
  6. Sleiman, M.; Logue, J.M.; Montesinos, V.N.; Russell, M.L.; Litter, M.I.; Gundel, L.A.; Destaillats, H. Emissions from electronic cigarettes: key parameters affecting the release of harmful chemicals. Environmental Science & Technology 2016, 50, 9644–9651. [Google Scholar] [CrossRef]
  7. Hess, C.A.; Olmedo, P.; Navas-Acien, A.; Goessler, W.; Cohen, J.E.; Rule, A.M. E-cigarettes as a source of toxic and potentially carcinogenic metals. Environmental Research 2017, 152, 221–225. [Google Scholar] [CrossRef]
  8. Dunbar, Z.R.; Das, A.; O’Connor, R.J.; Goniewicz, M.L.; Wei, B.; Travers, M.J. Brief report: lead levels in selected electronic cigarettes from Canada and the United States. International Journal of Environmental Research and Public Health 2018, 15, 154. [Google Scholar] [CrossRef]
  9. Gaur, S.; Agnihotri, R. Health effects of trace metals in electronic cigarette aerosols—a systematic review. Biological Trace Element Research 2019, 188, 295–315. [Google Scholar] [CrossRef]
  10. Holliday, R.; Chaffee, B.; Jakubovics, N.; Kist, R.; Preshaw, P. Electronic Cigarettes and Oral Health. Journal of Dental Research 2021, 100, 906–913. [Google Scholar] [CrossRef]
  11. Keith, R.; Bhatnagar, A. Cardiorespiratory and Immunologic Effects of Electronic Cigarettes. Current Addiction Reports 2021, 8, 336–346. [Google Scholar] [CrossRef] [PubMed]
  12. Cao, Y.; Wu, D.; Ma, Y.; Ma, X.; Wang, S.; Li, F.; Li, M.; Zhang, T. Toxicity of electronic cigarettes: A general review of the origins, health hazards, and toxicity mechanisms. Science of The Total Environment 2021, 772, 145475. [Google Scholar] [CrossRef] [PubMed]
  13. Ween, M.P.; Moshensky, A.; Thredgold, L.; Bastian, N.A.; Hamon, R.; Badiei, A.; Nguyen, P.T.; Herewane, K.; Jersmann, H.; Bojanowski, C.M.; Shin, J.; Reynolds, P.N.; Crotty Alexander, L.E.; Hodge, S.J. E-cigarettes and health risks: more to the flavor than just the name. American Journal of Physiology-Lung Cellular and Molecular Physiology 2021, 320, L600–L614. [Google Scholar] [CrossRef] [PubMed]
  14. Williams, M.; Villarreal, A.; Bozhilov, K.; Lin, S.; Talbot, P. Metal and Silicate Particles Including Nanoparticles Are Present in Electronic Cigarette Cartomizer Fluid and Aerosol. PLOS ONE 2013, 8, 1–11. [Google Scholar] [CrossRef] [PubMed]
  15. Goniewicz, M.L.; Knysak, J.; Gawron, M.; Kosmider, L.; Sobczak, A.; Kurek, J.; Prokopowicz, A.; Jablonska-Czapla, M.; Rosik-Dulewska, C.; Havel, C.; others. Levels of selected carcinogens and toxicants in vapour from electronic cigarettes. Tobacco Control 2014, 23, 133–139. [Google Scholar] [CrossRef] [PubMed]
  16. Lerner, C.A.; Sundar, I.K.; Watson, R.M.; Elder, A.; Jones, R.; Done, D.; Kurtzman, R.; Ossip, D.J.; Robinson, R.; McIntosh, S.; Rahman, I. Environmental health hazards of e-cigarettes and their components: Oxidants and copper in e-cigarette aerosols. Environmental Pollution 2015, 198, 100–107. [Google Scholar] [CrossRef]
  17. Williams, M.; To, A.; Bozhilov, K.; Talbot, P. Strategies to reduce tin and other metals in electronic cigarette aerosol. PLoS One 2015, 10, e0138933. [Google Scholar] [CrossRef]
  18. Mikheev, V.B.; Brinkman, M.C.; Granville, C.A.; Gordon, S.M.; Clark, P.I. Real-time measurement of electronic cigarette aerosol size distribution and metals content analysis. Nicotine & Tobacco Research 2016, 18, 1895–1902. [Google Scholar] [CrossRef]
  19. Palazzolo, D.L.; Crow, A.P.; Nelson, J.M.; Johnson, R.A. Trace metals derived from electronic cigarette (ECIG) generated aerosol: potential problem of ECIG devices that contain nickel. Frontiers in Physiology 2017, 7, 663. [Google Scholar] [CrossRef]
  20. Olmedo, P.; Goessler, W.; Tanda, S.; Grau-Perez, M.; Jarmul, S.; Aherrera, A.; Chen, R.; Hilpert, M.; Cohen, J.E.; Navas-Acien, A.; Rule, A.M. Metal Concentrations in e-Cigarette Liquid and Aerosol Samples: The Contribution of Metallic Coils. Environmental Health Perspectives 2018, 126, 027010. [Google Scholar] [CrossRef]
  21. Williams, M.; Li, J.; Talbot, P. Effects of model, method of collection, and topography on chemical elements and metals in the aerosol of tank-style electronic cigarettes. Scientific Reports 2019, 9, 13969. [Google Scholar] [CrossRef]
  22. Seiler-Ramadas, Radhika andSandner, I.; Haider, S.; Grabovac, I.; Dorner, T.E. Real-time measurement of electronic cigarette aerosol size distribution and metals content analysis. Wiener klinische Wochenschrift 2021, 133, 1020–1027. [CrossRef]
  23. Schober, W.; Szendrei, K.; Matzen, W.; Osiander-Fuchs, H.; Heitmann, D.; Schettgen, T.; Jörres, R.A.; Fromme, H. Use of electronic cigarettes (e-cigarettes) impairs indoor air quality and increases FeNO levels of e-cigarette consumers. International Journal of Hygiene and Environmental Health 2014, 217, 628–637. [Google Scholar] [CrossRef] [PubMed]
  24. Cho, J.H.; Paik, S.Y. Association between electronic cigarette use and asthma among high school students in South Korea. PloS One 2016, 11, e0151022. [Google Scholar] [CrossRef] [PubMed]
  25. Talih, S.; Balhas, Z.; Eissenberg, T.; Salman, R.; Karaoghlanian, N.; El Hellani, A.; Baalbaki, R.; Saliba, N.; Shihadeh, A. Effects of User Puff Topography, Device Voltage, and Liquid Nicotine Concentration on Electronic Cigarette Nicotine Yield: Measurements and Model Predictions. Nicotine & Tobacco Research 2014, 17, 150–157. [Google Scholar] [CrossRef]
  26. Fuoco, F.; Buonanno, G.; Stabile, L.; Vigo, P. Influential parameters on particle concentration and size distribution in the mainstream of e-cigarettes. Environmental Pollution 2014, 184, 523–529. [Google Scholar] [CrossRef]
  27. Li, Y.; Burns, A.E.; Tran, L.N.; Abellar, K.A.; Poindexter, M.; Li, X.; Madl, A.K.; Pinkerton, K.E.; Nguyen, T.B. Impact of e-Liquid Composition, Coil Temperature, and Puff Topography on the Aerosol Chemistry of Electronic Cigarettes. Chemical Research in Toxicology 2021, 34, 1640–1654. [Google Scholar] [CrossRef]
  28. Zhao, D.; Ilievski, V.; Slavkovich, V.; Olmedo, P.; Domingo-Relloso, A.; Rule, A.M.; Kleiman, N.J.; Navas-Acien, A.; Hilpert, M. Effects of e-liquid flavor, nicotine content, and puff duration on metal emissions from electronic cigarettes. Environmental Research 2022, 204, 112270. [Google Scholar] [CrossRef]
  29. Sharpless, N. How FDA is Regulating E-Cigarettes. https://www.fda.gov/news-events/fda-voices-perspectives-fda-leadership-and-experts/how-fda-regulating-e-cigarettes.
  30. Behar, R.Z.; Hua, M.; Talbot, P. Puffing Topography and Nicotine Intake of Electronic Cigarette Users. PLOS ONE 2015, 10, 1–18. [Google Scholar] [CrossRef]
  31. Cunningham, A.; Slayford, S.; Vas, C.; Gee, J.; Costigan, S.; Prasad, K. Development, validation and application of a device to measure e-cigarette users’ puffing topography. Scientific Reports 2016, 6, 35071. [Google Scholar] [CrossRef]
  32. Zhao, T.; Shu, S.; Guo, Q.; Zhu, Y. Effects of design parameters and puff topography on heating coil temperature and mainstream aerosols in electronic cigarettes. Atmospheric Environment 2016, 134, 61–69. [Google Scholar] [CrossRef]
  33. Williams, M.; Bozhilov, K.; Ghai, S.; Talbot, P. Elements including metals in the atomizer and aerosol of disposable electronic cigarettes and electronic hookahs. PloS One 2017, 12, e0175430. [Google Scholar] [CrossRef] [PubMed]
  34. Farsalinos, K.; Poulas, K.; Voudris, V. Changes in Puffing Topography and Nicotine Consumption Depending on the Power Setting of Electronic Cigarettes. Nicotine & Tobacco Research 2017, 20, 993–997. [Google Scholar] [CrossRef]
  35. Floyd, E.; Greenlee, S.; Oni, T.; Sadhasivam, B.; Queimado, L. The Effect of Flow Rate on a Third-Generation Sub-Ohm Tank Electronic Nicotine Delivery System—Comparison of CORESTA Flow Rates to More Realistic Flow Rates. International Journal of Environmental Research and Public Health 2021, 18, 7535. [Google Scholar] [CrossRef]
  36. Floyd, E.; Oni, T.; Cai, C.; Rehman, B.; Hwang, J.; Watson, T. Validation of a High Flow Rate Puff Topography System Designed for Measurement of Sub-Ohm, Third Generation Electronic Nicotine Delivery Systems. International Journal of Environmental Research and Public Health 2022, 19. [Google Scholar] [CrossRef]
  37. Korzun, T.; Lazurko, M.; Munhenzva, I.; Barsanti, K.C.; Huang, Y.; Jensen, R.P.; Escobedo, J.O.; Luo, W.; Peyton, D.H.; Strongin, R.M. E-cigarette airflow rate modulates toxicant profiles and can lead to concerning levels of solvent consumption. ACS Omega 2018, 3, 30–36. [Google Scholar] [CrossRef]
  38. Floyd, E.L.; Queimado, L.; Wang, J.; Regens, J.L.; Johnson, D.L. Electronic cigarette power affects count concentration and particle size distribution of vaping aerosol. PloS One 2018, 13, e0210147. [Google Scholar] [CrossRef]
  39. Mulder, H.A.; Patterson, J.L.; Halquist, M.S.; Kosmider, L.; Turner, J.B.M.; Poklis, J.L.; Poklis, A.; Peace, M.R. The effect of electronic cigarette user modifications and e-liquid adulteration on the particle size profile of an aerosolized product. Scientific Reports 2019, 9, 1–8. [Google Scholar] [CrossRef]
  40. Lechasseur, A.; Altmejd, S.; Turgeon, N.; Buonanno, G.; Morawska, L.; Brunet, D.; Duchaine, C.; Morissette, M.C. Variations in coil temperature/power and e-liquid constituents change size and lung deposition of particles emitted by an electronic cigarette. Physiological Reports 2019, 7, e14093. [Google Scholar] [CrossRef]
  41. Pourchez, J.; Parisse, S.; Sarry, G.; Perinel-Ragey, S.; Vergnon, J.M.; Clotagatide, A.; Prévôt, N. Impact of power level and refill liquid composition on the aerosol output and particle size distribution generated by a new-generation e-cigarette device. Aerosol Science and Technology 2018, 52, 359–369. [Google Scholar] [CrossRef]
  42. Alderman, S.L.; Song, C.; Moldoveanu, S.C.; Cole, S.K. Particle Size Distribution of E-Cigarette Aerosols and the Relationship to Cambridge Filter Pad Collection Efficiency. Contributions to Tobacco & Nicotine Research 2015, 26, 183–190. [Google Scholar] [CrossRef]
  43. CORESTA. Cooperation Centre for Scientific Research Relative to Tobacco (CORESTA). [https://www.coresta.org].
  44. Dunkhorst, W.; Lipowicz, P.; Li, W.; Hux, C.; Wang, Q.; Koch, W. In-situ characterization of e-cigarette aerosols by 90°-light scattering of polarized light. Aerosol Science and Technology 2018, 52, 717–724. [Google Scholar] [CrossRef]
  45. Jiang, H. Smart Electronic Cigarettes with Built-in Aerosol Sensors. 2022 IEEE Sensors, 2022, pp. 1–4. [CrossRef]
  46. Soulet, S.; Duquesne, M.; Toutain, J.; Pairaud, C.; Lalo, H. Experimental Method of Emission Generation Calibration Based on Reference Liquids Characterization. International Journal of Environmental Research and Public Health 2019, 16. [Google Scholar] [CrossRef] [PubMed]
  47. Gillman, I.; Kistler, K.; Stewart, E.; Paolantonio, A. Effect of variable power levels on the yield of total aerosol mass and formation of aldehydes in e-cigarette aerosols. Regulatory Toxicology and Pharmacology 2016, 75, 58–65. [Google Scholar] [CrossRef]
  48. Wu, J.; Yang, M.; Huang, J.; Gao, Y.; Li, D.; Gao, N. Vaporization characteristics and aerosol optical properties of electronic cigarettes. Environmental Pollution 2021, 275, 116670. [Google Scholar] [CrossRef]
  49. Lampos, S.; Kostenidou, E.; Farsalinos, K.; Zagoriti, Z.; Ntoukas, A.; Dalamarinis, K.; Savranakis, P.; Lagoumintzis, G.; Poulas, K. Real-Time Assessment of E-Cigarettes and Conventional Cigarettes Emissions: Aerosol Size Distributions, Mass and Number Concentrations. Toxics 2019, 7. [Google Scholar] [CrossRef]
  50. Wasisto, H.S.; Zhang, Q.; Merzsch, S.; Waag, A.; Peiner, E. A phase-locked loop frequency tracking system for portable microelectromechanical piezoresistive cantilever mass sensors. Microsystem Technologies 2014, 20, 559–569. [Google Scholar] [CrossRef]
  51. Dunkhorst, W.; Lipowicz, P.; Koch, W. Characterization of highly concentrated organic aerosols by optical extinction in the mid infrared regime: Application to e-cigarettes. Journal of Aerosol Science 2016, 94, 33–42. [Google Scholar] [CrossRef]
  52. Lee Black, D.; McQuay, M.Q.; Bonin, M.P. Laser-based techniques for particle-size measurement: A review of sizing methods and their industrial applications. Progress in Energy and Combustion Science 1996, 22, 267–306. [Google Scholar] [CrossRef]
  53. Xu, R. Particle characterization: light scattering methods; Vol. 13, Springer Science & Business Media, 2001. [CrossRef]
  54. Huynh, B.K.; Chen, Y.; Fletcher, D.F.; Young, P.; Zhu, B.; Traini, D. An Investigation into the Powder Release Behavior from Capsule-Based Dry Powder Inhalers. Aerosol Science and Technology 2015, 49, 902–911. [Google Scholar] [CrossRef]
  55. Lim, M.; Lee, B. Development of a Portable Monitoring System for Indoor E-Cigarettes Emission. 2020 IEEE SENSORS, 2020, pp. 1–4. [CrossRef]
  56. Sousan, S.; Pender, J.; Streuber, D.; Haley, M.; Shingleton, W.; Soule, E. Laboratory determination of gravimetric correction factors for real-time area measurements of electronic cigarette aerosols. Aerosol Science and Technology 2022, 56, 517–529. [Google Scholar] [CrossRef] [PubMed]
  57. Chen, C.; Jiang, M.; Luo, X.; Tai, H.; Jiang, Y.; Yang, M.; Xie, G.; Su, Y. Ni-Co-P hollow nanobricks enabled humidity sensor for respiratory analysis and human-machine interfacing. Sensors and Actuators B: Chemical 2022, 370, 132441. [Google Scholar] [CrossRef]
  58. Gai, Y.; Jiang, Y.; Li, Z. Advances in health rehabilitation devices based on triboelectric nanogenerators. Nano Energy 2023, 116, 108787. [Google Scholar] [CrossRef]
Disclaimer/Publisher’s Note: The statements, opinions and data contained in all publications are solely those of the individual author(s) and contributor(s) and not of MDPI and/or the editor(s). MDPI and/or the editor(s) disclaim responsibility for any injury to people or property resulting from any ideas, methods, instructions or products referred to in the content.
Copyright: This open access article is published under a Creative Commons CC BY 4.0 license, which permit the free download, distribution, and reuse, provided that the author and preprint are cited in any reuse.
Prerpints.org logo

Preprints.org is a free preprint server supported by MDPI in Basel, Switzerland.

Subscribe

© 2024 MDPI (Basel, Switzerland) unless otherwise stated