2. Theory
From the system’s point of view, the work done on a volume of material can be stored as electric or magnetic field energy [
3]. Our model uses the third possible mechanism, the dissipation of electrical energy according to the Rayleigh dissipation function [
10], which is proportional to the conductance of the DEP system. According to the LMEP, the direction of the fastest increase in dissipation, which in our system corresponds to the fastest increase in the conductance of the system, determines the direction of thermodynamic evolution of the system, and thus the direction of DEP translation [
2,
5].
It is generally accepted that DEP forces arise from the interaction of the object’s induced in-phase (real) polarization components with the inducing external field. Accordingly, from the system’s point of view, the DEP force is calculated from the in-phase contributions to the energy dissipation. Unfortunately, in the overall system, in-phase contributions to energy dissipation can also arise from the interaction of the out-of-phase components of the currents with out-of-phase components of the induced polarizations. Moreover, these contributions to the total dissipation may depend on the object’s position. DEP force calculations from energy differences must exclude such contributions, which are not trivial [
9]. We use DC properties for the external and object media to avoid the occurrence of out-of-phase components in the polarizations and currents. It should be mentioned that another way to avoid out-of-phase components simply is to consider the capacitive charge work for the whole system for the high-frequency limit [
9]. By combining appropriate DC conductivities for the external medium and the object, the model allows analysis of any real polarization relationship of the external medium and the object that may occur at a given frequency for frequency-dependent properties.
The method used below to calculate forces and trajectories has been discussed in previous works [
1,
2,
9]. In short, 2D “conductance fields” were calculated for each electrode and sphere/medium conductance configuration. The conductance fields describe the dependence of the conductance of the system on the position of the sphere’s center. Thus, the trajectory of the maximum conductance gradient can be found for each starting position of the sphere. Depending on the structure of the conductance field, DEP trajectories with different start positions lead to the same or different endpoints.
The gradient in the system’s conductance for position
was derived numerically from the vector
, which was normalized to the step width
, and points in the direction of the maximum increase in the sheet conductance
:
To compare the DEP forces in different chamber setups, a relative DEP force was derived by normalizing the force to the square of the chamber voltage, the depth of
perpendicular to the sheet plane, and
, the sheet conductance of the chamber without object:
This is Equation (8) from [
2].
6. Conclusion
Possibly, the main conclusion is that DEP itself can generally be viewed as a conditional polarization mechanism, even if it is slow in terms of the field oscillation in AC fields [
8,
9]. This argument is based on the more general view that positive and negative DEP are interpreted from the perspective of the object as displacement of a lower polarizable medium by a higher polarizable medium, where the higher polarizable medium can be either the object itself (positive DEP) or the external medium (negative DEP). From this consideration, it is immediately clear that the DEP for a suspension of objects must lead to an increase in polarizability for the whole system.
This is the basis for modeling DEP in a given system by combining the system’s approach with the “conductance field”, the “capacitance field” or more generally, a “polarizability field” of the system. The fields describe the conductance of the system as a function of the object’s position in the DEP chamber. In the system, the DEP translation of objects follows field gradients while being retarded by the viscous properties of the suspension. Calculations with smaller and larger spheres in the DEP systems have shown that the properties of the chambers discussed here as watersheds, saddle points, and catchment areas are qualitatively identical over a wide range of relative sizes of chamber to sphere. This was also found in initial calculations on 3D models, which require considerably more computing time than the 2D models.
The system’s perspective of DEP allows the consideration of an inhomogeneous object polarization and its interaction with an inhomogeneous external field. The calculation of the resulting interaction forces is simplified since the forces can directly be derived from differences in the system’s conductance (or capacitance). This permits a description of the contributions of effects such as induced multipoles or inhomogeneities of the external field induced only by the object’s presence, etc., which are tedious to model in object approaches. Moreover, the attractive forces between neighboring objects can easily be modeled and compared with analytical multipole models in which each object is subjected to the field created by the inhomogeneous polarization of the other object [
27].
Up to now, it has been shown that the LMEP approach works for the electroorientation of ellipsoidal objects [
8], for DEP in multiple electrode configurations and for the calculation of mirror charge-induced forces [
1,
2,
9]. For example, LMEP modeling of AC-electrokinetic effects can be extended to nonspherical objects, multibody systems, or Janus particles to compute combined orientation, translation, and aggregation patterns. Other examples include objects inducing attractive mirror charges on flat electrode surfaces and pointed electrodes inducing mirror charges in large objects. Another problem is the induction of repulsive mirror charges on nonconducting chamber walls [
2]. However, the superposition of DEP translation with induced fluid currents can complicate the registration of object trajectories in real systems.
The system approach represents a significant simplification for numerical modeling of DEP force fields in microfluidic systems. This can be helpful in the search for optimal electrode drive modes for the manipulation and positioning of biological objects and colloidal particles [
13,
14,
15,
17,
18,
19,
20,
21,
23]. The four-electrode system considered here can be readily used for electro-rotation of objects [
11,
13,
15,
21]. The selective switching of drive voltages and AC phases at the electrodes can be used to manipulate and position the object in multi-electrode chambers [
28,
29].
In a subsequent paper, we plan to investigate the experimental behavior of cells and colloidal objects in microchambers with four electrodes and compare it with the behavior expected from to our new theory. However, especially for negative DEP, it has already been observed that the DEP forces in some areas, such as near saddle points, are minimal and may not overcome sedimentation, surface friction, and subsequent adhesion.
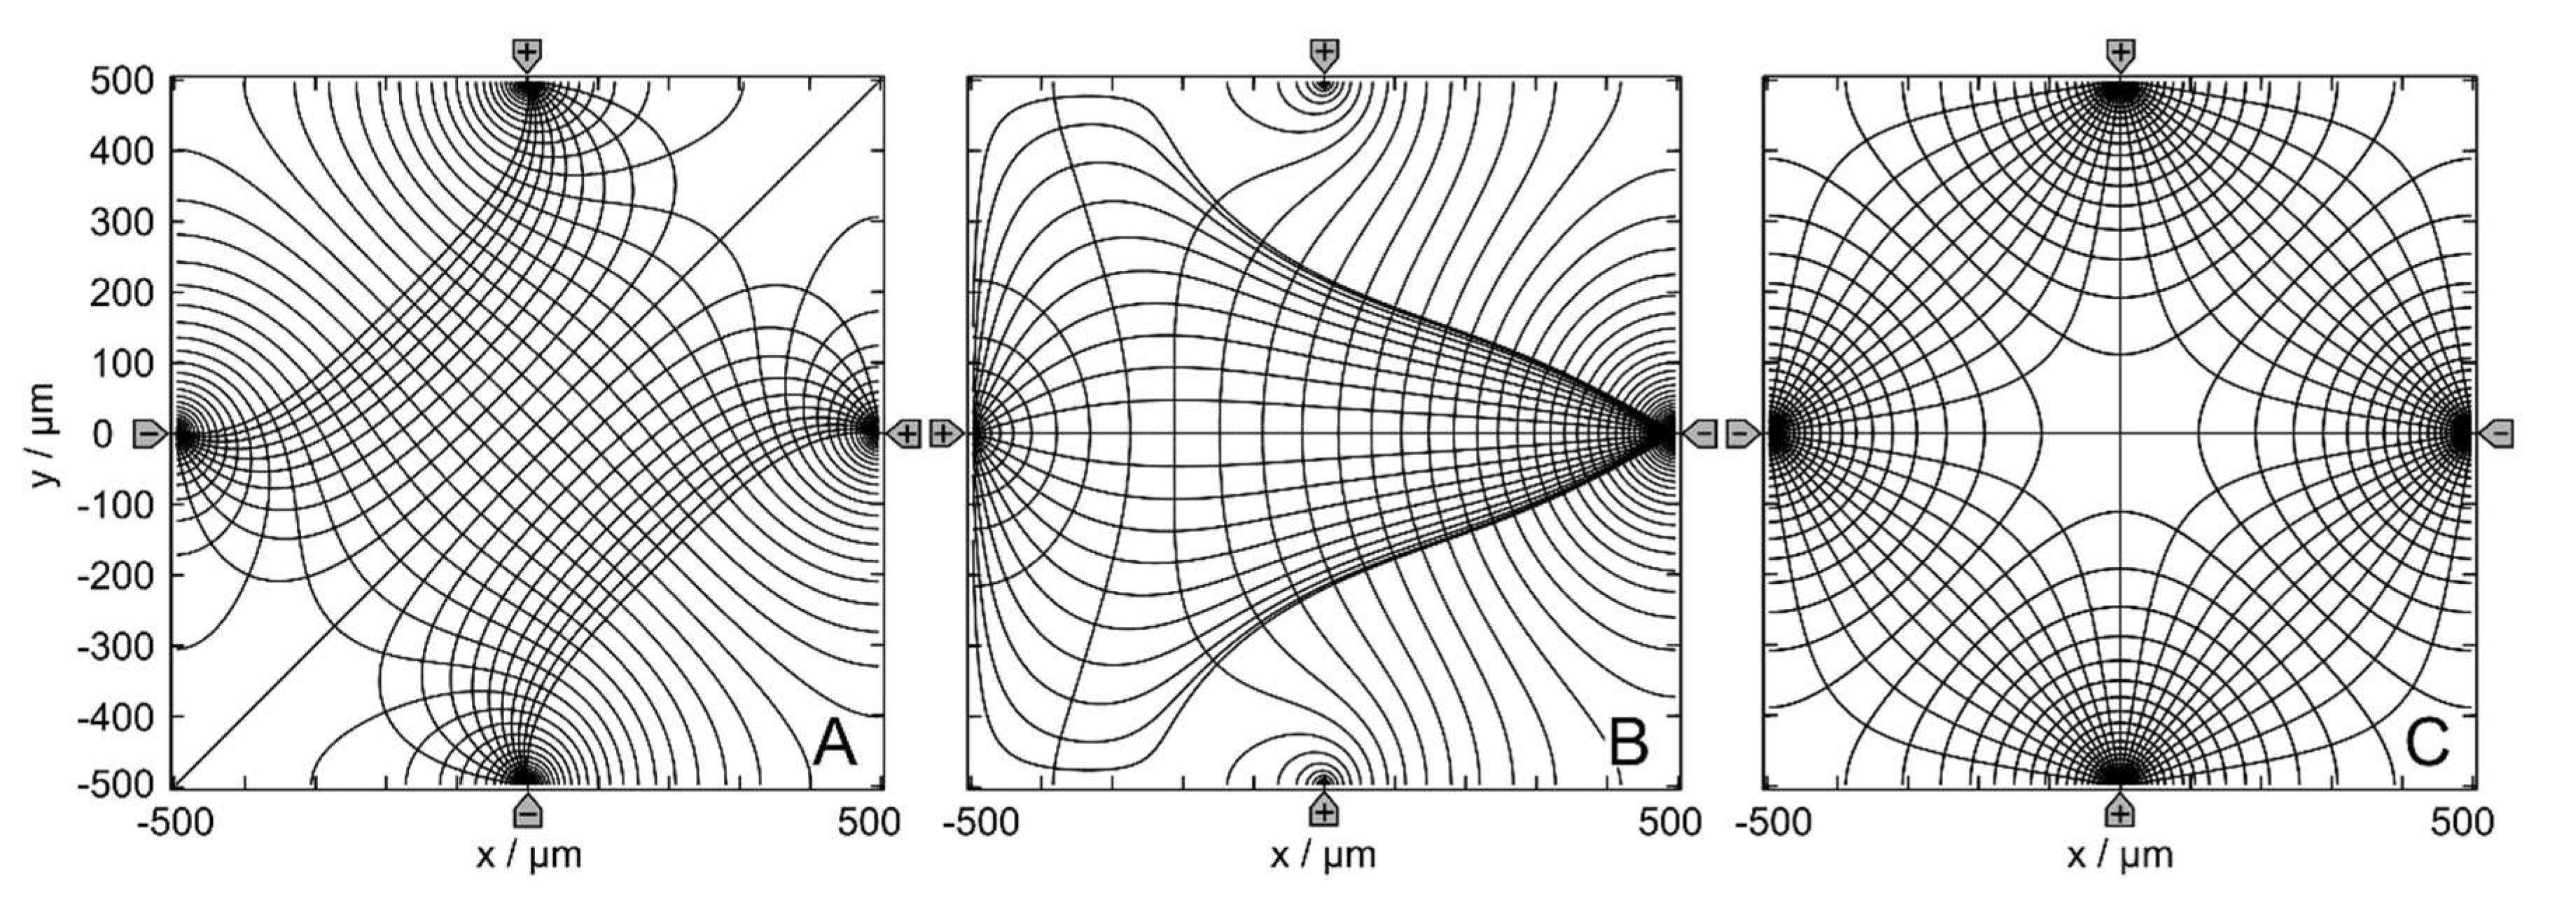
Figure 1.
Potential and current line distributions in the 1 × 1-mm chamber without the object. The four-pointed electrodes were energized with 1 V (marked by “+”) versus 0 V at the counter electrodes (marked by “-“). For a clearer presentation of the current and potential distributions, equidistant current lines were used at x=0 in A and x=-250 µm in B. For C, two distributions with equidistant streamlines at x= -250 µm and at x=250 µm were combined. The calculated basic sheet conductances for the 100 mS // 1 S media are A: 42.31 mS // 422.9 mS, B: 32.75 mS // 327.4 mS and C: 46.67 mS // 466.5 mS, corresponding to cell constants of approx. 0.423, 0.327 and 0.466, respectively.
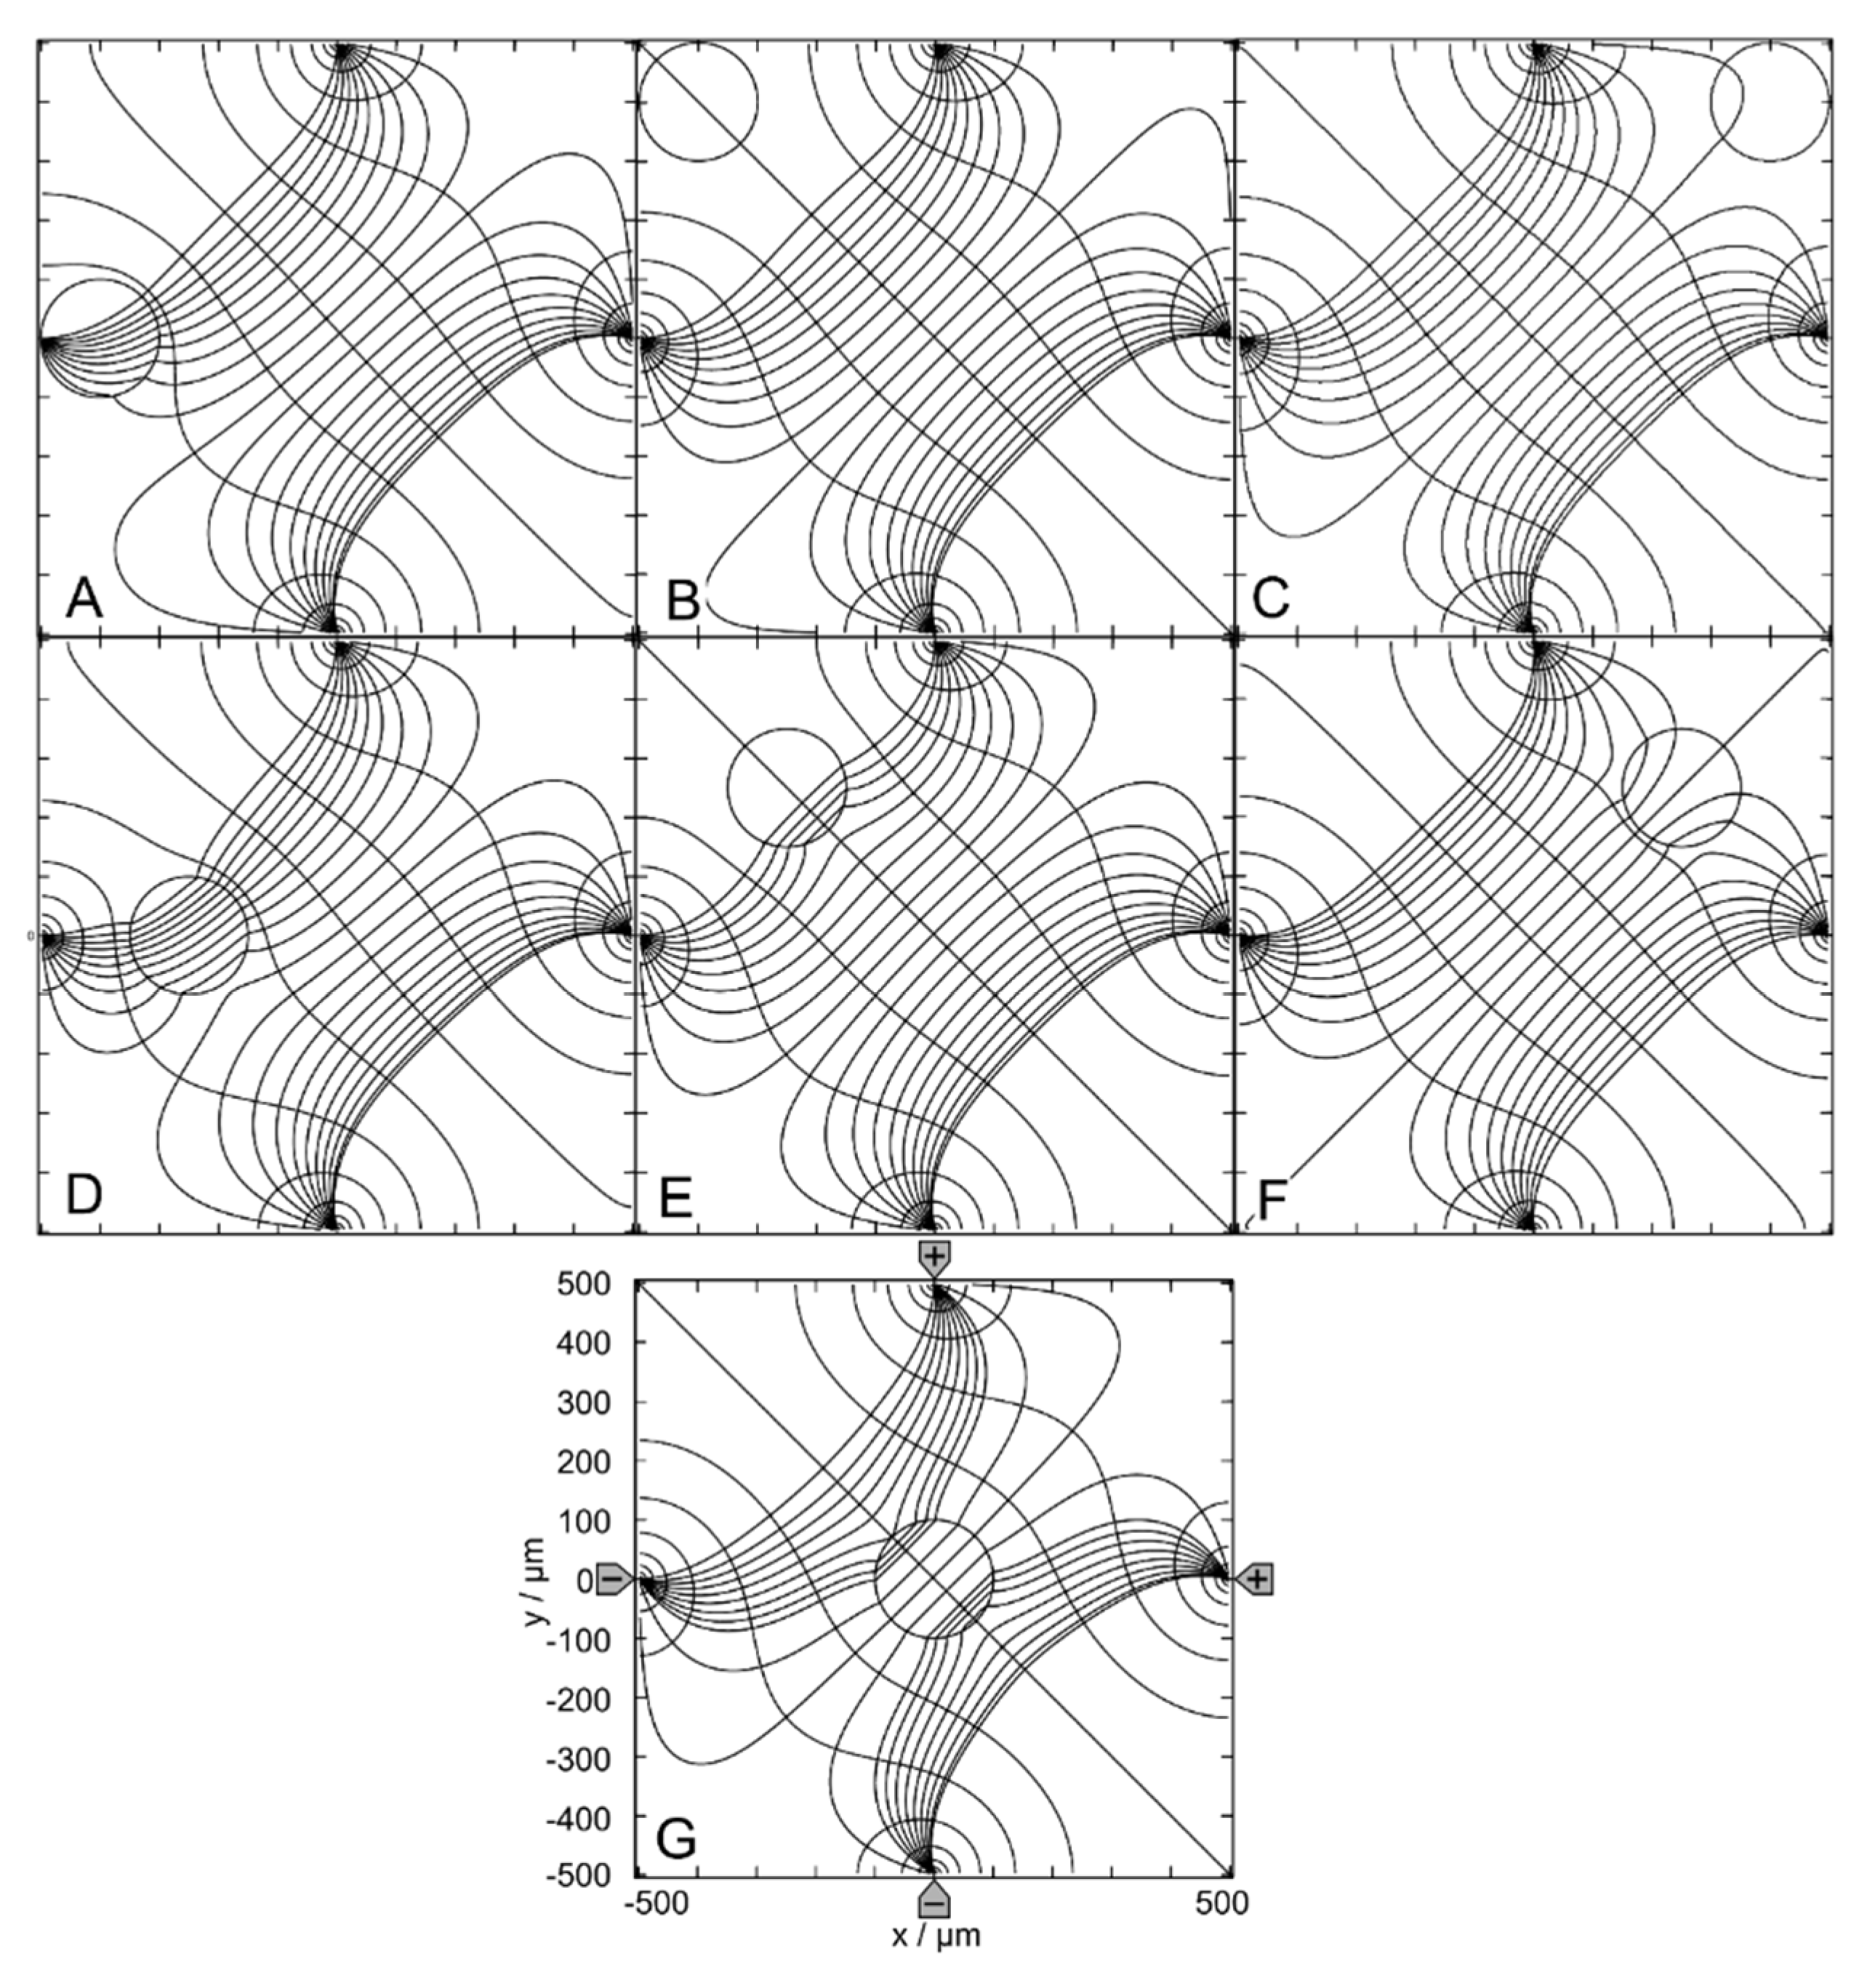
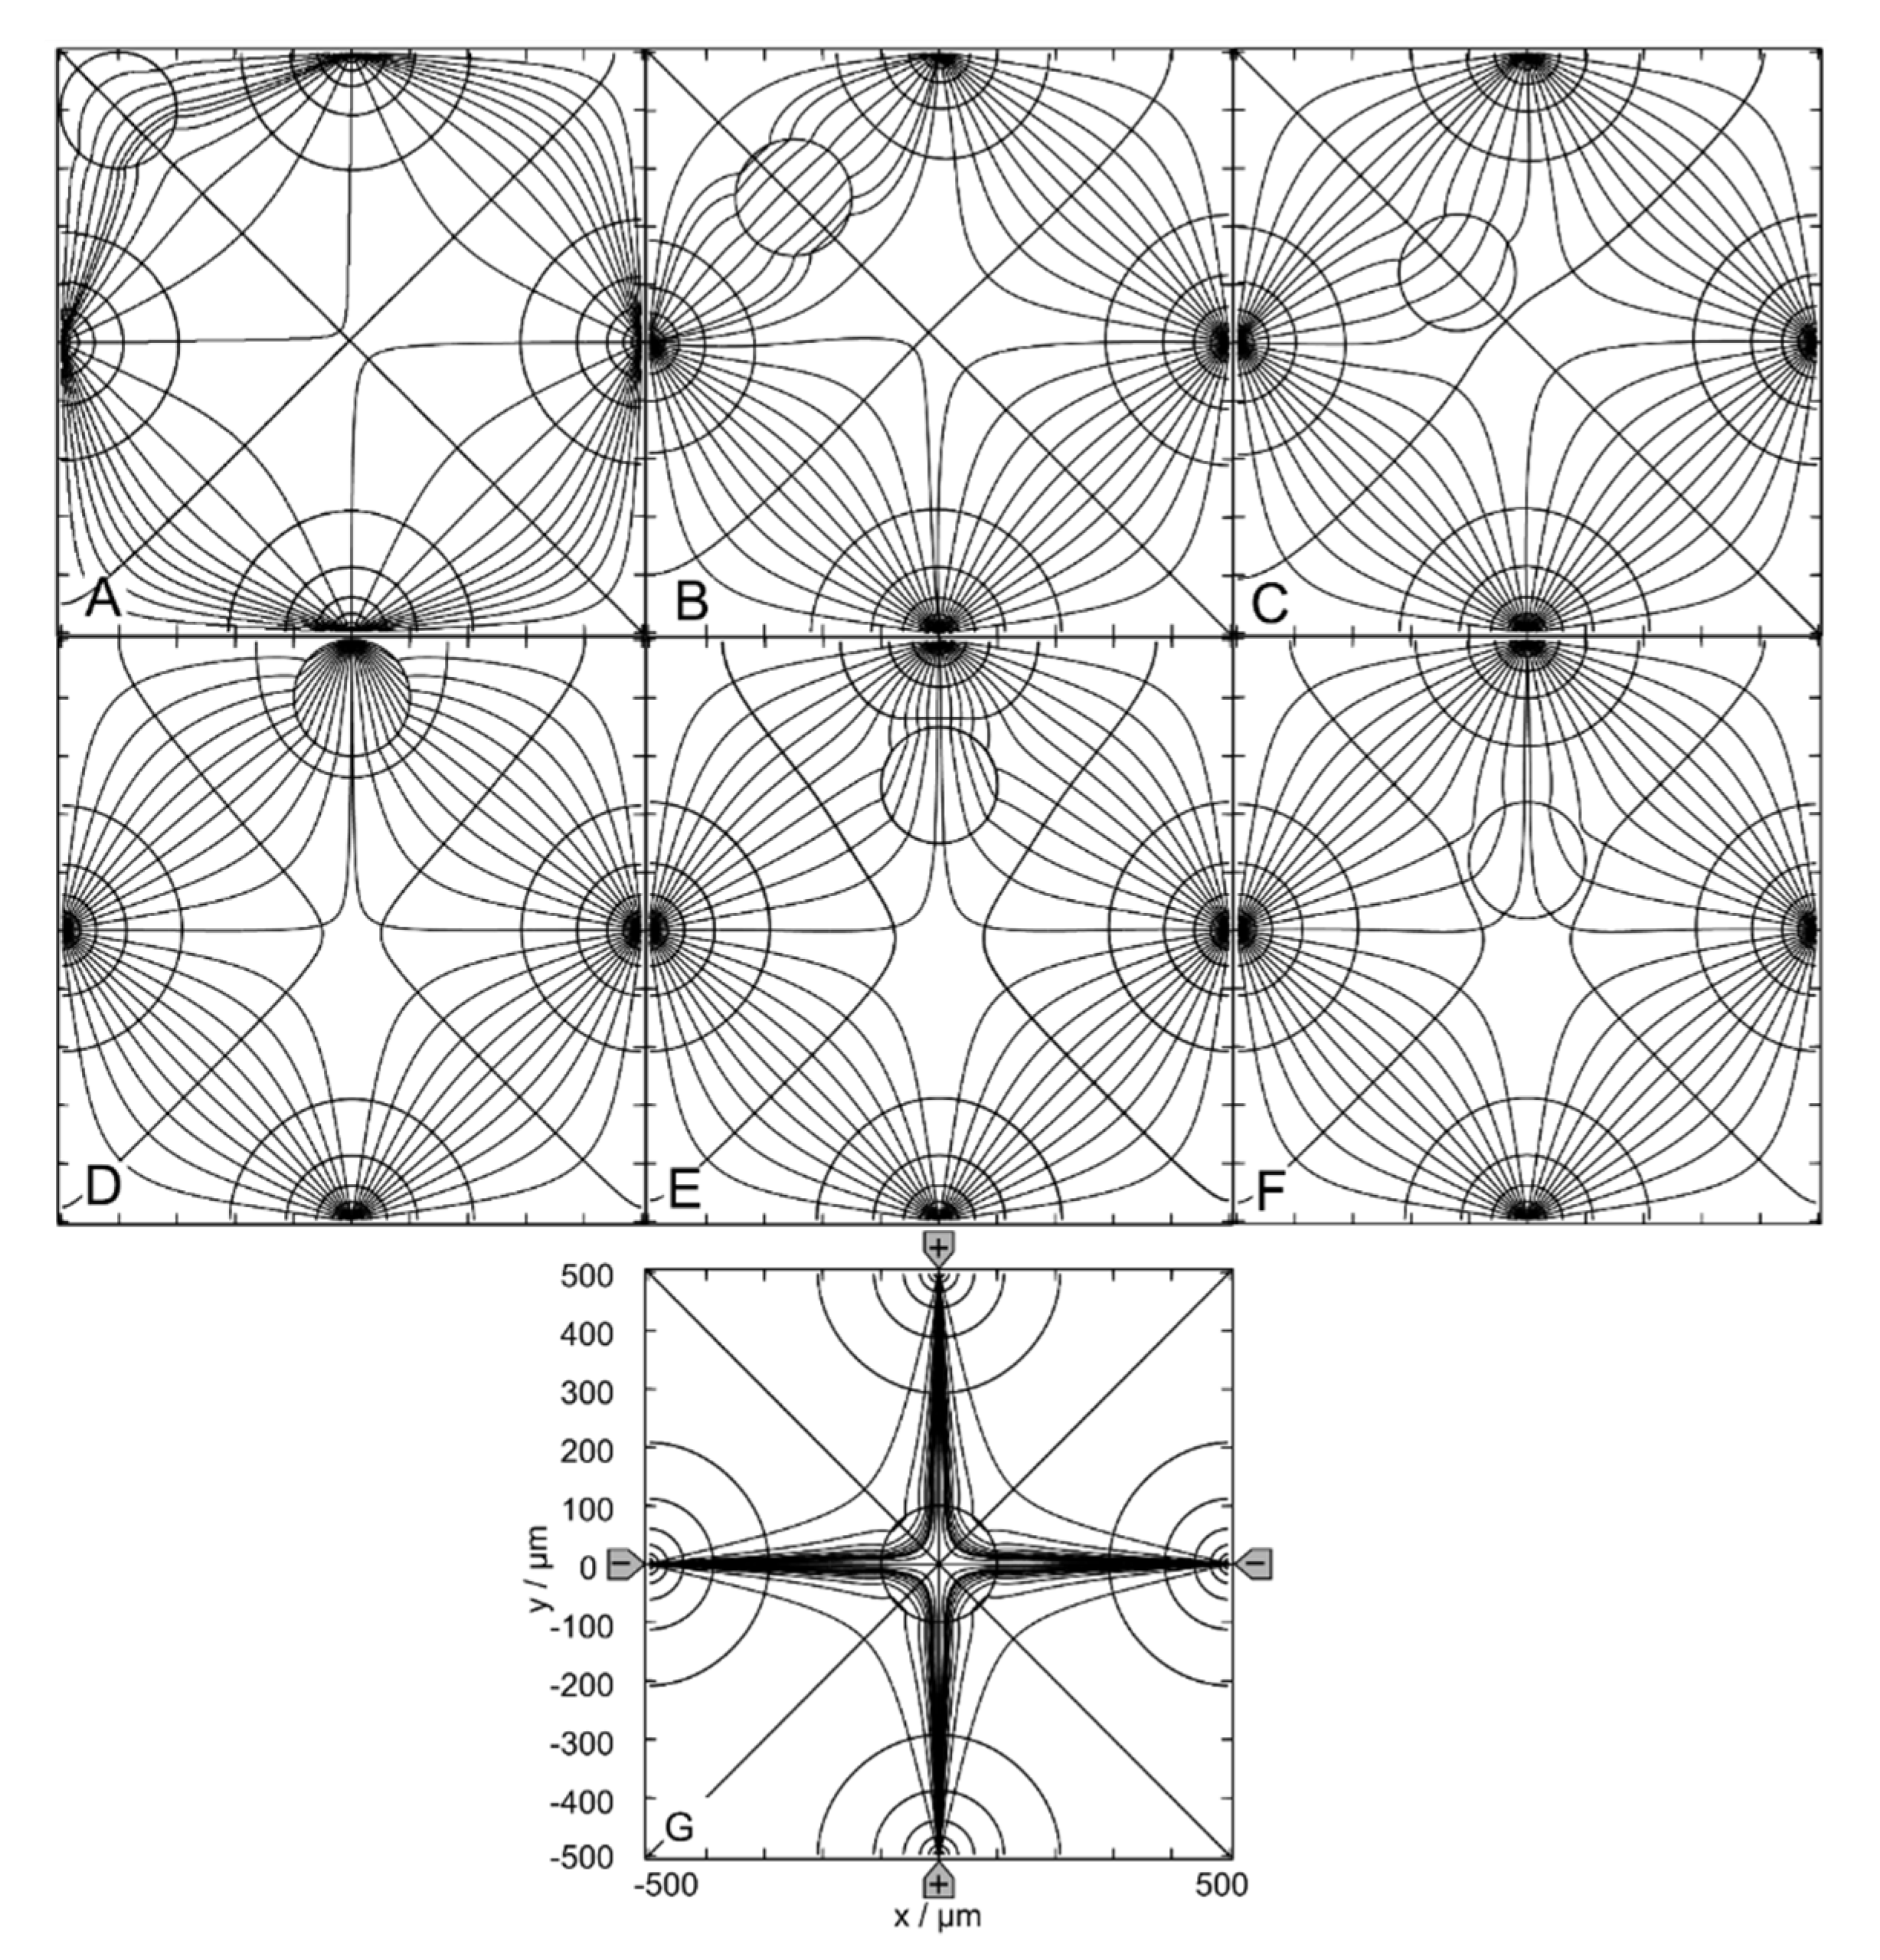
Figure 2.
Potential and current line distributions for different positions of the 1.0-S sphere in 0.1-S medium for the (++--) - drive mode. The position of the electrodes is sketched in G only. The overall conductances of the chamber are A: 51.62 mS, B: 42.50 mS, C: 42.31 mS, D: 43.09 mS, E: 43.07 mS, F: 42.46 mS and G: 42.94 mS (Table 1). The current lines were chosen to be equidistant at x=0.
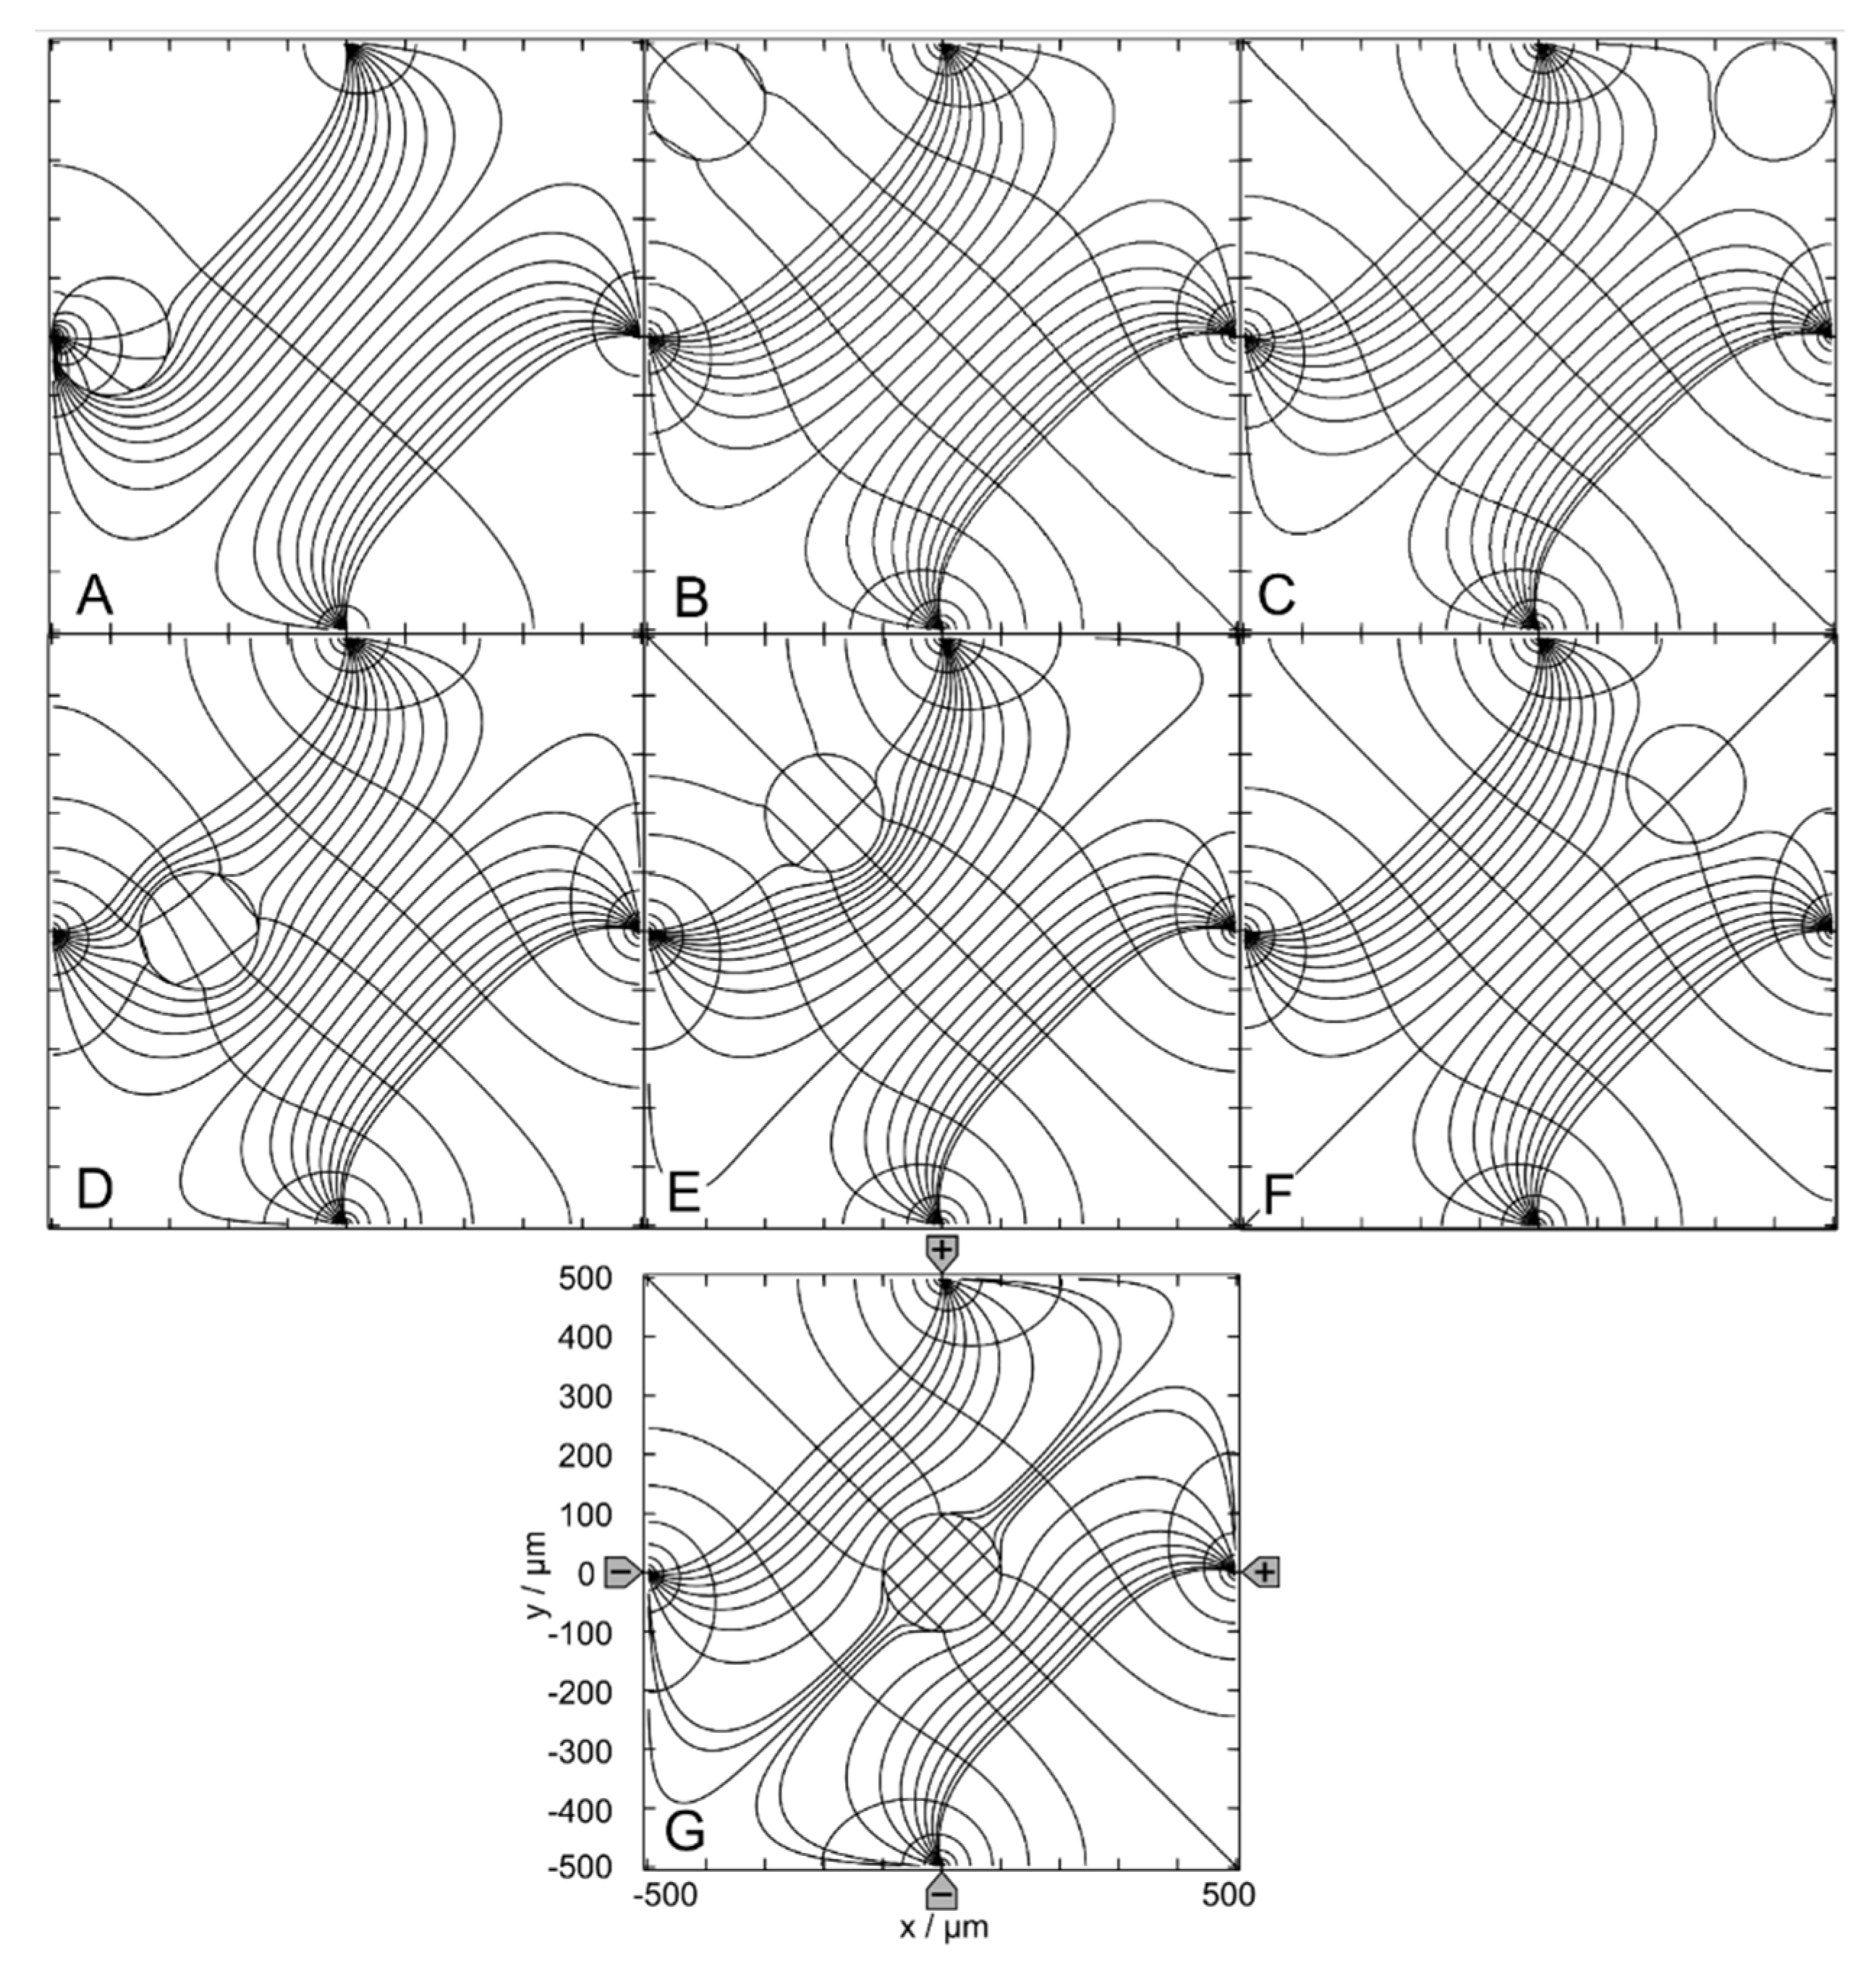
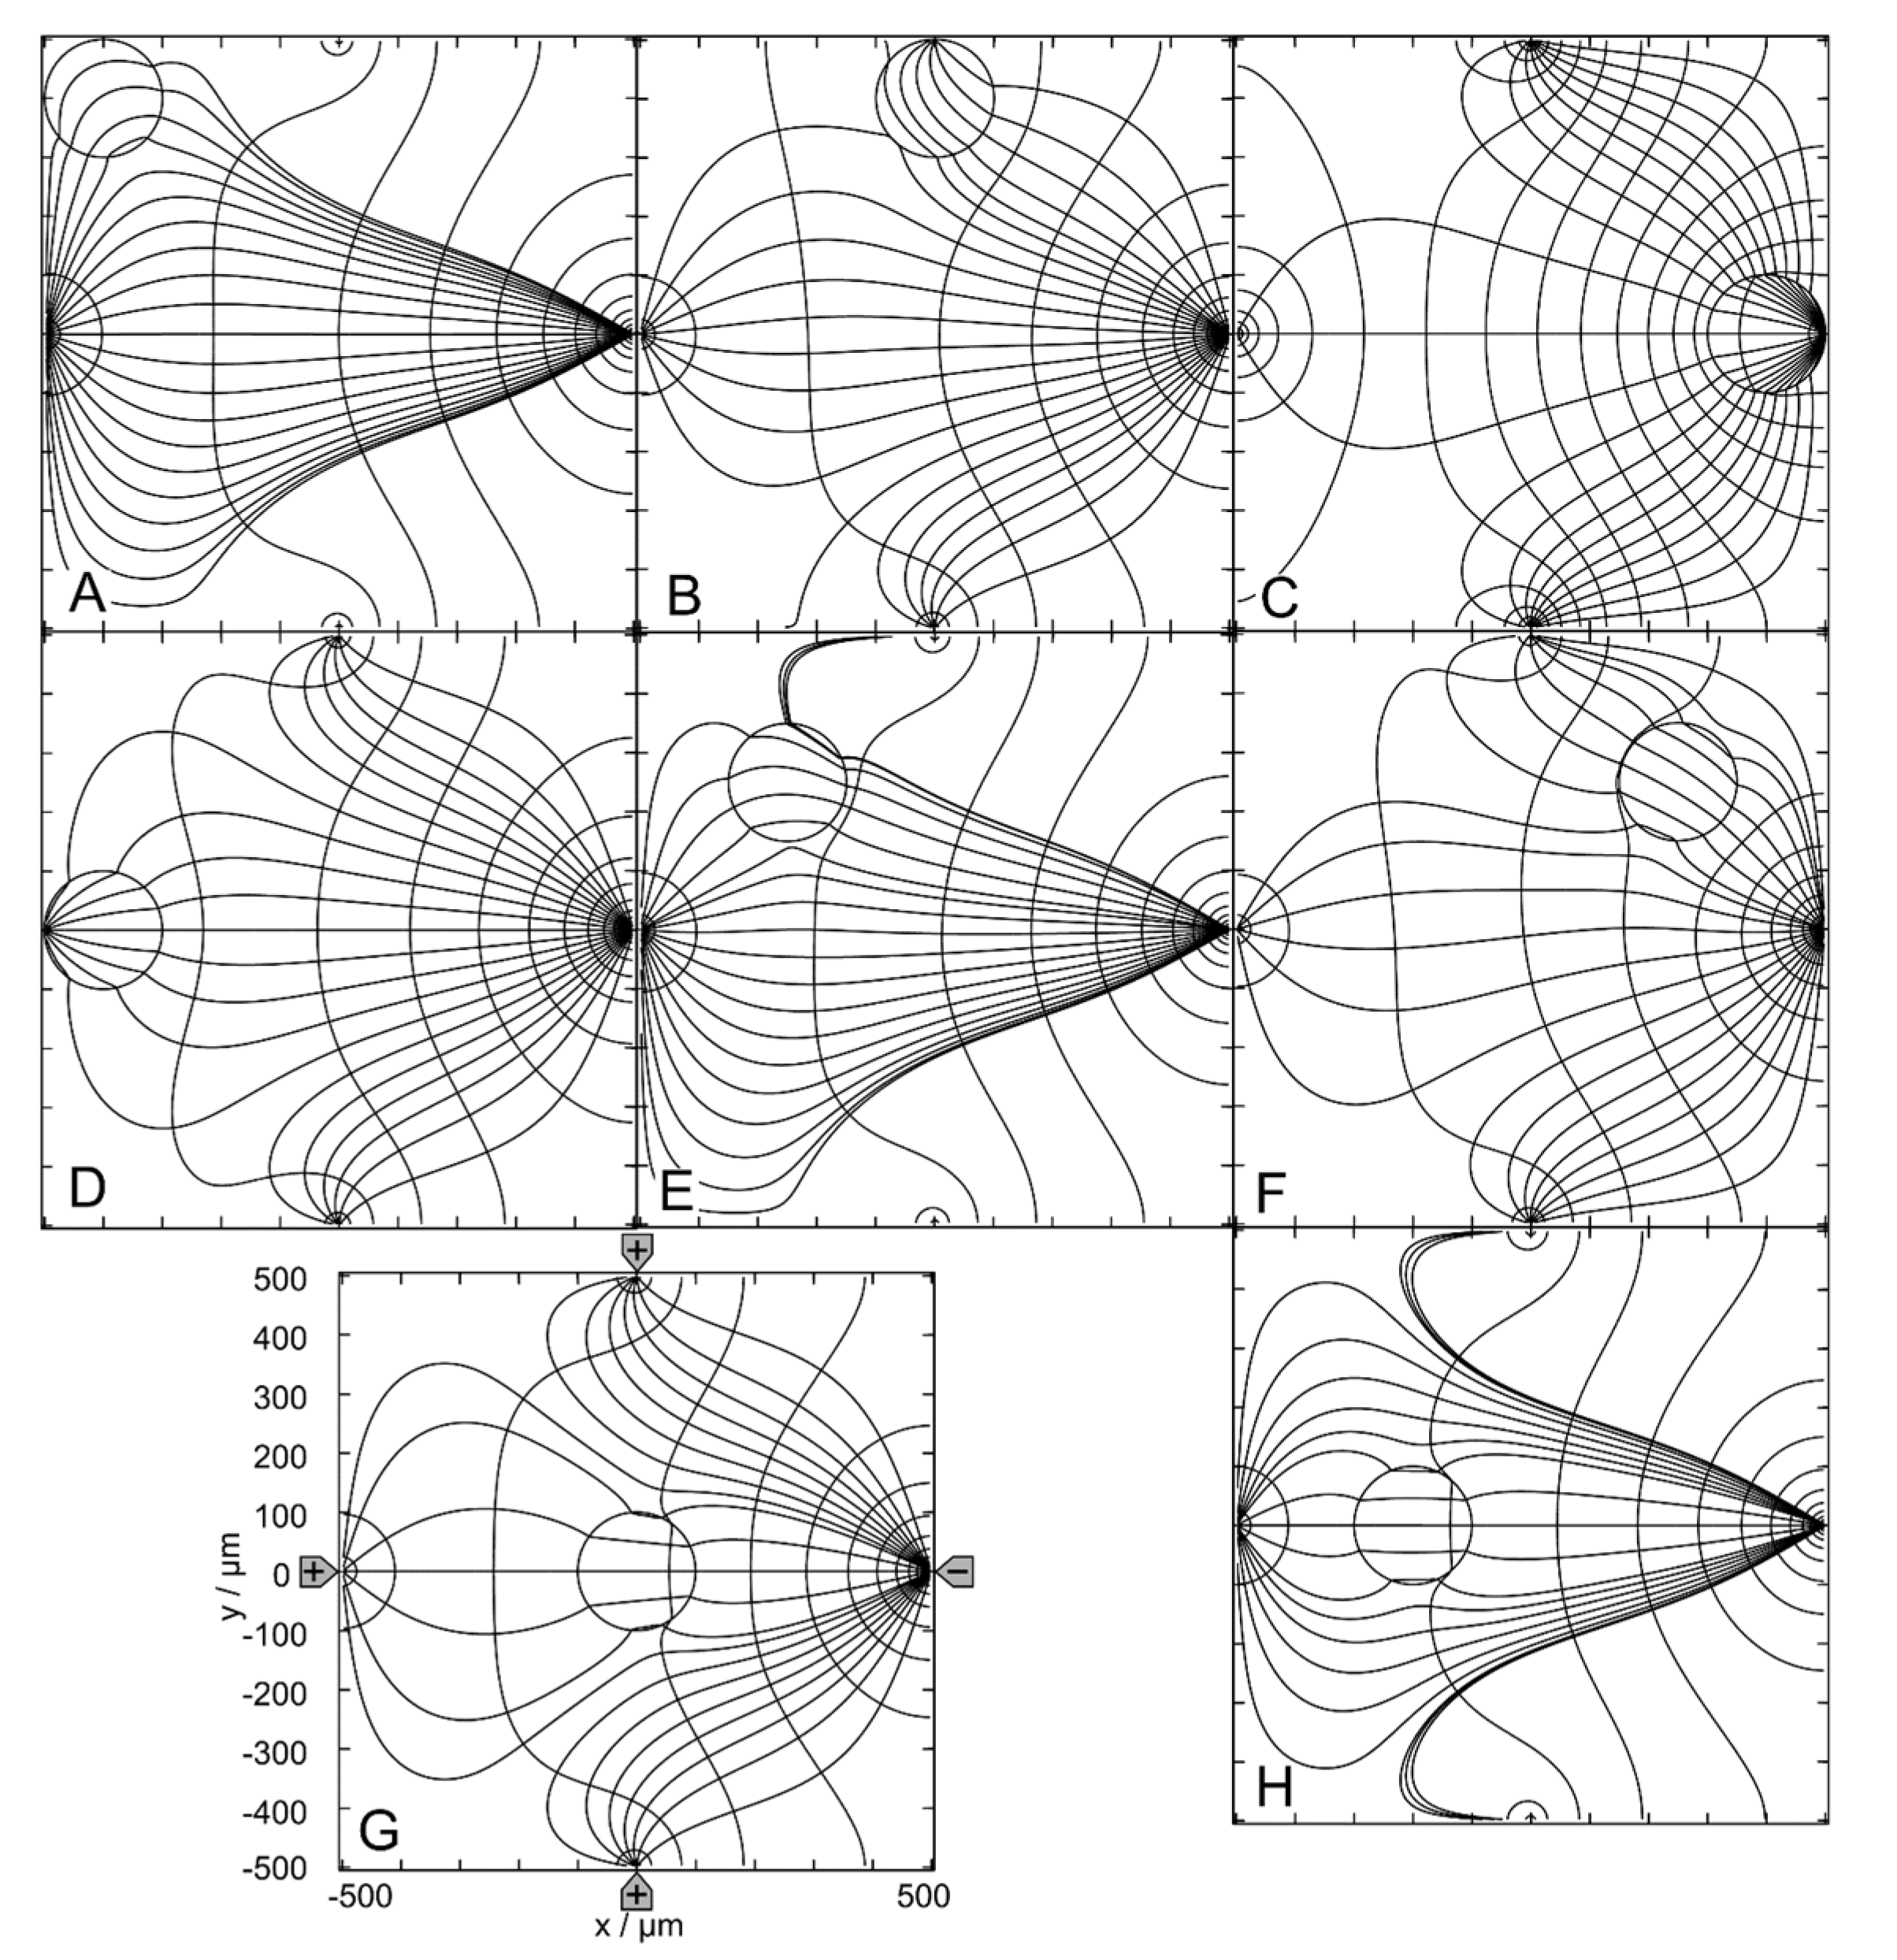
Figure 3.
Potential and current line distributions for different positions of the 0.1-S sphere in 1.0-S medium for the (++--) - drive mode. The position of the electrodes is sketched in G only. The conductances of the chamber are A: 173.0 mS, B: 420.1 mS, C: 422.9 mS, D: 414.6 mS, E: 414.3 mS, F: 421.2 mS and G: 416.4 mS (Table 1). The current lines were chosen to be equidistant at x=0.
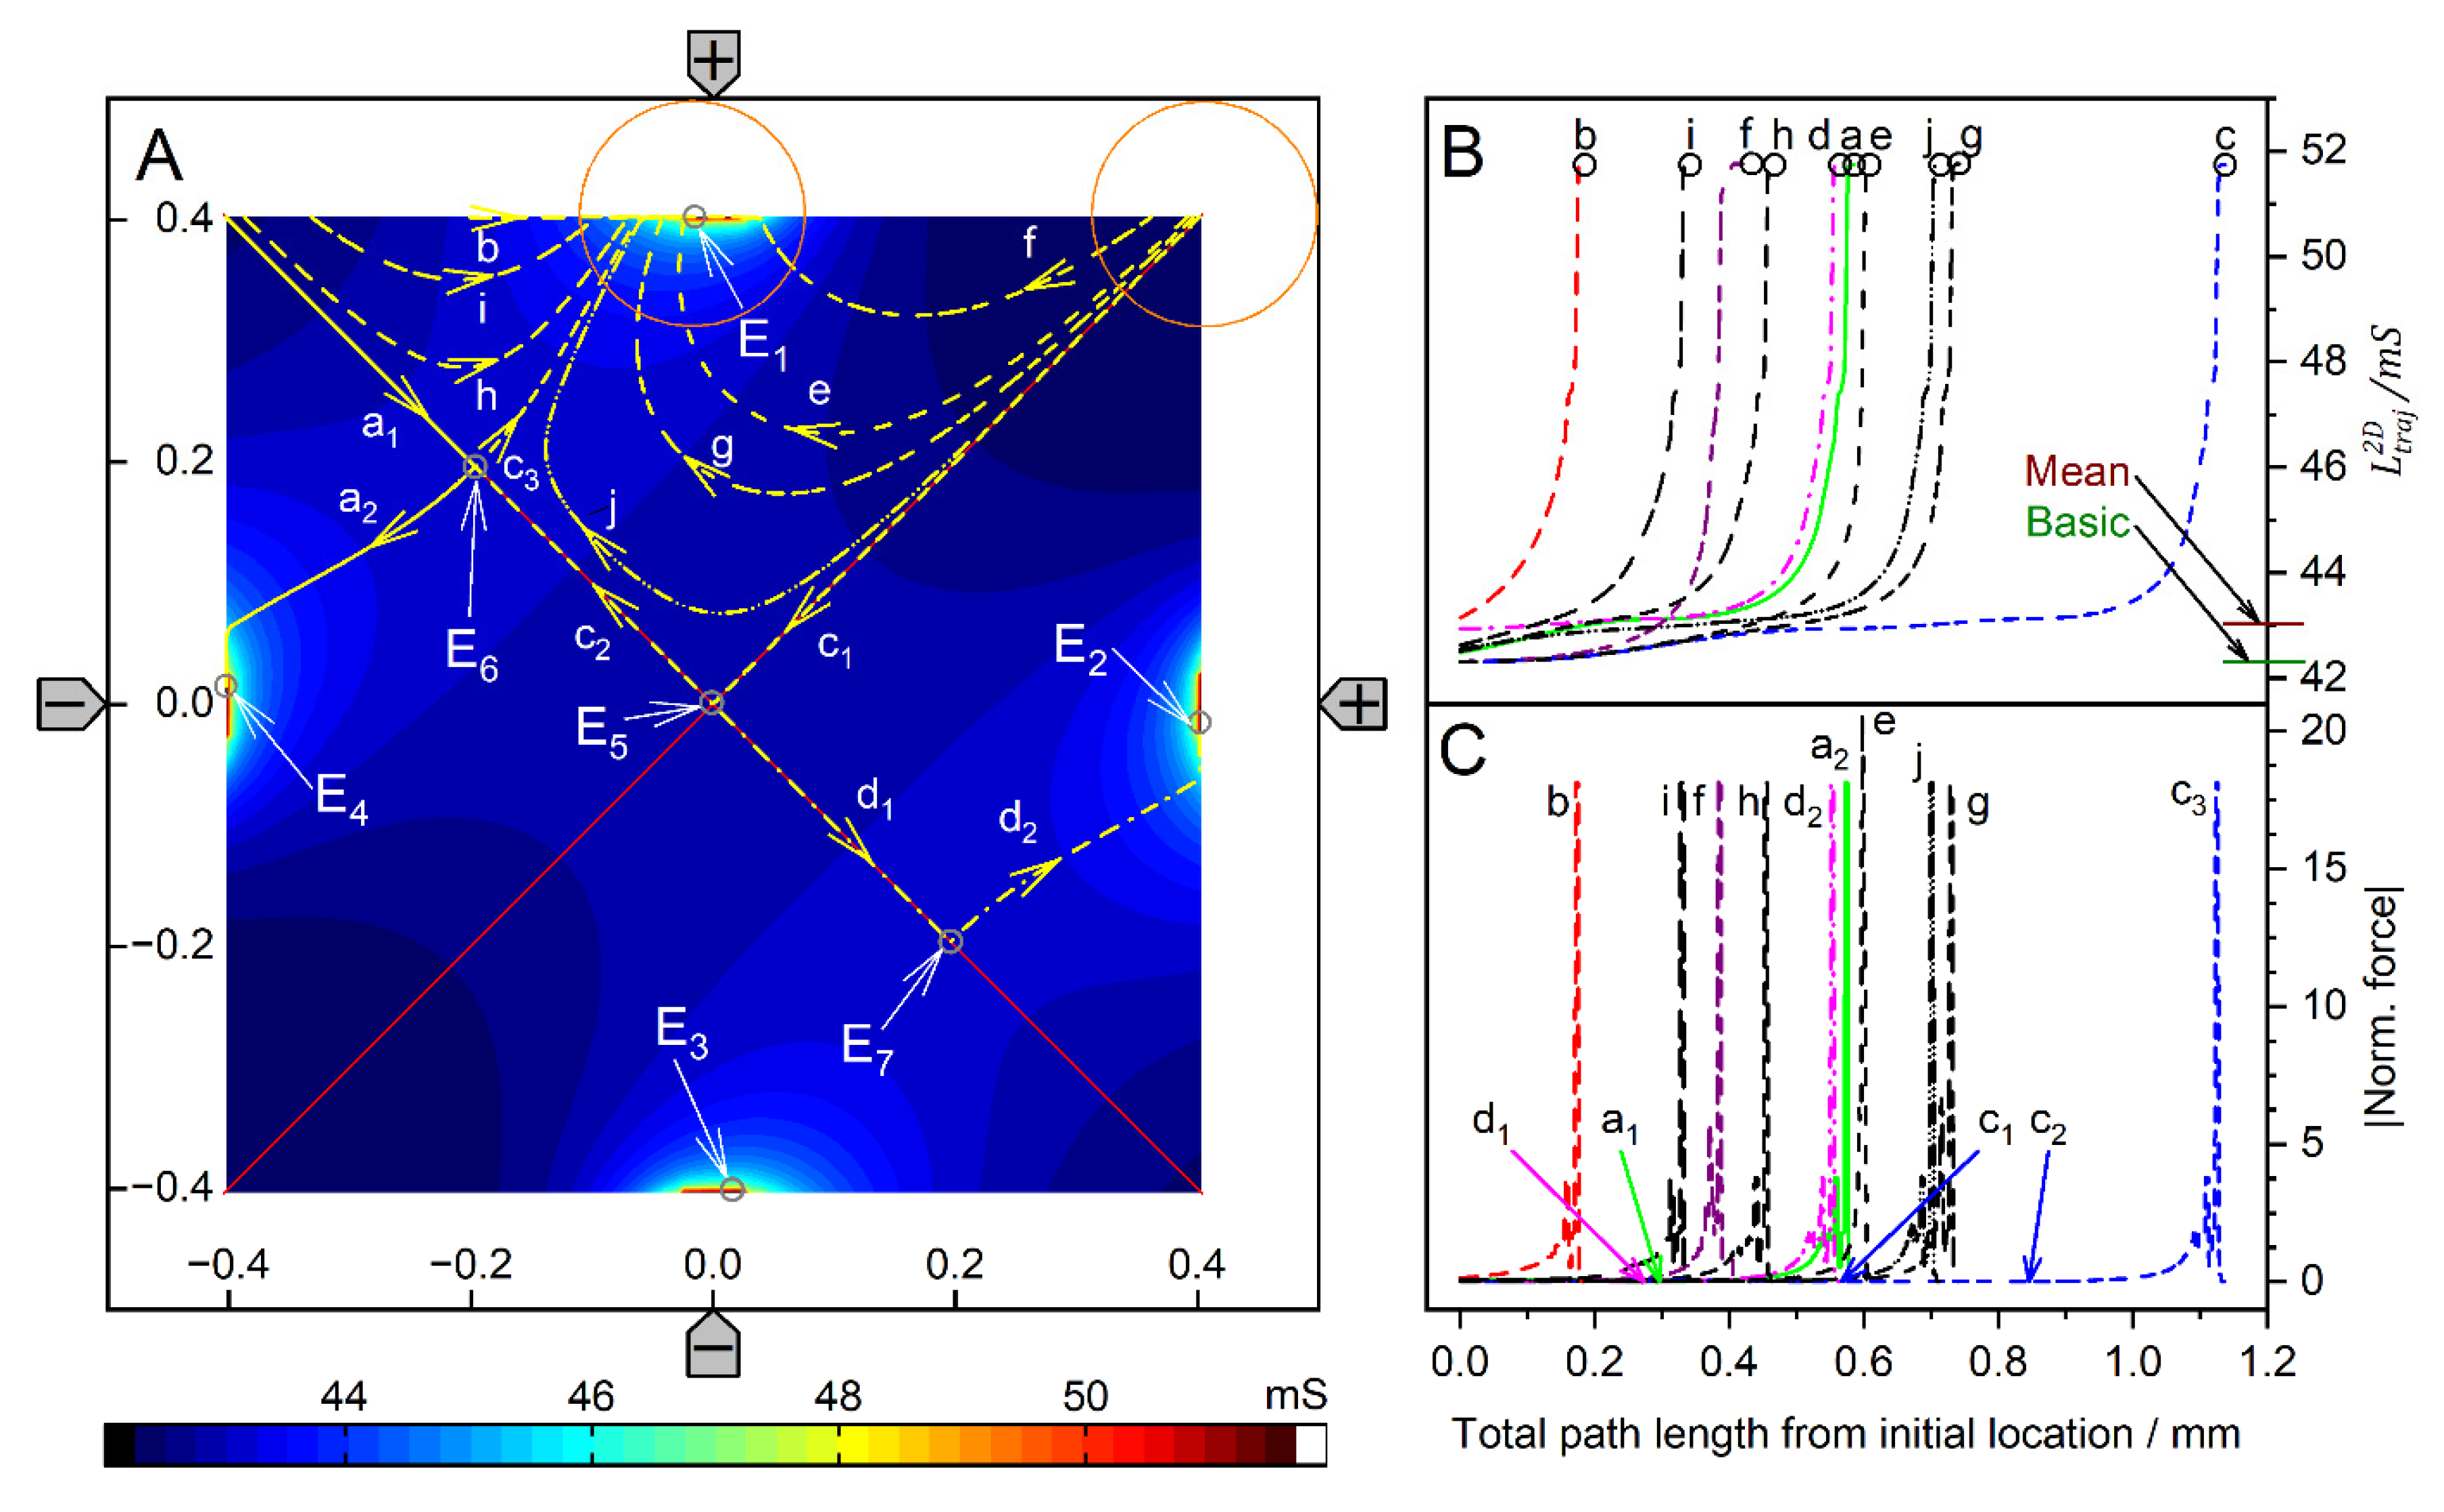
Figure 4.
Single 200-µm, 1.0-S sphere (reddish circles in A) in the chamber of Figure 1A with 0.1-S medium. A: Conductance field plot with trajectories (a-j). Two watersheds (two diagonal red lines) separate the four catchment areas of the stable endpoints E1, E2, E3 and E4. E5, E6 and E7 are unstable saddle points on one of the watersheds. B: Chamber conductance along the trajectories. The basic, minimum, mean, and maximum conductances are 42.31 mS (w/o sphere), 42.31 mS (Figure 2C), 42.03 mS, and 51.75 mS (E1 - E4), respectively (Table 1). Trajectories c1, c2, and d1 run on watersheds and through unstable endpoints. C: Normalized DEP forces calculated from the conductance values in B.
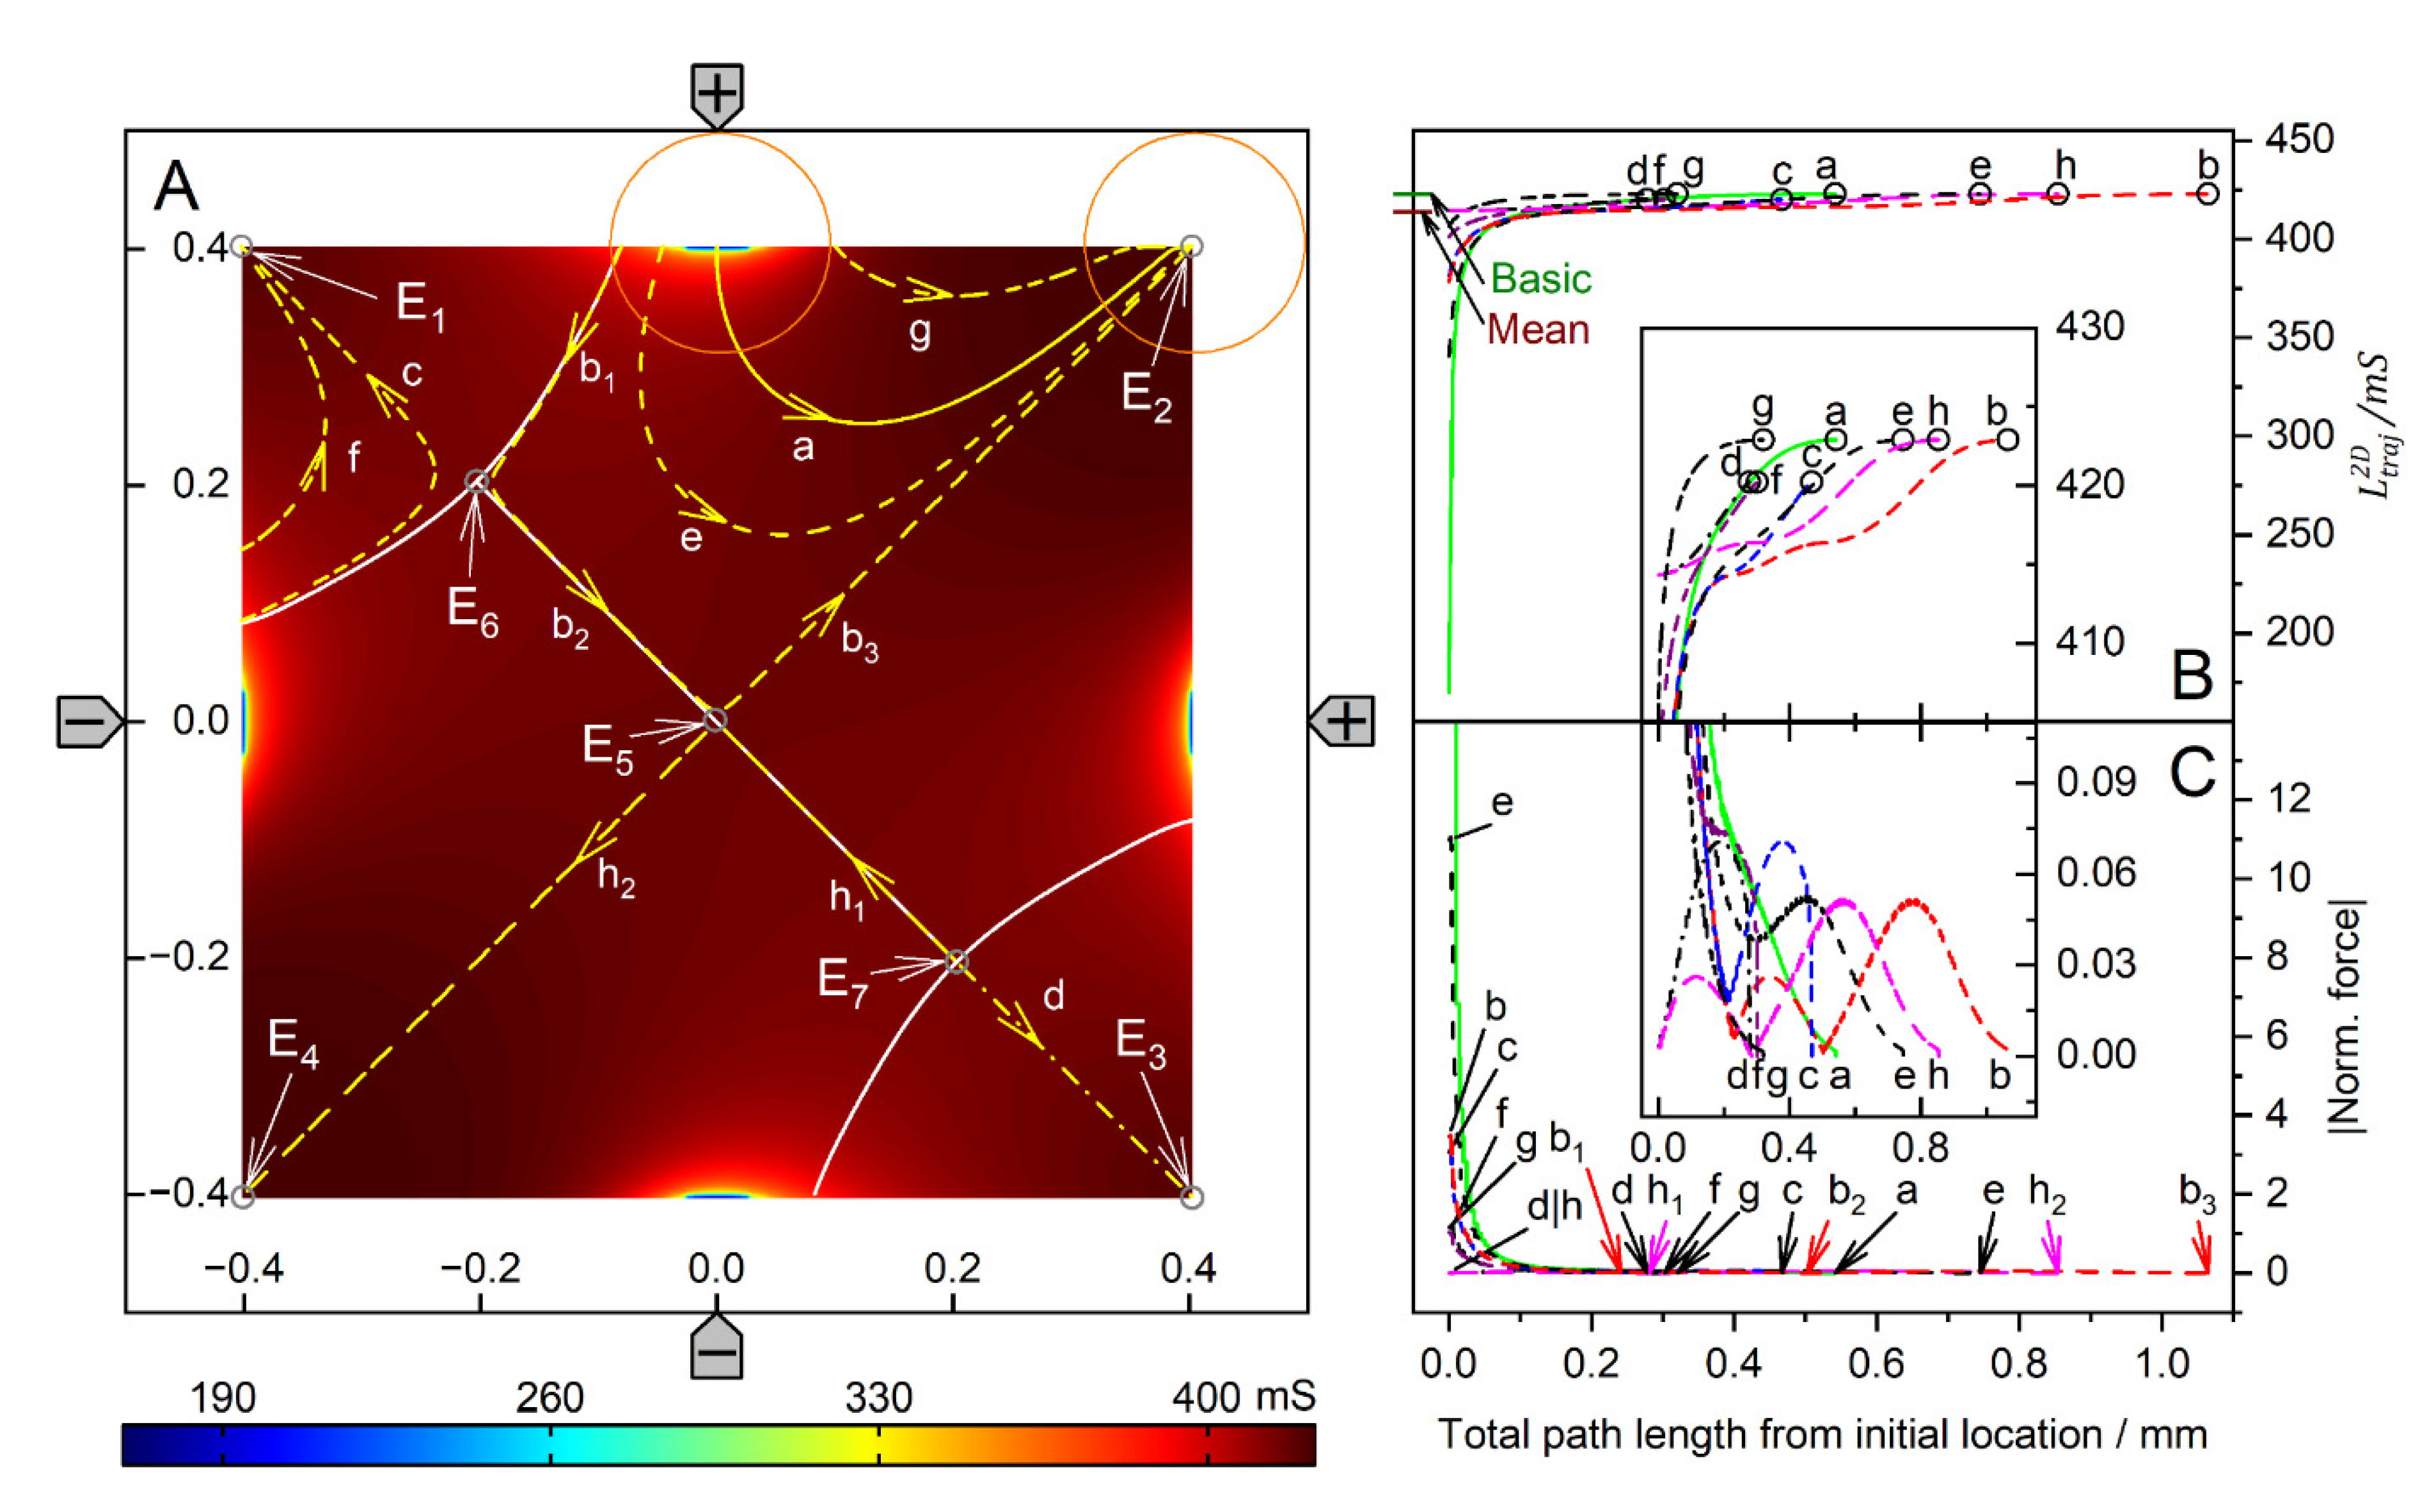
Figure 5.
Single 200-µm 2D sphere of 0.1-S (reddish circles in A) in the chamber of Figure 1 with 1.0-S medium. A: Conductance field plot with trajectories (a-h). Three watersheds (the diagonal white line between E6 and E7 and two curved lines through E6 and E7 at the end of the diagonal watershed) separate the four catchment areas of the stable endpoints E1, E2, E3 and E4. E5, E6, and E7 are unstable saddle points. B: Chamber conductance along the trajectories. The basic, minimum, mean, and maximum conductances are 422.9 mS (w/o sphere), 169.7 mS, 414.1 mS, and 422.9 mS (E1, E2, E3 and E4), respectively (Table 1). Trajectories b1, b2, and h1 follow watersheds and run across unstable endpoints. C: Normalized DEP forces calculated from the conductance values in B. The initial force peak of 75.35 for trajectory a (green) was truncated, and the ordinate was shortened to increase the resolution for all other trajectories.
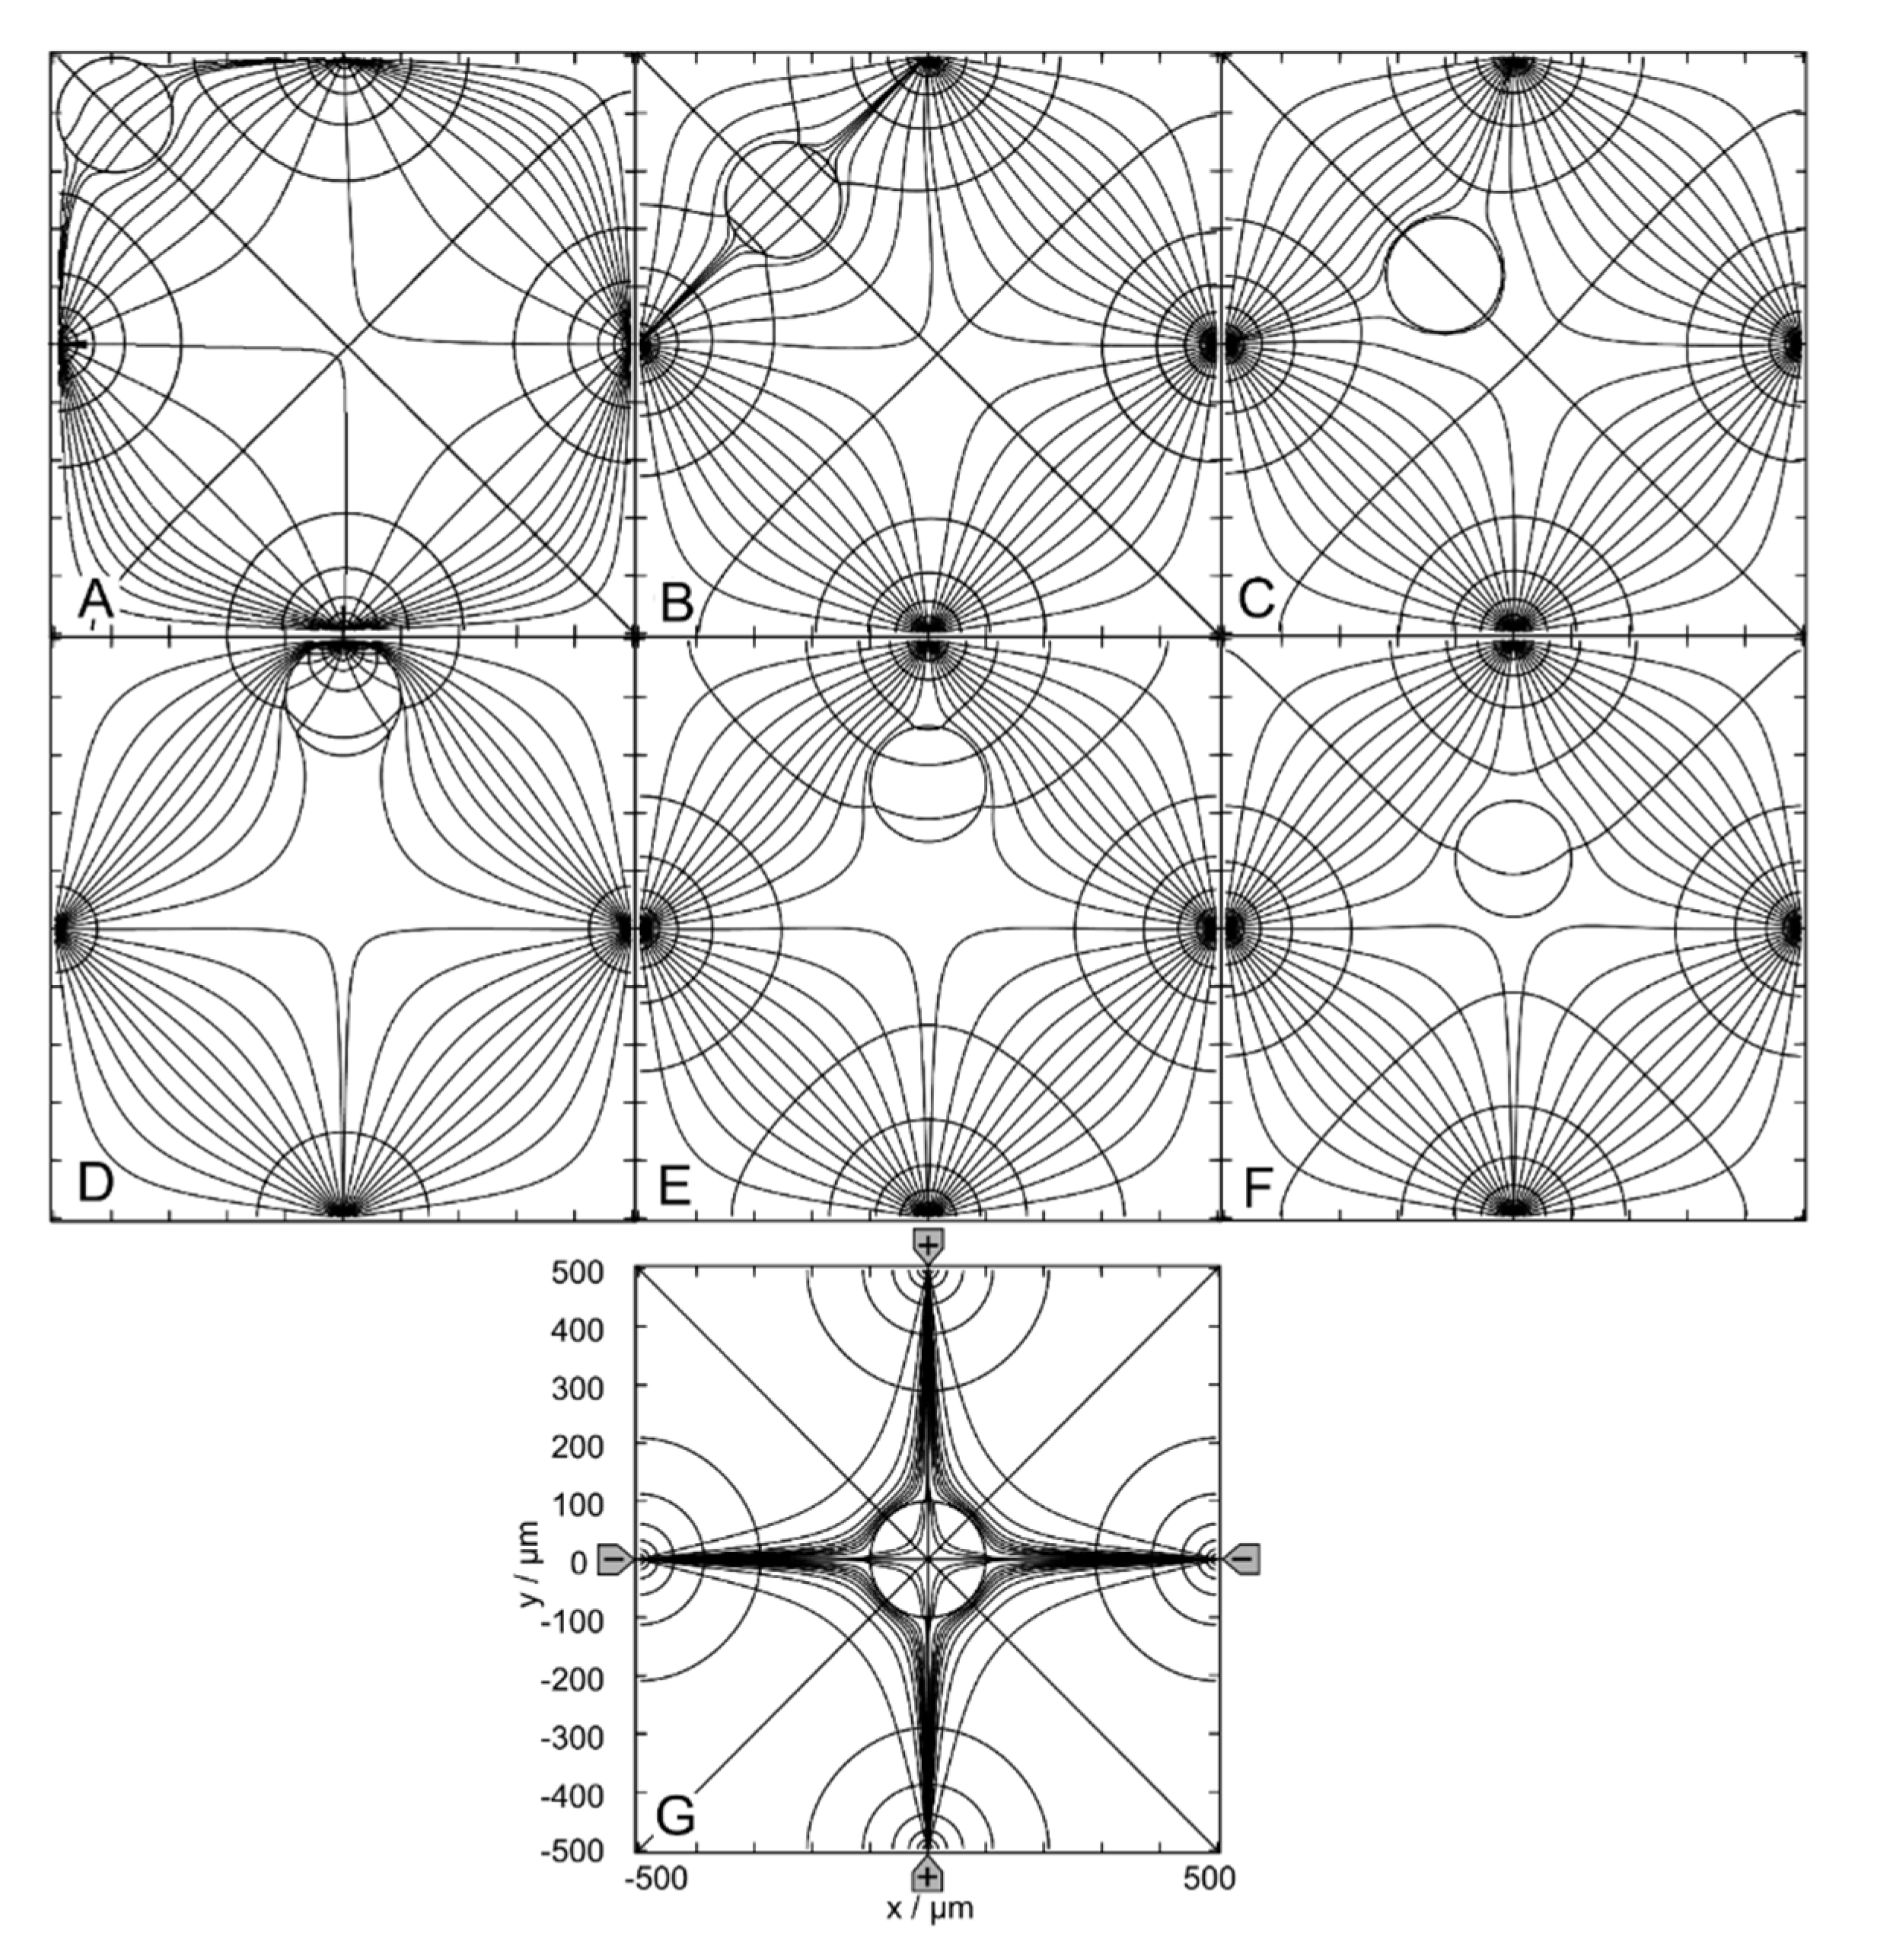
Figure 6.
Potential and current line distributions for different positions of the 1.0-S sphere in 0.1-S medium for the (+++-) - drive mode. The position of the electrodes is sketched in G only. The conductances of the chamber are A: 32.76 mS, B: 35.03 mS, C: 72.19 mS, D: 34.90 mS, E: 32.82 mS, F: 33.34 mS, G: 33.09 mS and H: 32.96 mS (Table 1). The current lines were chosen to be equidistant at x=-300 µm (A), x=-250 µm (E), x=-200 µm (H), x=50 µm (B, D, G), x=250 µm (F) and x=300 µm (C).
Figure 7.
Potential and current line distributions for different positions of the 0.1-S sphere in 1.0-S medium for the (+++-) - drive mode. The position of the electrodes is sketched only in G. The conductances of the chamber are A: 327.3 mS, B: 217.9 mS, C: 60.02 mS, D: 218.8 mS, E: 326.6 mS, F: 321.0 mS, G: 323.8 mS and H: 325.2 mS (Table 1). The current lines were chosen to be equidistant at x=-300 µm (A), x=-250 µm (E), x=-200 µm (H), x=50 µm (B, D, G), x=250 µm (F) and x=300 µm (C).
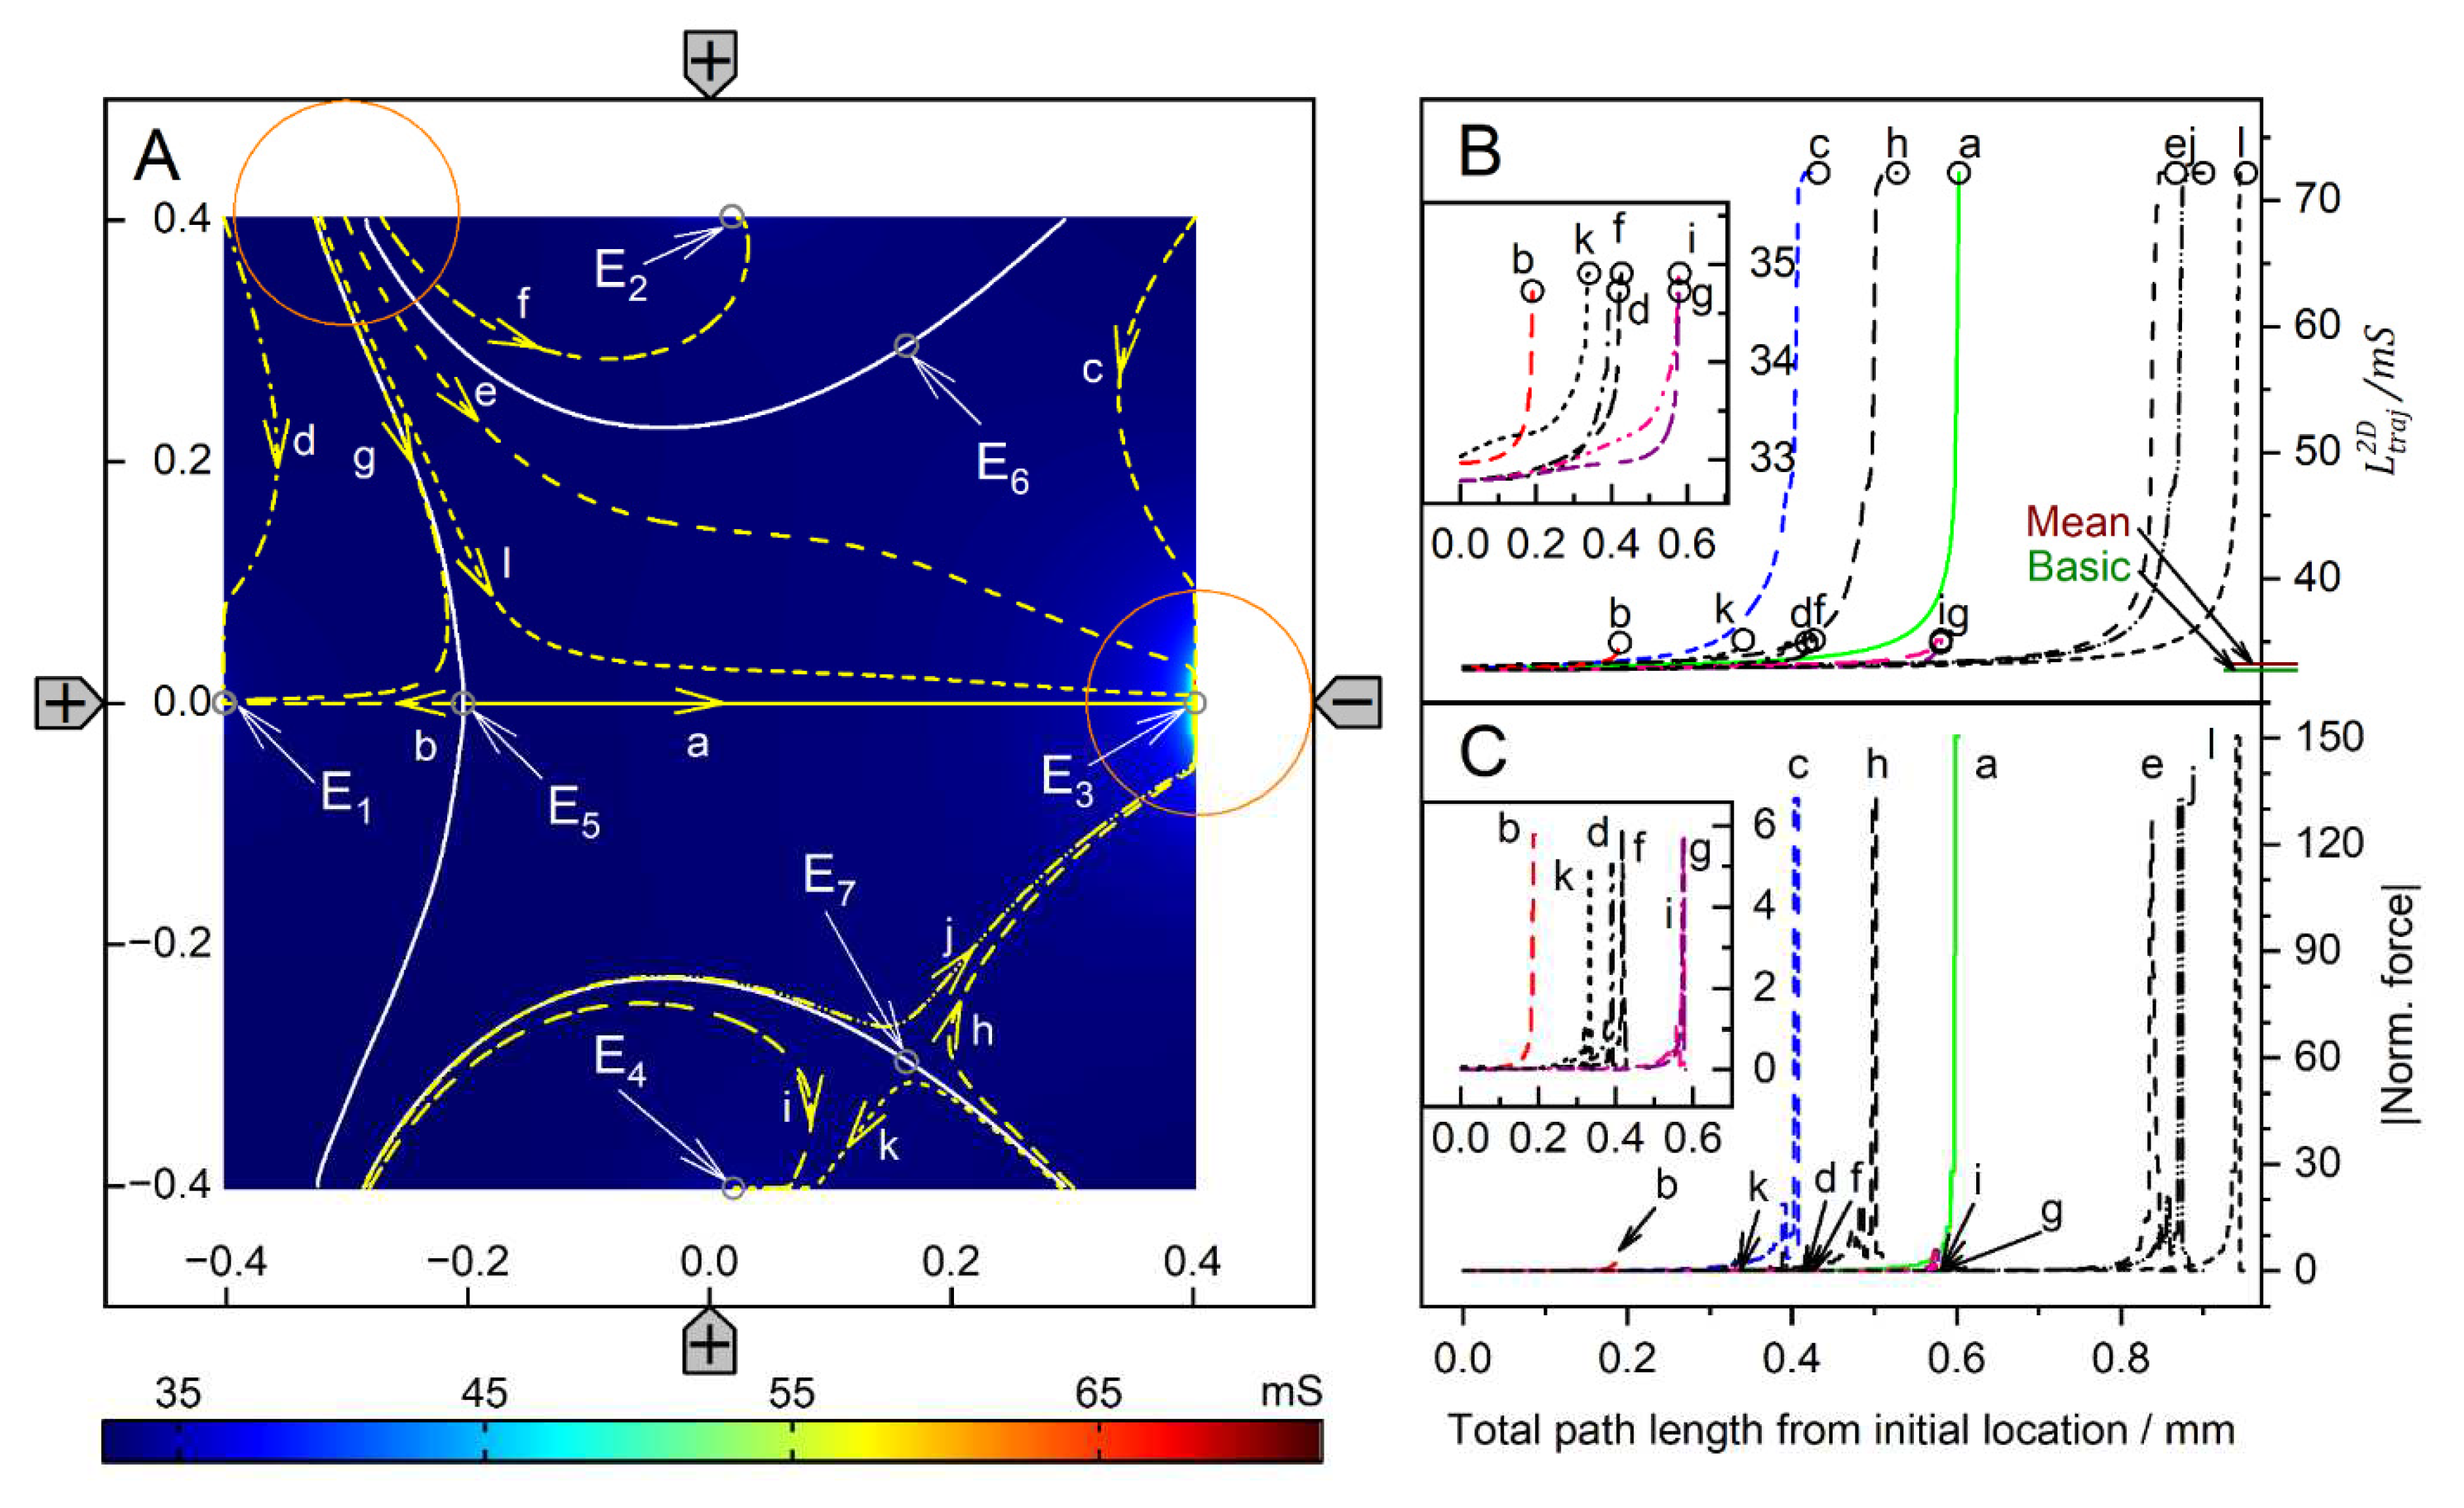
Figure 8.
Single 200-µm, 1.0-S sphere (reddish circles in A) in the chamber of Figure 1B with 0.1-S medium. A: Conductance field plot with trajectories (a-k). Three watersheds (curved white lines) with unstable saddle points E5, E6, and E7 separate four catchment areas for the stable endpoints E1, E2, E3, and E4. B: Chamber conductance along the trajectories. The basic, minimum, mean, and maximum conductances are 32.75 mS (w/o sphere), 32.76 mS (Figure 6A), 33.27 mS, and 72.19 mS (Figure 6C; E3), respectively (Table 1). C: Normalized DEP forces calculated from the conductance values in B. The arrows mark the ends of trajectories.
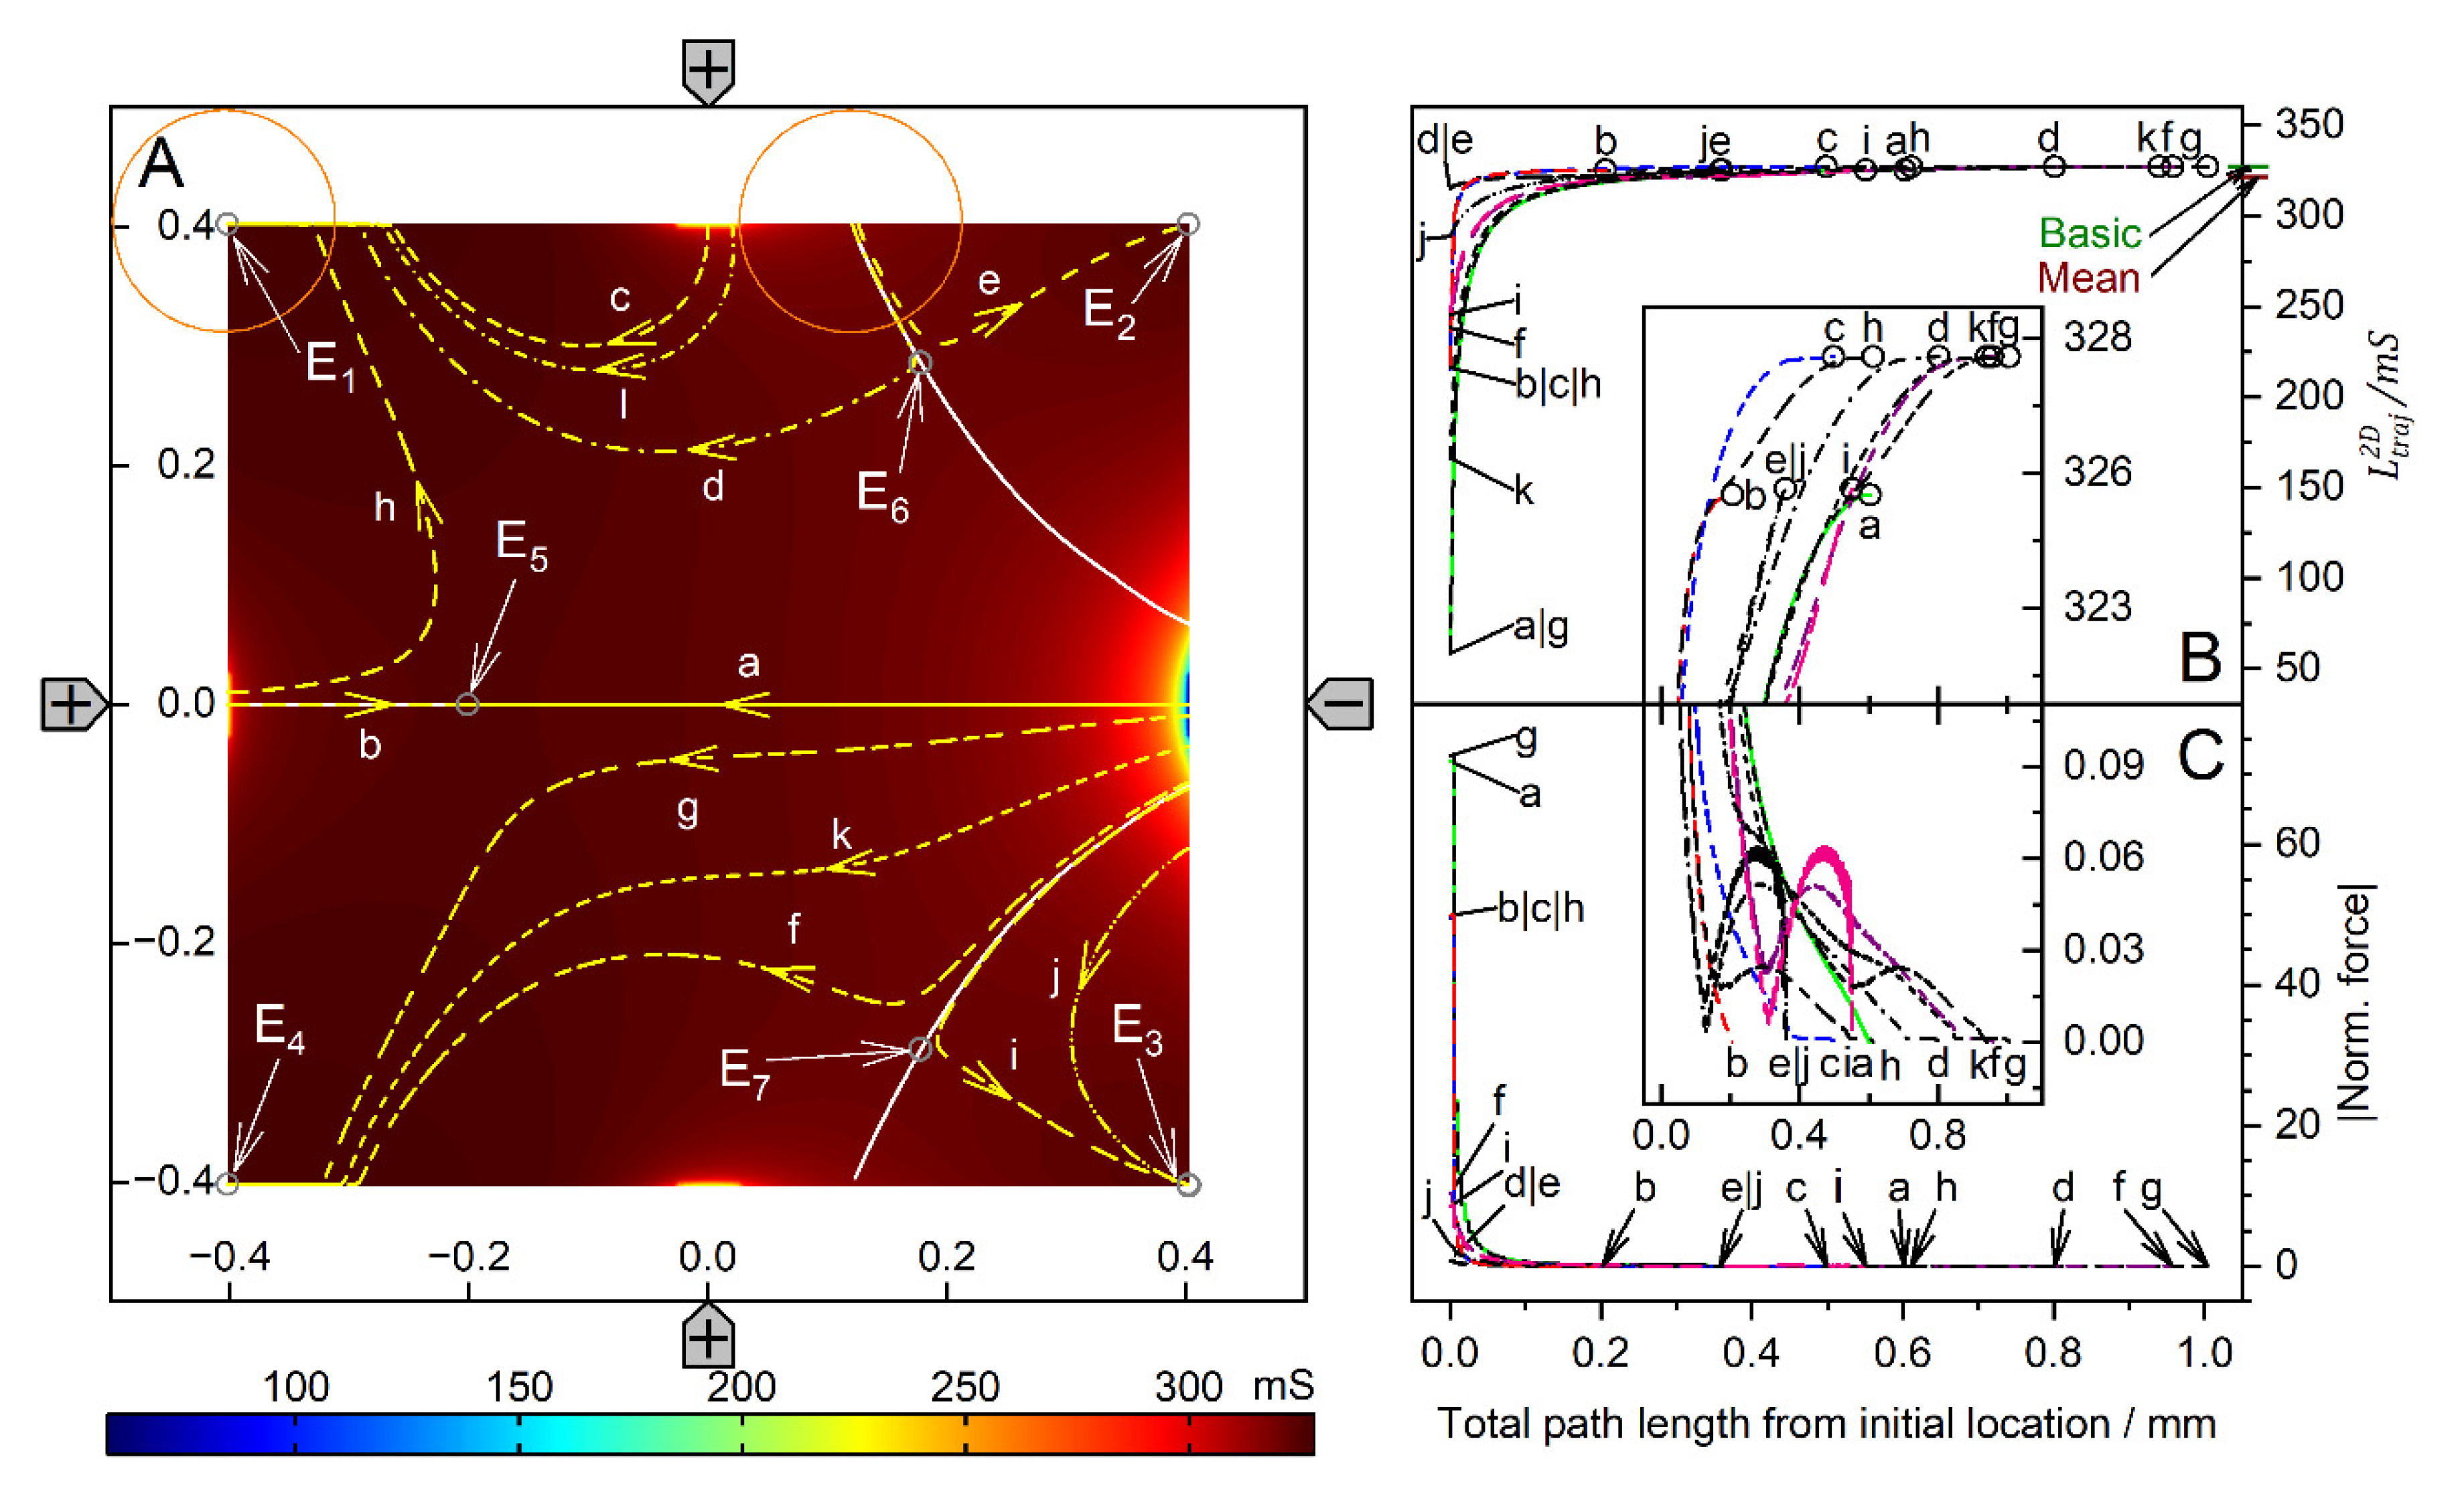
Figure 9.
Single 200-µm 2D sphere of 0.1-S (reddish circles in A) in the chamber of Figure 1B with 1.0-S medium. A: Conductance field plot with trajectories (a-k). Three watersheds (horizontal symmetry line, two curved white lines) with the unstable saddle points E5, E6, and E7 separate four catchment areas for the stable endpoints E1, E2, E3, and E4. B: Chamber conductance along the trajectories. The basic, minimum, mean, and maximum conductances are 327.4 mS (w/o sphere), 58.45, 321.4 mS, and 327.3 mS (Figure 7A), respectively (Table 1). C: Normalized DEP forces calculated from the conductance values in B. The DEP force is zero at the saddle points E5, E6, and E7 but not at the stable endpoints E1, E2, E3, and E4. The arrows mark the ends of trajectories.
Figure 10.
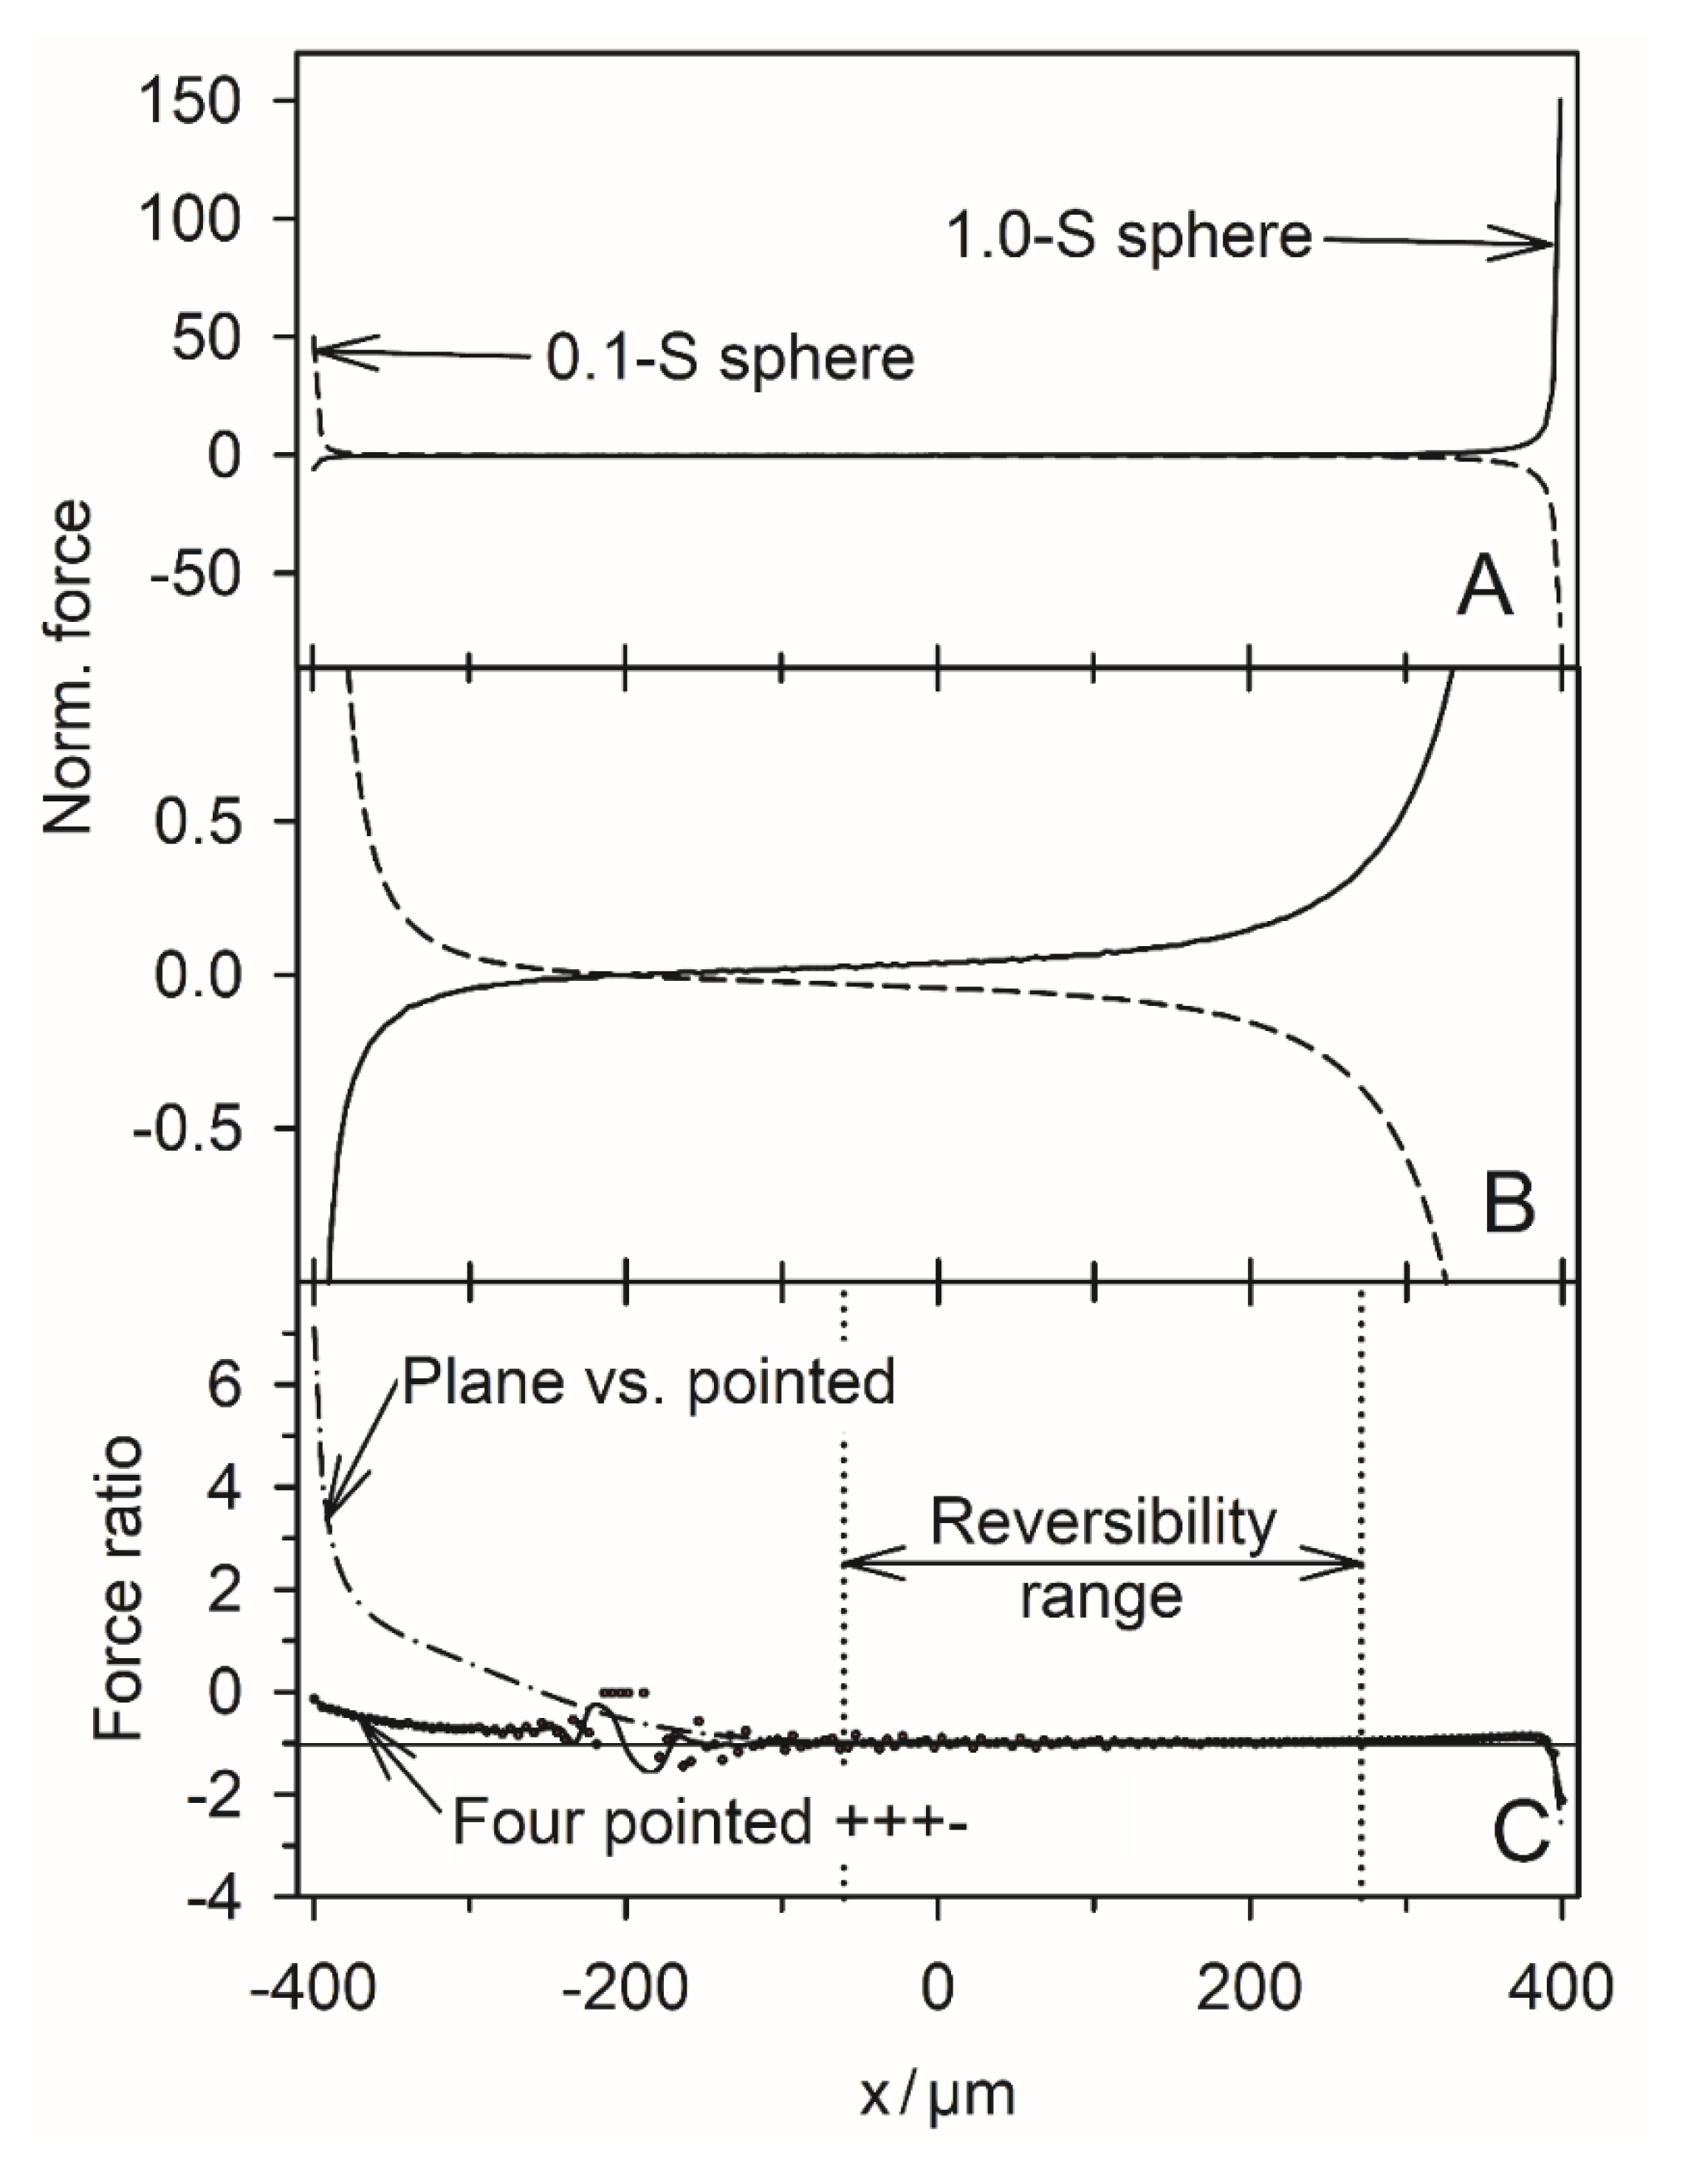
Normalized DEP forces and DEP force reversibility along the chamber’s symmetry line in the DEP mode.
A: Normalized DEP forces acting on the 1.0-S (full line, corresponding to trajectories a and b in
Figure 8) and 0.1-S spheres (dashed line, corresponding to trajectories a and b in
Figure 9).
B: Zoom of A. The forces vanish for x=-201 µm for both spheres at the bifurcation points E
5 (
Figure 8 and
Figure 9).
C: DEP force reversibility as calculated from the quotient of the normalized DEP forces on the 1.0-S and 0.1-S spheres using the data of Tables S3 and S4, which are summarized in Table S7, Supplementary Materials). The horizontal line marks the force ratio of -1, i.e., ideal reversibility, which can be assumed to be within the “reversibility range” -60 µm < x < 270 µm.
Figure 11.
Potential and current line distributions for different positions of the 1.0-S sphere in 0.1-S medium. The location of the electrodes is sketched only in G. The conductances of the chamber are A: 46.78 mS, B: 47.04 mS, C: 46.84 mS, D: 57.85 mS, E: 47.10 mS, F: 46.77 mS and G: 46.69 mS (Table 1). Equipotential and current lines were combined from separate calculations for the left and right halves of the chamber, with current lines chosen to be equidistant at x=-40 µm and x=40 µm, respectively.
Figure 12.
Potential and current line distributions for different positions of the 0.1-S sphere in 1.0-S medium. The position of the electrodes is sketched only in G. The conductances of the chamber are A: 464.8 mS, B: 462.3 mS, C: 464.7 mS, D: 180.5 mS, E: 461.8 mS, F: 465.4 mS and G: 466.2 mS (Table 1). Equipotential and current lines were combined from separate calculations for the left and right halves of the chamber, with current lines chosen to be equidistant at x=-40 µm and x=40 µm, respectively.
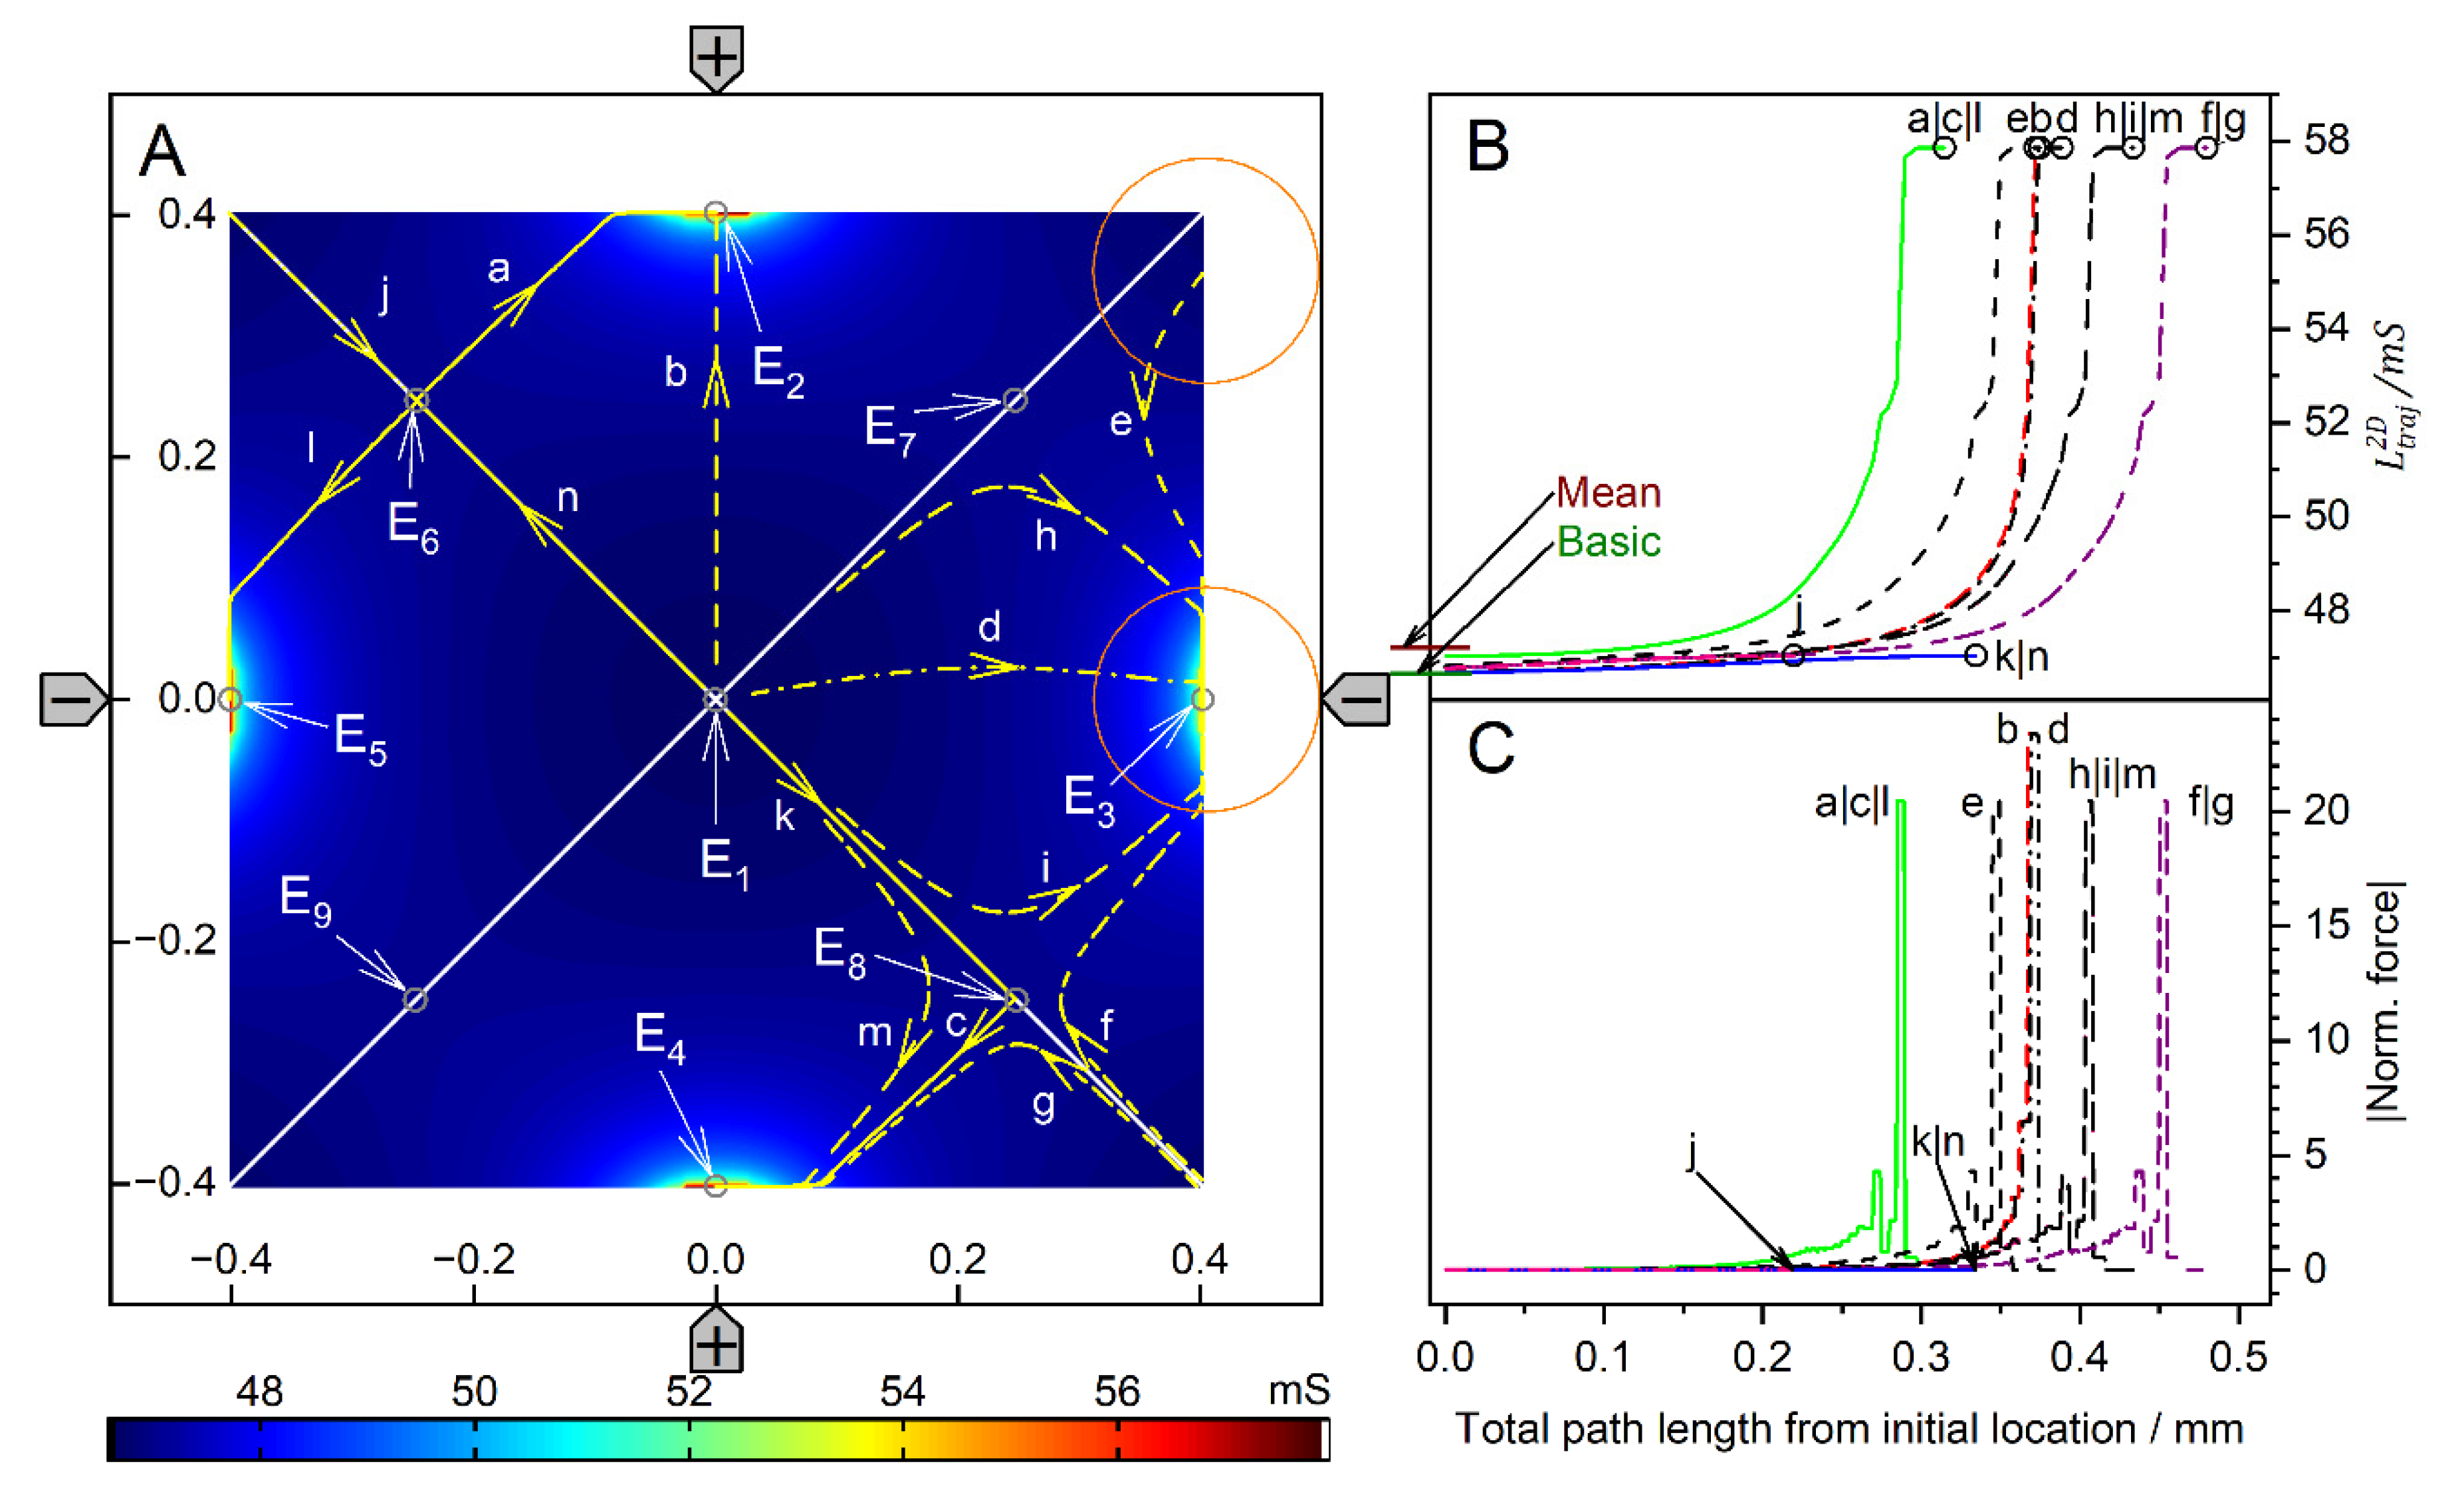
Figure 13.
Single 200-µm, 1.0-S sphere (reddish circles in A) in the chamber of Figure 1C with 0.1-S medium. A: Conductance field plot with trajectories (a-n). Two diagonal watersheds separate the four catchment areas of the stable endpoints E2, E3, E4 and E5. E1 is a single unstable point precisely in the chamber’s center. B: Chamber conductance along the trajectories. The basic, minimum, mean, and maximum conductances are 46.67 mS (w/o sphere), 46.69 mS (Figure 10G), 47.21, and 57.85 mS (Figure 10D; E2, E3, E4, E5). C: Normalized DEP forces calculated from the conductance values in B. The arrows mark the end of the trajectories.
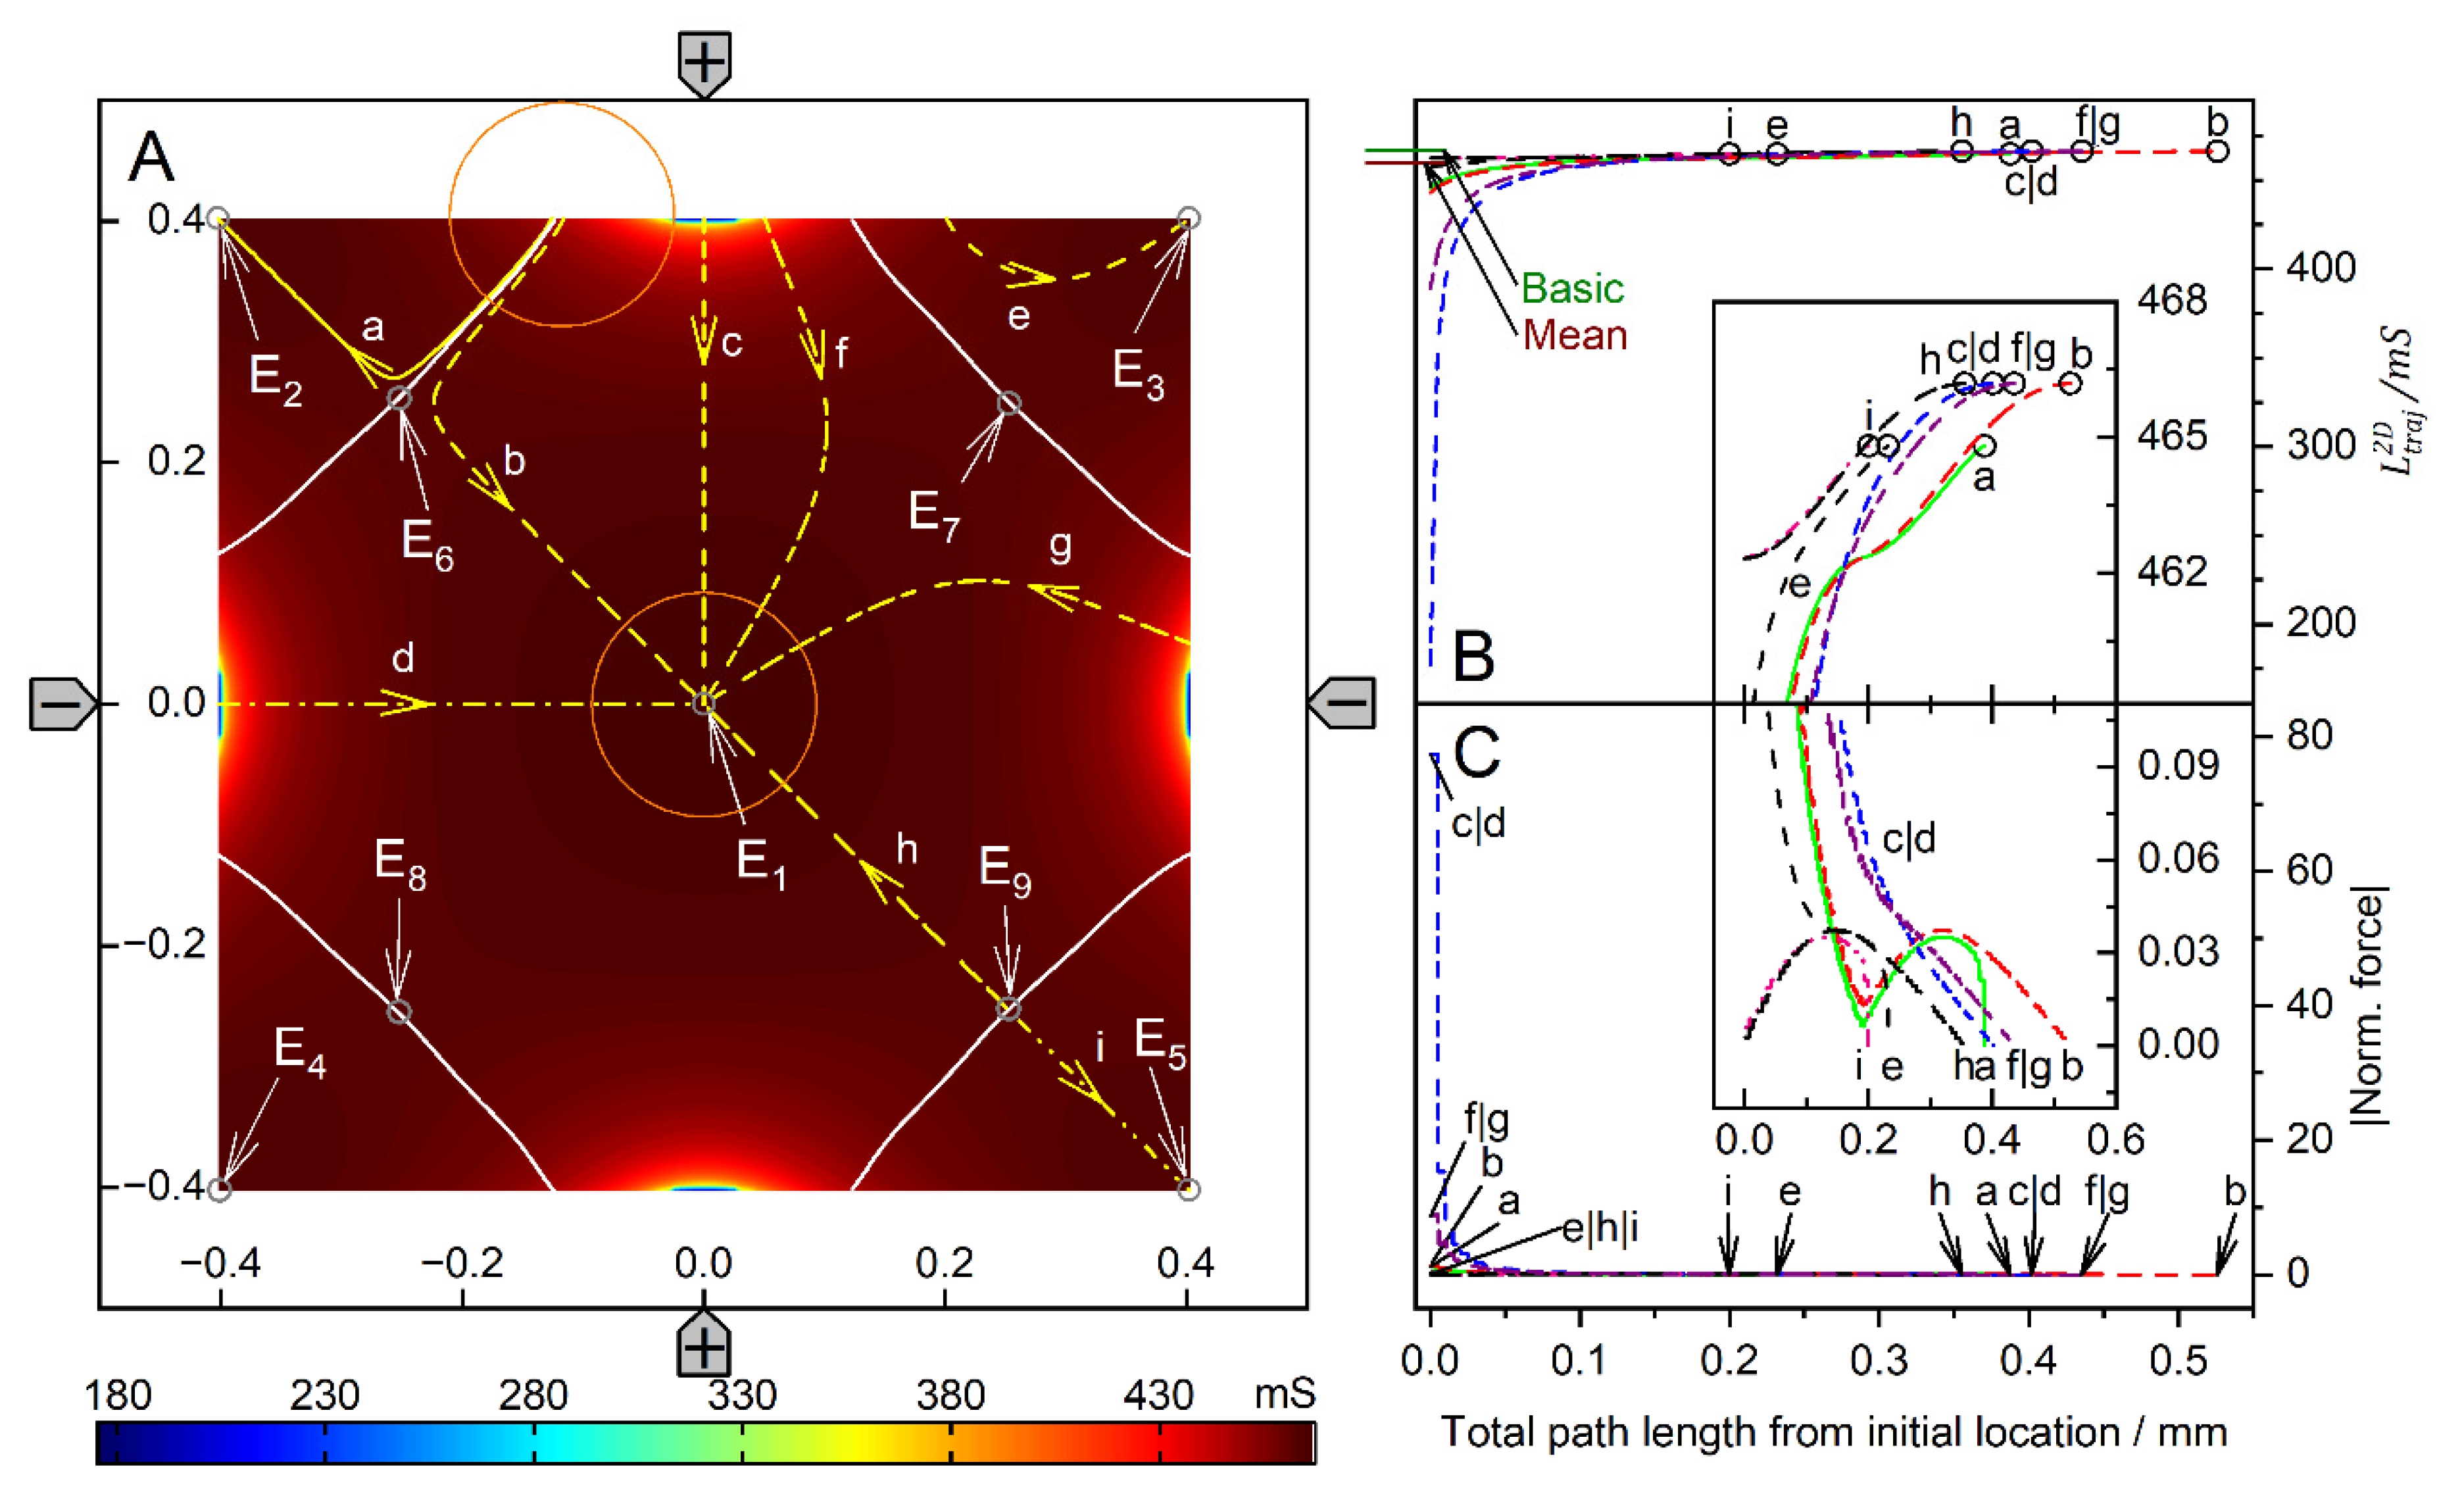
Figure 14.
Single 200-µm 2D sphere of 0.1-S (reddish circles in A) in the chamber of Figure 1C with 1.0-S medium. A: Conductance field plot with trajectories (a-i). Four watersheds (white lines cutting off the chamber’s corners) separate the five catchment areas of the stable endpoints E1 - E5. E6 - E9 are unstable saddle points in the middle of the watersheds. B: Chamber conductance along the trajectories. The basic (w/o sphere), minimum, mean, and maximum conductances are 466.5 mS, 176.9 mS (Figure 4D), 459.3 mS, and 466.2 mS (Figure 4G; E1), respectively. C: Normalized DEP forces calculated from the conductance values in B.
Table 1.
Conductances of the chambers for the drive modes (++--), (+++-), and (+-+-) (
Figure 1) without (w/o sphere) and with the 2D sphere at different positions in the chamber (A - H) in mS. The conductances of the spheres and the outside chamber combine either 1.0 S for the sphere with 0.1 S for the medium (1.0 in 0.1) or 0.1 S for the sphere with 1.0 S for the medium (0.1 in 1.0).
| Mode |
++-- |
+++- |
+-+- |
| Conductance |
1.0-in-0.1 |
0.1-in-1.0 |
1.0-in-0.1 |
0.1-in-1.0 |
1.0-in-0.1 |
0.1-in-1.0 |
| Basic (w/o sphere) |
42.3103 |
422.9419 |
32.7518 |
327.3895 |
46.6665 |
466.4686 |
| Minimum |
42.3132 |
169.6693 |
32.7567 |
58.4465 |
46.6926 |
176.8777 |
| Mean |
43.0311 |
414.1074 |
33.2723 |
321.3707 |
47.2079 |
459.3097 |
| Maximum |
51.7546 |
422.9101 |
72.1644 |
327.3172 |
57.8512 |
466.1858 |
| A |
51.6242 |
172.9551 |
32.7572 |
327.3137 |
46.7797 |
464.7503 |
| B |
42.4985 |
420.1077 |
35.0269 |
217.9206 |
47.0445 |
462.2856 |
| C |
42.3139 |
422.9059 |
72.1854 |
60.0215 |
46.8354 |
464.6568 |
| D |
43.0865 |
414.6169 |
34.9014 |
218.8037 |
57.8507 |
180.4669 |
| E |
43.0702 |
414.2677 |
32.8186 |
326.6342 |
47.0987 |
461.7775 |
| F |
42.4621 |
421.2087 |
33.3379 |
321.0329 |
46.7698 |
465.3648 |
| G |
42.9407 |
416.3622 |
33.0919 |
323.8072 |
46.6926 |
466.1859 |
| H |
-- |
-- |
32.9595 |
325.1618 |
-- |
-- |
