1. Introduction
Dynamic neural networks represent an important tool in various area such as natural language processing, speech recognition, time series prediction, computer vision and more. Their architecture enables the training of deeper, more accurate and more efficient models. As opposed to static neural networks whose structure can be sufficient for simpler tasks with fixed input sizes and architectures, dynamic networks are often preferred for tasks where adaptability and flexibility are crucial. These tasks may involve altering the number of layers, units, or connections based on the input data or the learning progress of the network. Therefore, they have favorable properties that are absent in static ones. Generally, dynamic networks have the following advantages:
Efficiency;
Adaptiveness;
Compatibility;
Generality;
There are several types of the dynamic neural network architectures: recurrent neural networks [
2], transformer-based neural networks [
3], temporal convolutional networks (TCN) [
4], echo state networks (ESN) [
5], neural turing machines (NTM) [
6], differentiable neural computers (DNC) [
7], neural networks with attention mechanisms [
8], neural networks with adaptive components [
9].
The choice of architecture depends on the specific problem and the nature of data being processed.
Recurrent networks are a widespread type of dynamic neural networks. It uses iterative functional loops to store information. RNN have several properties that make them an attractive choice for classification or regression problems: they are flexible in their use of contextual information (because they can learn what to store and what to ignore), they accept many different types and representations of data, and they can recognize sequential patterns in the presence of sequential biases. However, they also have several drawbacks that have limited their application to real-world classification or regression problems. The most serious shortcoming of standard RNN is that it is very difficult to get them to store information for long periods of time. Another problem is that they can only access contextual information in one direction. This is quite useful for time series prediction, but not for classification. Although developed for one-dimensional sequences, some of their properties, such as robustness to bias and flexible use of context, are also desirable in multidimensional domains such as image and video processing [
10].
To handle the vanishing gradient problem and other issues in traditional RNN, long short-term memory networks have been introduced to enable effective modeling and learning from data sequences [
11]. LSTM neural networks work on a gate principle. In essence, it controls the importance of data at different time intervals in such a way that it ignores the irrelevant ones and stores the important information of the input data in the past time intervals, thus preventing the vanishing gradient problem [
10].
Due to their exceptional capabilities, LSTM are mainly used in language processing and speech recognition. They are used by Google to improve Google's speech recognition and translate tools and are often used by Facebook [
12]. However, it is interesting to see how they can deal with data from real industrial processes, for example when it comes to predicting difficult-to-measure process variables such as product quality or the amount of pollutant emissions. Much research has been done in this area in recent years, and a number of papers have been published, from basic research to application.
Fault detection and diagnosis in industrial processes is very important for planning overhauls and reducing plant downtime. Several papers have been published on this subject [
13,
14,
15,
16,
17,
18]. There are many examples where mathematical models based on LSTM prediction of quality-critical characteristics of a product are used to replace failure-prone and expensive process analyzers. In References [
19,
20] the authors developed mathematical models (soft sensors) to predict the concentrations of sulfur dioxide and hydrogen sulfide at the sulfur production plant. Furthermore, such models are presented for a penicillin fermentation process [
21], industrial polyethylene process [
22], grinding-classification process [
23], polypropylene process [
24], roasting process of oxidizing zinc sulfide concentrates [
25], plasma enhanced chemical vapor deposition (PECVD) – the most important process in the manufacturing of solar panels [
26], industrial hydrocracking process [
27]. There are several recent works related to emissions [
28,
29,
30]. LSTM also finds application in predictive production planning in energy-intensive manufacturing industries in line with industry 4.0 and the internet of things (IoT) [
31].
As for the isomerization process, several papers have published recently on the subject of mathematical modeling of this process. The authors have presented the development and optimization of the kinetic model of the catalytic reactions [
32], the development of the ANN MLP-based model [
33], and the development of the SVM-based model [
34] for estimating the quality of isomerate gasoline. No papers applying LSTM models to the isomerization process in refineries was found in the existing relevant literature.
This paper presents the development of mathematical models in an industrial isomerization process using the LSTM network architecture. Here it is crucial to continuously estimate the quality-critical components that influence the octane number of gasoline. These are the components of 2,2- and 2,3-dimethylbutanes (2,2- and 2,3-DMB), and 2- and 3-methylpentanes (2- and 3-MP) in the isomerizate – the product of the process. The isomerization process is a complex industrial nonlinear process with emphasized process dynamics, where it is better to develop empirical, data-driven models rather than fundamental (first-principle). Because of its structure, i.e., the idea of a dynamic neural network that allows manipulation of data in past time intervals, and other advantages, LSTM is a suitable technique for developing models for such a process. The achieved results were compared with the results of various types of other data-driven models developed for an isomerization process, such as MLP artificial neural networks, SVM, and dynamic polynomial models, presented and published earlier [
35,
36,
37,
38].
The traditional steps of the data-driven model development include selection of historical data from plant database, data preprocessing, model structure and regressor selection, model estimation and validation [
39,
40].
2. Materials and Methods
2.1. Theoretical backgroung
Artificial neural networks were originally developed as mathematical models capable of processing information like a biological brain.
The basic structure of ANN is a network of small processing units or nodes connected by weighted links. In terms of the original biological model, the nodes represent neurons, and the connection weights represent the strength of the synapses between the neurons. The network is activated by providing some or all of the nodes with an input, and this activation then propagates along the weighted connections throughout the network [
10].
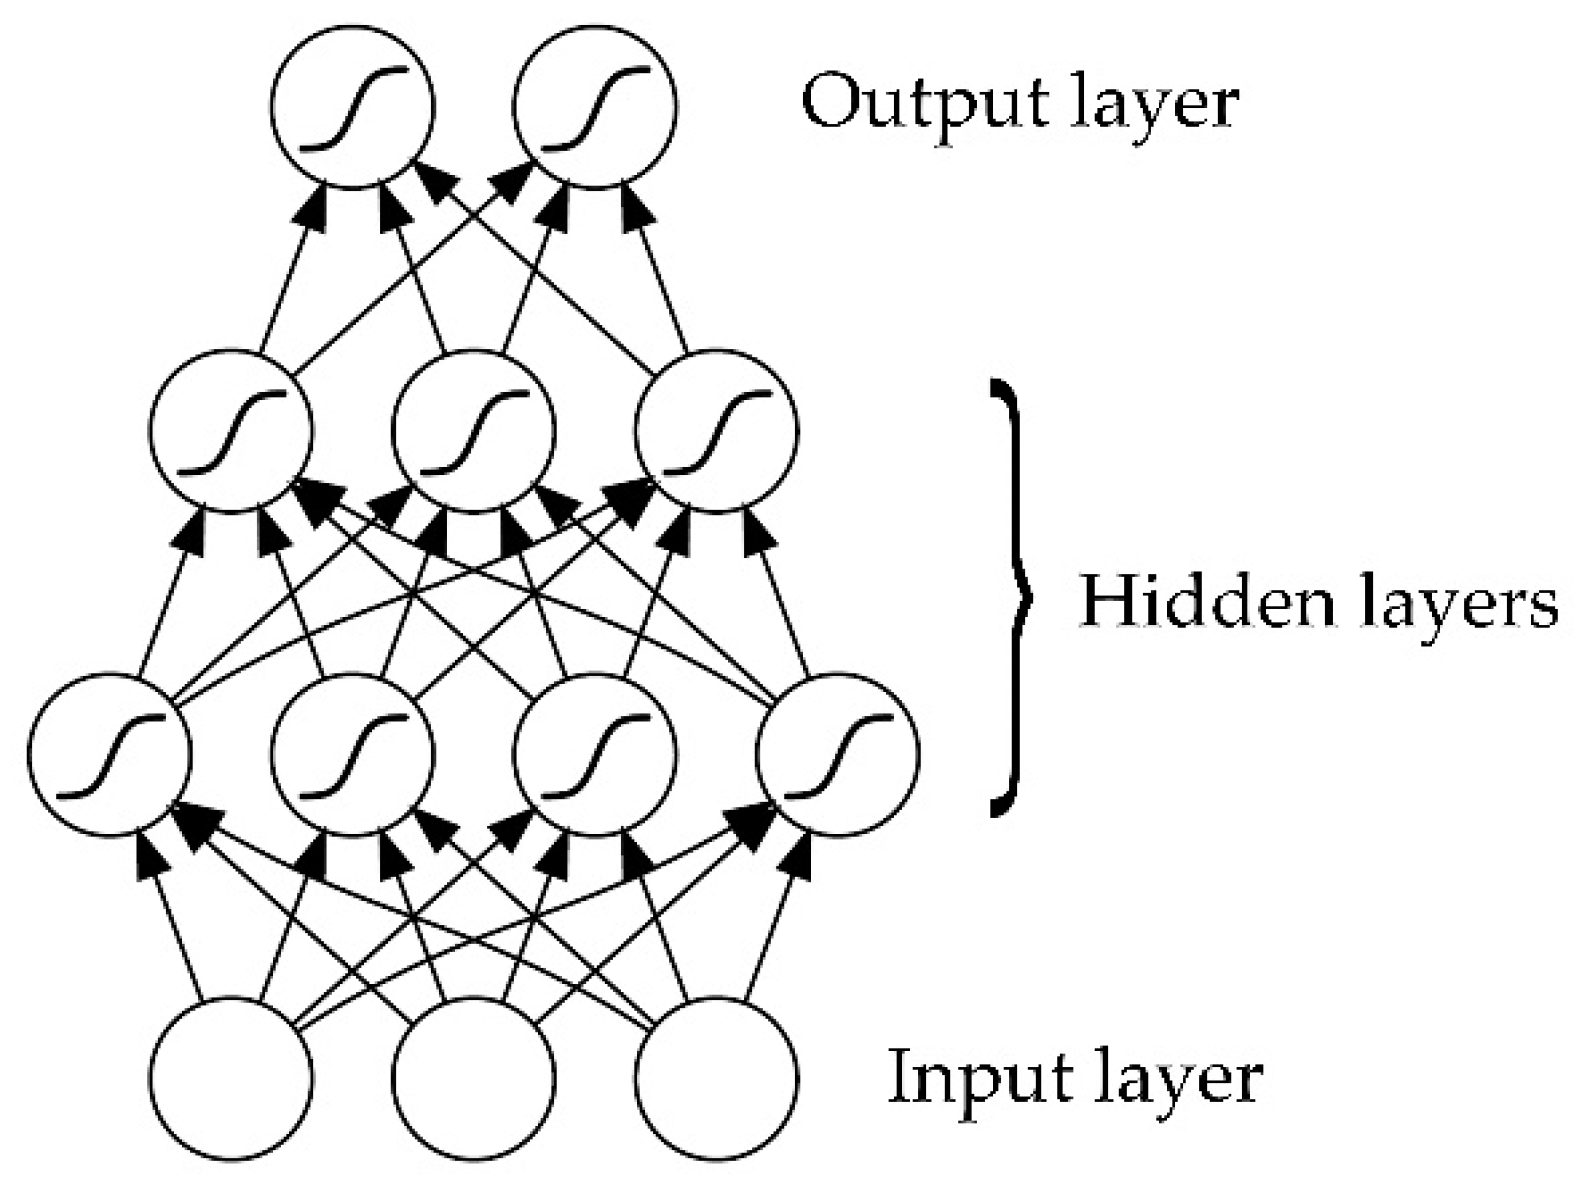
As shown in
Figure 1, the units in a multilayer perceptron, a class of ANN, are arranged in layers, with connections passing from one layer to the next. The input patterns are presented to the input layer and then passed through the hidden layers to the output layer. This process is referred to as feedforward pass of the network. Since the output of MLP depends only on the current input and not on past or future inputs, MLP is more suitable for pattern classification than for regression. MLP with a particular set of weights defines a function of network output on input data. By changing the weights, a single MLP can express many different functions [
10].
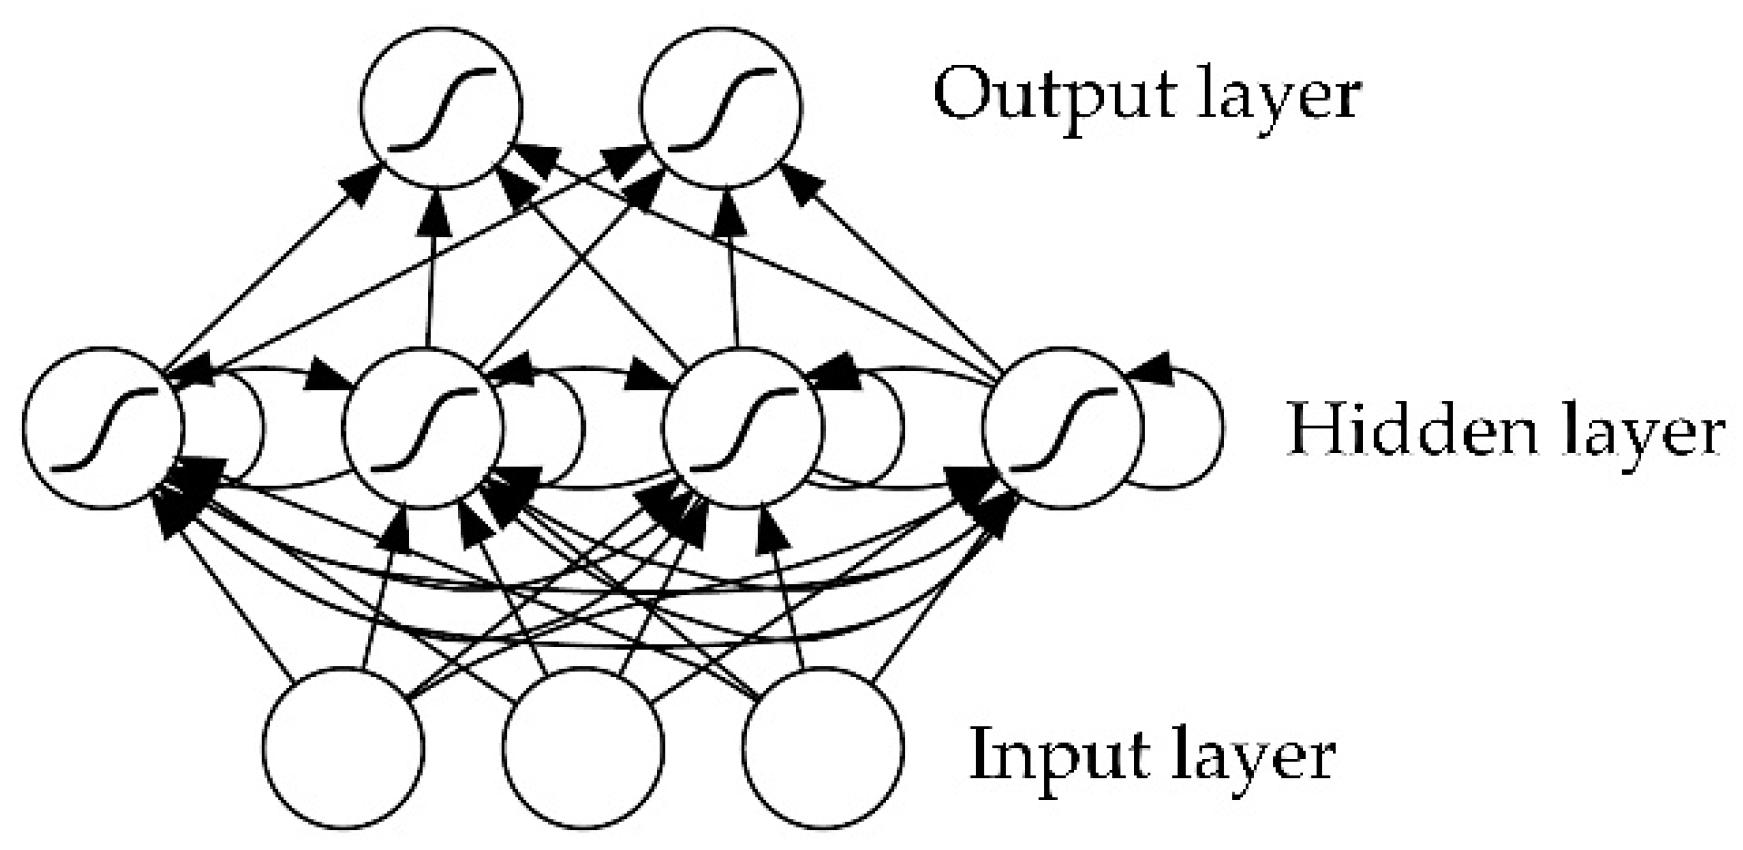
While MLPs only map from input to output vectors, RNN can in principle map the entire history of previous inputs to each output. RNN with a sufficient number of hidden units can approximate any measurable sequence-to-sequence mapping with certain accuracy. The key point is that the recurrent connections allow a “memory” of previous inputs to persist in the internal state of the network, thereby affecting the network output (
Figure 2) [
10].
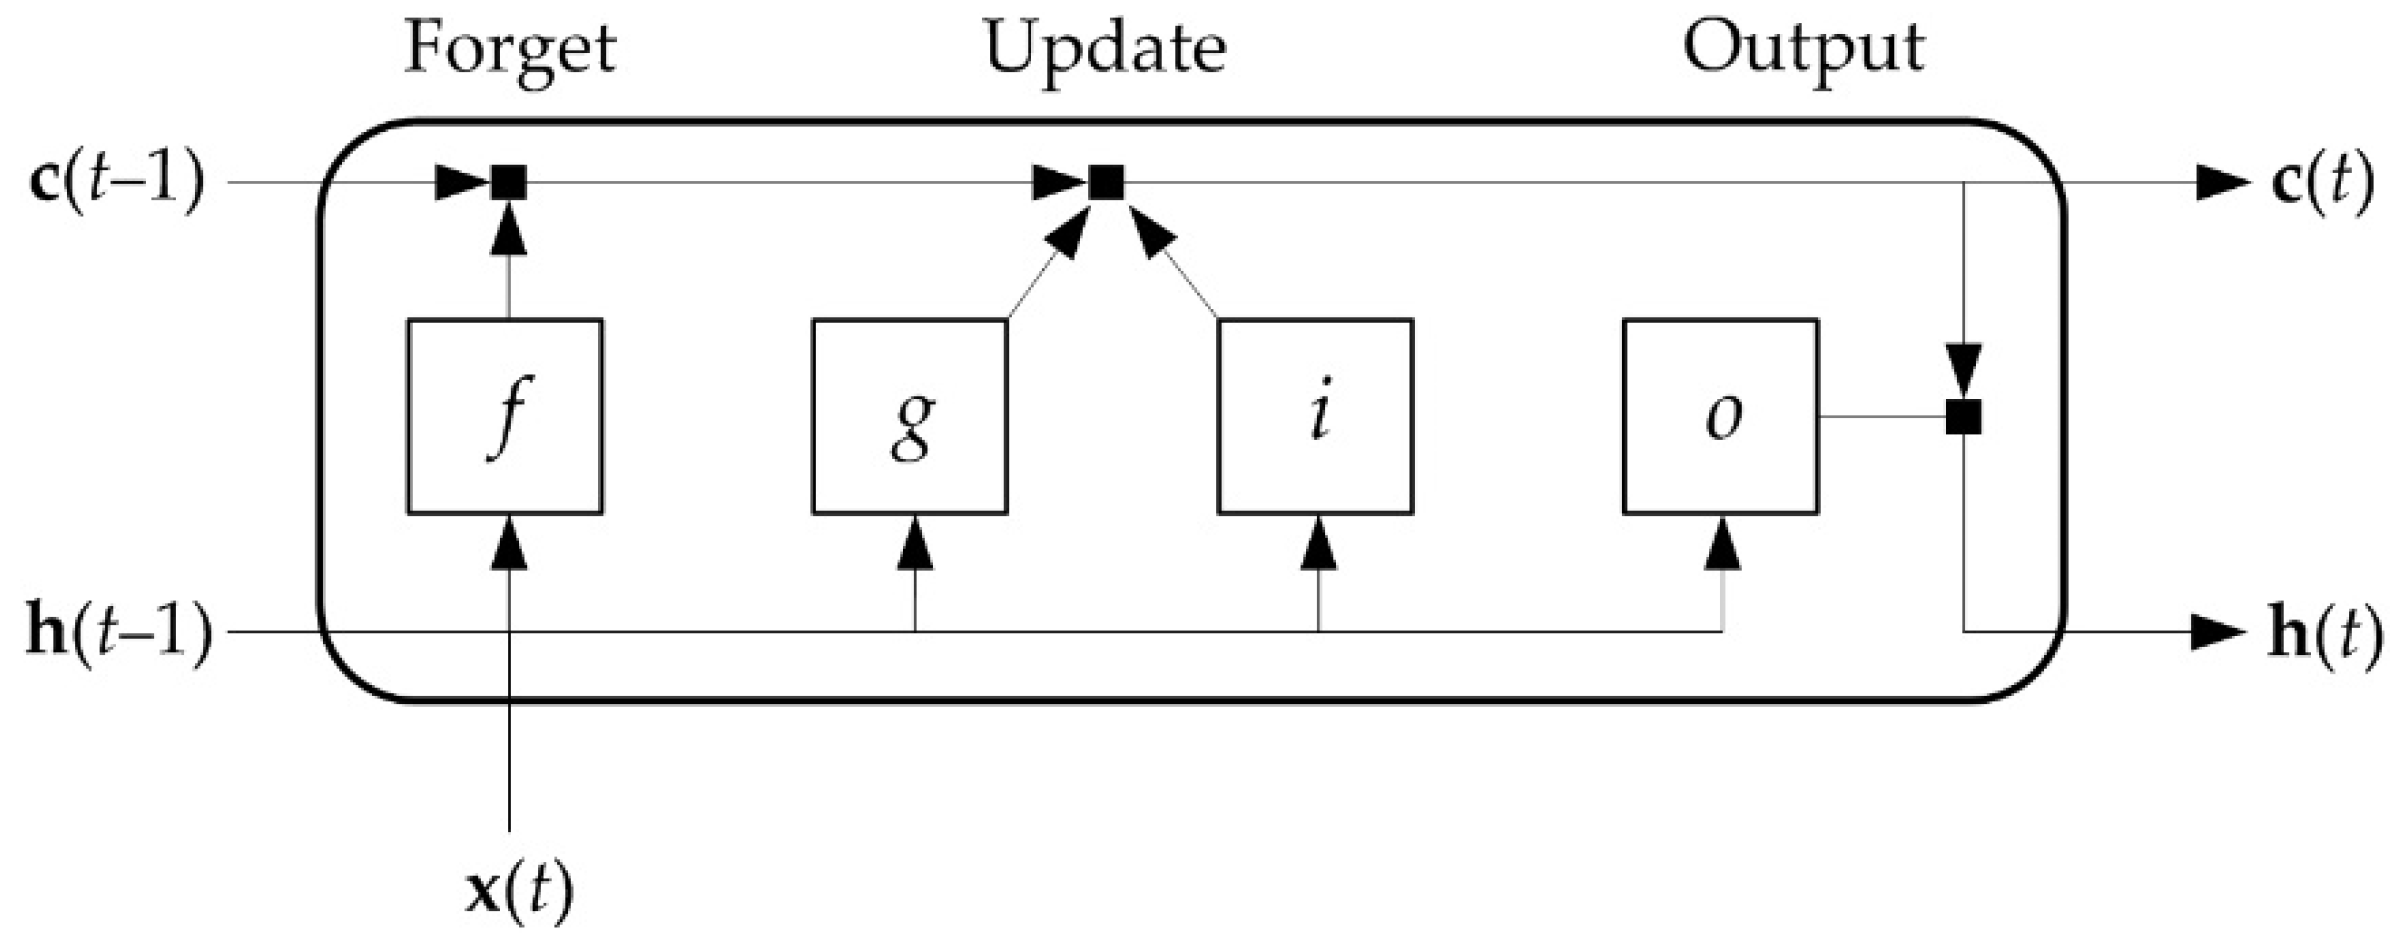
To overcome the vanishing gradient problem, basic RNN are replaced by LSTM networks when long-term dependencies are learned. LSTM architecture consists of recurrently connected sub-networks, known as memory units. One unit consist of a memory cell and nonlinear gates that selectively keep current information that is relevant and forget past information that is not [
11,
12,
20,
41]. A typical LSTM unit is shown in
Figure 3.
For a given time t, the unit state consists of the output state h(t), which contains the output for that time, and the cell state c(t), which contains the information learned from previous time steps ( and ). In every time step, c(t) is updated by adding or discarding information using gates. The current input is x(t).
The components of which the LSTM unit consists are input gate, i – updates the inputs combining the current input, and the previous output and cell states; forget gate, f – determines which information should be removed from previous cell state; output gate, o – calculates output information; cell input, g – updates the inputs combining the current input and the previous output state.
The learnable weights of the LSTM unit are the input weights,
W, the recurrent weights,
R, and the bias,
b. The matrices with which they are represented follow:
where
i,
f,
g and
o denote the input gate, forget gate, cell input and output gate, respectively [
42].
The states of the components of the LSTM unit at the time
t are represented by the following equations:
where
and
denote the activation functions – sigmoid and hyperbolic tangent, respectively. The sigmoid is always used as a gate activation function, while the hyperbolic tangent is often used as a cell input.
Finally, the cell state
c(
t) and the initial state
h(
t) are calculated as follows:
where ⊙ Hadamard product – point-wise multiplication of two vectors.
The parameters (weights and biases) are determined by minimizing the loss function using learning algorithms like stohastic gradient descent (SDG), stohastic gradient descent with momentum (SGDM), adaptive moment estimation (ADAM), Nesterov-accelerated adaptive moment estimation (NADAM) and root mean square propagation (RMSProp) [
43].
2.2. Process description
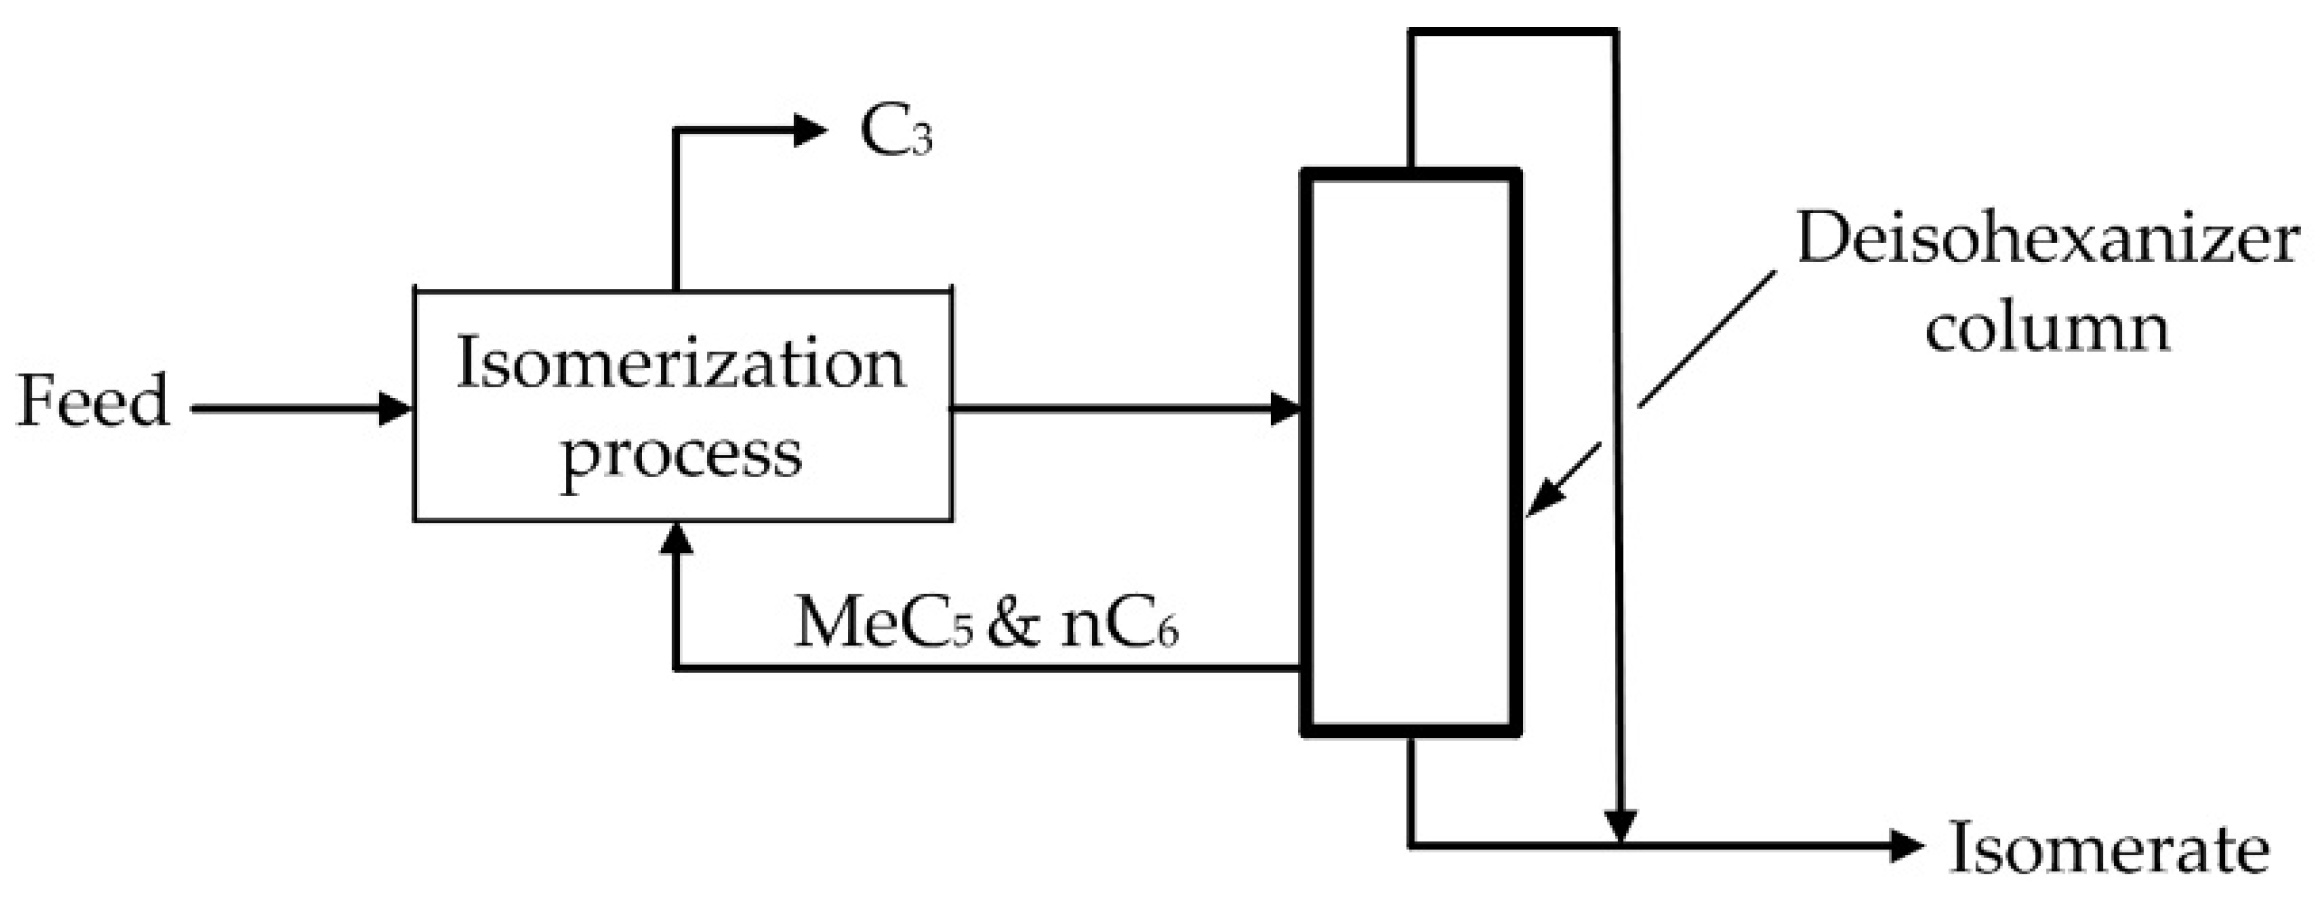
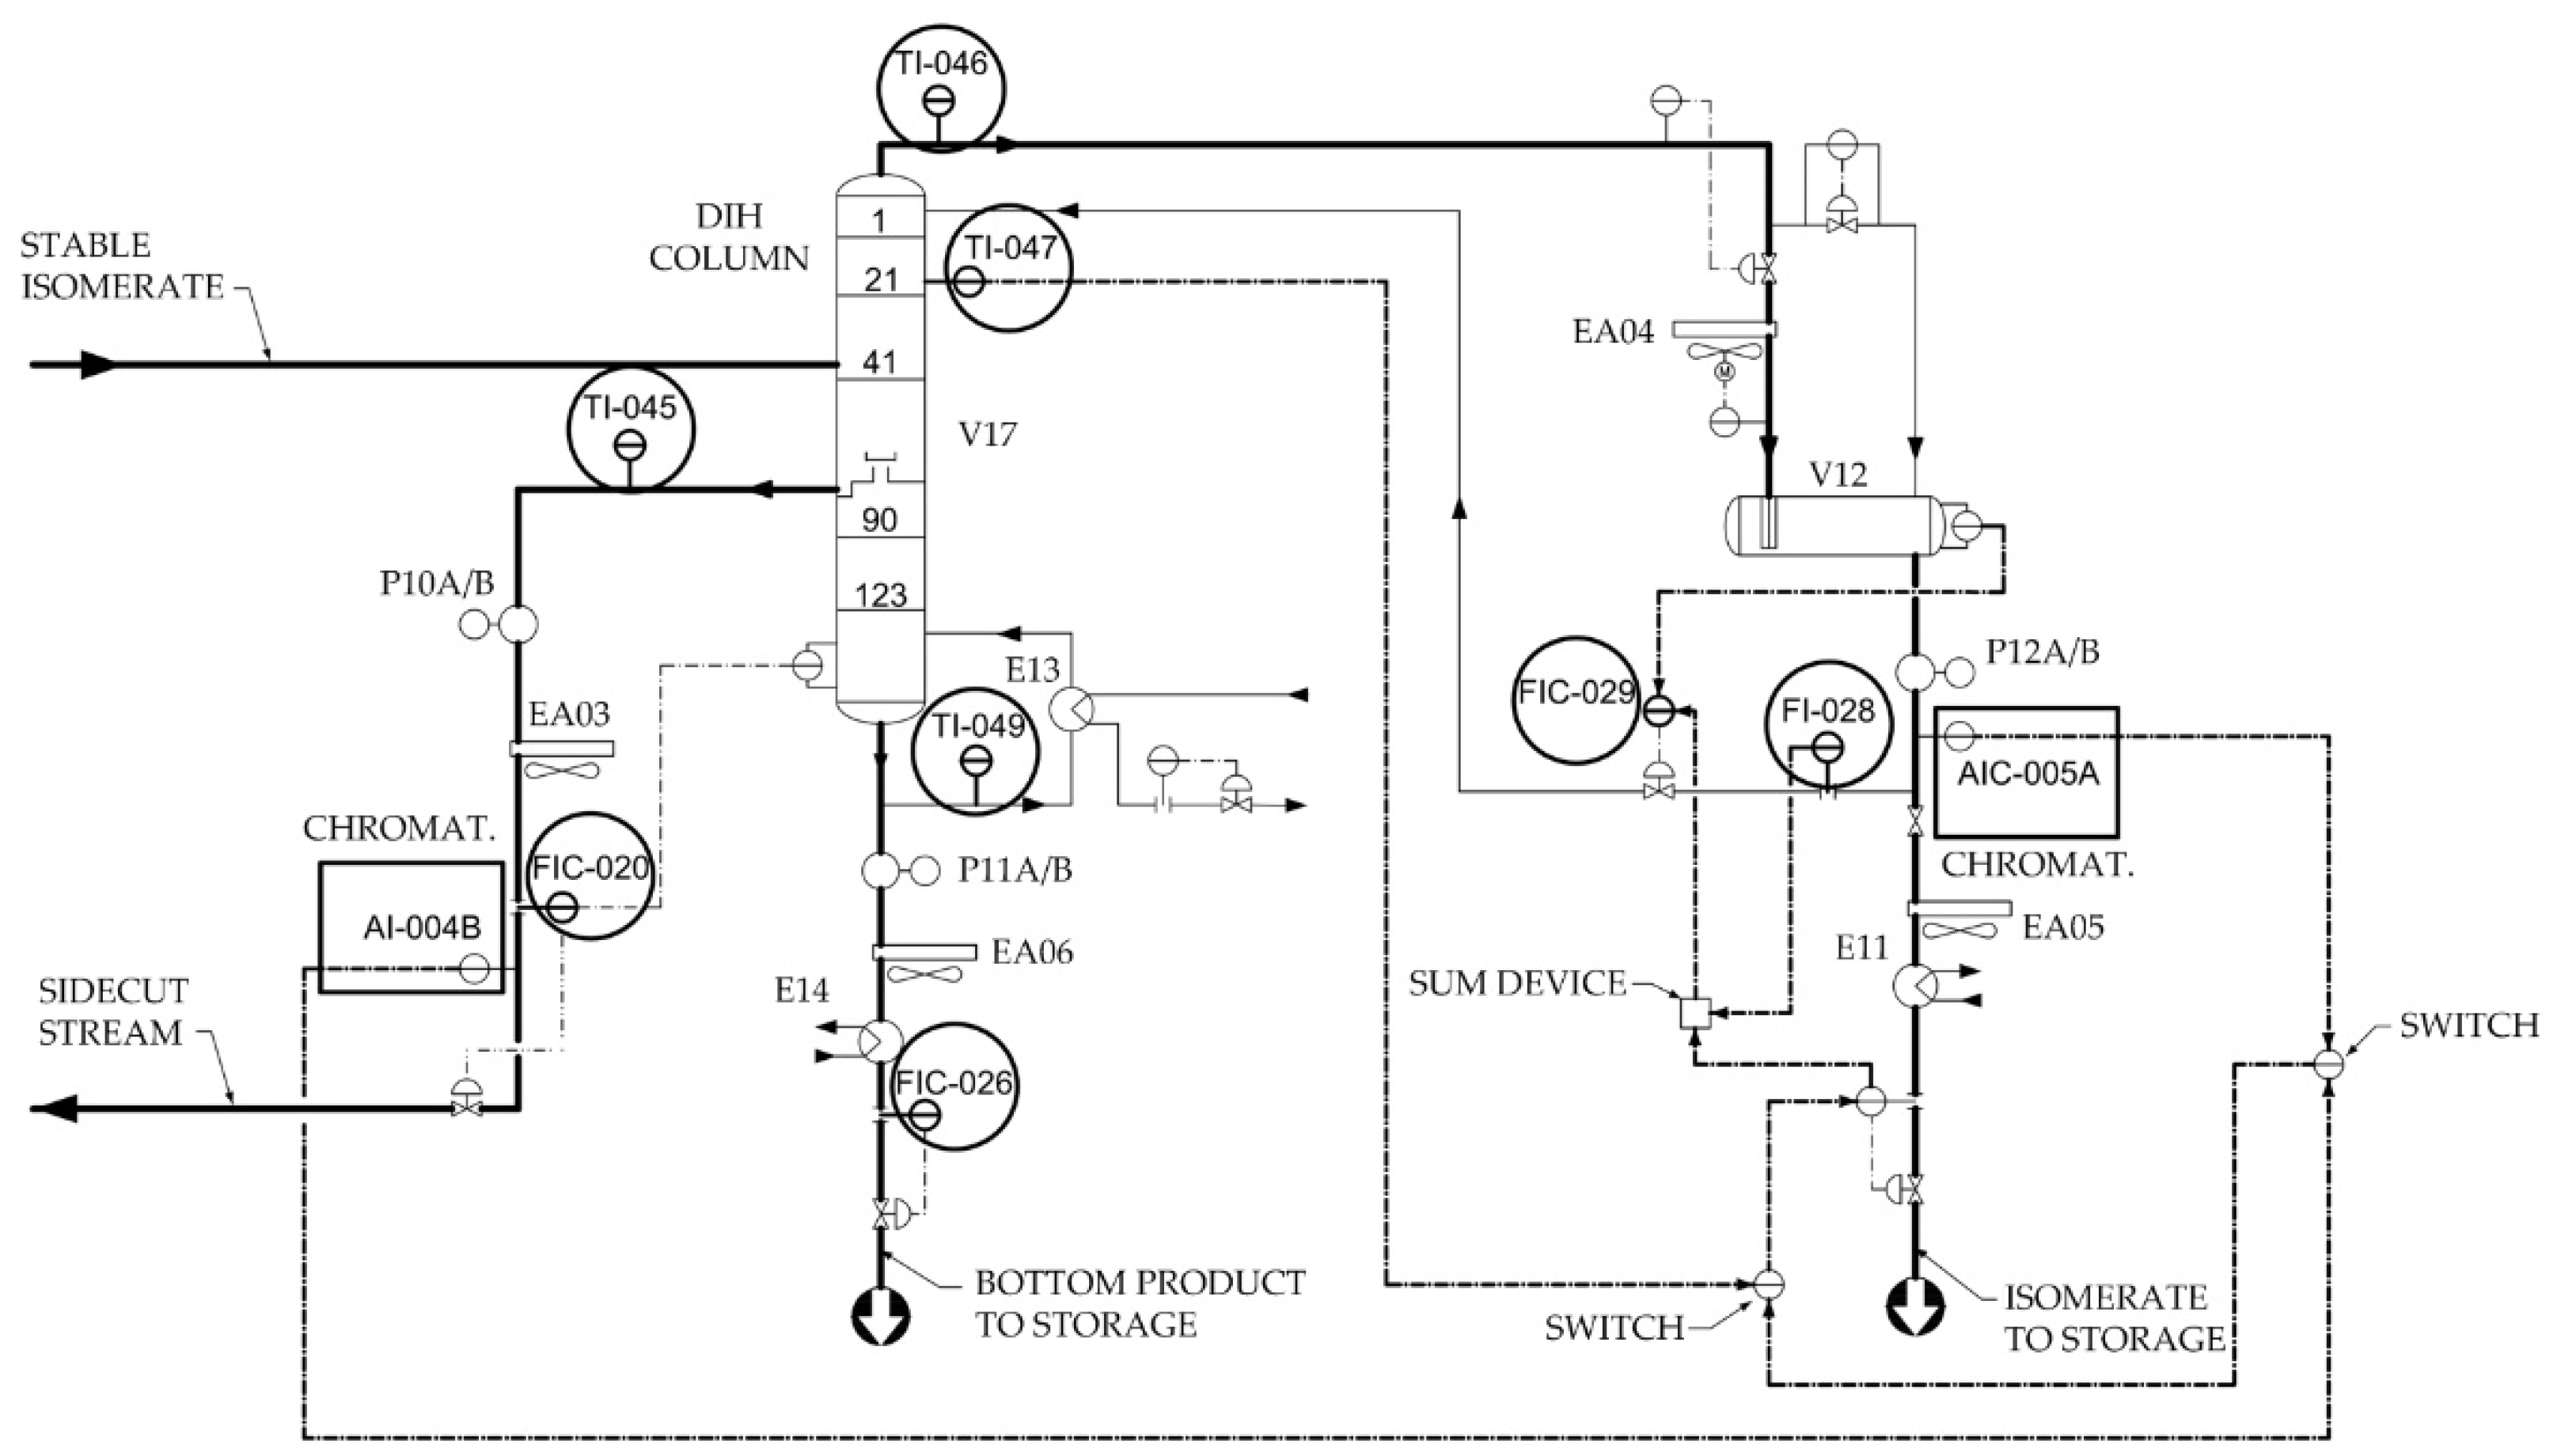
The industrial process of catalytic isomerization of pentane, hexane, and their mixtures improves the octane rating of light straight-run naphtha. The reactions occur in the presence of hydrogen over a fixed catalyst bed and under operating conditions that promote isomerization and minimize hydrocracking. The dominant reaction of the isomerization process is the conversion of n-paraffins to i-paraffins, i.e., to high-octane structures. The reaction is controlled by thermodynamic equilibrium, which is more favorable at a low temperature. The basic isomerization process can be improved by the addition of a deisohexanization (DIH) column, in which the basic isomerization product is separated into normal and isoparaffin components. In the side stream of the DIH column, the unconverted n-paraffins and the newly formed low-octane methylpentanes are concentrated and recycled to the isomerization reactor section, as shown in
Figure 4 [
44,
45].
The aim of the technological process is to maintain the high-octane 2,2- and 2,3-DMB in the overhead stream and the low-octane 2- and 3- MP in the side stream of the DIH column by controlling the content of these quality-critical product components.
2.3. Model development
When developing a data-driven model, it is important to select easily measured influencing (input) variables that affect output variables, difficult to measure and often unavailable. In this case, the output variables are quality-critical product components – 2,3-DMB and 3-MP. Product quality indicators are also 2,2-DMB and 2-MP, but since 2,2-DMB is a high-octane component and 2-MP is a low-octane component that are correlated with 2,3-DMB and 3-MP, respectively, it is often sufficient to consider only one pair of components.
In order to successfully perform the selection of input variables, it is important to gain theoretical insight into the process, but it is even more important to talk to the operators of the observed plant, who will point out possible input variables. After selecting a specific number of input variables, the final number is determined using various correlation analysis techniques.
Table 1 shows the potential input variables for 2,3-DMB and 3-MP content model development.
Potential input variables as well as output variables measured using process analyzers AI-004B (measuring of 2,3-DMB) and AIC-005A (measuring of 3-MP content) are shown in a process flow diagram of the deisohexanizer section of the process (
Figure 5).
The correlation analysis performed for the potentially influential variables excluded some variables as model inputs because they showed little correlation with the outputs [
36]. FIC-020 (DIH column side product flow) was excluded for 2,3-DMB content model development, and FIC-020 and FIC-026 (DIH column bottom product flow) were excluded for 3-MP.
The selection of the influencing variables is followed by data collection and preprocessing. A continuous data set for a period of 2 to 3 weeks is needed for the selected input variables and for the outputs. It is also important that the selected data belong to different process dynamics’ regimes if possible. In the search for a period with emphasized process dynamics, two different data sets were selected, one for the development of a model to estimate the content of 2,3-DMB and the other for 3-MP. Regarding the preprocessing of the selected data, it should be emphasized that there were not many missing data, outliers, or noise. Although the input data were available every minute, the sampling period was set to 3 minutes, since the process dynamics of such a large industrial plant allows it. The output variables are measured using on-line chromatographs with a sampling time of 30 minutes. Since it is necessary to coordinate the sampling periods of the input and output variables, the 30-minute period of the output data is supplemented by interpolation data using cubic spline interpolation.
LSTM dynamic recurrent neural network models for estimating the contents of 2,3-DMB and 3-MP were developed using Python 3.9.6 programming language paired with Keras library for deep learning in combination with M1 Apple processor working at 3.2 GHz. Model development data sets consist of 6 667 and 10 078 continuous samples for the development of 2,3-DMB and 3-MP content models, respectively. The data is divided into training and test set in a ratio of 85:15. The structure of the LSTM network consisted of a hidden layer, with the number of hidden units studied ranging from 5 to 50. The activation functions used as cell input are hyperbolic tangent (tanh), sigmoid, and rectified linear unit (ReLU). The learning algorithms ADAM and NADAM were used to determine and optimize the parameters (weights and biases). The loss function, represented by the mean squared error (MSE) as a function of the number of past steps of the input variables, was minimized. Attention should be paid to the optimal number of past steps – too many lead to overfitting, too few to poor generalization capabilities. The number of past steps of the input variables was studied in the range of 5 to 200.
Evaluation of the developed models was performed on the training and test data sets based on four statistical indicators: Pearson correlation coefficient (
R), coefficient of determination (
), root mean square error (
RMSE), and mean absolute error (
MAE):
where
is the measured input,
is the measured output,
is the model output,
is the mean of all measured inputs,
is the mean of all measured outputs and
n is the number of values in the observed data set.
The results of LSTM network models were compared with the results of data-driven models, whose development methodology and materials are presented in Reference [
35] for MLP ANN, in References [
36,
37] for SVM and in References [
37,
38] for dynamic polynomial (finite impulse response – FIR, autoregressive with exogenous inputs – ARX, output error – OE, nonlinear ARX – NARX, Hammerstein Wiener – HW) models.
3. Results
Table 2 and
Table 3 show the optimal evaluation results of the developed 2,3-DMB and 3-MP content LSTM network models. The results are based on the evaluation criteria shown in equations [
10,
11,
12,
13], separately on the training and test sets. In the cases of the 2,3-DMB and 3-MP models, optimal results were obtained with the ADAM optimization algorithm and the tanh activation function, and with 25 hidden units in the hidden layer. The optimal number of past steps in the case of the 2,3-DMB model was 45, while in the case of the 3-MP it was 55.
For both models, very high Pearson correlation coefficient (R) and coefficient of determination () values can be observed, along with low root mean square error (RMSE) and mean absolute error (MAE) values.
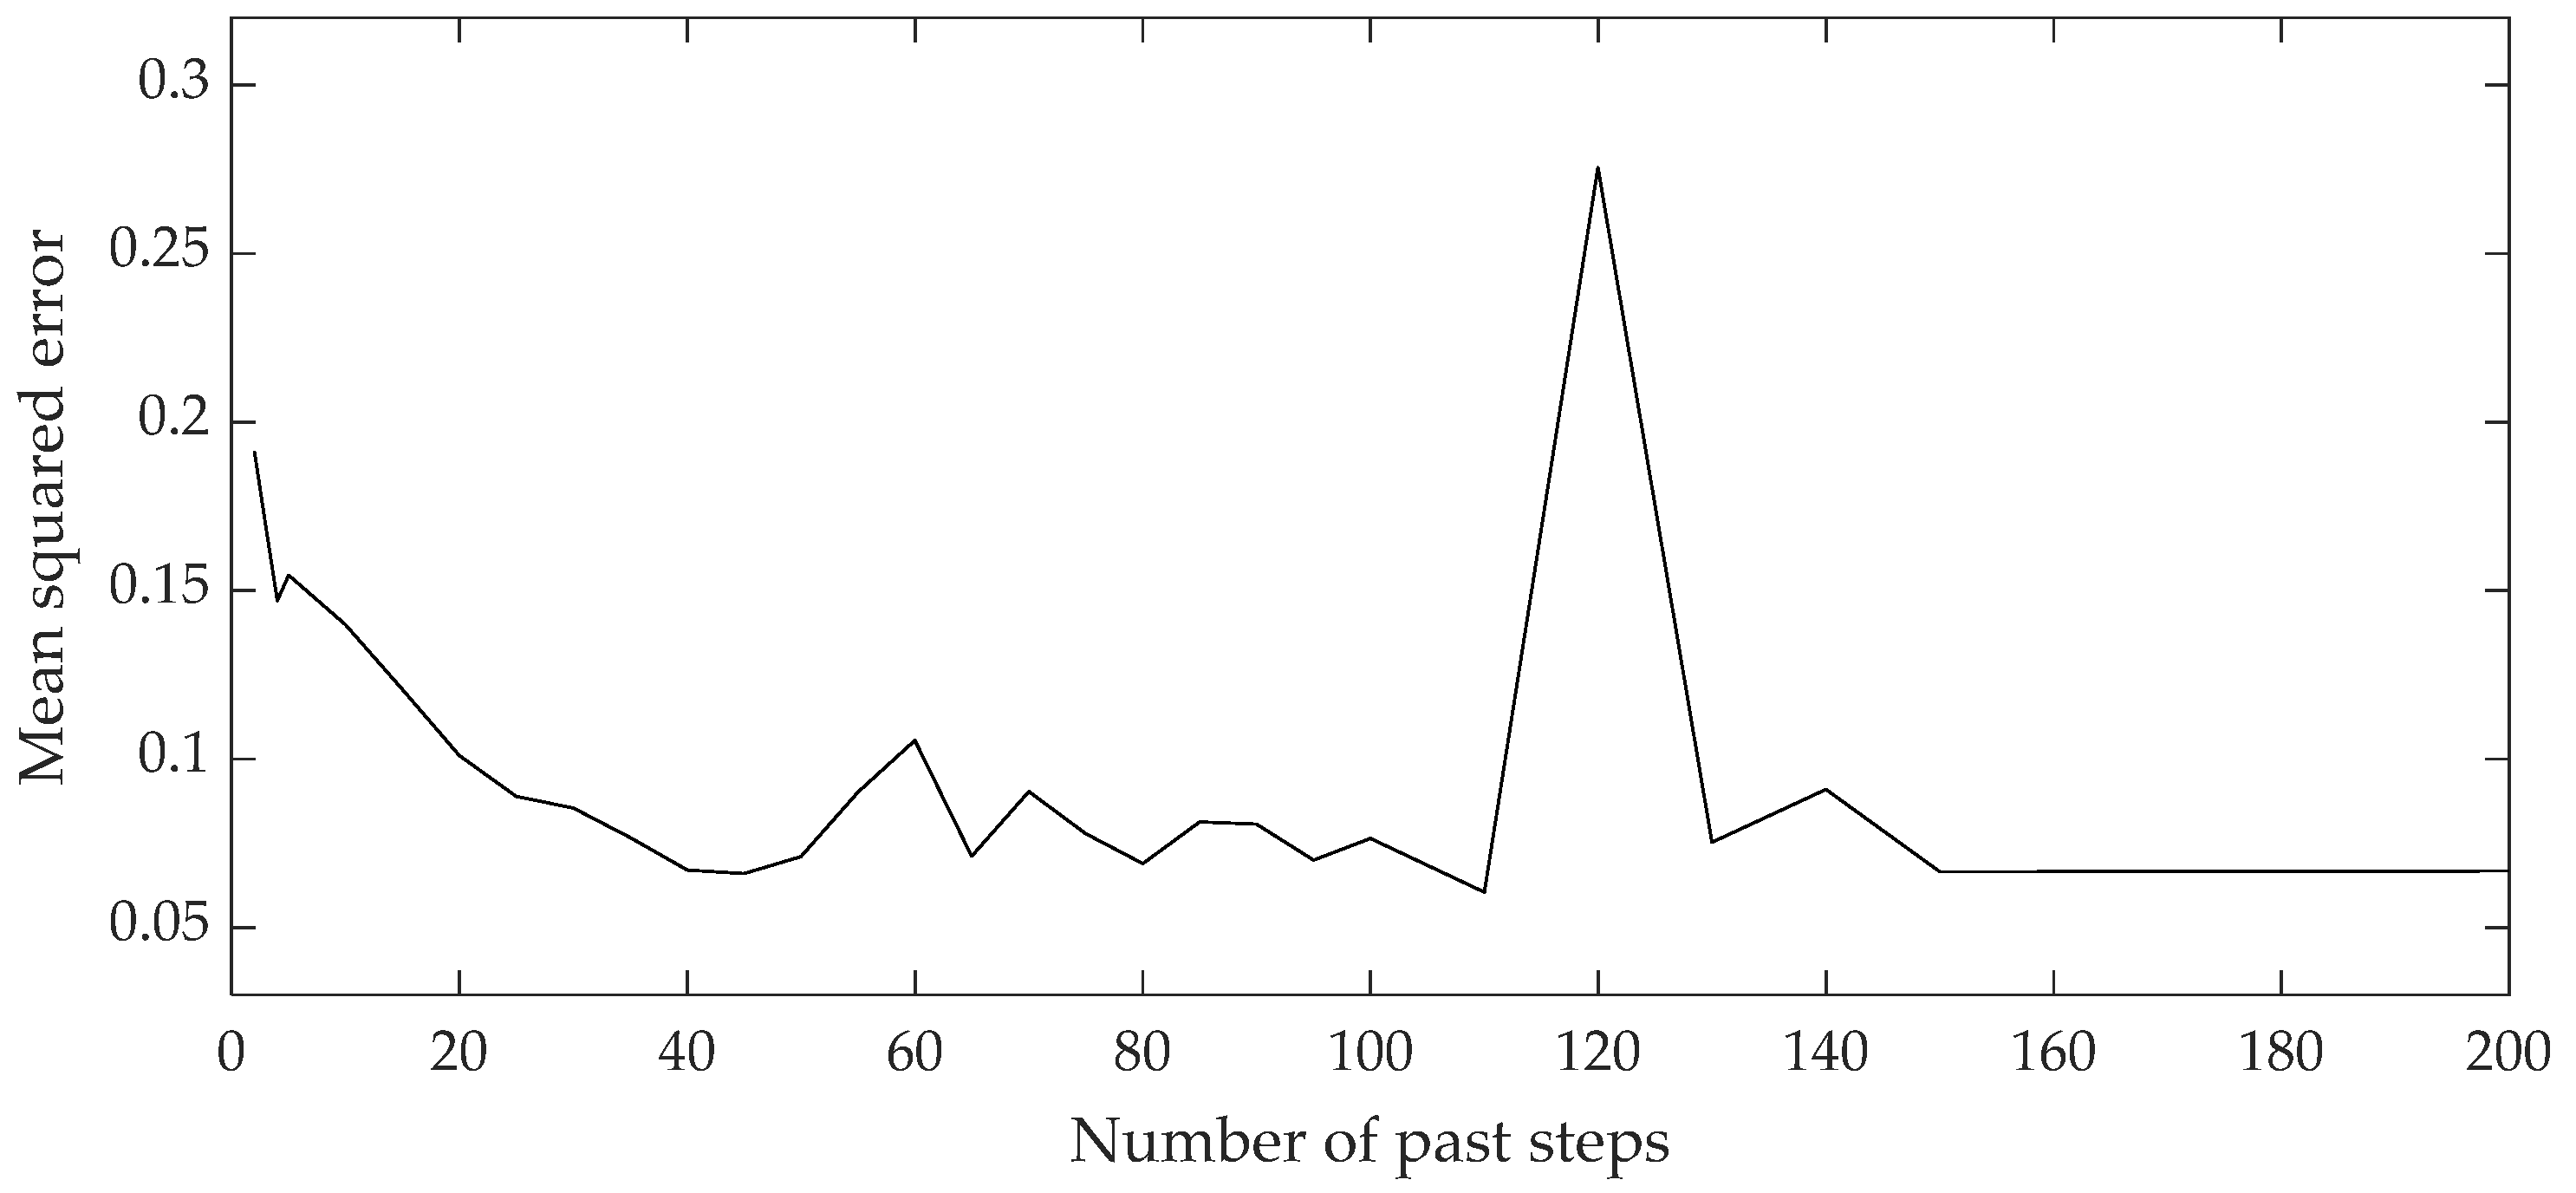
Figure 6 and
Figure 7 show the curves of the loss functions during the training process of the 2,3-DMB and 3 MP content models. During the training process, a minimum mean squared error was targeted, which depends on the number of past steps of the input variables, ranging from 5 to 200.
To avoid overfitting of the developed models, the optimal network structure was assumed to be the one where the MSE reaches the minimum value for the minimum number of past steps, since the MSE remains relatively stable by increasing the number of steps. The values of the Pearson correlation coefficient and the coefficient of determination of the developed and presented models do not deviate significantly in the mutual comparison for a specific data set and model, which is a sign that the developed models are not overfitted, i.e., they have good generalization capabilities.
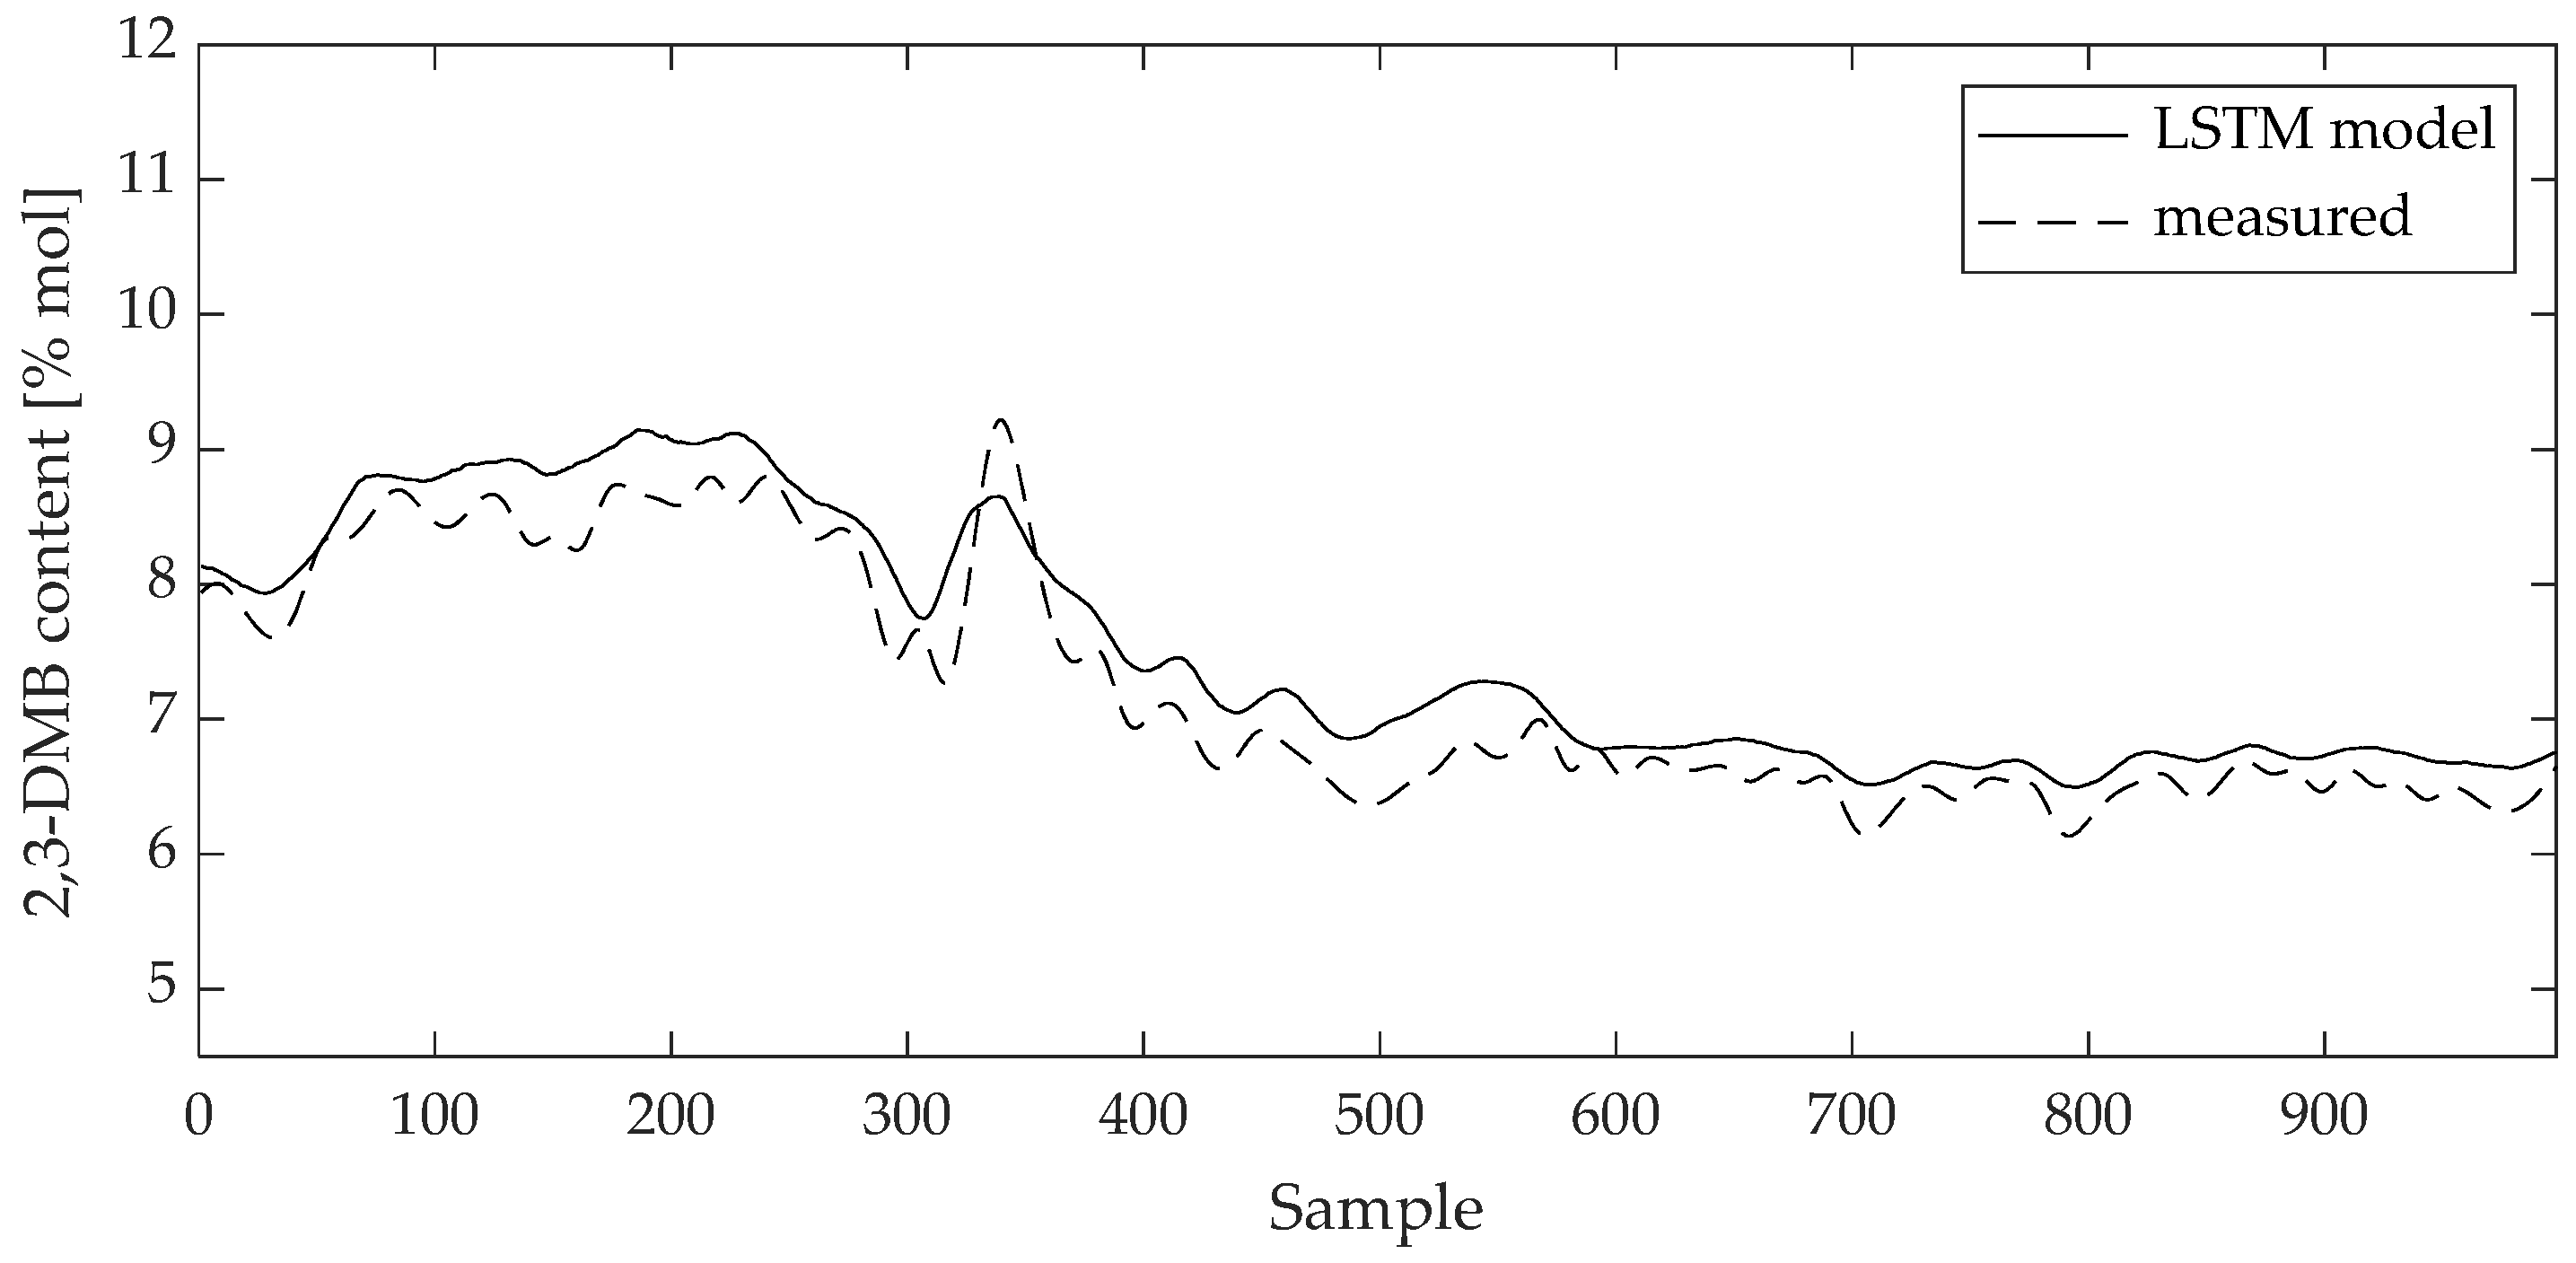
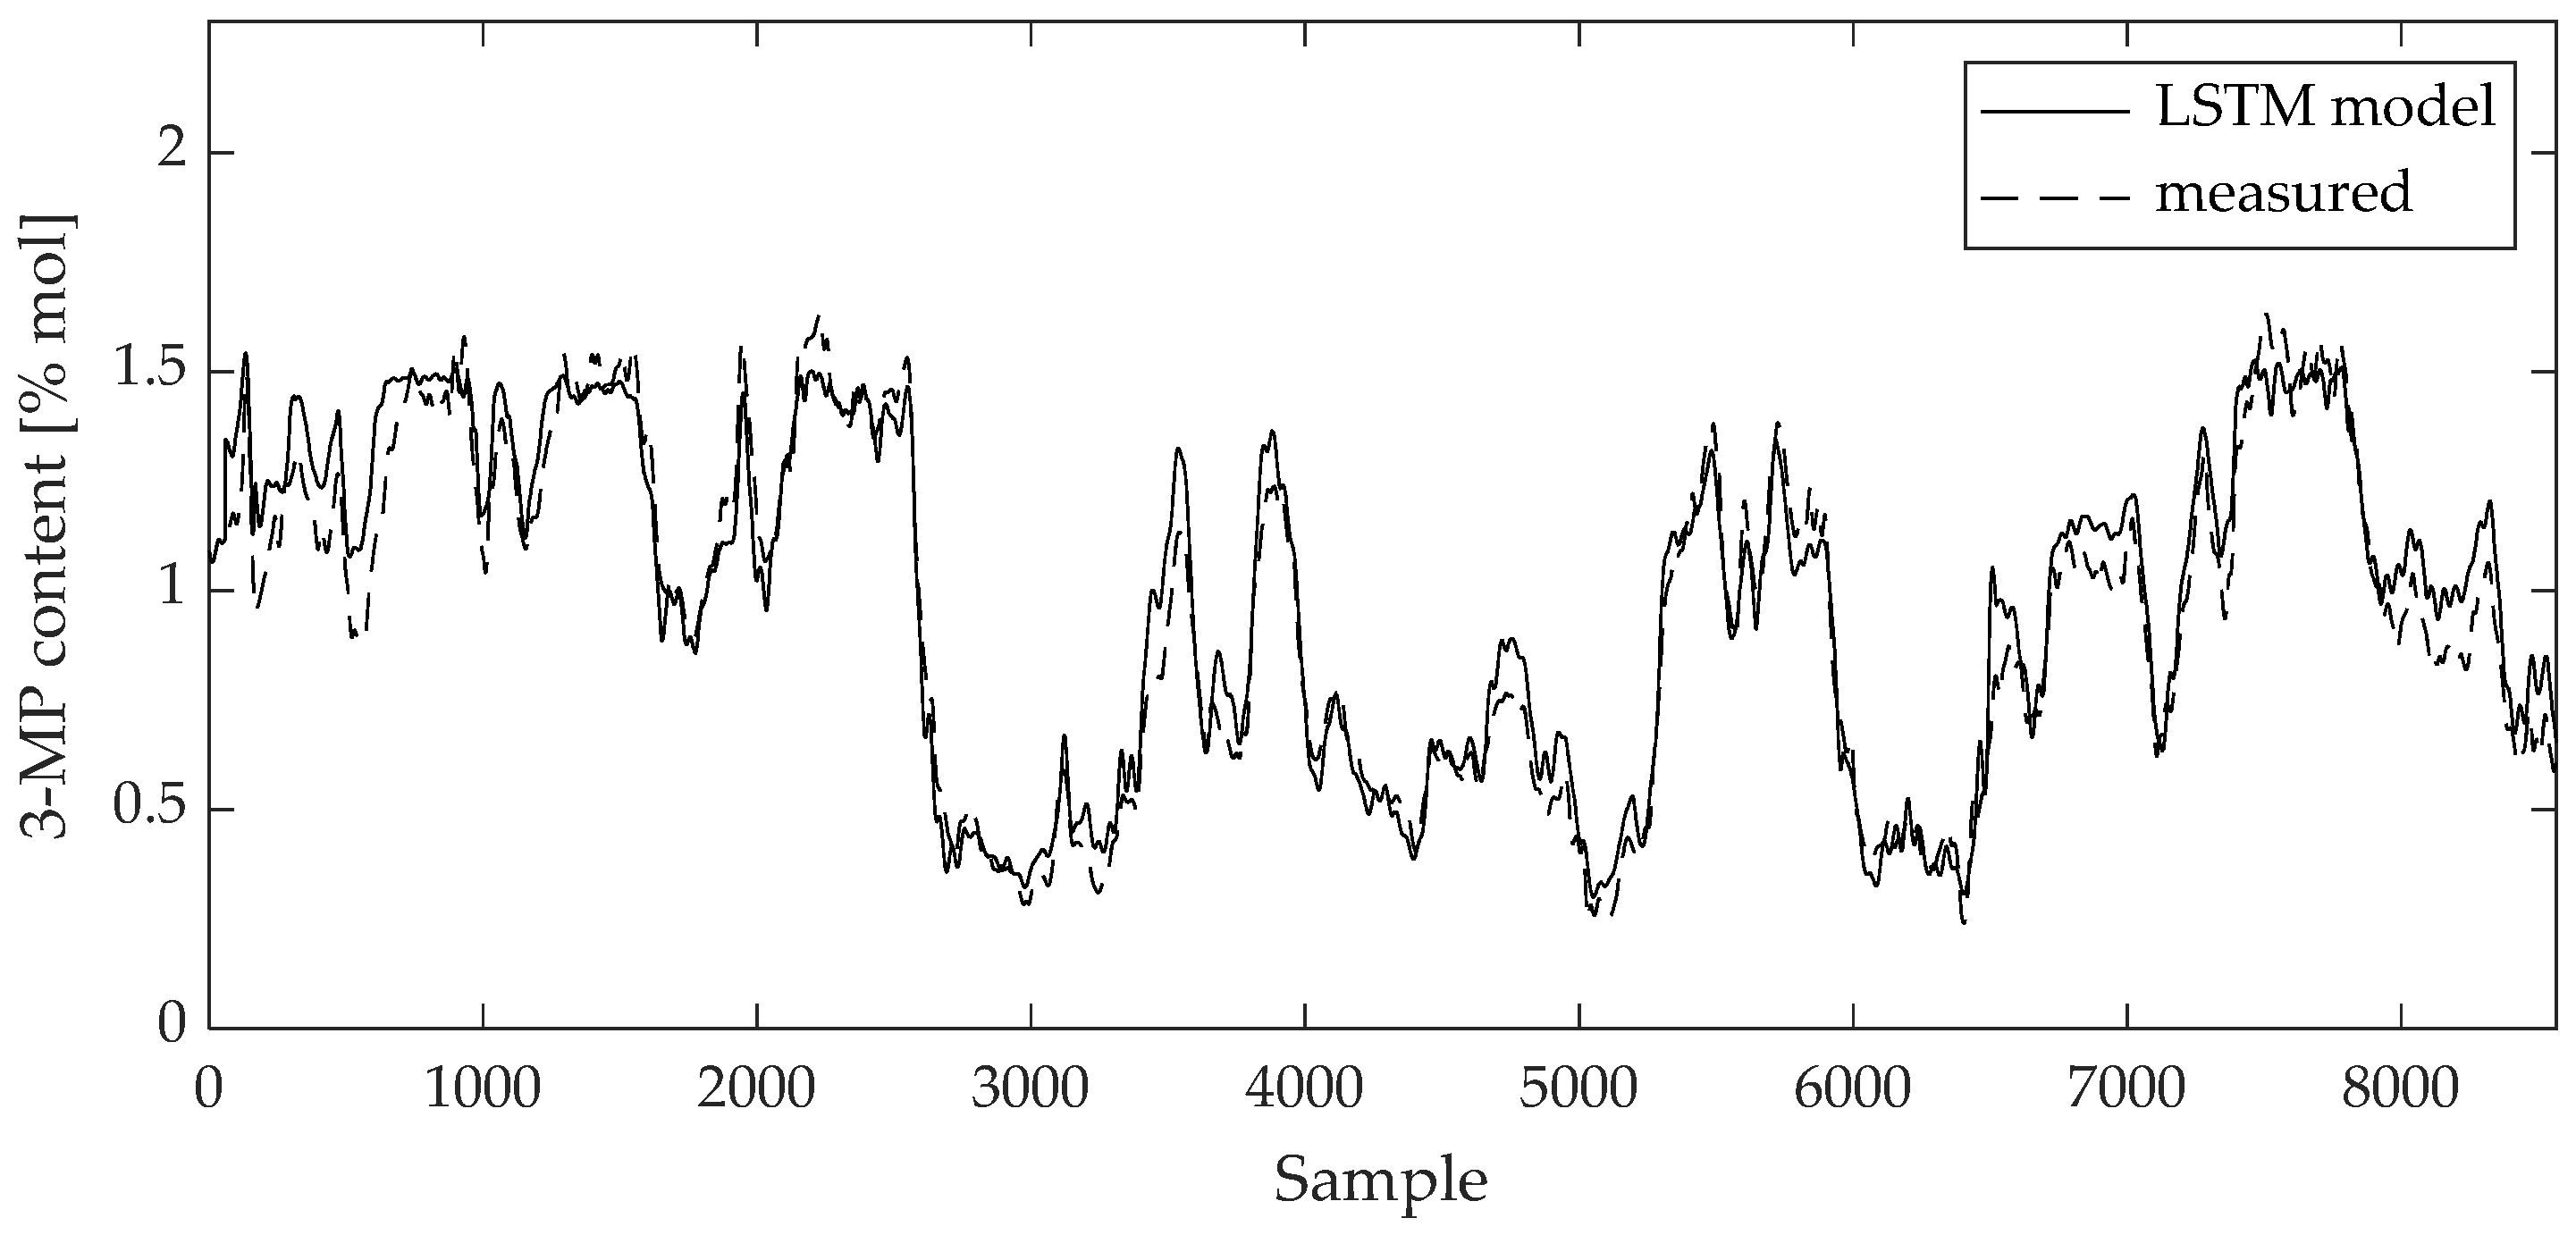
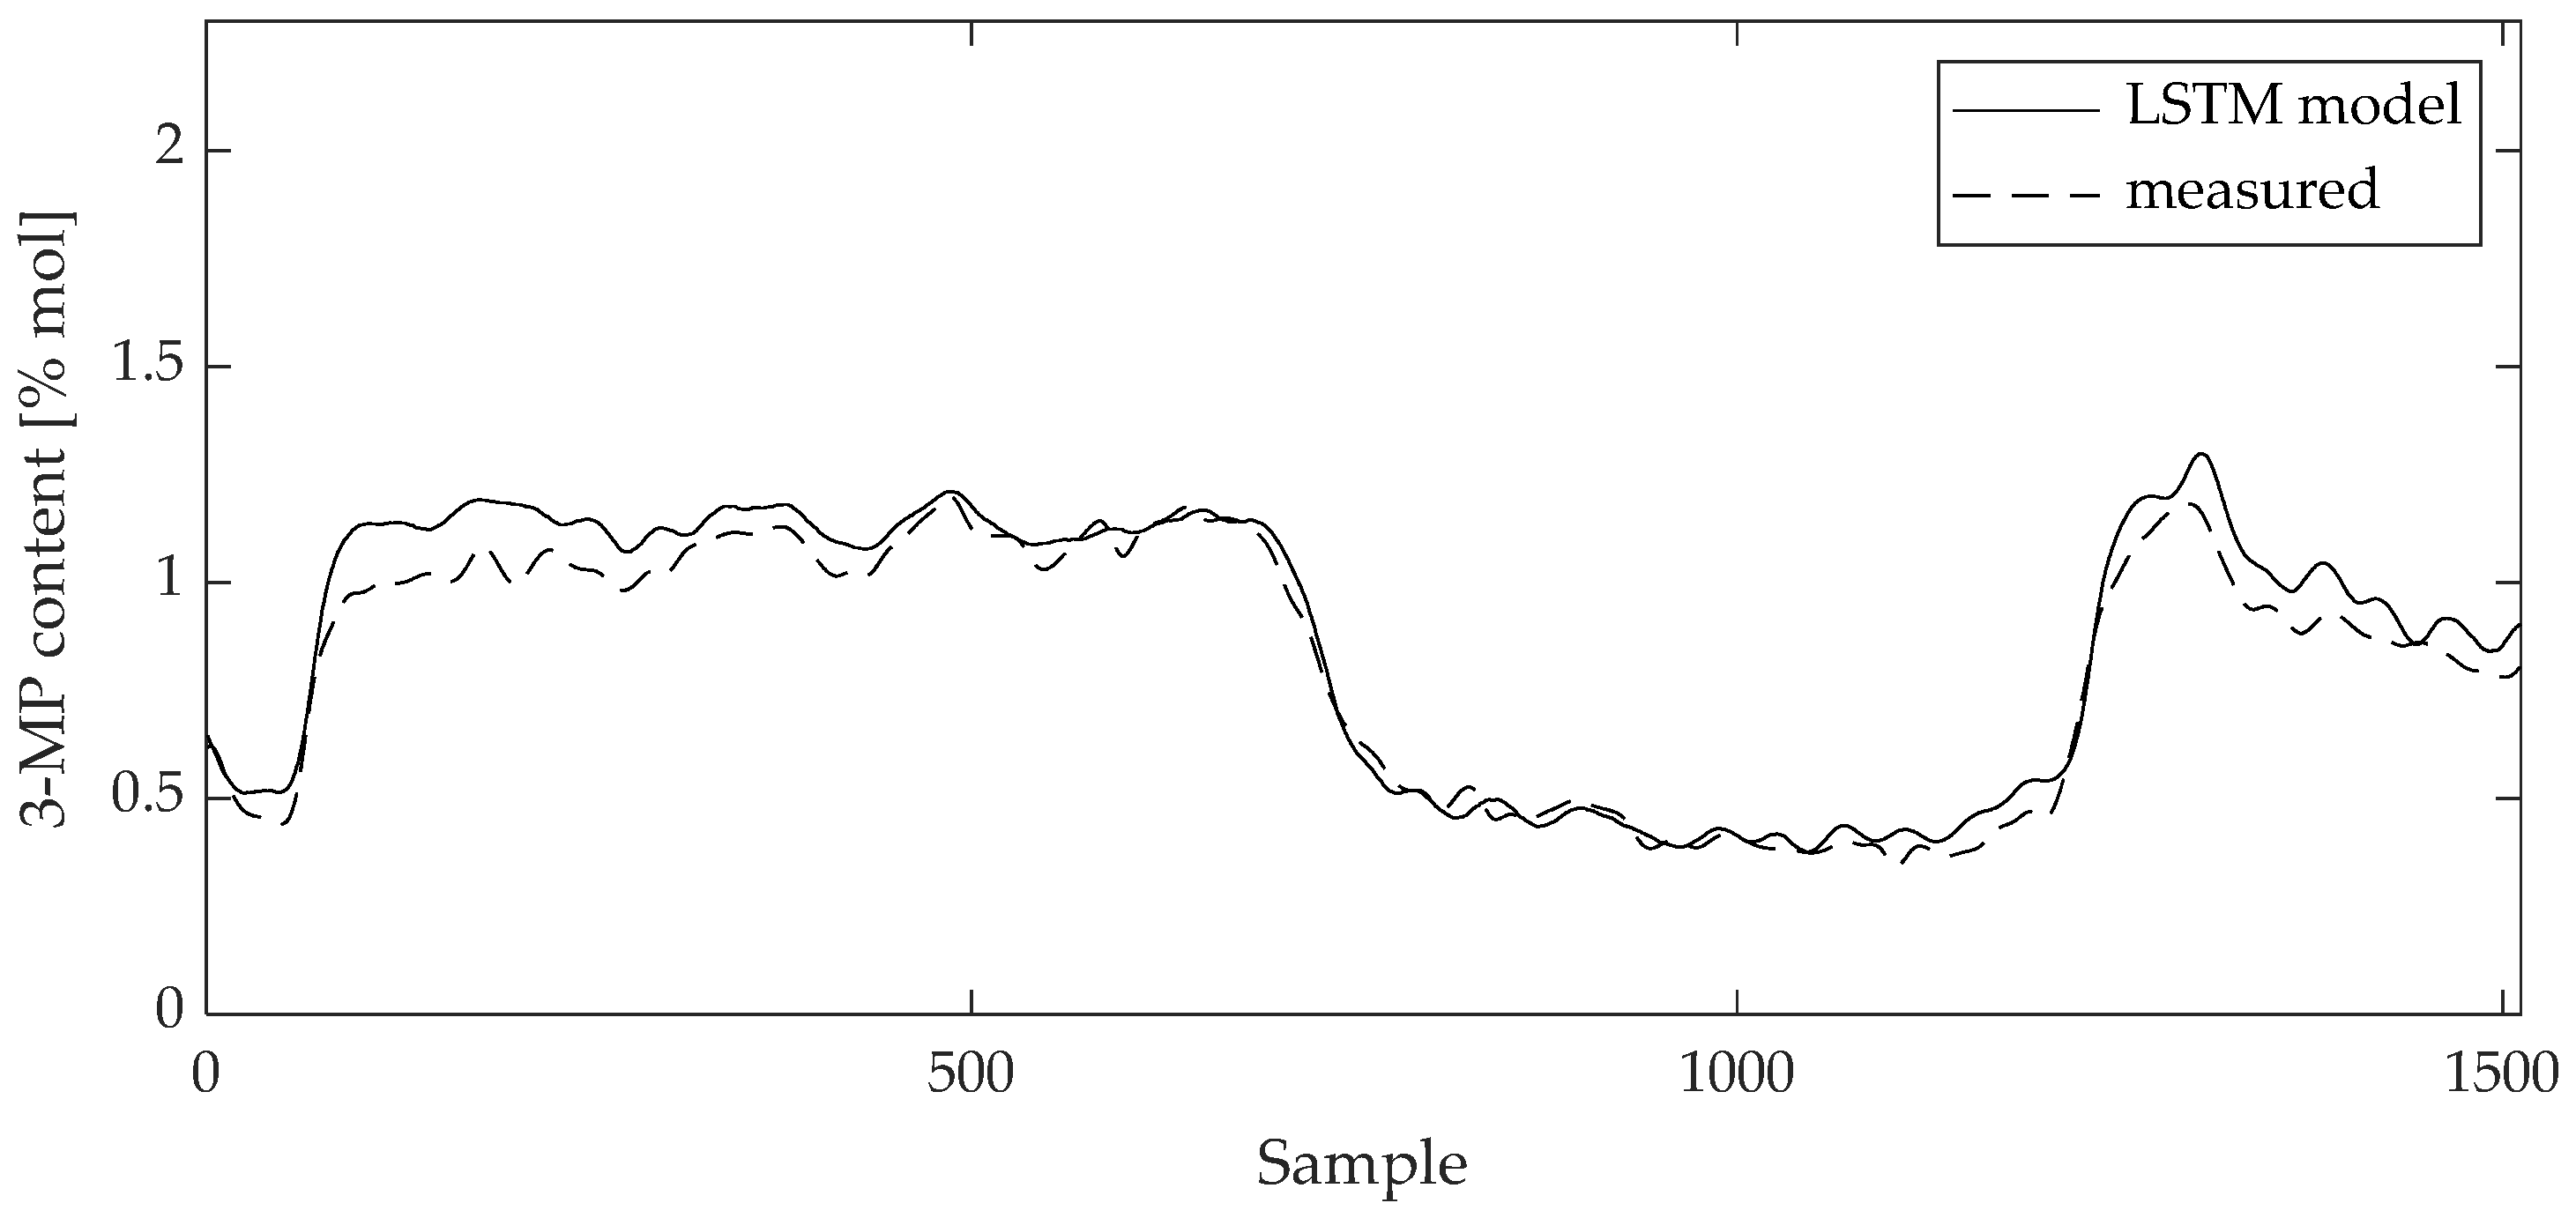
The validity of the model can be visually evaluated by direct comparison between the measured data and the model values on the training and test data sets (
Figure 8,
Figure 9,
Figure 10 and
Figure 11). The curves of the model results correspond with the data from
Table 2 and
Table 3.
Curves of comparison show good matching between measured data and the 2,3-DMB and 3-MP model output, respectively, both on the training and test data sets.
Table 4 and
Table 5 show the comparison of the results of the LSTM network models presented above with MLP ANN, SVM, and dynamic polynomial models (FIR, ARX, OE, NARX and HW).
For 2,3-DMB content, the LSTM-based model evaluated by the Pearson correlation coefficient showed a better result than the MLP-, FIR-, ARX-, OE-, NARX-, and HW-based models. The robust SVM-based model performed slightly better according to this criterion. According to other statistical criteria, the LSTM-based model proved to be inferior. However, in terms of application, the results are within a satisfactory range, since the mean square error and the mean absolute error are relatively small.
In the case of the content of 3-MP, the LSTM-based model showed superior results compared to MLP-, SVM-, FIR-, ARX- and NARX-based models for all statistical indicators. Only the dynamic polynomial models OE and HW with complex model structure are only slightly better in terms of statistical indicators. Based on the results, the models can be applied.
4. Discussion
The main hypothesis was to verify whether the recently widely used LSTM dynamic neural networks can satisfactorily estimate the quality-critical product components in a complex nonlinear industrial process and thus to be successfully applied in control systems of such processes. The research has shown that they can do so. The overall results of the developed models using LSTM dynamic recurrent neural networks are satisfactory. LSTM has a unique structure that allows them to selectively choose data from the past to correctly estimate future states, which means that there are no long computational times, which is very important in the industry.
In the paper under Reference [
35], it was found that ANN (MLP) generally describes the complex dynamics of the process worse than dynamic polynomial models commonly used in these cases, in terms of 2- and 3-MP content model group, and the question of developing dynamic networks arose. It can now be seen that dynamic LSTM networks in this case give better results than most of other models, including the robust SVM. They are only slightly worse than the structurally very complex models of OE and HW.
To allow a direct comparison of the developed LSTM-based models with other already developed models for an isomerization process, two data sets were used from those previously defined. The set for the development of the 2,2- and 2,3-DMB content model group is of less process dynamics (6 667 continuous samples). The descriptive statistics of data, which support this, is presented in
Table 6 and
Table 7. In the development of dynamic models, especially models with a simpler structure such as FIR and ARX, the problem of developing a satisfactory model arose because of this. Static MLP and SVM models showed better results, especially due to the randomization of the entire training data set. Due to the lower process dynamics and the characteristic structure of the LSTM network, the LSTM-based models gave slightly worse results compared to the other models, especially in terms of the higher mean square errors and mean absolute errors. Considering the characteristic data set, the highlighted advantages of LSTM networks did not come into play in this case.
The developed LSTM models of 2,3-DMB and 3-MP content are of satisfactory accuracy and with low errors overall, so they are recommended for application in the plant measurement and control system.
Improvements of the developed LSTM models are also possible by introducing an additional hidden layer; however, in this case there is a risk of excessive complexity of the model at the expense of a questionable improvement for practical application.
5. Conclusions
The paper presents the development of data-driven models based on dynamic LSTM recurrent neural networks and their comparison with several types previously developed models, including MLP, SVM, FIR, ARX, OE, NARX and HW. The developed LSTM-based models for estimating the contents of 2,3-DMB and 3-MP in an industrial process of isomerization show satisfactory results and are suitable for the application. In comparison with other models, the 3-MP content LSTM model shows generally better results, while the 2,3-DMB content LSTM model slightly worse, mainly due to less available process dynamics.
Author Contributions
Conceptualization, S.H. and Ž.U.A.; methodology, S.H.; software, N.R.; validation, S.H., Ž.U.A. and N.R.; formal analysis, N.B.; investigation, N.B.; resources, N.B.; data curation, N.R.; writing—original draft preparation, S.H.; writing—review and editing, Ž.U.A.; visualization, Ž.U.A.; supervision, N.B.; project administration, Ž.U.A.; funding acquisition, N.B. All authors have read and agreed to the published version of the manuscript.
Funding
This research received no external funding.
Data Availability Statement
Data sharing not applicable.
Acknowledgments
Not applicable.
Conflicts of Interest
The authors declare no conflict of interest. The funders had no role in the design of the study; in the collection, analyses, or interpretation of data; in the writing of the manuscript; or in the decision to publish the results.
References
- Han, Y.; Huang, G.; Song, S.; Yang, L.; Wang, H.; Wang, Y. Dynamic Neural Networks: A Survey. IEEE Trans. Pattern Anal. Mach. Intell. 2022, 44, 7436–7456. [Google Scholar] [CrossRef] [PubMed]
- Medsker, L.R.; Jain, L.C. (Eds.) Recurrent Neural Networks Design and Applications; CRC Press: Boca Raton, United States, 2001. [Google Scholar]
- Gillioz, A.; Casas, J.; Mugellini, E.; Khaled, O.A. Overview of the Transformer-based Models for NLP Tasks. In Proceedings of the 2020 15th Conference on Computer Science and Information Systems (FedCSIS), Sofia, Bulgaria, 6–9 September 2020. [Google Scholar] [CrossRef]
- Wan, R.; Mei, S.; Wang, J.; Liu, M.; Yang, F. Multivariate Temporal Convolutional Network: A Deep Neural Networks Approach for Multivariate Time Series Forecasting. Electronics 2019, 8, 876. [Google Scholar] [CrossRef]
- Yao, X.; Shao, Y.; Fan, S.; Cao, S. Echo state network with multiple delayed outputs for multiple delayed time series prediction. J. Frank. Inst. 2022, 359, 11089–11107. [Google Scholar] [CrossRef]
- Faradonbe, S.M.; Safi-Esfahani, F.; Karimian-Kelishadrokhi, M. A Review on Neural Turing Machine (NMT). SN Comput. Sci. 2020, 1, 333. [Google Scholar] [CrossRef]
- Rakhmatullin, A.Kh.; Gibadullin, R.F. Synthesis and Analysis of Elementary Algorithms for a Differential Neural Computer. Lobachevskii J. Math. 2022, 43, 473–483. [Google Scholar] [CrossRef]
- Soydaner, D. Attention mechanism in neural networks: where it comes and where it goes. Neural. Comput. Appl. 2022, 34, 13371–13385. [Google Scholar] [CrossRef]
- Widrow, B.; Winter, R. Neural nets for adaptive filtering and adaptive pattern recognitions. Computer 1988, 21, 25–39. [Google Scholar] [CrossRef]
- Graves, A. Supervised Sequence Labelling with Reccurent Neural Networks; Springer: New York, United States, 2012. [Google Scholar]
- Hochreiter, S.; Schmidhuber, J. Long Short-Term Memory. Neural Comput. 1997, 9, 1735–1780. [Google Scholar] [CrossRef]
- Van Houdt, G.; Mosquera, C.; Nápoles, G. A review on the long short-term memory model. Artif. Intell. Rev. 2020, 53, 5929–5955. [Google Scholar] [CrossRef]
- Liu, Y.; Young, R.; Jafarpour, B. Long–short-term memory encoder–decoder with regularized hidden dynamics for fault detection in industrial processes. J. Process Control 2023, 124, 166–178. [Google Scholar] [CrossRef]
- Aghaee, M.; Krau, S.; Tamer, M.; Budman, H. Unsupervised Fault Detection of Pharmaceutical Processes Using Long Short-Term Memory Autoencoders. Ind. Eng. Chem. Res. 2023, 62, 9773–9786. [Google Scholar] [CrossRef]
- Yao, P.; Yang, S.; Li, P. Fault Diagnosis Based on RseNet-LSTM for Industrial Process. In Proceedings of the 2021 IEEE 5th Advanced Information Technology, Electronic and Automation Control Conference (IAEAC), Chongqing, China, 12–14 March 2021. [Google Scholar]
- Zhang, H.; Niu, G.; Zhang, B.; Miao, Q. Cost-Effective Lebesgue Sampling Long Short-Term Memory Networks for Lithium-Ion Batteries Diagnosis and Prognosis. IEEE Trans. Ind. Electron. 2021, 69, 1958–1964. [Google Scholar] [CrossRef]
- He, R.; Chen, G.; Sun, S.; Dong, C.; Jiang, S. Attention-Based Long Short-Term Memory Method for Alarm Root-Cause Diagnosis in Chemical Processes. Ind. Eng. Chem. Res. 2020, 59, 11559–11569. [Google Scholar] [CrossRef]
- Yu, J.; Liu, X.; Ye, L. Convolutional Long Short-Term Memory Autoencoder-Based Feature Learning for Fault Detection in Industrial Processes. IEEE Trans. Instrum. Meas. 2020, 70, 1–15. [Google Scholar] [CrossRef]
- Tan, Q.; Li, B. Soft Sensor Modeling Method for Sulfur Recovery Process Based on Long Short-Term Memory Artificial Neural Network (LSTM). In Proceedings of the 2023 9th International Conference on Energy Materials and Environment Engineering (ICEMEE 2023), Kuala Lumpur, Malaysia, 8–10 June 2023. [Google Scholar]
- Curreri, F.; Patanè, L.; Xibilia, M.G. RNN- and LSTM-Based Soft Sensors Transferability for an Industrial Process. Sensors 2021, 21, 823. [Google Scholar] [CrossRef] [PubMed]
- Yuan, X.; Li, L.; Wang, Y. Nonlinear Dynamic Soft Sensor Modeling With Supervised Long Short-Term Memory Network. IEEE Trans. Ind. Inform. 2020, 16, 3168–3176. [Google Scholar] [CrossRef]
- Liu, Q.; Jia, M.; Gao, Z.; Xu, L.; Liu, Y. Correntropy long short term memory soft sensor for quality prediction in industrial polyethylene process. Chemom. Intell. Lab. Syst. 2022, 231, 104678. [Google Scholar] [CrossRef]
- Zhou, J.; Wang, X.; Yang, C.; Xiong, W. A Novel Soft Sensor Modeling Approach Based on Difference-LSTM for Complex Industrial Process. IEEE Trans. Ind. Inform. 2022, 18, 2955–2964. [Google Scholar] [CrossRef]
- Geng, Z.; Chen, Z.; Meng, Q.; Han, Y. Novel Transformer Based on Gated Convolutional Neural Network for Dynamic Soft Sensor Modeling of Industrial Processes. IEEE Trans. Ind. Inform. 2022, 18, 1521–1529. [Google Scholar] [CrossRef]
- Feng, Z.; Li, Y.; Sun, B. A multimode mechanism-guided product quality estimation approach for multi-rate industrial processes. Inf. Sci. 2022, 596, 489–500. [Google Scholar] [CrossRef]
- Sun, M.; Zhang, Z.; Zhou, Y.; Xia, Z.; Zhou, Z.; Zhang, L. Convolution and Long Short-Term Memory Neural Network for PECVD Process Quality Prediction. In Proceedings of the 2021 Global Reliability and Prognostics and Health Management (PHM-Nanjing), Nanjing, China, 15–17 October 2021. [Google Scholar]
- Tang, Y.; Wang, Y.; Liu, C.; Yuan, X.; Wang, K.; Yang, C. Semi-supervised LSTM with historical feature fusion attention for temporal sequence dynamic modeling in industrial processes. Eng. Appl. Artif. Intell. 2023, 117, 105547. [Google Scholar] [CrossRef]
- Lei, R.; Guo, Y.B.; Guo, W. Physics-guided long short-term memory networks for emission prediction in laser powder bed fusion. J. Manuf. Sci. Eng. 2023, 1–46. [Google Scholar] [CrossRef]
- Jin, N.; Zeng, Y.; Yan, K.; Ji, Z. Multivariate Air Quality Forecasting With Nested Long Short Term Memory Neural Network. IEEE Trans. Ind. Inform. 2021, 17, 8514–8522. [Google Scholar] [CrossRef]
- Xu, B.; Pooi, C.K.; Tan, K.M.; Huang, S.; Shi, X.; Ng, H.Y. A novel long short-term memory artificial neural network (LSTM)-based soft-sensor to monitor and forecast wastewater treatment performance. J. Water Process Eng. 2023, 54, 104041. [Google Scholar] [CrossRef]
- Ma, S.; Zhang, Y.; Lv, J.; Ge, Y.; Yang, H.; Li, L. Big data driven predictive production planning for energy-intensive manufacturing industries. Energy 2020, 211, 118320. [Google Scholar] [CrossRef]
- Hamied, R.S.; Shakor, Z.M.; Sadeiq, A.H.; Abdul Razak, A.A.; Khadim, A.T. Kinetic Modeling of Light Naphtha Hydroisomerization in an Industrial Universal Oil Products Penex™ Unit. Energy Engineering 2023, 120, 1371–1386. [Google Scholar] [CrossRef]
- Khajah, M.; Chehadeh, D. Modeling and active constrained optimization of C5/C6 isomerization via Artificial Neural Networks. Chem. Eng. Res. Des. 2022, 182, 395–409. [Google Scholar] [CrossRef]
- Abdolkarimi, V.; Sari, A.; Shokri, S. Robust prediction and optimization of gasoline quality using data-driven adaptive modeling for a light naphtha isomerization reactor. Fuel 2022, 328, 125304. [Google Scholar] [CrossRef]
- Ujević Andrijić, Ž.; Herceg, S.; Bolf, N. Data-driven estimation of critical quality attributes on industrial processes. In Proceedings of the 19th Ružička Days “Today Science – Tomorrow Industry” international conference, Vukovar, Croatia, 21–23 September 2022. [Google Scholar]
- Herceg, S.; Ujević Andrijić, Ž.; Bolf, N. Support vector machine-based soft sensors in the isomerization process. Chem. Biochem. Eng. Q. 2020, 34, 243–255. [Google Scholar] [CrossRef]
- Herceg, S.; Ujević Andrijić, Ž.; Bolf, N. Development of soft sensors for isomerization process based on support vector machine regression and dynamic polynomial models. Chem. Eng. Res. Des. 2019, 149, 95–103. [Google Scholar] [CrossRef]
- Herceg, S.; Ujević Andrijić, Ž.; Bolf, N. Continuous estimation of the key components content in the isomerization process products. Chem. Eng. Trans. 2018, 69, 79–84. [Google Scholar] [CrossRef]
- Fortuna, L.; Graziani, S.; Rizzo, A.; Xibilia, M.G. Soft Sensors for Monitoring and Control of Industrial Processes (Advances in Industrial Control); Springer: London, United Kingdom, 2007. [Google Scholar]
- Kadlec, P.; Gabrys, B.; Strandt, S. Data-driven Soft Sensors in the process industry. Comput. Chem. Eng. 2009, 33, 795–814. [Google Scholar] [CrossRef]
- Greff, K.; Srivastava, R.K.; Koutník, J.; Steunebrink, B.R.; Schmidhuber, J. LSTM: A Search Space Odyssey. IEEE Trans. Neural Netw. Learn. Syst. 2017, 28, 2222–2232. [Google Scholar] [CrossRef]
- Beale, M.H.; Hagan, M.T.; Demuth, H.B. Deep Learning Toolbox™ User's Guide; The MathWorks, Inc.: Natick, United States, 2020; pp. 1-53–1-64. [Google Scholar]
- Goodfellow, I.; Bengio, Y.; Courville, A. Deep Learning; The MIT Press: Cambridge, United States, 2016; pp. 267–320. [Google Scholar]
- Cusher, N.A. UOP Penex Process. In Handbook of Petroleum Refining Processes, 3rd ed.; Meyers R.A. Ed.; McGraw-Hill: New York, United States, 2003; pp. 9.15–9.27. [Google Scholar]
- Cerić, E. Nafta, procesi i proizvodi; IBC d.o.o.: Sarajevo, Bosnia and Herzegovina, 2012. [Google Scholar]
|
Disclaimer/Publisher’s Note: The statements, opinions and data contained in all publications are solely those of the individual author(s) and contributor(s) and not of MDPI and/or the editor(s). MDPI and/or the editor(s) disclaim responsibility for any injury to people or property resulting from any ideas, methods, instructions or products referred to in the content. |
© 2023 by the authors. Licensee MDPI, Basel, Switzerland. This article is an open access article distributed under the terms and conditions of the Creative Commons Attribution (CC BY) license (http://creativecommons.org/licenses/by/4.0/).
