Submitted:
01 October 2023
Posted:
02 October 2023
You are already at the latest version
Abstract
Keywords:
1. Introduction
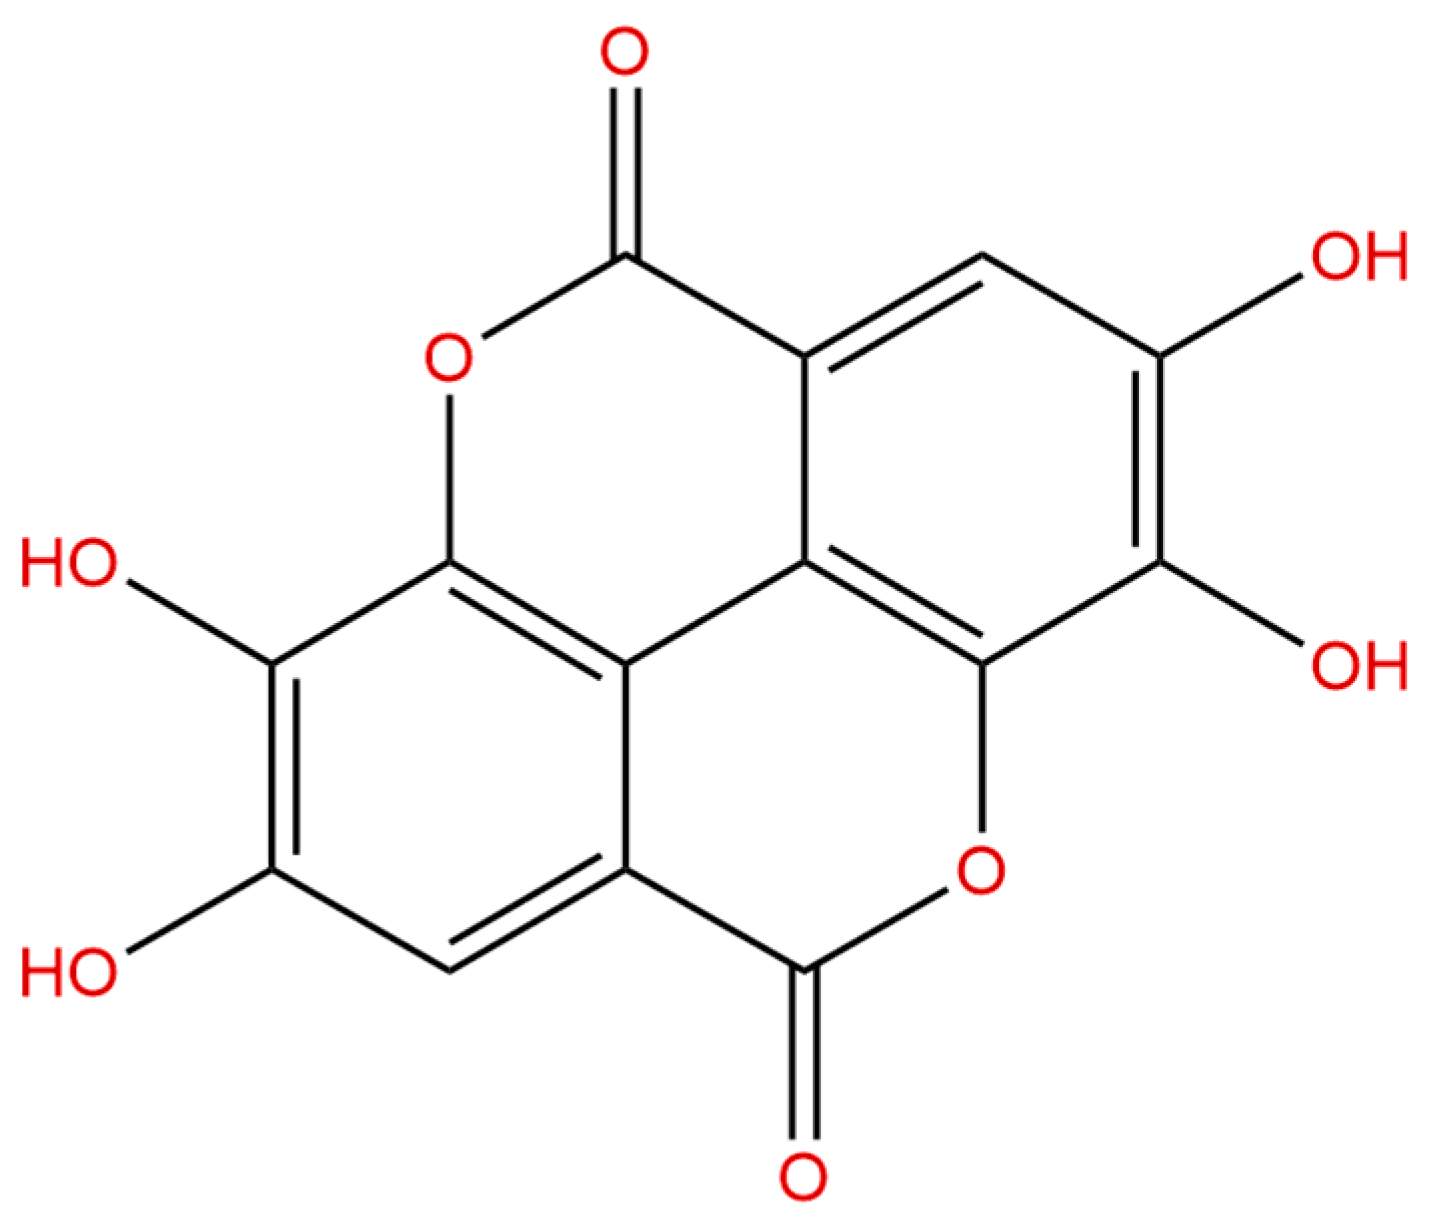
2. Materials and Methods
2.1. Drugs and Reagents
2.2. Animals and Treatments
2.3. Measurement of Aspartate Aminotransferase (AST) and Alanine Aminotransferase (ALT)
2.4. Histopathological Analysis
2.5. Measurements for Malondialdehyde (MDA) Level, and Catalase (CAT), and Superoxide Dismutase (SOD) Activites
2.6. Measurements of Inflammatory Markers
2.7. Measurements of the Activities of Caspase-9 and Caspase-3
2.8. Quantitative RT-PCR
2.9. Western Blotting
2.10. Molecular Docking Analysis
2.11. Statistical Analysis
3. Results
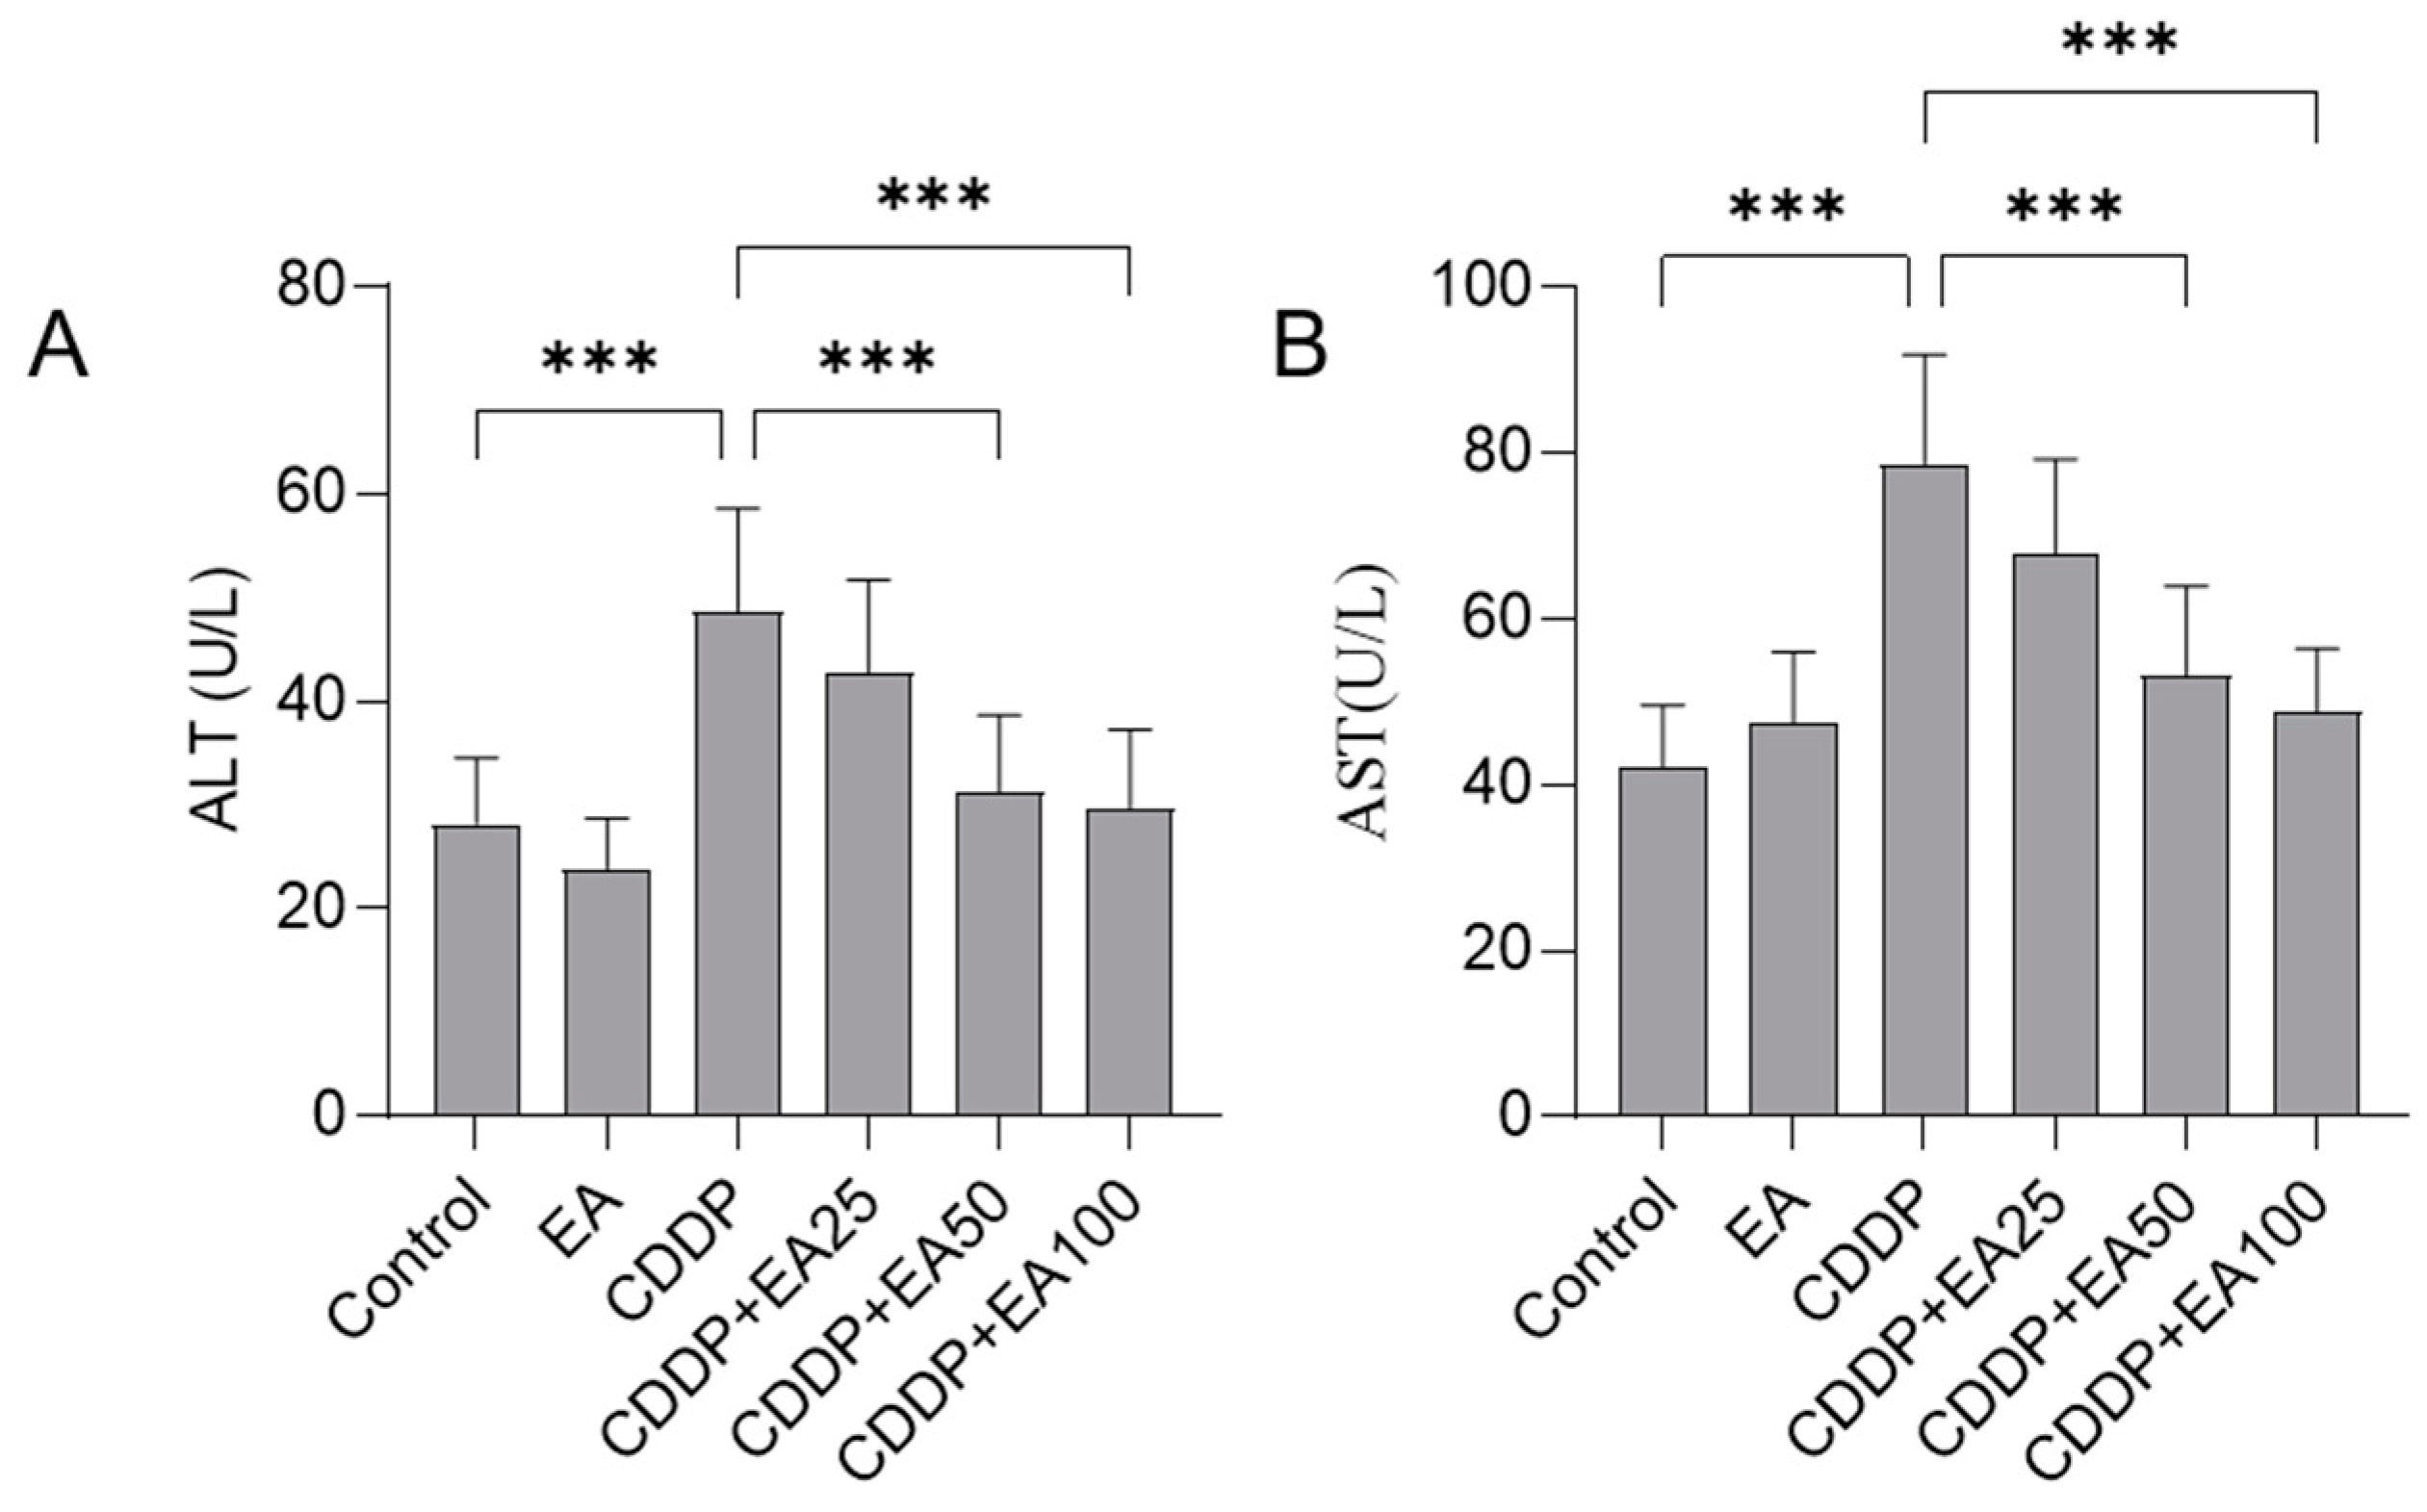
3.1. EA Supplementation Decreases the Levels of Serum ALT and AST
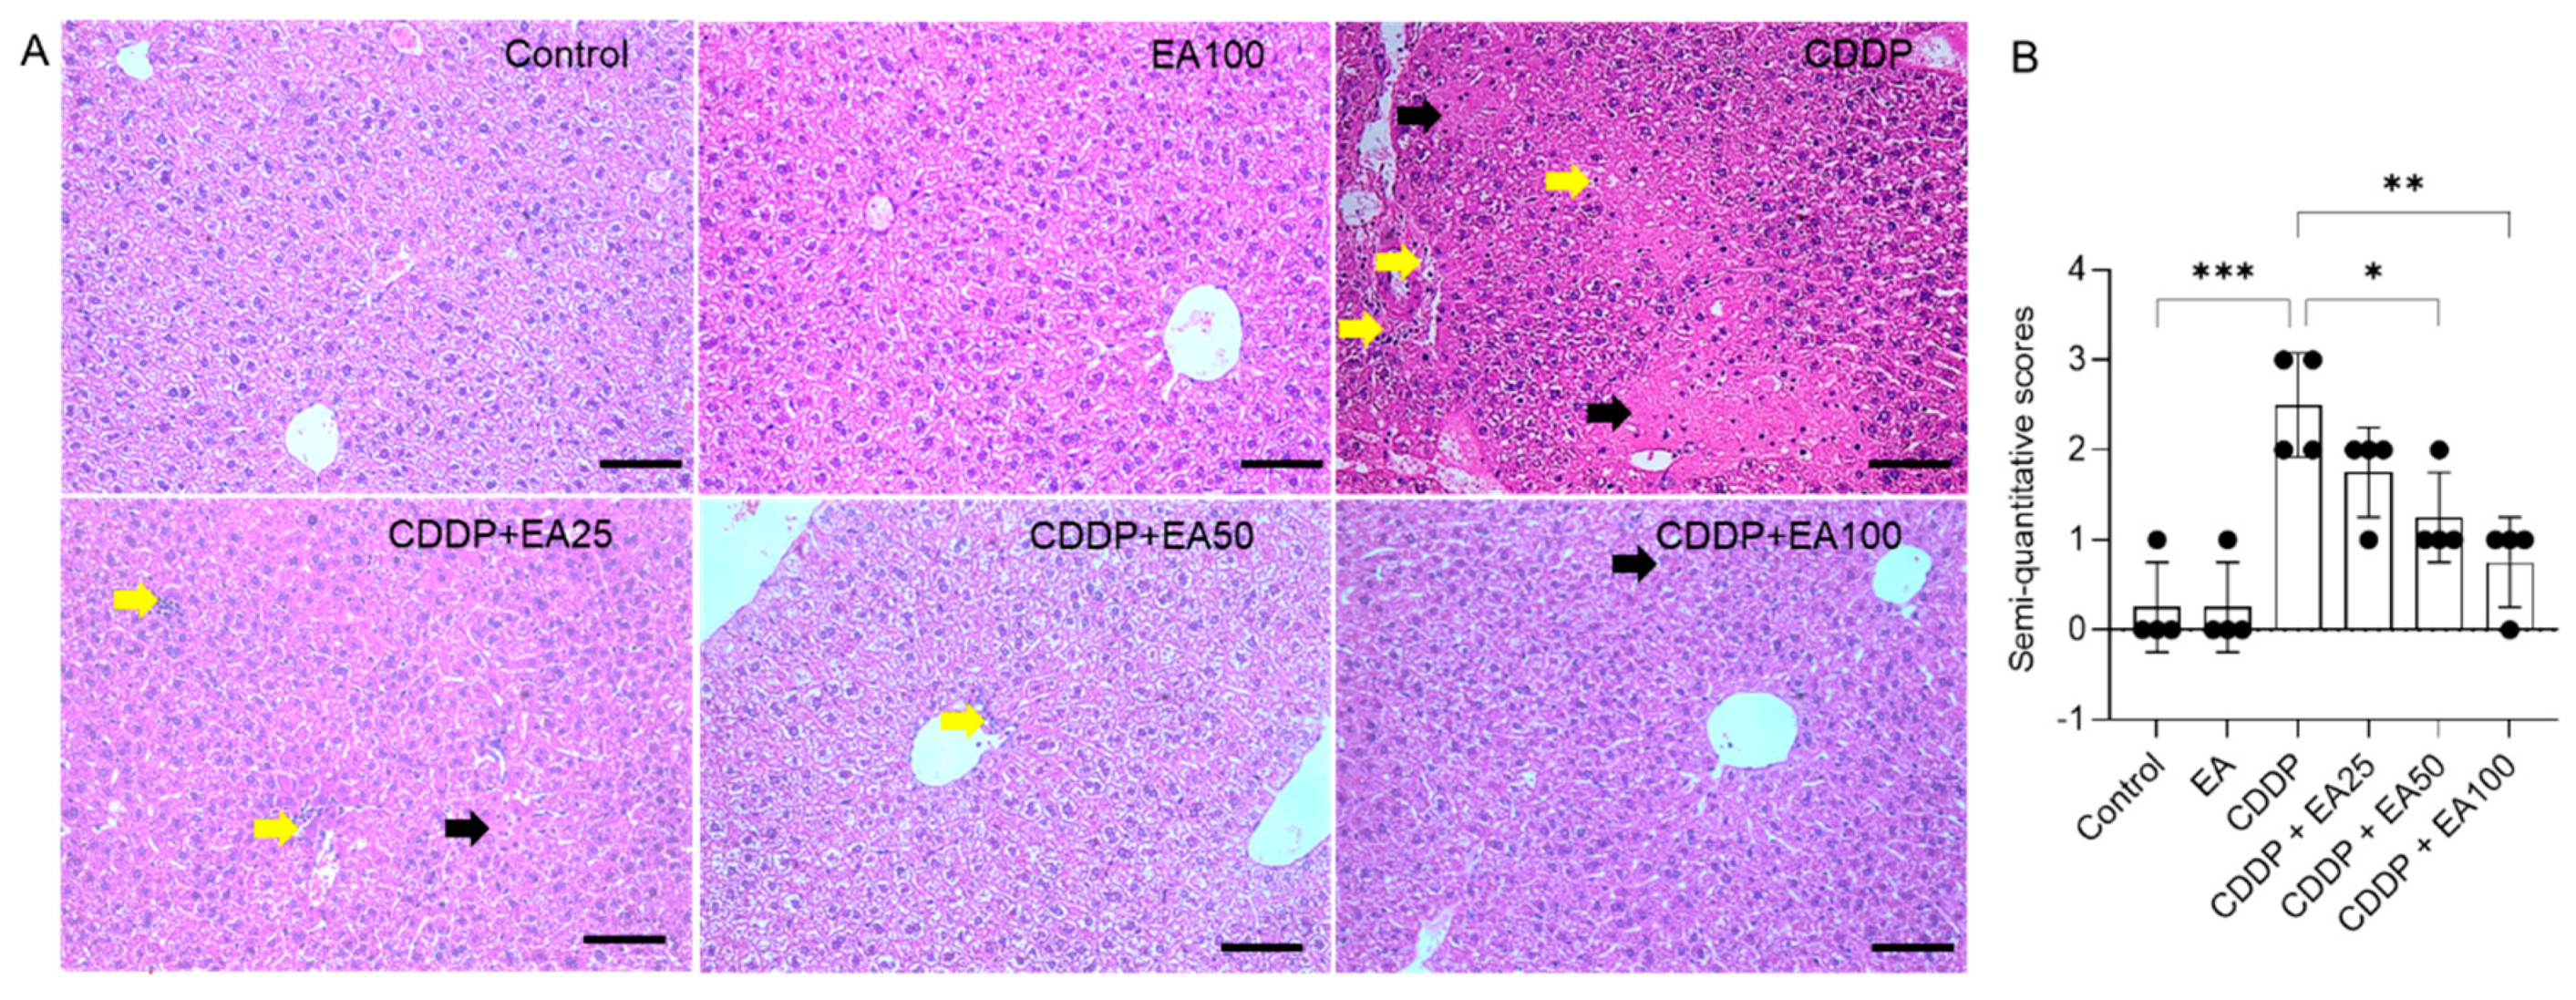
3.2. EA Supplementation Attenuates CDDP Exposure-Induced Histopathological Changes in the Livers
3.3. EA Supplementation Attenuates CDDP Exposure-Induced Liver Oxidative Stress Damage
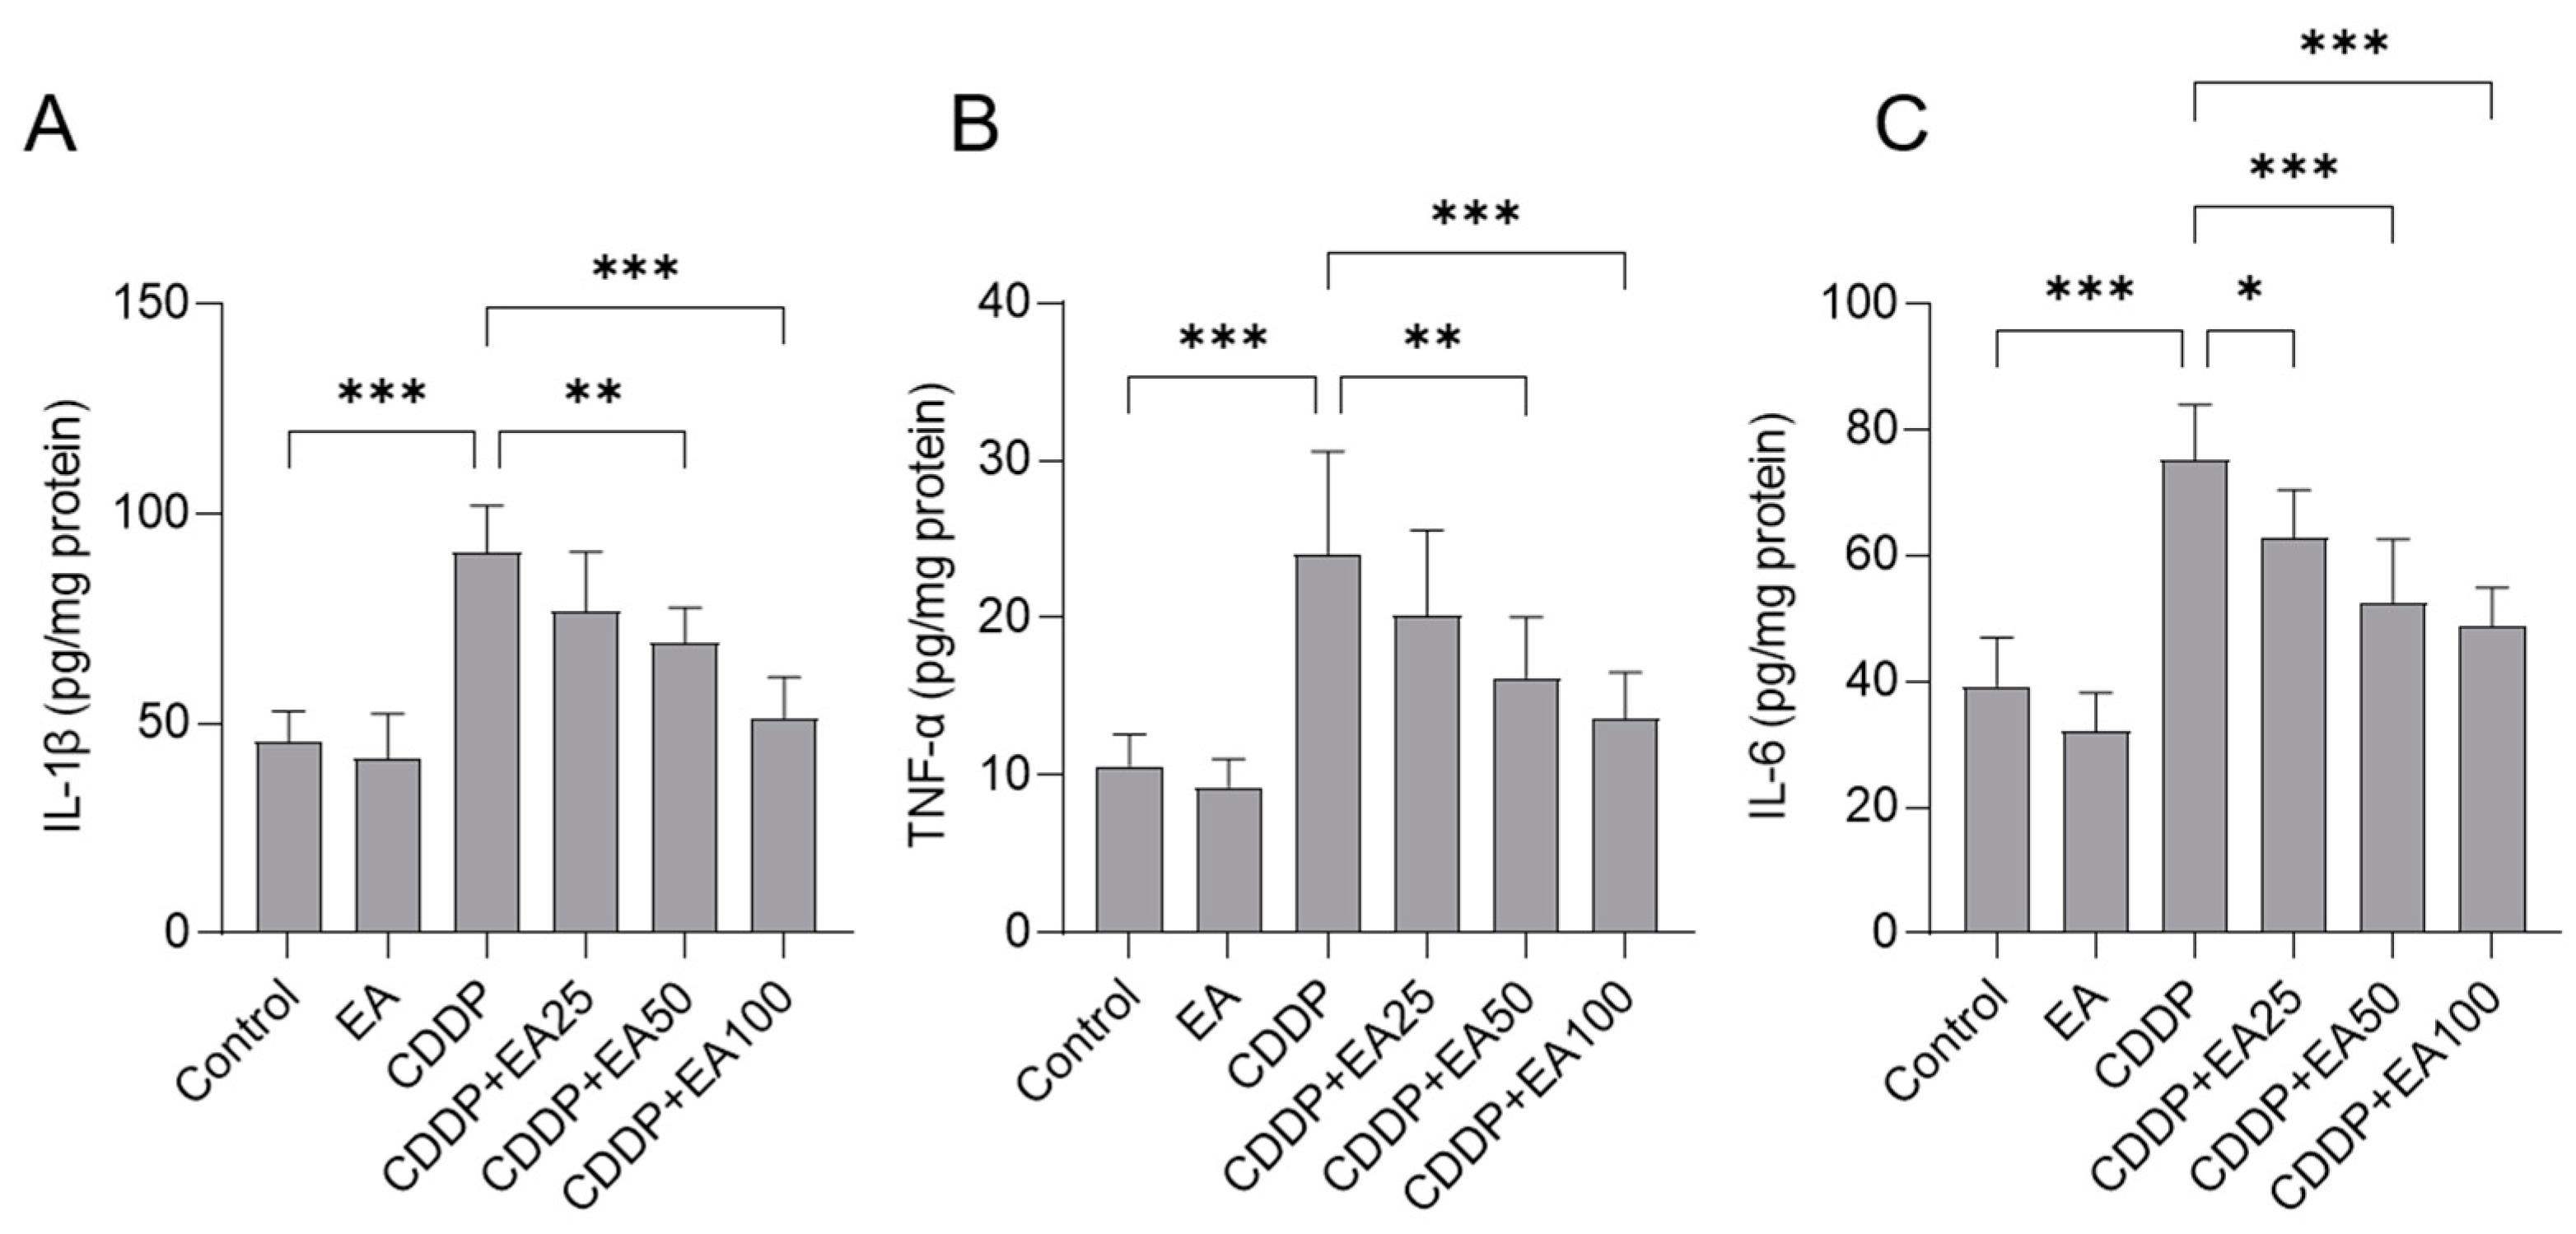
3.4. EA Supplementation Attenuates CDDP Exposure-Caused Inflammatory Response in the Livers of Mice
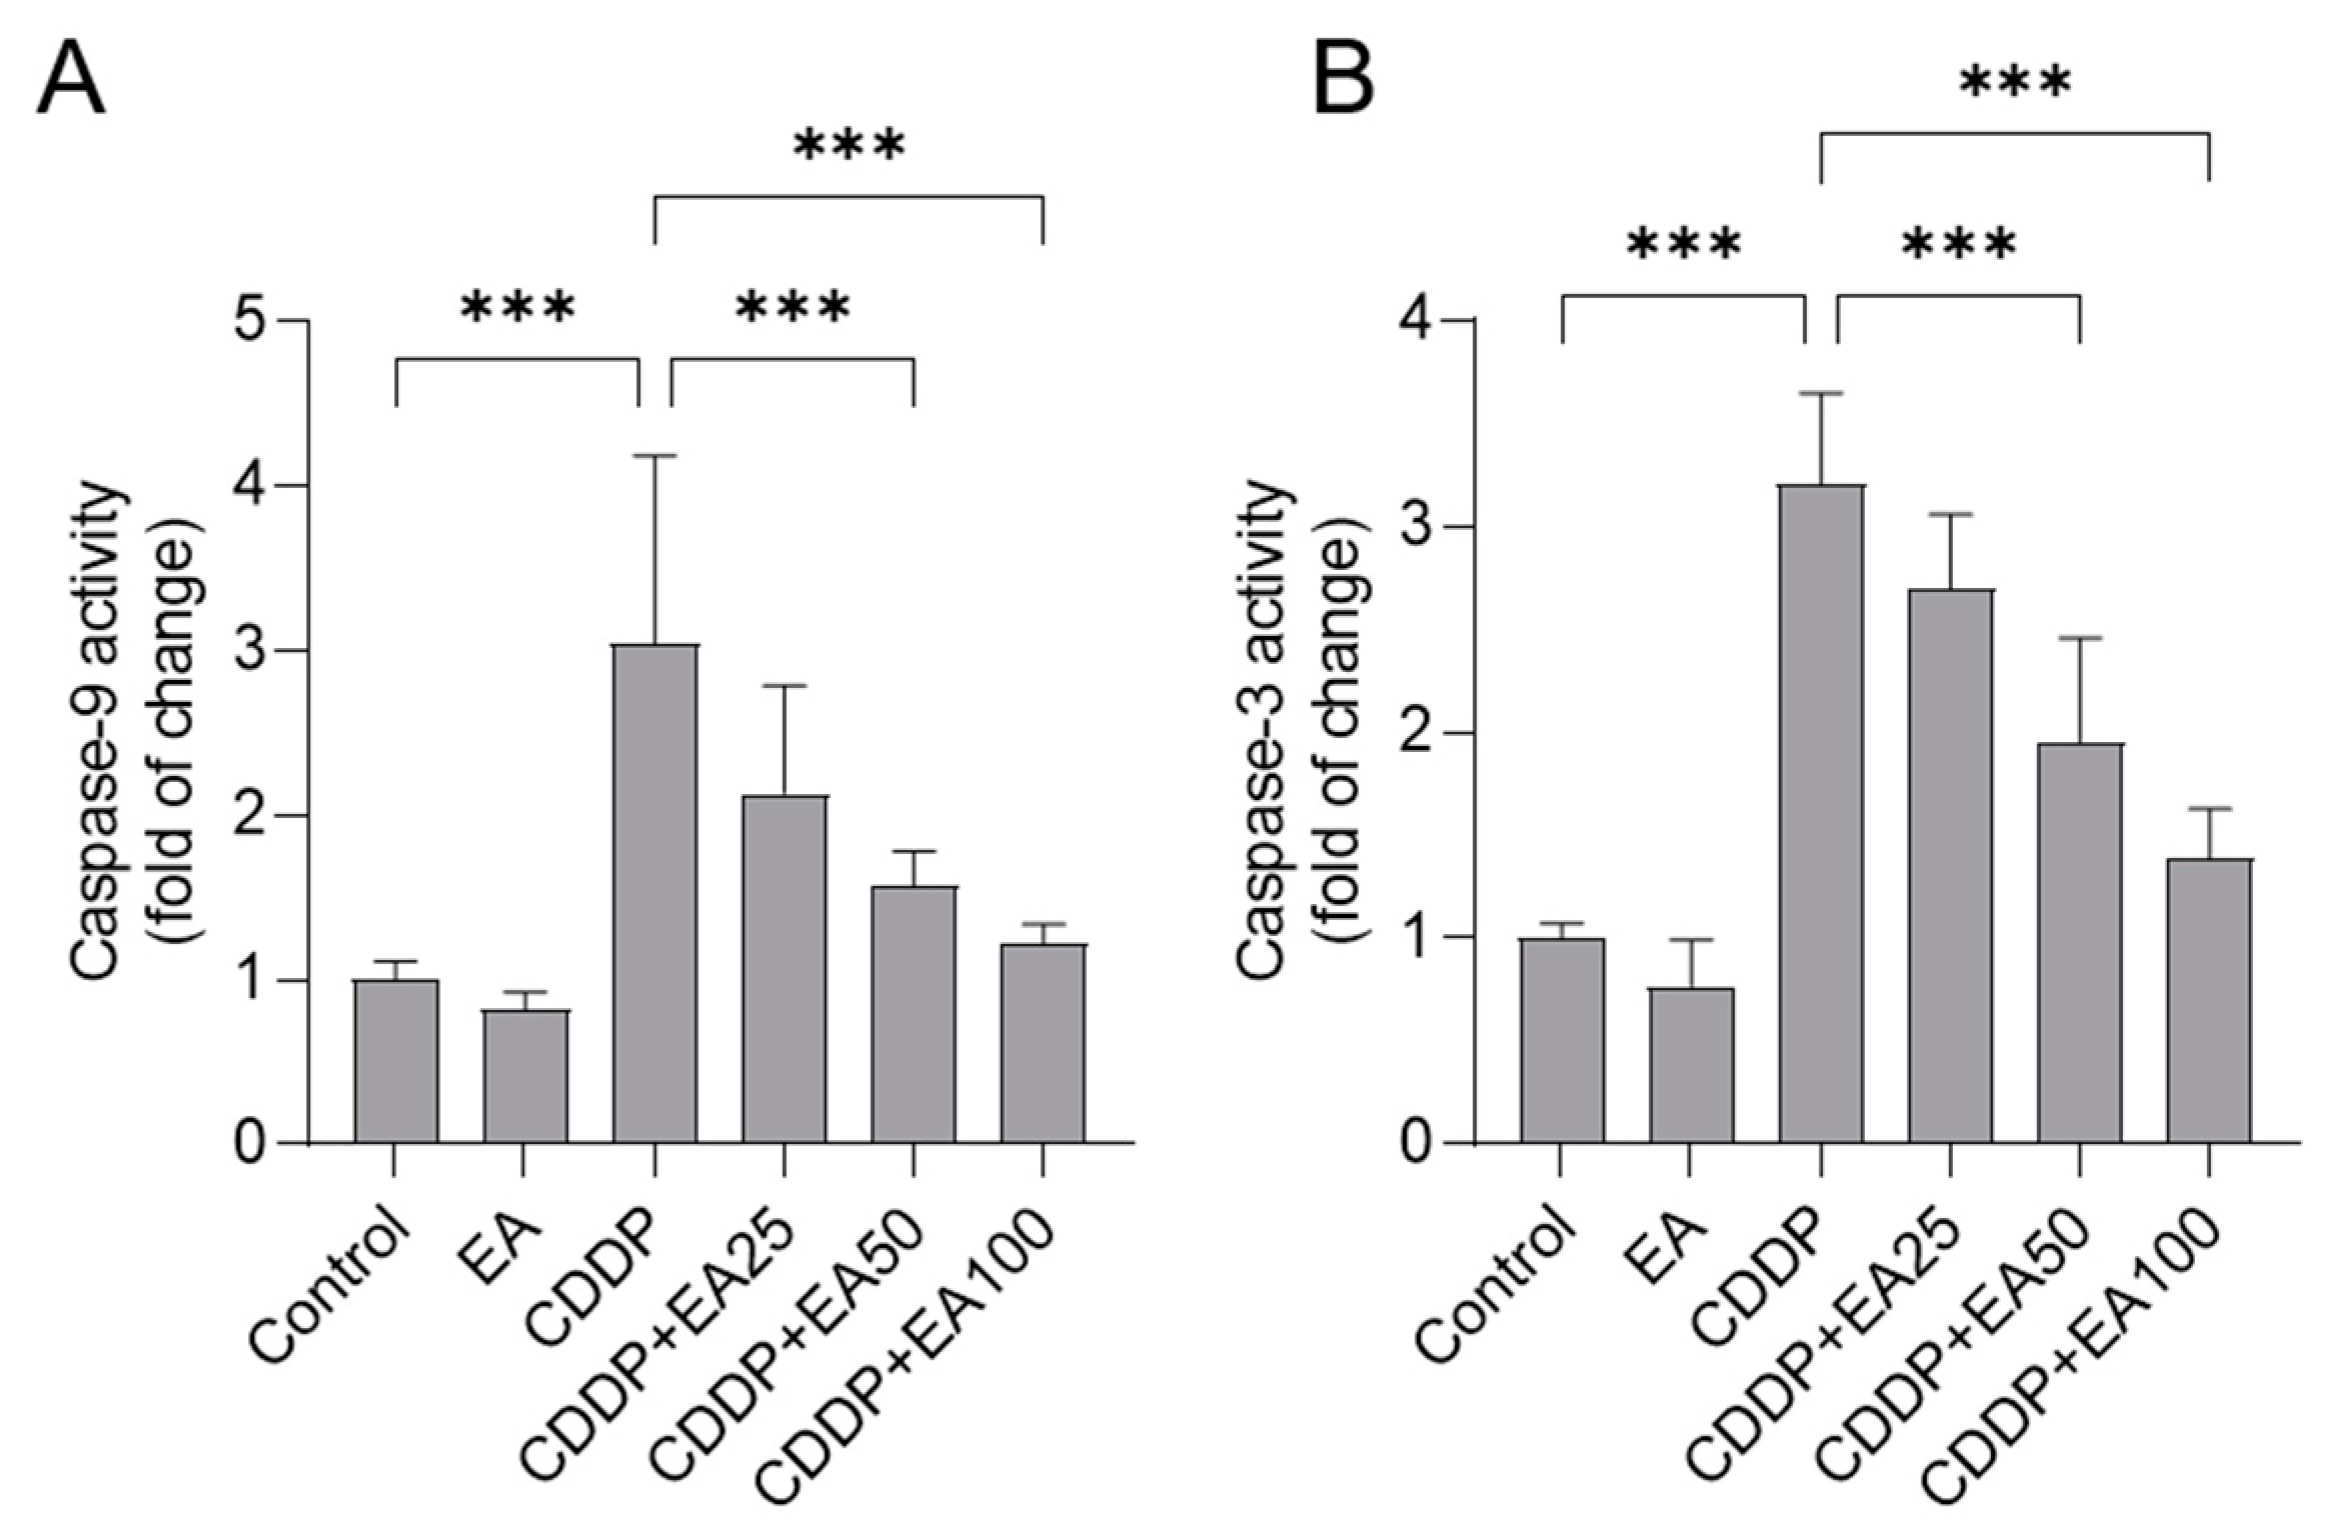
3.5. EA Supplementation Attenuates CDDP Exposure-Induced the Activation of Casapses in the Livers
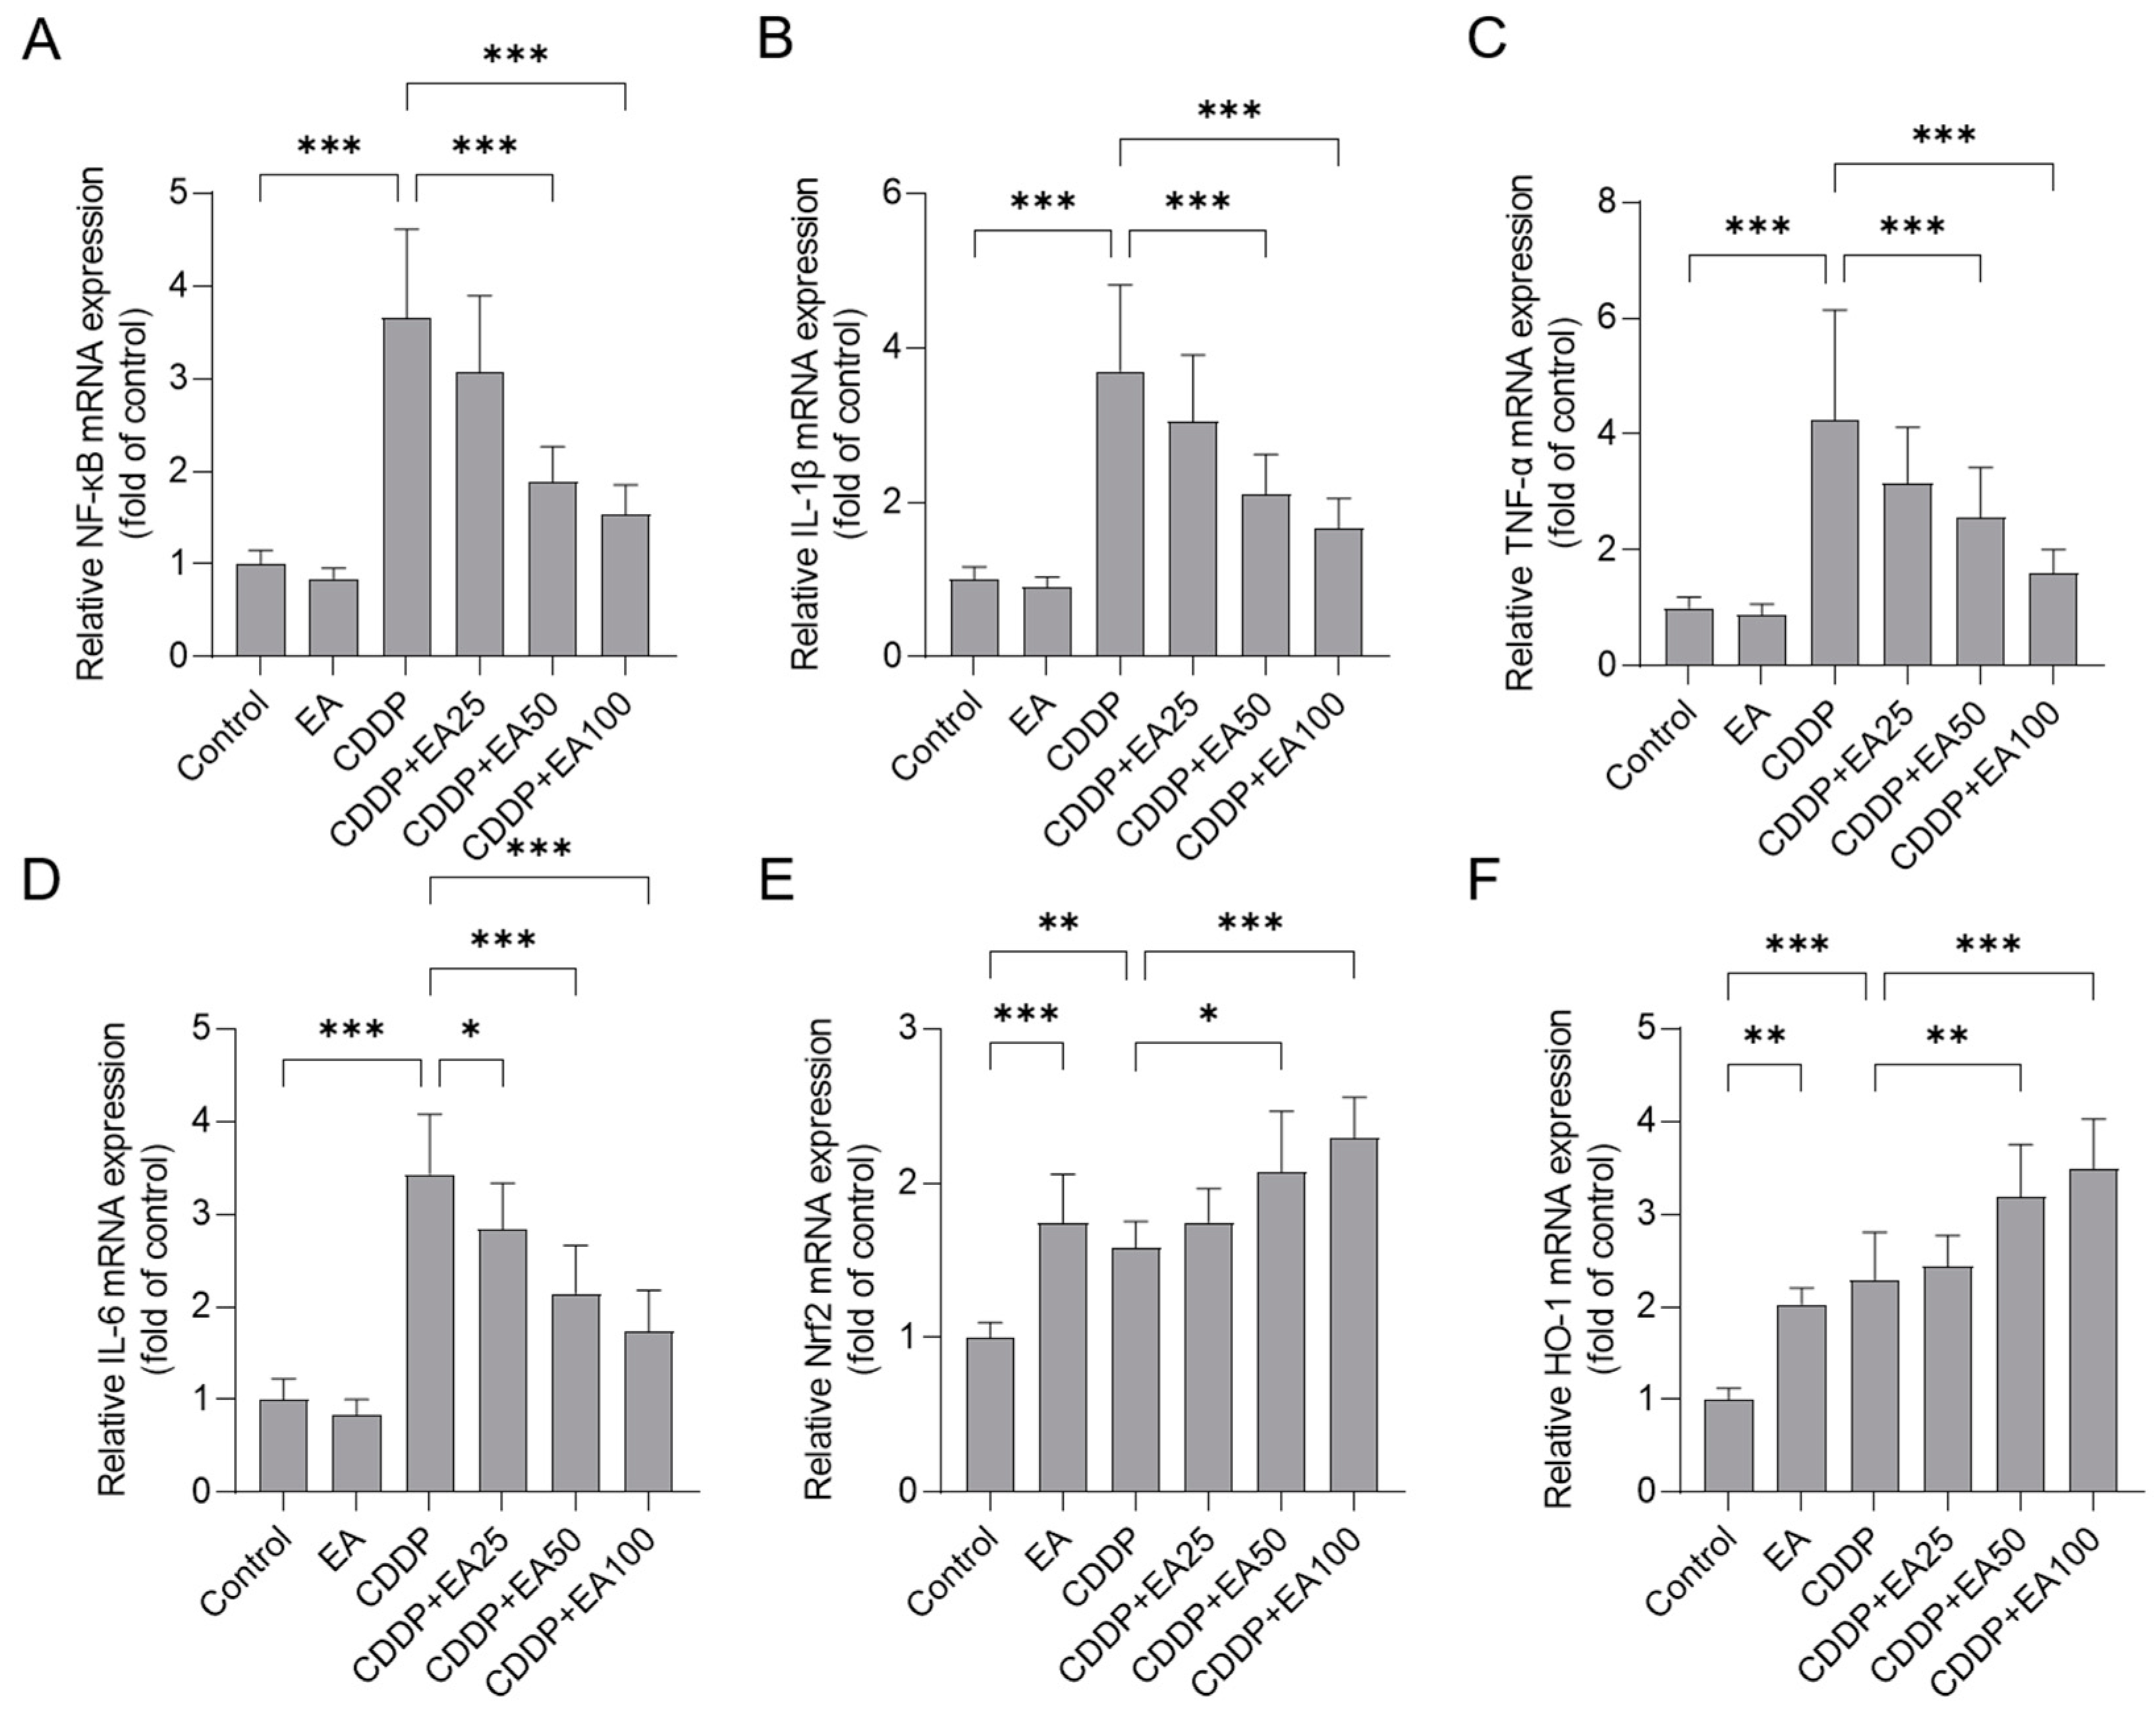
3.6. EA Supplementation Upregulates the mRNA Expressions of Nrf2, and HO-1 Genes and Downregulates the mRNA Expressions of NF-kB, IL-1β, TNF-α, and IL-6 Genes in the Livers of Mice
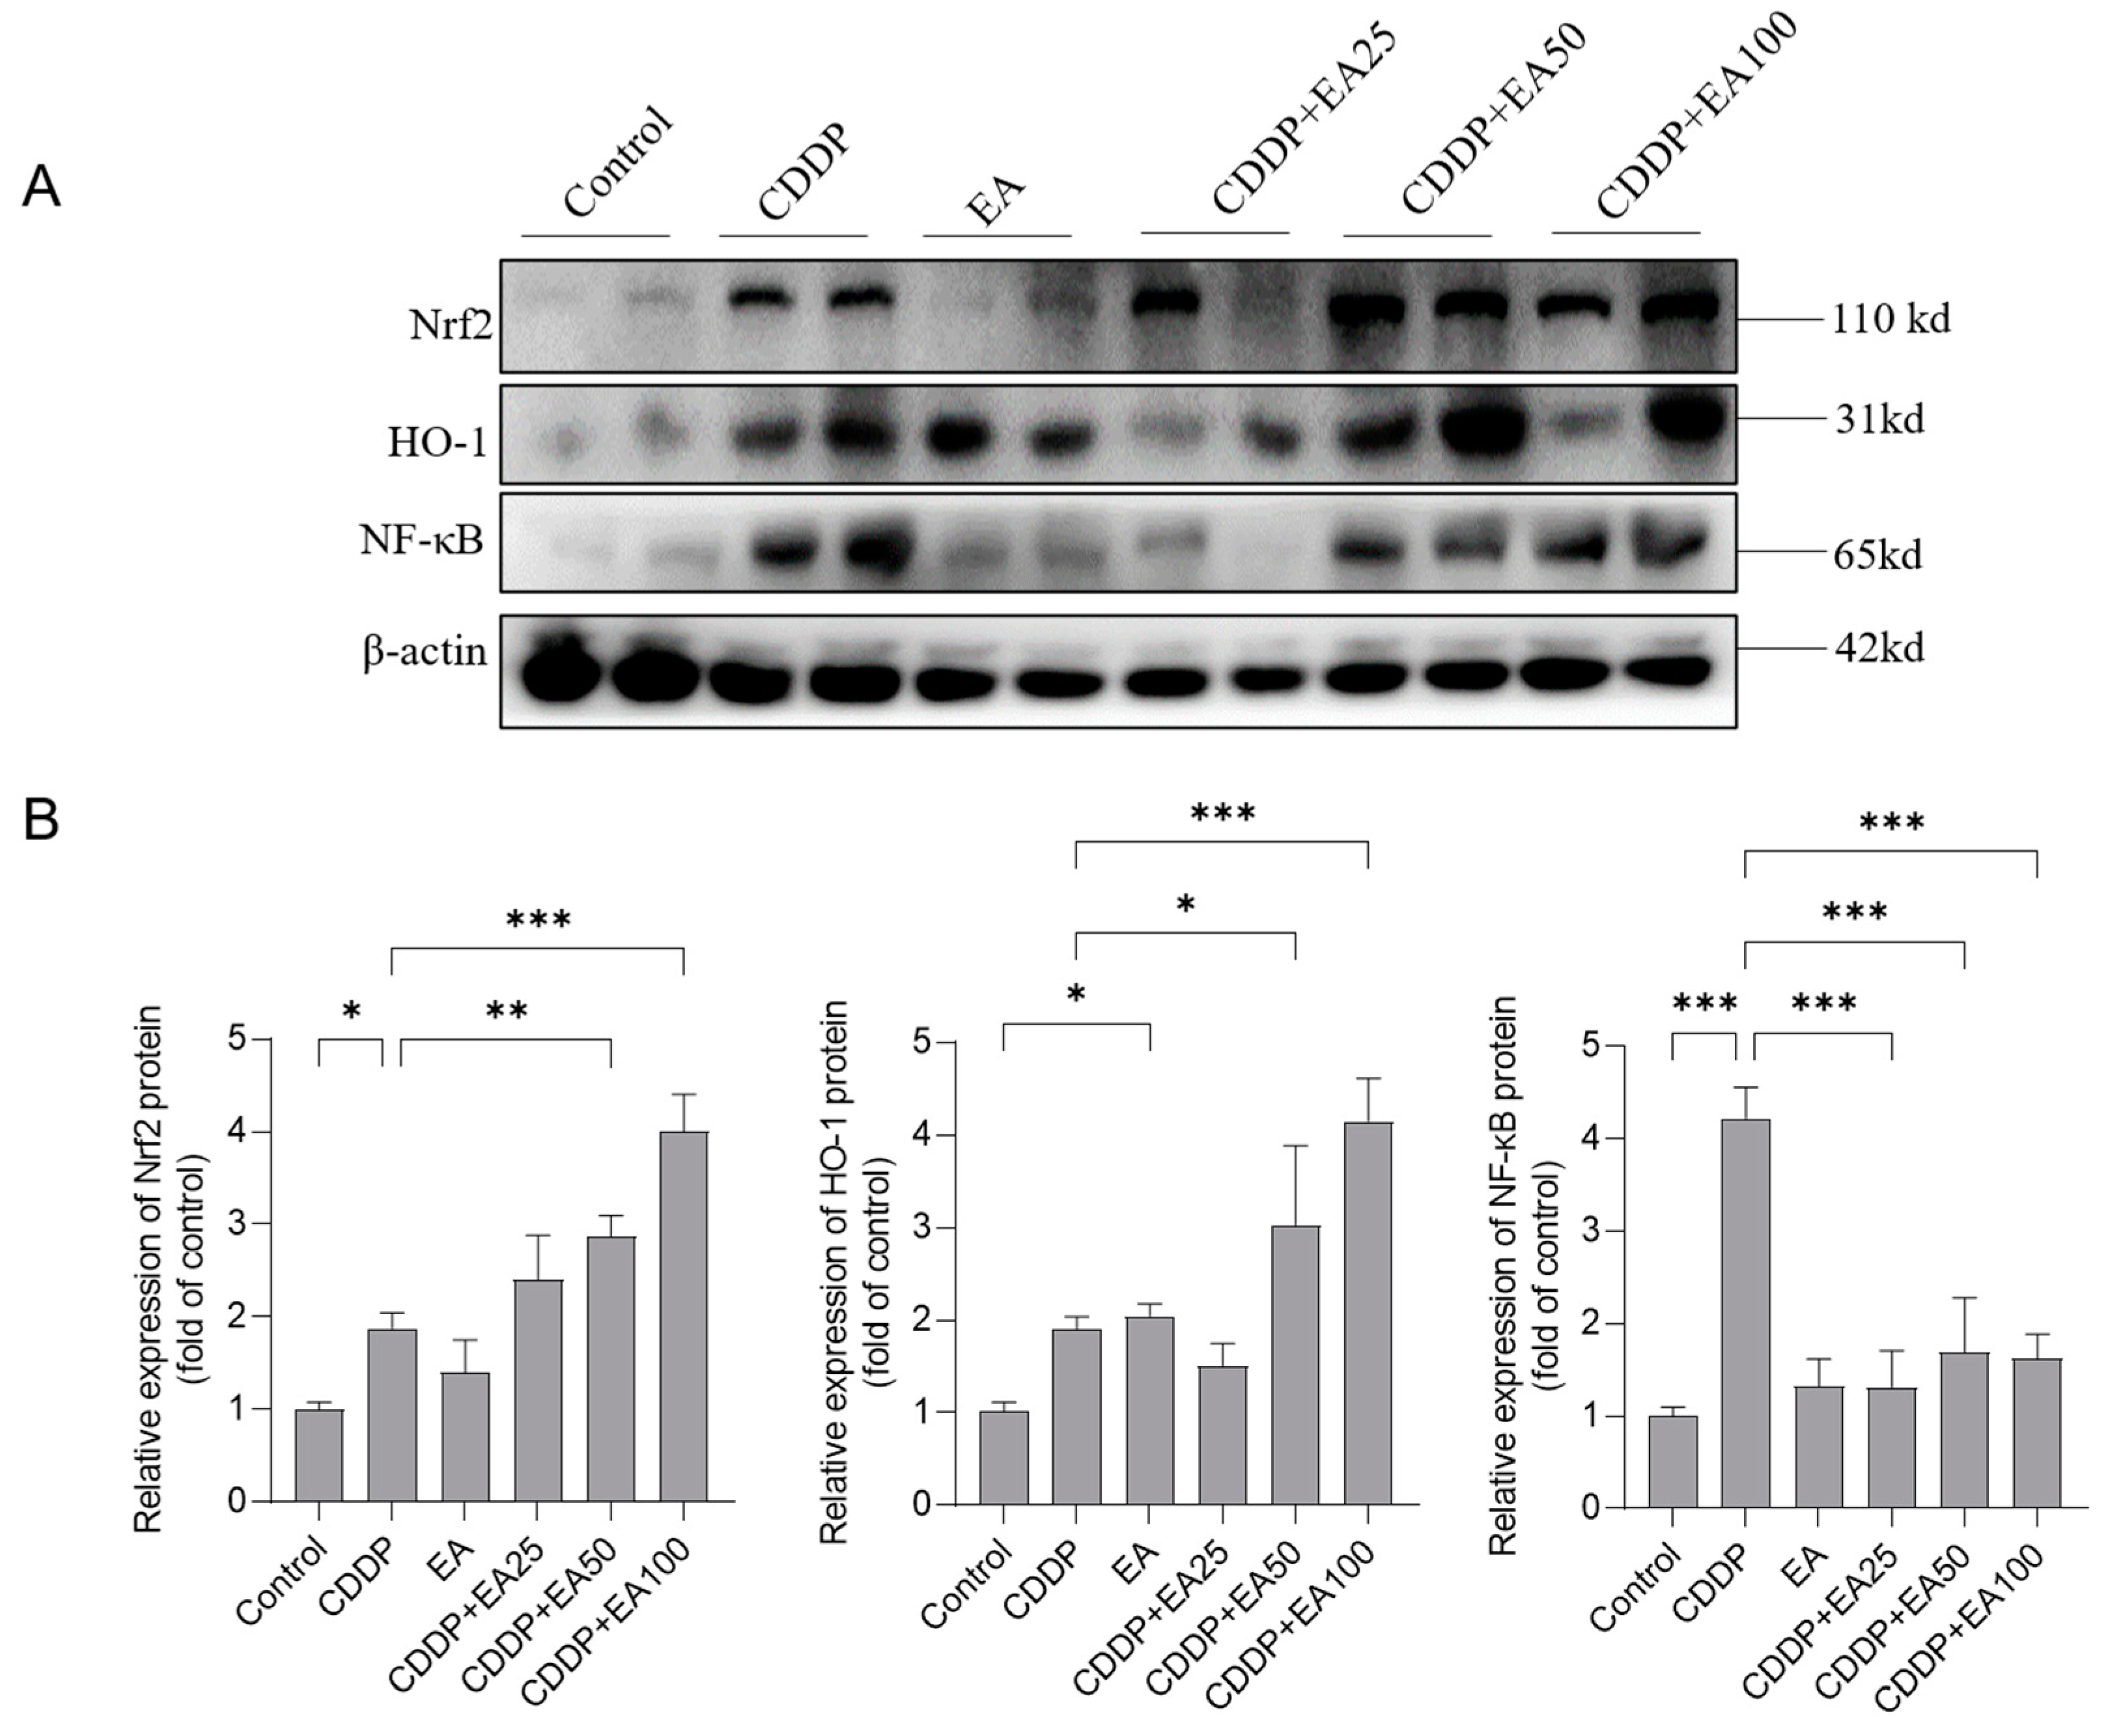
3.7. EA Supplementation Promotes the Expression of Nrf2, HO-1 Proteins and Inhibites the Expression of NF-kB Protein in the Livers of Mice
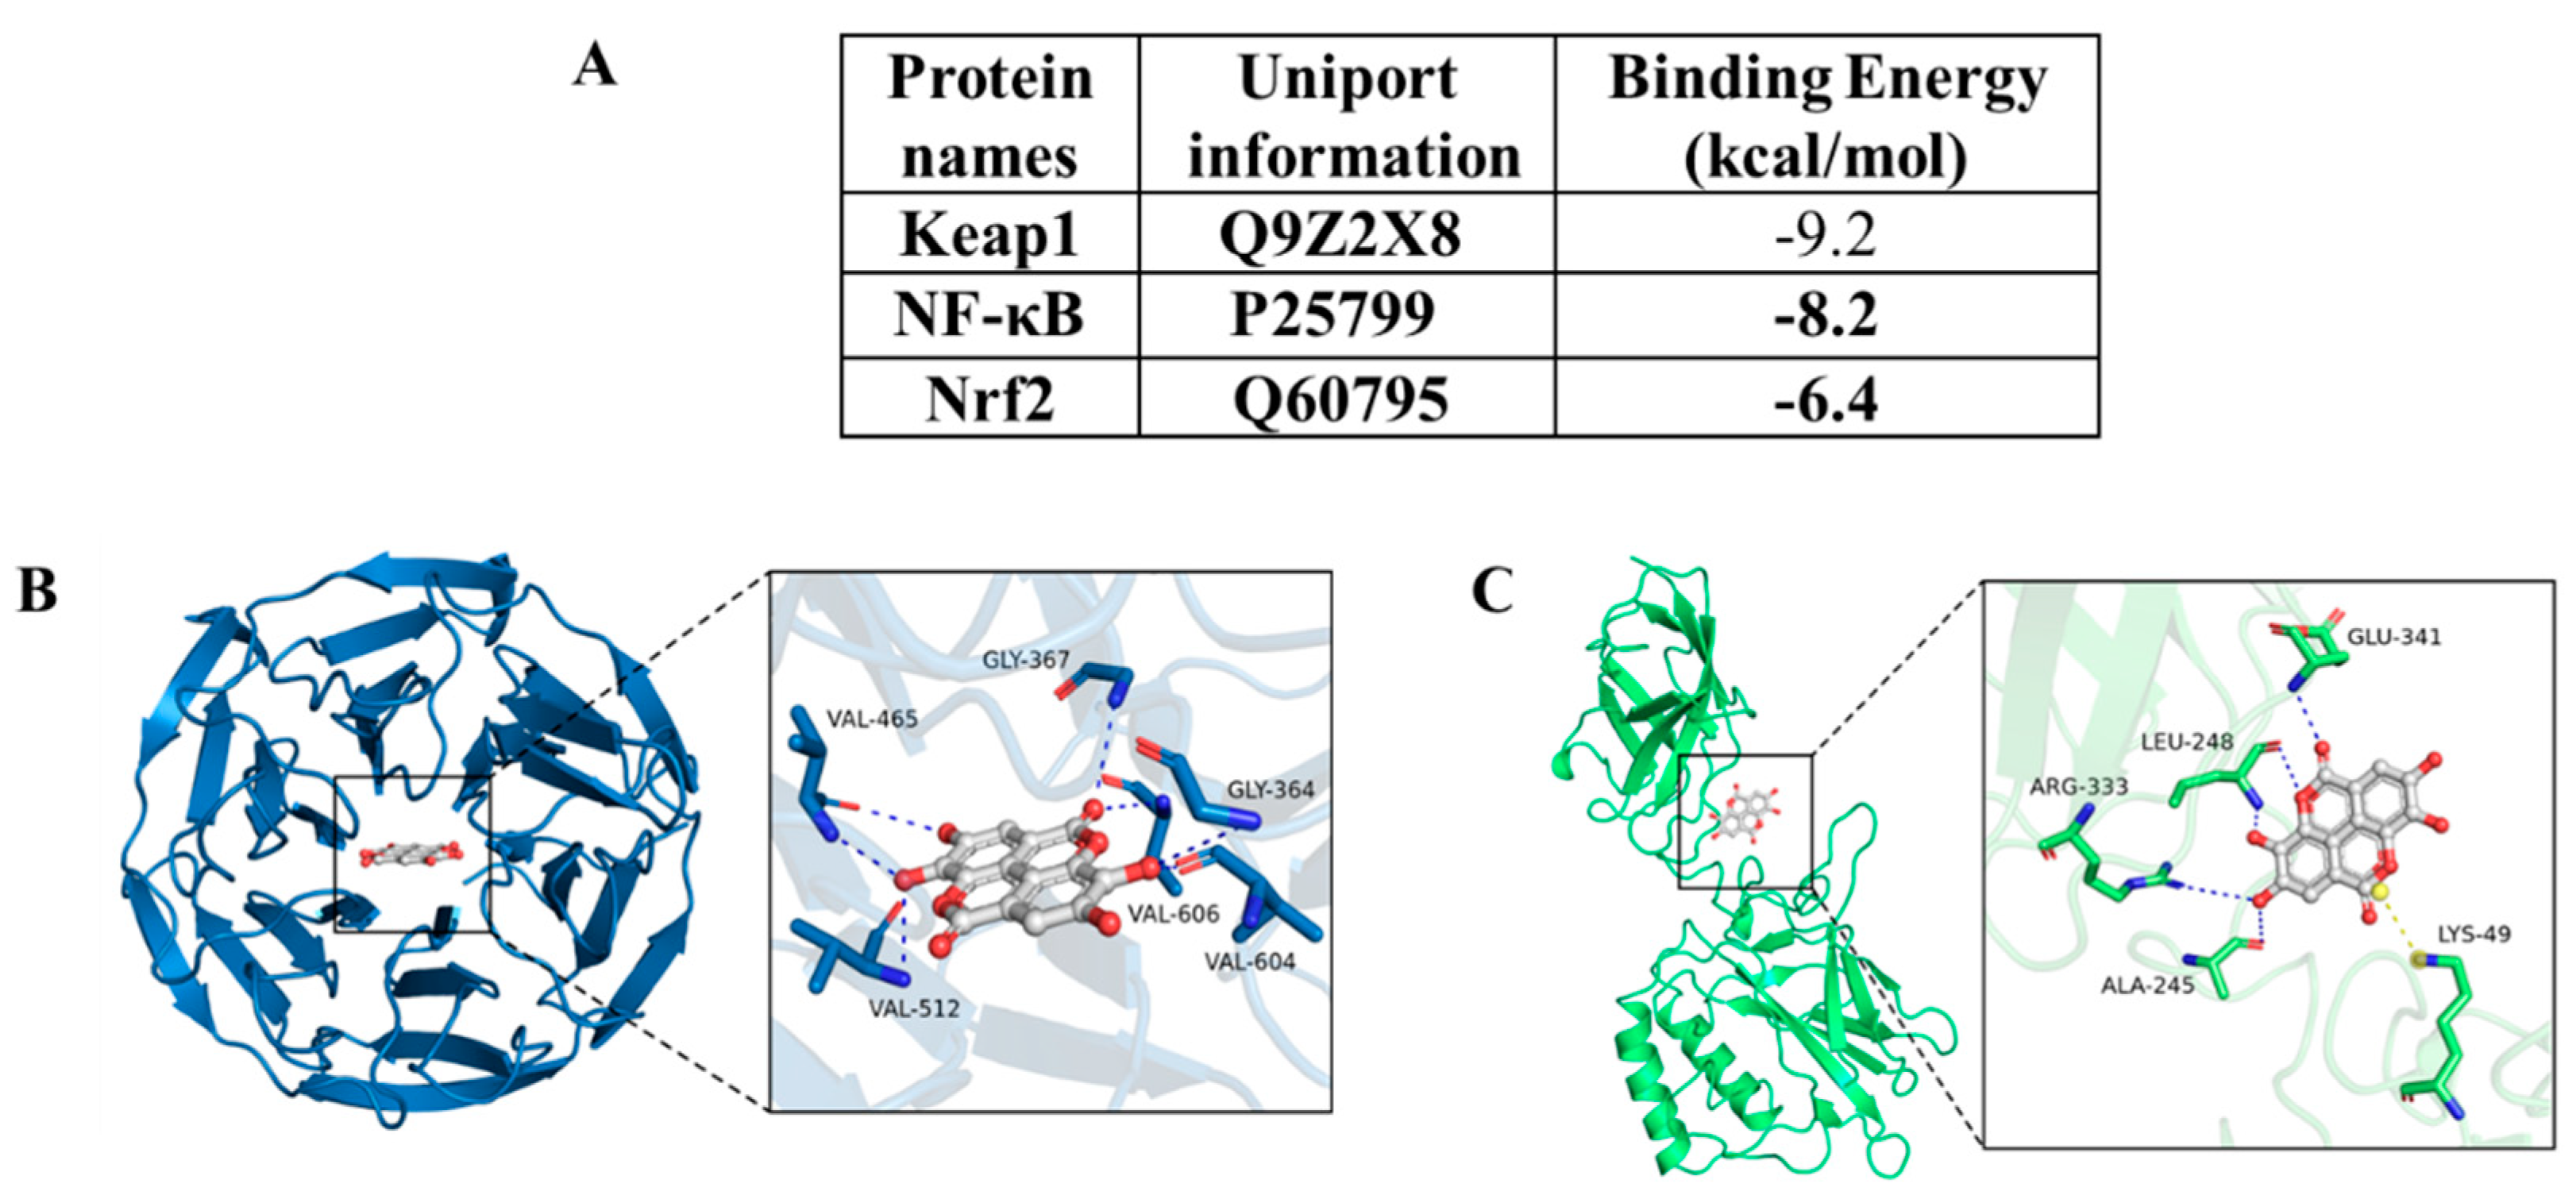
3.8. Molecular docking analysis results of EA with Nrf2, Keap1, and NF-kB proteins
4. Discussion
5. Conclusions
Supplementary Materials
Author Contributions
Funding
Conflicts of Interest
References
- Hill, N.O. Cis-platinum for cancer. The New England journal of medicine 1979, 301, 47. [CrossRef]
- Tang, C.; Livingston, M.J.; Safirstein, R.; Dong, Z. Cisplatin nephrotoxicity: new insights and therapeutic implications. Nature reviews. Nephrology 2023, 19, 53-72. [CrossRef]
- Squillace, S.; Niehoff, M.L.; Doyle, T.M.; Green, M.; Esposito, E.; Cuzzocrea, S.; Arnatt, C.K.; Spiegel, S.; Farr, S.A.; Salvemini, D. Sphingosine-1-phosphate receptor 1 activation in the central nervous system drives cisplatin-induced cognitive impairment. J Clin Invest 2022, 132. [CrossRef]
- Nofal, A.E.; Okdah, Y.A.; Rady, M.I.; Hassaan, H.Z. Gum Acacia attenuates cisplatin toxic effect spermatogenesis dysfunction and infertility in rats. International journal of biological macromolecules 2023, 240, 124292. [CrossRef]
- Rottenberg, S.; Disler, C.; Perego, P. The rediscovery of platinum-based cancer therapy. Nat Rev Cancer 2021, 21, 37-50. [CrossRef]
- Gong, C.; Qian, L.; Yang, H.; Ji, L.L.; Wei, H.; Zhou, W.B.; Qi, C.; Wang, C.H. Hepatotoxicity and pharmacokinetics of cisplatin in combination therapy with a traditional Chinese medicine compound of Zengmian Yiliu granules in ICR mice and SKOV-3-bearing nude mice. BMC complementary and alternative medicine 2015, 15, 283. [CrossRef]
- Al-Malki, A.L.; Sayed, A.A. Thymoquinone attenuates cisplatin-induced hepatotoxicity via nuclear factor kappa-β. BMC complementary and alternative medicine 2014, 14, 282. [CrossRef]
- Lu, Y.; Cederbaum, A.I. Cisplatin-induced hepatotoxicity is enhanced by elevated expression of cytochrome P450 2E1. Toxicological sciences : an official journal of the Society of Toxicology 2006, 89, 515-523. [CrossRef]
- Elhady, S.S.; Abdelhameed, R.F.A.; Mehanna, E.T.; Wahba, A.S.; Elfaky, M.A.; Koshak, A.E.; Noor, A.O.; Bogari, H.A.; Malatani, R.T.; Goda, M.S. Metabolic Profiling, Chemical Composition, Antioxidant Capacity, and In Vivo Hepato- and Nephroprotective Effects of Sonchus cornutus in Mice Exposed to Cisplatin. Antioxidants (Basel) 2022, 11. [CrossRef]
- Habib, S.A.; Suddek, G.M.; Abdel Rahim, M.; Abdelrahman, R.S. The protective effect of protocatechuic acid on hepatotoxicity induced by cisplatin in mice. Life sciences 2021, 277, 119485. [CrossRef]
- Hong, K.O.; Hwang, J.K.; Park, K.K.; Kim, S.H. Phosphorylation of c-Jun N-terminal Kinases (JNKs) is involved in the preventive effect of xanthorrhizol on cisplatin-induced hepatotoxicity. Arch Toxicol 2005, 79, 231-236. [CrossRef]
- Bhattacharyya, S.; Mehta, P. The hepatoprotective potential of Spirulina and vitamin C supplemention in cisplatin toxicity. Food & function 2012, 3, 164-169. [CrossRef]
- Mohamed, H.E.; Badawy, M.M.M. Modulatory effect of zingerone against cisplatin or γ-irradiation induced hepatotoxicity by molecular targeting regulation. Applied radiation and isotopes : including data, instrumentation and methods for use in agriculture, industry and medicine 2019, 154, 108891. [CrossRef]
- Huang, H.; Shen, Z.; Geng, Q.; Wu, Z.; Shi, P.; Miao, X. Protective effect of Schisandra chinensis bee pollen extract on liver and kidney injury induced by cisplatin in rats. Biomed Pharmacother 2017, 95, 1765-1776. [CrossRef]
- Sami, D.H.; Soliman, A.S.; Khowailed, A.A.; Alruhaimi, R.S.; Hassanein, E.H.M.; Kamel, E.M.; Mahmoud, A.M. The protective effect of 7-hydroxycoumarin against cisplatin-induced liver injury is mediated via attenuation of oxidative stress and inflammation and upregulation of Nrf2/HO-1 pathway. Environ Sci Pollut Res Int 2023, 30, 80181-80191. [CrossRef]
- Kim, D.H.; Sim, Y.; Hwang, J.H.; Kwun, I.S.; Lim, J.H.; Kim, J.; Kim, J.I.; Baek, M.C.; Akbar, M.; Seo, W.; et al. Ellagic Acid Prevents Binge Alcohol-Induced Leaky Gut and Liver Injury through Inhibiting Gut Dysbiosis and Oxidative Stress. Antioxidants (Basel) 2021, 10. [CrossRef]
- Azam, F.; Khan, M.A.; Khan, A.; Ahmad, S.; Zofair, S.F.F.; Younus, H. In silico and in vitro studies on the inhibition of laccase activity by Ellagic acid: Implications in drug designing for the treatment of Cryptococcal infections. International journal of biological macromolecules 2022, 209, 642-654. [CrossRef]
- Yoganathan, S.; Alagaratnam, A.; Acharekar, N.; Kong, J. Ellagic Acid and Schisandrins: Natural Biaryl Polyphenols with Therapeutic Potential to Overcome Multidrug Resistance in Cancer. Cells 2021, 10. [CrossRef]
- Wang, Q.; Botchway, B.O.A.; Zhang, Y.; Liu, X. Ellagic acid activates the Keap1-Nrf2-ARE signaling pathway in improving Parkinson’s disease: A review. Biomed Pharmacother 2022, 156, 113848. [CrossRef]
- Zhu, W.; Tang, H.; Li, J.; Guedes, R.M.; Cao, L.; Guo, C. Ellagic acid attenuates interleukin-1β-induced oxidative stress and exerts protective effects on chondrocytes through the Kelch-like ECH-associated protein 1 (Keap1)/ Nuclear factor erythroid 2-related factor 2 (Nrf2) pathway. Bioengineered 2022, 13, 9233-9247. [CrossRef]
- Zhang, X.; Wang, S.; Wu, Y.; Liu, X.; Wang, J.; Han, D. Ellagic Acid Alleviates Diquat-Induced Jejunum Oxidative Stress in C57BL/6 Mice through Activating Nrf2 Mediated Signaling Pathway. Nutrients 2022, 14. [CrossRef]
- Aishwarya, V.; Solaipriya, S.; Sivaramakrishnan, V. Role of ellagic acid for the prevention and treatment of liver diseases. Phytotherapy research : PTR 2021, 35, 2925-2944. [CrossRef]
- Kang, E.H.; Kown, T.Y.; Oh, G.T.; Park, W.F.; Park, S.I.; Park, S.K.; Lee, Y.I. The flavonoid ellagic acid from a medicinal herb inhibits host immune tolerance induced by the hepatitis B virus-e antigen. Antiviral research 2006, 72, 100-106. [CrossRef]
- Qi, M.; Wang, N.; Xiao, Y.; Deng, Y.; Zha, A.; Tan, B.; Wang, J.; Yin, Y.; Liao, P. Ellagic acid ameliorates paraquat-induced liver injury associated with improved gut microbial profile. Environmental pollution (Barking, Essex : 1987) 2022, 293, 118572. [CrossRef]
- Aslan, A.; Gok, O.; Erman, O.; Kuloglu, T. Ellagic acid impedes carbontetrachloride-induced liver damage in rats through suppression of NF-kB, Bcl-2 and regulating Nrf-2 and caspase pathway. Biomed Pharmacother 2018, 105, 662-669. [CrossRef]
- Aslan, A.; Gok, O.; Beyaz, S.; Ağca, C.A.; Erman, O.; Zerek, A. Ellagic acid prevents kidney injury and oxidative damage via regulation of Nrf-2/NF-κB signaling in carbon tetrachloride induced rats. Mol Biol Rep 2020, 47, 7959-7970. [CrossRef]
- Dai, C.; Liu, M.; Zhang, Q.; Das Gupta, S.; Tang, S.; Shen, J. Nootkatone Supplementation Attenuates Carbon Tetrachloride Exposure-Induced Nephrotoxicity in Mice. Antioxidants (Basel) 2023, 12. [CrossRef]
- Dai, C.; Zhang, X.; Lin, J.; Shen, J. Nootkatone Supplementation Ameliorates Carbon Tetrachloride-Induced Acute Liver Injury via the Inhibition of Oxidative Stress, NF-κB Pathways, and the Activation of Nrf2/HO-1 Pathway. Antioxidants (Basel) 2023, 12. [CrossRef]
- Taghizadeh, F.; Hosseinimehr, S.J.; Zargari, M.; Karimpour Malekshah, A.; Mirzaei, M.; Talebpour Amiri, F. Alleviation of cisplatin-induced hepatotoxicity by gliclazide: Involvement of oxidative stress and caspase-3 activity. Pharmacology research & perspectives 2021, 9, e00788. [CrossRef]
- Dai, C.; Zhang, Q.; Shen, L.; Sharma, G.; Jiang, H.; Wang, Z.; Shen, J. Quercetin Attenuates Quinocetone-Induced Cell Apoptosis In Vitro by Activating the P38/Nrf2/HO-1 Pathway and Inhibiting the ROS/Mitochondrial Apoptotic Pathway. Antioxidants (Basel) 2022, 11. [CrossRef]
- Gong, S.; Feng, Y.; Zeng, Y.; Zhang, H.; Pan, M.; He, F.; Wu, R.; Chen, J.; Lu, J.; Zhang, S.; et al. Gut microbiota accelerates cisplatin-induced acute liver injury associated with robust inflammation and oxidative stress in mice. J Transl Med 2021, 19, 147. [CrossRef]
- Devipriya, N.; Sudheer, A.R.; Srinivasan, M.; Menon, V.P. Effect of Ellagic Acid, a Plant Polyphenol, on Fibrotic Markers (MMPs and TIMPs) during Alcohol-Induced Hepatotoxicity. Toxicol Mech Methods 2007, 17, 349-356. [CrossRef]
- Gu, L.; Deng, W.S.; Liu, Y.; Jiang, C.H.; Sun, L.C.; Sun, X.F.; Xu, Q.; Zhou, H. Ellagic acid protects Lipopolysaccharide/D-galactosamine-induced acute hepatic injury in mice. Int Immunopharmacol 2014, 22, 341-345. [CrossRef]
- Beigi, T.; Safi, A.; Satvati, M.; Kalantari-Hesari, A.; Ahmadi, R.; Meshkibaf, M.H. Protective role of ellagic acid and taurine against fluoxetine induced hepatotoxic effects on biochemical and oxidative stress parameters, histopathological changes, and gene expressions of IL-1β, NF-κB, and TNF-α in male Wistar rats. Life sciences 2022, 304, 120679. [CrossRef]
- Cuevas-Magaña, M.Y.; Vega-García, C.C.; León-Contreras, J.C.; Hernández-Pando, R.; Zazueta, C.; García-Niño, W.R. Ellagic acid ameliorates hexavalent chromium-induced renal toxicity by attenuating oxidative stress, suppressing TNF-α and protecting mitochondria. Toxicology and applied pharmacology 2022, 454, 116242. [CrossRef]
- Gentilin, E.; Simoni, E.; Candito, M.; Cazzador, D.; Astolfi, L. Cisplatin-Induced Ototoxicity: Updates on Molecular Targets. Trends in molecular medicine 2019, 25, 1123-1132. [CrossRef]
- Kim, K.H.; Lee, B.; Kim, Y.R.; Kim, M.A.; Ryu, N.; Jung, D.J.; Kim, U.K.; Baek, J.I.; Lee, K.Y. Evaluating protective and therapeutic effects of alpha-lipoic acid on cisplatin-induced ototoxicity. Cell Death Dis 2018, 9, 827. [CrossRef]
- Zhao, L.; Mehmood, A.; Soliman, M.M.; Iftikhar, A.; Iftikhar, M.; Aboelenin, S.M.; Wang, C. Protective Effects of Ellagic Acid Against Alcoholic Liver Disease in Mice. Front Nutr 2021, 8, 744520. [CrossRef]
- Green, D.R.; Reed, J.C. Mitochondria and apoptosis. Science (New York, N.Y.) 1998, 281, 1309-1312. [CrossRef]
- Fu, Y.; Xiang, Y.; Wang, Y.; Liu, Z.; Yang, D.; Zha, J.; Tang, C.; Cai, J.; Chen, G.; Dong, Z. The STAT1/HMGB1/NF-κB pathway in chronic inflammation and kidney injury after cisplatin exposure. Theranostics 2023, 13, 2757-2773. [CrossRef]
- Rønning, S.B.; Voldvik, V.; Bergum, S.K.; Aaby, K.; Borge, G.I.A. Ellagic acid and urolithin A modulate the immune response in LPS-stimulated U937 monocytic cells and THP-1 differentiated macrophages. Food & function 2020, 11, 7946-7959. [CrossRef]
- Bello, M.; Morales-González, J.A. Molecular recognition between potential natural inhibitors of the Keap1-Nrf2 complex. International journal of biological macromolecules 2017, 105, 981-992. [CrossRef]
- Tonelli, C.; Chio, I.I.C.; Tuveson, D.A. Transcriptional Regulation by Nrf2. Antioxidants & redox signaling 2018, 29, 1727-1745. [CrossRef]
- Hu, J.; Gu, W.; Ma, N.; Fan, X.; Ci, X. Leonurine alleviates ferroptosis in cisplatin-induced acute kidney injury by activating the Nrf2 signalling pathway. Br J Pharmacol 2022, 179, 3991-4009. [CrossRef]
- Xiao, Y.; Huang, R.; Wang, N.; Deng, Y.; Tan, B.; Yin, Y.; Qi, M.; Wang, J. Ellagic Acid Alleviates Oxidative Stress by Mediating Nrf2 Signaling Pathways and Protects against Paraquat-Induced Intestinal Injury in Piglets. Antioxidants (Basel) 2022, 11. [CrossRef]
- Ding, X.; Jian, T.; Wu, Y.; Zuo, Y.; Li, J.; Lv, H.; Ma, L.; Ren, B.; Zhao, L.; Li, W.; et al. Ellagic acid ameliorates oxidative stress and insulin resistance in high glucose-treated HepG2 cells via miR-223/keap1-Nrf2 pathway. Biomed Pharmacother 2019, 110, 85-94. [CrossRef]
- Gao, W.; Guo, L.; Yang, Y.; Wang, Y.; Xia, S.; Gong, H.; Zhang, B.K.; Yan, M. Dissecting the Crosstalk Between Nrf2 and NF-κB Response Pathways in Drug-Induced Toxicity. Frontiers in cell and developmental biology 2021, 9, 809952. [CrossRef]
- Tasaki, M.; Umemura, T.; Maeda, M.; Ishii, Y.; Okamura, T.; Inoue, T.; Kuroiwa, Y.; Hirose, M.; Nishikawa, A. Safety assessment of ellagic acid, a food additive, in a subchronic toxicity study using F344 rats. Food Chem Toxicol 2008, 46, 1119-1124. [CrossRef]
- Heilman, J.; Andreux, P.; Tran, N.; Rinsch, C.; Blanco-Bose, W. Safety assessment of Urolithin A, a metabolite produced by the human gut microbiota upon dietary intake of plant derived ellagitannins and ellagic acid. Food Chem Toxicol 2017, 108, 289-297. [CrossRef]

Disclaimer/Publisher’s Note: The statements, opinions and data contained in all publications are solely those of the individual author(s) and contributor(s) and not of MDPI and/or the editor(s). MDPI and/or the editor(s) disclaim responsibility for any injury to people or property resulting from any ideas, methods, instructions or products referred to in the content. |
© 2023 by the authors. Licensee MDPI, Basel, Switzerland. This article is an open access article distributed under the terms and conditions of the Creative Commons Attribution (CC BY) license (http://creativecommons.org/licenses/by/4.0/).


