1. Introduction
Acute pancreatitis (AP) is a common disease in gastroenterology with an increasing global incidence, accounting for about 3% of all hospitalized patients [
1]. AP is a complex inflammatory syndrome that results from many etiologies of which gallstones, alcohol and ERCP are the leading causes [
2]. About 20% of patients who experienced their first AP attack will develop recurrent attacks and approximately one-third of the latter continue to end-stage chronic pancreatitis [
3,
4,
5]. Despite the advances in medicine, the worldwide mortality rate among AP patients remained high, imposing an important burden on the healthcare system [
1,
2]. The relatively high morbidity and mortality characterizing AP could be attributed to the poor understanding of the pathogenesis of this common clinical setting. It is widely accepted that excessive stimulation of the pancreas or direct destructive insults obstruct the outflow of zymogen granules, where they are proteolytically activated in the acinar cells by lysosomal enzymes mainly cathepsin B and eventually causing acute cell injury [
6]. This adverse reaction is further exacerbated by neutrophilic enzymes and transcription factors, which lead to the production of various pro-inflammatory cytokines, including tumor necrosis factor (TNF)-α, interleukin (IL)-1, IL-6, and IL-8, along with conversion of trypsinogen into trypsin - a phenomenon also referred to as auto-digestion [
7,
8]. Moreover, the pro-inflammatory stimuli upregulate cyclooxygenase (COX)-2, a key enzyme responsible for the generation of prostaglandins, leukotrienes, and thromboxane from arachidonic acid [
9].
In light of the unclear characterization of the mechanistic pathways responsible for AP, treatment options targeting a specific underlying cause remain elusive and the current therapy relies mainly on painkillers and hydration, opioids being the most frequently prescribed analgesics for pain relief of patients with AP [
10,
11]. As AP is secondary to pancreatic parenchymal inflammation, non-steroidal anti-inflammatory drugs (NSAIDs) are also often used [
10,
11]. Previous studies have highlighted the keen involvement of heparanase (Hpa), an endoglycosidase that degrades heparan sulfate (HS) [
12], in the pathogenesis of inflammatory diseases including AP [
12,
13,
14,
15]. Specifically, we provided evidence that pancreatic Hpa expression and activity are significantly increased following cerulein-induced AP [
12]. Moreover, pancreas edema and inflammation, as well as the induction of cytokines and signaling molecules in response to cerulein were attenuated markedly by PG545 and SST0001, heparin/HS-like Hpa inhibitors [
12], implying that the enzyme plays a significant role in AP. Notably, the above features appear even more pronounced in transgenic mice overexpressing Hpa, suggesting that these mice can be utilized as a highly appropriate model system to reveal the molecular mechanism by which Hpa functions in AP [
12]. Recently, a pioneering study has demonstrated that Aspirin has an inhibitory effect on Hpa [
16], a feature that may be held responsible, in part, for the anti-inflammatory effects of NSAIDs, including in AP [
17,
18] Another compound that possesses a potential pancreato-protective effect against AP is Trehalose, a naturally occurring non-reducing disaccharide [
19]. The mechanisms underlying the beneficial effect of aspirin and Trehalose are unknown but assumingly involve Hpa inhibition and anti-oxidative effect. The current study addresses the assumption that a combination of established Hpa inhibitors with aspirin or Trehalose will ameliorate AP more efficiently than each drug alone.
4. Discussion
Acute pancreatitis is characterized by significant morbidity and mortality. While mild AP is without serious complications, mortality from pancreatitis is approximately 1% overall [
25,
26] and may reach among hospitalized patients as high as 30%–40% [
27]. Despite intensive investigation, neither the etiology nor the pathophysiology of the pancreatitis process is fully understood and there is no specific or effective pharmacological treatment to prevent clinical progression of the disease or death [
28,
29]. Here, we extend our previous findings that Hpa is engaged in AP [
12], as evident by upregulation of its expression and activity in cerulean-induced AP. Furthermore, treatment with Hpa inhibitors, namely Pixatimod (PG545) or Roneparstat (SST0001), significantly attenuated lipase and amylase elevation, pancreatic edema, recruitment of neutrophils, induction of cytokines (i.e., TNFα, IL-6), and activation of NFκB and STAT3 signaling. The pancreato-protective effects of PG545 and SST0001 strongly implicate Hpa in the pathogenesis of AP. This notion is further supported by our observation that all the above adverse characteristics of AP were even more prominent in Hpa-Tg mice endowed with higher levels of Hpa in their pancreas, suggesting that the severity of AP correlates with Hpa levels. Furthermore, we found that cerulein-induced AP is associated with upregulation of CathL which likely contributes to the disease. This notion is supported by reports demonstrating that the severity of pancreatitis is reduced in CathL -KO mice [
30]. In this context, CathL functions not only to damage the pancreas by its digestive activity but also by its ability to activate latent Hpa [
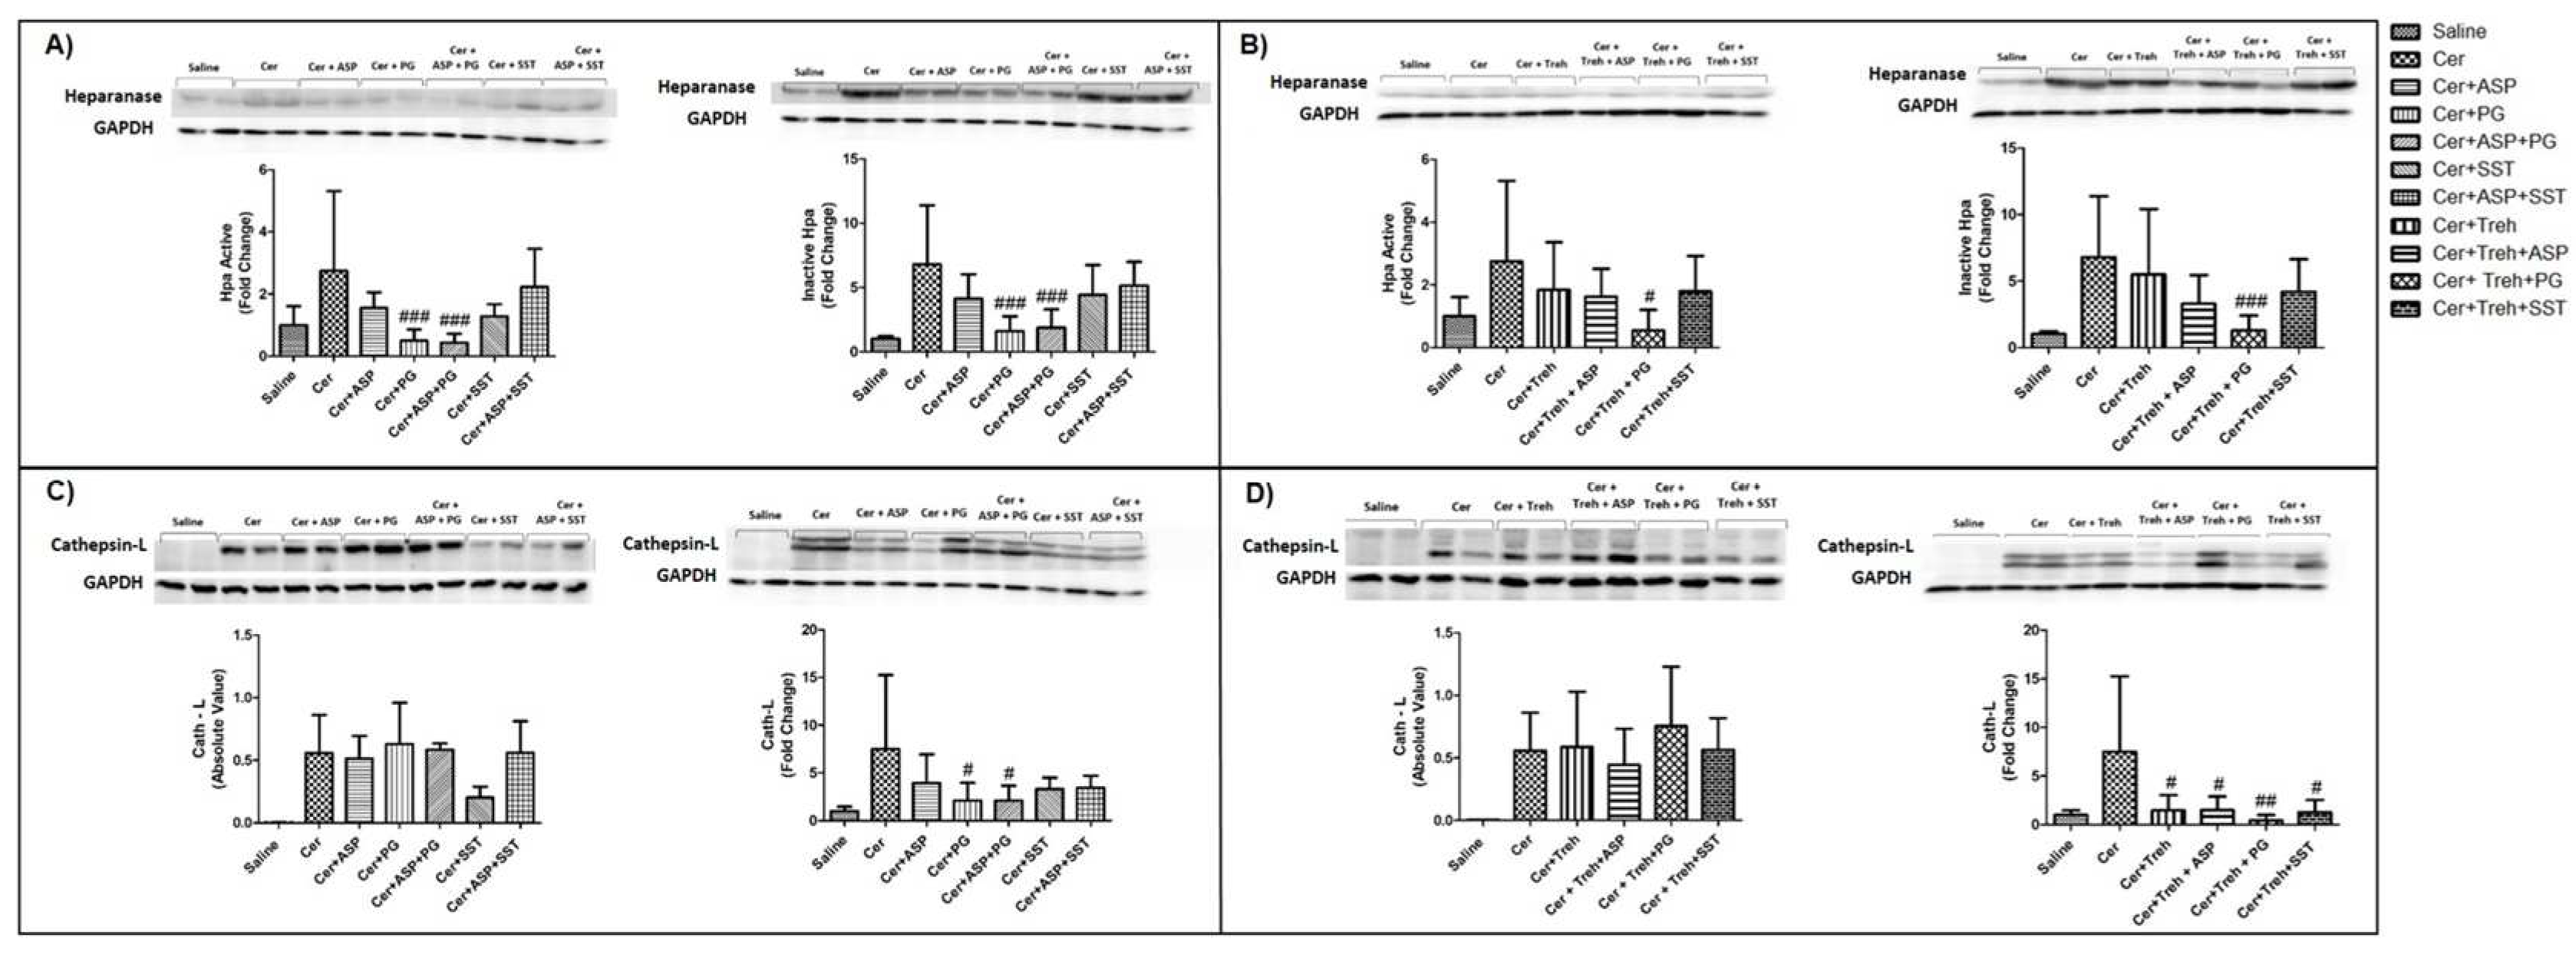
12]. The latter is first synthesized as a readily secreted inactive 65 kDa pro-enzyme that is taken up by the cells and transferred to late endosomes/lysosomes [
31,
32]. In the lysosomes, Hpa is proteolytically processed by CathL into its active form, a heterodimer constituted of 8 kDa and 50 kDa subunits [
33,
34,
35]. In addition, latent Hpa can get activated extracellularly by secreted CathL. Thus, the induction of Hpa expression in the course of AP is accompanied by enhanced expression of CathL which, in turn, activates Hpa in a loop that feeds itself, generating continuous production of active Hpa that functions to support AP. This devastating loop is efficiently blocked, nonetheless, by the Hpa inhibitors Pixatimod and Roneparstat, lending hope that these compounds, now in phase I/II clinical trials in cancer patients [
36,
37] will prove efficacious also in AP.
In the current study, we also demonstrated that both Aspirin and Trehalose alone or in combination with the above Hpa inhibitors dramatically mitigate AP more than each drug alone, thus may constitute a novel therapy for this common orphan disease. The pancreato-protective effect of Aspirin, the most prominent representative of nonsteroidal anti-inflammatory drugs (NSAIDs), is not surprising. Prostaglandin (PG) production is mediated by the activity of COXs, which exist as distinct two isoforms referred to as COX-1 and COX-2 [
9]. While COX-1 is constitutively expressed in most tissues and is the major source of housekeeping PGs, COX-2, key enzyme responsible for the generation of PGs, leukotrienes, and thromboxane, is induced by pro-inflammatory stimuli [
9,
38]. NSAIDs are inhibitors of both COX1 and 2, thus avert PGs production and could reduce the inflammatory response characterizing AP both clinically and experimentally [
39]. In this respect, nonselective NSAIDs are routinely used to prevent post-endoscopic retrograde cholangio-pancreatography (ERCP) pancreatitis, given their efficacy, safety, availability, and affordability [
40,
41], although their efficacy in reducing the incidence and severity of post-ERCP pancreatitis (PEP) was not confirmed when given as a pretreatment [
42]. In humans, the efficacy of nonselective NSAIDs in preventing the clinical progression of AP was not studied thoroughly. Specifically, while clinical studies evaluated the analgesic effect and safety profile of nonselective NSAIDs on subjects with AP [
43,
44], no controlled studies evaluated the efficacy of nonselective NSAIDs in preventing the clinical progression of AP. In this respect, a recent study examined the impact of Indomethacin therapy in subjects with AP who had systemic inflammatory response syndrome (SIRS) at the time of enrollment [
45]. While rectal indomethacin can be safely administered over 48 hours, it is not superior to placebo in reducing the SIRS or clinical progression in a high-risk population with AP [
45]. In contrast to the inconsistent findings of the clinical trials, experimental studies applying animal models showed that the administration of indomethacin or diclofenac after AP induction decreased disease severity and mortality [
46,
47,
48,
49,
50]. Our results clearly show that pretreatment with Aspirin significantly attenuated the severity of AP in both WT and Hpa-Tg mice as was evident by reduction in pancreatic enzymes and edema along histological improvement. It is well known that the onset of AP is followed by an exaggerated immune response that plays a critical role in the pathogenesis of severe AP and may represent a potential therapeutic target for AP. The initial parenchymal injury activates inflammatory cells and transcription factors, which lead to the production of various pro-inflammatory cytokines, such as tumor necrosis factor (TNF)-α, interleukin (IL)-1, IL-6, and IL-8 [
7,
8], as observed in the present study. The pro-inflammatory milieu induces COX-2, a key enzyme in the conversion of arachidonic acid to PGs, leukotrienes, and thromboxanes [
9]. These inflammatory mediators are released into the circulation, where they contribute to the development of SIRS and multi-organ failure, and even death [
51,
52]. The pancreato-protective effects of Aspirin could be attributed to its anti-inflammatory properties as was evident by reducing macrophage infiltration into the pancreatic tissue, and the downregulation of cytokines along with Hpa. However, the finding that Aspirin possesses a partial inhibitory effect against Hpa [
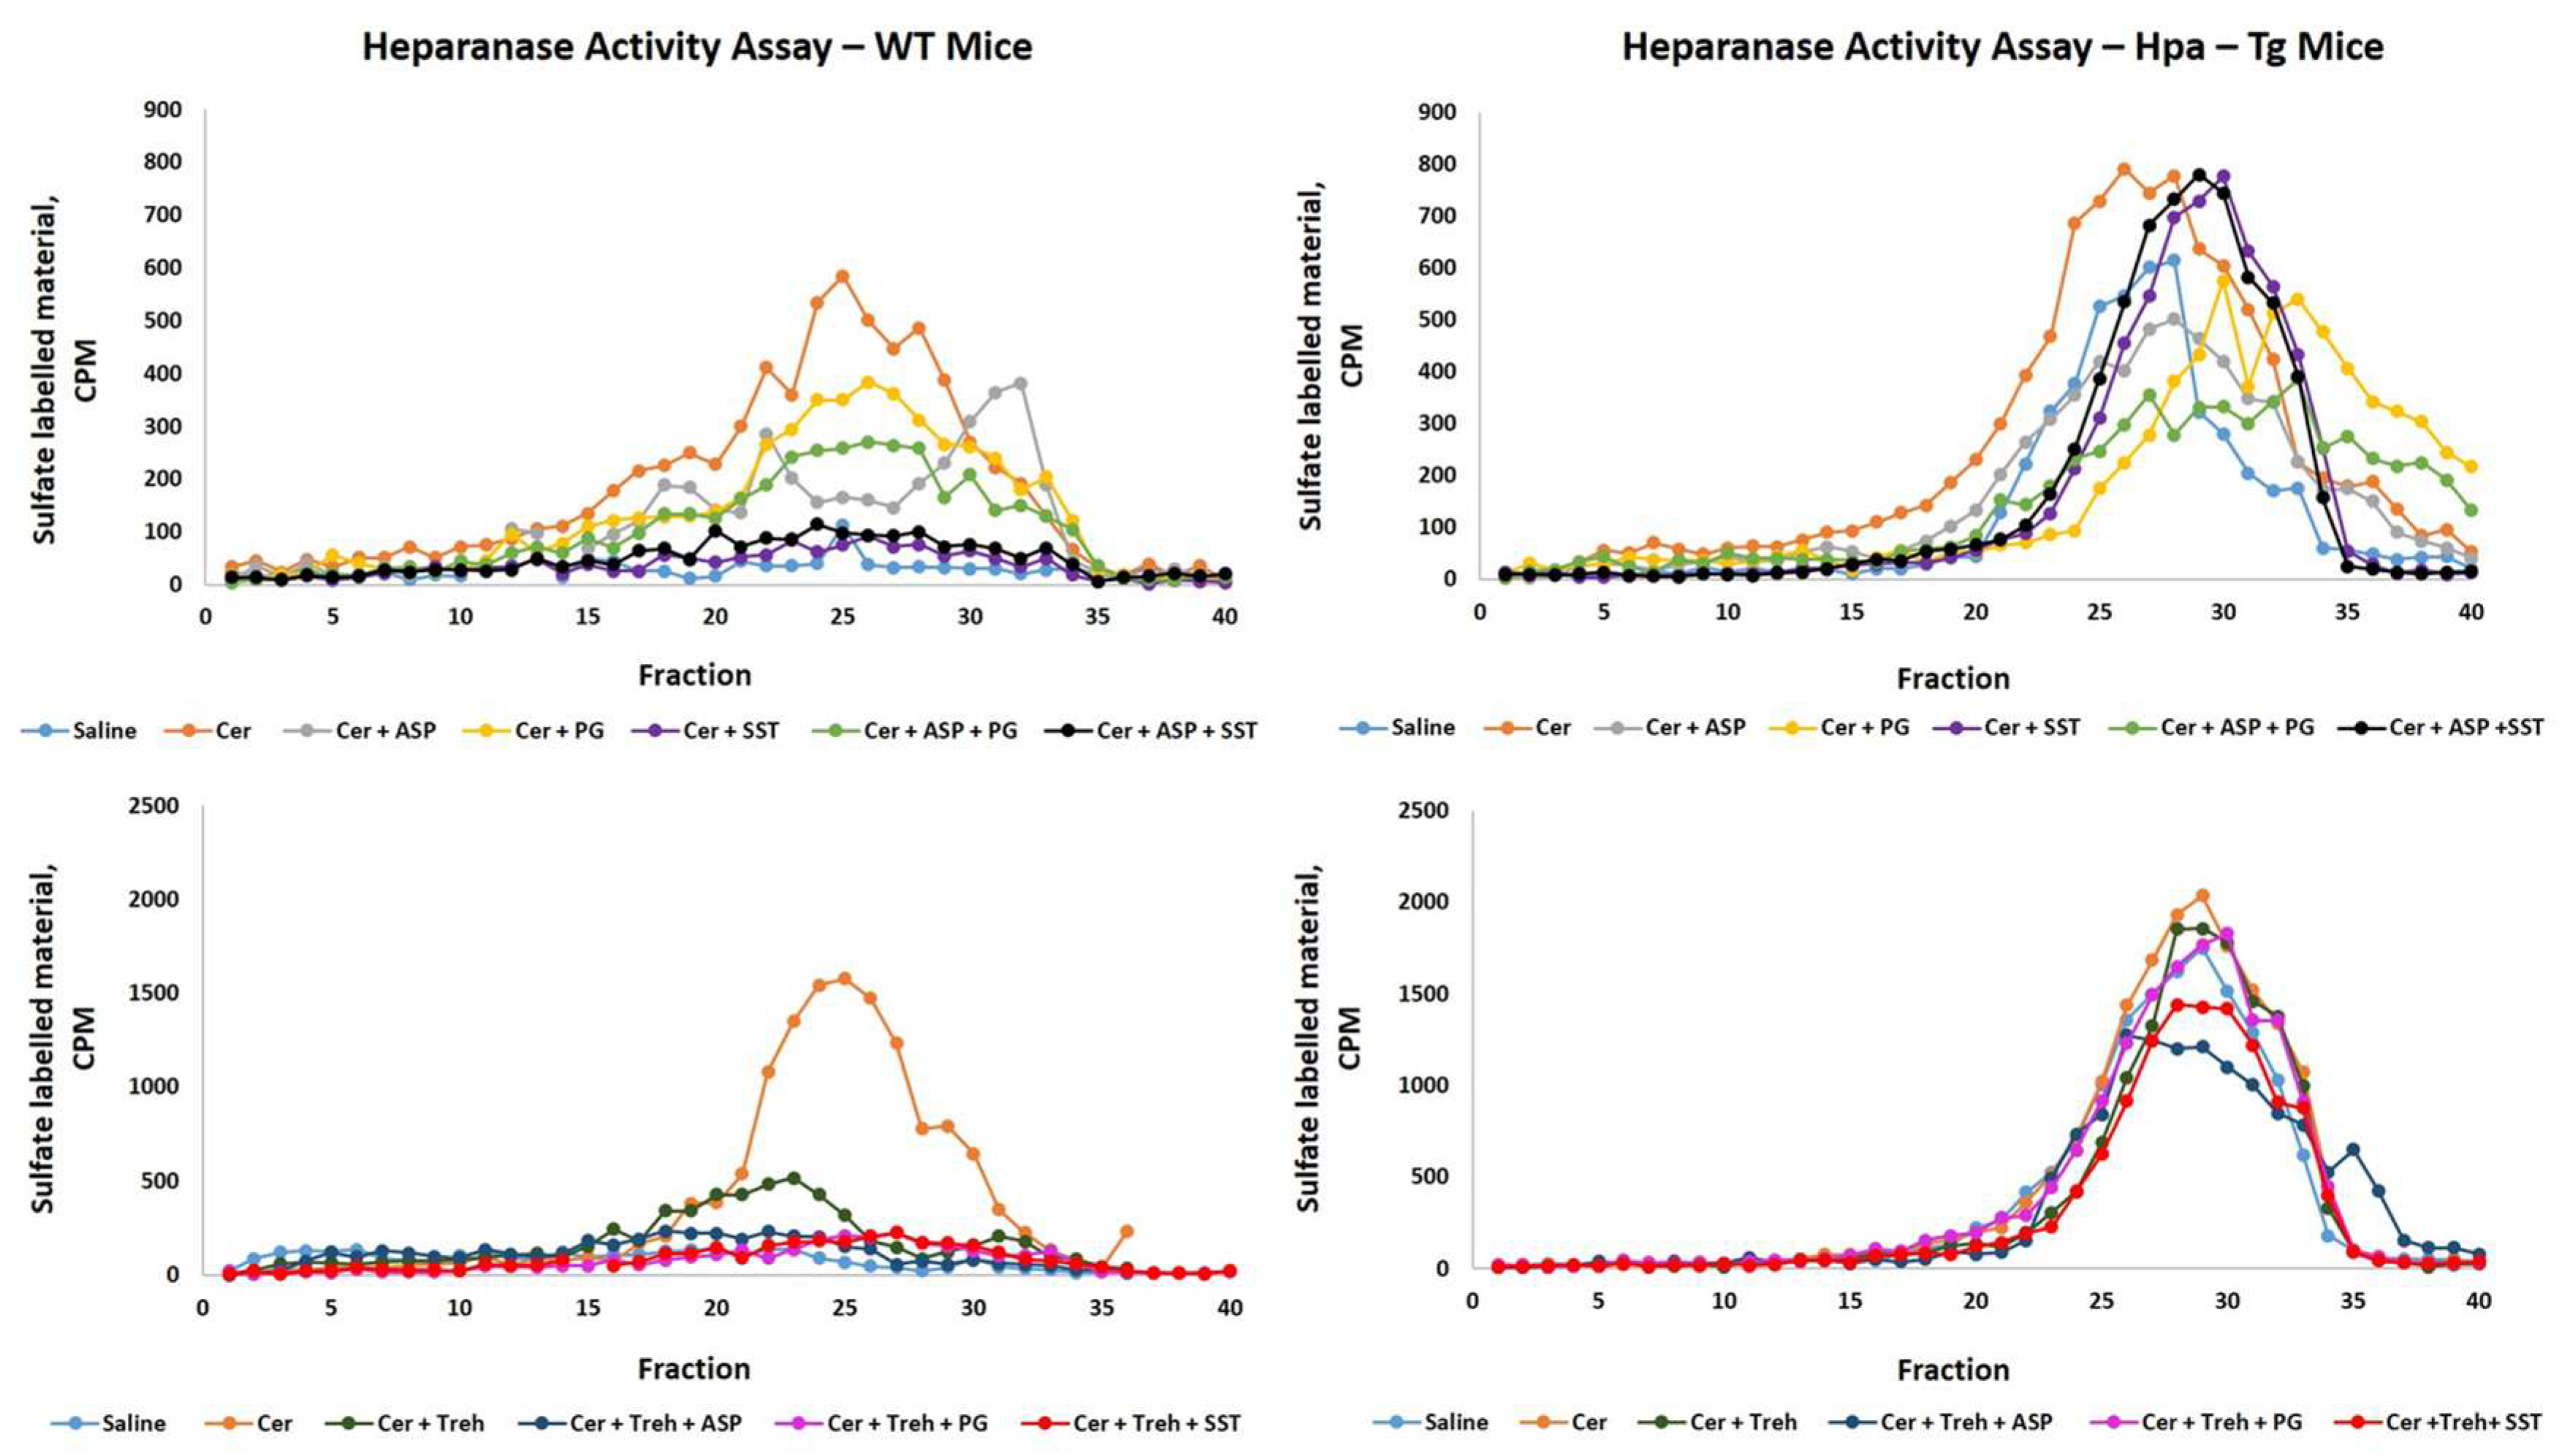
16], suggests that this new mode of action may contribute to the protective effects of Aspirin against AP. However, our findings that Aspirin, even when administered at high doses, did not affect Hpa activity in both WT and Hpa-Tg mice, argue against this possibility.
The current study shows that pretreatment with Trehalose alone or in combination with Aspirin, PG545, or SST0001 dramatically ameliorate AP in both WT and Hpa-Tg mice. These results are in agreement with a previous report by Biczo et al [
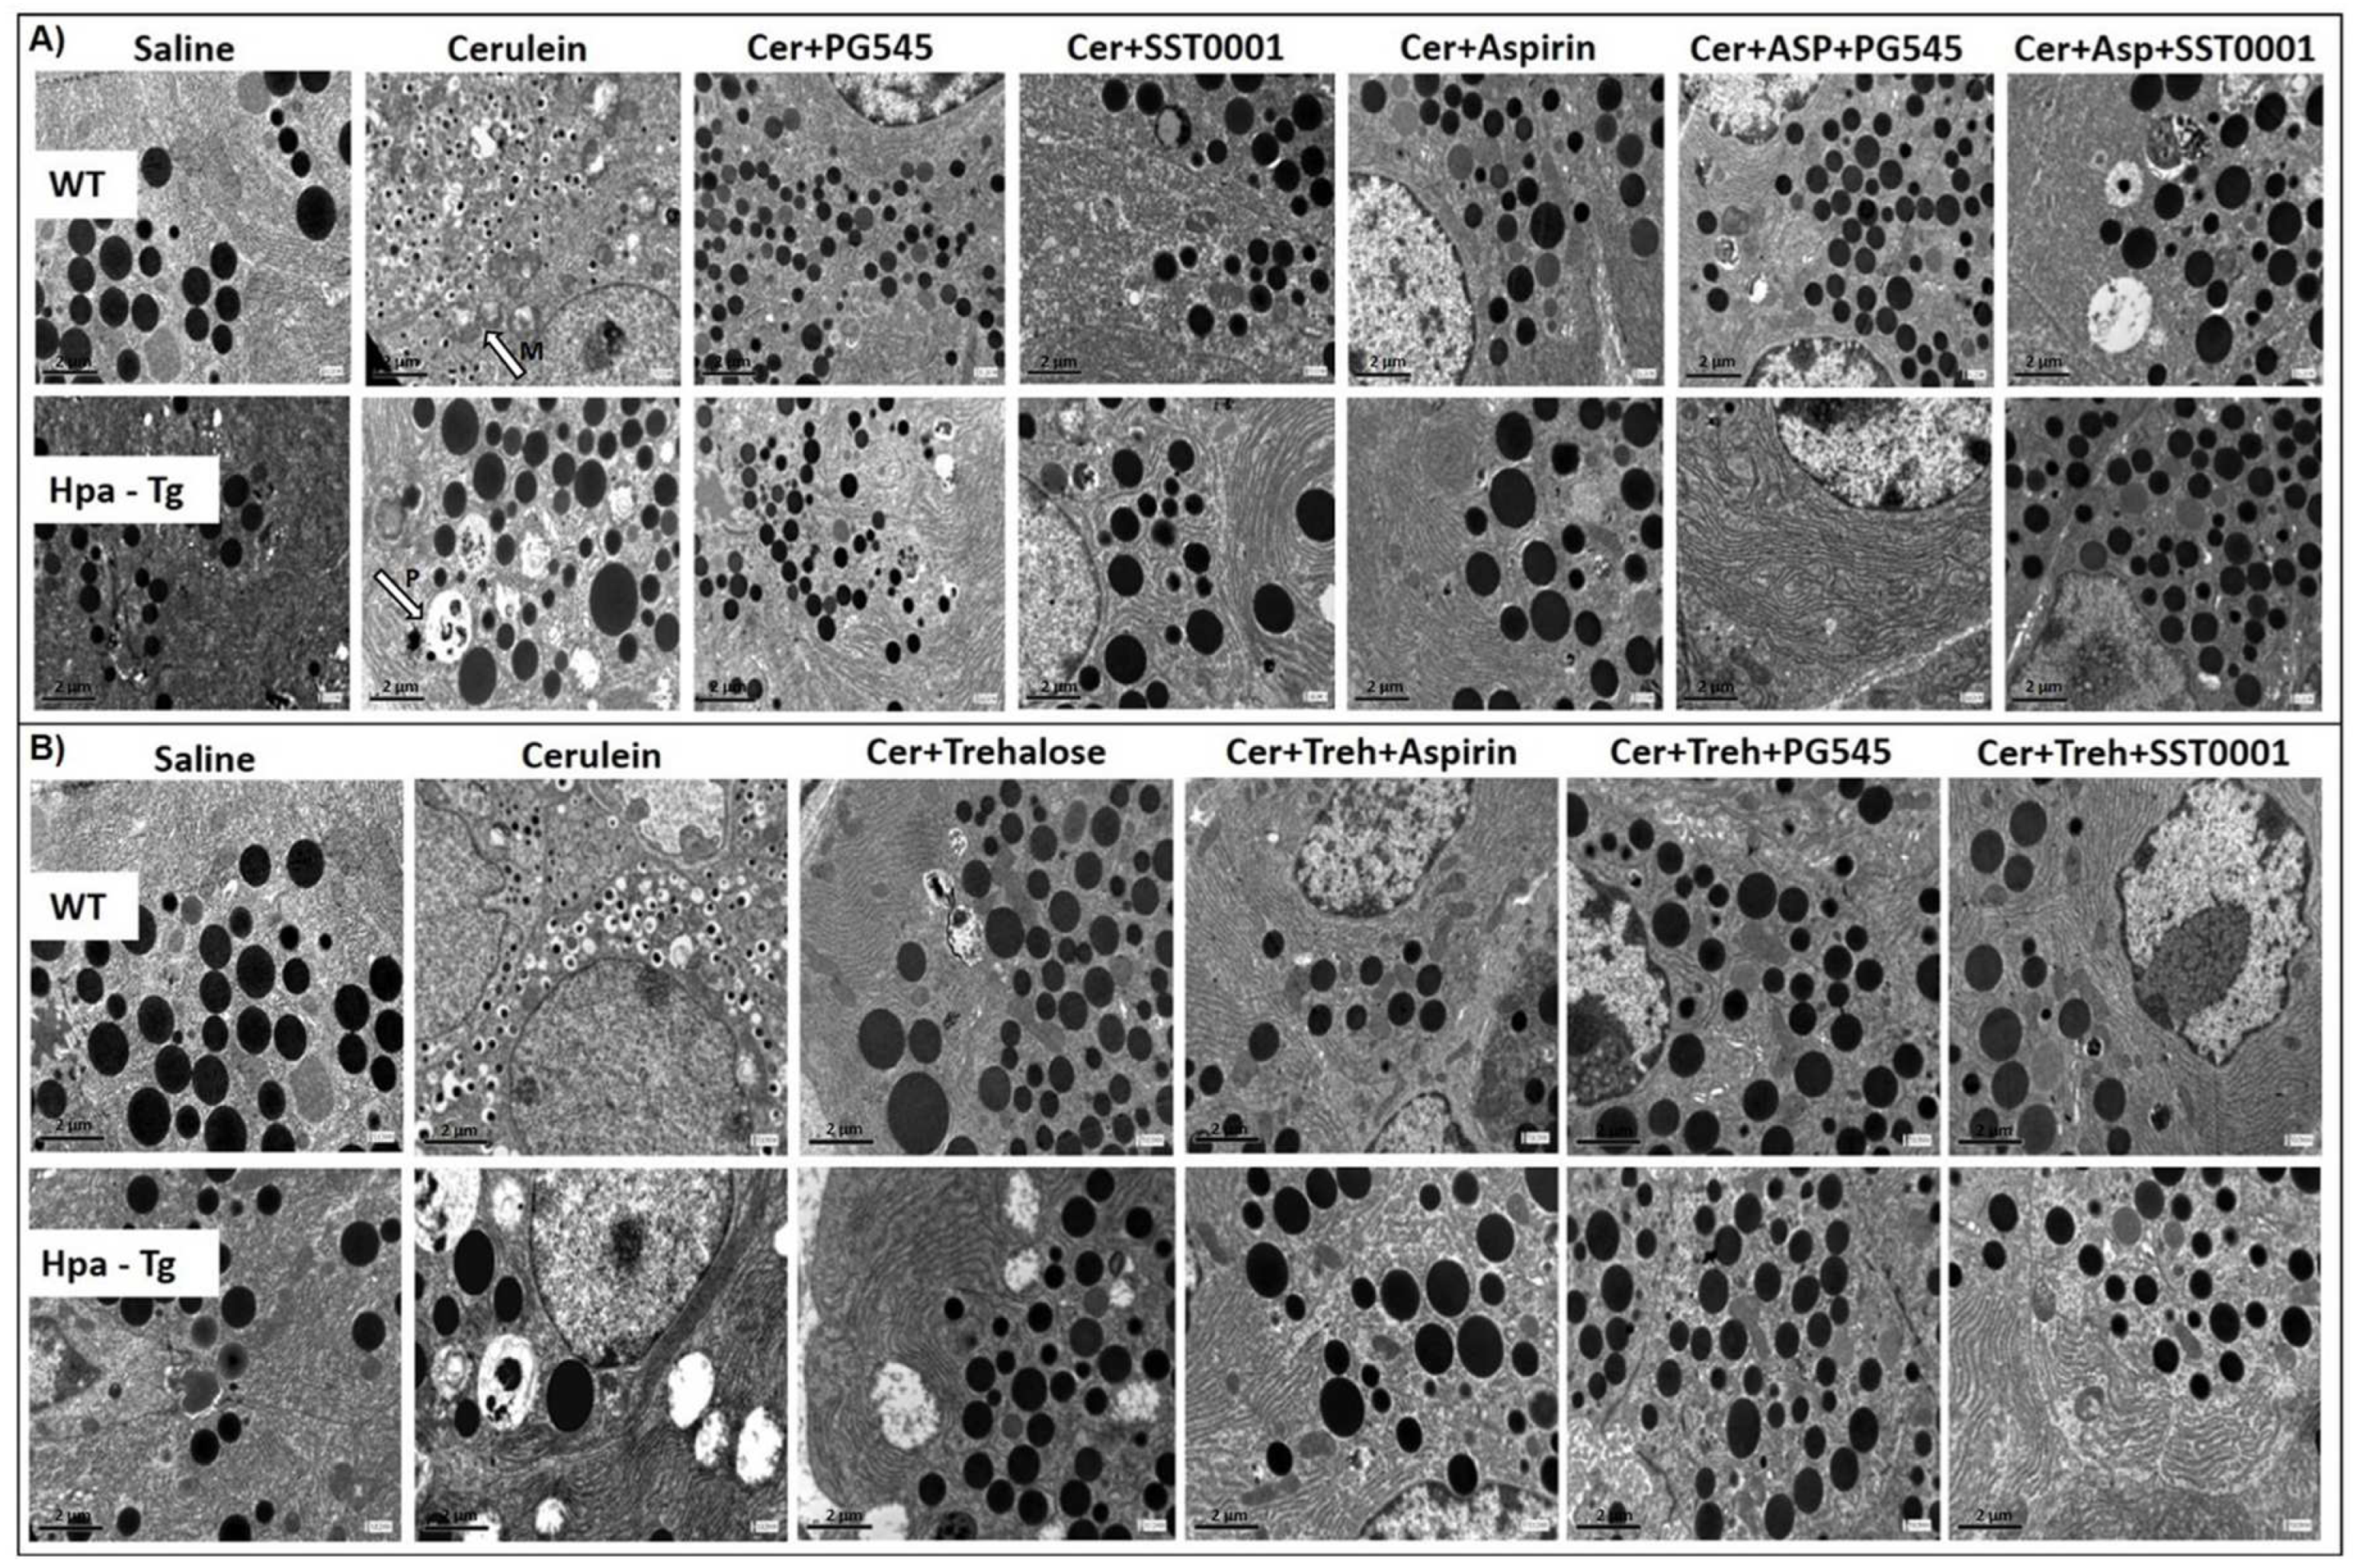
19] demonstrating that Trehalose exerted pancreato-protective action in cerulein-induced AP mouse model. These beneficial effects of Trehalose were evident by abrogating mitochondrial dysfunction, endoplasmic reticulum (ER) stress, and impaired autophagy. Furthermore, administration of Trehalose largely prevented trypsinogen activation, necrosis, and other parameters of pancreatic injury due to cerulein or other models of AP. In line with these results, we report that administration of cerulein resulted in profoundly exaggerated mitochondrial area in Hpa-Tg mice, suggesting deleterious mitochondrial swelling characterizing AP. Noteworthy, administration of cerulein also resulted in exaggerated mitochondrial heterogeneity and clumpiness in Hpa-Tg as compared with WT mice. Pretreatment with Trehalose as well as PG545, SST0001, Aspirin, or combined therapy reduced these adverse mitochondrial alterations in WT mice and even more profoundly in Hpa-Tg mice. Taken together, these findings suggest a central role for mitochondrial dysfunction and abnormal autophagy as principal downstream effectors in the development of AP.
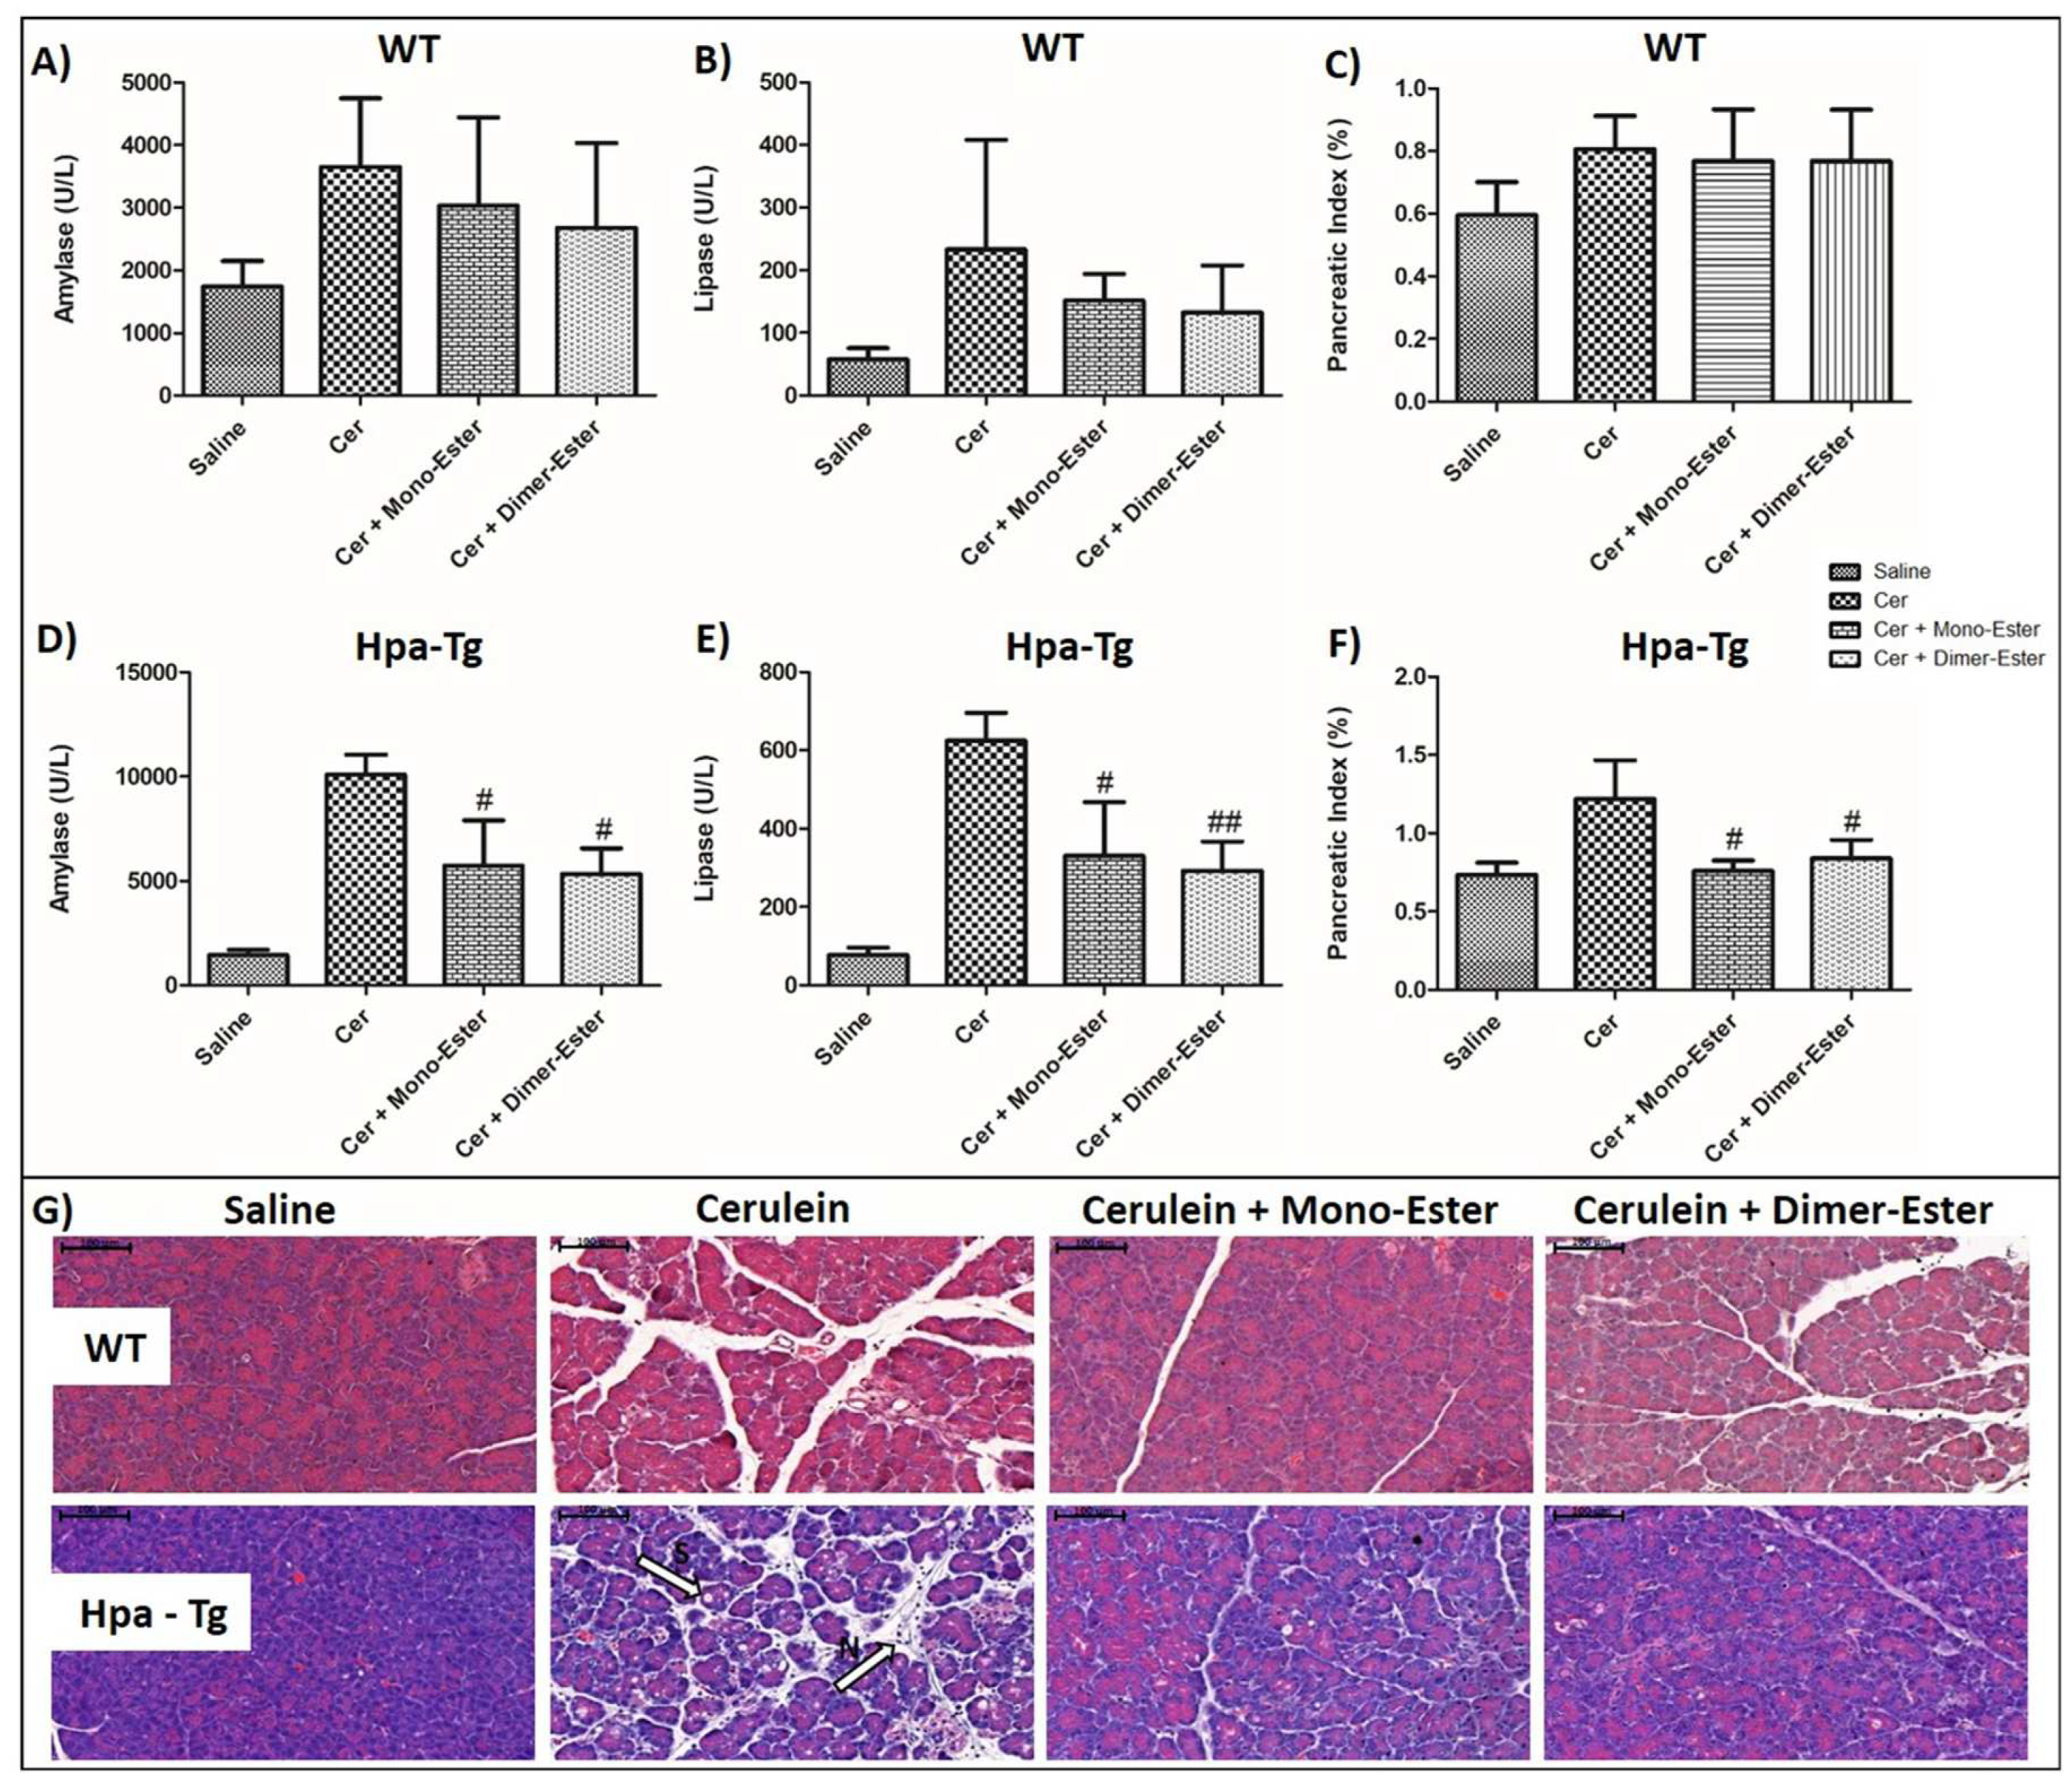
In light of the protective action of both Aspirin and Trehalose against AP, we synthesized a new compound that combines both agents, termed Aspirlose. Encouragingly, pretreatment with this novel compound decreased the elevated levels of amylase and lipase and pancreatic edema characterizing AP in the cerulein model of the disease. In addition, Aspirlose reduced pancreatic inflammatory response in both WT and Hpa-Tg mice. These results suggest that Aspirlose may compose a novel therapeutic tool for AP as was evident by reversing the biochemical, inflammatory, and histological perturbations in this disease state.
Figure 1.
Effects of PG545, SST0001, Aspirin, or combined therapy on AP. Serum levels of amylase (A,D), lipase (B,E) and pancreatic index (Pancreas/Body weight ratio) (C,F) in WT and Hpa-Tg mice subjected to cerulein-induced AP. Blood samples were collected and evaluated biochemically for lipase and amylase levels from control untreated WT (saline, n=15) or Hpa-Tg (saline,n = 15) mice; Cerulein treated WT (cer, n = 15) or Hpa- Tg (cer, n = 20) mice; Cerulein + Aspirin treated WT (cer + ASP, n=10) or Hpa- Tg (cer + ASP, n=14) mice; Cerulein + PG545 treated WT (cer + PG, n=15) or Hpa- Tg (cer + PG, n=15) mice; Cerulein + Aspirin + PG545 treated WT (cer + ASP + PG, n=9) or Hpa- Tg (cer + ASP + PG, n=11) mice; Cerulein + SST0001 treated WT (cer + SST, n=9) or Hpa- Tg (cer + SST, n=8) mice; Cerulein + Aspirin + SST0001 treated WT (cer + ASP + SST, n=9) or Hpa- Tg (cer + ASP + SST, n=8) mice. Pancreases samples from the above mentioned groups were collected and weighted. #, p<0.05 ##, p<0.01, ###, p<0.001 compared to cerulein group; $, p<0.05, $$, p<0.01, $$$, p<0.001 compared to combination group.
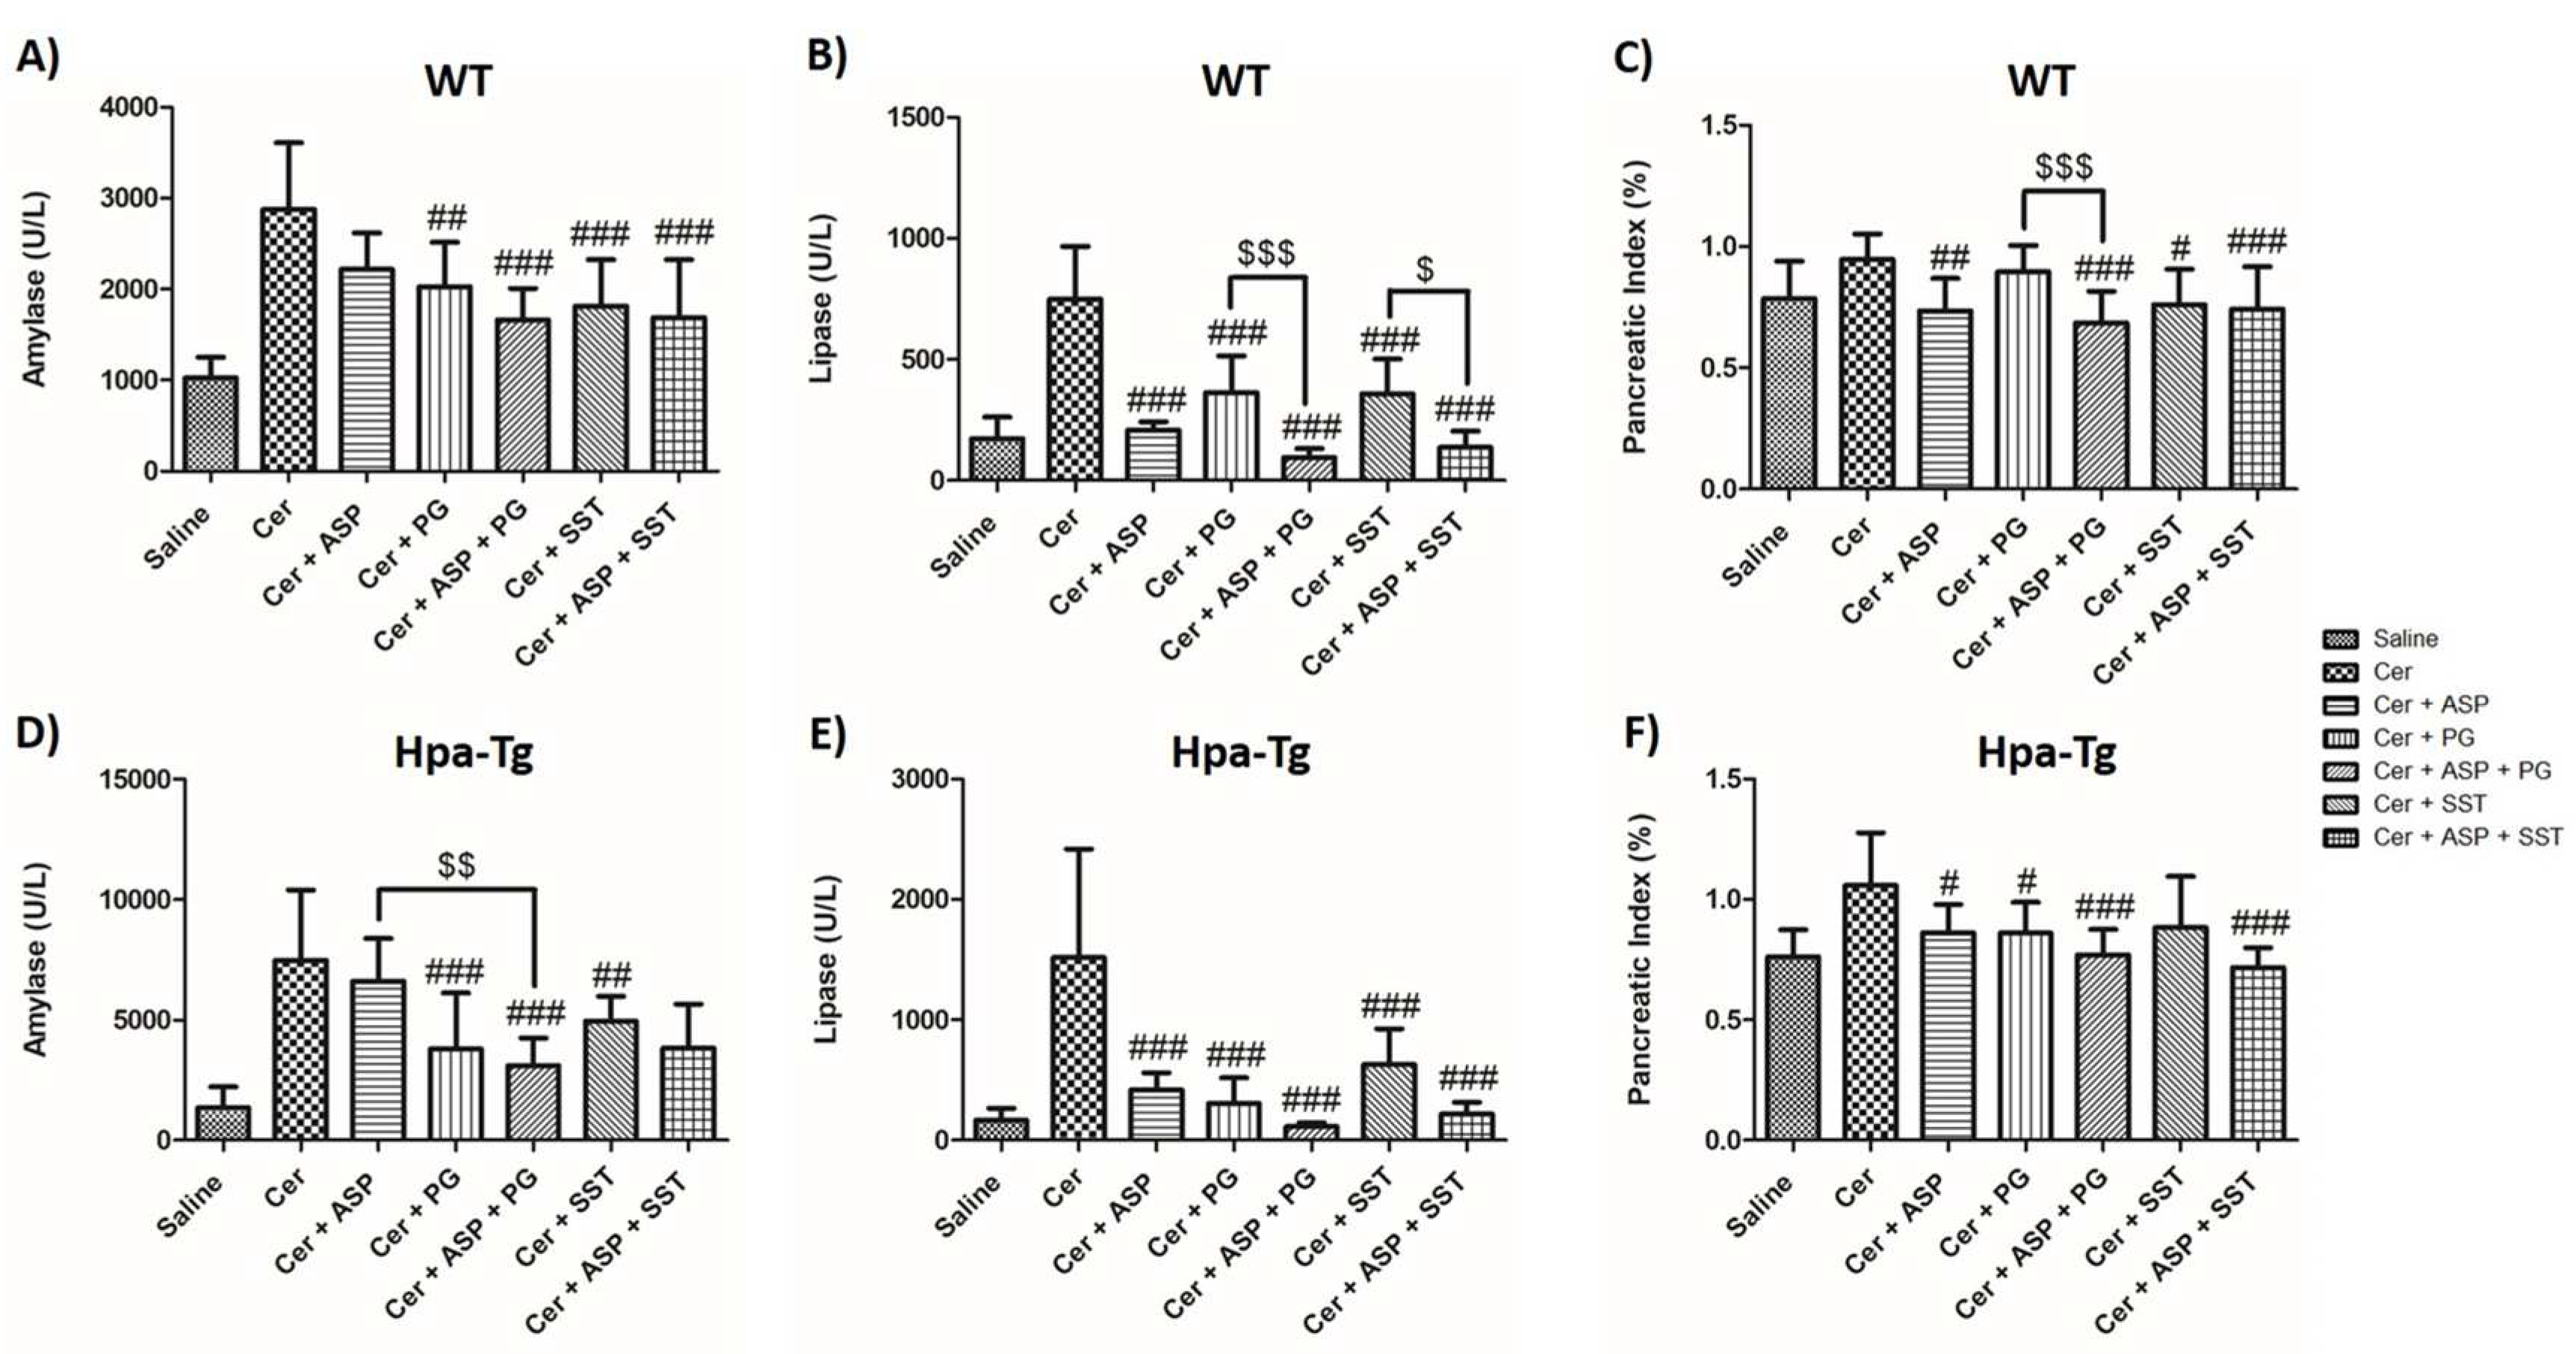
Figure 2.
Effects of Trehalose, PG545, SST0001, Aspirin, or combined therapy on AP. Serum levels of amylase (A,D), lipase (B,E) and pancreatic index (Pancreas/Body weight ratio) (C,F) in WT and Hpa-Tg mice subjected to cerulein-induced AP. Blood samples were collected and evaluated biochemically for lipase and amylase levels from control untreated WT (saline, n=15) or Hpa-Tg (saline, n = 12) mice; Cerulein treated WT (cer, n = 19) or Hpa- Tg (cer, n = 11) mice; Cerulein + Trehalose treated WT (cer + Treh, n=9) or Hpa- Tg (cer + Treh, n=19) mice; Cerulein + Trehalose + Aspirin treated WT (cer + Treh + ASP, n=9) or Hpa- Tg (cer + Treh + ASP, n=16) mice; Cerulein + Trehalose + PG545 treated WT (cer + Treh + PG, n=9) or Hpa- Tg (cer + Treh+ PG, n=18) mice; Cerulein + Trehalose + SST0001 treated WT (cer + Treh + SST, n=9) or Hpa- Tg (cer + Treh + SST, n=16) mice. Pancreases samples from the above mentioned groups were collected and weighted. #, p<0.05 ##, p<0.01, ###, p<0.001 compared to cerulein group; $, p<0.05, $$, p<0.01, $$$, p<0.001 compared to combination group.
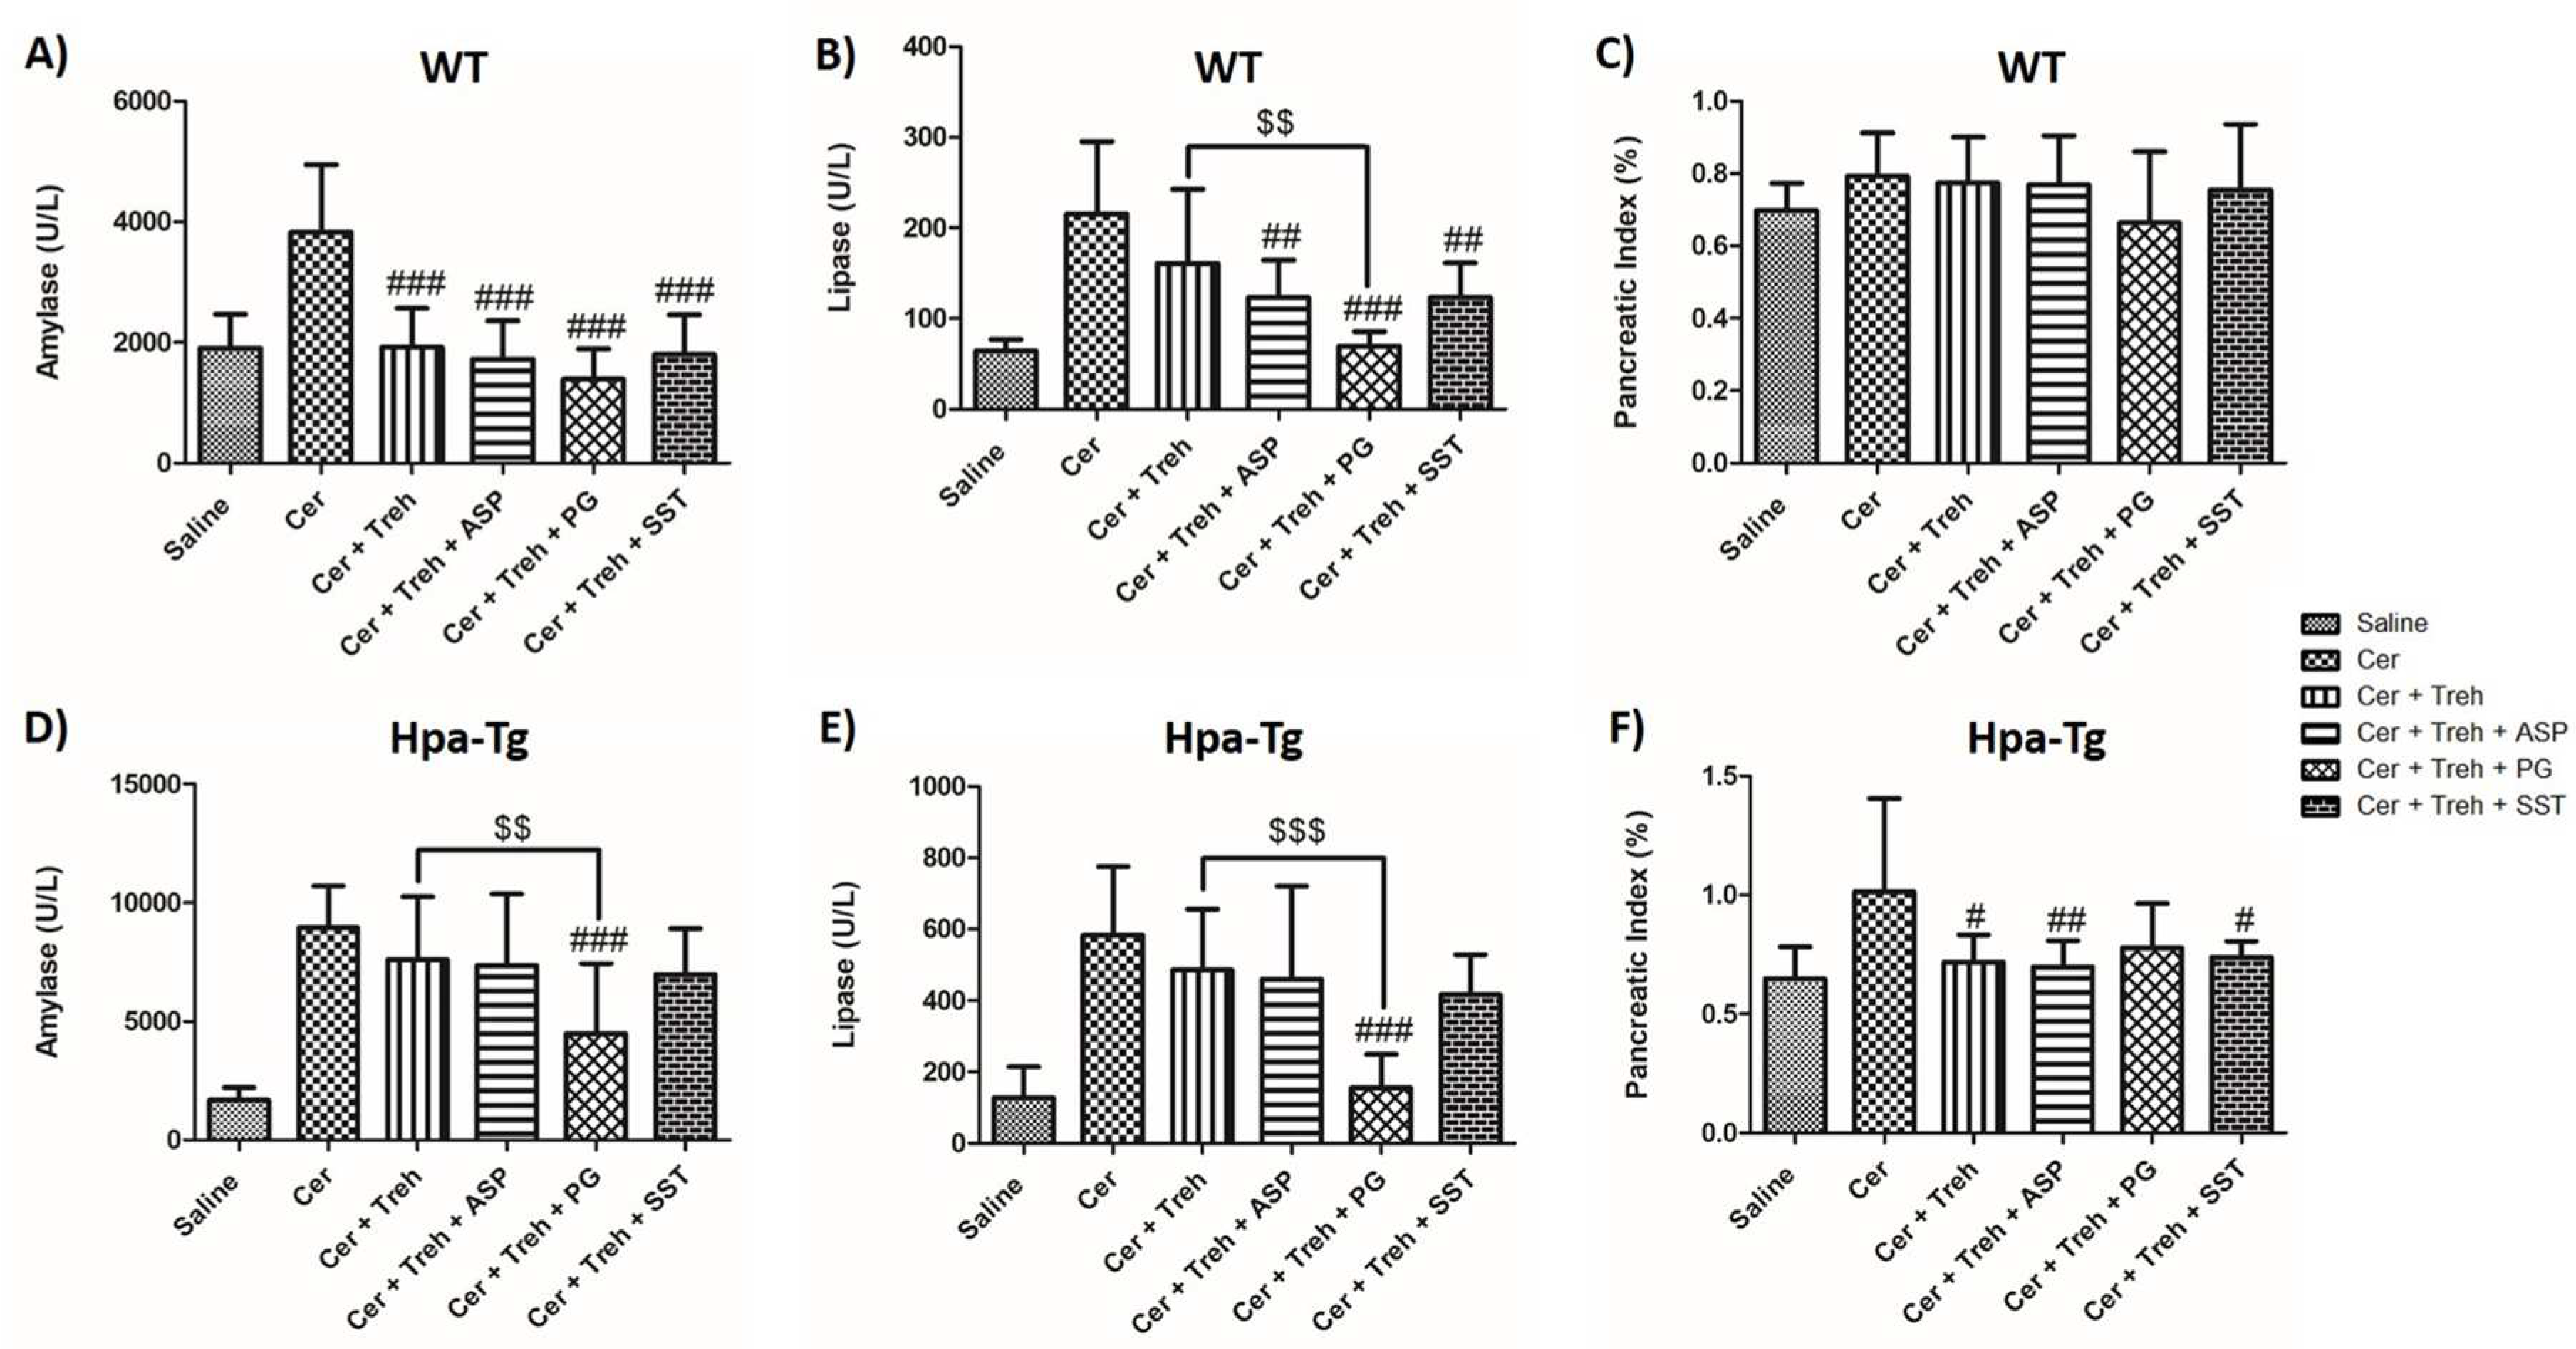
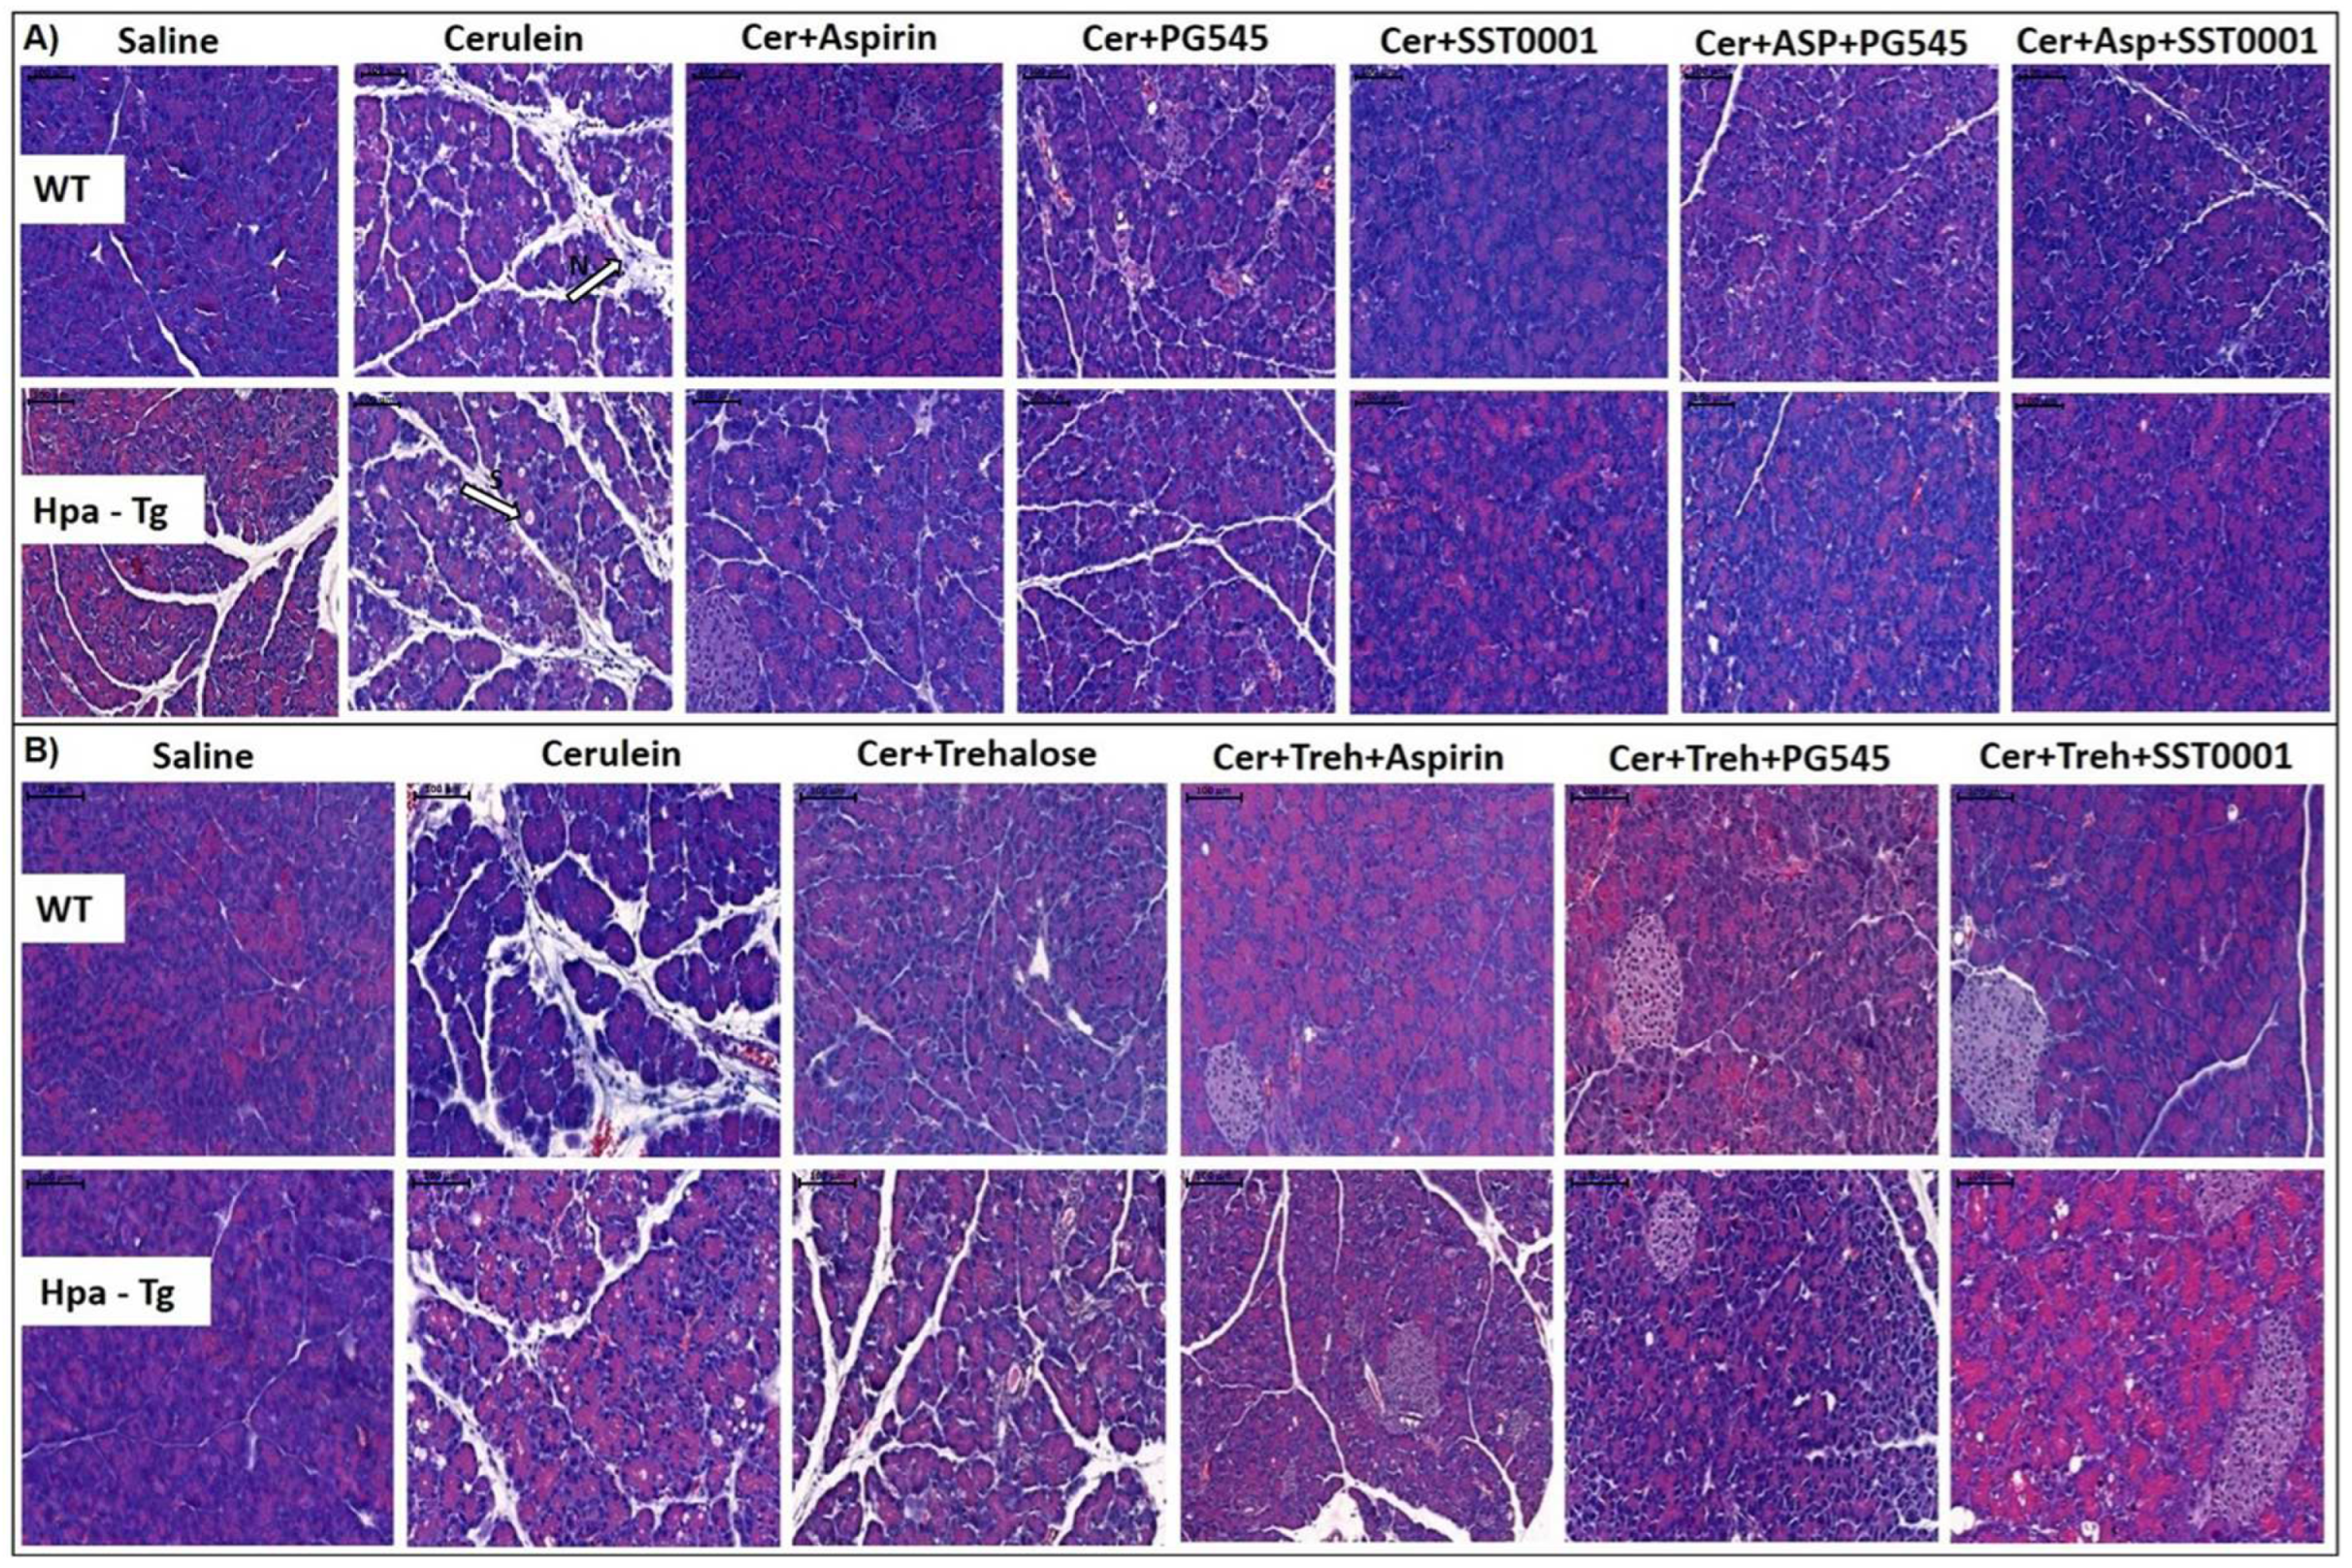
Figure 3.
Hematoxylin & Eosin staining. WT and Hpa-Tg mice were injected with either saline or cerulein in the presence or absence of PG545, SST0001, Aspirin, Trehalose alone, or the indicated combined pretreatment. Pancreas tissues were collected 24 h thereafter, and 5-micron sections of formalin-fixed, paraffin-embedded samples were stained with H&E. N = infiltration of neutrophils, S = bubble shape bodies. Shown are representative photomicrographs in scale of 100µM (A,B).
Figure 4.
Electron Microscopy Analysis. WT and Hpa-Tg mice were injected with either saline or cerulein in the presence or absence of PG545, SST0001, Aspirin, Trehalose, or the indicated combined pretreatment. Pancreas tissues were collected 24 h thereafter and sections were examined with a transmission electron microscope. M = Mitochondrial vacuolization , P = Autophagosome. Shown are representative photomicrographs in scale of 2µM (A,B).
Figure 5.
Analysis of Electron Microscopy Images. WT and Hpa-Tg mice were injected with saline or cerulein in the presence or absence of PG545, SST0001, Aspirin, Trehalose each alone, or the indicated combined pretreatment. Pancreas tissues were collected 24h thereafter. Tissue sections were processed and photographed under a transmission electron microscope and morphometric analysis was performed by Image pro plus 7 software. Mitochondria (n = 18-111) were detected and analyzed by different features of size, shape, and texture for each sample (A-L) in WT (n of fields = 3-10) and Hpa- Tg mice (n of fields = 3-11). Area parameter represents the mitochondria size among the different treatment groups (A,B). Heterogeneity parameter represents the percentage of the pixels that deviate above 10% (C,D). Clumpiness parameter represents clumps accumulation indicating the mitochondrial texture (E,F). Aspect parameter represents the mitochondria shape among the different treatment groups (G,H). Mean diameter parameter represents the mean diameter value of the different mitochondria (I,J). Area/Box parameter indicates the mitochondrial shape under normal and stress conditions (K,L). #, p<0.05 ##, p<0.01, ###, p<0.001 compared to cerulein group; $, p<0.05, $$, p<0.01, $$$, p<0.001 compared to combination group.
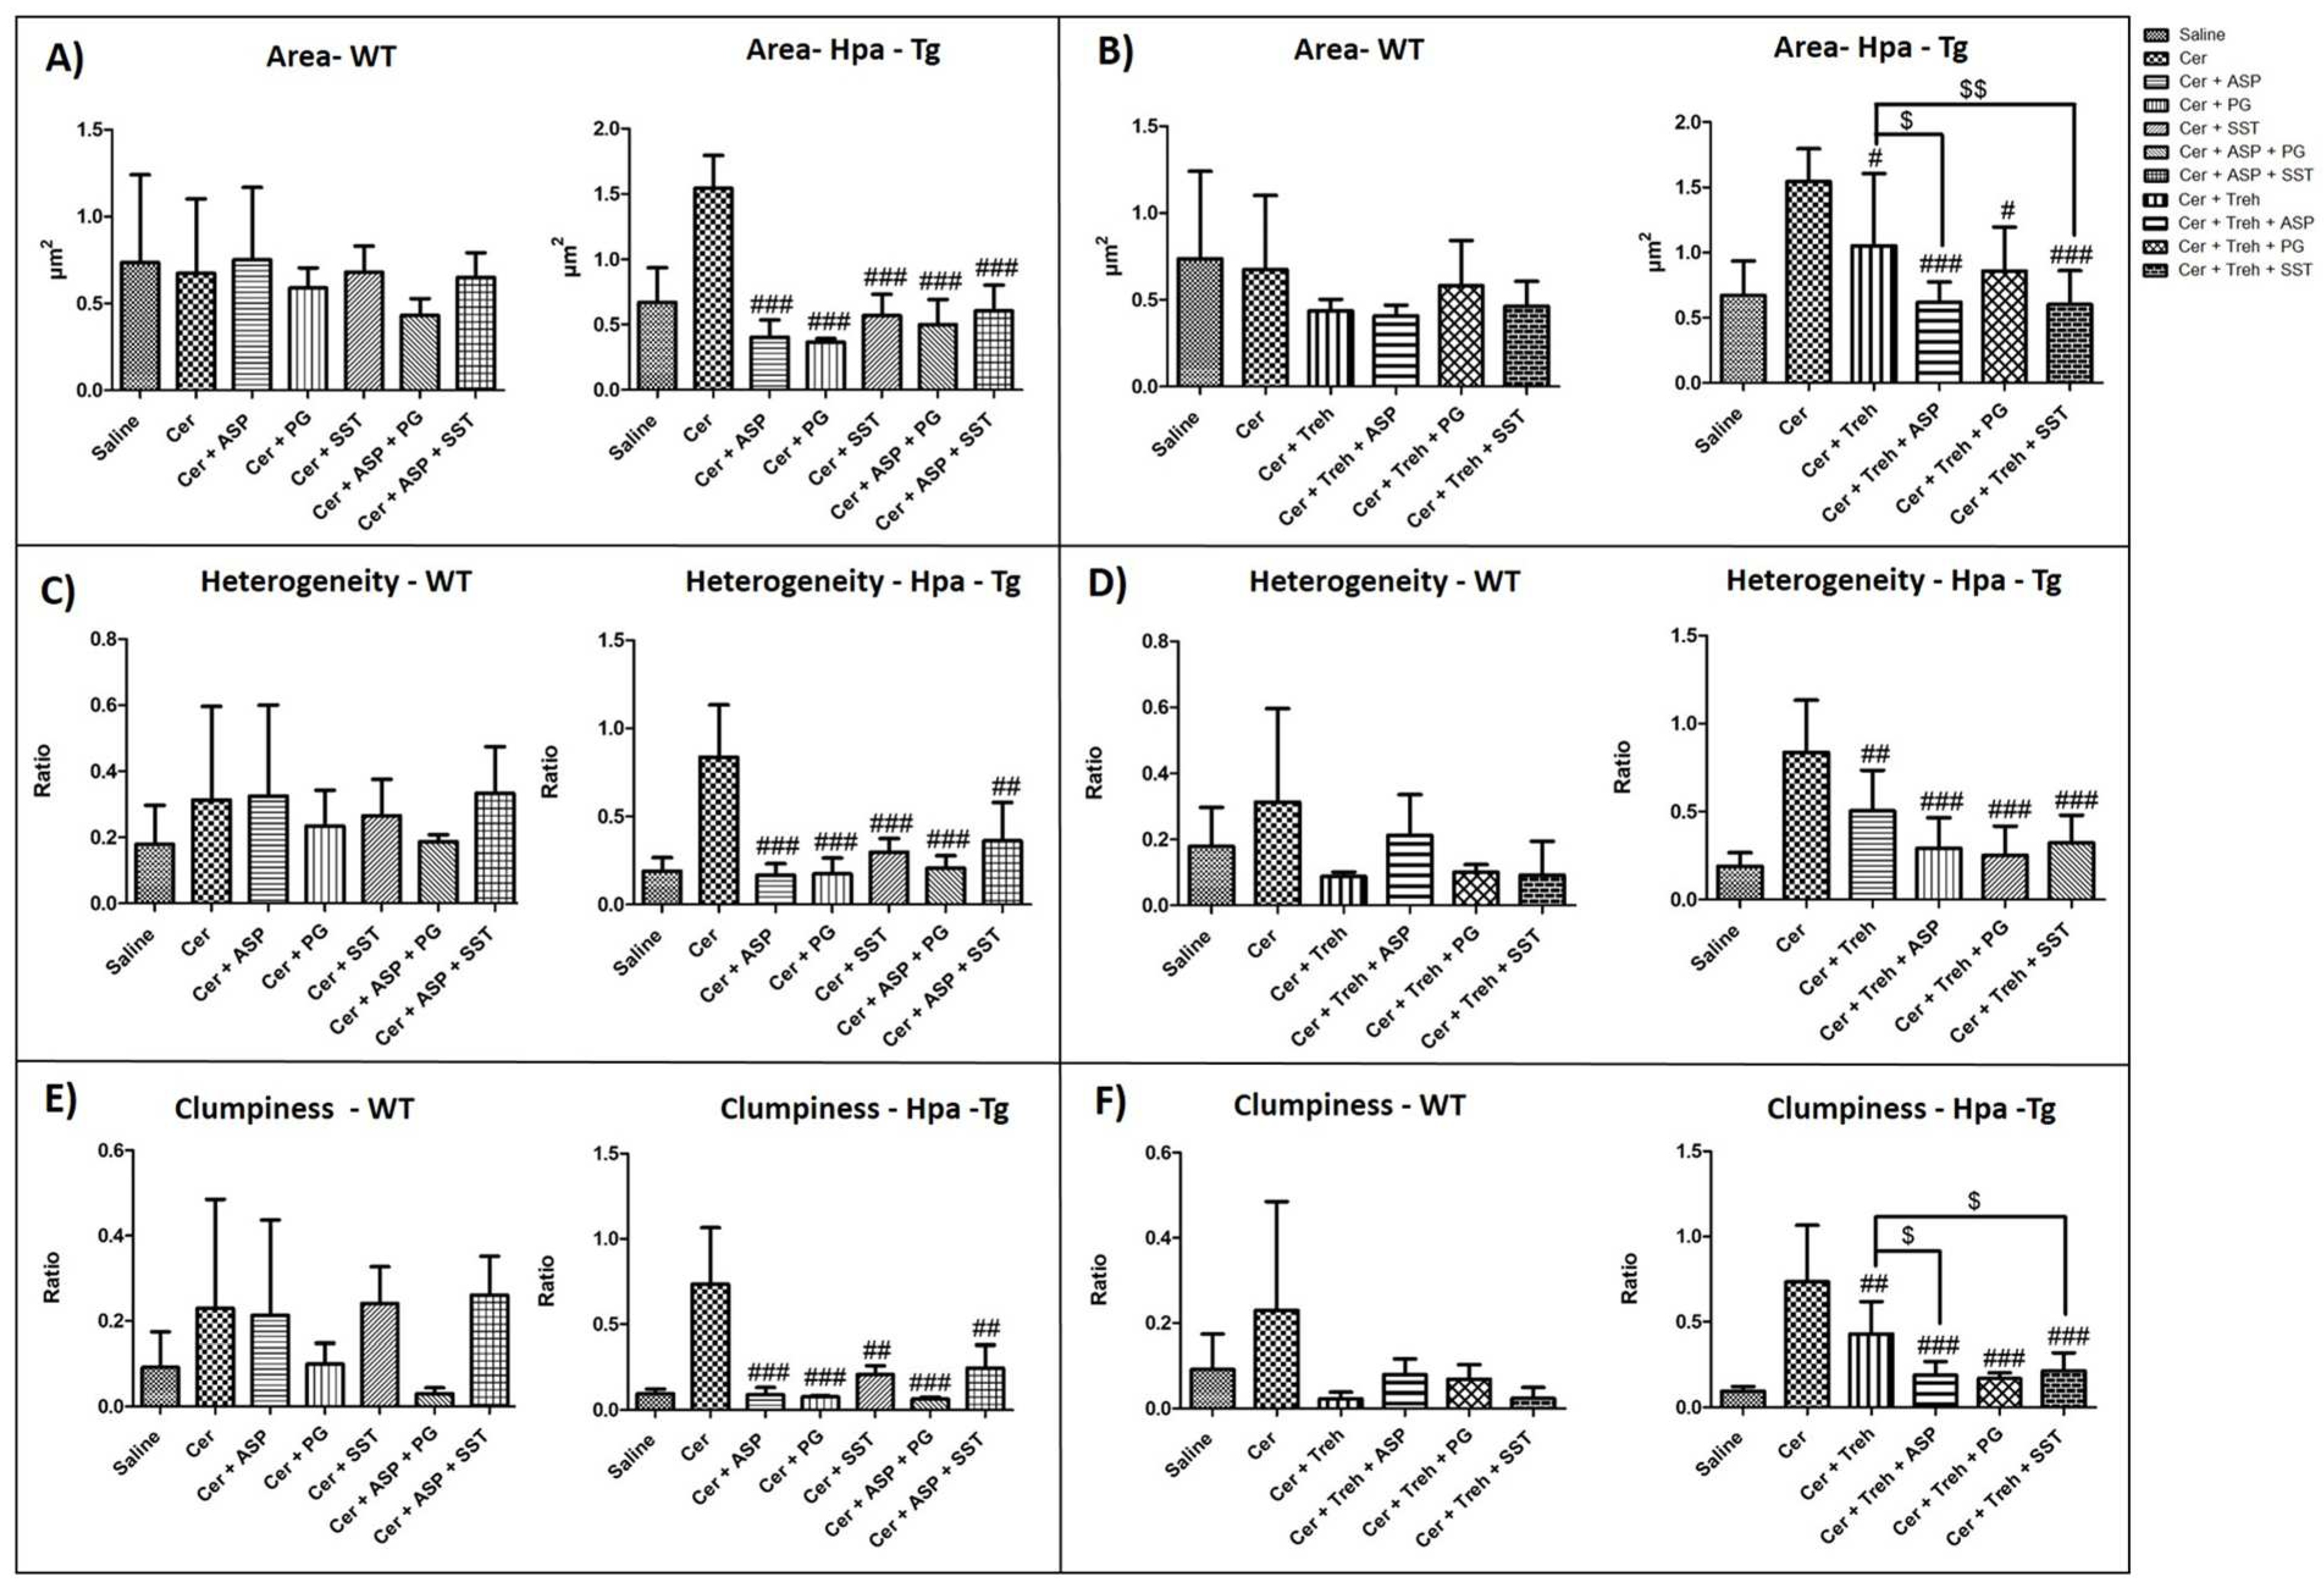
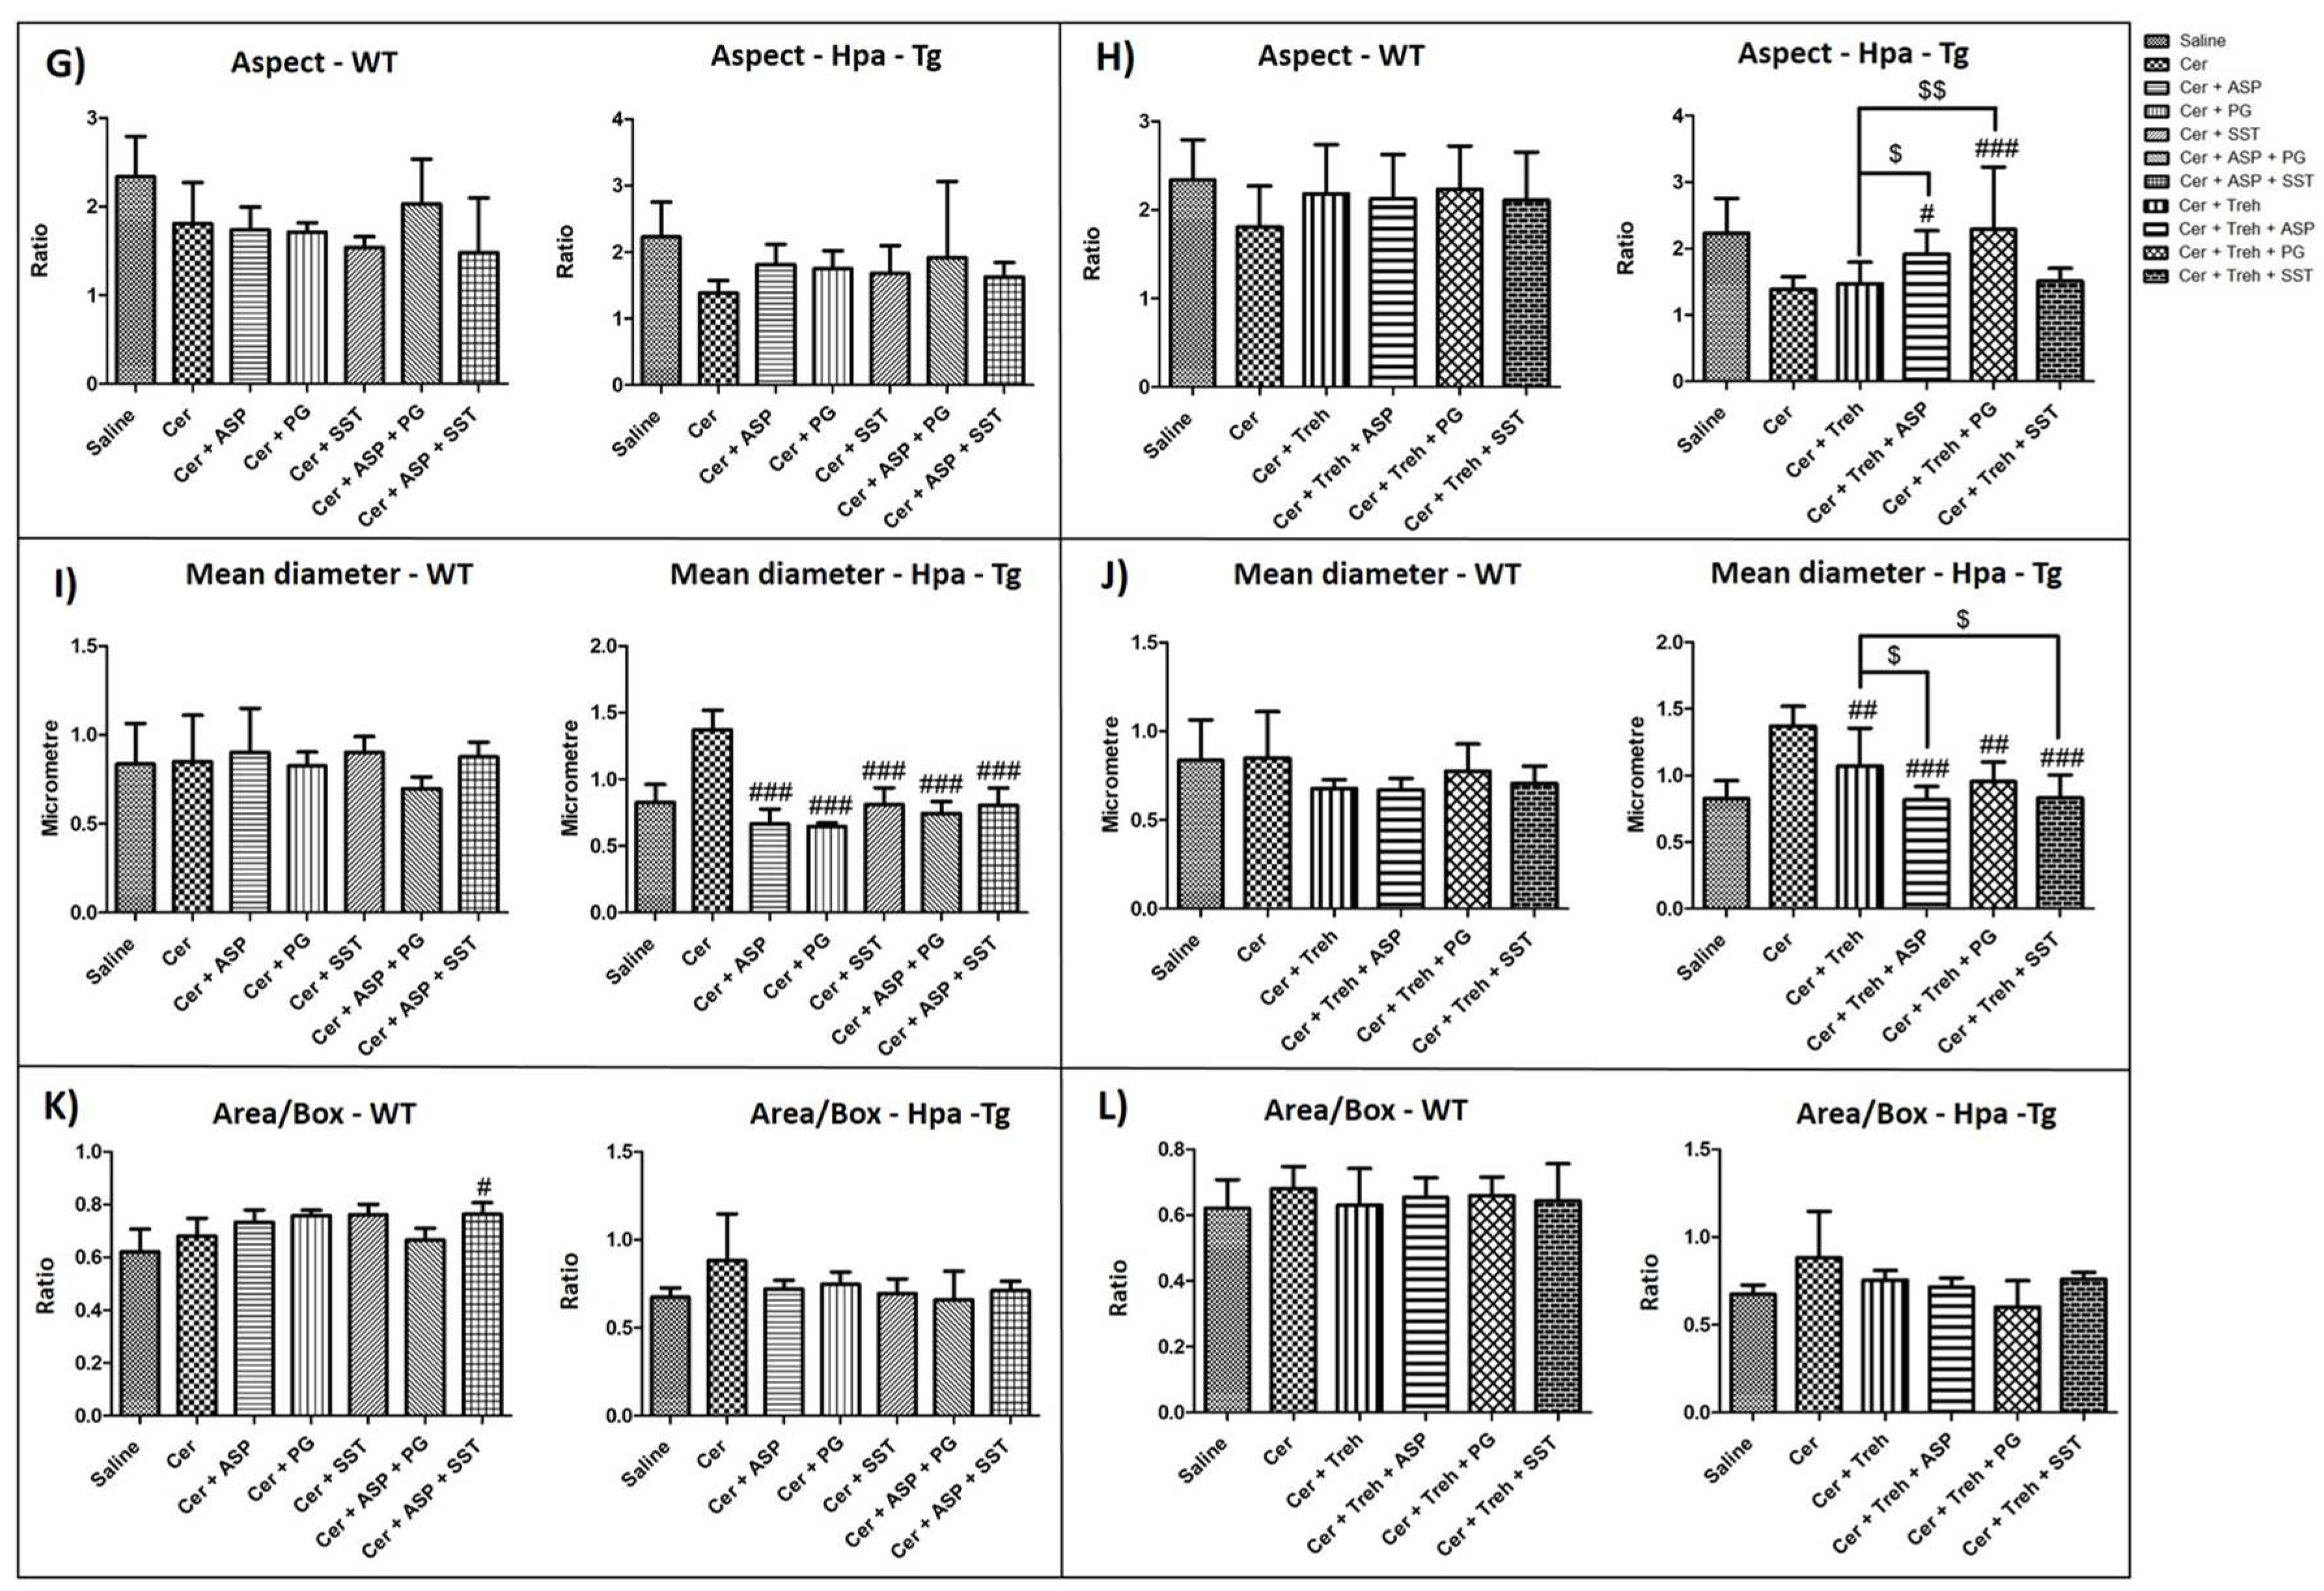
Figure 6.
Hpa Activity in WT and Hpa-Tg Mice. Freshly collected pancreatic tissues were homogenized and incubated on sulfate-labeled ECM-coated dishes. Hpa activity (release of sulfate-labeled heparan sulfate degradation fragments) was evaluated in pancreatic tissues harvested from saline, n=3 (light blue); cerulein, n=3 (orange); cerulein + Aspirin, n=3 (gray); cerulein + PG545, n=3 (yellow); cerulein + SST0001, n=3 (purple); cerulein + Aspirin + PG545, n=3 (light green); cerulein + Aspirin + SST0001, n=3 (black); cerulein + Trehalose, n=3 (dark green); cerulein + Trehalose + Aspirin, n=3 (dark blue); cerulein + Trehalose + PG545, n=3 (pink) and cerulein + Trehalose + SST0001, n=3 (red) (A-D).
Figure 7.
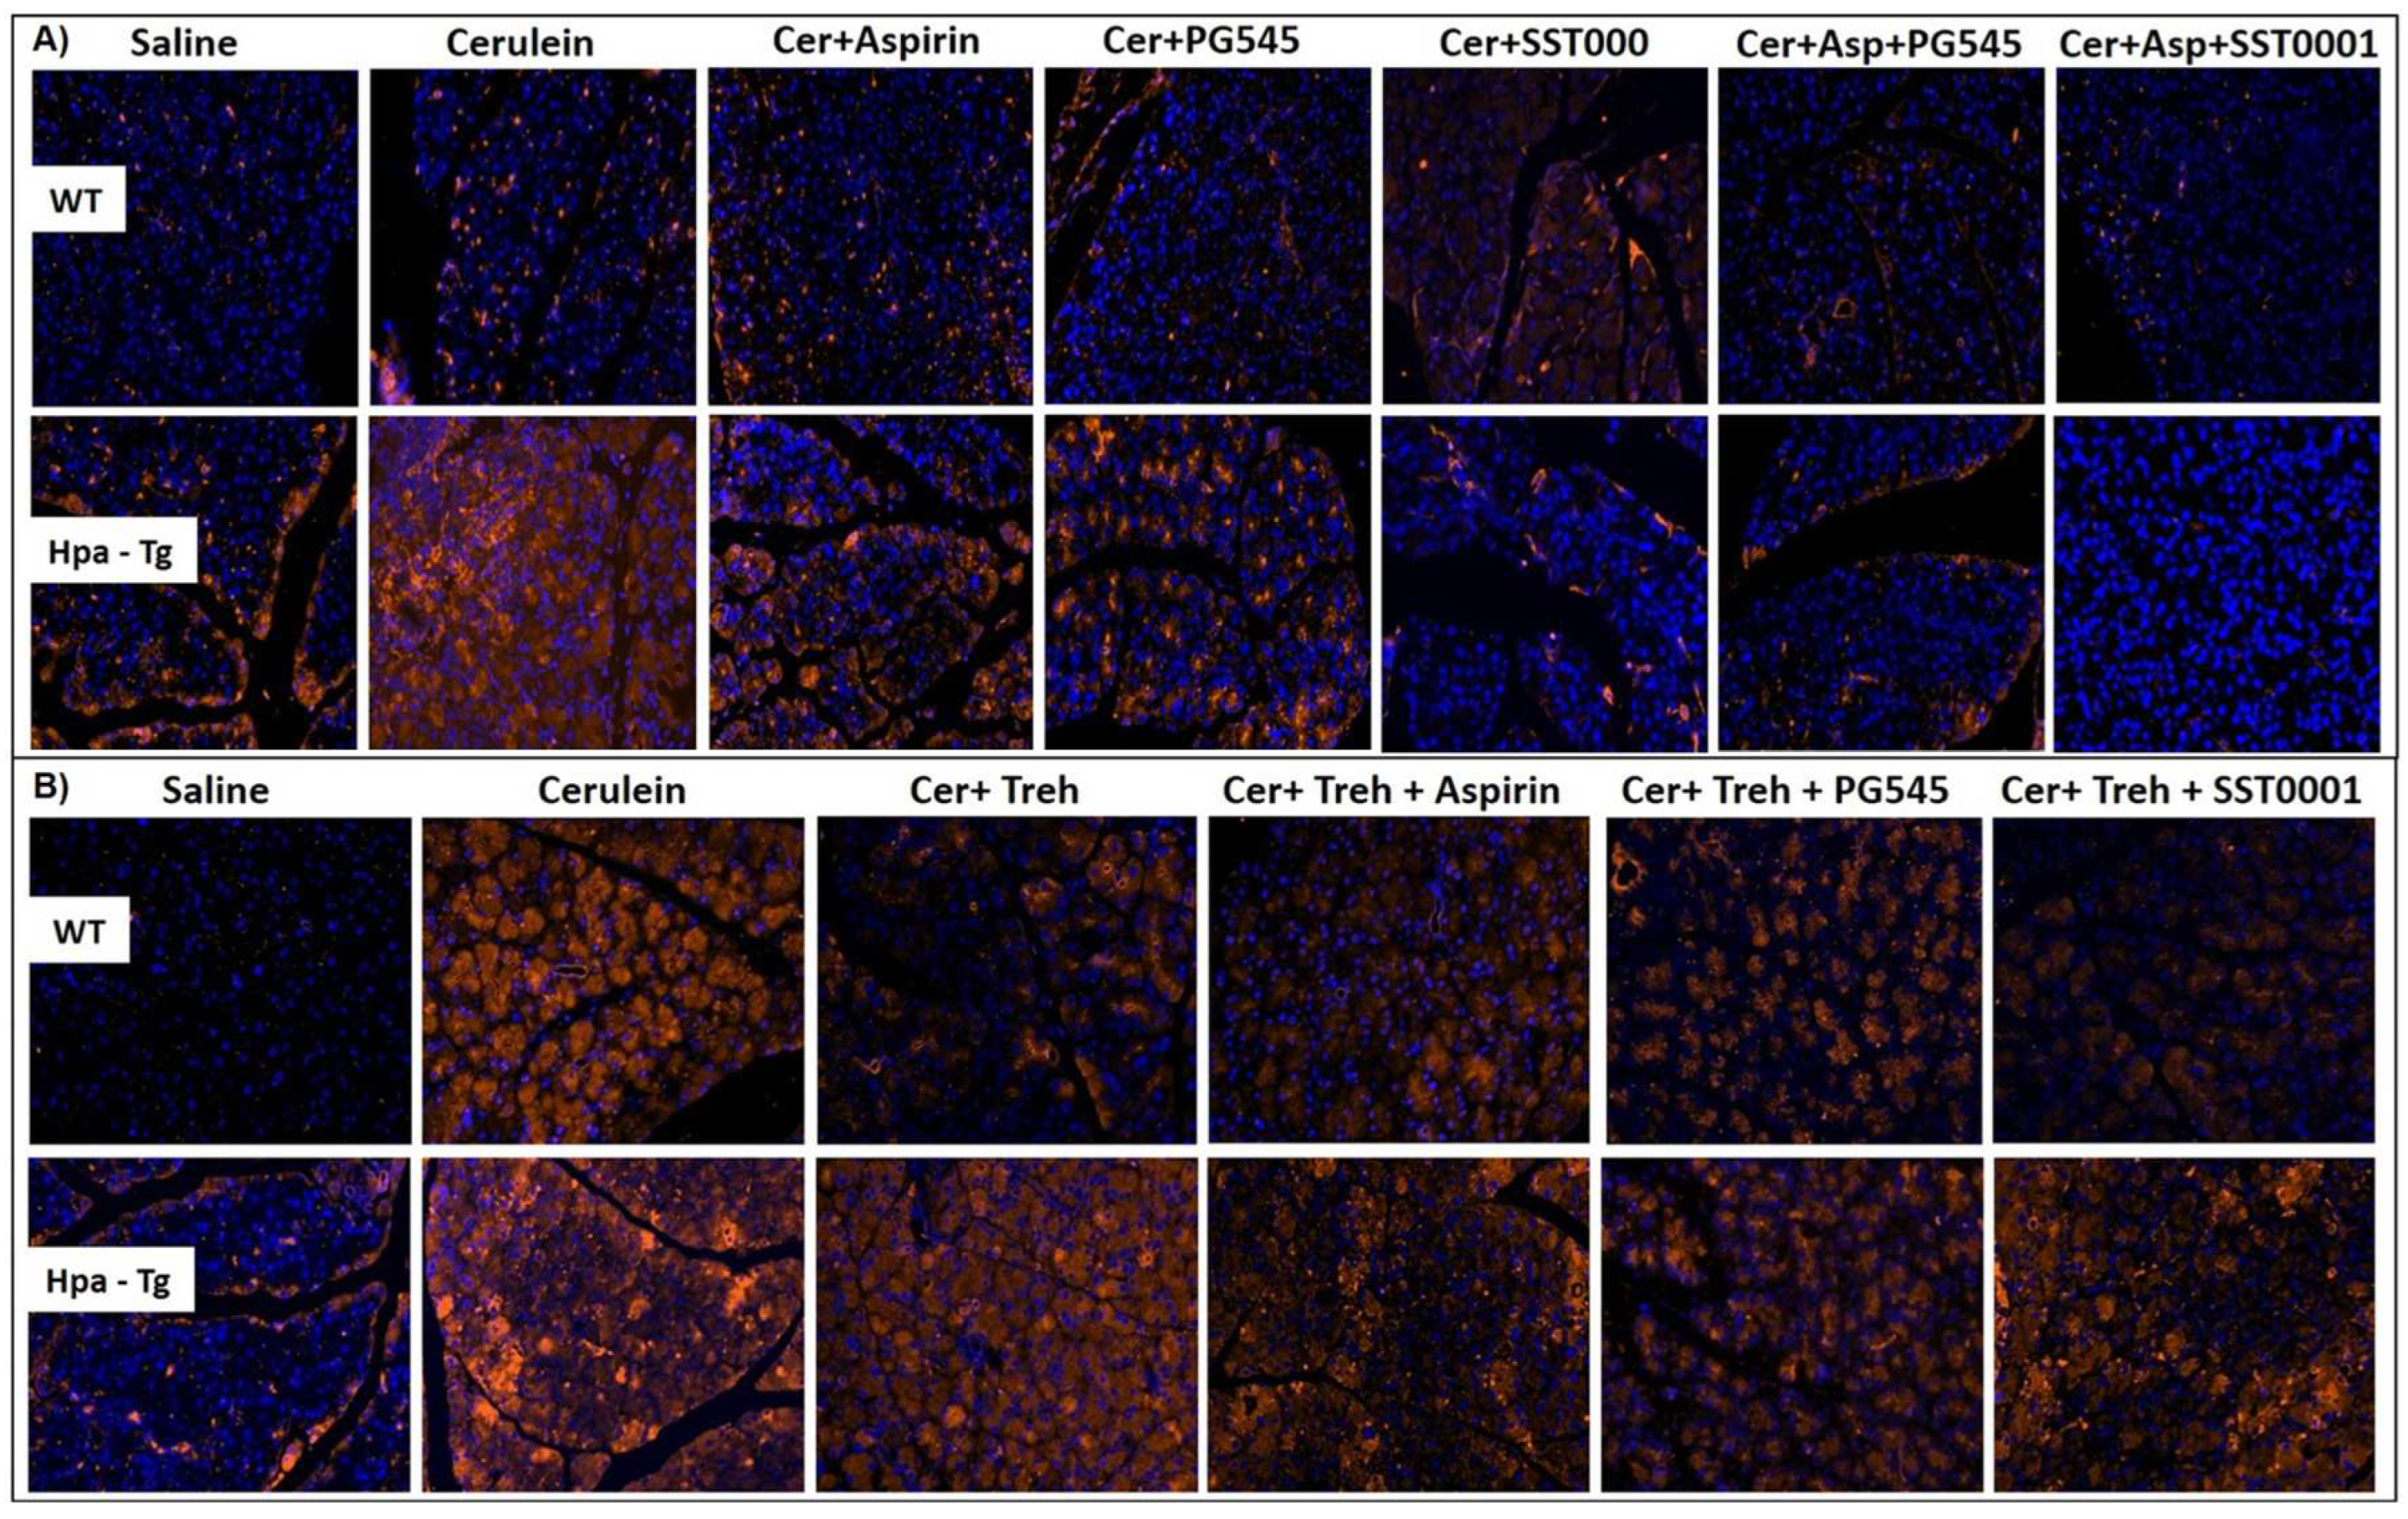
Immunostaining of Hpa. WT and Hpa-Tg mice were injected with either saline or cerulein in the presence or absence of PG545, SST0001, Aspirin, or Trehalose (each alone) or the indicated combined pretreatment. Tissues were harvested, fixed with formalin and embedded in paraffin. 3-micron sections were subjected to immunostaining with anti-Hpa antibody (A,B). DAPI staining for DNA appears in blue. All photographs were taken at the same magnification.
Figure 8.
Western blot analysis (Hpa, CathL) of pancreatic tissue extracts derived from WT and Hpa-Tg mice. Hpa (A,B) and CathL (C,D) immunoreactive proteins normalized to housekeeping gene GAPDH. Representative Western blots are shown above the densitometry graphs. #, p<0.05 ##, p<0.01, ###, p<0.001 compared to cerulein group; $, p<0.05, $$, p<0.01, $$$, p<0.001 compared to combination group.
Figure 9.
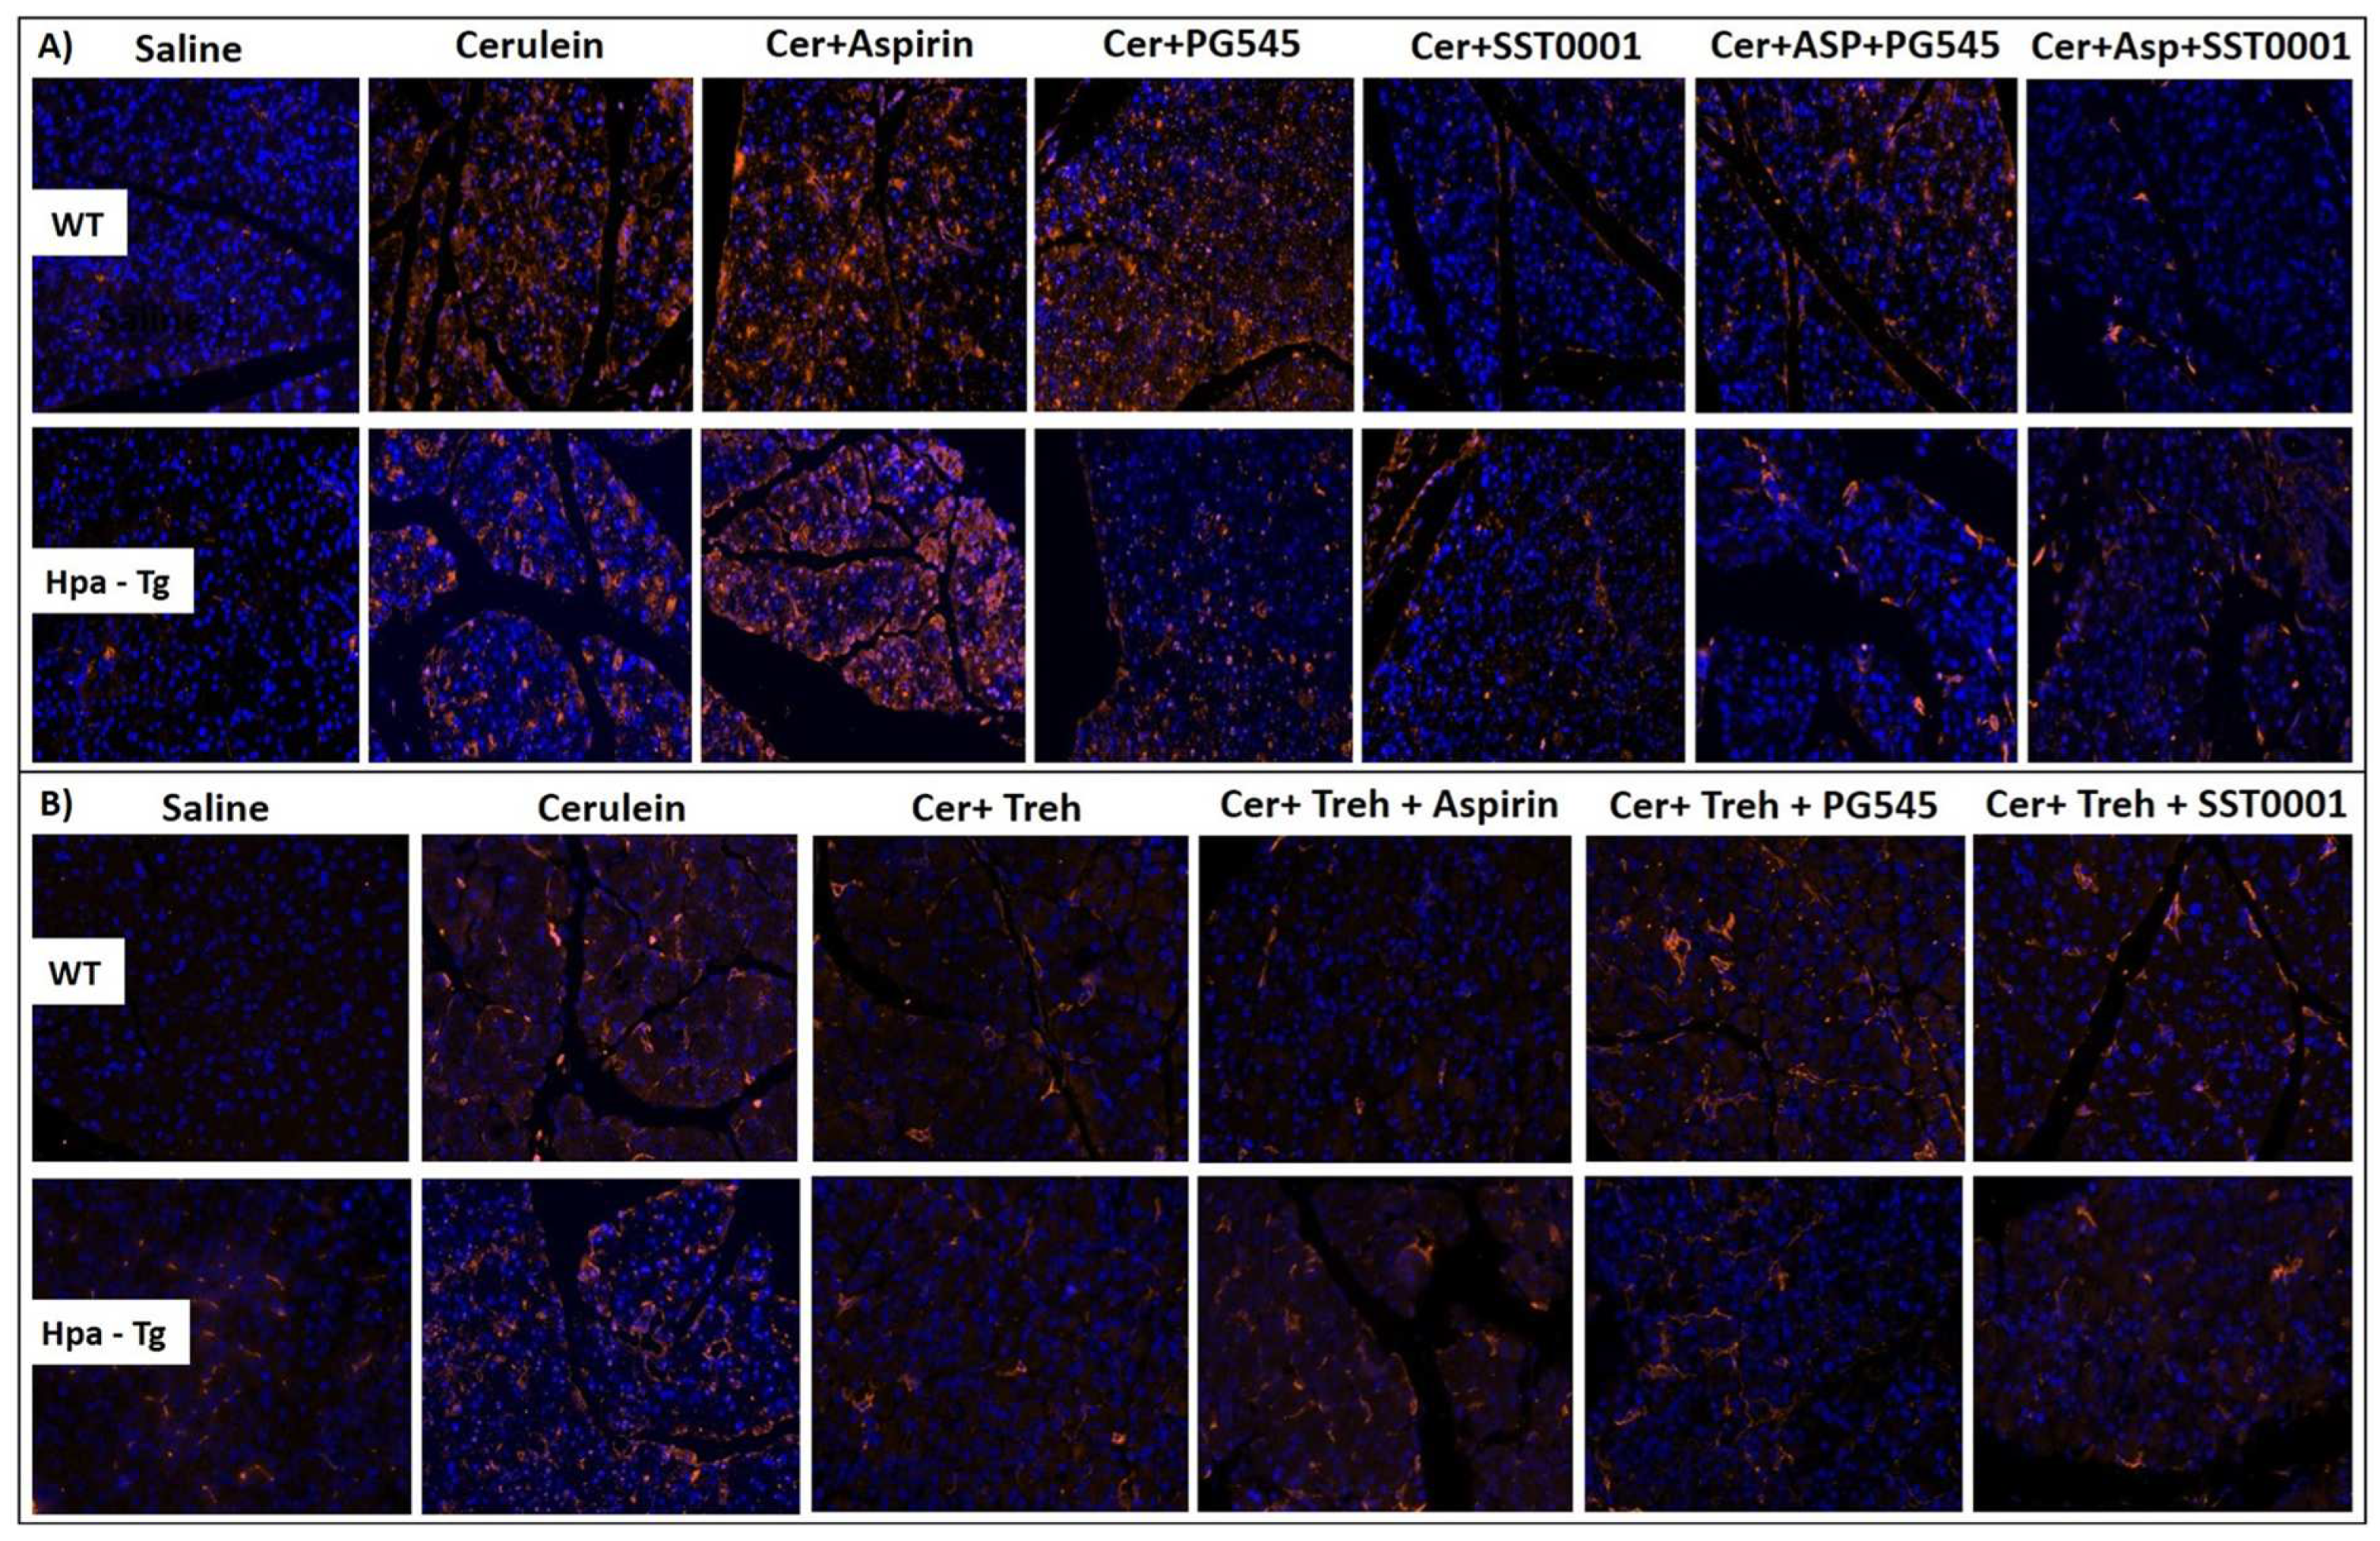
Immunostaining of F4/80. WT and Hpa-Tg mice were injected with either saline or cerulein in the presence or absence of PG545, SST0001, Aspirin, Trehalose alone, or the indicated combined pretreatment. Tissues were harvested, fixed with formalin and embedded in paraffin. 3-micron sections were subjected to immunostaining with anti-F4/80 - a macrophage-specific marker (A,B). DAPI staining for DNA appears in blue. All photographs were made at the same magnification.
Figure 10.
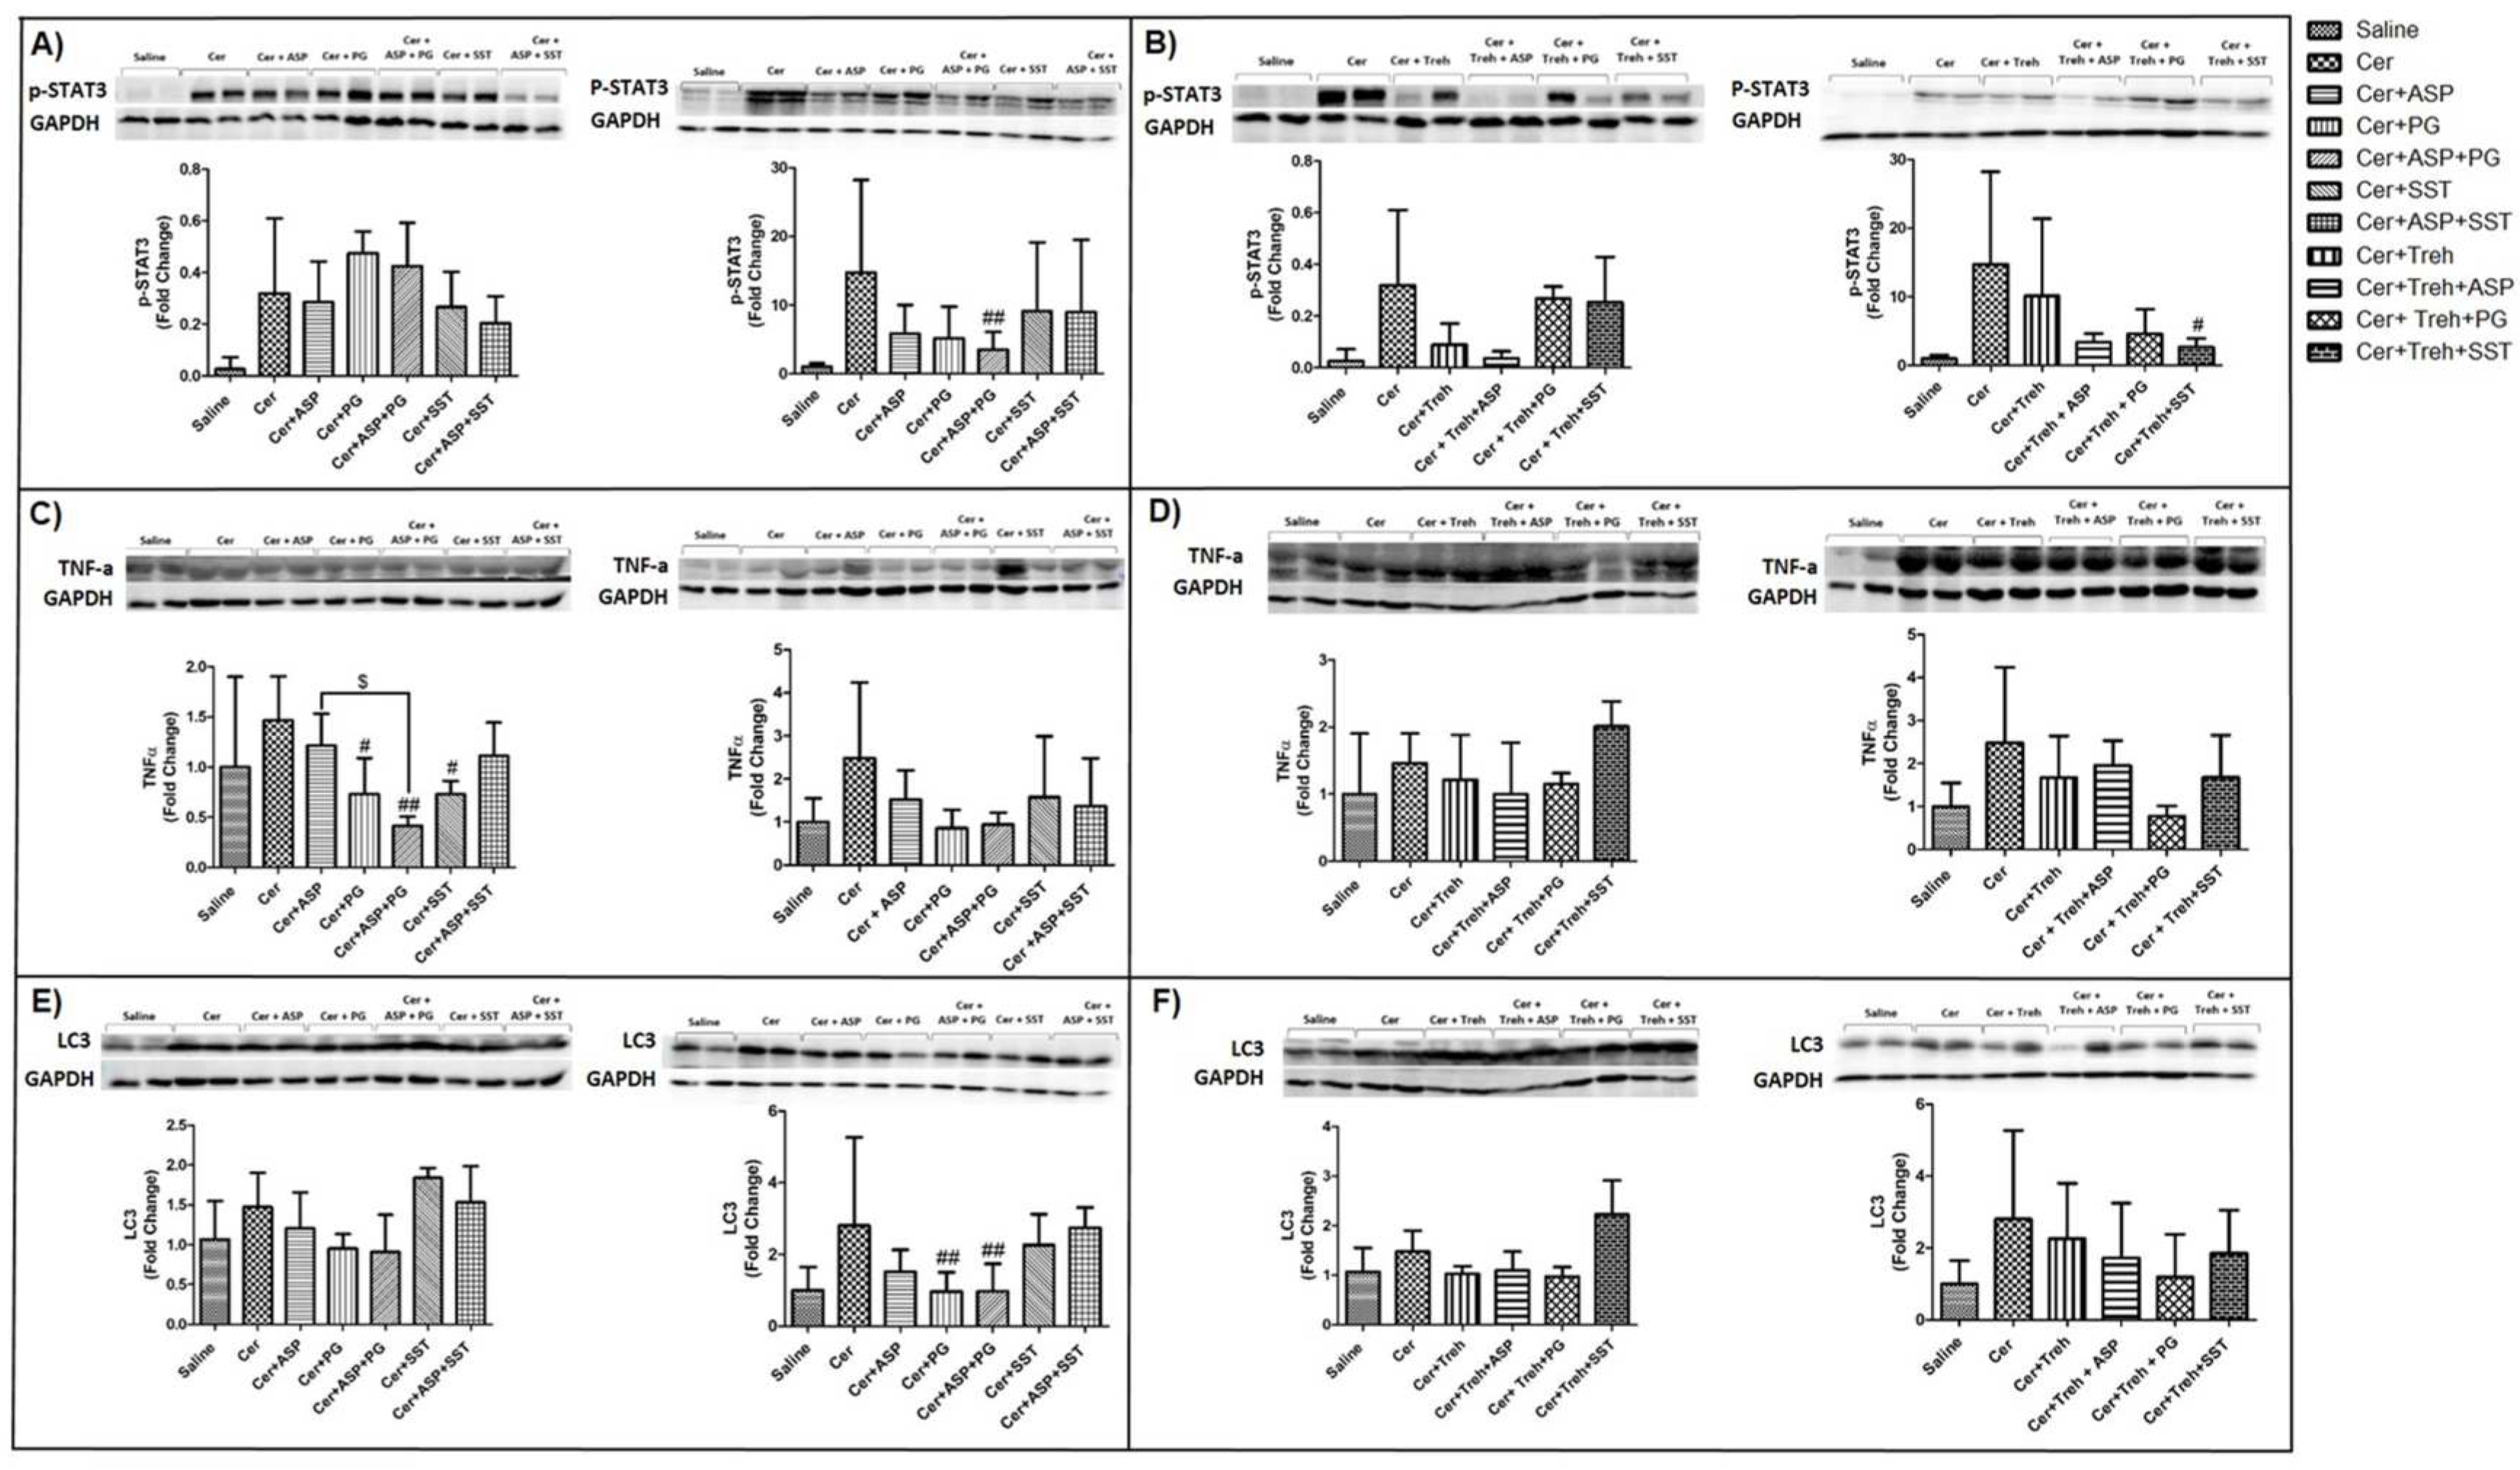
Western blot analysis (biomarkers of inflammation) of pancreatic tissue extracts derived from WT and Hpa-Tg mice. p-STAT3 (A,B), TNF-α (C,D) and LC3 (E,F) immunoreactive proteins normalized to housekeeping gene GAPDH. Representative Western blots are shown above the densitometric graphs. Cerulein induction leads to the activation of inflammatory cascade with elevated abundance of p-STAT3, TNF-α, and LC3 in WT (n=3-6) and Hpa- Tg (n=4-16) mice. *, p<0.05, **, p<0.01***, p<0.001 compared to saline group; #, p<0.05 ##, p<0.01, ###, p<0.001 compared to cerulein group; $, p<0.05, $$, p<0.01, $$$, p<0.001 compared to combination group.
Figure 11.
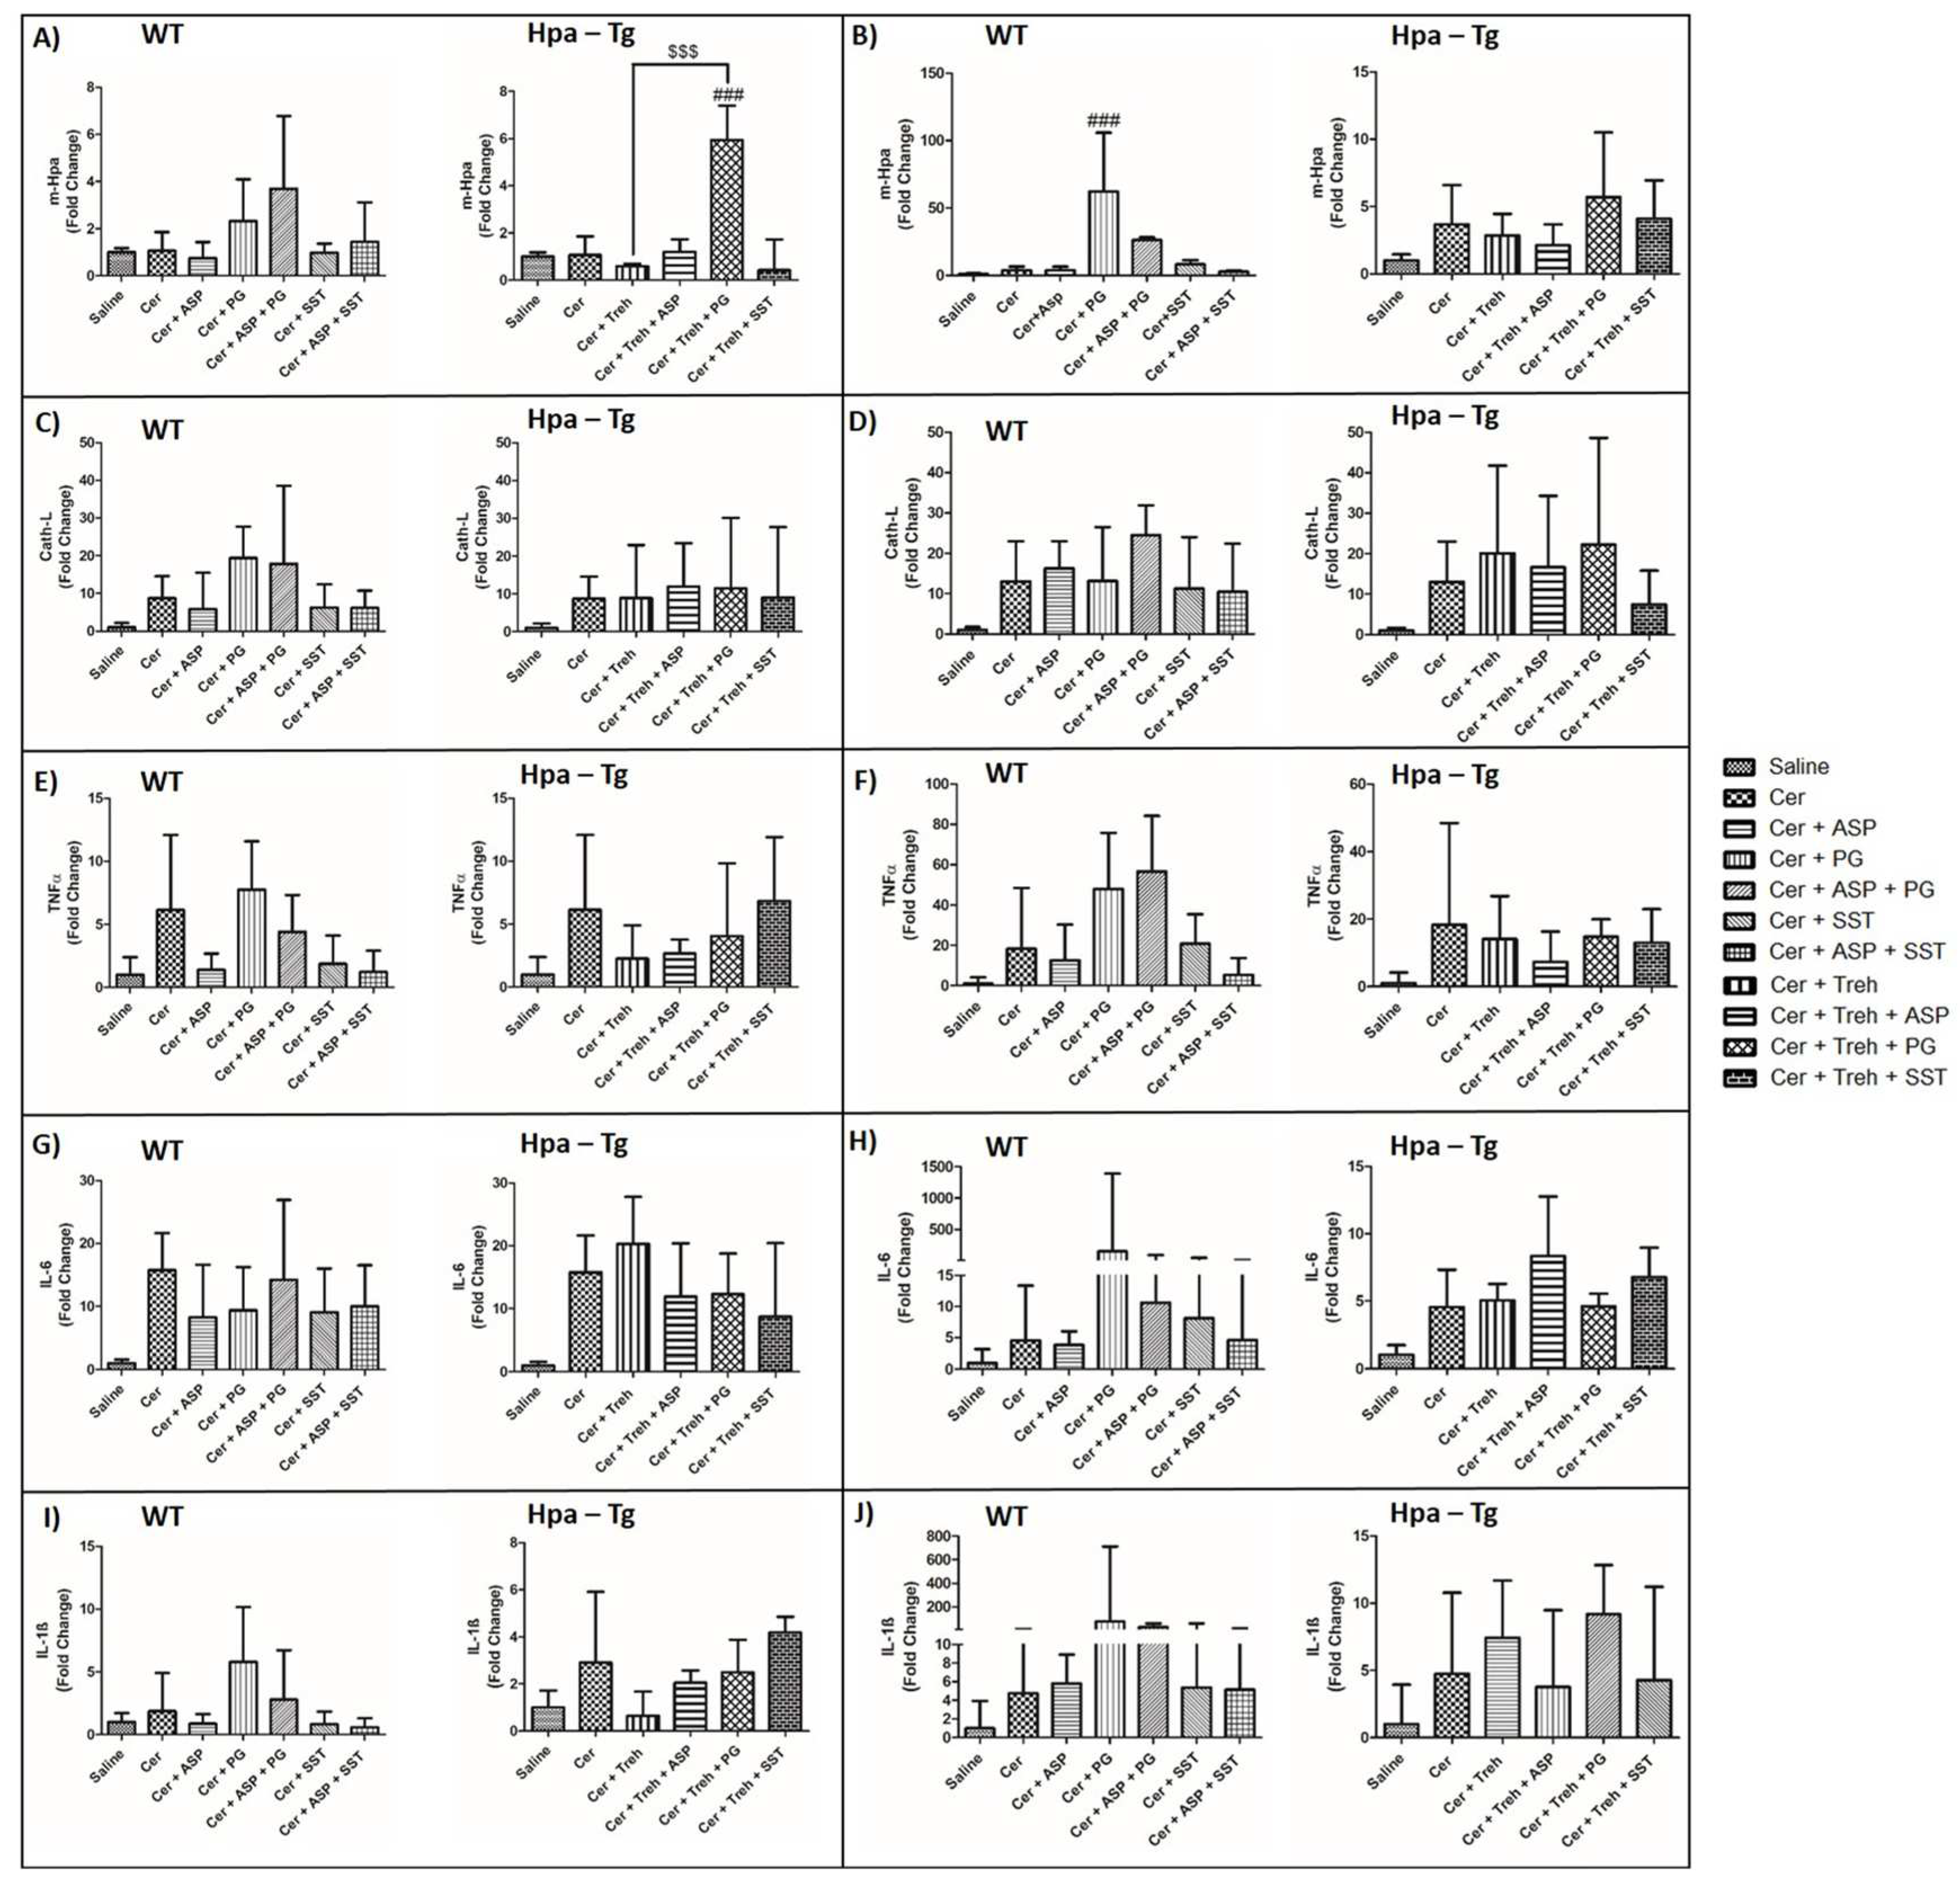
Expression of inflammatory cytokines during AP in WT and Hpa-Tg mice. Total RNA was extracted from WT (n= 3-10) and Hpa- Tg mice (n= 3-11) corresponding pancreas tissues and subjected to real-time qPCR analyses applying primers specific for Hpa (A,B), CathL (C,D), TNFα (E,F), IL-6 (G,H) and IL-1β (I,J). Relative gene expression (fold-change) is shown graphically in relation to the levels in control pancreas as set arbitrarily to a value of 1. #, p<0.05 ##, p<0.01, ###, p<0.001 compared to cerulein group; $, p<0.05, $$, p<0.01, $$$, p<0.001 compared to combination group.
Figure 12.
Effects of Aspirlose on experimental AP in WT and Hpa-Tg mice. Upper panel describes serum levels of amylase (A,D), lipase (B,E) and pancreatic index (Pancreas/Body weight ratio) (C,F) in WT and Hpa-Tg mice subjected to cerulein-induced AP. Blood samples were collected and evaluated biochemically for lipase and amylase levels from control untreated WT (saline, n=6-7 ) or Hpa-Tg (saline, n =3) mice; cerulein treated WT (cer, n = 8-9) or Hpa- Tg (cer, n = 3) mice; Cerulein + Aspirlose Mono-ester treated WT (cer + Mono-ester, n=8) or Hpa- Tg (cer + Mono-ester, n=3) mice; Cerulein + Aspirlose Dimer-ester treated WT (cer + Dimer-ester, n=8) or Hpa- Tg (cer + Dimer -ester, n=3) mice. Pancreases samples from the above mentioned groups were collected and weighted. #, p<0.05 ##, p<0.01, ###, p<0.001 compared to cerulein group; $, p<0.05, $$, p<0.01, $$$, p<0.001 compared to combination group.Lower panel presents H&E staining of WT and Hpa-Tg mice injected with either saline or cerulein in the presence or absence of Aspirlose as mono-ester or dimer-ester (G). N = infiltration of neutrophils, S = bubble shape bodies. Shown are representative photomicrographs in scale of 100µM (G).
