Preprint
Article

Obesity Effect On The Respiratory Parameters In Osas Children

Altmetrics

Downloads

72

Views

31

Comments

0

A peer-reviewed article of this preprint also exists.

Submitted:

02 October 2023

Posted:

03 October 2023

You are already at the latest version

Alerts
Abstract
A Pediatric Sleep Questionnaire (PSQ) and a recording of the respiratory parameters with a noc-turnal home cardiorespiratory polygraphy (PG) are necessary to diagnose OSAS. Few researchers have studied how obesity could influence the respiratory parameters in OSAS children. The aim of the study was to investigate how obesity can influence sleep respiratory parameters in OSAS children. Methods: The study analyzes 56 Caucasian children and adolescents aged 11 ± 2.79 years with a BMI> 5th percentiles and PSQ value of 0.33. Children were divided into the Obesity Group (OG) with a BMI of  95th and the Control Group (CG) with a 5th<BMI> 95th percentile. All selected children underwent PG. Respiratory parameters were extracted to divide into levels of severity OSAS: snoring, mild, moderate, and severe. Results: The comparison analysis of AHI, SaO2, and Nadir between the OG and CG showed a statistical significance only for ODI (p = 0.02). The comparison analysis of PSQ between the OG and CG and of PSQ and respiratory parameters showed no significant result. A statistically significant correlation between BMI and AHI (r2=0.01), SaO2 (r2=0.09), and Nadir O2 (r2=0.00) was found. Conclusion: There was no strong correlation between Obesity and OSAS, but it was found between BMI increasing and AHI severity
Keywords: 
Subject: Biology and Life Sciences  -   Life Sciences

1. Introduction

Childhood obesity is now acknowledged as a major pediatric health issue. It is mainly associated with a range of significant health and social problems (e.g., diabetes, hypertension, peer rejection), moreover, evidence shows that childhood obesity might also be a significant risk factor for obstructive sleep apnea syndrome (OSAS) [1]. The American Academy of Pediatrics (AAP) defined Obstructive Sleep Apnea (OSA) as “a disorder of breathing during sleep characterized by prolonged partial upper airway obstruction and/or intermittent complete obstruction (obstructive apnea) that disrupts normal ventilation during sleep and normal sleep patterns” [2]. OSA affects about 2% of the pediatric population, it is more commonly seen amongst males than females [3], and usually occurs between 2 and 8 years old, in association with the peak tonsil growth, due to the relative size of the Waldeyer ring lymphatic tissue. Many risk factors might contribute, through a reduction or collapse of the upper airways, to the pathogenesis of OSAS. Amongst these, might be counted obesity, adenoid and/or tonsil hypertrophy, allergic rhinitis, craniofacial abnormalities, genetics (such as Down, Prader-Willi and Beckwith-Wiedmann), and inflammatory diseases [4]. Different studies showed that overweight or obese children have a 24 - 61% higher risk of developing OSAS compared with normal-weighted children [3,4]. Each increment in Body Mass Index (BMI) above the 50th percentile is associated with around a 10% increased risk. The reported association between OSAS and body mass among children appears to vary according to factors such as ethnicity, the presence of adenotonsillar hypertrophy, and socioeconomic status [5].The physiological effects of obesity on the respiratory system are expressed by an increased mass effect on the upper airway, deposition of fat in the pharyngeal muscles, decreased chest wall compliance, displacement of the diaphragm, and blunting of central respiratory drive, all increasing the potential severity of OSAS [1]. In obese children diffuse adiposity might lead to airway collapse during sleep causing the onset and severity of OSAS, an altered and short-lived sleep, might lead to an increase in appetite and body mass index (BMI) creating a vicious cycle. Indeed, it has been hypothesized that OSA contributes to obesity and vice-versa [6]. The diagnosis of pediatric OSAS is divided into several stages, the first one is a detailed collection of specific signs and symptoms, amongst them, snoring is quite common (2-3% of children with snoring suffer from OSAS) [7]. Unfortunately, amongst children, a clear correlation cannot be easily found when it comes to comparing daytime signs and clinical assessment, so that, could potentially lead to confusion [4]. The specialist should carry out specific and selective tests, also in case of mild symptoms and risk factors and the literature offers a wide variety of specific tests leading to diverse predictability. The Pediatric Sleep Questionnaire (PSQ) is one of the most reliable: a range of sensitivity from 0.81 and 0.85 and a specificity of 0.87 for PSG-defined OSAS, definitely better than other published questionnaires [8].It is a valid test for identifying children affected by OSAS with an apnea-hypopnea index (AHI) > 5 following the last guidelines [9,10,11]. It consists of 22 symptom items, including a 9-item breathing subscale, a 2-item sleepiness subscale, a 6-item behavior subscale, and a 5-item another subscale including questions about weight, rate of growth since birth, nocturnal enuresis, ability to awaken and feeling unrefreshed in the morning. Both sensitivity and specificity are high when 8 or more answers to the 22 question items are positive [12]. Once the suspected diagnosis of OSAS has appeared through first-level screening, it is necessary to evaluate sleep respiratory parameters with an exam as the Polysomnography (PSG).Polysomnography is the gold standard test to record parameters of the Apnea-Hypopnea Index (AHI), a Saturation of Oxygen (SaO2), and Desaturation of Oxygen (ODI) and Nadir, in order to perform a diagnosis [8], to evaluate the severity, to predict postoperative complications and the persistence of sleep breathing disorders after treatment. Due to the costs involved and the need for hospitalization, it unfortunately cannot be considered a routine exam [4]. The nocturnal home cardiorespiratory Polygraphy (PG) might be used for OSA diagnosis as an alternative to PSG [13]. It is a home-portable system to obtain measurements of airflow, snoring, chest and abdominal wall movements, heart rate, electrocardiography (ECG), position, and pulse oximetry. However, PG detects apnea and/or hypopnea and respiratory effort but does not allow to distinguish sleep from wakefulness and to facilitate sleep staging. The affordability, the non-hospitalization requirement, and taking into consideration that it can be performed in the patient’s normal bed in an accustomed environment, which allows for a more physiologically relevant study, especially in children are the advantages of this exam [14]. Adenotonsillar hypertrophy is a major risk factor for pediatric OSA. However, several studies have reported that the disorder is more likely to persist in children with overweight/obesity after adenotonsillectomy compared with children with normal weight, indicating that obesity is the key to the pathogenesis of OSA [15]. In literature, several articles have examined the correlation between obesity and OSAS and the emerged conclusions are often discordant. In 2012, the American Academy of Pediatrics (AAP) published an OSA guideline that recommends weight reduction in obese children, even though only some works have found and reported a significant association between weight change and polysomnography (PSG) parameters increased [8,10]. A review by Gulotta [4] et al. reported that few papers have investigated obesity as a risk factor and how it can influence AHI in OSAS children; moreover, the results are very discordant [1,3,16,17]. So, it is clear that obesity is a risk factor for OSAS in children, but the literature is not aware of how much this condition directly influences the respiratory parameters and the children's daily lives. Perhaps, the purpose of the study is to investigate how obesity can influence the AHI index and sleep respiratory parameters in OSAS pediatric patients. The primary endpoint is to evaluate how obesity can influence the AHI index and sleep respiratory parameters in OSAS children patients using a non-invasive test as PG. The secondary endpoint is to investigate if PSQ is a valid tool to highlight risk OSAS patients as preliminary screening.

2. Materials and Methods

Approval for this observational epidemiological study was granted by the Institutional Review Board of the University of Campania “Luigi Vanvitelli” and Ethics Committee n.776/2014. Signed informed consent from the parents of all children involved in the study after a detailed explanation of the experimental protocol was achieved. Ninety-one consecutive Caucasian patients were gathered from the Program of Orthodontics, Multidisciplinary Department of Medical-Surgical and Dental Specialties and Department of the Woman, the Child, of General and Specialized Surgery, University of Campania “Luigi Vanvitelli”, Italy between January 2019 and January 2020. All the children’s parents filled out the Pediatric Sleep Questionnaire (PSQ) (Figure 1). The questionnaire was proposed to parents after translation from English to Italian, validated by a language native speaker. A cutoff value of 0.33 (33% of the 22 question items were answered positively) was used to assess risk for OSAS [8]. We established a binary system in which the affirmative answers corresponded to 1, the negative corresponded to 0 and if the parents didn’t know, the response was missed.
The inclusion criteria were:
-
age: 8 and 14 years
-
BMI > 5th percentile
-
PSQ value ≥ 0.33
Patients recruited in the sample had an age range starting from 8 years in order to eliminate the interference that the tonsillar peak growth may have [4]. Patients with BMI ≤ 5th percentile, non-alimentary obesity, a medical history of acute or chronic cardiorespiratory or neuromuscular diseases, dimorphism, major craniofacial abnormalities, or associated craniofacial syndromes were excluded.
Of the 91 initial patients, 5 fulfilled one of the exclusion criteria (n.1 had a craniofacial syndrome and n.4 had hormonal abnormalities leading to obesity) and 18 did not wish to participate in the study.
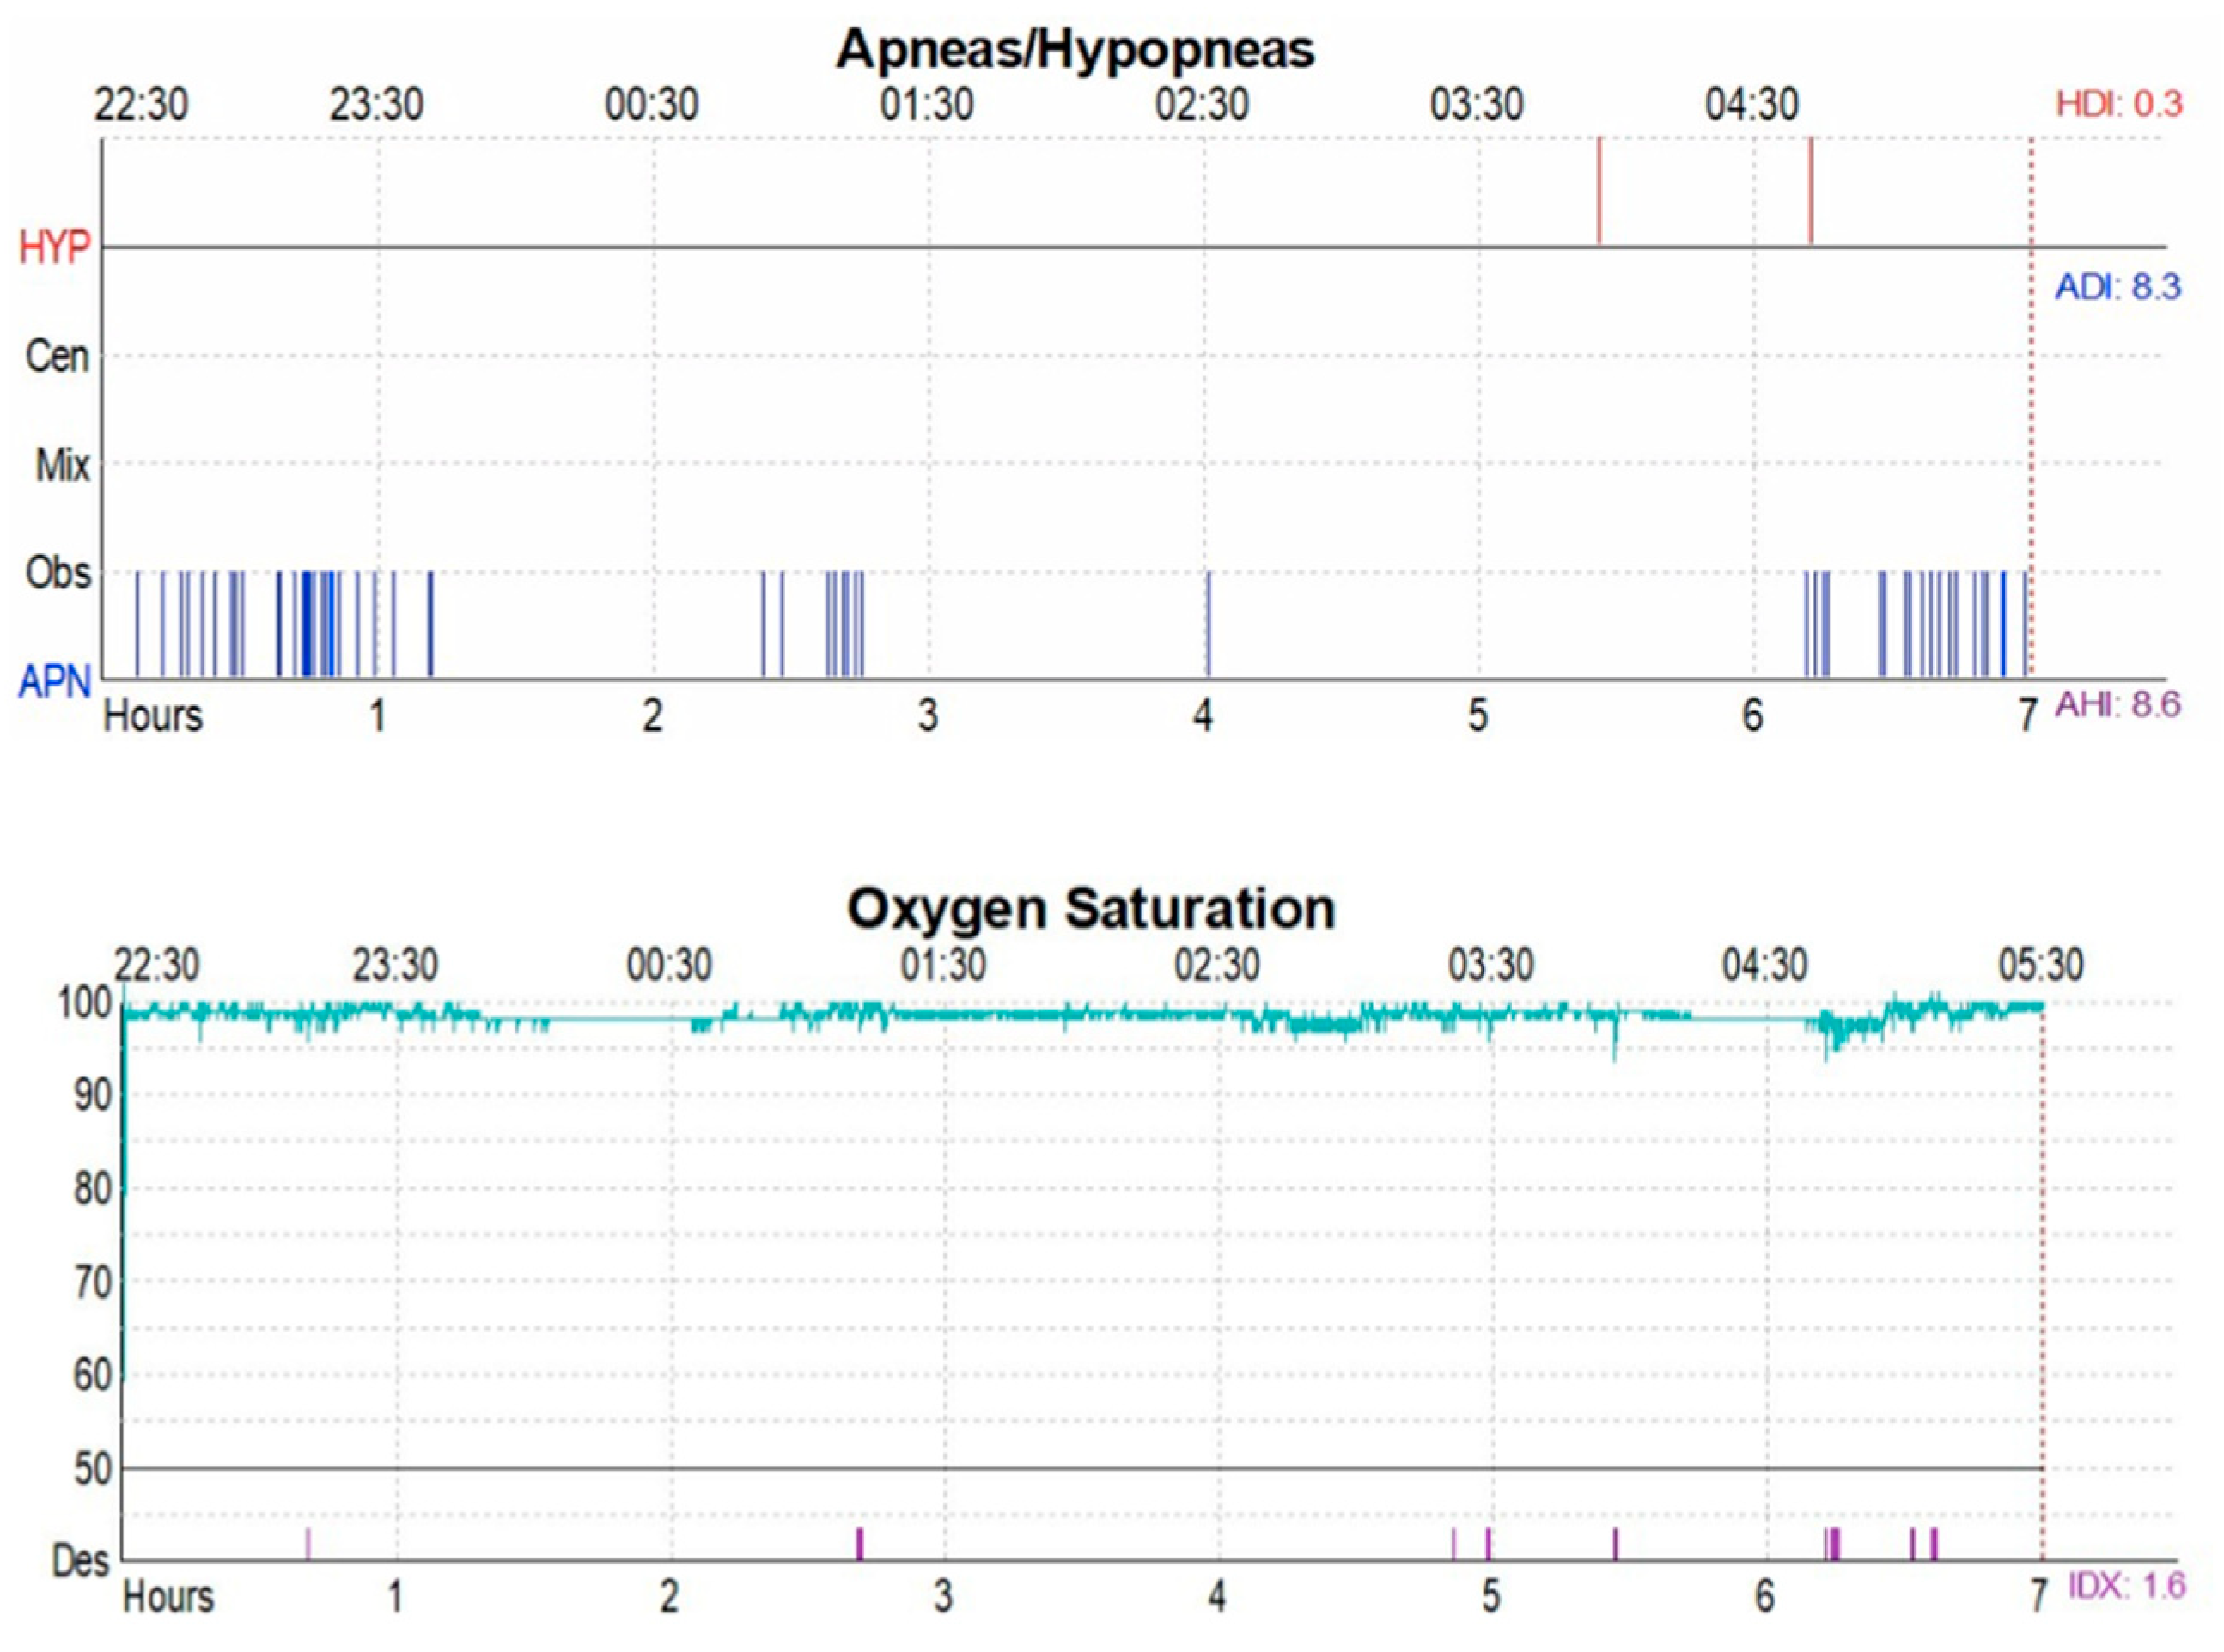
All selected children underwent a Nocturnal Home Cardiorespiratory Polygraphy (PG). A technician operator instructed the parents on the time when the child was to sleep and set the registration for nine hours. The following parameters were recorded simultaneously: airflow, snore, chest and abdominal efforts parameters, electrocardiography (ECG), body position and oximetry. The respiratory parameters AHI, Sao2, ODI and Nadir were extracted from the report (Figure 2) and stored creating an Excel file (Microsoft corporation, California). To avoid inter-observer variability all sleep examinations were analyzed manually by the same technician programmed. The samples were divided into four levels according to with OSAS severity using the AHI parameter. Snoring with AHI was ≤ 1; Mild OSA with AHI > 1and ≤ 5; Moderate OSA with AHI > 5 and < 10; Severe OSA with AHI ≥ 10 [11]. Twelve children and adolescents were excluded because of inadequate signal quality/sleep time < 3.75 h. or signal quality <90%. The final sample included 56 patients.
Children who met the study criteria were divided into two groups: Control Group (CG) with 5h < BMI > 95th percentile and Obesity Group (OG) with BMI 95th [18].
Demographics and clinical characteristics of study participants were described using means with standard deviations (SDs), medians with ranges, and frequencies with percentages as appropriate. The sample size was calculated through G*Power 3.1.9.6 for Mac OS imposing 3 different settings, a single tail, an effect size equal to 0.5, an error probability ratio equal to 0.2, and a power level of 0.8. A score of 0.33 was used to clinically suggest the risk for OSA, and this value was then used to calculate the sensitivity and specificity of the PSQ score to correctly identify OSA. Internal consistency of the PSQ was assessed using Spearman Rho coefficients. The Fisher exact test was used to test differences in categorical variables between those at high risk and those at low risk. Correlations between the outcomes, PSG parameters (eg, AHI, Sa O2, Nadir O2), PSQ items (including total PSQ score), and physical exam findings were assessed using Spearman Rho coefficients. The univariate analysis of categorical data was compared using a χ2 test and all risk factors with p 0.05 were included in multiple analyses conducted using logistic regression. All statistically significant factors were reported as ORs (odds ratios) with 95% CIs. A two-sided p-value of 0.05 was considered statistically significant and all analyses were performed using SAS version 9.4. Dahlberg’s D was calculated to quantify the measurement error, and Student’s t-test for paired data to identify any systematic error.

3. Results

In this study were enrolled, 56 Caucasian children and adolescents (30 males and 26 females, aged 11 ± 2.79 years). The demographic and anthropometric characteristics of the sample are shown in Table 1. Based on BMI, in the sample, 41.1% of children were in the Control Group (5h<BMI> 95th), while 58.9% were in the Obesity Group (BMI95th). The two groups differed significantly in Z-score BMI: they showed a value of 0.63 in the Control Group and 3.77 in the Obesity Group (p = 0.00). After PG evaluation, of 56 total patients evaluated, 14.3% of cases showed snoring, 33.9% mild OSAS, 32.2% moderate OSAS and 19.6 % severe OSAS. Regarding OSAS parameters, the two groups differed significantly only for ODI: they showed respectively a value of 9.67 and 3.72 (p = 0.02) (Table 2).
  • Comparison analysis of PSQ between the Obesity Group and in Control Group
The comparison analysis of the PSQ between the two groups showed a higher value of the questionnaire of the Obesity Group than in the Control Group, but the difference showed no significant result (p=0.15) (Table 3).
  • Correlation analysis of PSQ with Z-score BMI and respiratory parameters
The correlation analysis of the PSQ shows no significant result with Z-score BMI (r =0.02). In the same way, our analysis of the correlation between PSQ and the severity of OSAS (AHI r = 0.02) and other respiratory parameters (SaO2 r = 0.01, ODI r = 0.03, Nadir O2 r = 0.02) showed no significant result (Table 4).
  • Correlation analysis between BMI and respiratory parameters
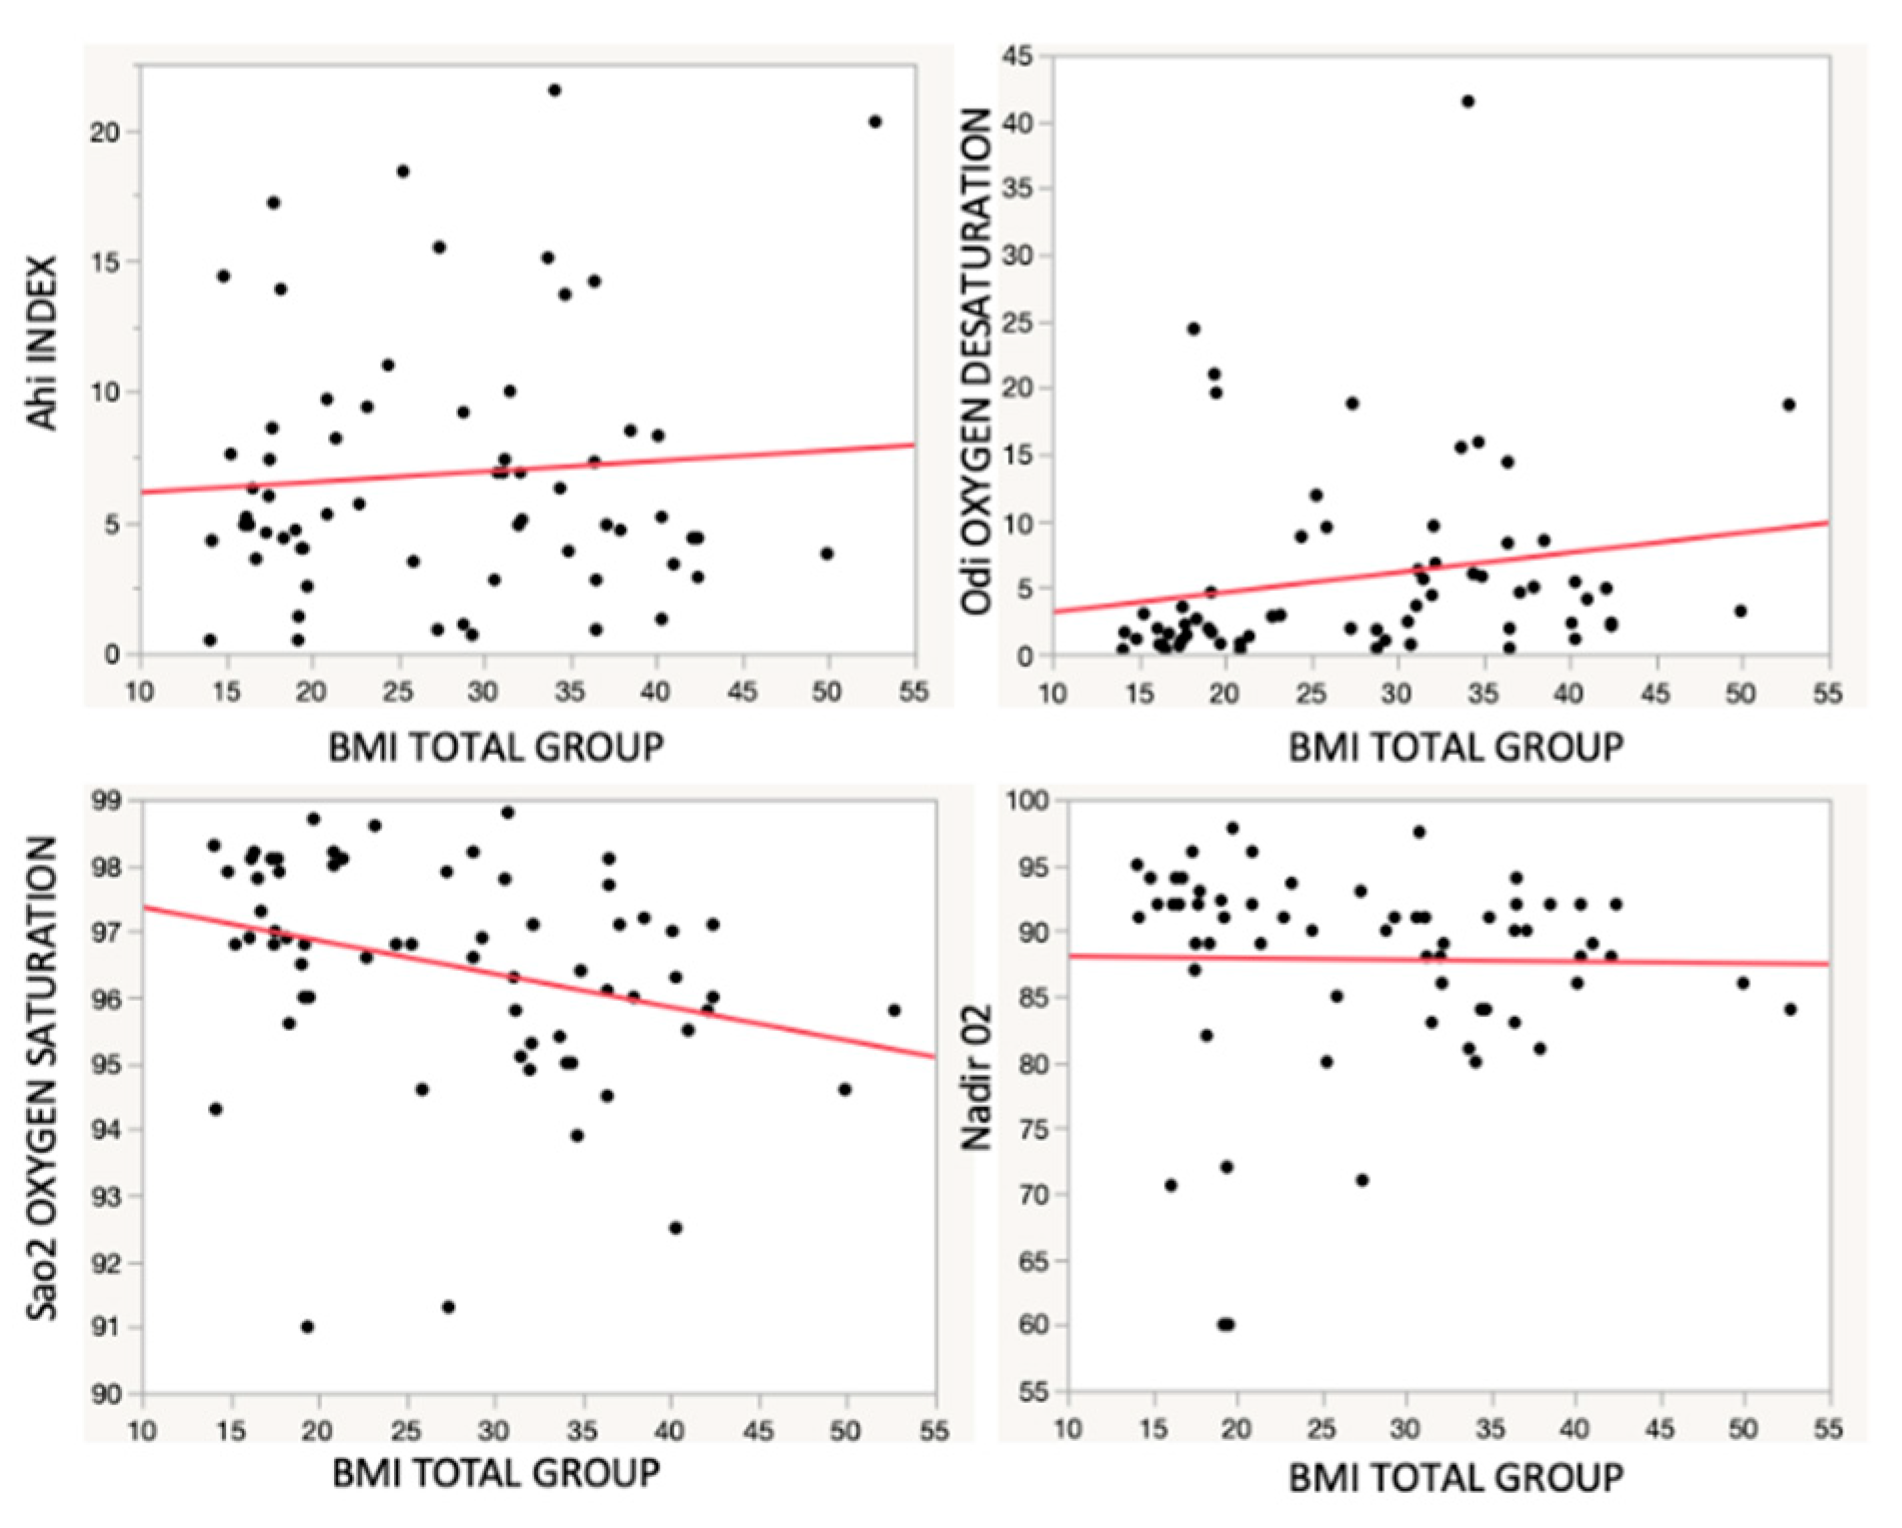
In the logistic regression model with 56 children, the slope of the line showed the trend of the respiratory parameters according to Z-score BMI (Figure 3).
There was a statistically significant direct correlation between AHI and Z-score BMI. Moreover, the slope of the line showed that an increase in Z-score BMI equaled an average decrease in the SaO2, it was statistically significant.
The linear regression analysis with ODI illustrated that there was no correlation with a Z-score BMI. Finally, it was found that there was a statistically significant correlation between Z-score BMI and Nadir O2. (Table 5).
  • Distribution of the entity of OSAS and SaO2
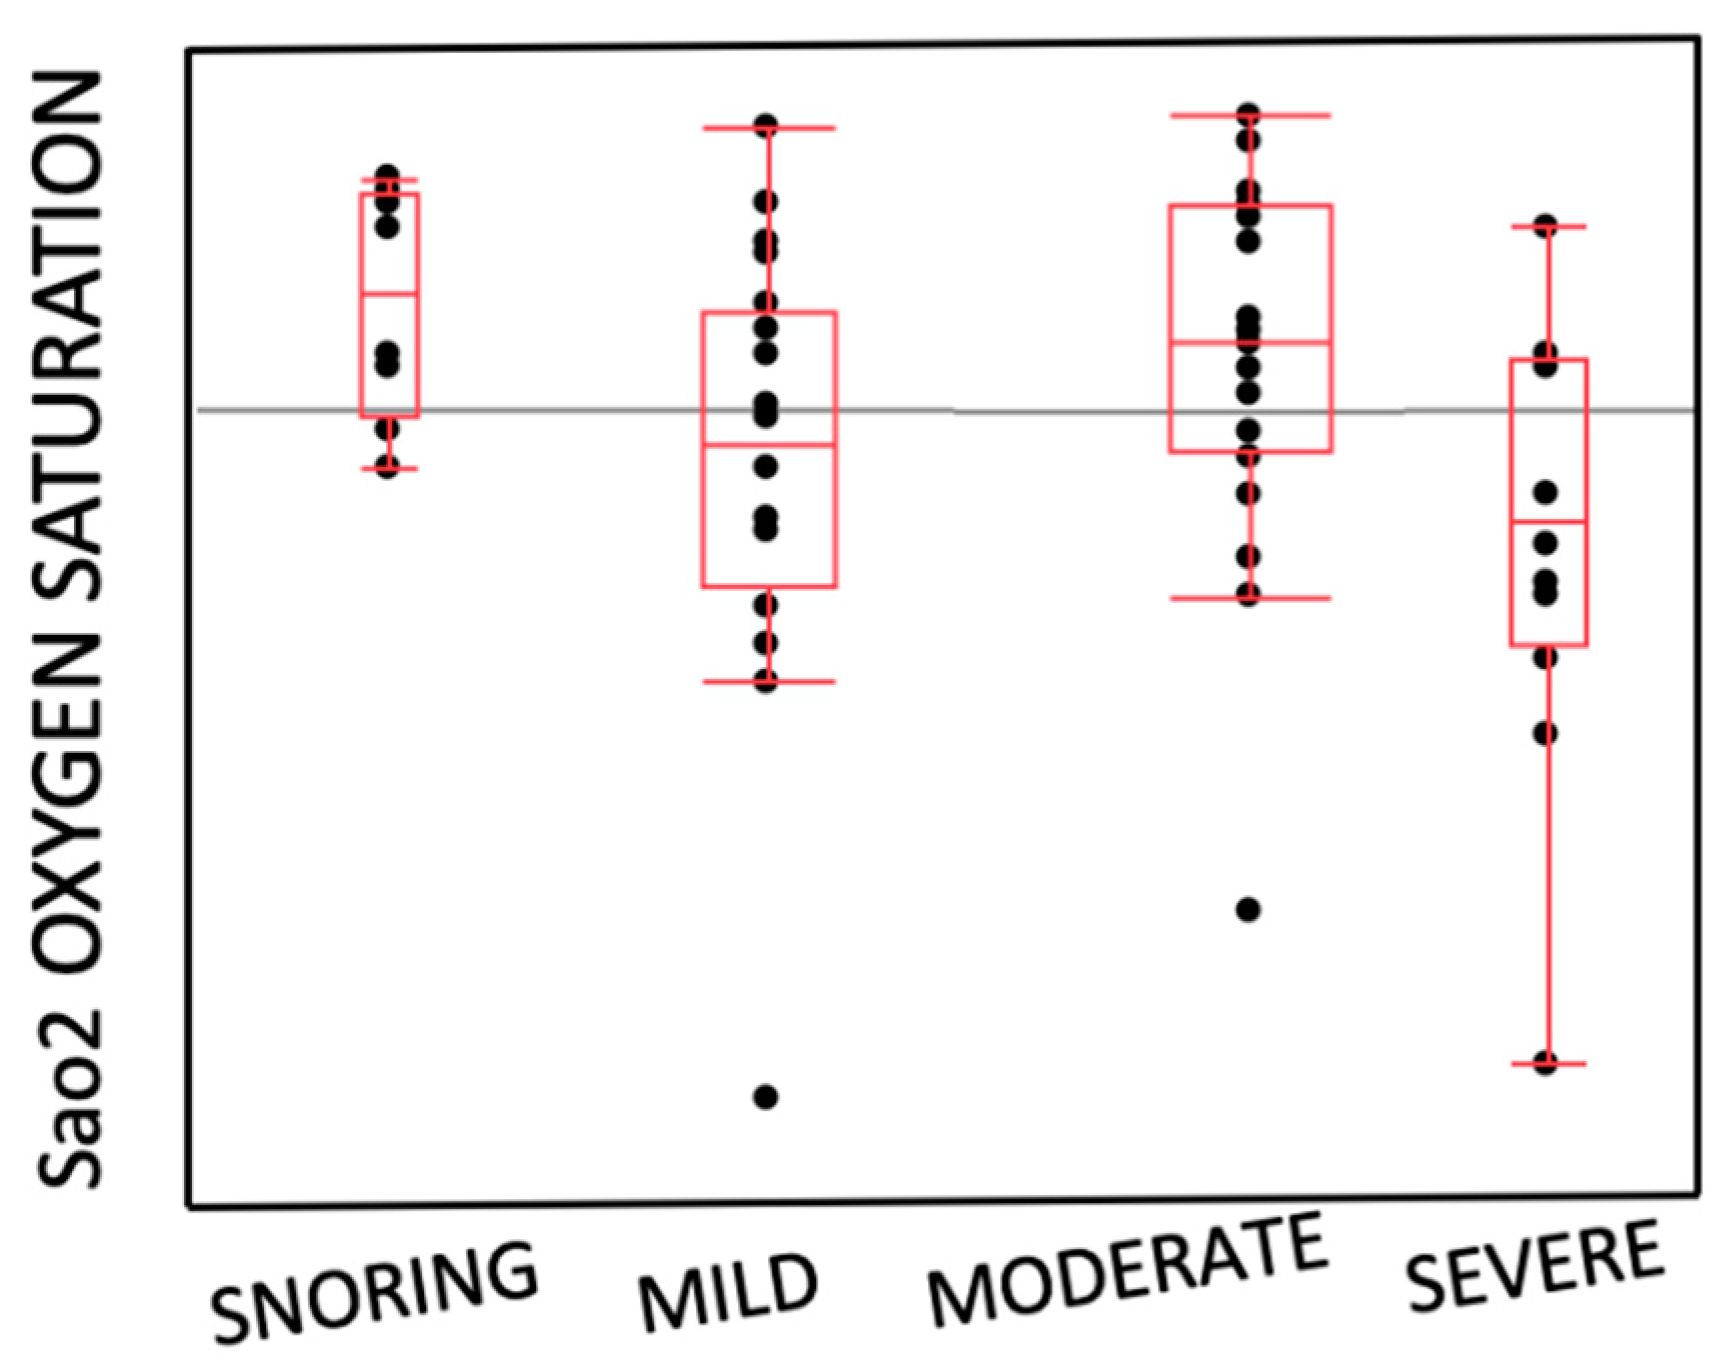
The box and whiskers plot reported a different distribution of the SaO2 parameter between the different entities of OSAS.
As shown in the diagram, simple snoring keeps the saturation levels above the median, having an average value very similar to normal.
The severe OSAS reported saturation of oxygen almost completely below the median, thus indicating a very low saturation of O2. Conversely, the mild and moderate OSAS severity classes do not sit above or below the median, giving no precise reference of SaO2 (Figure 4).

4. Discussion

The aim of the study was to investigate how obesity might influence the AHI index and sleep respiratory parameters in OSAS children.
The physiological effects of obesity on the respiratory system are expressed by an increased mass effect on the upper airway, deposition of fat in the pharyngeal muscles, decreased chest wall compliance, displacement of the diaphragm, and blunting of central respiratory drive, all increasing the potential severity of OSAS, a decrease in oxygen saturation and an increase in oxygen desaturation. [1].
Andersen investigated the impact of obesity treatment on OSA in children and adolescents, indicating that obesity treatment should be considered among the first-line treatments. He reported an association between BMI reduction and AHI reduction after approximately six months of treatment [19].
In literature it has been reported that 1 kg/m2 beyond the mean BMI for age and gender, can increase the risk of OSA by 12 % [6] and children older than 12 years old, show an increased risk of OSAS in association with overweight and obesity in adulthood [20,21].
We hypothesized that obese children might have a greater risk of being affected by OSAS than the average population and a positive correlation between the degree of obesity and the severity of OSAS. Our statistical analysis was conducted comparing the severity of OSAS and respiratory parameters of the Obese Group and the Control Group (Table 2). In our comparative analysis, the Obese Group showed a lower saturation average, an higher ODI value and a lower NADIR O2 value than the Control Group. Only ODI showed a statistically significant difference, indicating that the obese group had a number of desaturations over 4% higher than the Control Group. Furthermore, the Obese Group showed a higher value of AHI but the difference with the Control Group was not statistically significant. Conversely, in our regression analysis (Figure 3), a statistically significant worsening of AHI was found with an increase in Z-score BMI. The different results between the two analyses could depend on a bias of the comparative analysis between two groups, which differ greatly in number, unlike correlation analysis which does not depend on the size of groups.
However, this result is supported by several studies Xu et al, Koehler et al and Andersen et al. [1,19,22]. In the study of Xu [22], obesity was positively related to the number of obstructive apnea/hypopnea events and was inversely related to arterial oxygen saturation drops in obese children [23].
The correlation analysis of Kohler et al indicated that children with a higher BMI-z score demonstrated a significantly higher number of obstructive events during sleep and a lower Nadir O2 [1].
Andersen et al showed that an increase in the BMI SDS of one unit equaled an average increase in the AHI of 57%. However, a direct comparison with other studies is difficult due to the inconsistency in the definition of respiratory events included in the AHI and because there is no consensus regarding the AHI cutoff value defining OSA. Moreover, the definition of overweight/obesity varies between studies.
We conducted the correlation analysis to verify the value of the respiratory parameters according to the increase in BMI. (Figure 3, Table 5).
Our statistical analysis showed a linear statistically significant decrease in SaO2 values and a constant correlation value of Nadir O2 with increasing BMI, statistically significant.
This could mean that in obese children the lower saturation value remains almost constant and no severe dangerous respiratory crises could happen.
The linear analysis between BMI and ODI showed a positive correlation but was not statistically significant; this result may be explained by the presence of a non-large sample size enough to detect the significance of all parameters. Carroll et al. cautioned that clinical assessment alone was insufficient for the diagnosis of OSAS [8,10] and a meta-analysis published in 2004 by Brietzke et al. reached the same conclusion [23]. Since these findings, various tools have been designed to optimize the screening of these patients, including questionnaires and clinical scoring scales [7]. The Pediatric Sleep Questionnaire (PSQ) is one of the most reliable: a range of sensitivity from 0.81 and 0.85 and a specificity of 0.87 for PSG-defined OSAS, definitely better than other published questionnaires.
Our study conducted a comparative analysis of the PSQ between the two Groups; PSQ values emerged higher in the Obese Group as they reflect a higher symptomatic stage reported by patients and parents, but not a significantly different value of the data was reported (Table 3).
It is important to highlight that, the investigation through the questionnaire could potentially be limited by the fact that isn’t filled by the children themselves but by their parents, who don’t always spend the night sleeping with their kids, and have little knowledge of the actual sleeping behavior [6]. This could obviously bring out a bias in both groups. Furthermore, this result may be explained by the presence of a non-large sample size enough to detect the significance of PSQ.
In any case, PSQ should be considered a valid tool of initial screening for parents, teachers, and clinicians to focus their attention on the behaviors and habits of the child, and to prevent the risk of more serious consequences. So, to obtain the maximum output using PSQ as a screening tool, all the children with a score > 0.33 should be addressed to sleep nocturnal monitoring, like a PG, to obtain an adequate diagnosis of OSAS and evaluation of the respiratory parameters of patients. We unfortunately did not have the possibility to perform full PG, so the information about arousals and sleep architecture was not acquired and this could potentially result in an underestimation of the respiratory parameters.
Another analysis evaluated the distribution of SaO2 amongst the various OSAS severity classes (Figure 4).
In snoring subjects was reported a value of SaO2 above the median, this means that it was very close to the normal range so the result was not dangerous.
In mild and moderate OSAS, the distribution of SaO2 values did not follow a specific trend, indicating the need for maximum attention to monitoring the parameter during the diagnosis procedure.
Differently from the previous ones, in subjects with severe Osas, the SaO2 values were well below the threshold These data must always be compared, however, with those of the Nadir. If this parameter maintains optimal values, the health risks are contained, if instead, its values were to be reduced, this condition would be extremely dangerous.
OSAS in children is a condition with a multifactorial etiology. The clinicians should be alert to the coexistence of nocturnal symptoms reported by parents, such as snoring or arousal and daytime symptoms, about a child's academic progress, attention, behavior or emotion regulation, sustained attention, selective attention, and alertness [24,25].
If undiagnosed, OSAS can result in neurobehavioral and cardiovascular complications and growth impairment.
Therefore, it is important to identify risk factors for OSAS with valid tools like PSQ and PG to develop better strategies and managing OSAS.

5. Conclusions

The results of our study have shown that:
-
There was no strong correlation between Obesity and OSAS
-
No statistically significant correlation was found between the results of PSQ of
-
Obesity Group and Control Group and respiratory parameters
-
There was correlation between BMI increasing and AHI severity

Author Contributions

Conceptualization, C.C., L.P and V.G.; methodology, C.C.; software, S.M.; validation, L.P., G.U. and V.G.; formal analysis, V.G.; investigation, C.C.; resources, C.C. and G.U.; data curation, V.G.; writing—original draft preparation, C.C.; writing—review and editing, L.P.; visualization, C.C.; supervision, V.G.; project administration, L.P.; funding acquisition, S.M.

Funding

This research received no external funding

Institutional Review Board Statement

The study was conducted in accordance with the Declaration of Helsinki, and approved by the Institutional Review Board of University of Campania “Luigi Vanvitelli (protocol n.776/2014 ) for studies involving humans.

Informed Consent Statement

Informed consent was obtained from all subjects involved in the study

Conflicts of Interest

The authors declare no conflict of interest.

References

  1. M. Koeler, B. Psych, K. Lushington et al. Obesity and Risk of Sleep Related Upper Airway Obstruction in Caucasian Children. J Clin Sleep Med, 2008, 4(2):129-36. [CrossRef]
  2. L. Nespoli, A. Caprioglio, L. Brunetti et al. Obstructive sleep apnea syndrome in childhood. Early Hum Dev, 2013 , 89 suppl 3:s33/7. [CrossRef]
  3. IG. Andersen, JC. Holm, P. Homøe. Obstructive sleep apnea in children and adolescents with and without obesity. Eur Arch Otorhinolaryngol, 2019, 276(3):871-878. [CrossRef]
  4. G. Gulotta, G. Iannella, C. Vicini et al. Risk Factors for Obstructive Sleep Apnea Syndrome in Children: State of the Art. Int J Environ Res Public Health, 2019, 16(18). [CrossRef]
  5. M. Koeler, Thormaehlen S, Kennedy D et al. Differences in the Association Between Obesity and Obstructive Sleep Apnea Among Children and Adolescents. Journal Clinical of Sleep Medicine, 2009, 15;5(6):506-11. [CrossRef]
  6. MS. Su, HL. Zhang,XH. Cai et al. Obesity in children with different risk factors for obstructive sleep apnea: A community-based study. Eur. J. Pediatr, 2016, 175, 211–220. [CrossRef]
  7. DW. Beebe. Neurobehavioral morbidity associated with disordered breathing during sleep in children: a comprehensive review. Sleep, 2006, 29(9):1115-34. [CrossRef]
  8. RD. Chervin, RA, K.Hedger, J.E.Dillon et al. Pediatric Sleep Questionnaire (PSQ): Validity and reliability of scales for sleep-disordered breathing, snoring, sleepiness and behavioral problems. Sleep Medicine, 2000, 1(1):21-32. [CrossRef]
  9. RD. Chervin, RA. Weatherly, SL. Garetz et al. Pediatric Sleep Questionnaire: Prediction of Sleep Apnea and Outcomes. Arch Otolaryngol Head Neck Surg, 2007, 133:216-222. [CrossRef]
  10. CL. Marcus, LJ. Brooks, SD. Ward et al. Technical Report: Diagnosis and Management of Childhood Obstructive Sleep Apnea Syndrome. Pediatrics, 2012, 130(3) e714-e755. [CrossRef]
  11. GR. Umano, G. Rondinelli, M. Luciano et al. Pediatric Sleep Questionnaire Predicts Moderate-to-Severe Obstructive Sleep Apnea in Children and Adolescents with Obesity. Children, 2022, 27;9(9):1303. [CrossRef]
  12. J. Micheal, MD. Sateia. International classification of sleep disorders-third edition: highlights and modifications. Chest, 2014, 146(5):1387-1394. [CrossRef]
  13. AG. Kaditis, ML. Alonso Alvarez, A. Boudewyns et al. Obstructive sleep disordered breathing in 2- to 18-year-old children: diagnosis and management. Eur Respir J, 2015, 47:69–94. [CrossRef]
  14. JA.Pena-Zarza, B. Osona-Rodriguez de Torres, JA. Gil-Sanchez et al. Utility of the Pediatric Sleep Questionnaire and Pulse Oximetry as Screening Tools in Pediatric Patients with Suspected Obstructive Sleep Apnea Syndrome. Sleep Discord, 2012, 2012:819035. [CrossRef]
  15. IG. Andersen, JC. Holmb, P. Homøea. Obstructive sleep apnea in children and adolescents with and without obesity. European Archives of Oto-Rhino-Laryngology, 2019, 276(3):871-878. [CrossRef]
  16. YK. Wing, SH Hui, WM Pak et al. A controlled study of sleep related disordered breathing in obese children. Arch Dis Child, 2003, 88:1043-1047. 1047. [CrossRef]
  17. R. Arens, S. Sin, K. Nandalike et al. Upper airway structure and body fat composition in obese children with obstructive sleep apnea syndrome. Am. J. Respir. Crit. Care Med, 2011, 183, 782–787. [CrossRef]
  18. S. Barlow. Expert Committee. Expert committee recommendations regarding prevention, assessment, and treatment of child and adolescent overweight and obesity: Summary report. Pediatrics, 2007, 120(4):S164-S192. [CrossRef]
  19. IG. Andersen, JC. Holmb, P. Homøea. Impact of weight-loss management on children and adolescents with obesity and obstructive sleep apnea. Int. J. Pediatr. Otorhinolaryngol, 2019, 123, 57–62. [CrossRef]
  20. S.L Verhulst, H. Franckx, L. Van Gaal, et al. The effect of weight loss on sleep-disordered breathing in obese teenagers. Obesity (silver spring), 2009, 17(6):1178-83. [CrossRef]
  21. ME. De Felice, L. Nucci, A. Fiori et al. Accuracy of interproximal enamel reduction during clear aligner treatment. Prog Orthod, 2020, Jul 28;21(1):28. [CrossRef]
  22. Z. Xu, A. Jiaqing, L. Yuchuan et al. A case-control study of obstructive sleep apnea-hypopnea syndrome in obese and nonobese Chinese children. Chest, 2008, 133, 684–689. [CrossRef]
  23. SE. Brietzke, ES Katz, DW Roberson. Cam history and physical examination reliably diagnose pediatric obstructive sleep apnea/hypoapnea syndrome? A systematic review of the literarure. Otolaringol Head Neck Surg, 2004, 131:827-32. [CrossRef]
  24. Z. Xu, Y. Wu, J. Tai et al. Risk factors of obstructive sleep apnea syndrome in children. Journal of Otolaryngology-Head and Neck Surgery, 2020, 49(1):11. [CrossRef]
  25. E. Dekel, L Nucci, T. Weill et al. Impaction of maxillary canines and its effect on the position of adjacent teeth and canine development: A cone-beam computed tomography study. Am J Orthod Dentofacial Orthop, 2021, 159(2):e135-e147. [CrossRef]
  26. S.Y. Lin, Y.X. Su, Y.C. Wu et al. Management of paediatric obstructive sleep apnoea: A systematic review and network meta-analysis. Int J Paediatr Dent, 2019, 00:1–15. [CrossRef]
  27. C. Guilleminault, R. Korobkin, R. Winkle. A review of 50 children with obstructive sleep apnea syndrome. Lung, 1981, 159(5):275-87. [CrossRef]
  28. ML. Alonso-Álvarez, JA. Cordero-Guevara, J. Terán-Santos et al. Obstructive Sleep Apnea in Obese Community-Dwelling Children: The NANOS Study. Sleep, 2014, 37(5):943-9. [CrossRef]
  29. T. Khosla and CR. Lowe. Indices of obesity derived from body weight and heigh. Nihon Rinsho, 53 Suppl:147-53,1995.
  30. G. Valerio, C. Maffeis, G. Saggese et al. Diagnosis, treatment and prevention of pediatric obesity: consensus position statement of the Italian Society for Pediatric Endocrinology Diabetology and the Italian Society of Pediatrics. Ital J Pediatr, 2018, 31;44(1):88. [CrossRef]
  31. CL. Marcus, “Pathophysiology of childhood obstructive sleep apnea: current concepts. Respir Physiol, 2000, 119:143–54. [CrossRef]
  32. CL. Marcus, LJ. Brooks, KA Draper et al. Clinical Practice Guideline: Diagnosis and Management of Childhood Obstructive Sleep Apnea Syndrome. Pediatrics, 2012, 130;576.
  33. G. Gudnadottir, L. Hafsten, S. Redfors et al, “Respiratory polygraphy in children with sleep- disordered breathing. J Sleep Res, 2019, 28:12856.
  34. M. Cozzani, D. Sadri, L. Nucci et al. The effect of Alexander, Gianelly, Roth, and MBT bracket systems on anterior retraction: a 3-dimensional finite element study. Clin Oral Investig, 2020, 24(3):1351-1357. [CrossRef]
  35. MJ Sateia. International classification of sleep disorders-third edition: highlights and modifications. Chest, 2014, 146(5):1387-1394. 1387.
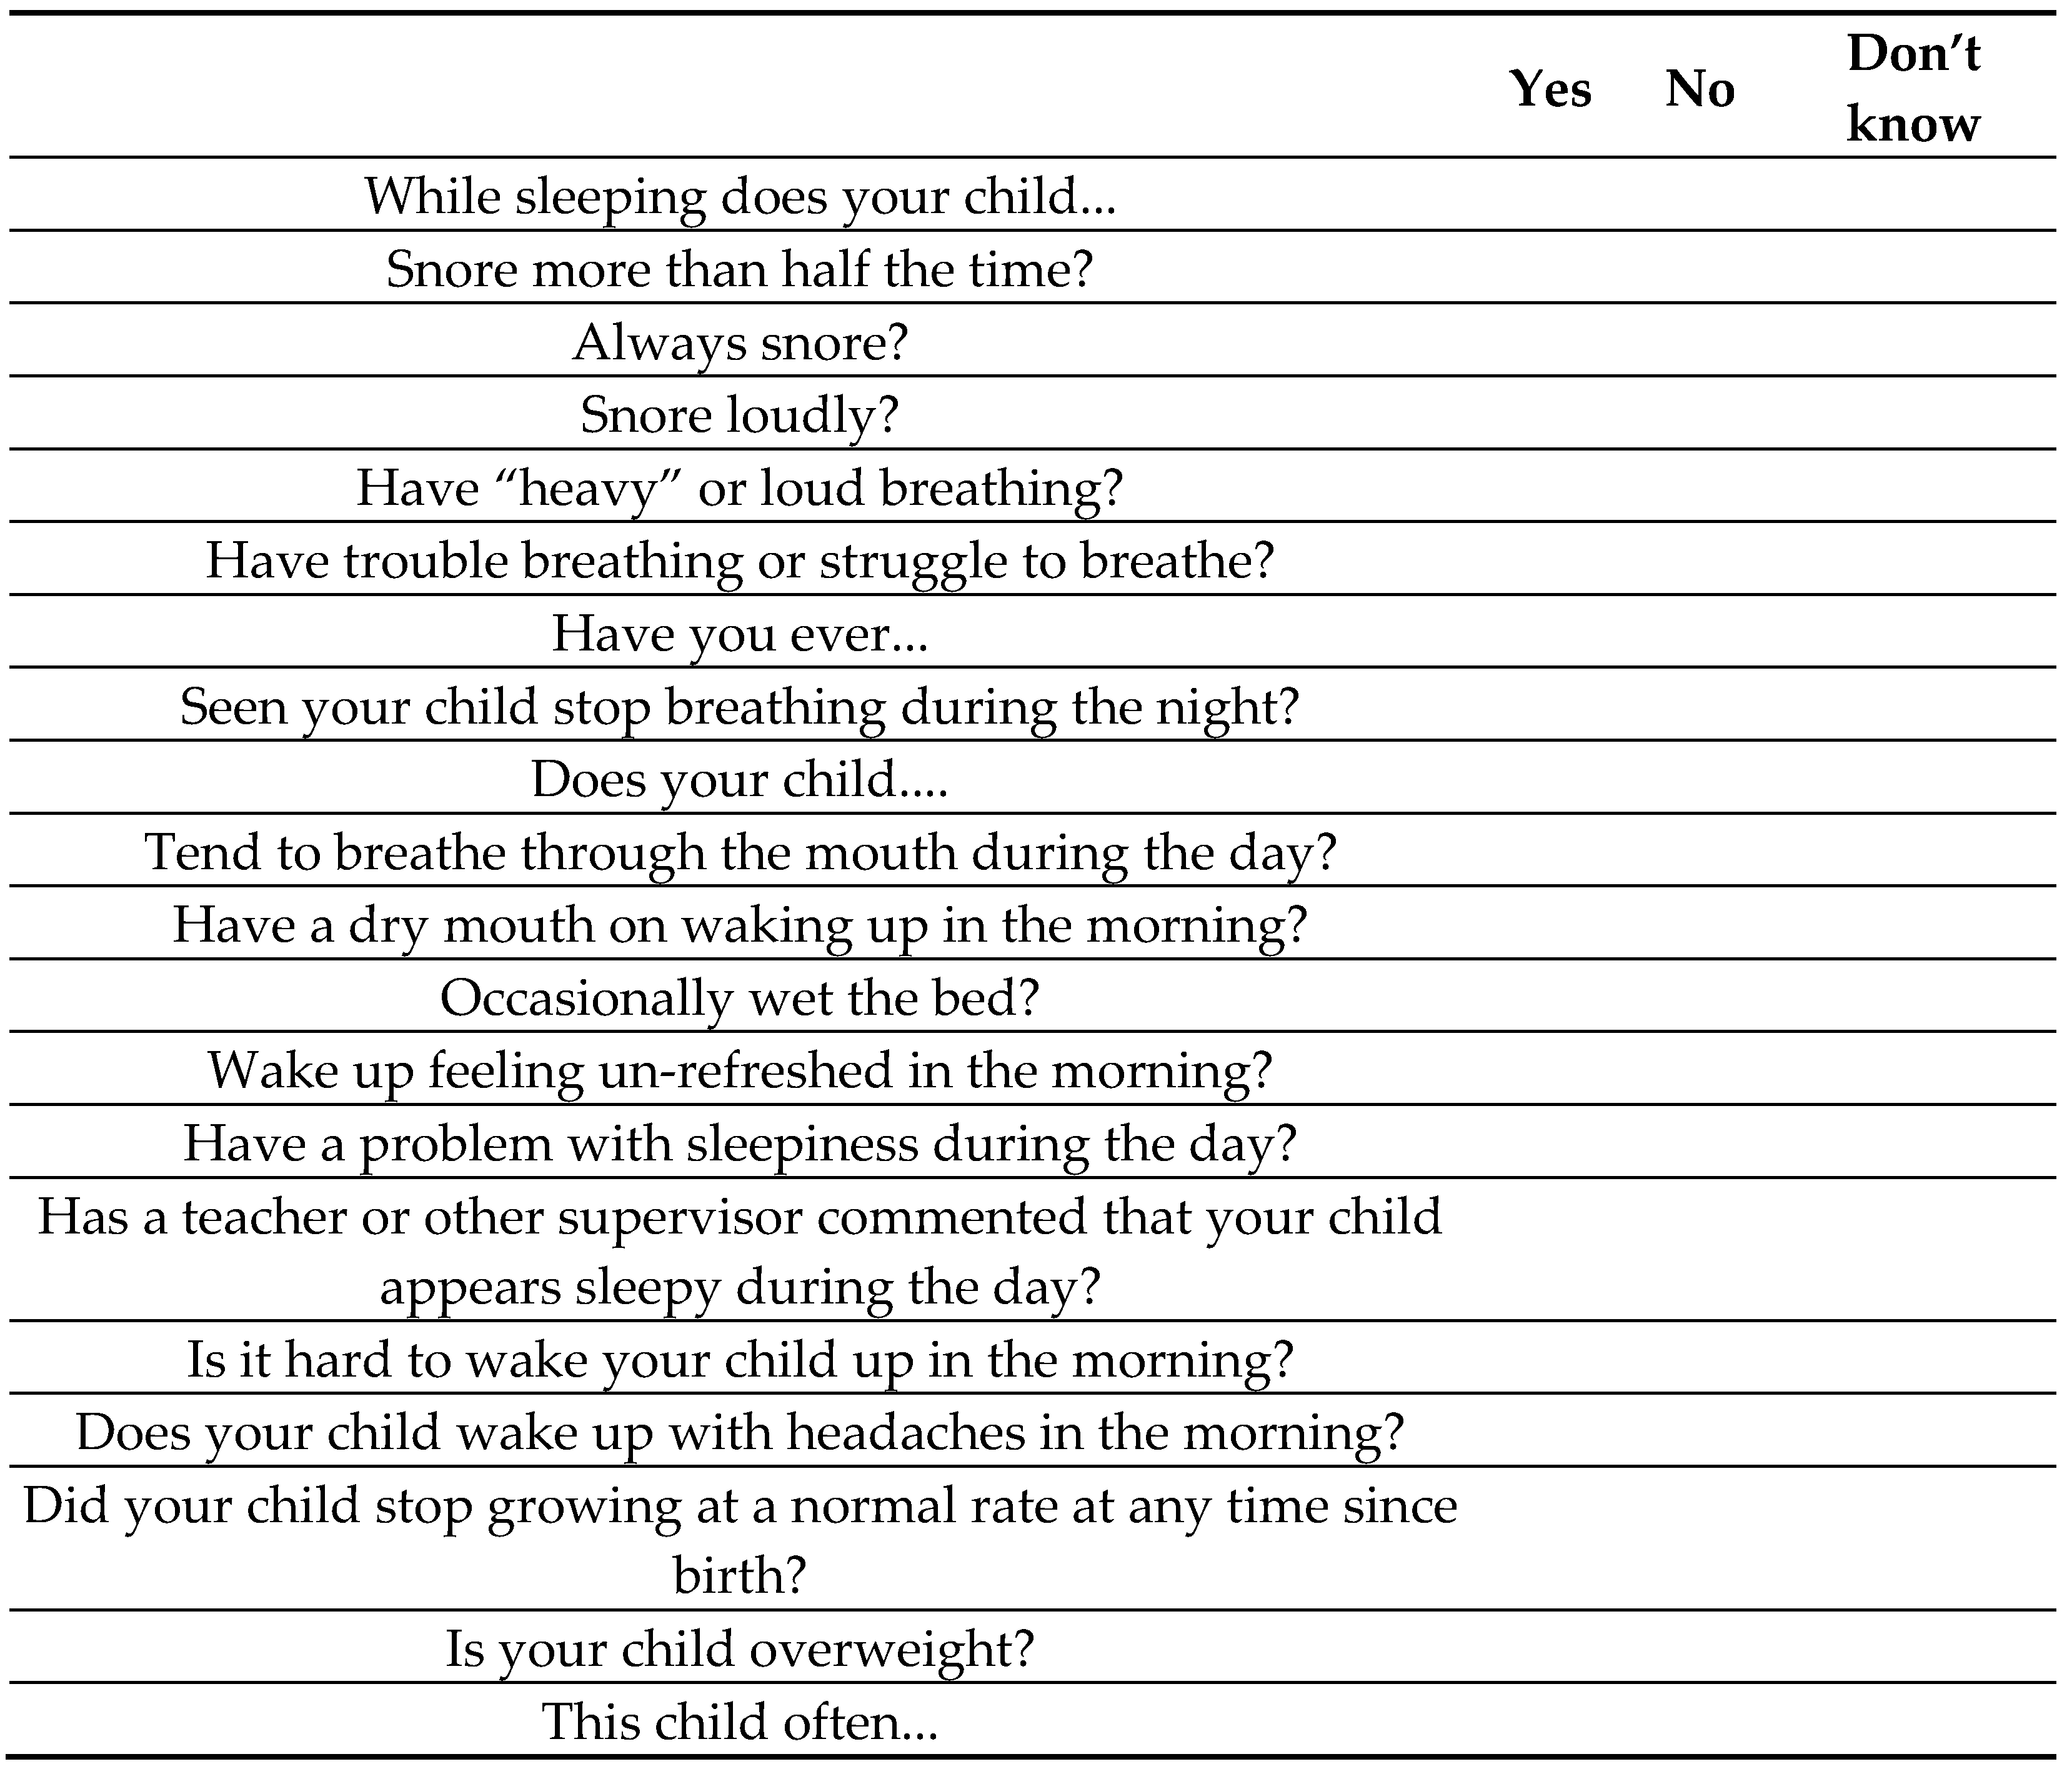
Figure 1. Pediatric Sleep Questionnaire (PSQ).
Preprints 86710 g001aPreprints 86710 g001b
Figure 2. Report of Nocturnal Home Cardiorespiratory Polygraphy.HYP, Hypopnea; APN, Apnea; Cen, Central sleep apnea; Mix, Mixed sleep apnea;Obs, Obstructive sleep apneaHDI, Hypopneas per hour of sleep;ADI, Apneas per hour of sleep; IDX, Oxygen desaturation index.
Preprints 86710 g002
Figure 3. Scatter plot with a simple linear regression line illustrating the relation between Z-score BMI and respiratory parameter.
Preprints 86710 g003
Figure 4. Box and whiskers plot illustrating the relation between the entity of OSAS. (x: AHI) and oxygen saturation (y: Sa02).
Preprints 86710 g004
Table 1. Demographic, anthropometric and OSAS parameters in 56 children and adolescents. SD, standard deviation; BMI, body mass index.
Obesity Group Control Group p
Number 33 23
Male 19 11
Female 14 12
Mean Age± Sd (yrs) 10.47 ± 2.93 8.72 ± 2.25 0.02
BMI± Sd 34.95 ± 7.27 17.69 ± 2.31 0.00
Z-score BMI 3.77 ± 0.87 0.63 ± 0.95 0.00
Table 2. OSAS parameters in 56 children and adolescents.
Obesity Group Control Group p
OSAS SEVERITY 0.97
Snoring (14.3%) 5 (15.2%) 3 (13%)
Mild (33.9%) 11 (33.3%) 8 (34.7%)
Moderate (32.2%) 10 (30.3%) 8 (34.7%)
Severe (19.6%) 7 (21.2%) 4 (17.6%)
AHI 7.04 ± 5.80 6.23 ± 4.31 0.46
ODI 9.67 ± 10.30 3.72 ± 6.29 0.02
Nadir O2 86.45 ± 6.76 88.94 ± 9.40 0.36
SaO2 92.67 ± 1.27 96.2 ± 1.57 0.38
Table 3. Comparison analysis of PSQ between Obesity Group and Control Group.
Obesity Group Control Group
Mean sd Mean sd p
PSQ 0.53 0.13 0.47 0.15 0.15
Table 4. Correlation analysis of PSQ with Z-score BMI and respiratory parameters.
r p
Z-score BMI 0.02 1.08
AHI 0.02 1.22
SaO2 0.01 0.61
ODI 0.03 1.45
Nadir O2 0.02 1.13
Table 5. Correlation analysis of Z-score BMI with respiratory parameters.
r2 p
AHI 0.01 0.00
Sa O2 0.09 0.00
ODI 0.04 0.56
NADIR O2 0.00 0.00
Disclaimer/Publisher’s Note: The statements, opinions and data contained in all publications are solely those of the individual author(s) and contributor(s) and not of MDPI and/or the editor(s). MDPI and/or the editor(s) disclaim responsibility for any injury to people or property resulting from any ideas, methods, instructions or products referred to in the content.
Copyright: This open access article is published under a Creative Commons CC BY 4.0 license, which permit the free download, distribution, and reuse, provided that the author and preprint are cited in any reuse.
Prerpints.org logo

Preprints.org is a free preprint server supported by MDPI in Basel, Switzerland.

Subscribe

© 2024 MDPI (Basel, Switzerland) unless otherwise stated