Submitted:
02 October 2023
Posted:
03 October 2023
You are already at the latest version
Abstract
Keywords:
1. Introduction
2. Data Source, Data Processing, and Model
2.1. Data Source
2.2. Data Processing
2.2.1. GPS Data
2.2.2. Computation of Equatorial Electrojet (EEJ)
- i.
- ii.
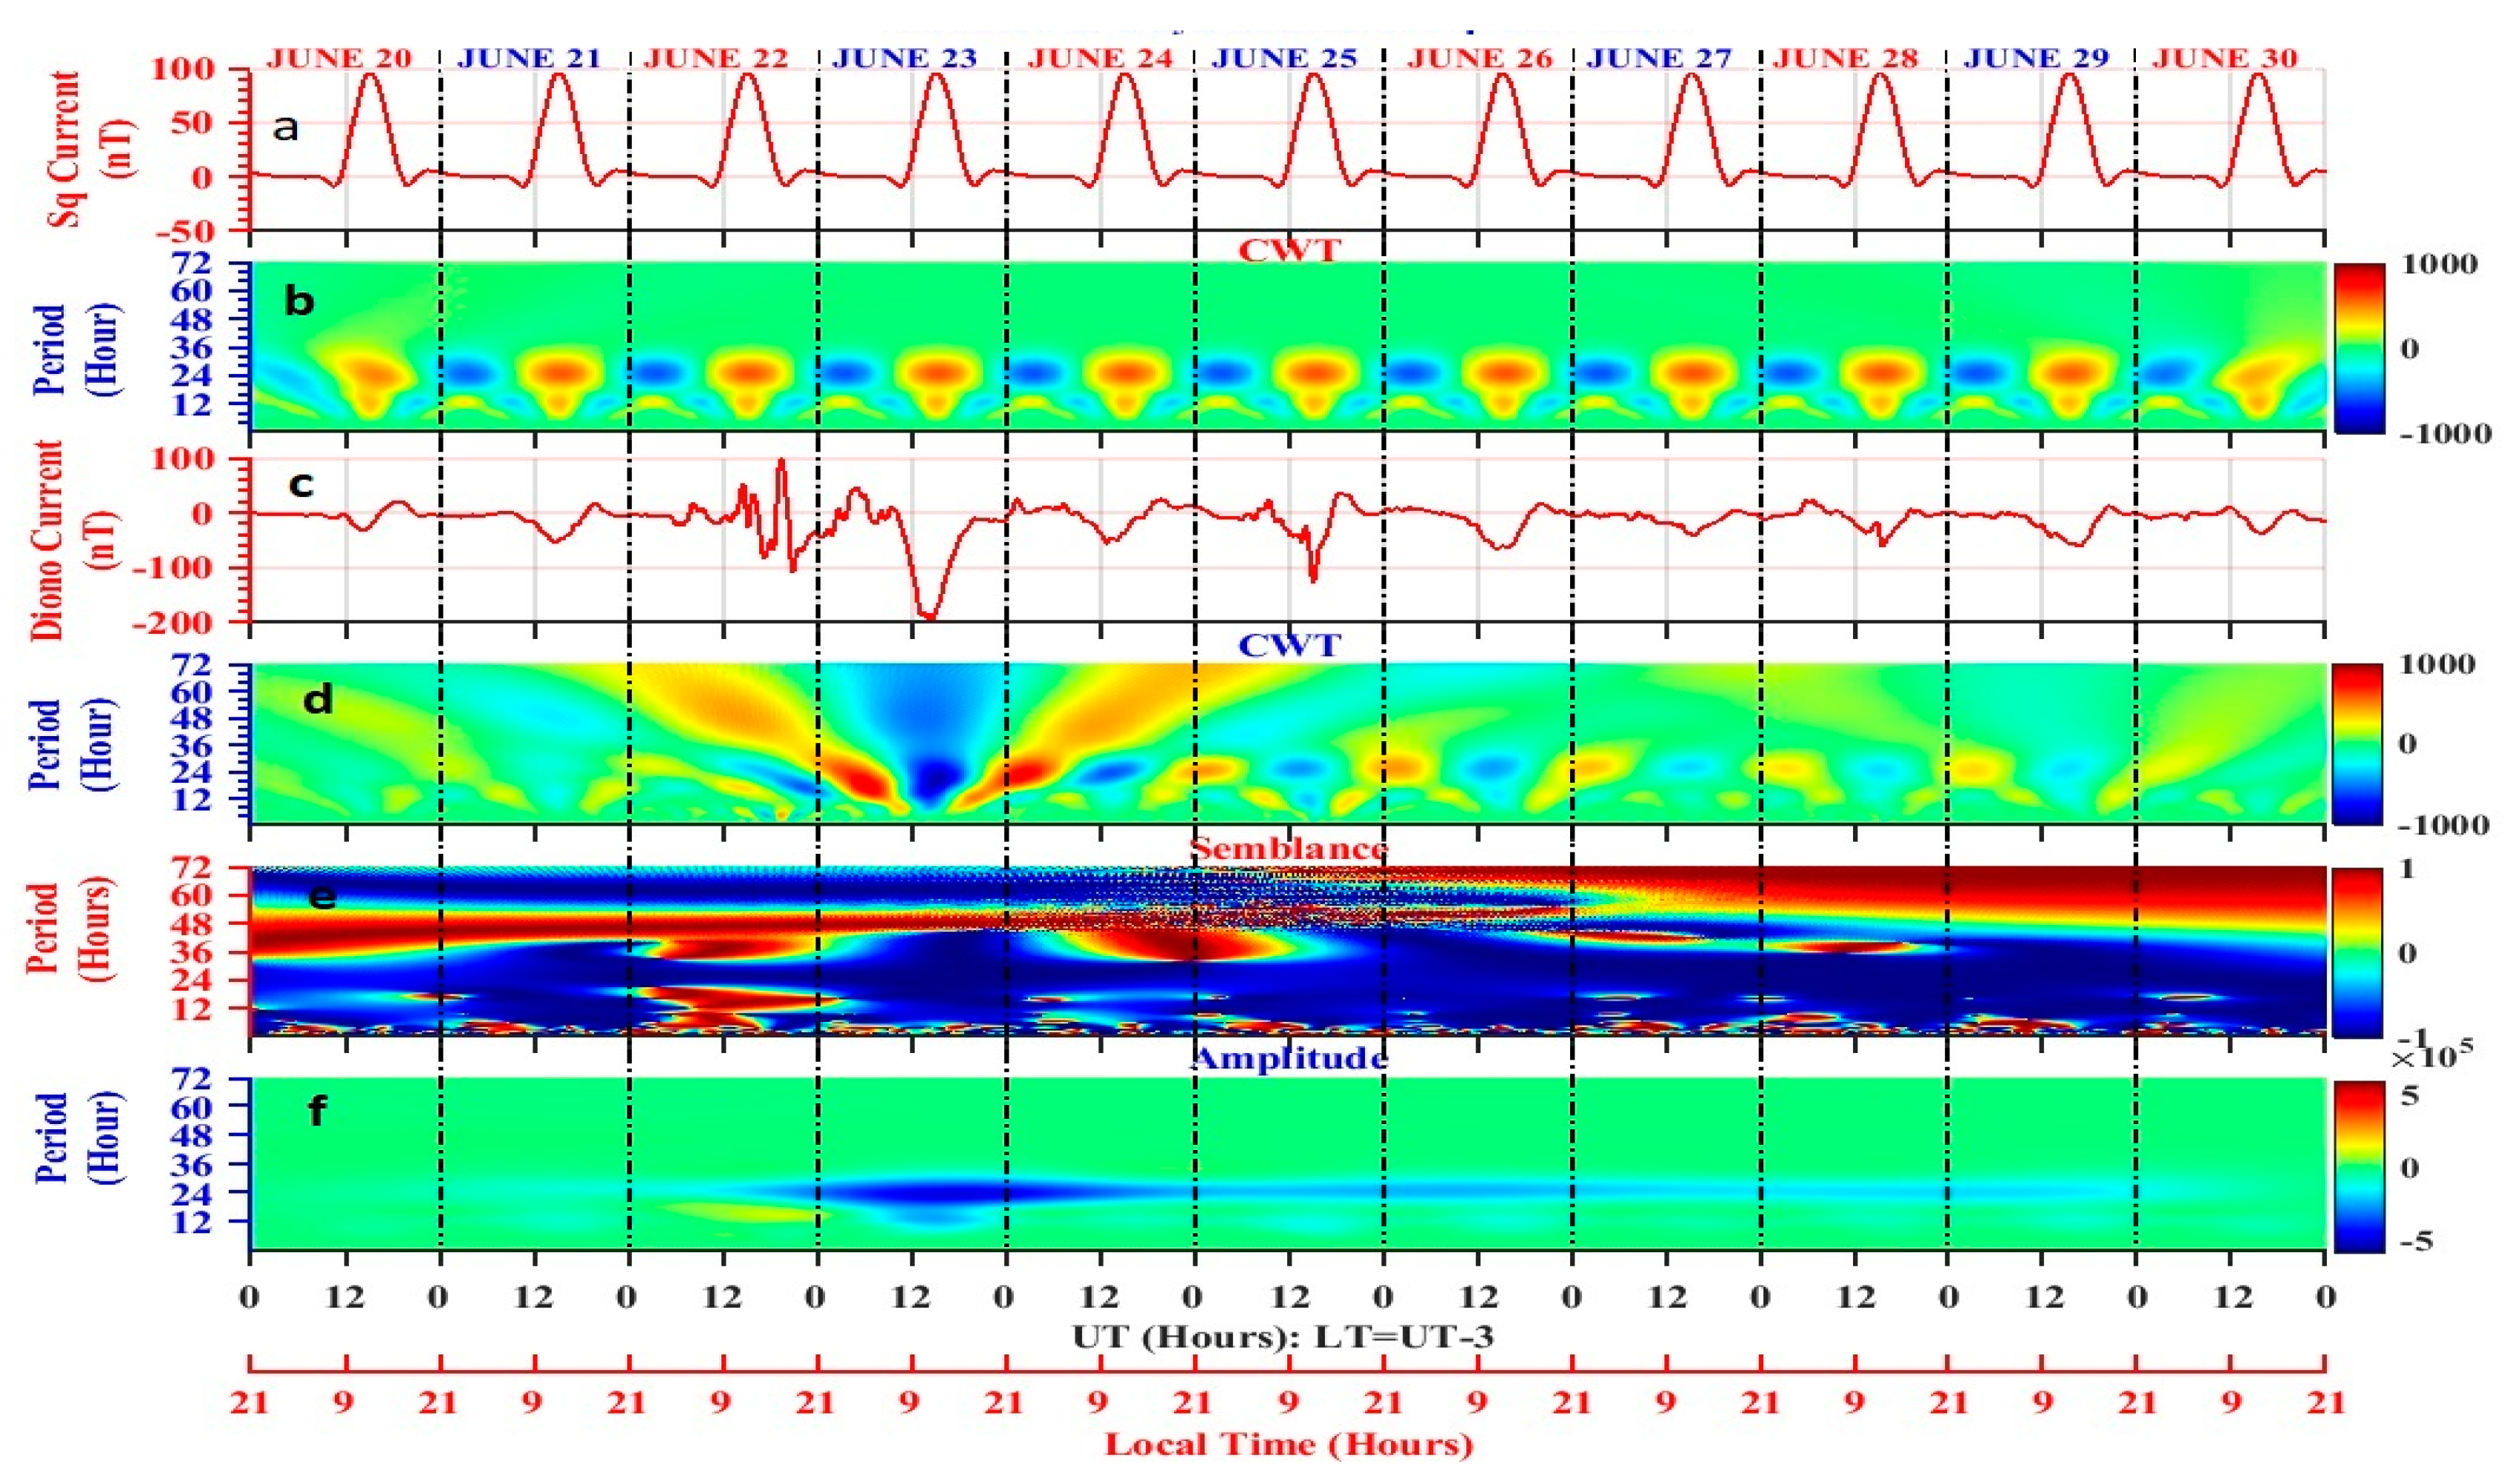
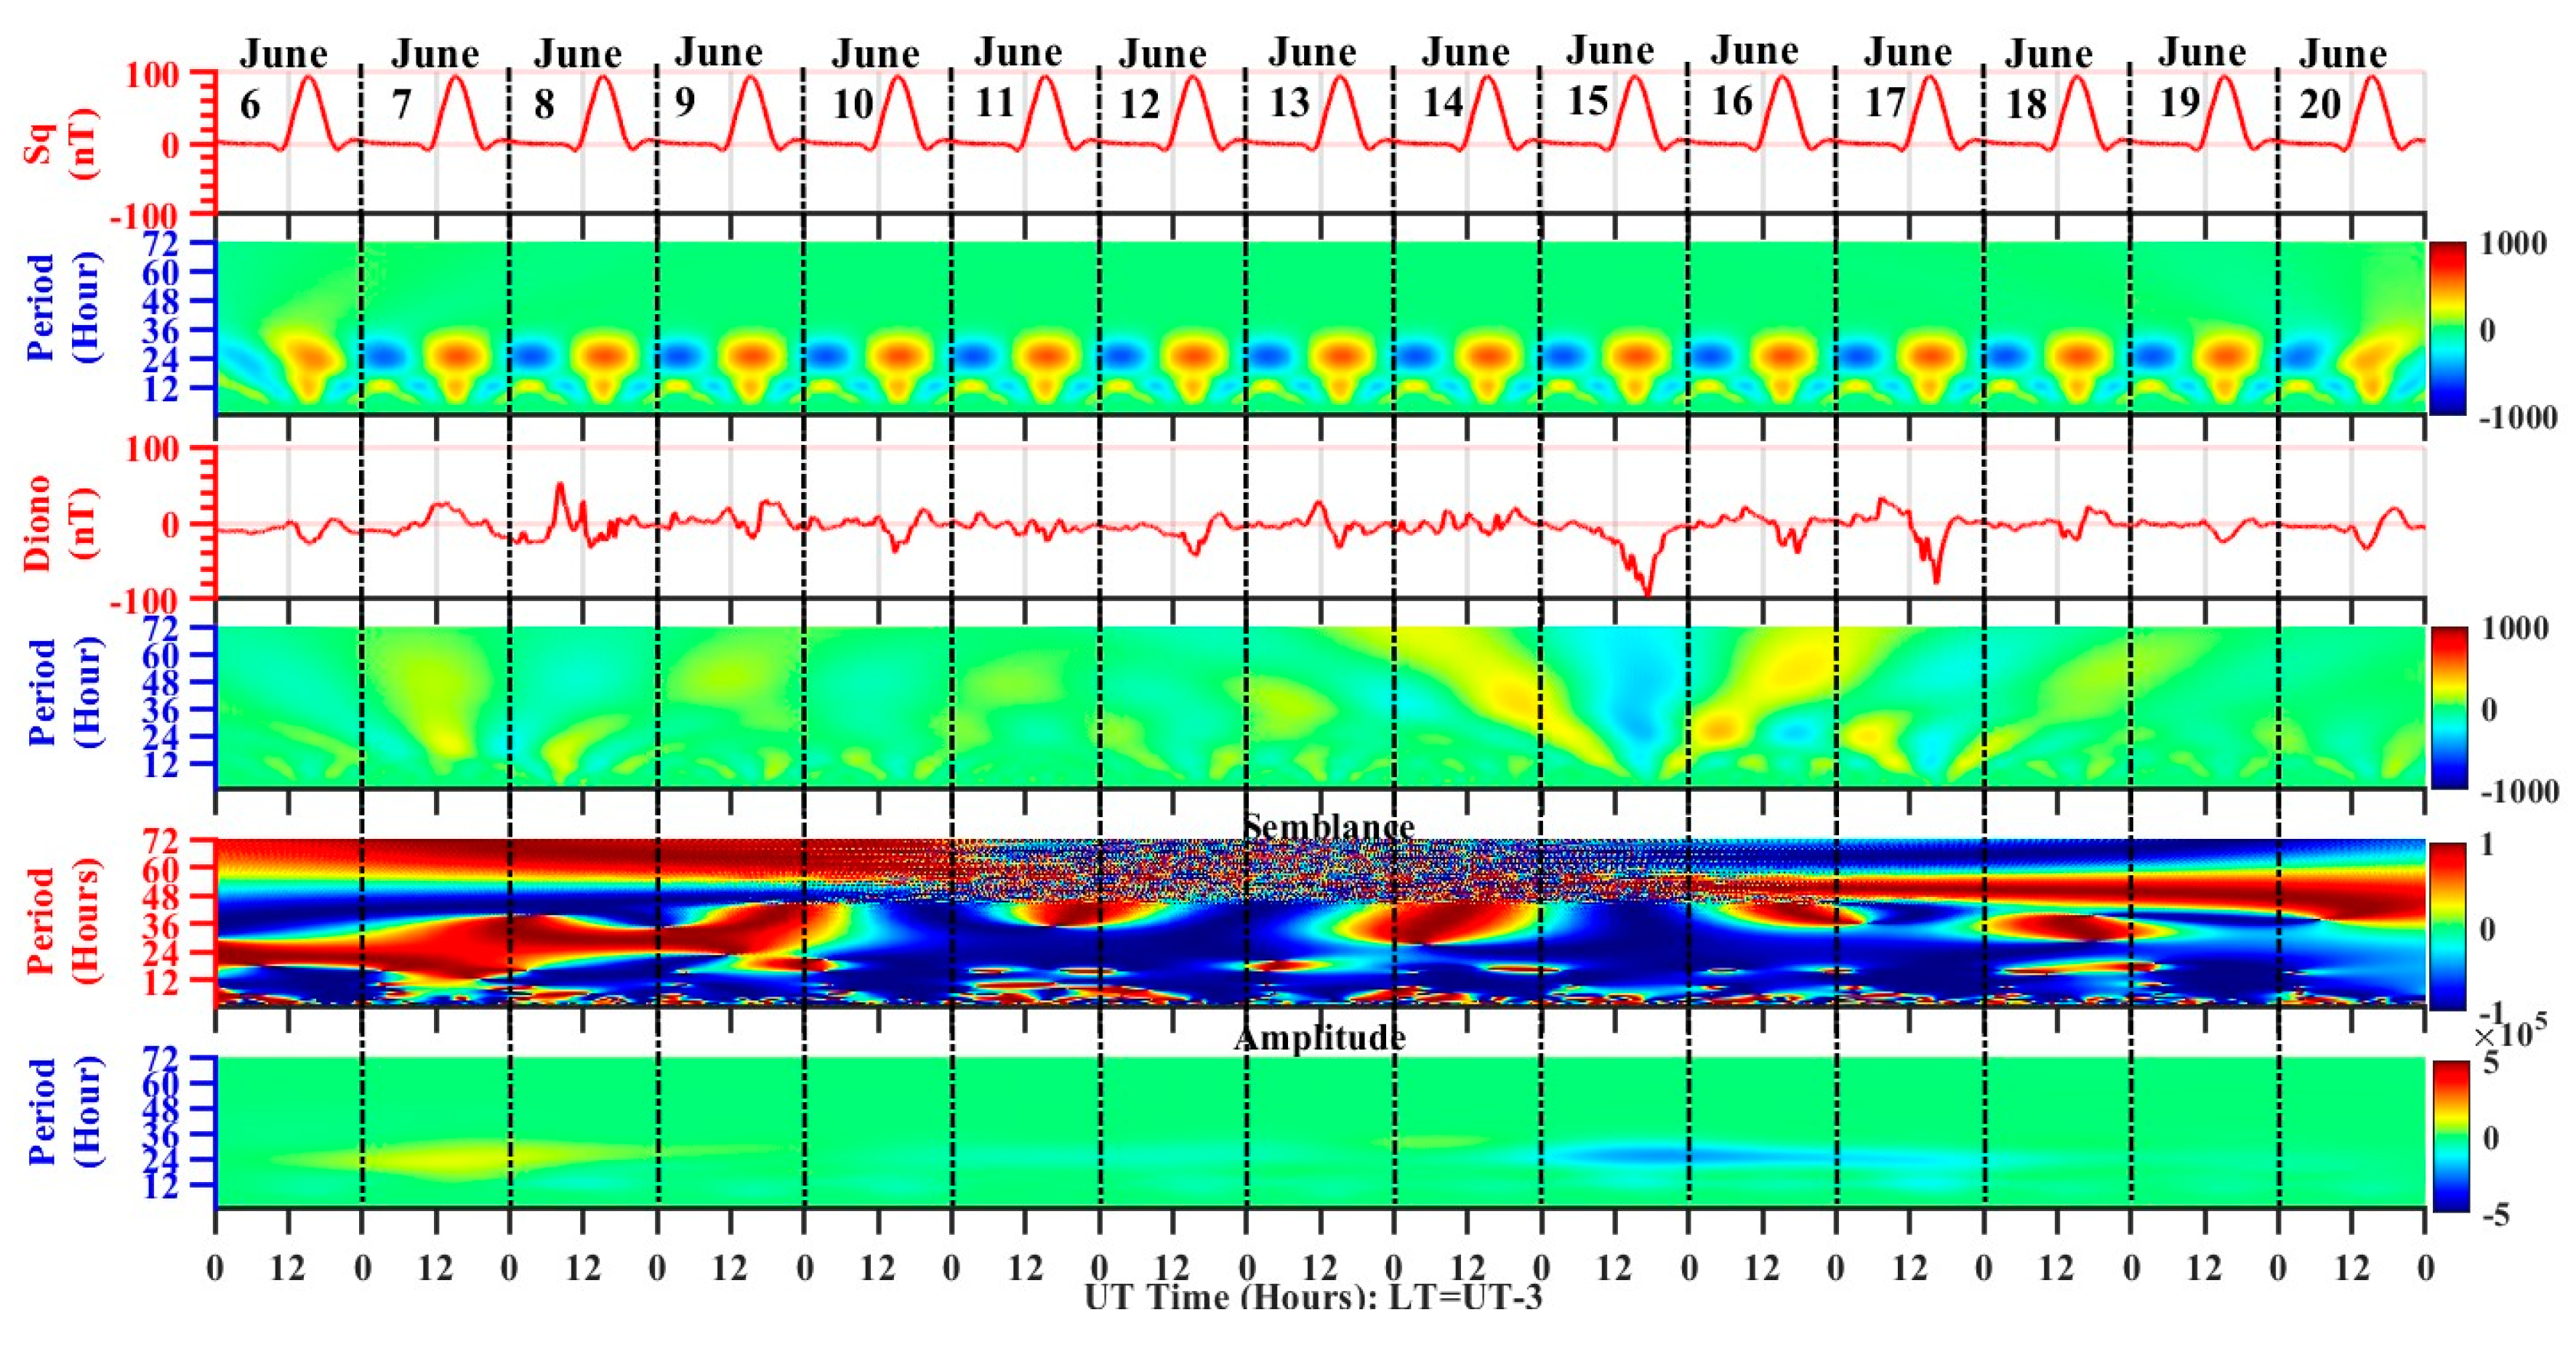
- Semblance cross-correlation wavelet analysis [35,43]. We refer interested readers to check the article published by Younas (2021) [35,43,44]. We perform semblance analysis by comparing the local phase relation between Sq current and current as a function of time and wavelength. The detail of this new method to identify the anti-Sq from the Diono can be found in the [35]. The positive phase is represented by +1 and the negative phase is represented by -1 (which anti-Sq current).
2.2.3. Computation of Akasofu’s parameter
2.3. SAMI2 Model
3. Results
3.1. Impact of June 22-23, and 25 Geomagnetic Storm Brazilian Ionosphere
3.1.1. The state of the interplanetary medium from 20-30 June 2015
3.1.2. Brazilian Equatorial Latitude Response to The Magnetospheric Convection
- Electric Field.
3.1.3. Development of Ddyn during June 22-23, and 25, 2015 Geomagnetic Storm at
- Brazilian Longitude.
3.1.4. Phase Comparison between Sq and Diono Current at Belem Magnetic Station.
3.1.5. Effect of Cowling Conductivity on Strength of Ddyn.
3.1.6. Manifestation of The Magnetic Perturbation on The Vertical Total Electron.
3.1.7. Spatial-Temporal Variation of Vertical Total Electron Content From 20-30 June.
3.1.8. Thermospheric Condition
3.2. Impact of June 8 Geomagnetic Storm on Brazilian Low-Latitude Ionosphere
3.2.1. The state of the Interplanetary Medium from June 6-30, 2015
3.2.2. DP2 Fluctuations at Brazilian Longitude
3.2.3. Diurnal Component of Disturbance Dynamo
3.2.4. Development of Ddyn during the June 8 Geomagnetic Storm.
3.2.5. Effect of Cowling Conductivity on Ddyn Strength
3.2.6. Impact of Magnetic Perturbation on VTEC from June 8-20, 2015.
3.2.7. Spatial – Temporal variation of VTEC from June 6-20, 2015
3.3. SAMI2 Model Run Results.
4. Discussion
4.1. Effect of Geomagnetic Storm on Electric Field.
- Top of Form
4.2. Development of Positive and Negative ionospheric
4.3. Eastward and Westward Disturbance Dynamo
4.4. SAMI2 Model performance during the Ddyn event.
5. Conclusion
- i.
- The positive ionospheric storm's development results from a combination of factors, including an increased [O]/[N_2] ratio in the thermosphere, the eastward penetration of the magnetospheric electric field, and the equatorward wind that carries a higher concentration of oxygen atoms compared to nitrogen molecules. The observed nighttime positive ionospheric storm in the Brazilian longitude shows a correlation with the eastward disturbance dynamo [47].
- ii.
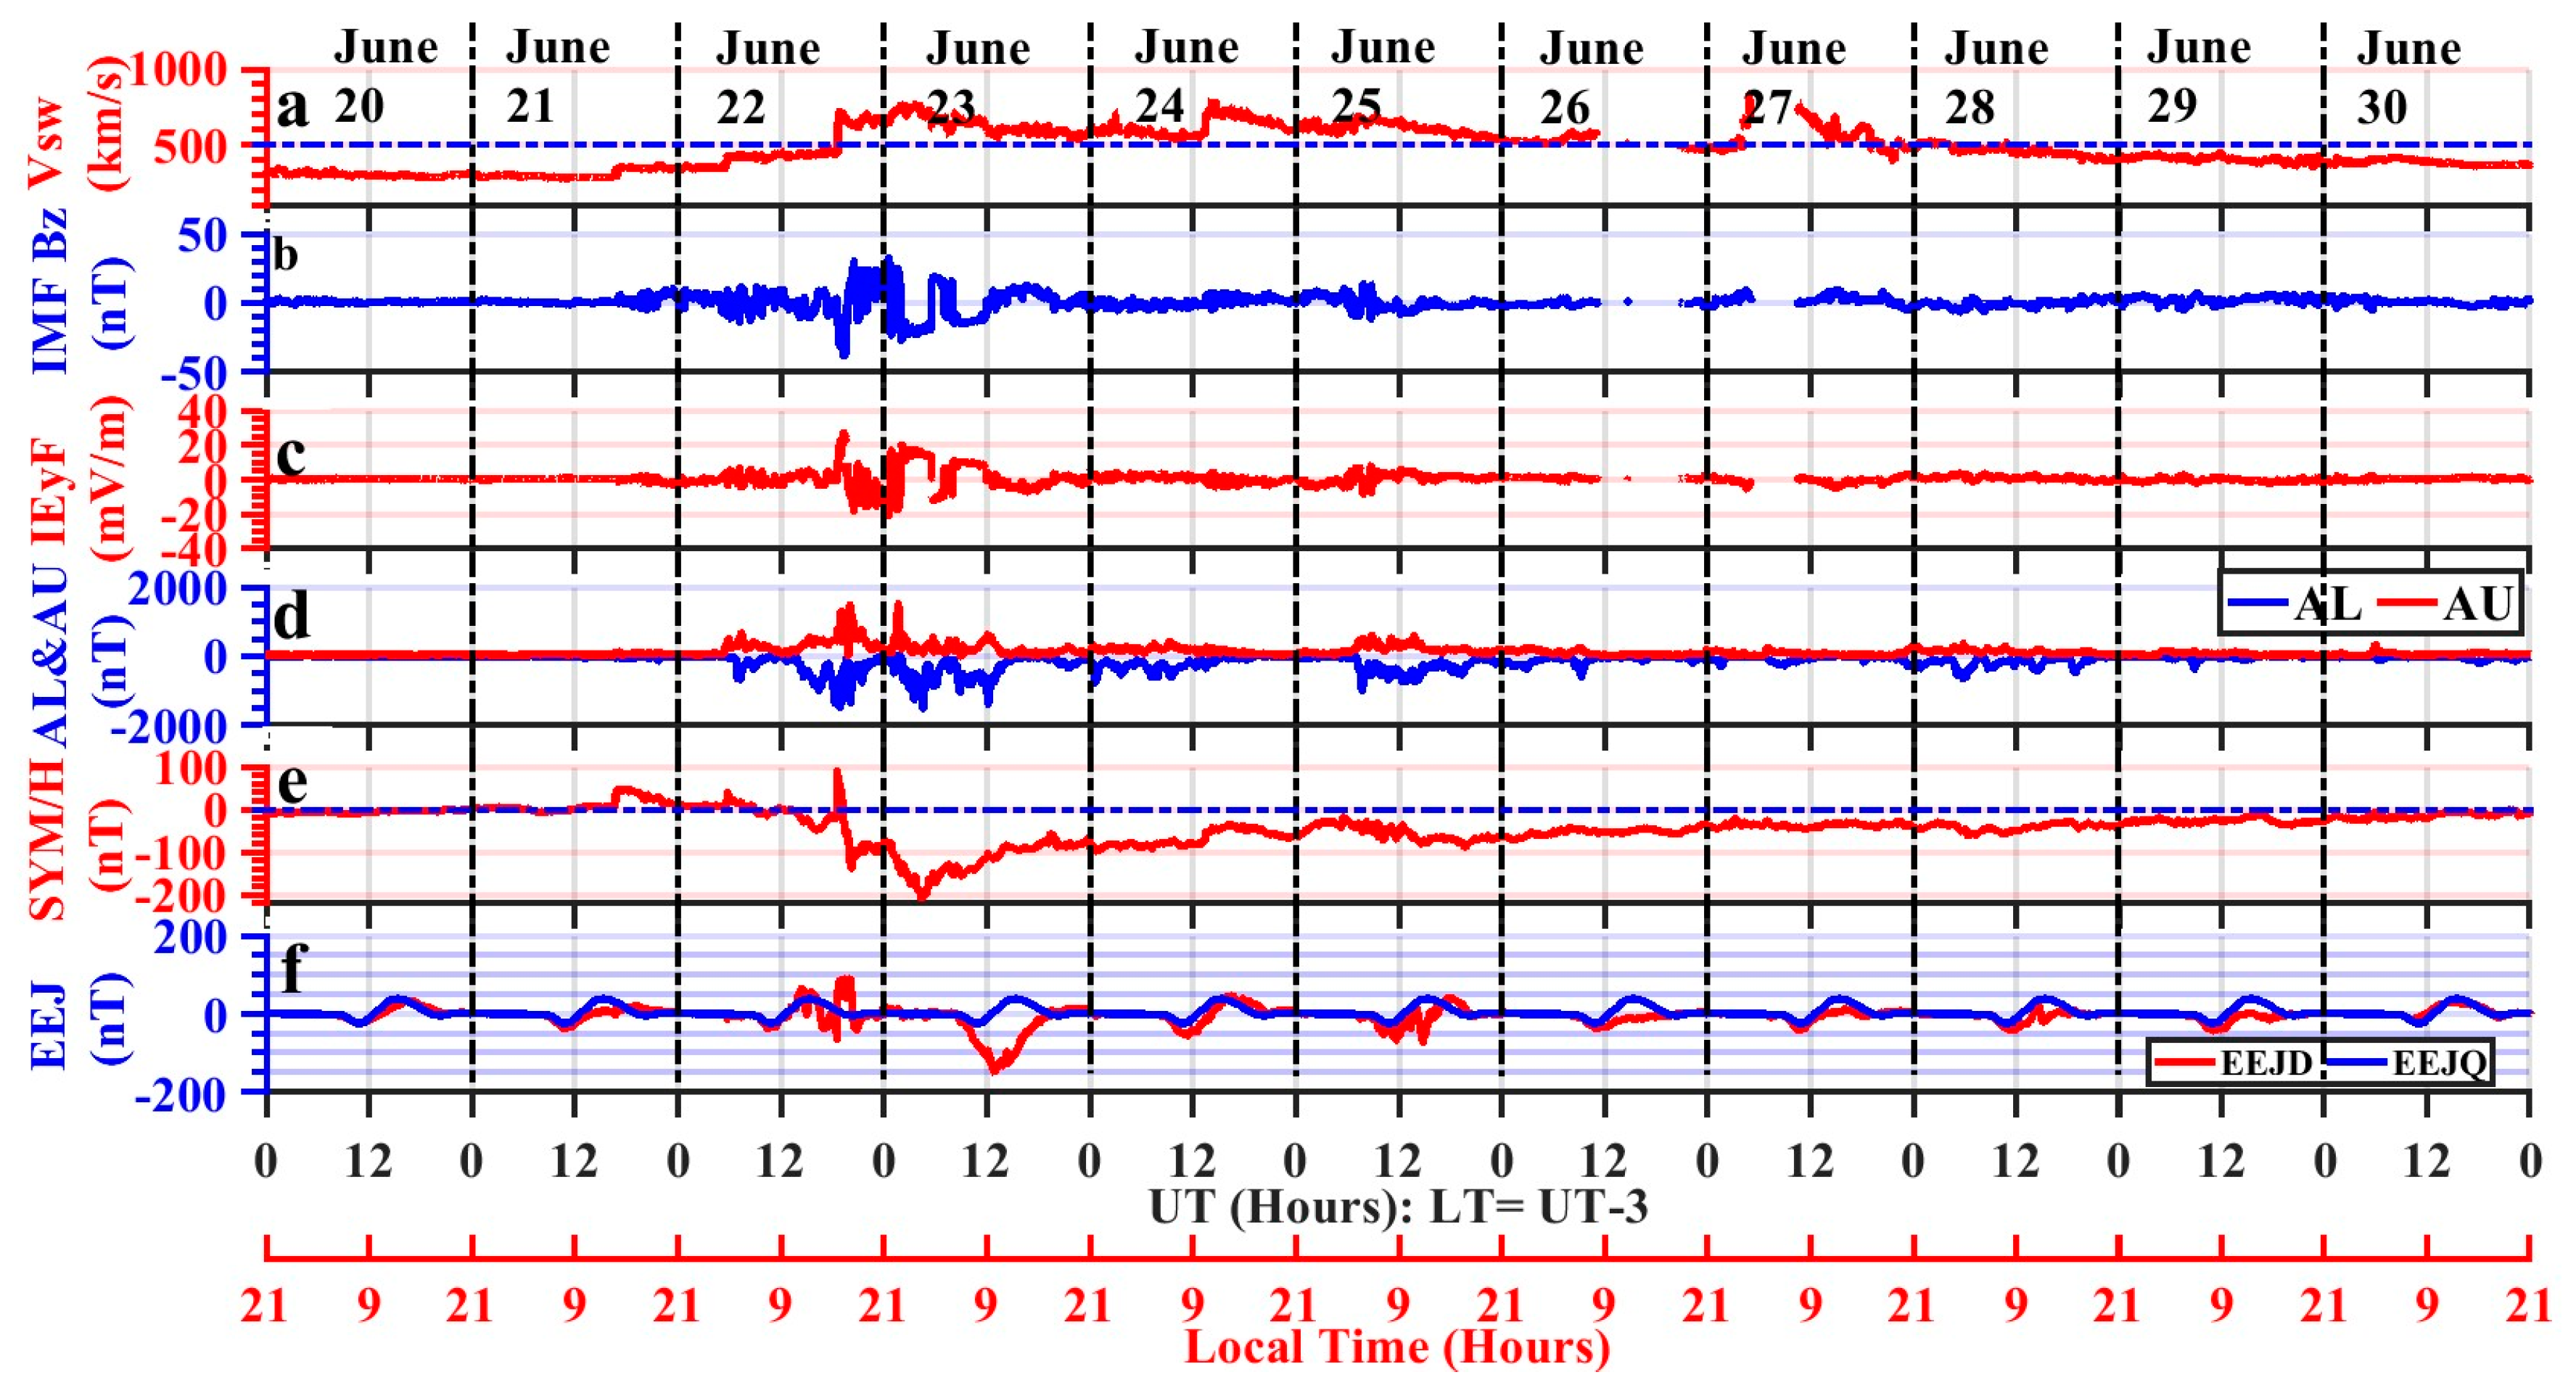
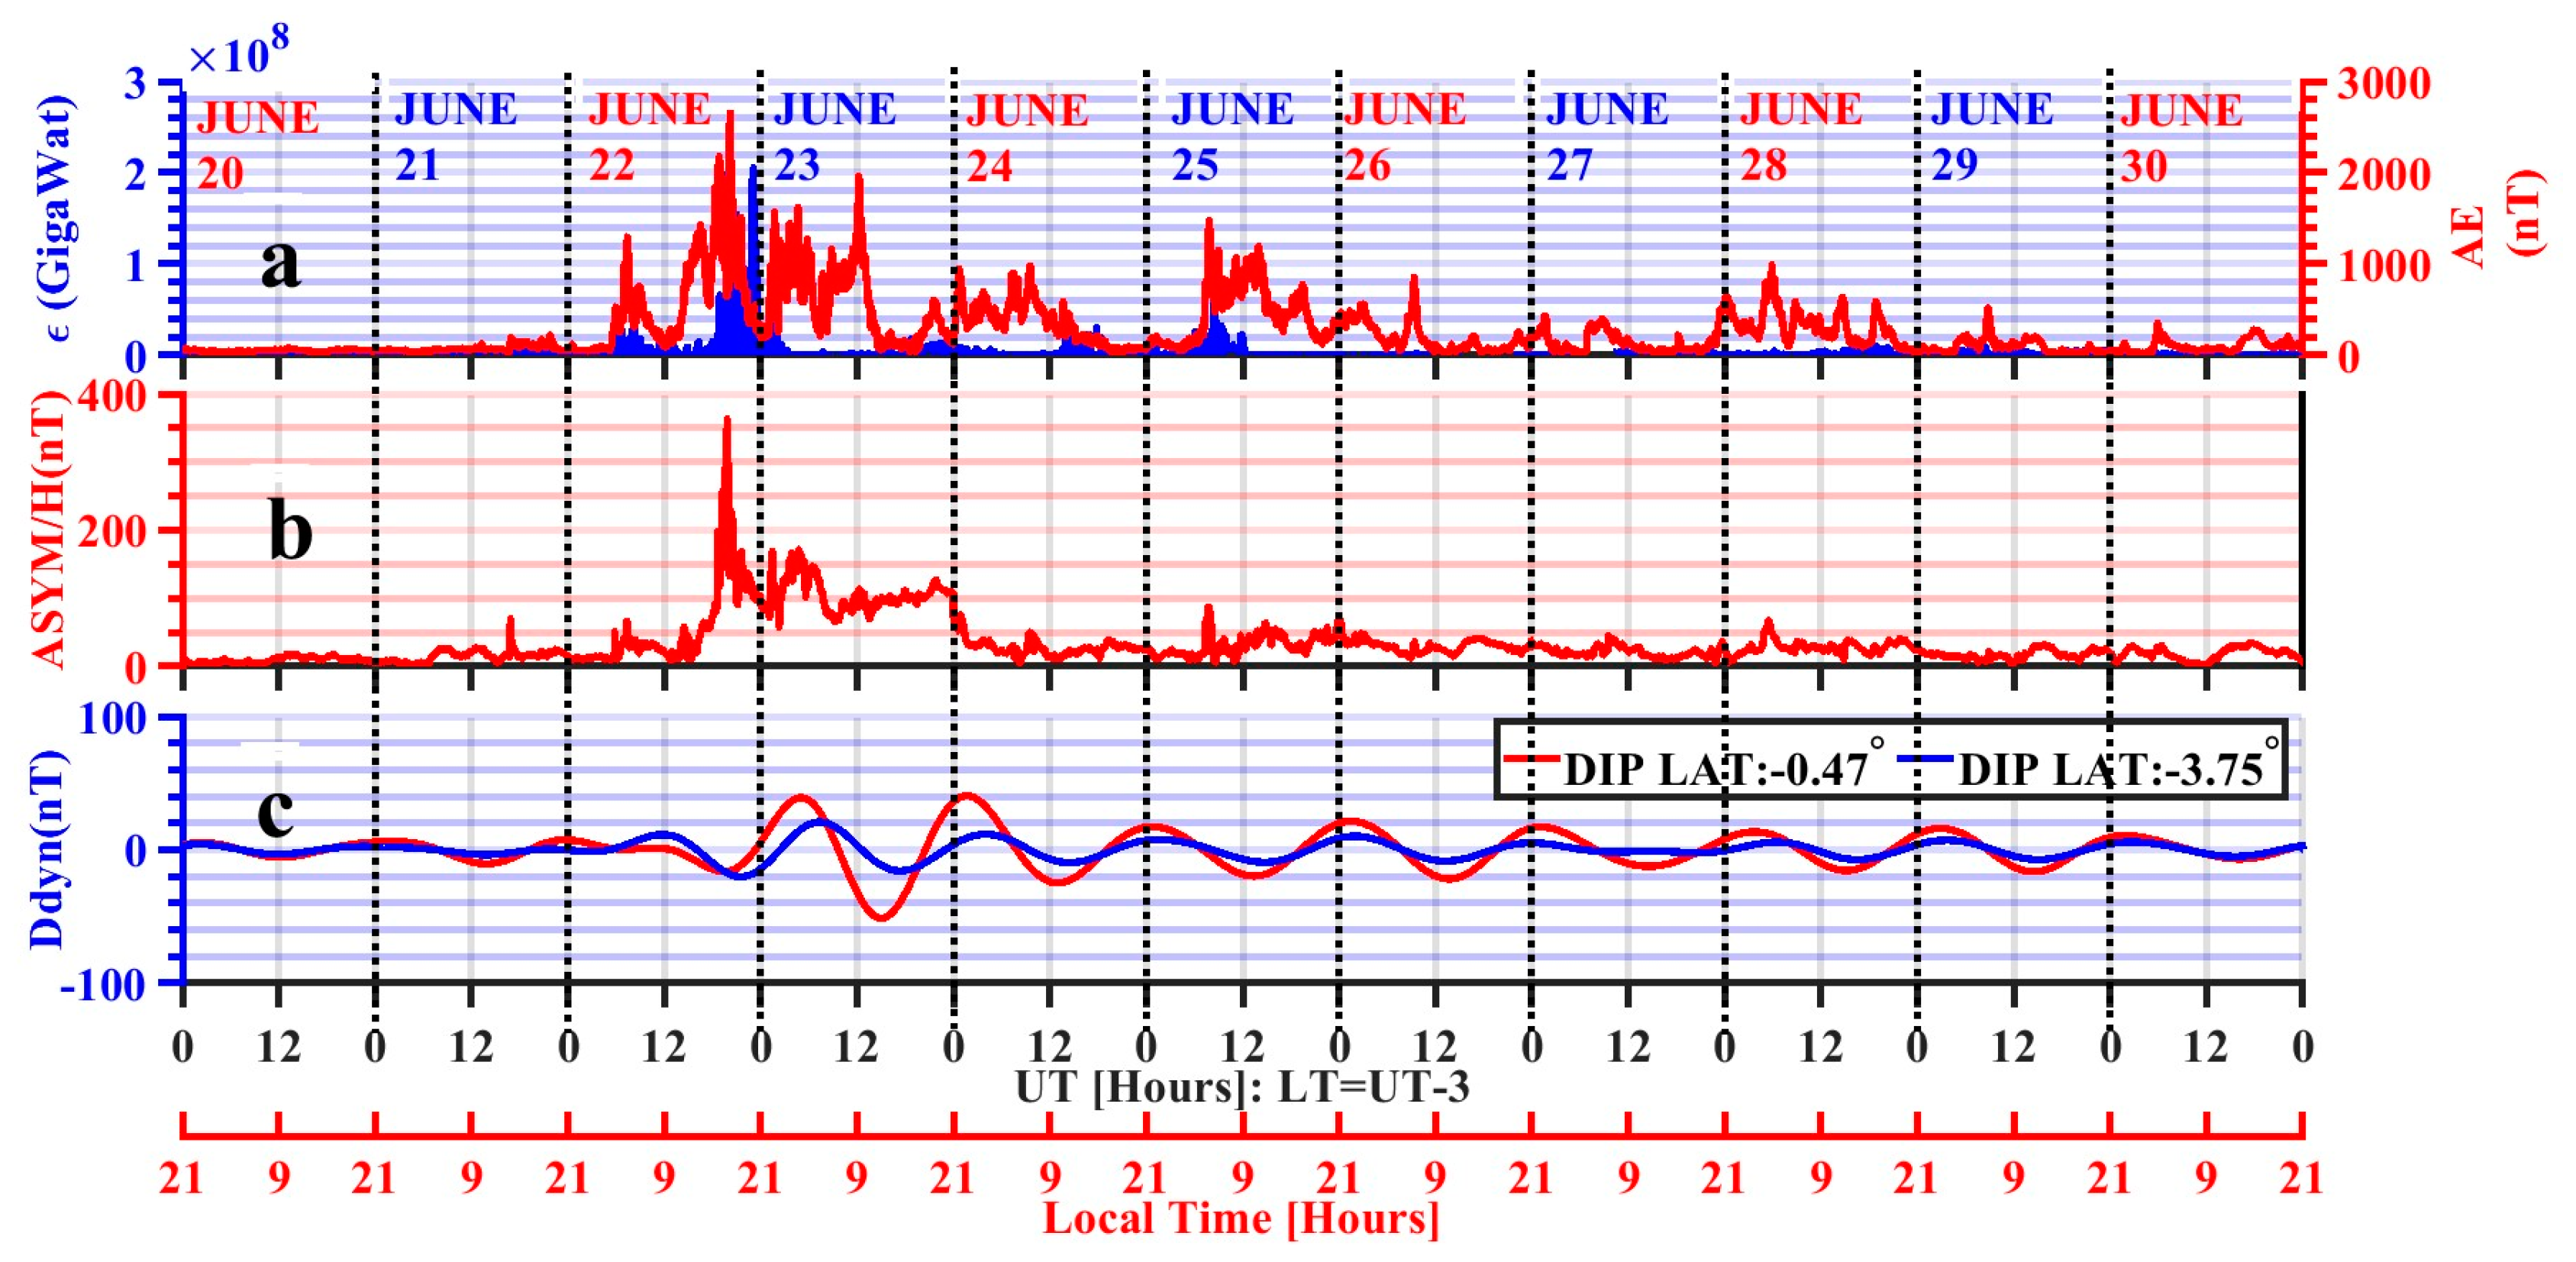
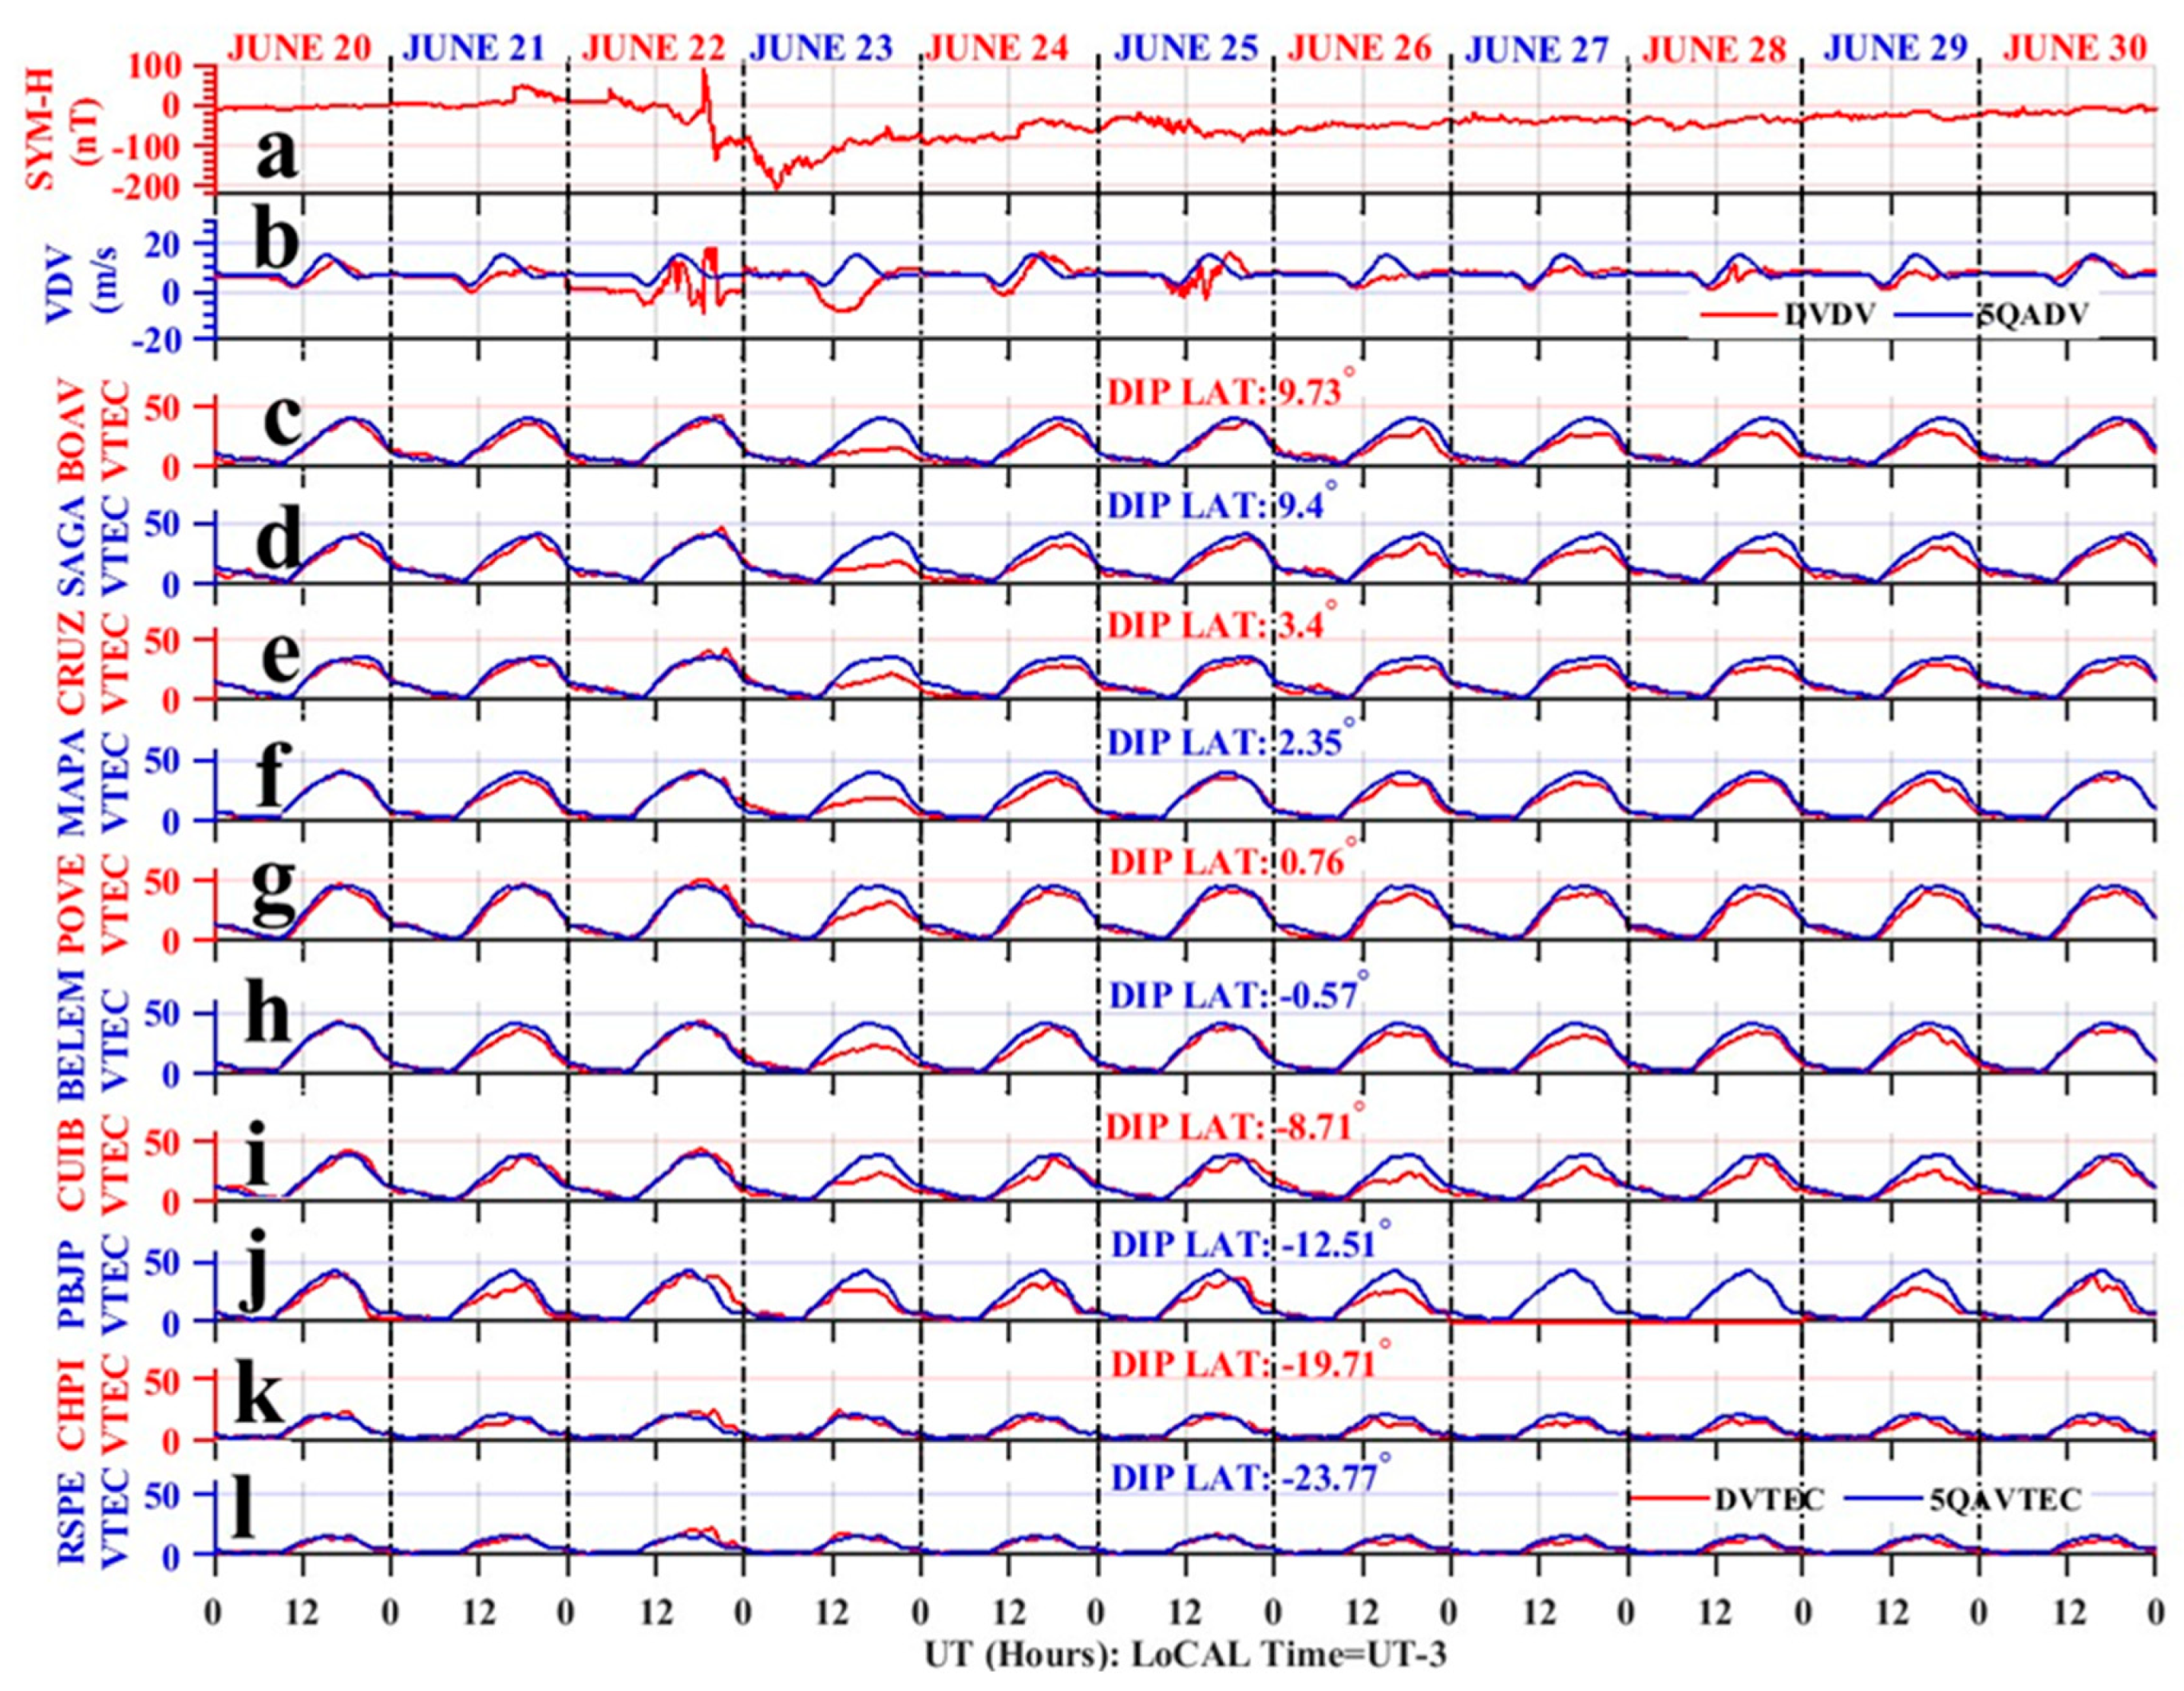
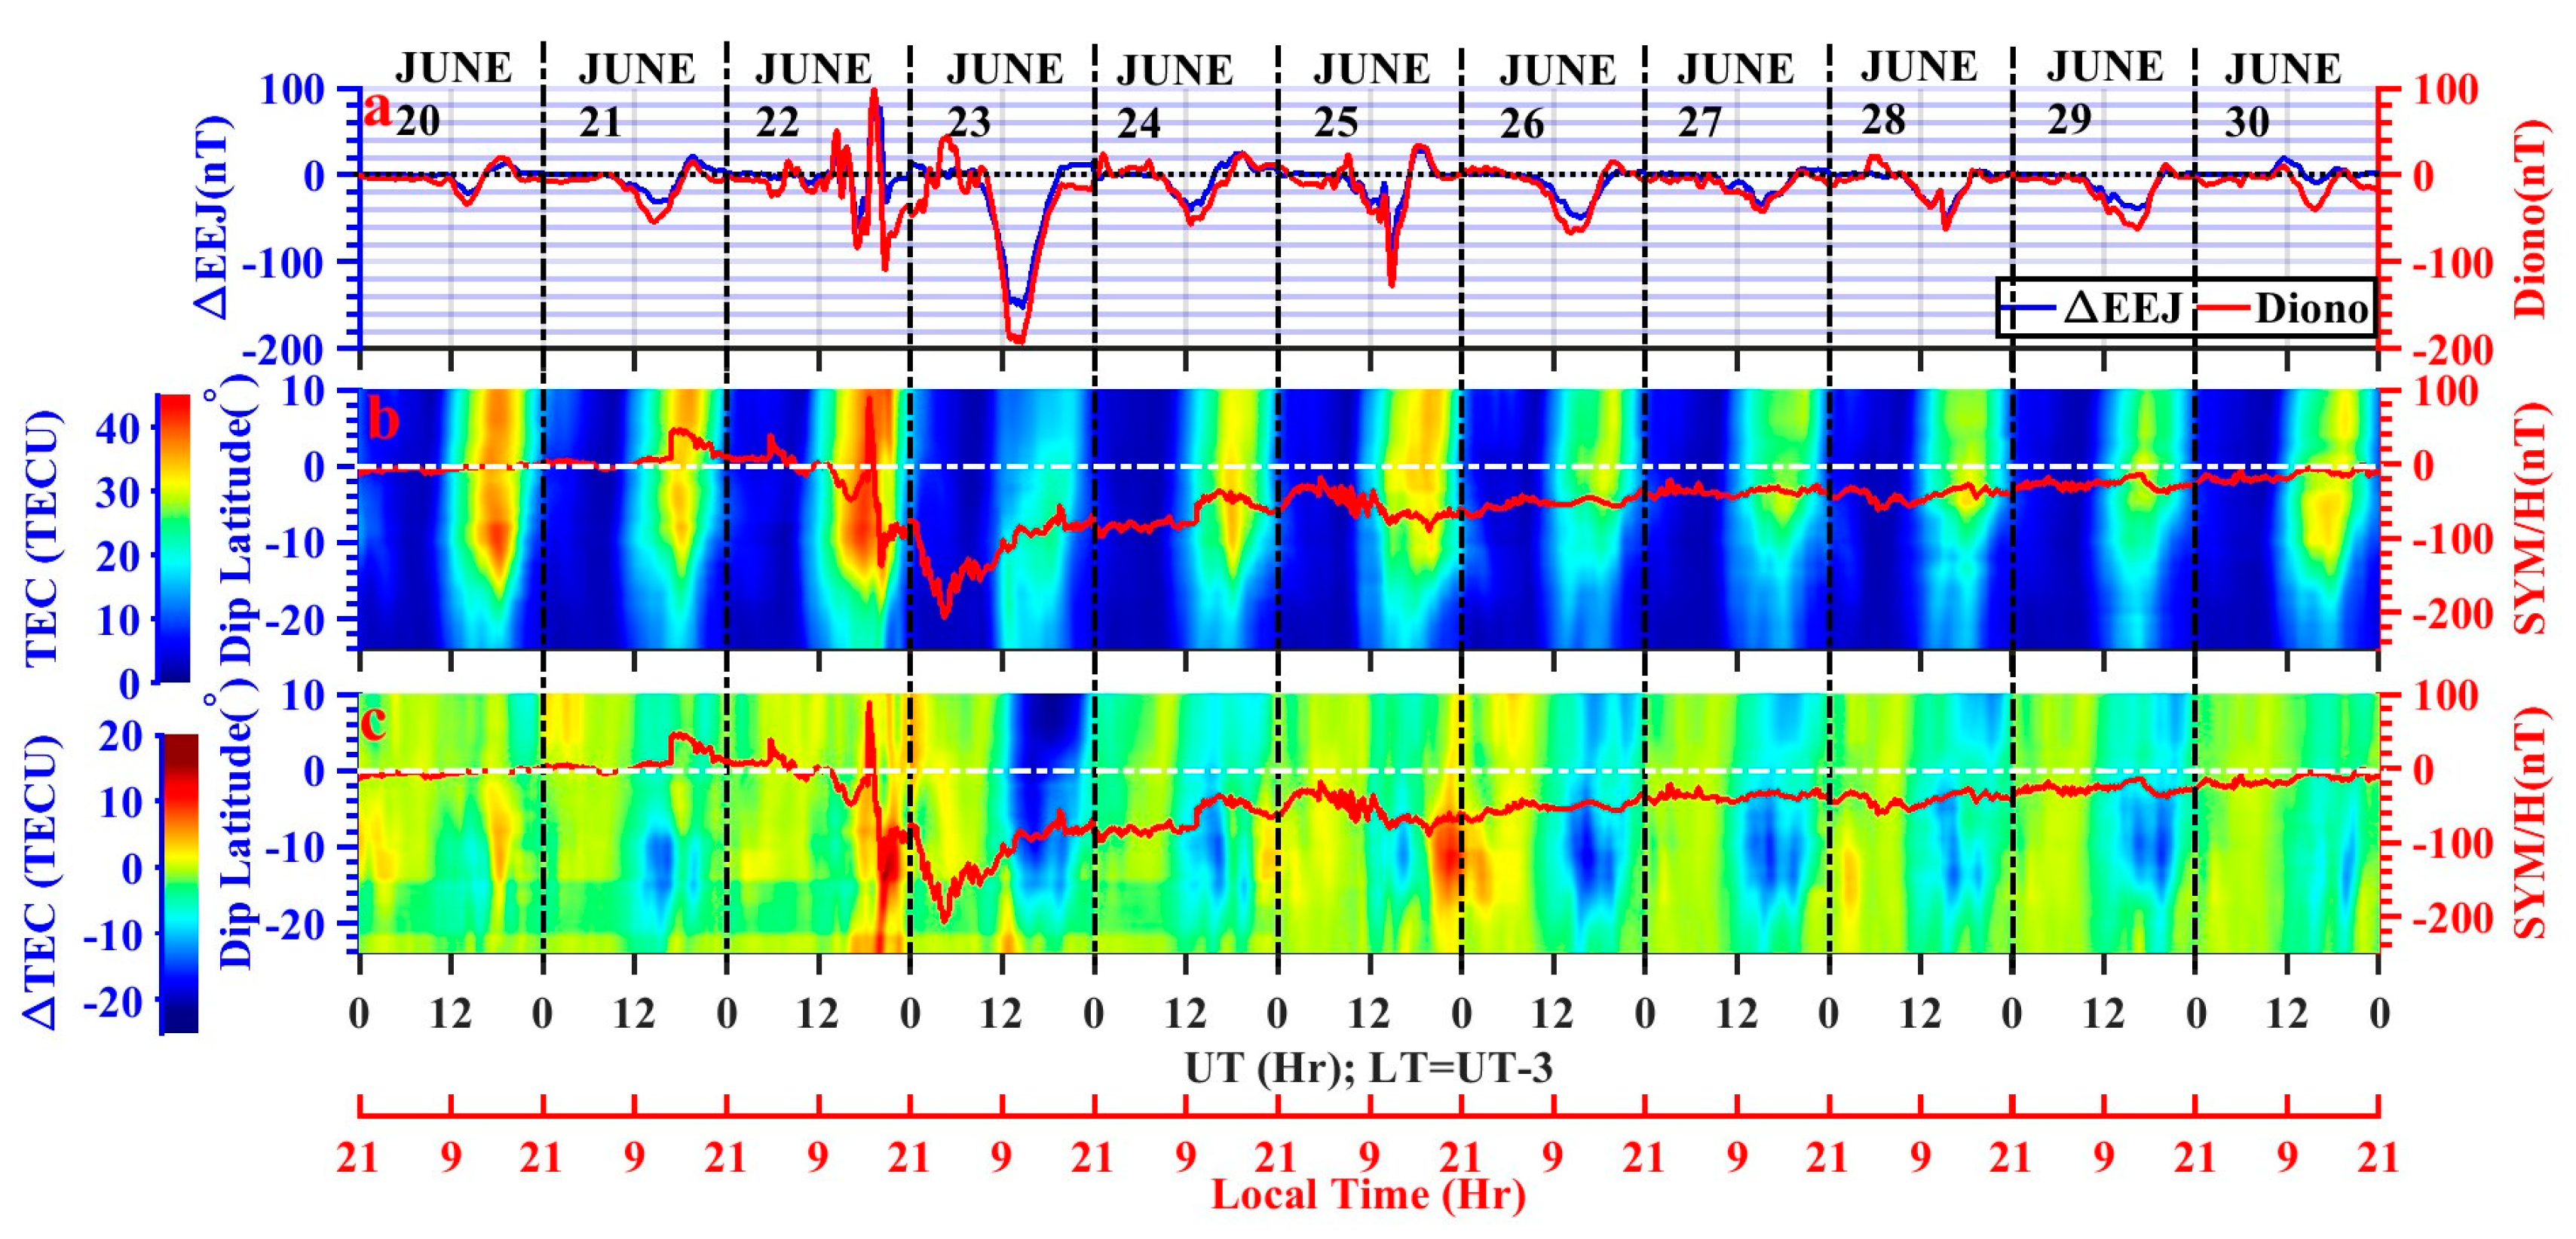
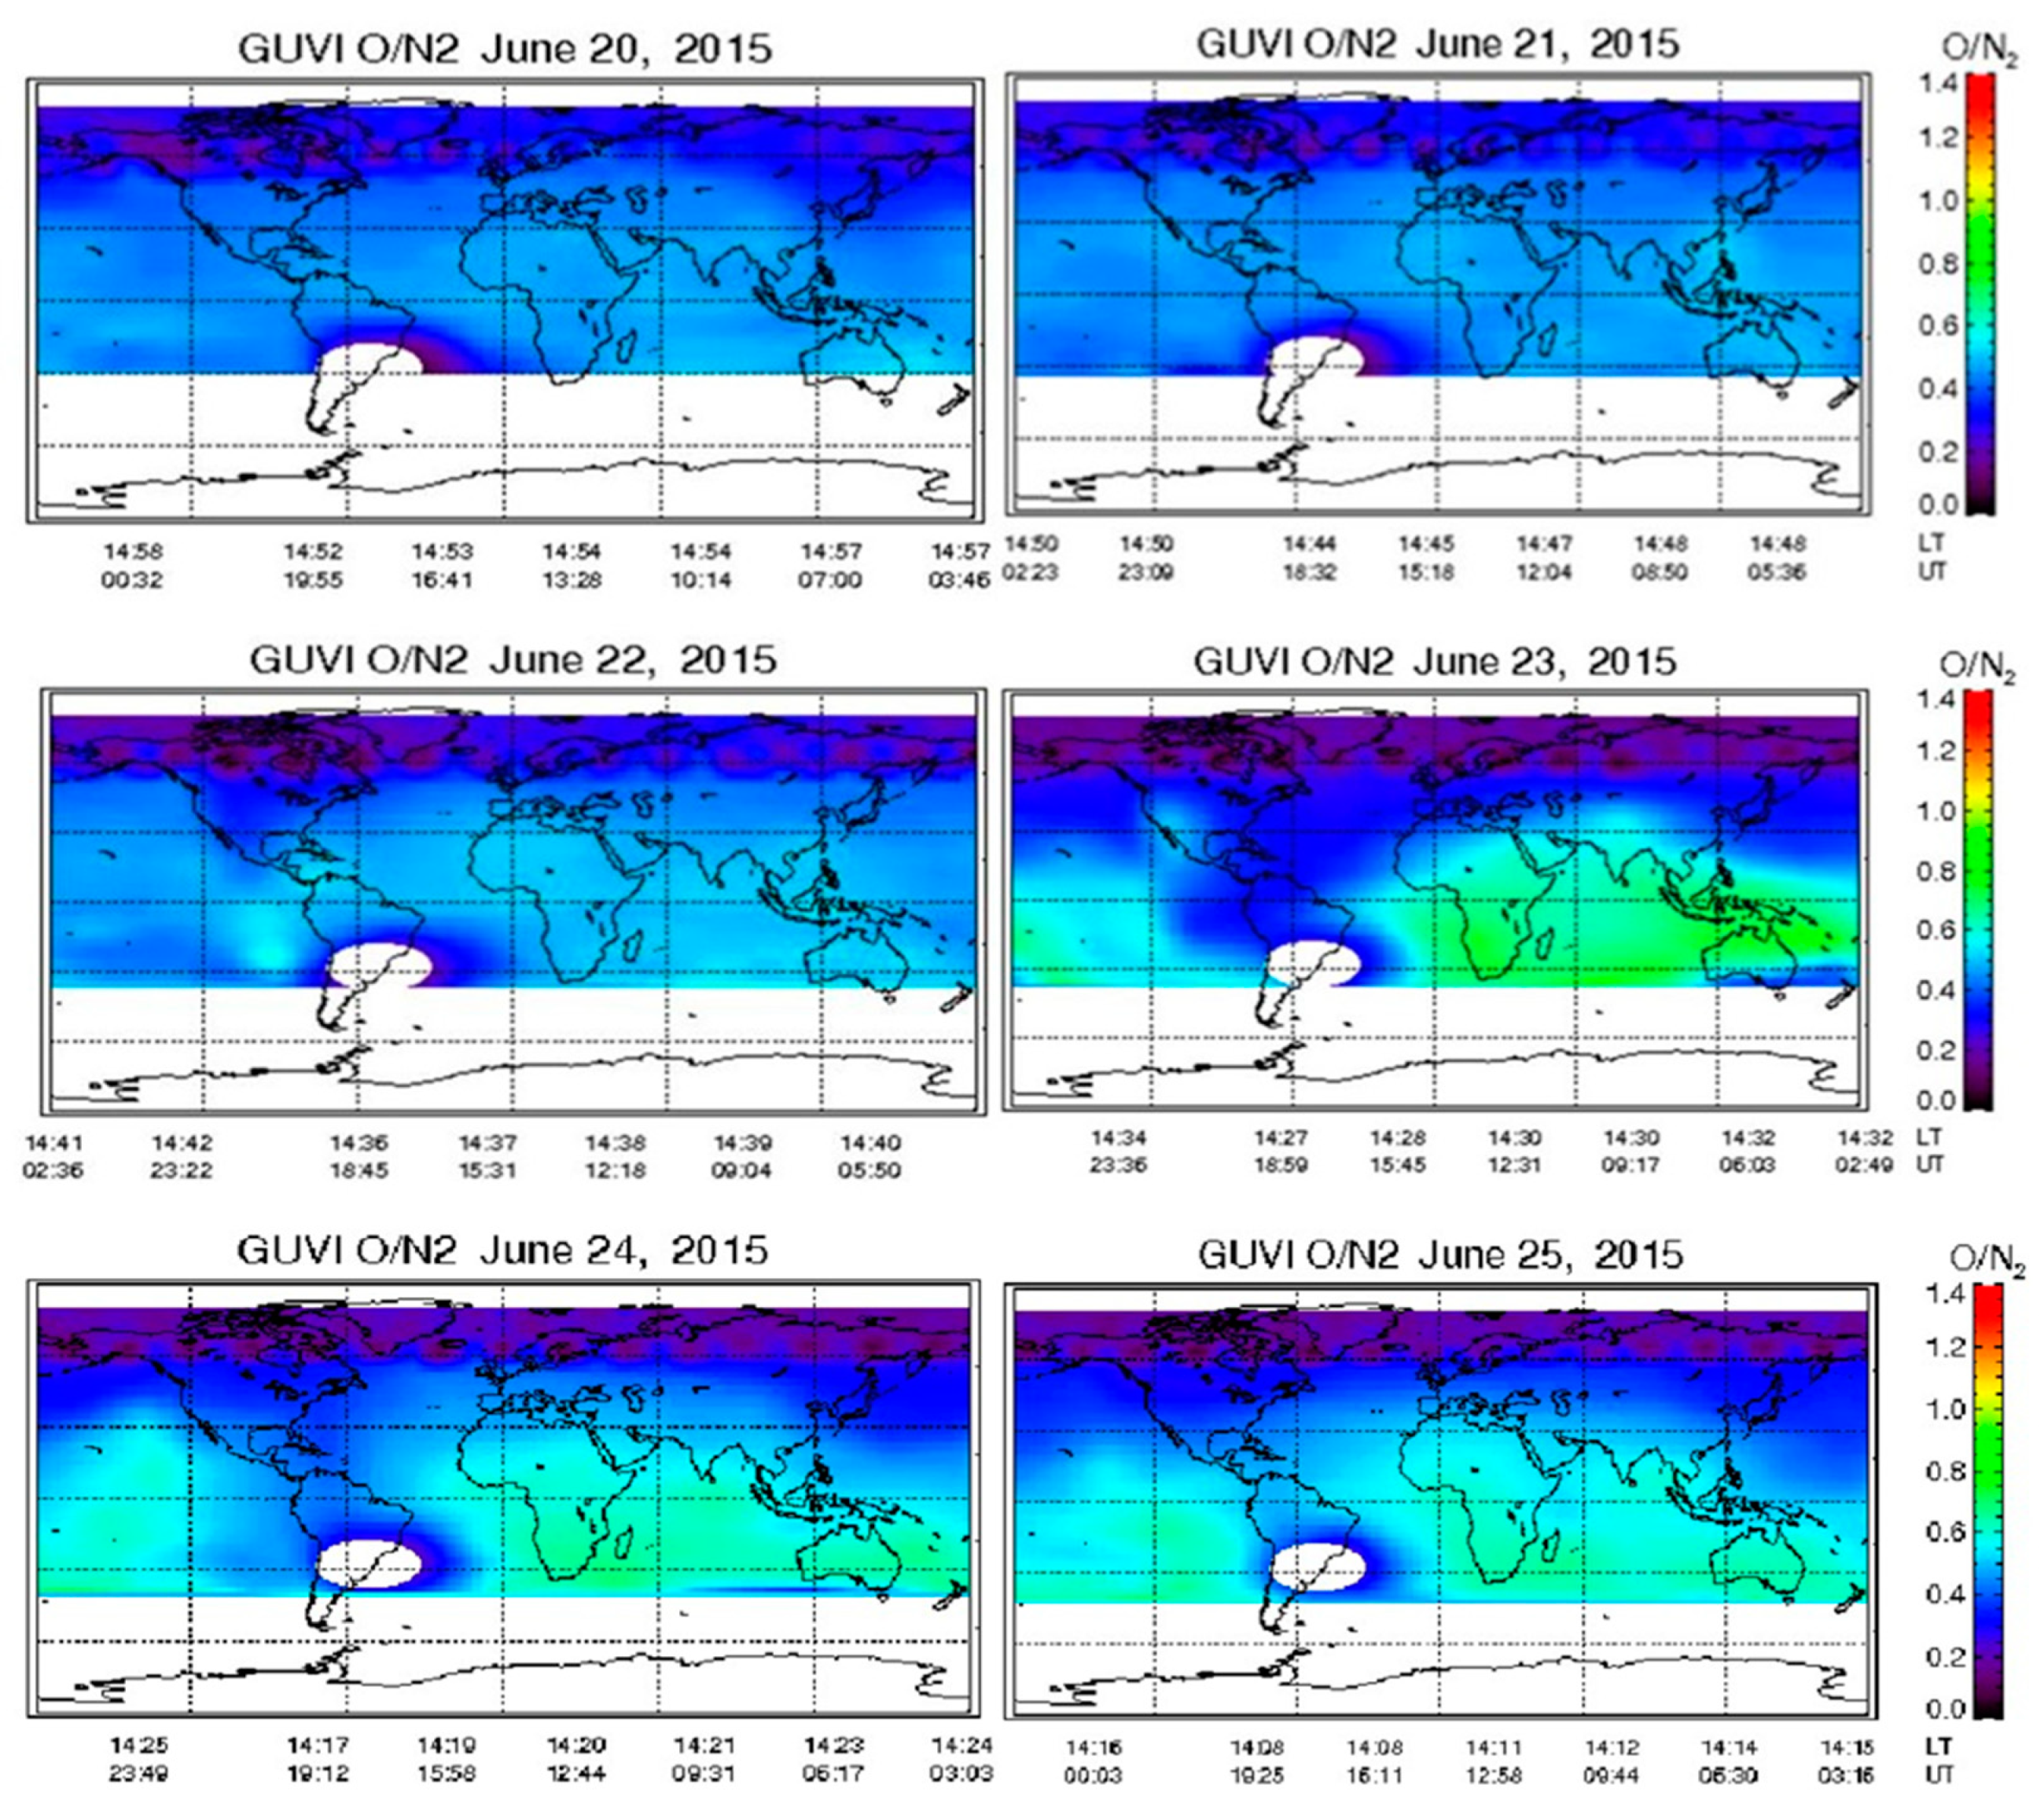
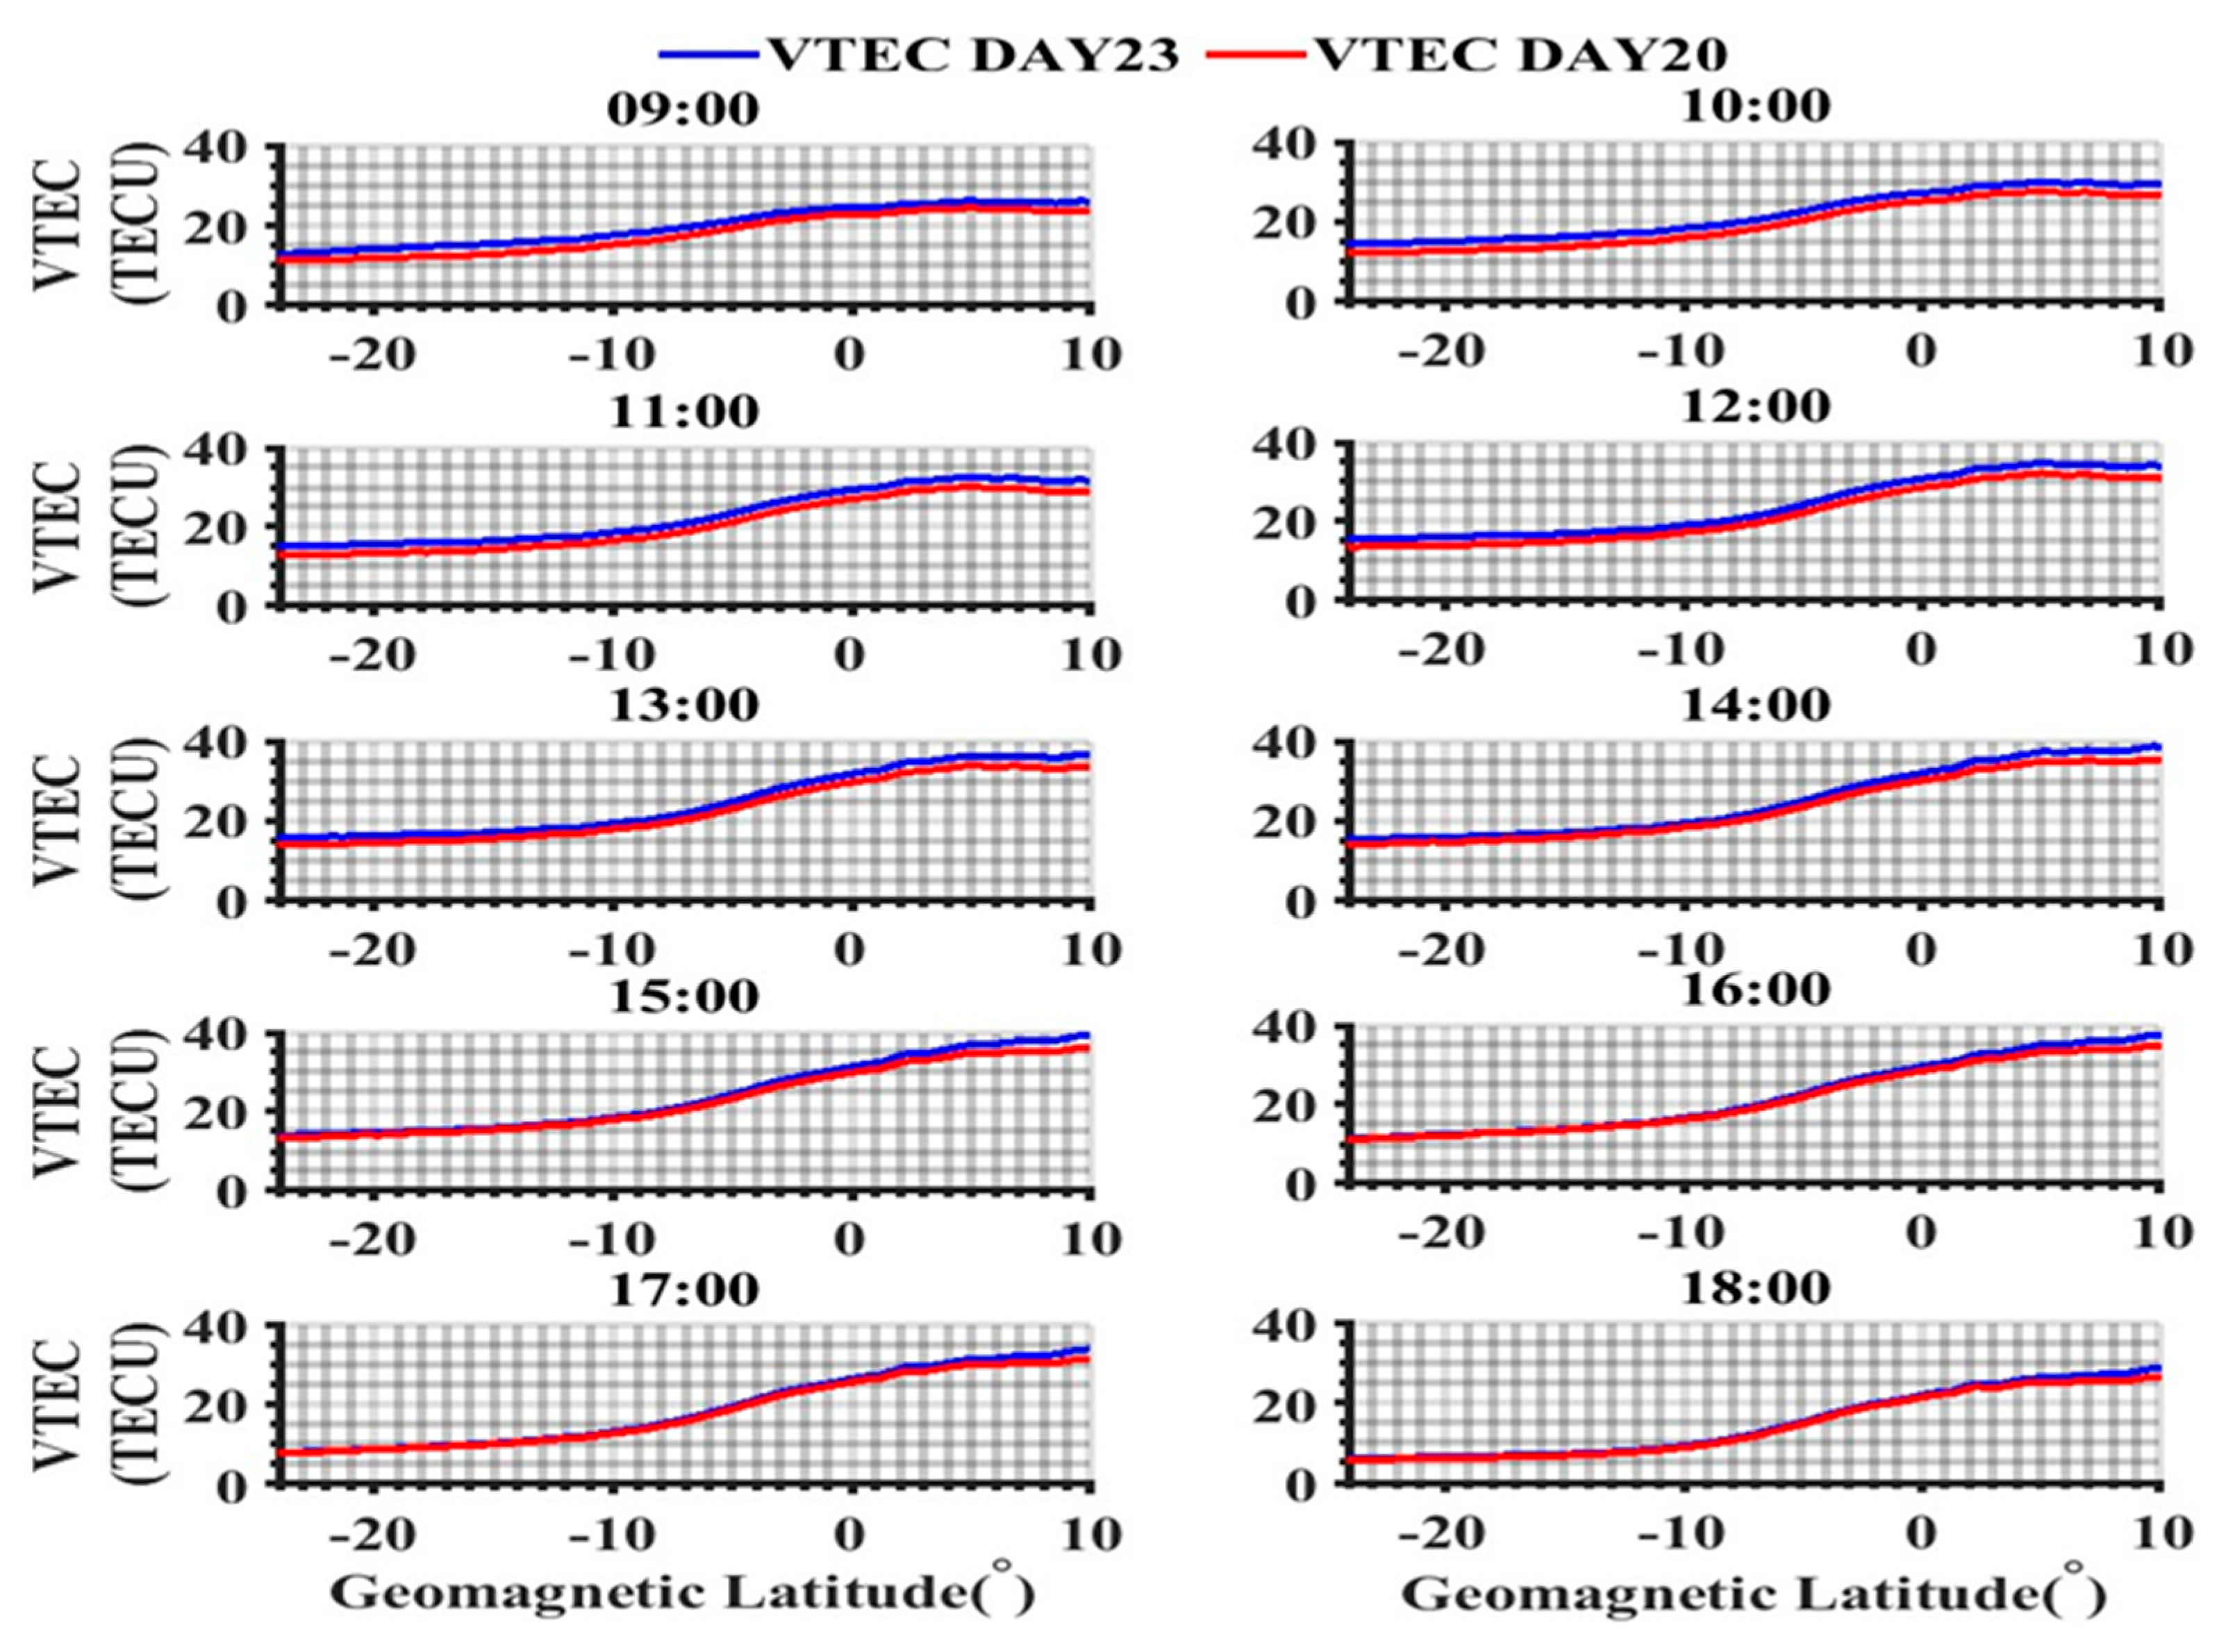
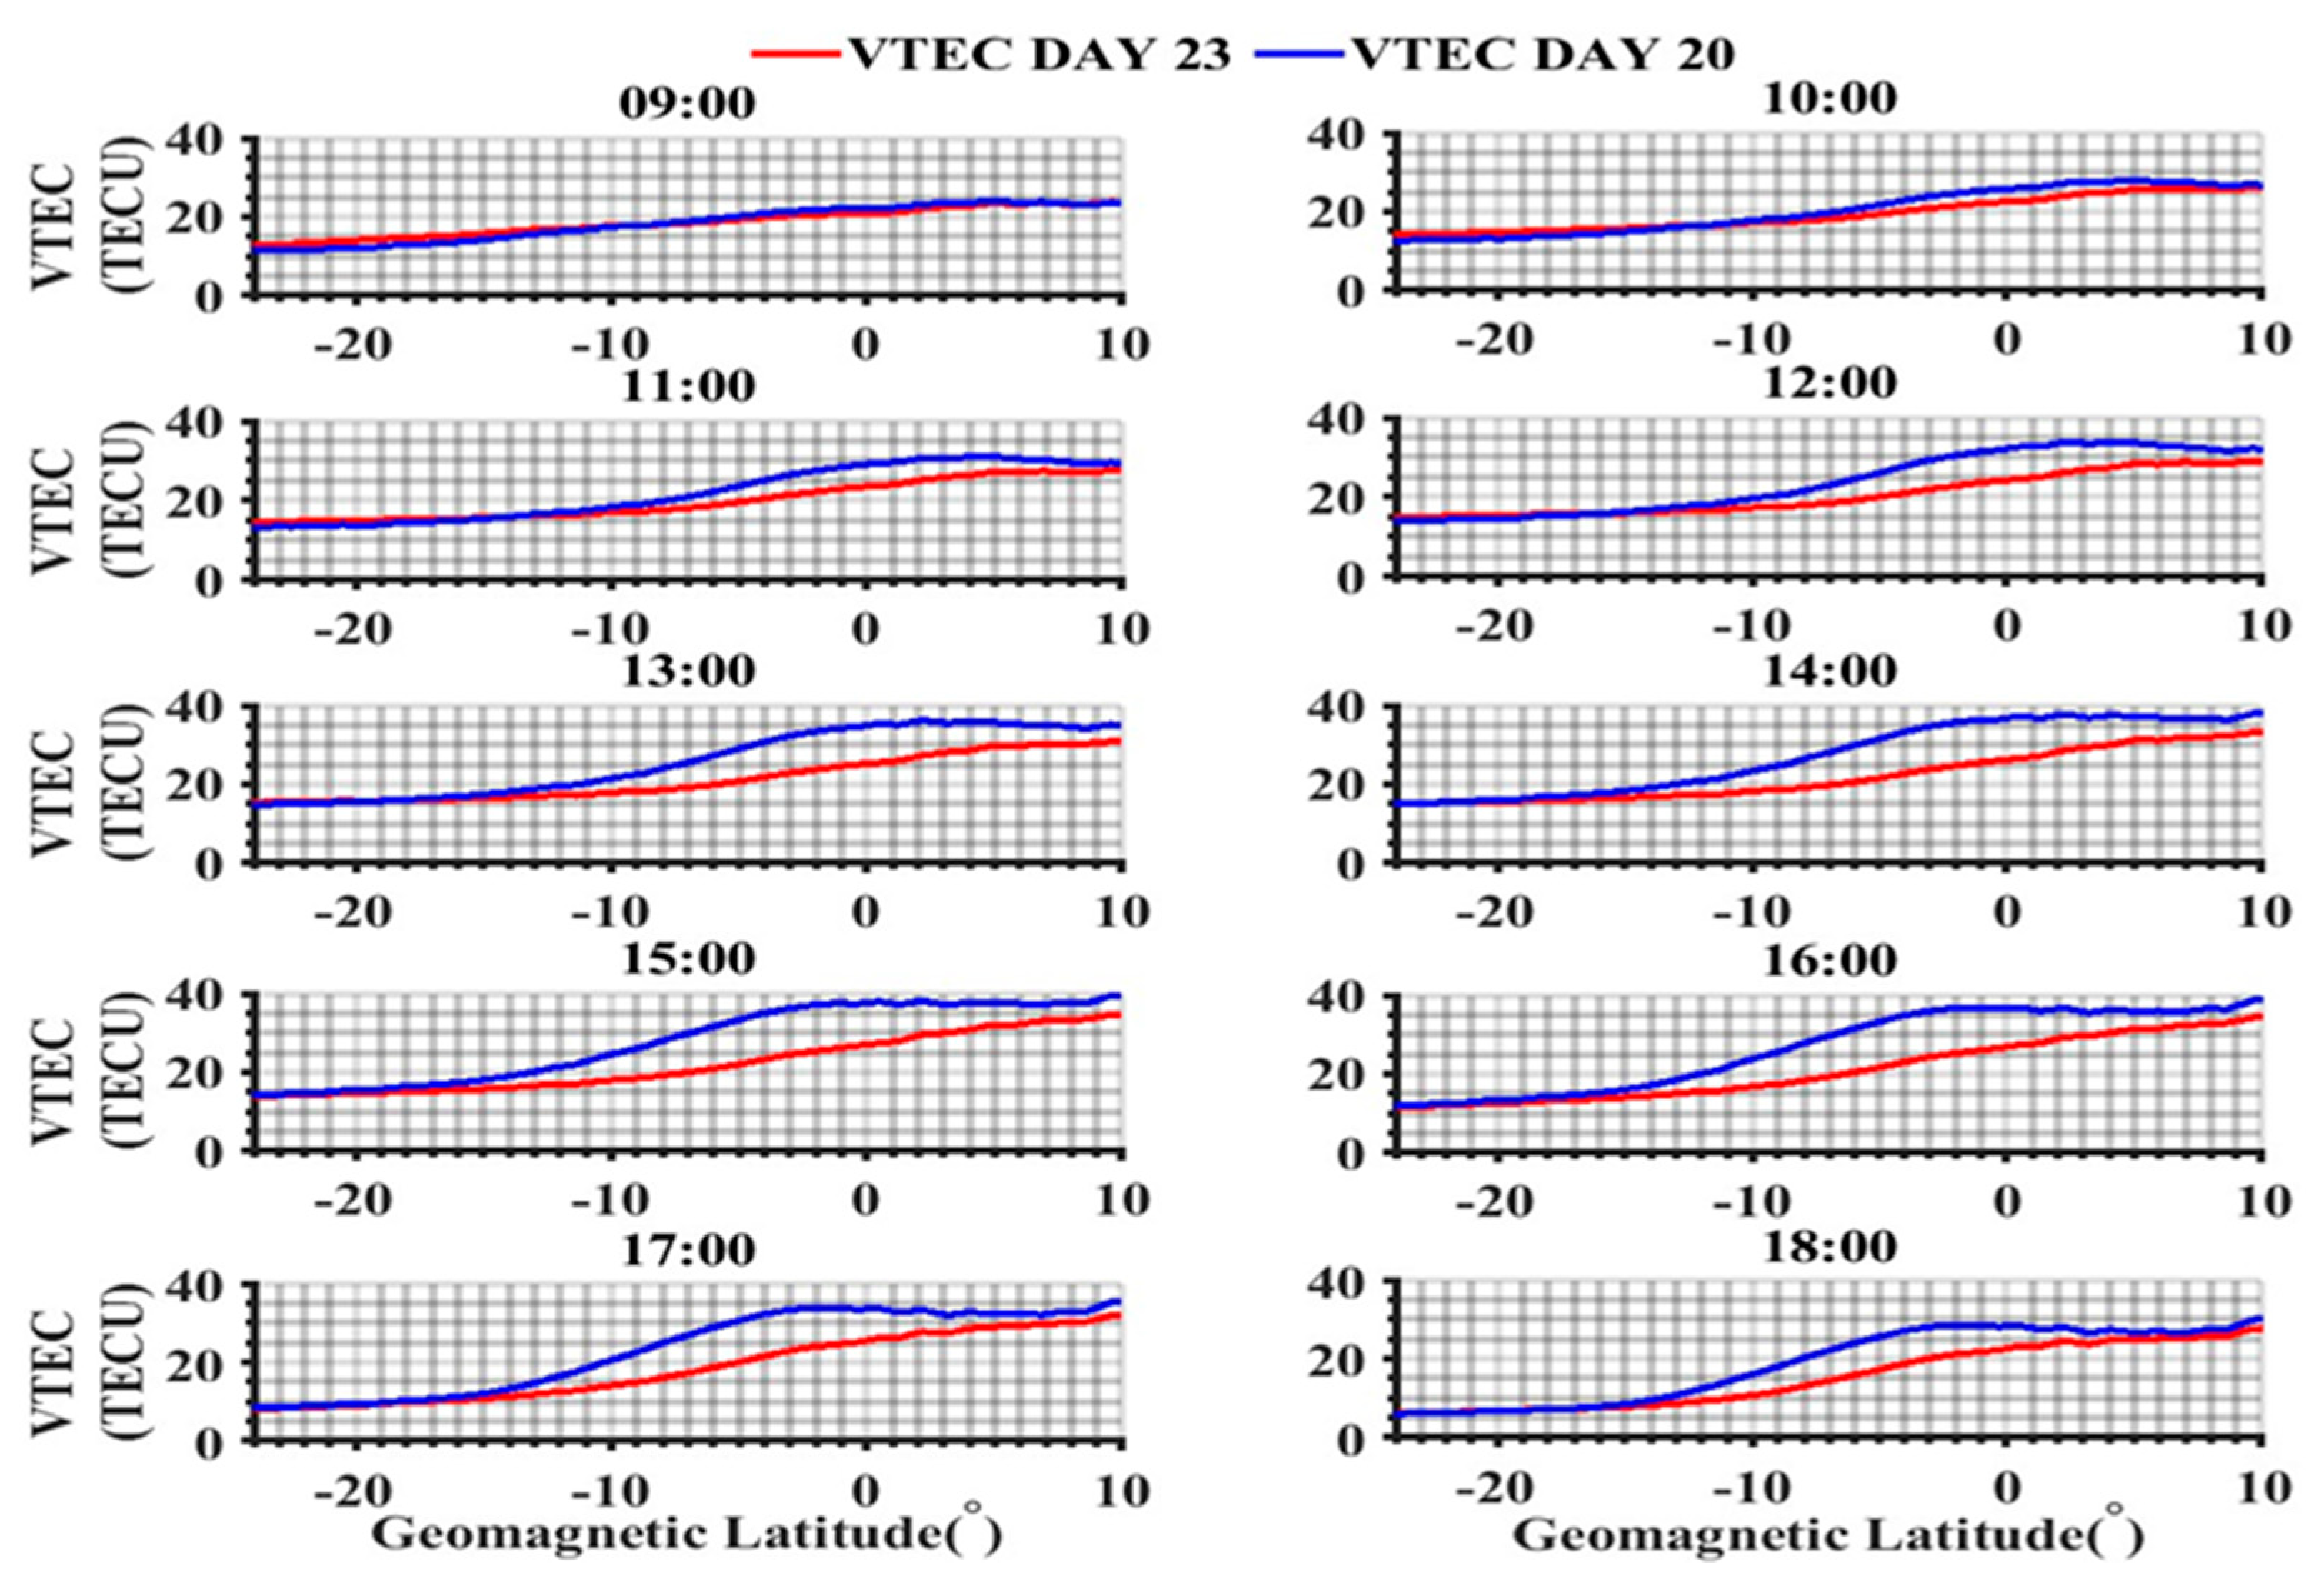
- On 23 June 2015, as depicted in Figure 5, Figure 7, Figure 9, and Figure 10, the occurrence of the negative ionospheric storm can be attributed to two key factors: a reduction in the thermospheric [O]⁄[N_2] ratio and the presence of a westward disturbance dynamo electric field. These elements were observed to be directly linked to the development of the negative ionospheric storm [13,55,56,62,63].
- iii.
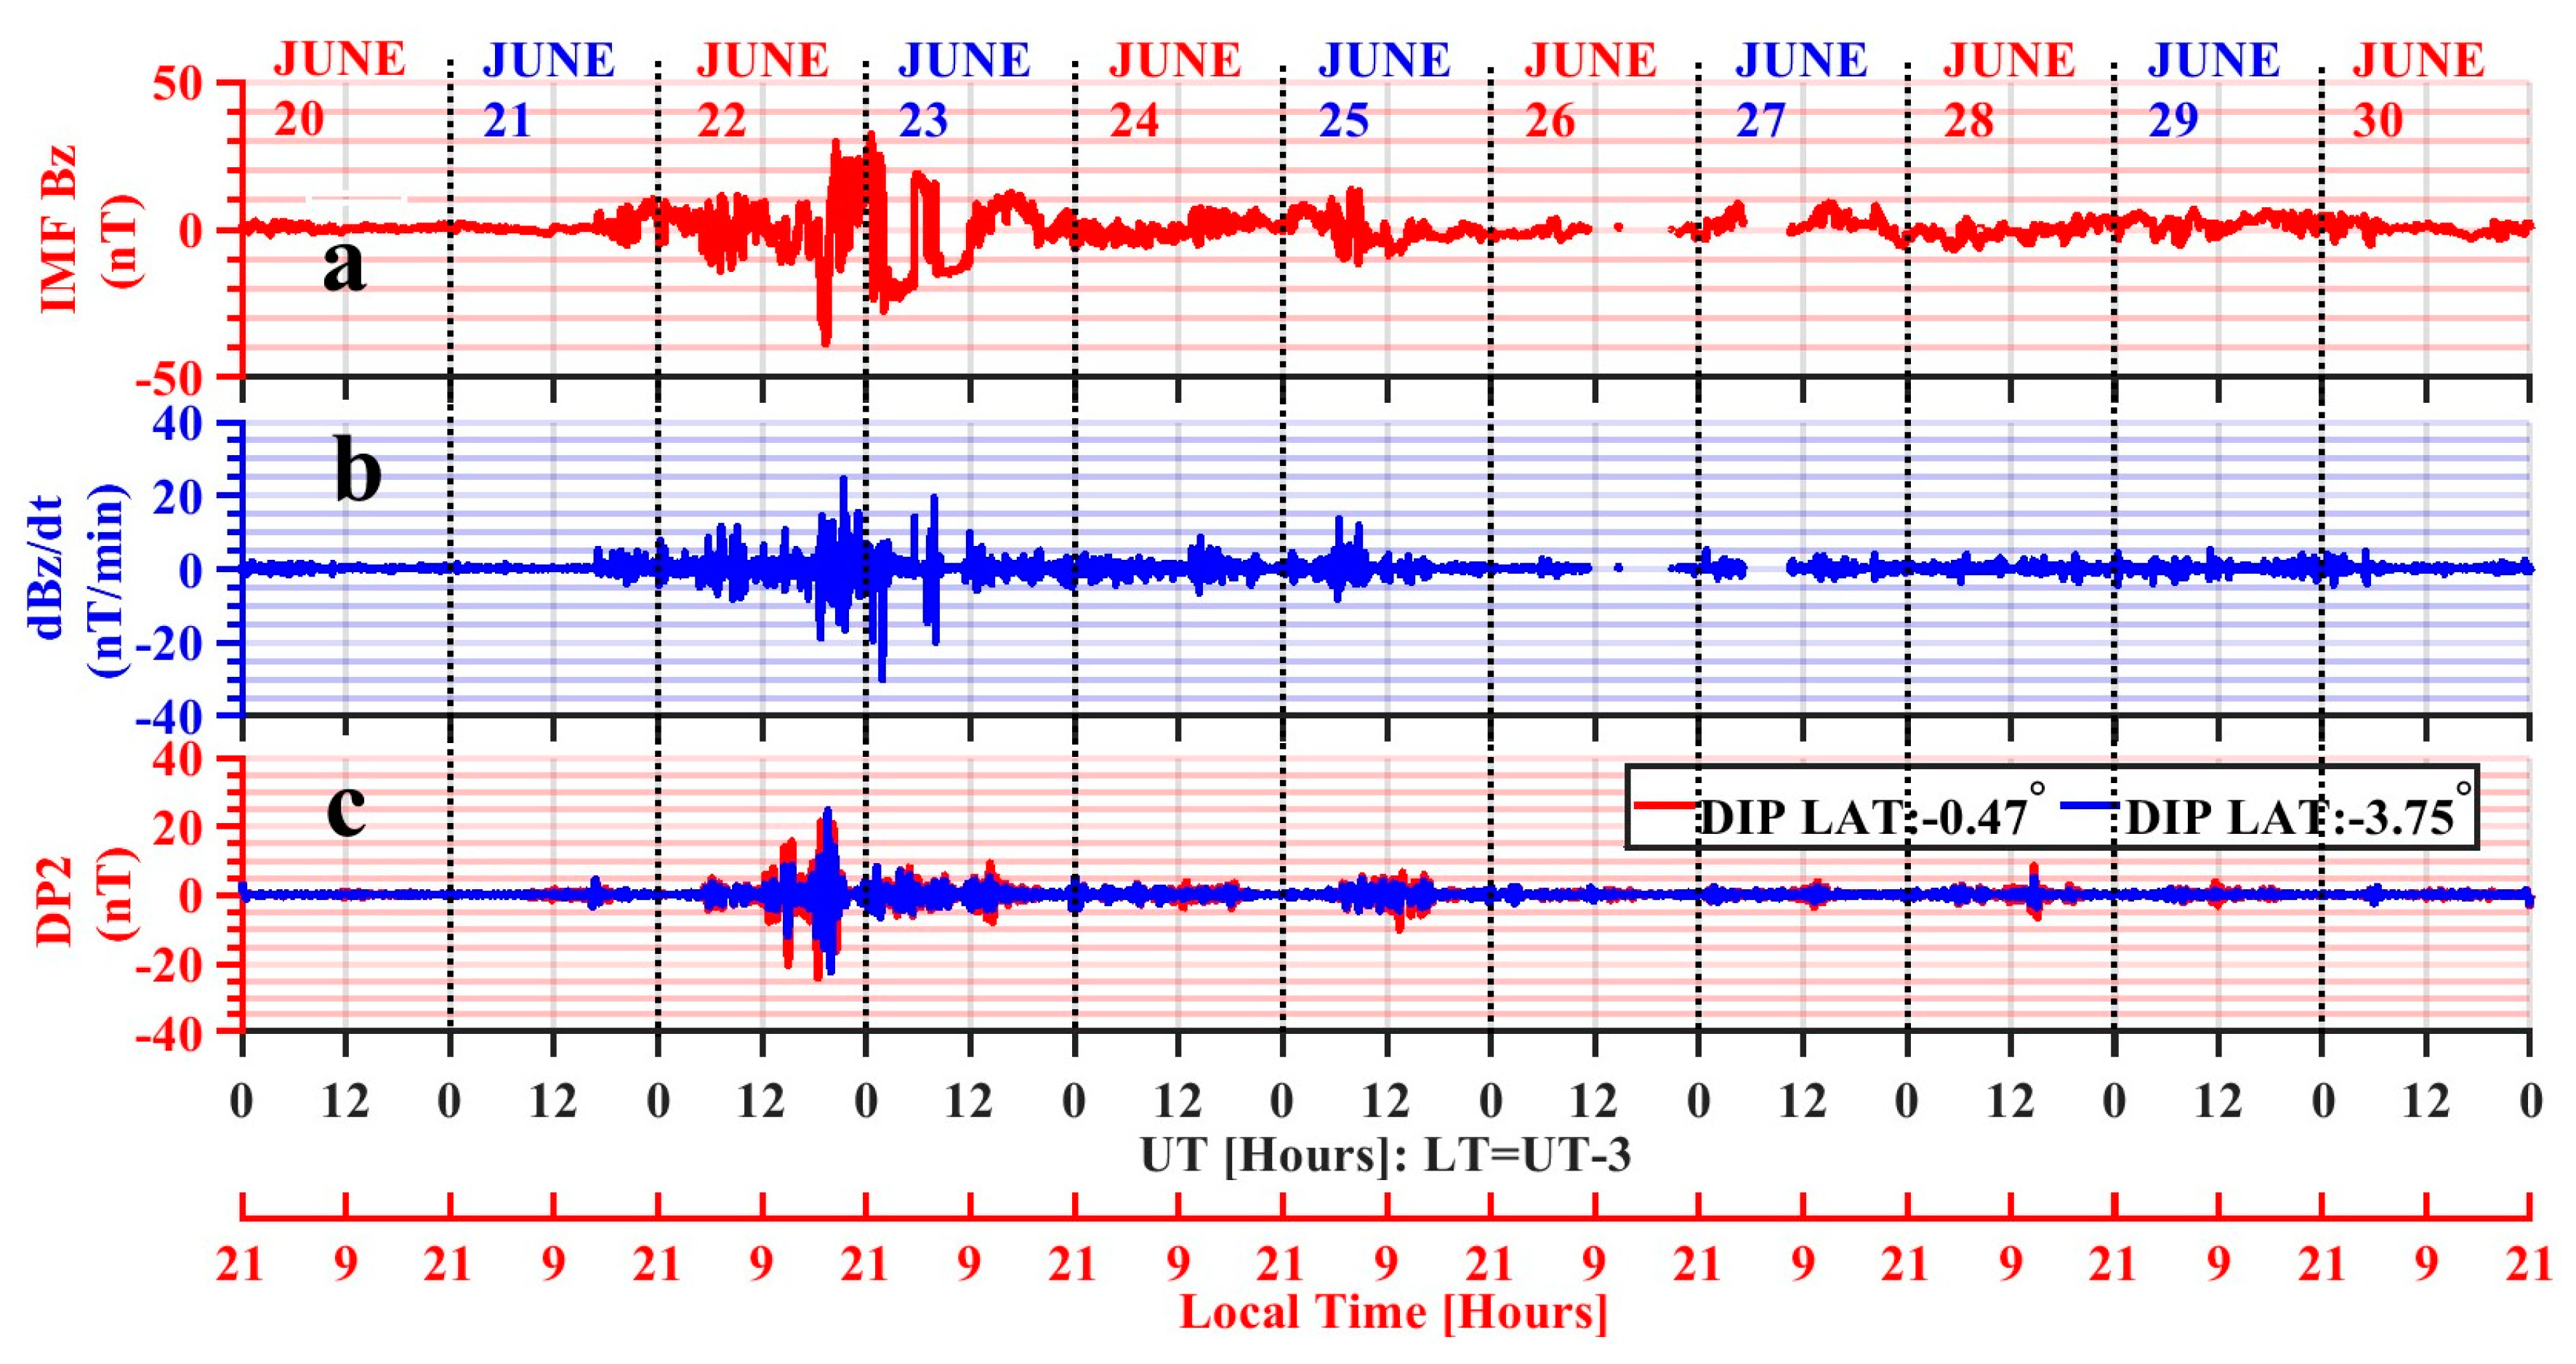
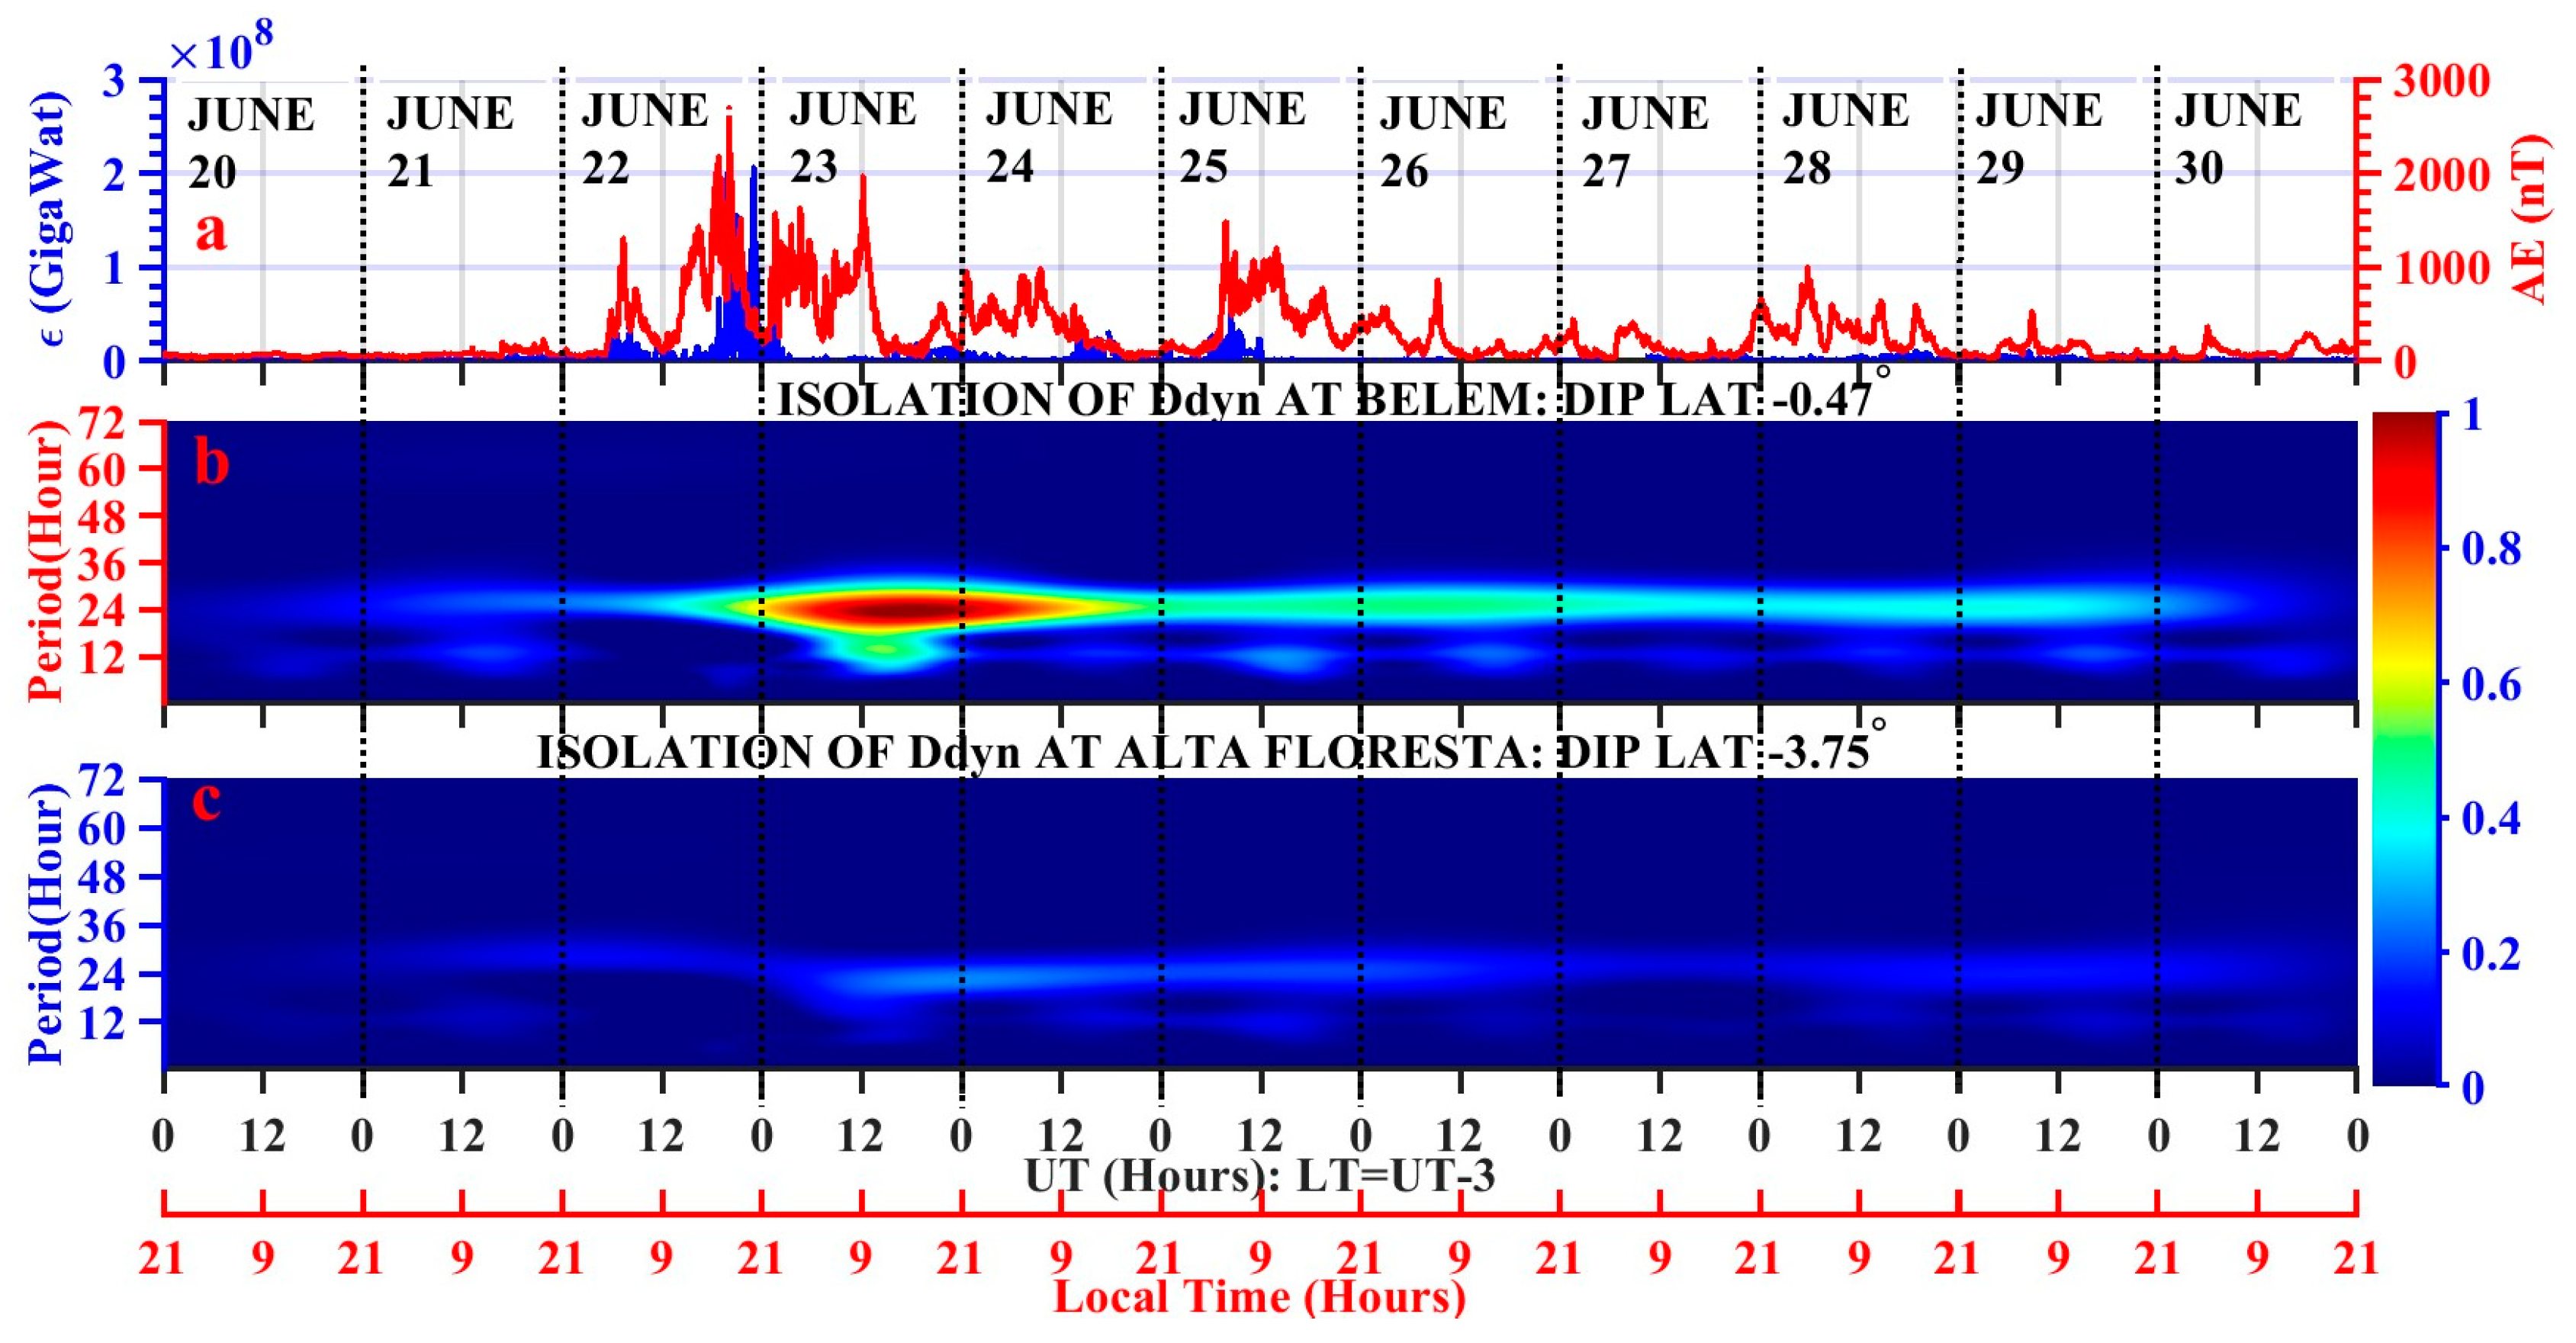
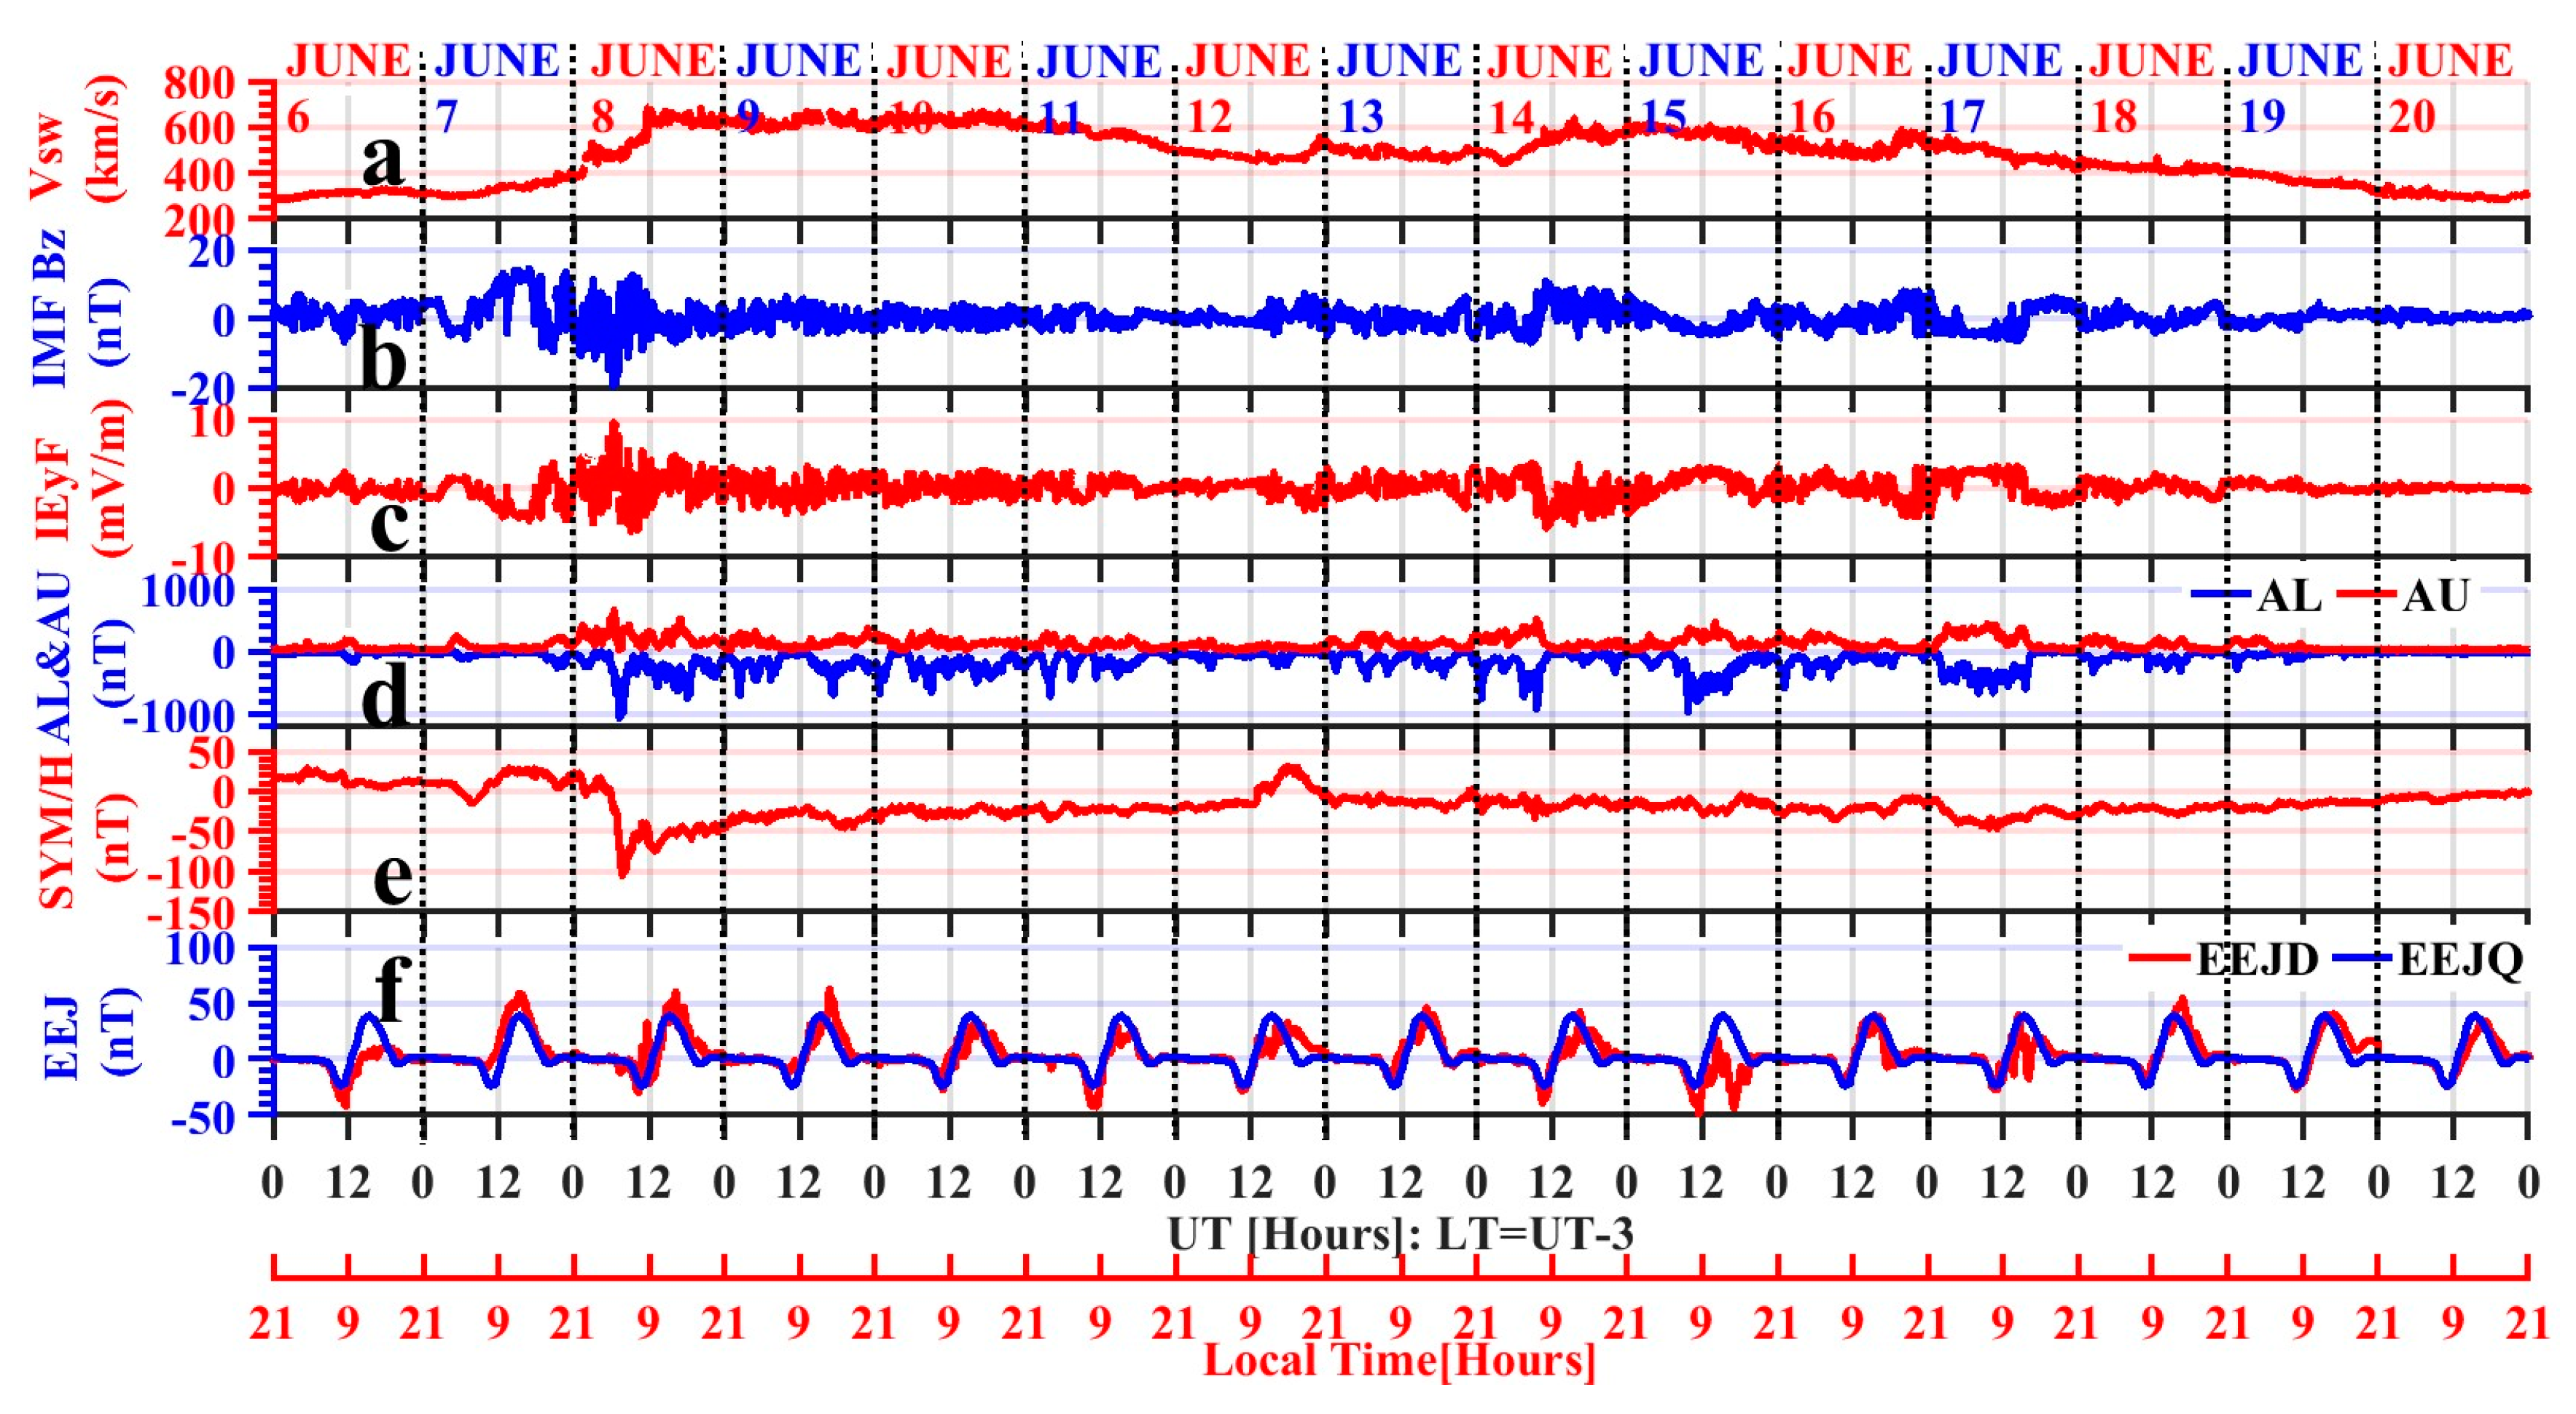
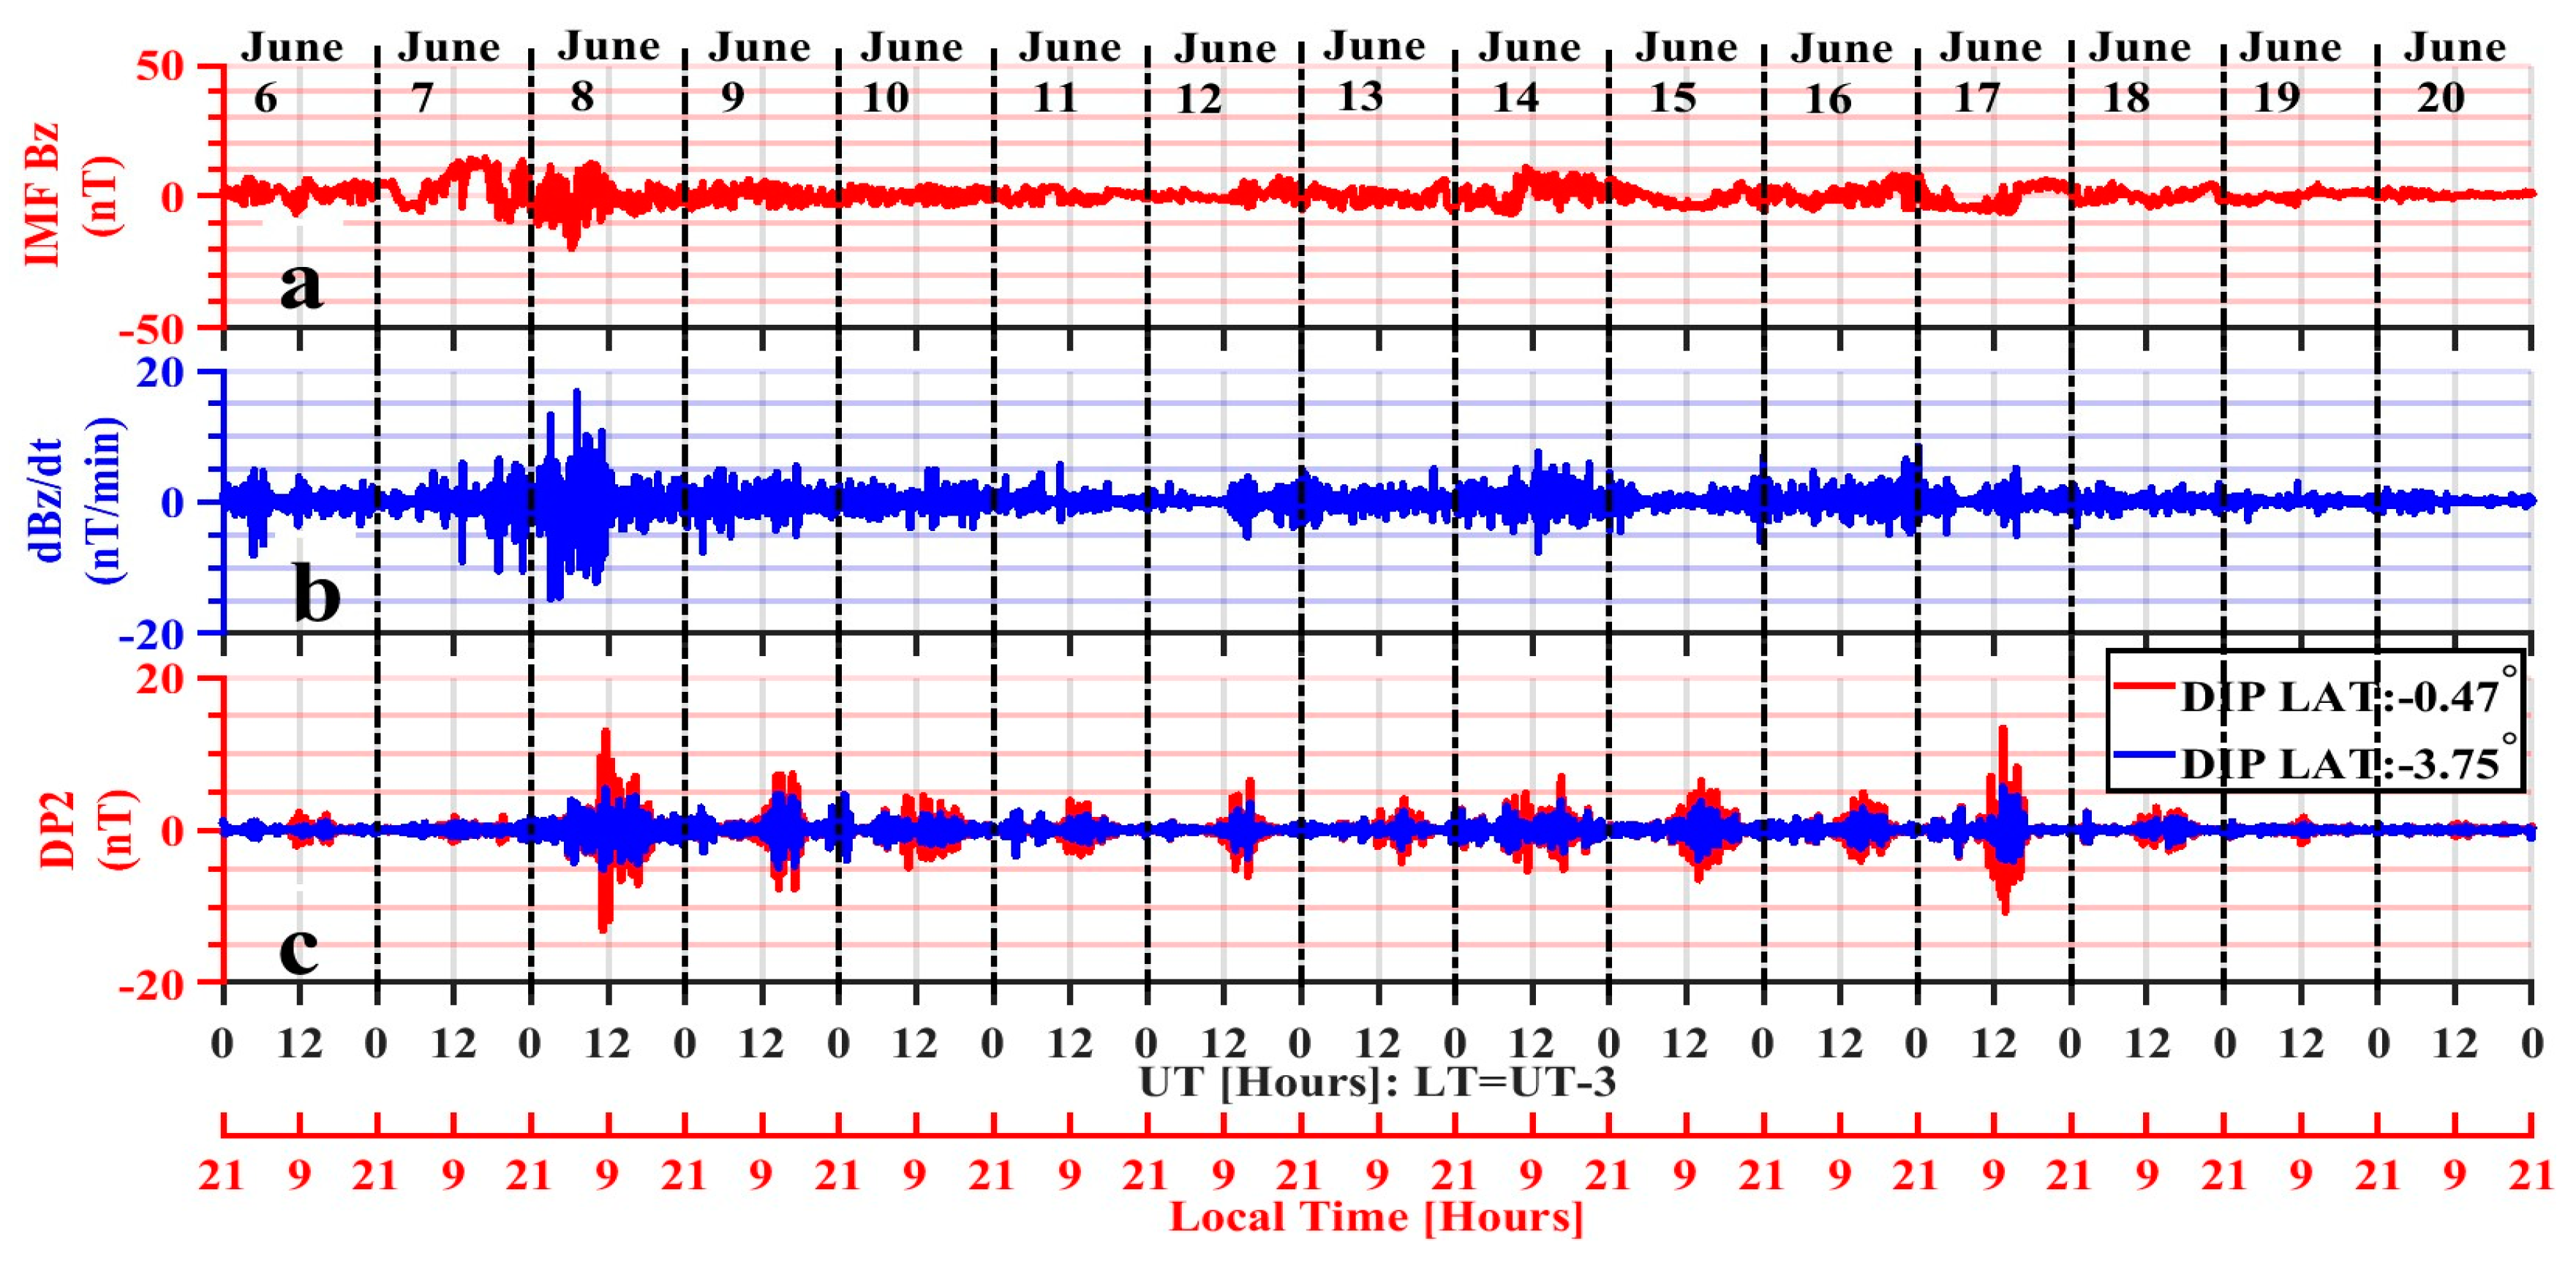
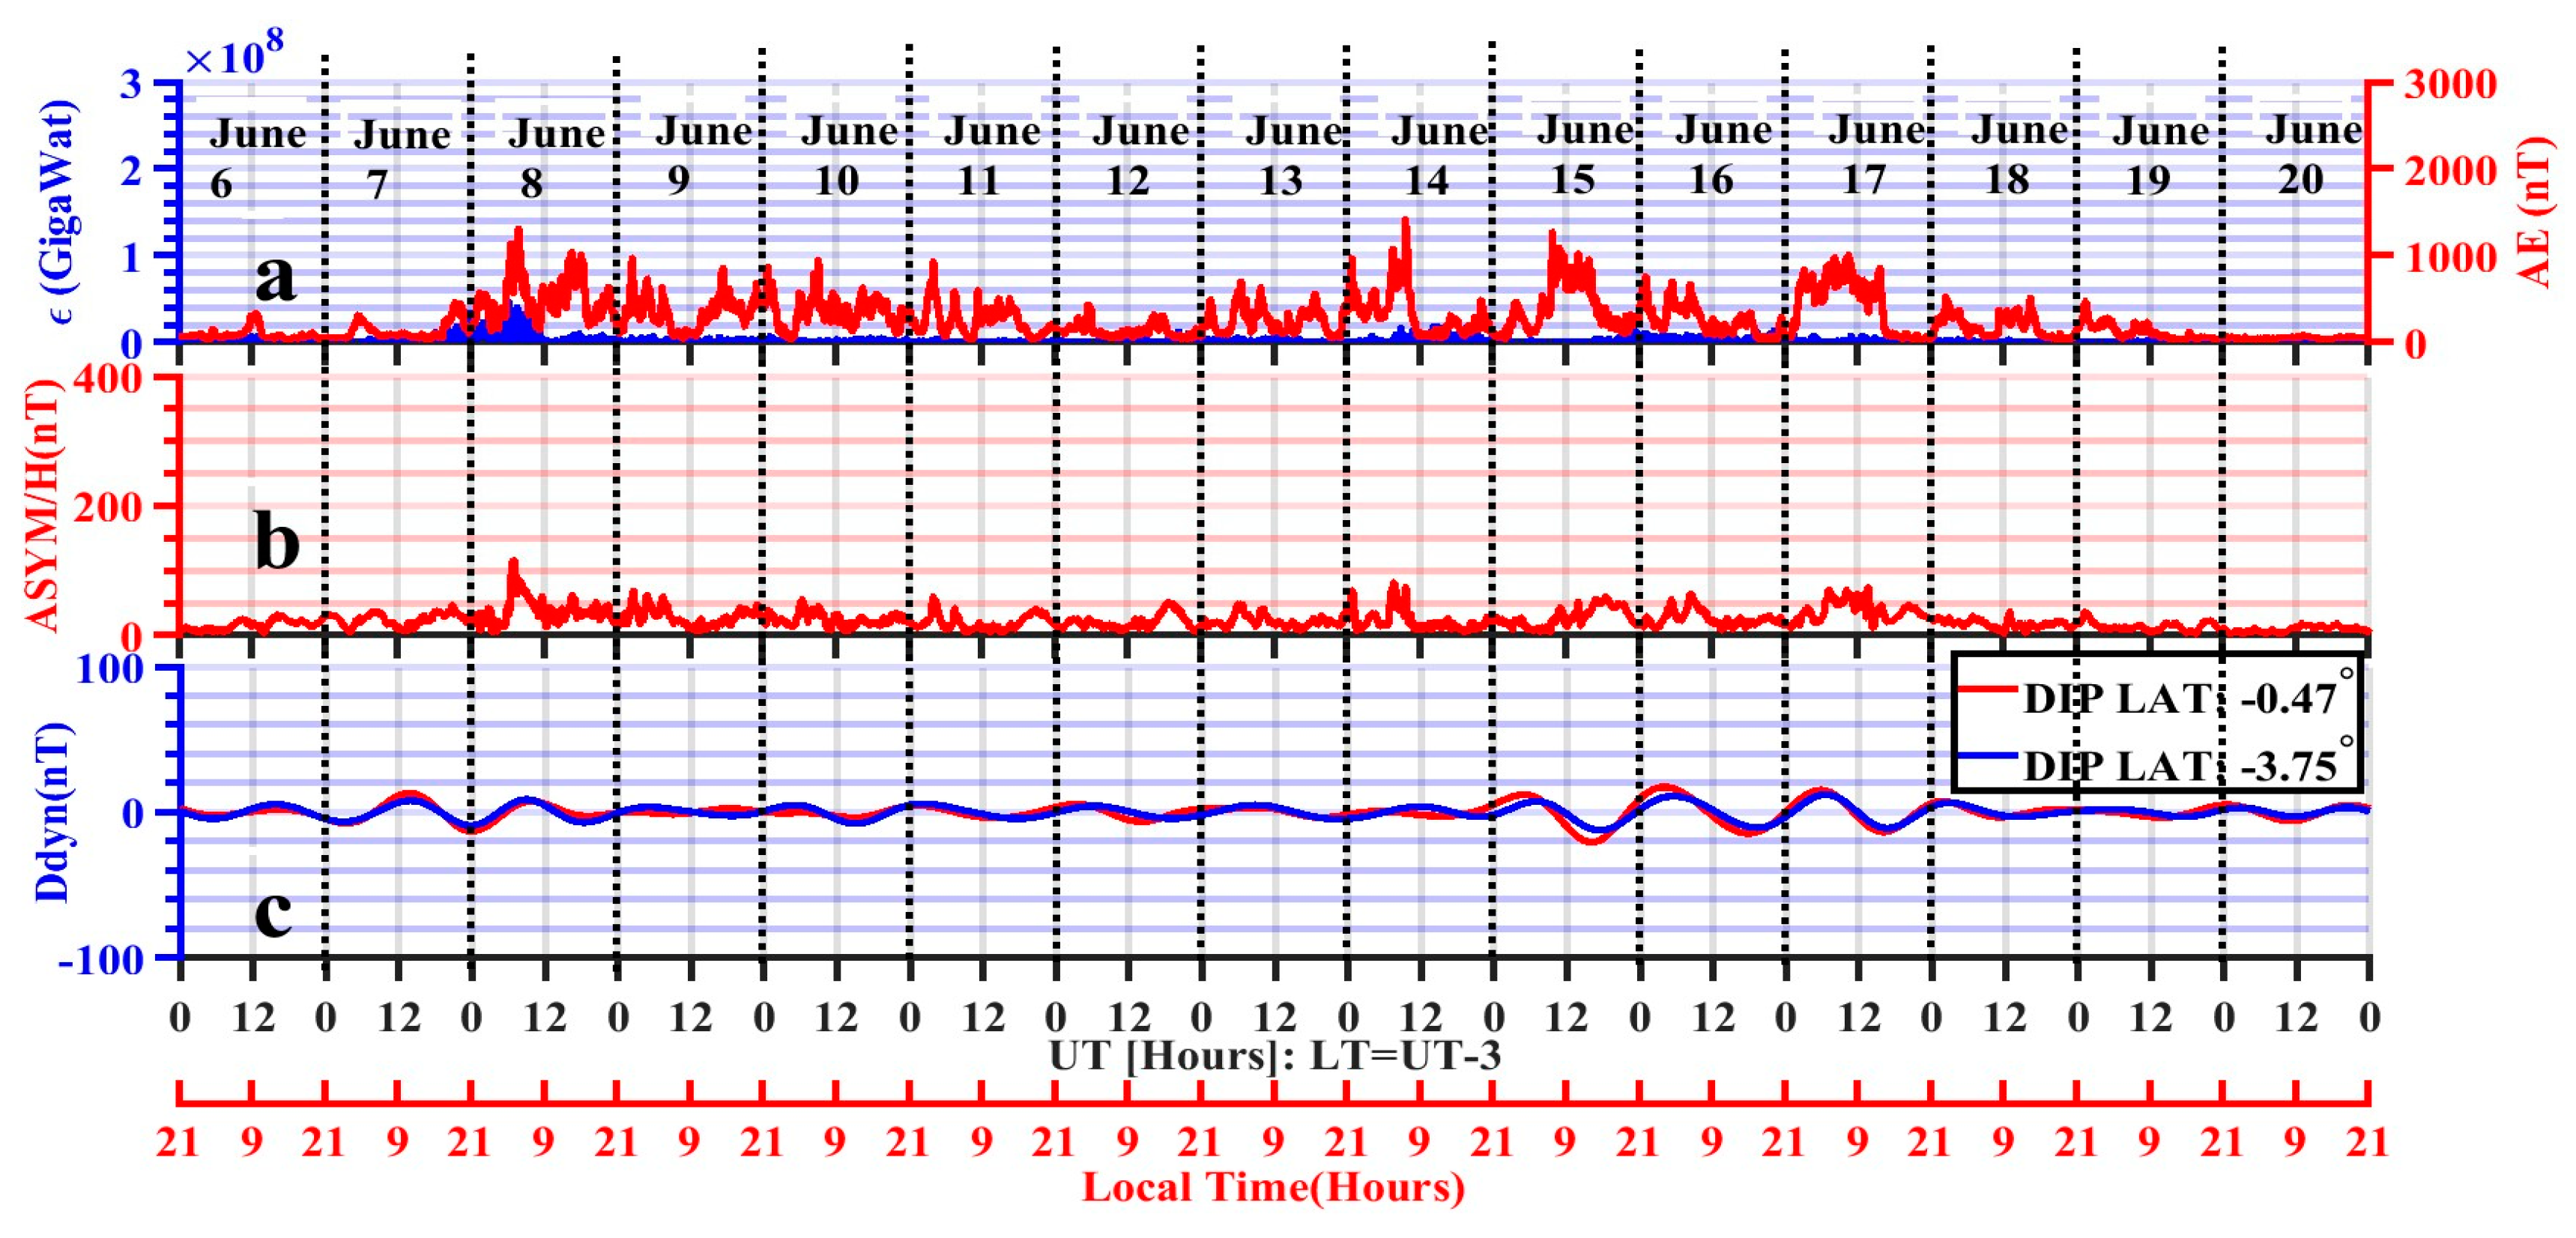
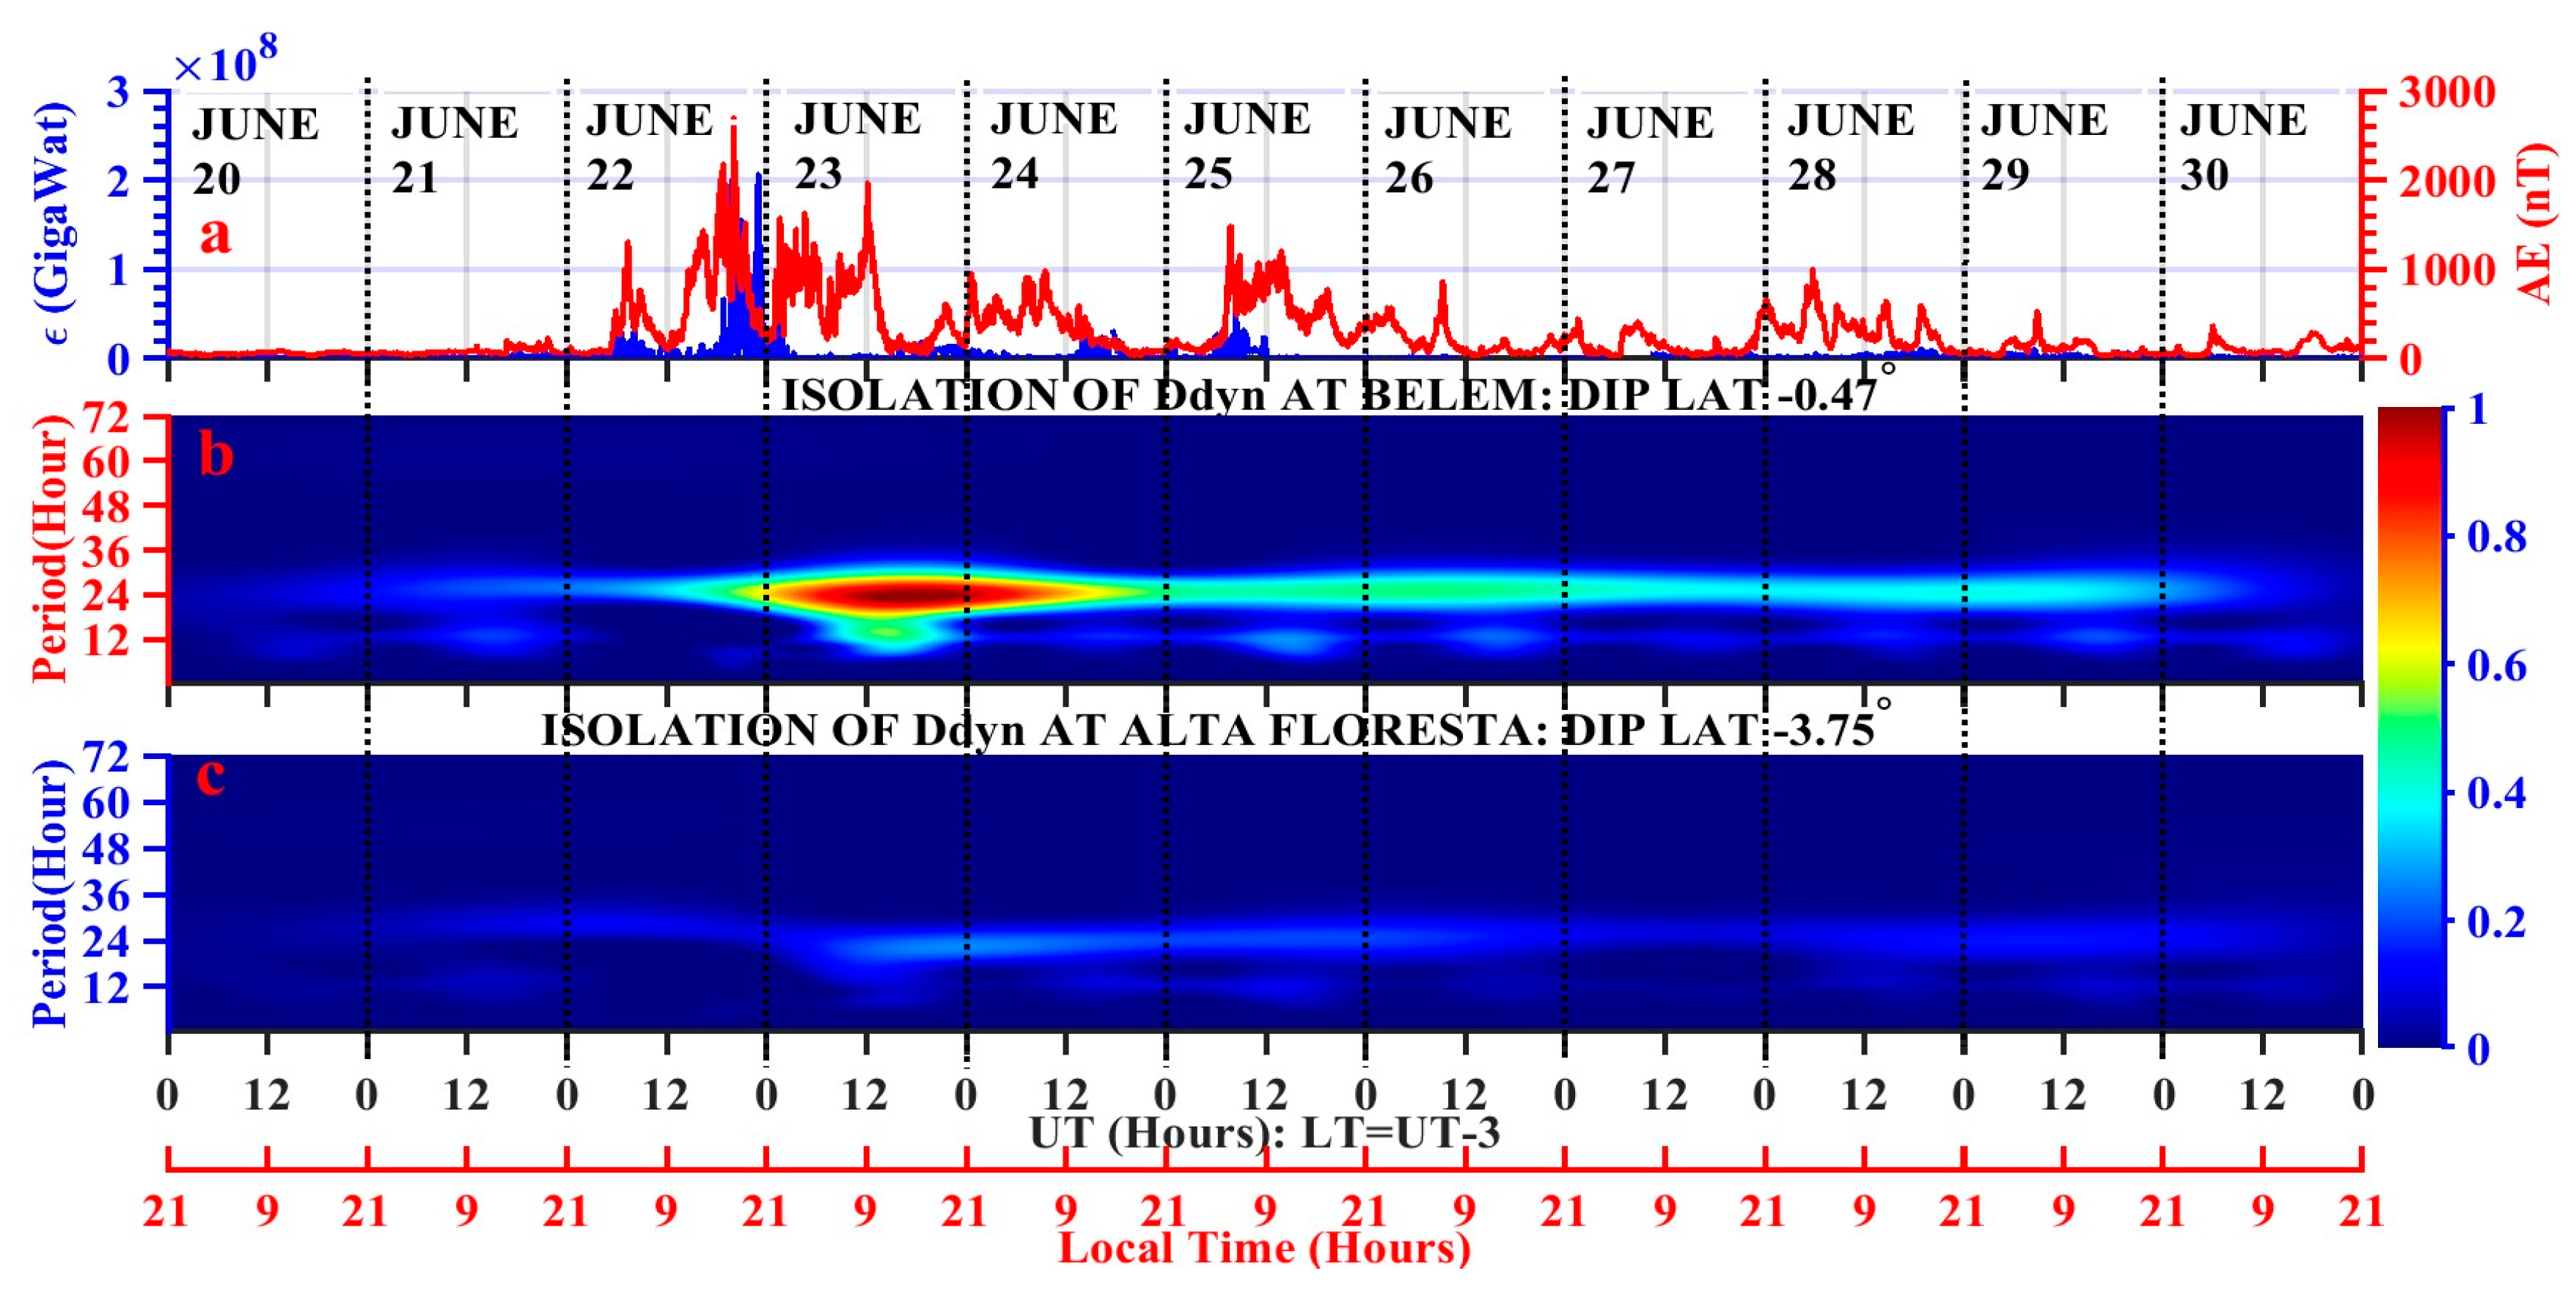
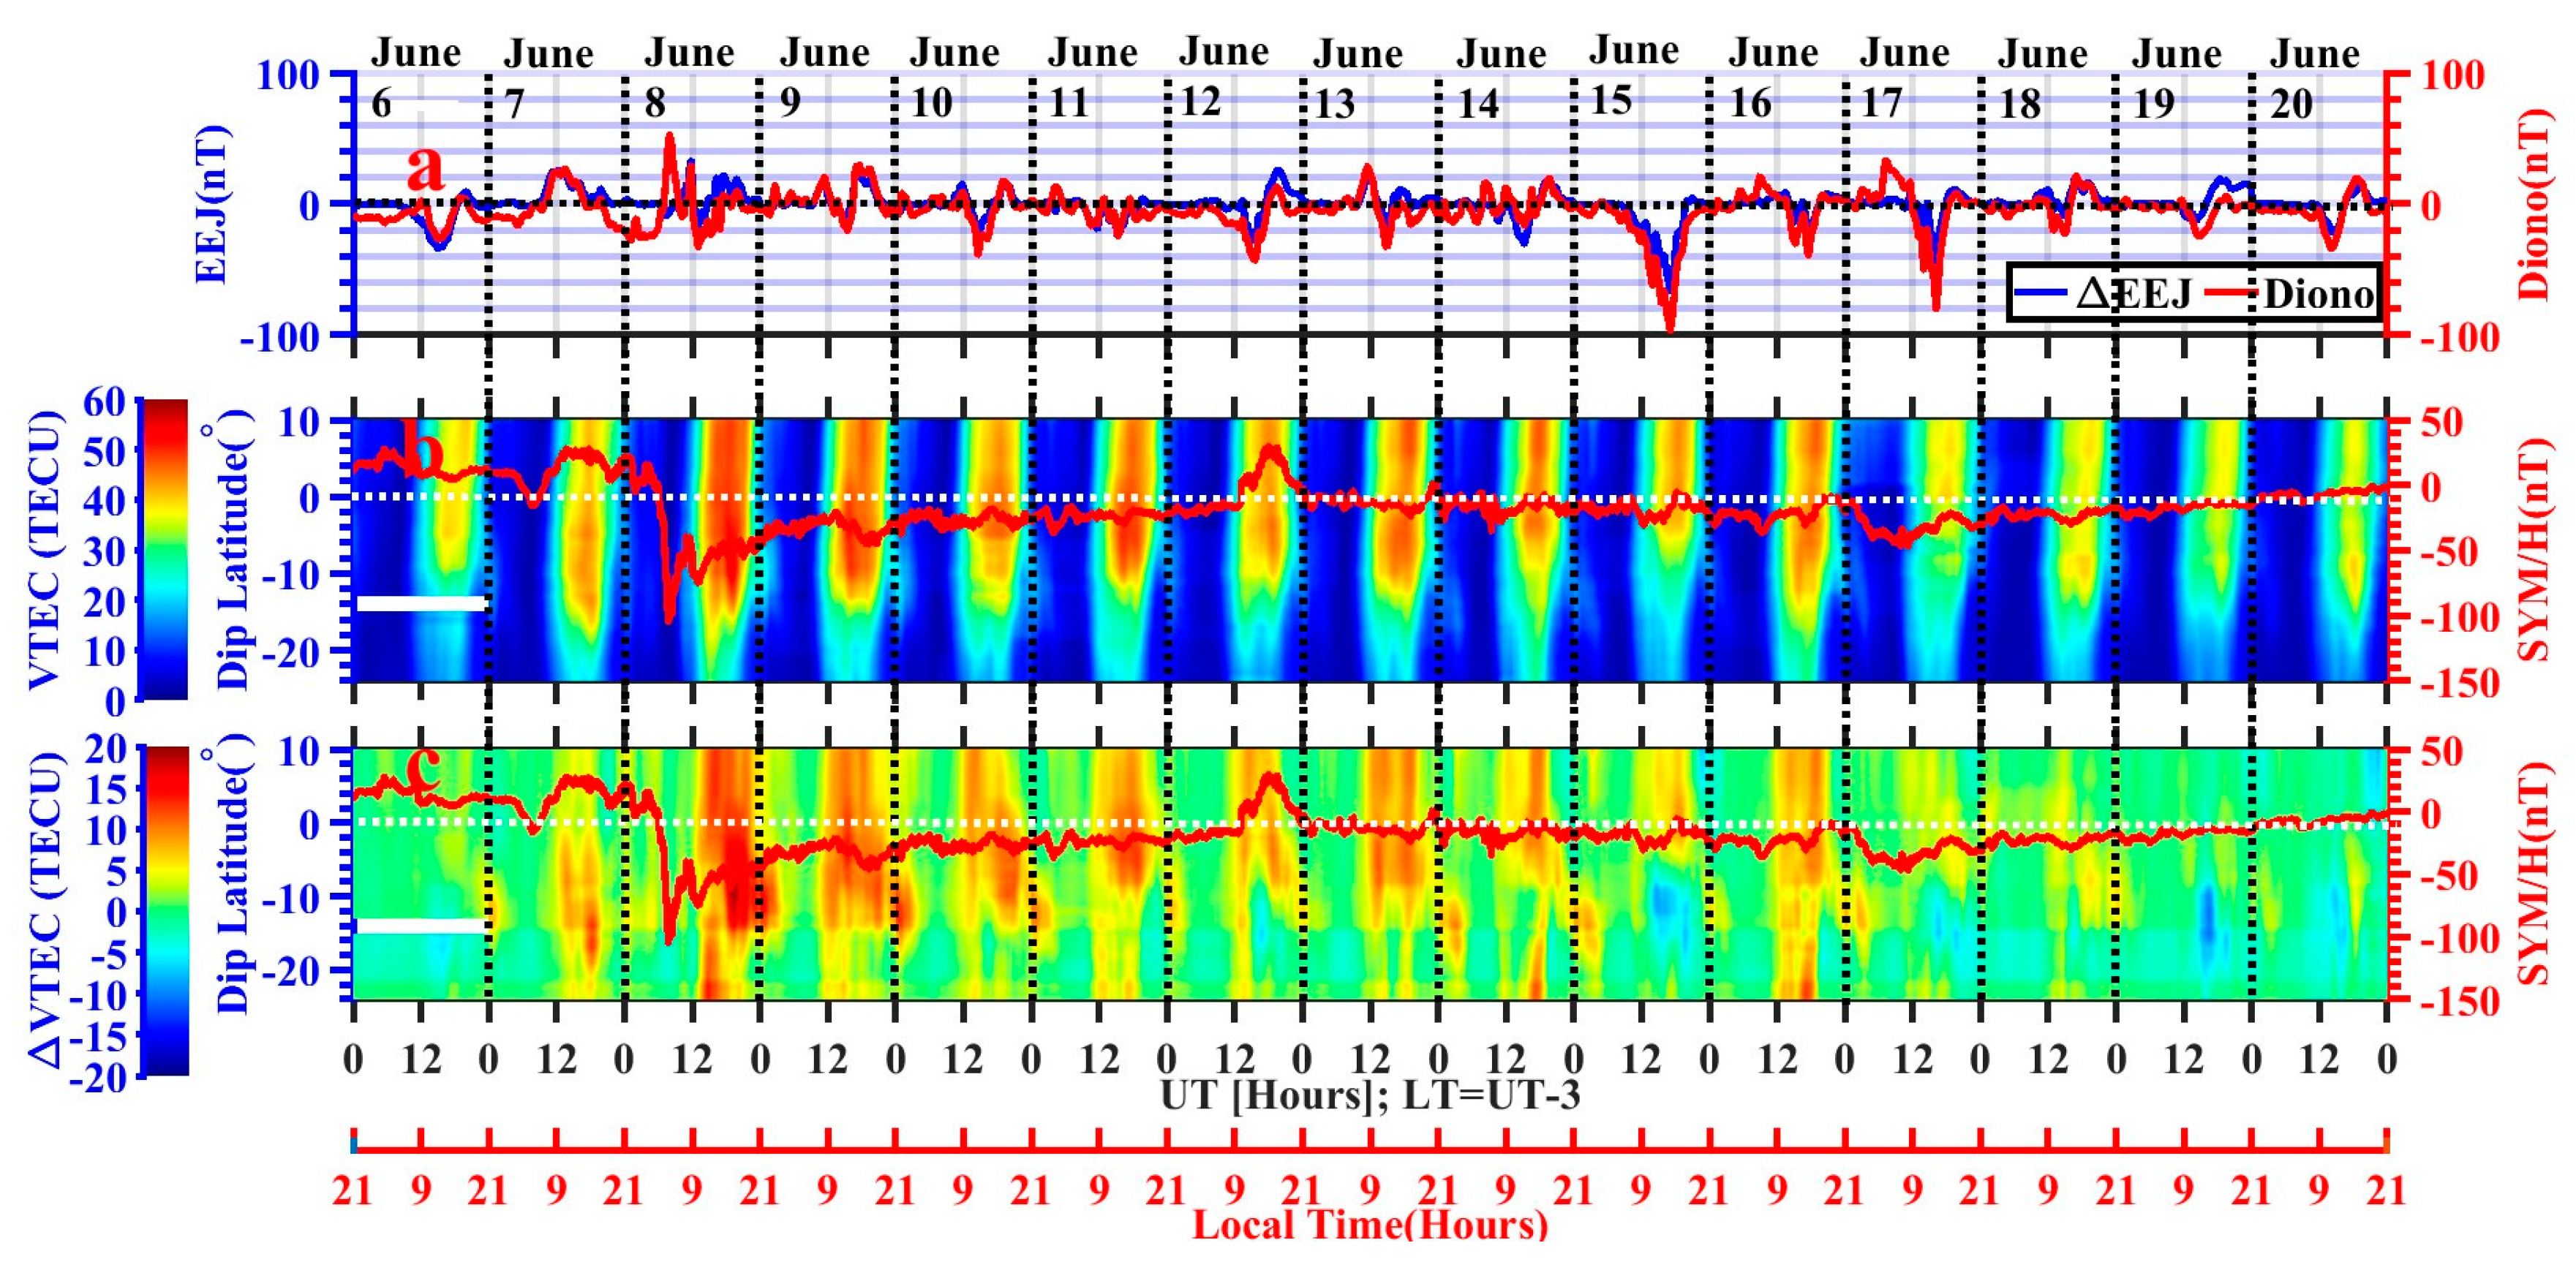
- The amplitude of Ddyn's development during a geomagnetic storm, which arose from the combined effects of a coronal mass ejection (CME) (see Figure 7) and high-speed solar wind streams (HSSWs), is significantly larger and lasts for several days when compared to the geomagnetic storm (see Figure 15) driven solely by HSSWs. Moreover, the cowling conductivity plays a crucial role in amplifying the Ddyn amplitude, as observed in the Belem (dip lat: -0.47˚) and Alta Floresta (dip alt: -3.75˚) regions.
- iv.
- Furthermore, a strong agreement was noted in the results obtained from the two methods used to isolate DP2 and Ddyn from Diono.
- v.
- In order to optimize the SAMI2 model's performance during a period of intense westward development of the disturbance dynamo in the daytime, it is essential to integrate the storm time equatorward wind into the SAMI2 model [19].
References
- D. Knipp, Understanding Space Weather and the Physics Behind It. 2011.
- M. A. Abdu, “Outstanding problems in the equatorial ionosphere-thermosphere electrodynamics relevant to spread F,” 2001. [Online]. Available: www.elsevier.nl/locate/jastp.
- M. E. Greenspan, C. E. Rasmussen, W. J. Burke, and M. A. Abdu, “Equatorial density depletions observed at 840 km during the great magnetic storm of March 1989,” J Geophys Res Space Phys, vol. 96, no. A8, pp. 13931–13942, Aug. 1991. [CrossRef]
- N. Balan, I. S. Batista, M. A. Abdu, J. MacDougall, and G. J. Bailey, “Physical mechanism and statistics of occurrence of an additional layer in the equatorial ionosphere,” J Geophys Res Space Phys, vol. 103, no. A12, pp. 29169–29181, Dec. 1998. [CrossRef]
- E. R. de Paula et al., “Ionospheric irregularity behavior during the September 6–10, 2017 magnetic storm over Brazilian equatorial–low latitudes,” Earth, Planets and Space, vol. 71, no. 1, p. 42, Dec. 2019. [CrossRef]
- R. Raghavarao, L. E. Wharton, N. W. Spencer, H. G. Mayr, and L. H. Brace, “An equatorial temperature and wind anomaly (ETWA),” Geophys Res Lett, vol. 18, no. 7, pp. 1193–1196, Jul. 1991. [CrossRef]
- N. Mridula and T. K. Pant, “On the possible role of zonal dynamics in the formation and evolution of F3 layers over equator,” J Atmos Sol Terr Phys, vol. 134, pp. 69–77, Nov. 2015. [CrossRef]
- N. Mridula, T. K. Pant, and G. Manju, “On the variability of the Equatorial Ionization Anomaly Trough over Indian region: A novel analysis using Beacon TEC measurements,” Advances in Space Research, vol. 66, no. 3, pp. 646–654, Aug. 2020. [CrossRef]
- E. v. APPLETON, “Two Anomalies in the Ionosphere,” Nature, vol. 157, no. 3995, pp. 691–691, May 1946. [CrossRef]
- L. Jose, S. Ravindran, C. Vineeth, T. K. Pant, and S. Alex, “Investigation of the response time of the equatorial ionosphere in context of the equatorial electrojet and equatorial ionization anomaly,” Ann Geophys, vol. 29, no. 7, pp. 1267–1275, 2011. [CrossRef]
- N. Balan, J. Souza, and G. J. Bailey, “Recent developments in the understanding of equatorial ionization anomaly: A review,” J Atmos Sol Terr Phys, vol. 171, pp. 3–11, Jun. 2018. [CrossRef]
- J. H. Sastri, “Equatorial anomaly in F-region-A review,” 1990.
- N. Balan, L. Liu, and H. Le, “A brief review of equatorial ionization anomaly and ionospheric irregularities,” Earth and Planetary Physics, vol. 2, no. 4, pp. 1–19, 2018. [CrossRef]
- N. Balan, H. Alleyne, Y. Otsuka, D. Vijaya Lekshmi, B. G. Fejer, and I. McCrea, “Relative effects of electric field and neutral wind on positive ionospheric storms,” Earth, Planets and Space, vol. 61, no. 4, pp. 439–445, Apr. 2009. [CrossRef]
- M. Piersanti et al., “Comprehensive Analysis of the Geoeffective Solar Event of 21 June 2015: Effects on the Magnetosphere, Plasmasphere, and Ionosphere Systems,” Sol Phys, vol. 292, no. 11, p. 169, Nov. 2017. [CrossRef]
- M. A. Abdu, J. H. Sastri, J. MacDougall, I. S. Batista, and J. H. A. Sobral, “Equatorial disturbance dynamo electric field longitudinal structure and spread F: A case study from GUARA/EITS campaigns,” Geophys Res Lett, vol. 24, no. 13, pp. 1707–1710, 1997. [CrossRef]
- M. A. Abdu, J. R. de Souza, J. H. A. Sobral, and I. S. Batista, “Magnetic storm associated disturbance dynamo effects in the low and equatorial latitude ionosphere,” 2006, pp. 283–304. [CrossRef]
- J. Rodríguez-Zuluaga, S. M. Radicella, B. Nava, C. Amory-Mazaudier, H. Mora-Páez, and K. Alazo-Cuartas, “Distinct responses of the low-latitude ionosphere to CME and HSSWS: The role of the IMF Bz oscillation frequency,” J Geophys Res Space Phys, vol. 121, no. 11, pp. 11,528-11,548, Nov. 2016. [CrossRef]
- C. Amory-Mazaudier, O. S. Bolaji, and V. Doumbia, “On the historical origins of the CEJ, DP2, and Ddyn current systems and their roles in the predictions of ionospheric responses to geomagnetic storms at equatorial latitudes,” J Geophys Res Space Phys, vol. 122, no. 7, pp. 7827–7833, Jul. 2017. [CrossRef]
- B. Nava et al., “Middle- and low-latitude ionosphere response to 2015 St. Patrick’s Day geomagnetic storm,” J Geophys Res Space Phys, vol. 121, no. 4, pp. 3421–3438, Apr. 2016. [CrossRef]
- P. O. Amaechi et al., “Ground-Based GNSS and C/NOFS Observations of Ionospheric Irregularities Over Africa: A Case Study of the 2013 St. Patrick’s Day Geomagnetic Storm,” Space Weather, vol. 19, no. 2, Feb. 2021. [CrossRef]
- M. Blanc, S. Profile, and A. D. Richmond, “THE IONOSPHERIC DISTURBANCE DYNAMO,” 1980. [Online]. Available: https://www.researchgate.net/publication/349725008.
- W. Younas, C. Amory-Mazaudier, M. Khan, and R. Fleury, “Ionospheric and Magnetic Signatures of a Space Weather Event on 25–29 August 2018: CME and HSSWs,” J Geophys Res Space Phys, vol. 125, no. 8, Aug. 2020. [CrossRef]
- C. Amory-Mazaudier, “Magnetic Signatures of Large-Scale Electric Currents in the Earth’s Environment at Middle and Low Latitudes,” Atmosphere (Basel), vol. 13, no. 10, p. 1699, Oct. 2022. [CrossRef]
- V. H. Vasyliunas, “Mathematical model of magnetospheric convection and its coupling to the ionosphere. In Particles and Fields in the Magnetosphere,” Mc Cormac, B.M., Ed.; D. Reidel Publ. Co.: Dordrecht, The Netherlands, 1970.
- G. A. Mansilla, “Ionospheric Response to the Magnetic Storm of 22 June 2015,” Pure Appl Geophys, vol. 175, no. 3, pp. 1139–1153, Mar. 2018. [CrossRef]
- E. Astafyeva, I. Zakharenkova, J. D. Huba, E. Doornbos, and J. IJssel, “Global Ionospheric and Thermospheric Effects of the June 2015 Geomagnetic Disturbances: Multi-Instrumental Observations and Modeling,” J Geophys Res Space Phys, vol. 122, no. 11, Nov. 2017. [CrossRef]
- E. Astafyeva et al., “Study of the Equatorial and Low-Latitude Electrodynamic and Ionospheric Disturbances During the 22–23 June 2015 Geomagnetic Storm Using Ground-Based and Spaceborne Techniques,” J Geophys Res Space Phys, vol. 123, no. 3, pp. 2424–2440, Mar. 2018. [CrossRef]
- B. Paul, B. K. De, and A. Guha, “Latitudinal variation of F-region ionospheric response during three strongest geomagnetic storms of 2015,” Acta Geodaetica et Geophysica, vol. 53, no. 4, pp. 579–606, Dec. 2018. [CrossRef]
- P. O. Amaechi, E. O. Oyeyemi, and A. O. Akala, “Geomagnetic storm effects on the occurrences of ionospheric irregularities over the African equatorial/low-latitude region,” Advances in Space Research, vol. 61, no. 8, pp. 2074–2090, Apr. 2018. [CrossRef]
- Gopi, “GPS-TEC analysis software,” 2011. [Online]. Available: https://www.researchgate.net/publication/255978205.
- R. G. Rastogi, T. Kitamura, and K. Kitamura, “Geomagnetic field variations at the equatorial electrojet station in Sri Lanka, Peredinia,” Ann Geophys, vol. 22, no. 8, pp. 2729–2739, Sep. 2004. [CrossRef]
- C. Agodi Onwumechili, THE EQUATORIAL ELECTROJET. Overseas Publishers Association, 1997.
- A. B. Rabiu, O. O. Folarin, T. Uozumi, N. S. Abdul Hamid, and A. Yoshikawa, “Longitudinal variation of equatorial electrojet and the occurrence of its counter electrojet,” Ann Geophys, vol. 35, no. 3, pp. 535–545, Apr. 2017. [CrossRef]
- W. Younas, C. Amory-Mazaudier, M. Khan, and M. Le Huy, “Magnetic Signatures of Ionospheric Disturbance Dynamo for CME and HSSWs Generated Storms,” Space Weather, vol. 19, no. 9, Sep. 2021. [CrossRef]
- N. M. Mene et al., “Statistical study of the DP2 enhancement at the dayside dip-equator compared to low latitudes,” Ann Geophys, vol. 29, no. 12, pp. 2225–2233, Dec. 2011. [CrossRef]
- B. Nava et al., “Middle- and low-latitude ionosphere response to 2015 St. Patrick’s Day geomagnetic storm,” Journal of Geophysical Research A: Space Physics, vol. 121, no. 4, pp. 3421–3438, Apr. 2016. [CrossRef]
- A. Nishida, “ Coherence of geomagnetic DP 2 fluctuations with interplanetary magnetic variations ,” J Geophys Res, vol. 73, no. 17, pp. 5549–5559, Sep. 1968. [CrossRef]
- A. Nishida, “Geomagnetic DP2 fluctuations and associated magnetospheric phenomena,” J Geophys Res, vol. 73, no. 5, pp. 1795–1803, Mar. 1968. [CrossRef]
- N. E. Huang et al., “The empirical mode decomposition and the Hilbert spectrum for nonlinear and non-stationary time series analysis,” Proceedings of the Royal Society of London. Series A: Mathematical, Physical and Engineering Sciences, vol. 454, no. 1971, pp. 903–995, Mar. 1998. [CrossRef]
- P. Flandrin, G. Rilling, and P. Goncalves, “Empirical Mode Decomposition as a Filter Bank,” IEEE Signal Process Lett, vol. 11, no. 2, pp. 112–114, Feb. 2004. [CrossRef]
- K. Dragomiretskiy and D. Zosso, “Variational Mode Decomposition,” IEEE Transactions on Signal Processing, vol. 62, no. 3, pp. 531–544, Feb. 2014. [CrossRef]
- G. R. J. Cooper and D. R. Cowan, “Comparing time series using wavelet-based semblance analysis,” Comput Geosci, vol. 34, no. 2, pp. 95–102, Feb. 2008. [CrossRef]
- “torrence and campo”.
- S. W. H. Cowley, “The Earth’s magnetosphere: A brief beginner’s guide,” Eos, Transactions American Geophysical Union, vol. 76, no. 51, pp. 525–525, 1995. [CrossRef]
- S.-I. Akasofu, “Energy coupling between the solar wind and the magnetosphere,” Space Sci Rev, vol. 28, no. 2, 1981. [CrossRef]
- J. D. Huba, G. Joyce, and J. A. Fedder, “Sami2 is Another Model of the Ionosphere (SAMI2): A new low-latitude ionosphere model,” J Geophys Res Space Phys, vol. 105, no. A10, pp. 23035–23053, Oct. 2000. [CrossRef]
- J. D. Huba, G. Joyce, and J. A. Fedder, “The formation of an electron hole in the topside equatorial ionosphere,” Geophys Res Lett, vol. 27, no. 2, pp. 181–184, Jan. 2000. [CrossRef]
- J. A. F. D. G. T. Richards P.G., “EUVAC: A solar EUV flux model for aeronomic calculations,” J. Geophys.Res., 99, 8981, 1994.
- B. G. Fejer and L. Scherliess, “Empirical models of storm time equatorial zonal electric fields,” J Geophys Res Space Phys, vol. 102, no. A11, pp. 24047–24056, 1997. [CrossRef]
- S. W. H. Cowley, “Magnetosphere-ionosphere interactions: A tutorial review,” in Geophysical Monograph Series, vol. 118, Blackwell Publishing Ltd, 2000, pp. 91–106. [CrossRef]
- T. J. Fuller-Rowell, M. V. Codrescu, H. Rishbeth, R. J. Moffett, and S. Quegan, “On the seasonal response of the thermosphere and ionosphere to geomagnetic storms,” J Geophys Res Space Phys, vol. 101, no. A2, pp. 2343–2353, Feb. 1996. [CrossRef]
- A. D. F. M. W.G. BAKER, “ELECTRIC CURRENTS IN THE IONOSPHERE I. THE CONDUCTIVITY.” [Online]. Available: https://royalsocietypublishing.org/.
- C. M. Huang, “Disturbance dynamo electric fields in response to geomagnetic storms occurring at different universal times,” J Geophys Res Space Phys, vol. 118, no. 1, pp. 496–501, Jan. 2013. [CrossRef]
- T. J. Fuller-Rowell, M. V. Codrescu, H. Rishbeth, R. J. Moffett, and S. Quegan, “On the seasonal response of the thermosphere and ionosphere to geomagnetic storms,” J Geophys Res Space Phys, vol. 101, no. A2, pp. 2343–2353, Feb. 1996. [CrossRef]
- T. J. Fuller-Rowell, M. V. Codrescu, R. J. Moffett, and S. Quegan, “Response of the thermosphere and ionosphere to geomagnetic storms,” J Geophys Res, vol. 99, no. A3, p. 3893, 1994. [CrossRef]
- T. J. Fuller-Rowell, M. V. Codrescu, R. G. Roble, and A. D. Richmond, “How does the thermosphere and ionosphere react to a geomagnetic storm?,” 1997, pp. 203–225. [CrossRef]
- T. Fuller-Rowell et al., “Observed and modeled thermosphere and ionosphere response to superstorms,” Radio Sci, vol. 42, no. 4, p. n/a-n/a, Aug. 2007. [CrossRef]
- Y. Wei, B. Zhao, G. Li, and W. Wan, “Electric field penetration into Earth’s ionosphere: a brief review for 2000–2013,” Sci Bull (Beijing), vol. 60, no. 8, pp. 748–761, Apr. 2015. [CrossRef]
- N. Balan, L. Liu, and H. Le, “A brief review of equatorial ionization anomaly and ionospheric irregularities,” Earth and Planetary Physics, vol. 2, no. 4, pp. 1–19, 2018. [CrossRef]
- J. Klenzing, A. G. Burrell, R. A. Heelis, J. D. Huba, R. Pfaff, and F. Sim\~oes, “Exploring the role of ionospheric drivers during the extreme solar minimum of 2008,” Ann Geophys, vol. 31, no. 12, pp. 2147–2156, 2013. [CrossRef]
- N. Balan, J. Souza, and G. J. Bailey, “Recent developments in the understanding of equatorial ionization anomaly: A review,” J Atmos Sol Terr Phys, vol. 171, pp. 3–11, Jun. 2018. [CrossRef]
- K. Liou, P. T. Newell, B. J. Anderson, L. Zanetti, and C. I. Meng, “Neutral composition effects on ionospheric storms at middle and low latitudes,” J Geophys Res Space Phys, vol. 110, no. A5, 2005. [CrossRef]
Disclaimer/Publisher’s Note: The statements, opinions and data contained in all publications are solely those of the individual author(s) and contributor(s) and not of MDPI and/or the editor(s). MDPI and/or the editor(s) disclaim responsibility for any injury to people or property resulting from any ideas, methods, instructions or products referred to in the content. |
© 2023 by the authors. Licensee MDPI, Basel, Switzerland. This article is an open access article distributed under the terms and conditions of the Creative Commons Attribution (CC BY) license (http://creativecommons.org/licenses/by/4.0/).


