4.2. Brain Activity Assessment
The purpose of stunning is to induce a temporary or permanent disruption of brain function, rendering the animal unconscious and insensitive to pain. In contrast to electrical and mechanical stunning methods, gas stunning does not immediately result in the loss of consciousness. Instead, there is a prolonged delay between initiation and the onset of unconsciousness, known as the induction phase. Results demonstrate that exposure to 40C60N or 20C80N gas mixtures in a pre-filled pit led to faster onset of LOC compared to 40C90C.
The time elapsed until the onset of LOC was determined using EEG spectral variables. Specifically, onset of LOC was identified when the F50 frequency decreased below 50% and the Delta frequency increased above 65% of the baseline. It is important to highlight that the chosen threshold values in this study differ from those employed in previous research. For example, in broiler chickens exposed to LAPS, LOC was determined when the F50 dropped below 7 Hz compared to baseline values of 20 Hz [
26] or when the F50 was reduced below 75% compared to baseline [
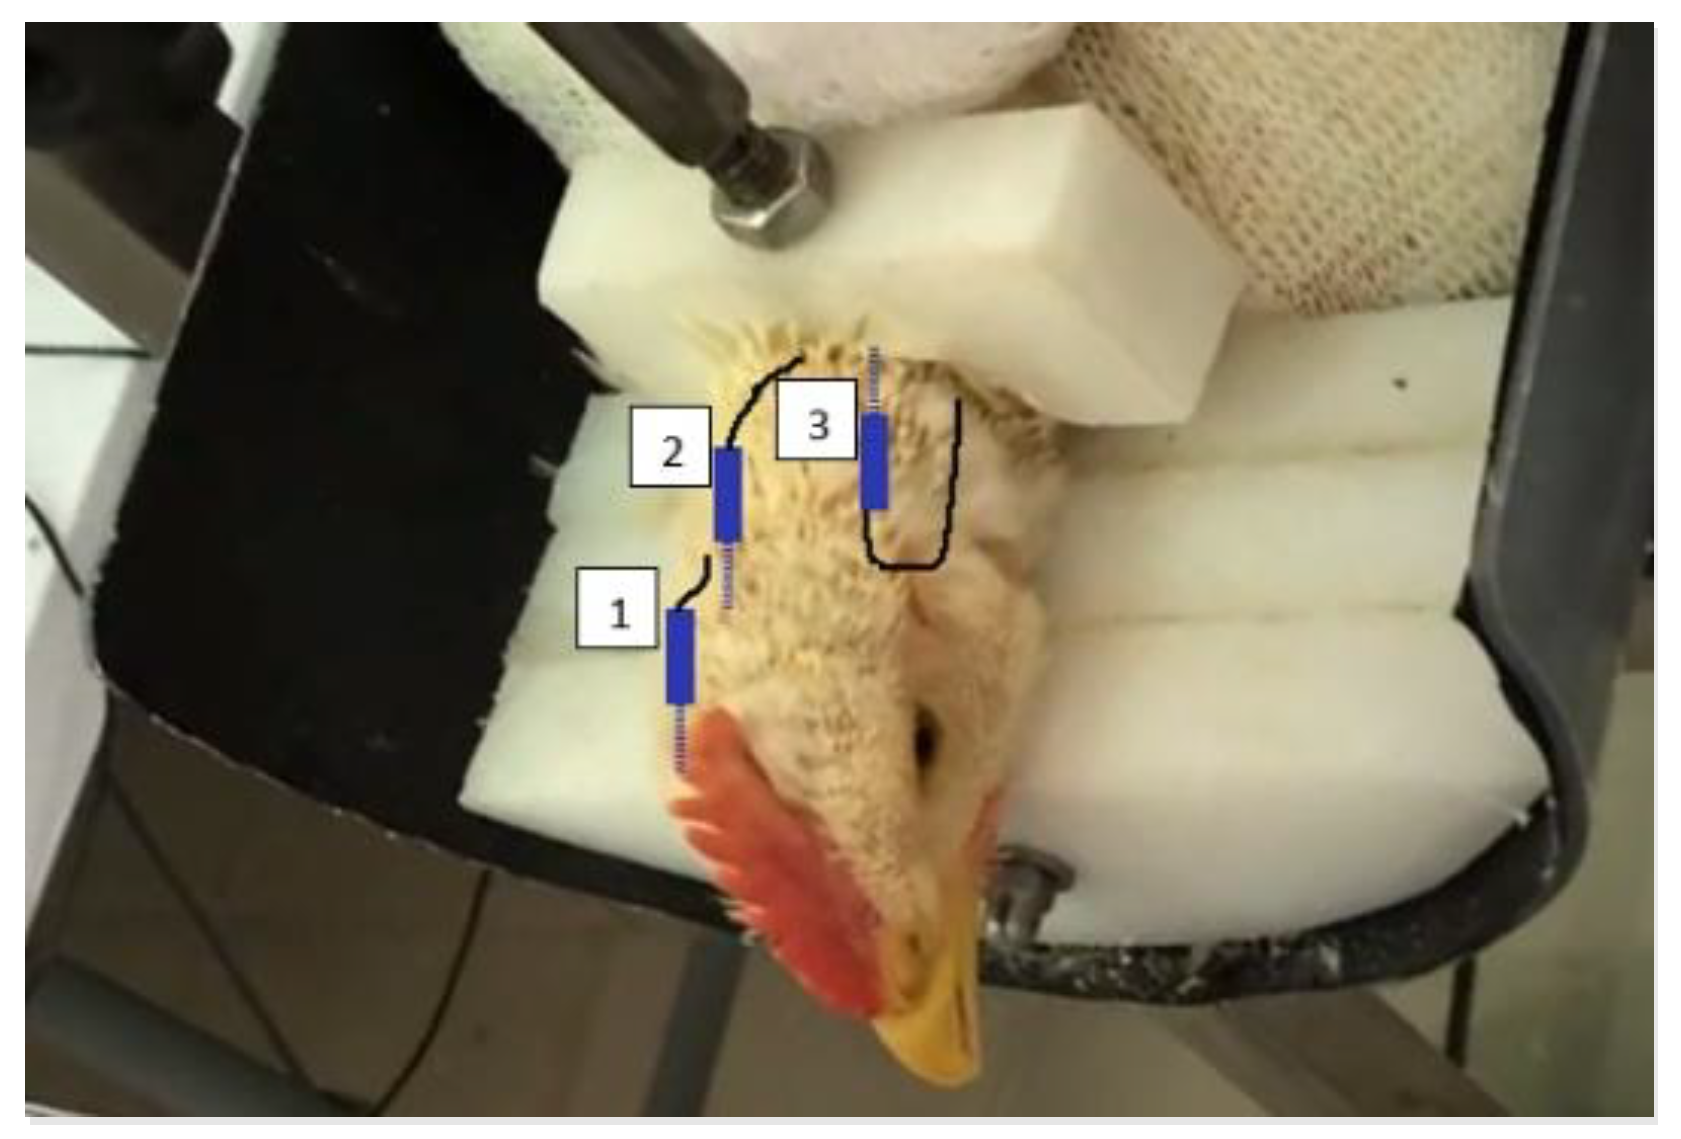
34]. The different thresholds used in our study compared to LAPS are attributed to the type of electrodes used. In our study, subcutaneous electrodes were used, while other authors [
26] utilized implanted electrodes placed through the skull, resulting in outputs on a different scale. Although subcutaneous electrodes provide lower-quality EEG recordings compared to implanted electrodes, they are less invasive for the animals as they do not require surgery or recovery time prior to the experiment. Furthermore, results from the contribution of Gamma frequency to Ptot remained at an average of 0.1%, indicating an irrelevant interference from background noise [
23]. This confirms the quality of the EEG recordings and the reliability of the obtained results in determining the time elapsed until the onset of LOC and death.
General anaesthesia serves as an ideal model for understanding the EEG waveform alterations during the transition from a conscious to an unconscious state [
21]. During general anaesthesia stages, there is a predominance of Delta and Theta frequency bands [
21]. F50 is particularly sensitive to changes in lower frequencies, while F95 is more responsive to shifts toward higher frequencies [
21]. Reductions in Ptot and F50 are well-established indicators correlated with clinical signs of loss of consciousness and anaesthesia in animals [
22,
23].
In the study conducted by Sandercock et al. [
32], the reduction of F50 was observed during inhalational anaesthesia using a face mask with a Sevoflurane vaporizer at a concentration of 8% in hens and turkeys. So far, there are no studies that have reported a specific threshold for Delta frequency contribution. Previous reports have described the analysis of Delta frequency on EEG as a visual change in the EEG trace, without an objective threshold [
19,
35]. Therefore, the decrease below 50% of F50 and the increase above 65% of Delta frequency contribution can be considered potential indicators of LOC during EEG recording in broiler chickens exposed to gas stunning.
The time elapsed until onset of LOC found in 40C60N and 20C80N was similar to those reported in previous studies [
16,
17]. McKeegan et al. [
16] reported, LOC in broiler chickens exposed to 40C60N was observed to occur at 23 ± 4 s, compared to 24.2 s [15 - 38 s] with 40C60N and 18.8 s [15 - 32 s] with 20C80N in the present study. This slight difference may be due to the use of a pre-filled pit with gas instead of a closed cabined (not pre-filled but flushed) used in McKeegan [
16] and, therefore, the reduction in available O
2 was reported to be not instantaneous and thus, there was a slight delay in reaching the desired modified atmosphere. Coenen et al. [
17] reported LOC in broiler chickens at 34 ± 12 s determined by visual analysis on EEG waveform when the trace was isoelectric, during gas exposure using a tunnel system where the combination of 30% CO
2 with 70% N
2 [
17]. Hence, the time to LOC can be different with similar conditions depending on the criteria used to assess EEG activity. The visual interpretation of EEGs can be subjective, and various studies have employed different waveform patterns to determine the LOC, such as suppressed, isoelectric, high amplitude low frequency (HALF), and transitional states [
17,
19,
36]. In addition to visual analysis, spectral analysis provides a quantitative approach for estimating LOC by generating numerical results. The utilization of numerical variables derived from EEGs has gained attention in similar experimental studies in recent years [
21,
23,
37,
38]. This complementary approach enhances the accuracy and reliability of assessing LOC. This study identified F50 and Delta frequency contribution as promising spectral variables for determining LOC in broiler chickens exposed to gas mixtures.
Permanent unconsciousness or brain death was assessed using EEG through visual analysis and spectral analysis. The average time for reaching irreversible loss of brain function and brain stem death was estimated to be 69.8 ± 11.9 s in the 40C60N mixture and 66.3 ± 8.1 s in the 20C80N mixture. The high variability observed in 20C80N for death, as indicated by spectral analysis, may be attributed to signal degradation. In such cases, visualizing the isoelectric pattern could provide a more accurate assessment. Both visual and spectral analysis methods demonstrated the irreversible cessation of brain activity and brain stem function [
19,
21,
23,
32]. In similar studies in broiler chickens exposed at a gas stunning in an experimental chamber using 40% CO
2 and 60% N
2 by flushing, the time to death estimated by visual analysis of EEG was 67.8 ± 4.6 s [
16].
Raj et al. [
39] reported a slightly different onset time of isoelectric EEG at 58 ± 2.3 s in broiler chickens exposed to a gas mixture (30% CO
2 + 60% Argon + 10% Air) in a pre-filled box, which may be attributed to the time it takes for the lift to descend into the pit (23 s) and reach the target gas concentration. In contrast, McKeegan et al. [
16] visually observed the onset of death at 80.7 s through the isoelectric pattern on EEG and the absence of motion in broiler chickens exposed to 40% CO
2 and 60% N
2 in a gas-flushed closed cabin. If the exposure time to the gas is insufficient to induce brain death and the animals can breathe atmospheric air, they may quickly regain consciousness [
12]. Results suggested that a four-minute exposure to 40C60N and 20C80N gas mixtures induced permanent unconsciousness in all birds, eliminating the possibility of regaining consciousness. The integration of visual and spectral analysis of EEGs proved to be a reliable method for accurately estimating brain death in broiler chickens exposed to gas stunning.
The present study was intended to record EEG traces from 50 broiler chickens. However, 28 out of 50 (56%) EEGs records were unsuitable for analyses due to loss of electrodes during gas exposure or non-readable EEG activity. This decrease of sample size is common when EEG is performed. Previous studies reported a loss of readable EEGs in 9–71% of animals [
35,
40,
41]. Unfortunately, in this study, no EEG traces were suitable for analyses in the 40C90C treatment, and the reasons for this systematic loss remain unknown. Therefore, it is important to consider refining the methodology in future studies to improve the quality of EEG recordings. In human and animal anaesthesia monitoring, high-quality EEG recordings are essential, and the use of different drugs to induce insensibility to pain, loss of consciousness, and loss of muscle tone can result in higher-quality EEGs [
42]. In this experimental set-up, using general anaesthesia prevents identifying the transition from consciousness to unconsciousness, rendering it unfeasible. Measures such as minimizing recording errors, reducing background electrical noise, and optimizing electrode placement on the bird's head may contribute to improving the quality of EEG records.
4.4. Relationship between Brain Activity and Behavioural Assessment
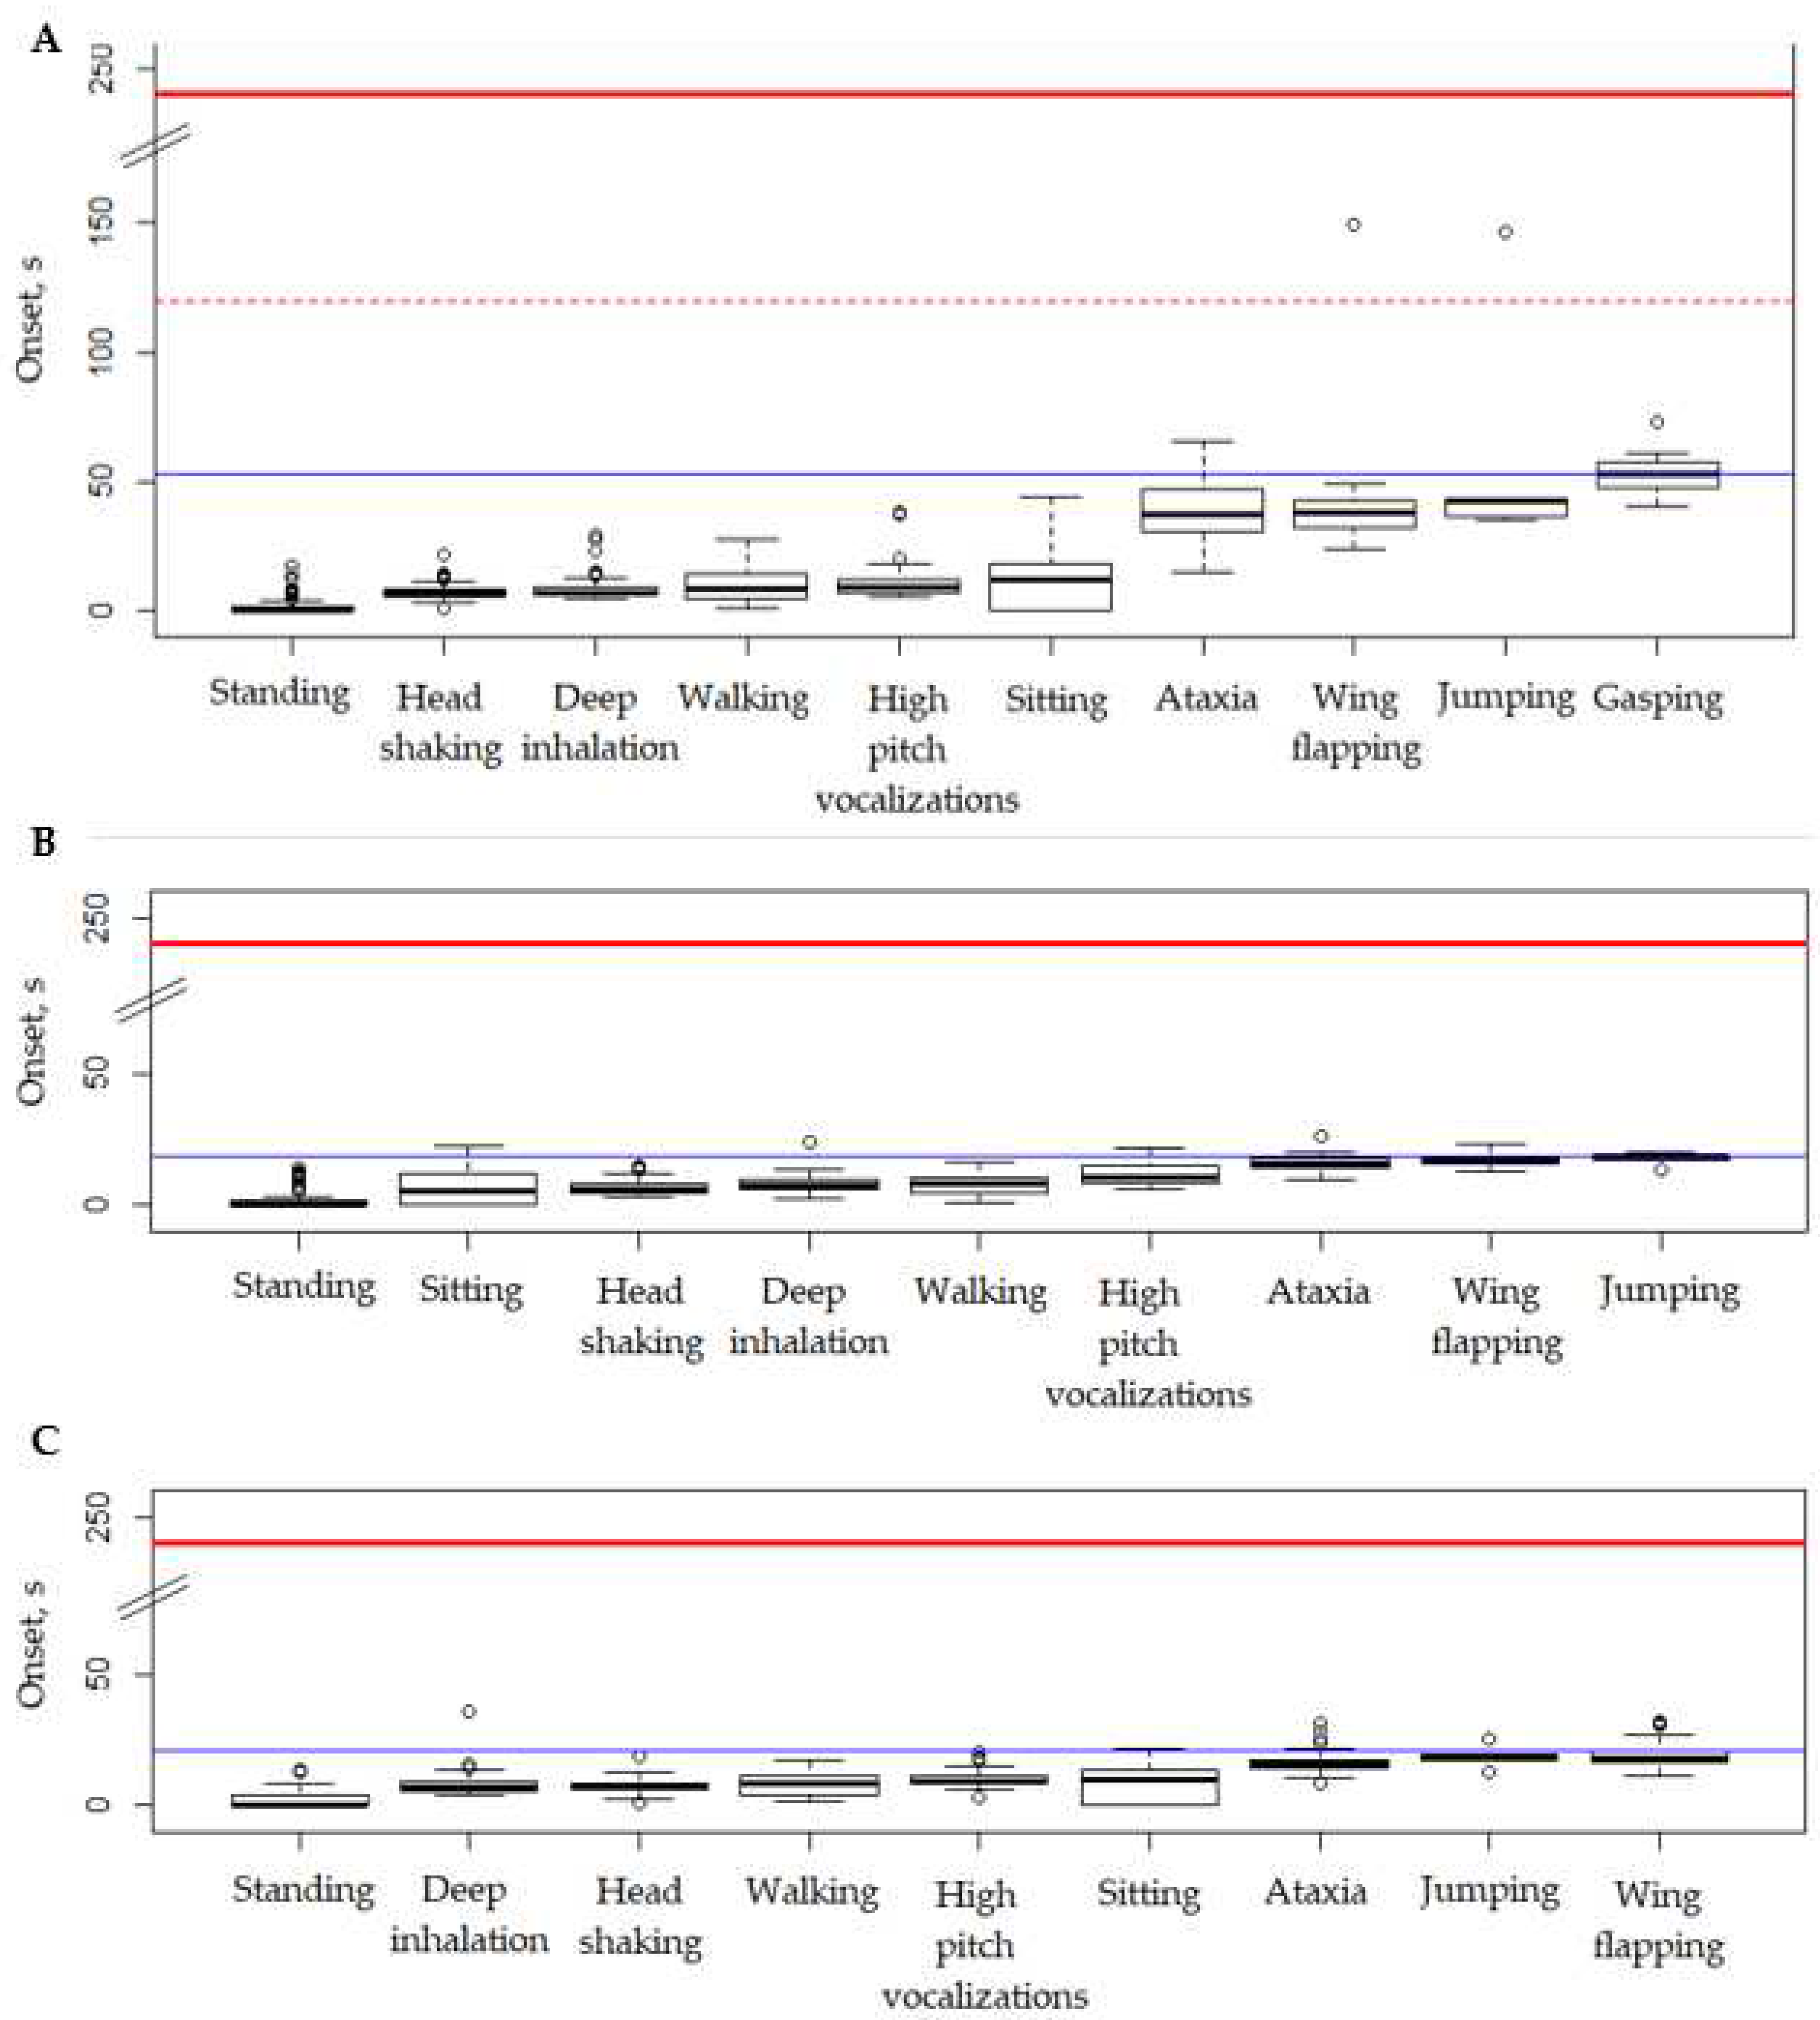
Correlating EEG activity with behavioural observations in unrestrained animals is crucial for interpreting behavioural indicators in slaughterhouse conditions where EEG recording is not feasible. The elapsed time until LOC determined through EEG spectral analyses matched with the time of LOP in 40C60N and 20C80N, confirming that LOP can be utilized as a proxy for the onset of LOC in broiler chickens, as previously reported Gerritzen et al. [
35], Benson et al. [
30], LAPS [
23]. On the other hand, the time elapsed until isoelectric patterns on EEG (i.e., death) matched with the onset of motionless in broiler chickens. Hence, the LOP and motionless are reliable animal-based indicators of LOC and death, respectively.
LOP is defined as the point when a broiler is unable to regain/maintain controlled posture and neck tension. Using LOP as a behavioural indicator of LOC appears to be an accurate ABI for monitoring unconsciousness in broiler chickens exposed to gas mixtures in slaughterhouses. Moreover, European regulation (1099/2009) on animal welfare during slaughter prohibit the use of CO
2 concentrations exceeding 40% for poultry, with concentrations above this threshold only permitted for already unconscious birds [
1]. Aversive behaviours such as head shaking, deep inhalation, ataxia, gasping, jumping, wing flapping, and vocalisations observed prior to LOP have negative consequences on animal welfare [
23]. The utilization of two-phase CO
2 stunning in broiler chickens introduces significant variability in the time required for LOP to occur, posing a risk of exposing conscious animals to concentrations above 40% that can induce pain.
Our findings indicate a correlation between the observation of motionless behaviour in broiler chickens exposed to gas mixtures and the identification of isoelectric patterns on EEG. The occurrence of motionless coincided with the presence of isoelectric patterns, suggesting a potential relationship between the two factors. Results in this study suggests that the assessment of motionless behaviour in field conditions can be a reliable indicator for estimating brain death in broiler chickens exposed to gas stunning.
The observed elevation in F50, Beta frequencies contribution after LOC in the 20C80N treatment can be attributed to signal degradation in the EEG recordings. This is supported by the minimal power observed during the isoelectric pattern, which is indicative of brain death [
43]. Hence, the changes observed in F50 and Beta frequency during a trace with very low power (<90% of baseline) are not biologically significant.
The use of LOP and motionless as animal-based indicators of loss of conscious and death, respectively, can be extended to other poultry species to assess the state of consciousness at the time of killing.


