1. Introduction
Apart from spin angular momentum, photons can also carry another form of angular momentum: orbital angular momentum (OAM) [
1]. It is related to the helical phase front and doughnut transversal profile of light. The helical phase front is expressed in exp(−i
lϕ), where
l is the topological charge (TC) and equals to the orbital angular quantum number, and
ϕ is the azimuth angle. Accordingly, a light beam carrying OAM is often called the vortex beam (i.e., the TC is larger than 0). Each photon in the vortex beams carries an OAM of
lℏ. The doughnut transversal profile of the spatial distribution in intensity comes from the phase singularity at the center of the beam. The specific nature and characteristics of the vortex beam makes it applied in many important and promising aspects, such as the optical manipulation of particles [
2,
3,
4], information transmission and cryptography [
5,
6], super-resolution microscopy [
7,
8], and micro-processing of materials [
9,
10]
etc. These applications rely on the interaction between OAM laser beam and matter. It has been observed that the OAM carried by the vortex beam can be transferred to matters [
11,
12,
13]. When the OAM laser beam is intense enough to induce the nonlinear optical process, such as frequency doubling, optical parametric down-conversion and four-wave mixing, spectral components with new frequency are generated, and the OAM transfer from the fundamental laser to the newly generated spectral components has been demonstrated in these nonlinear optical process [
14,
15]. Since these newly generated components possess OAM, different phenomena can be observed, which in turn provides an approach to study the nonlinear optical process.
However, when the vortex beam is too intense, it results in photoionization of the media, generating numerous plasmas, which makes the system complicated, and thus a great many new spectral components are generated. Besides, OAM can cause changes in the electron transition probability and selection rules within the molecules, affecting the excitation and photoionization of atoms and molecules [
16,
17,
18]. Among the interaction between intense laser and matter, femtosecond laser filamentation is a typical one. Femtosecond filament is formed when the Kerr self-focusing effect and plasma defocusing effect reach a dynamic balance [
19,
20]. Femtosecond filamentation has been observed in various transparent nonlinear and dispersive media including gas (e.g., air), liquid (e.g., water) and solidity (e.g., sapphire, glass). Comped with the gaseous media, the nonlinear refractivity of condensed media is higher, making it is easy to generate filament in condensed media. A great many of theoretical and experimental researches on the property, control, application of femtosecond filamentation have been conducted in the past few decades. Recently, the introduction of OAM has made the filamentation of femtosecond vortex beams a hot research topic [
21,
22,
23,
24,
25,
26,
27,
28,
29,
30,
31], for the OAM can provide a new degree of freedom to study the strong-field physics.
In our recent work, we have studied the supercontinuum and fluorescence induced by filamentation of femtosecond vortex beams in water and air [
29,
30,
31]. By studying the influence of TC on the supercontinuum and fluorescence emission, we explored the formation mechanisms of supercontinuum and fluorescence emission. The white light beam generated during the femtosecond filamentation in gases or condensed media generally consists of a white central part surrounded by a rainbow-like conical emission. The radial order of the spectral components is inverse of diffraction with bluer frequencies appearing on the outside rings. Conical emission is a signature of filamentation. As far as we know, few works focus on the conical emission induced by femtosecond vortex beams. In this paper, by using two typical kinds of vortex beams (i.e., Laguerre-Gaussian (LG) and Bessel-Gaussian (BG) beams), we study characteristics of the conical emission induced by the filamentation of the femtosecond vortex beams in water, and discuss the role of the OAM plays in the conical emission.
2. Experimental setup
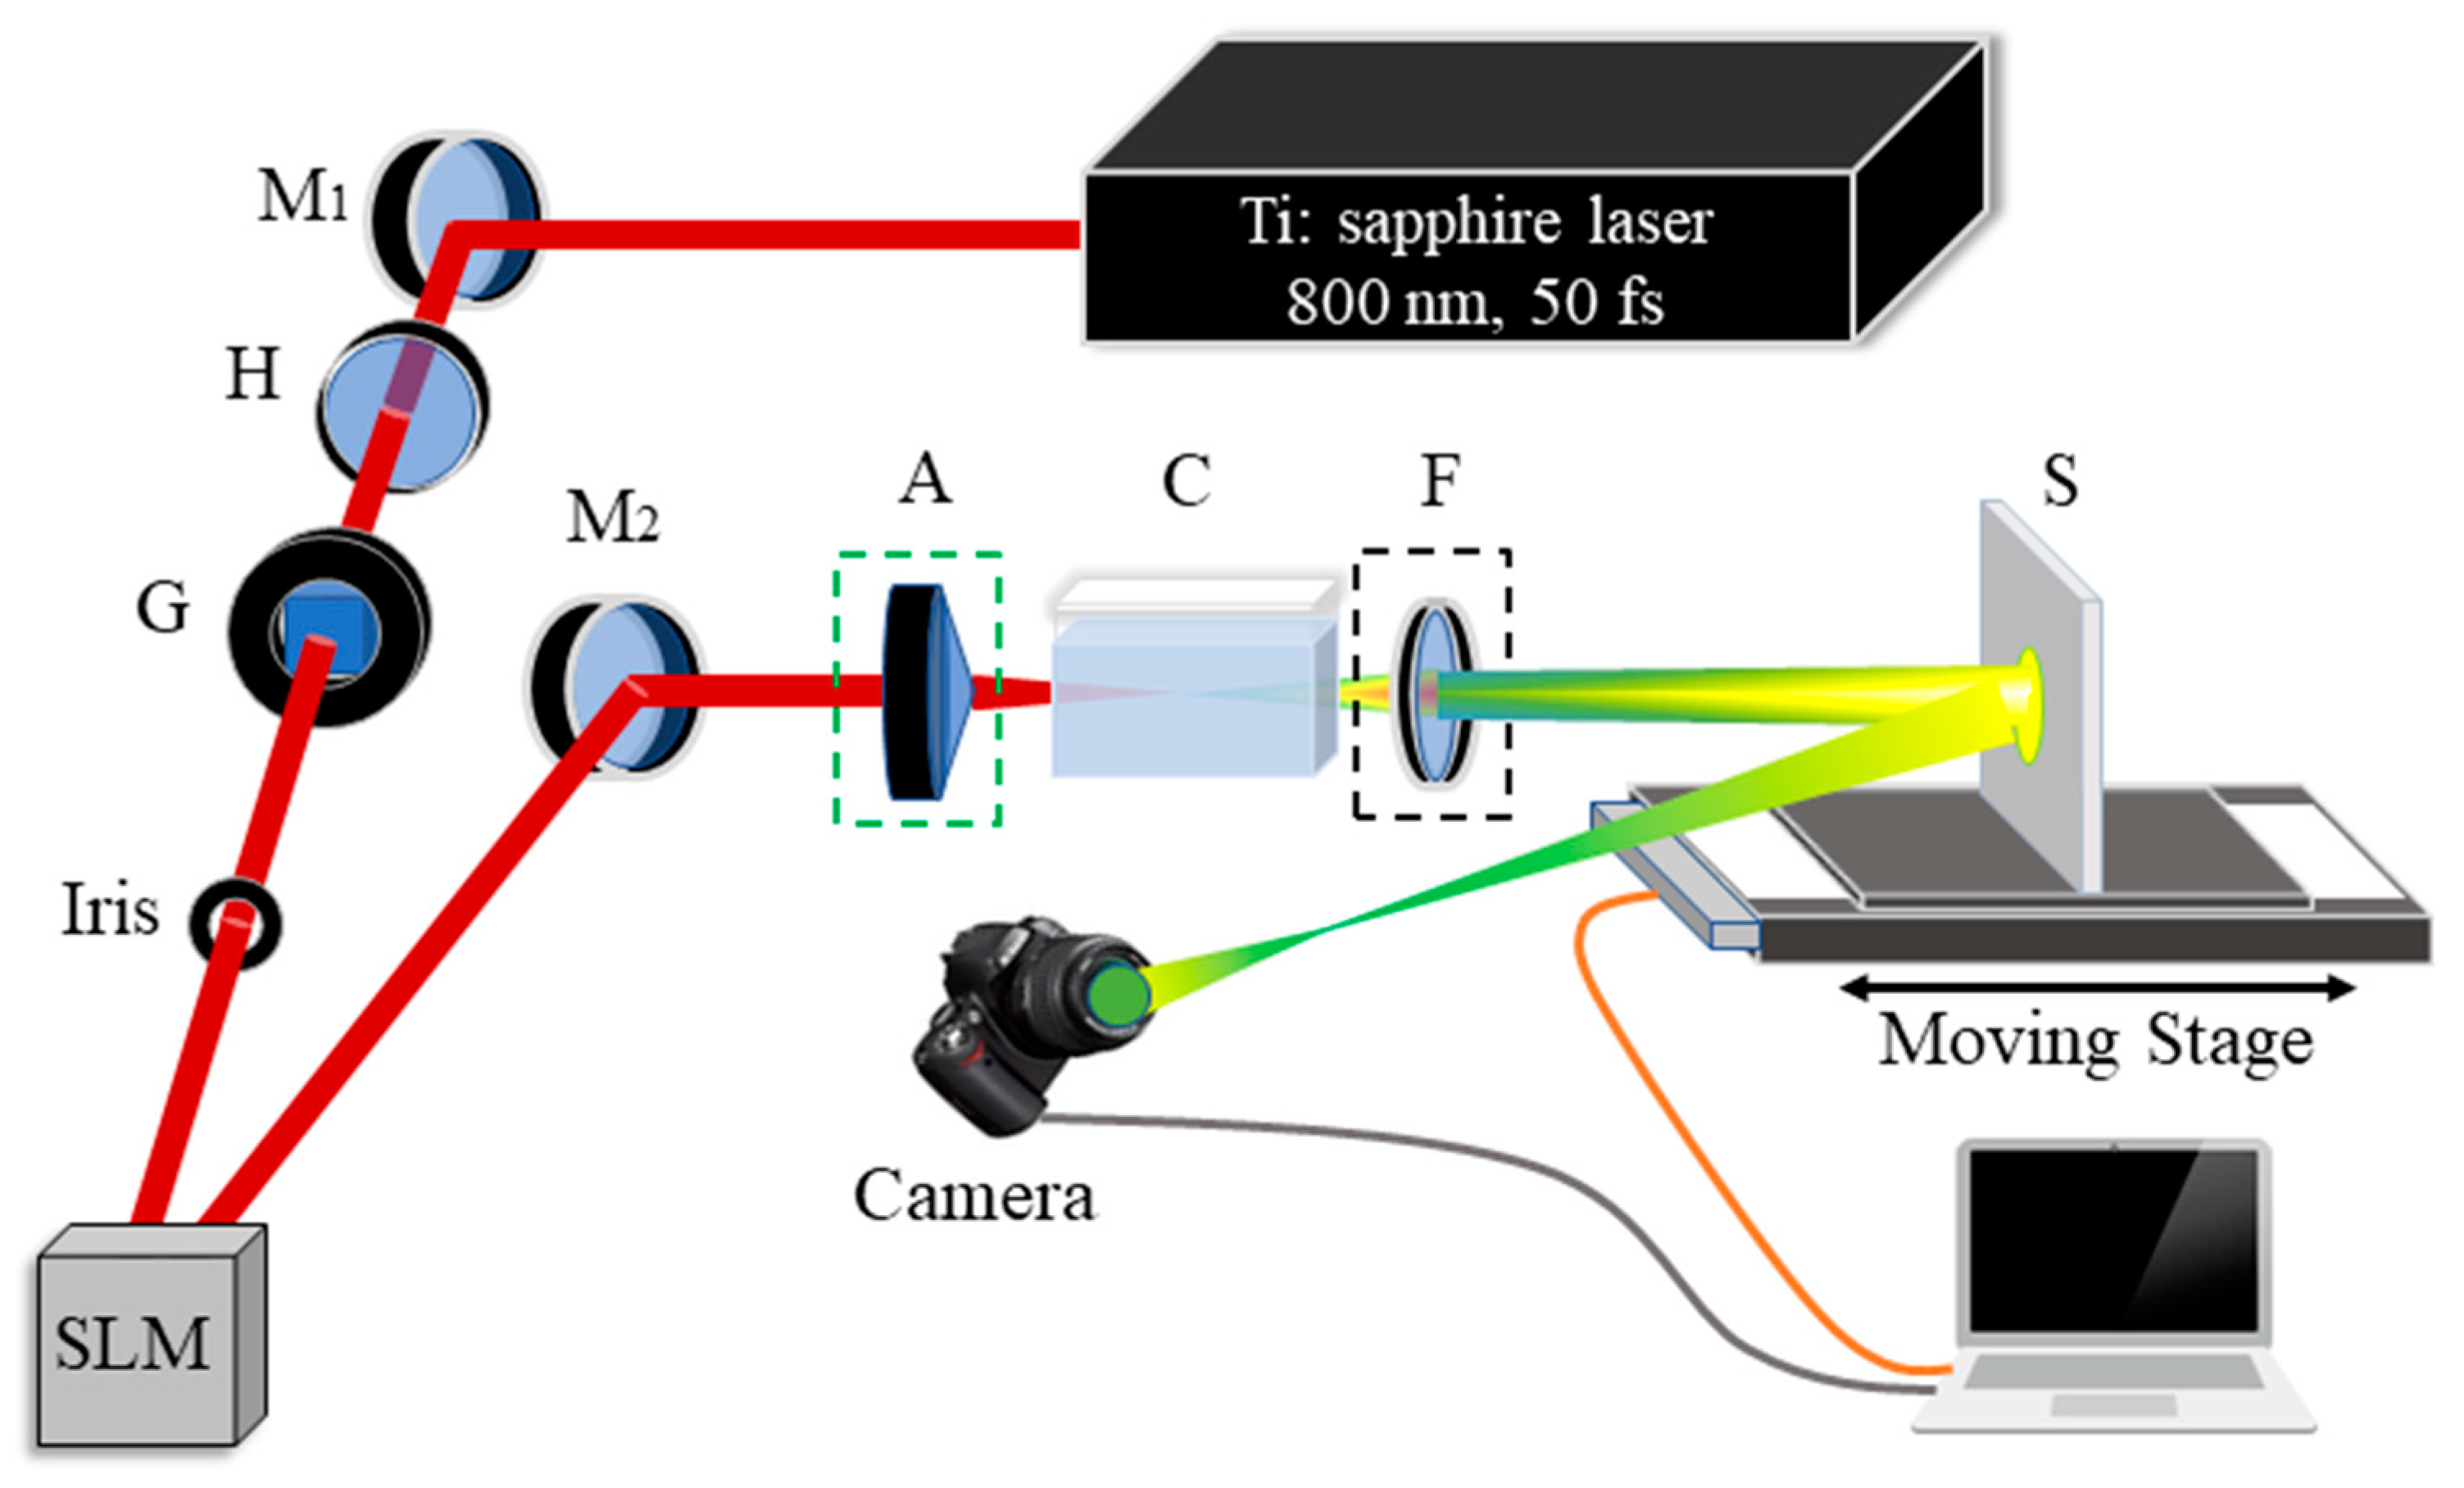
To explore the characteristics of the colored conical emission induced by the filamentation of femtosecond vortex beams in water, we design an experimental setup which is schematically shown in
Figure 1. The experiment is carried out by using an amplified Ti: sapphire laser (coherent Libra). The duration, central wavelength, energy and repetition rate of the emitted pulses are 50 fs, 800 nm, 3.0 mJ and 1 kHz, respectively. An energy attenuator which consists of a half-wave plate H and a Glan prism G adjusts the pulse energy to a desired value. The laser beam spot size is adjusted by an iris which is set as 10 mm in the experiment, and therefore the light beam can perfectly enter the liquid crystal screen of a spatial light modulator (Hamamatsu, LCOS-SLM, X13138-02). Vortex beams can be generated by loading the phase diagram to the liquid crystal screen of the SLM. In the experiment, to study the characteristics of the colored conical emission induced by the femtosecond BG and LG beams, the vortex beams are focused by two kinds of optical lenses (which are placed at the dashed green frame): One is a plano-convex focusing lens (fused silica) with a focal length of
f = 75 mm, and the other one is an axicon lens with a top angle of 170 degrees. The vortex beams are focused into a quartz cuvette C (50 mm×10 mm×40 mm) filled with water and form filaments, generating the supercontinuum. To avoid contribution from the cuvette walls, the beam is focused close to the center of the cuvette.
The femtosecond filament has certain length along the propagation direction of femtosecond laser pulses, and the filament length is affected by many factors, such as the parameters of laser beam, type of nature of the transparent medium, and the focusing condition,
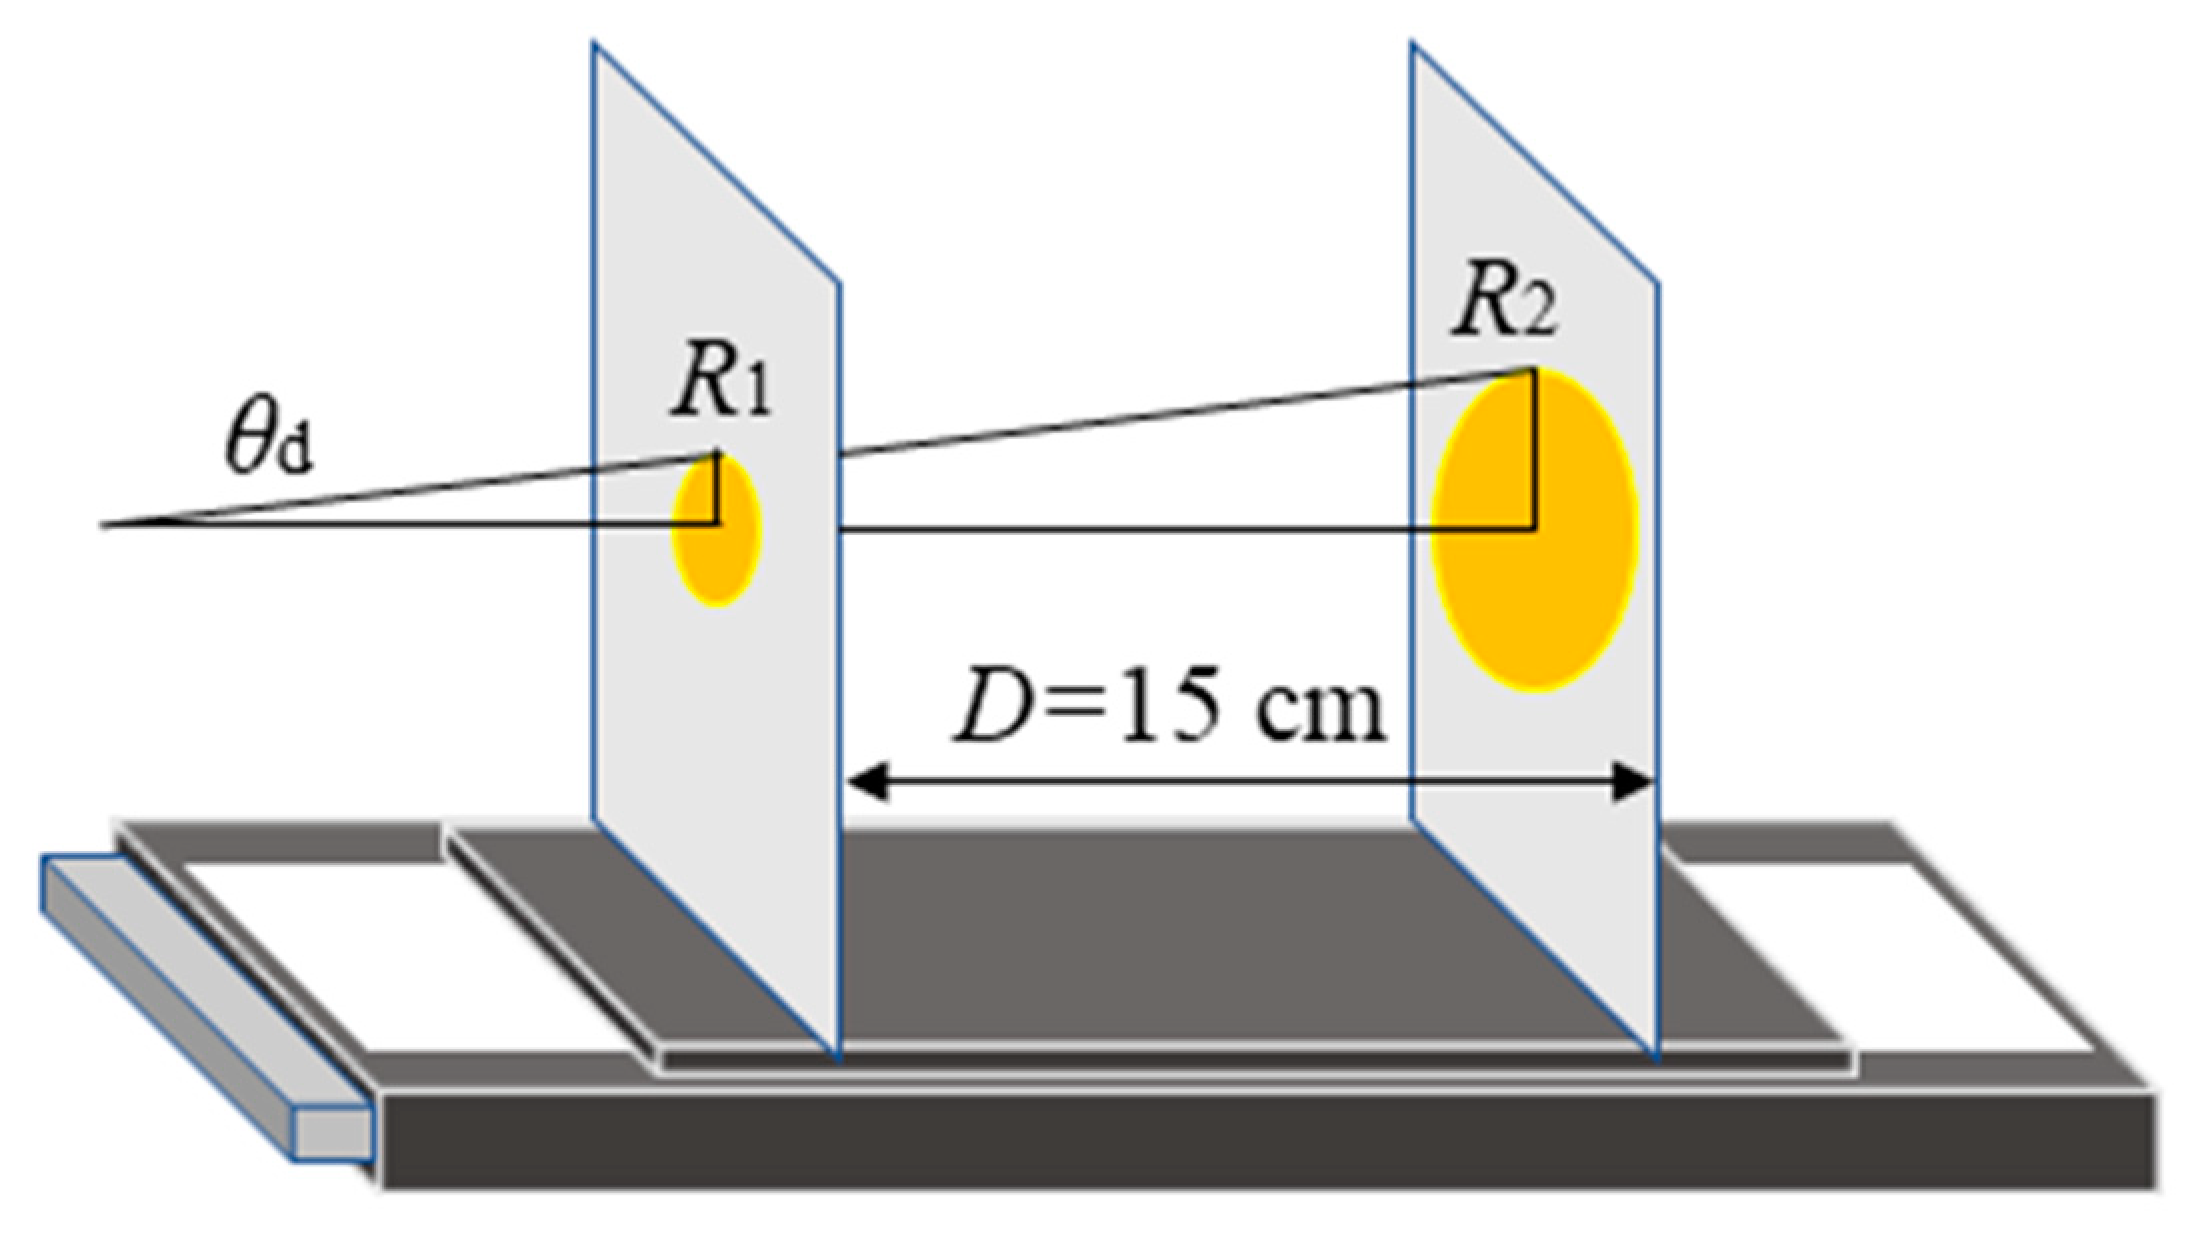
etc. Besides, it is not easy to determine the specific location of the filament in the water. More importantly, each part of the filament emits the supercontinuum. These factors make it difficult to determine the tip of the conical emission. As a result, we design an indirect method to measure the divergence angle of supercontinuum induced by femtosecond vortex beams. The schematic diagram of the method is shown in
Figure 2. A white screen S is placed on a moving stage, and its surface is perpendicular to the propagation direction of the laser pulse. By moving the white screen along the propagation direction of the femtosecond beam, the light spot is captured at two selected positions, at which the distance between the back wall of the cuvette and the screen are 8.1 cm and 23.1 cm. The space between the two positions is
D=15 cm. Once the radius of the light spot at the two positions is measured, we can obtain the maximum divergence angle of the supercontinuum
θd:
Since the supercontinuum contains different spectral components which are mixed together, we cannot obtain the spot radius of the spectral component with specific wavelength. By using a set of bandpass filters (450 nm, 500 nm, 550 nm, 600 nm, 650 nm and 700 nm), different spectral components are picked out. Light spots with clear boundary appear on the with screen which are then recorded by a digital camera (Nikon, D300S). Since the camera is placed at the side of light path, the light spots recorded by the camera are elliptical, which is the affine transformation of the actual light spots appear on the screen. Consequently, it is necessary to obtain profiles of the original circular light spots by the he affine transformation of the captured light spots [
32].
3. Results and discussion
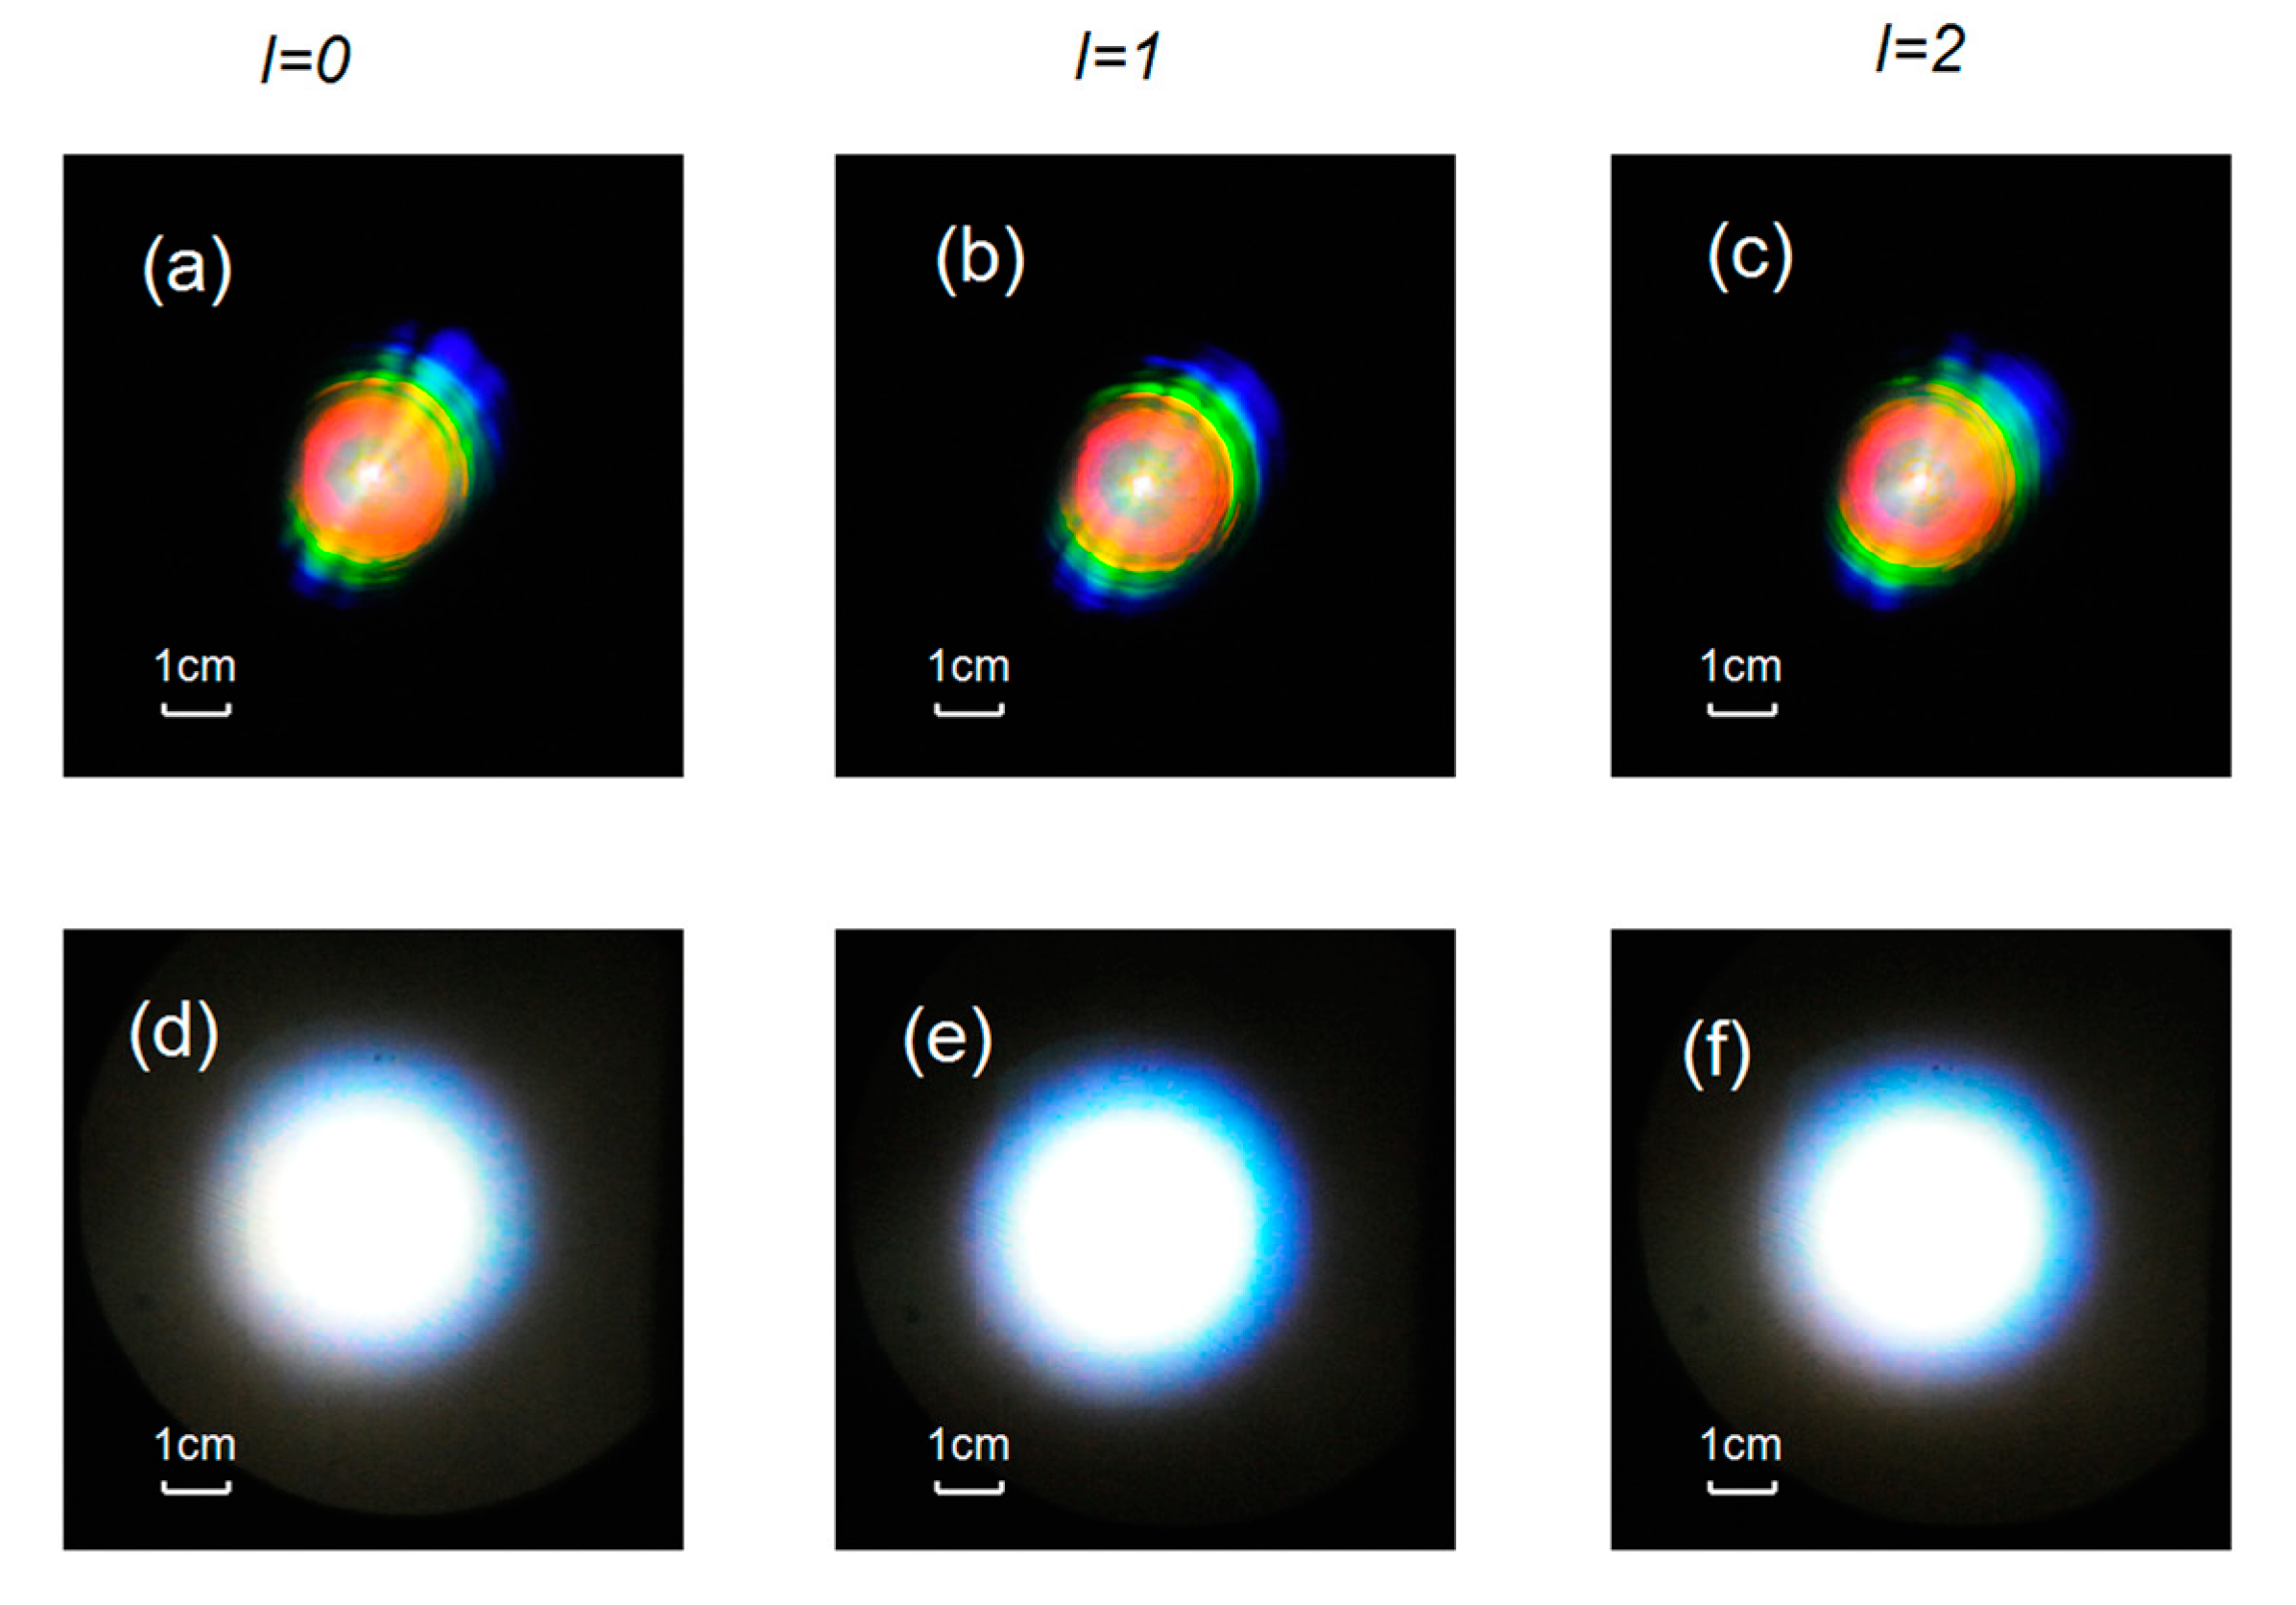
Figure 3 shows the patterns of the supercontinuum induced by the femtosecond BG and LG beams in water. Water is chosen as the medium in this paper because it can generate stable, ultrabroad, high intensity supercontinuum at a low cost, standing out among the condensed state media to generate supercontinuum. The white light produced by the BG beams distribute in a set of concentric rings like a rainbow with a white center, as shown in
Figure 3(a)-3(c). In contrast, the spot of the white light induced by the LG beams is completely different, which a circular white disk, as shown in
Figure 3(d)-3(f). Obviously, it is different from the white light spot that has been observed in many previous which generally consists of a white central part surrounded by a set of rainbow-like rings. It can also be seen from
Figure 3 that by increasing the TC value of the vortex beams, the characteristics of the white light patterns are almost the same as the zero-order vortex beam for both the LG and BG beams. To make out the origin of the difference between the spot of white light induced by the two kinds of vortex beam, especially the abnormal white light spots in the case of the LG beams, in the following part, by using a set of bandpass filters (450 nm, 500 nm, 550 nm, 600 nm, 650 nm and 700 nm), we study the light spots for different monochromatic components and further obtain the divergence angles for all wavelength and TC values.
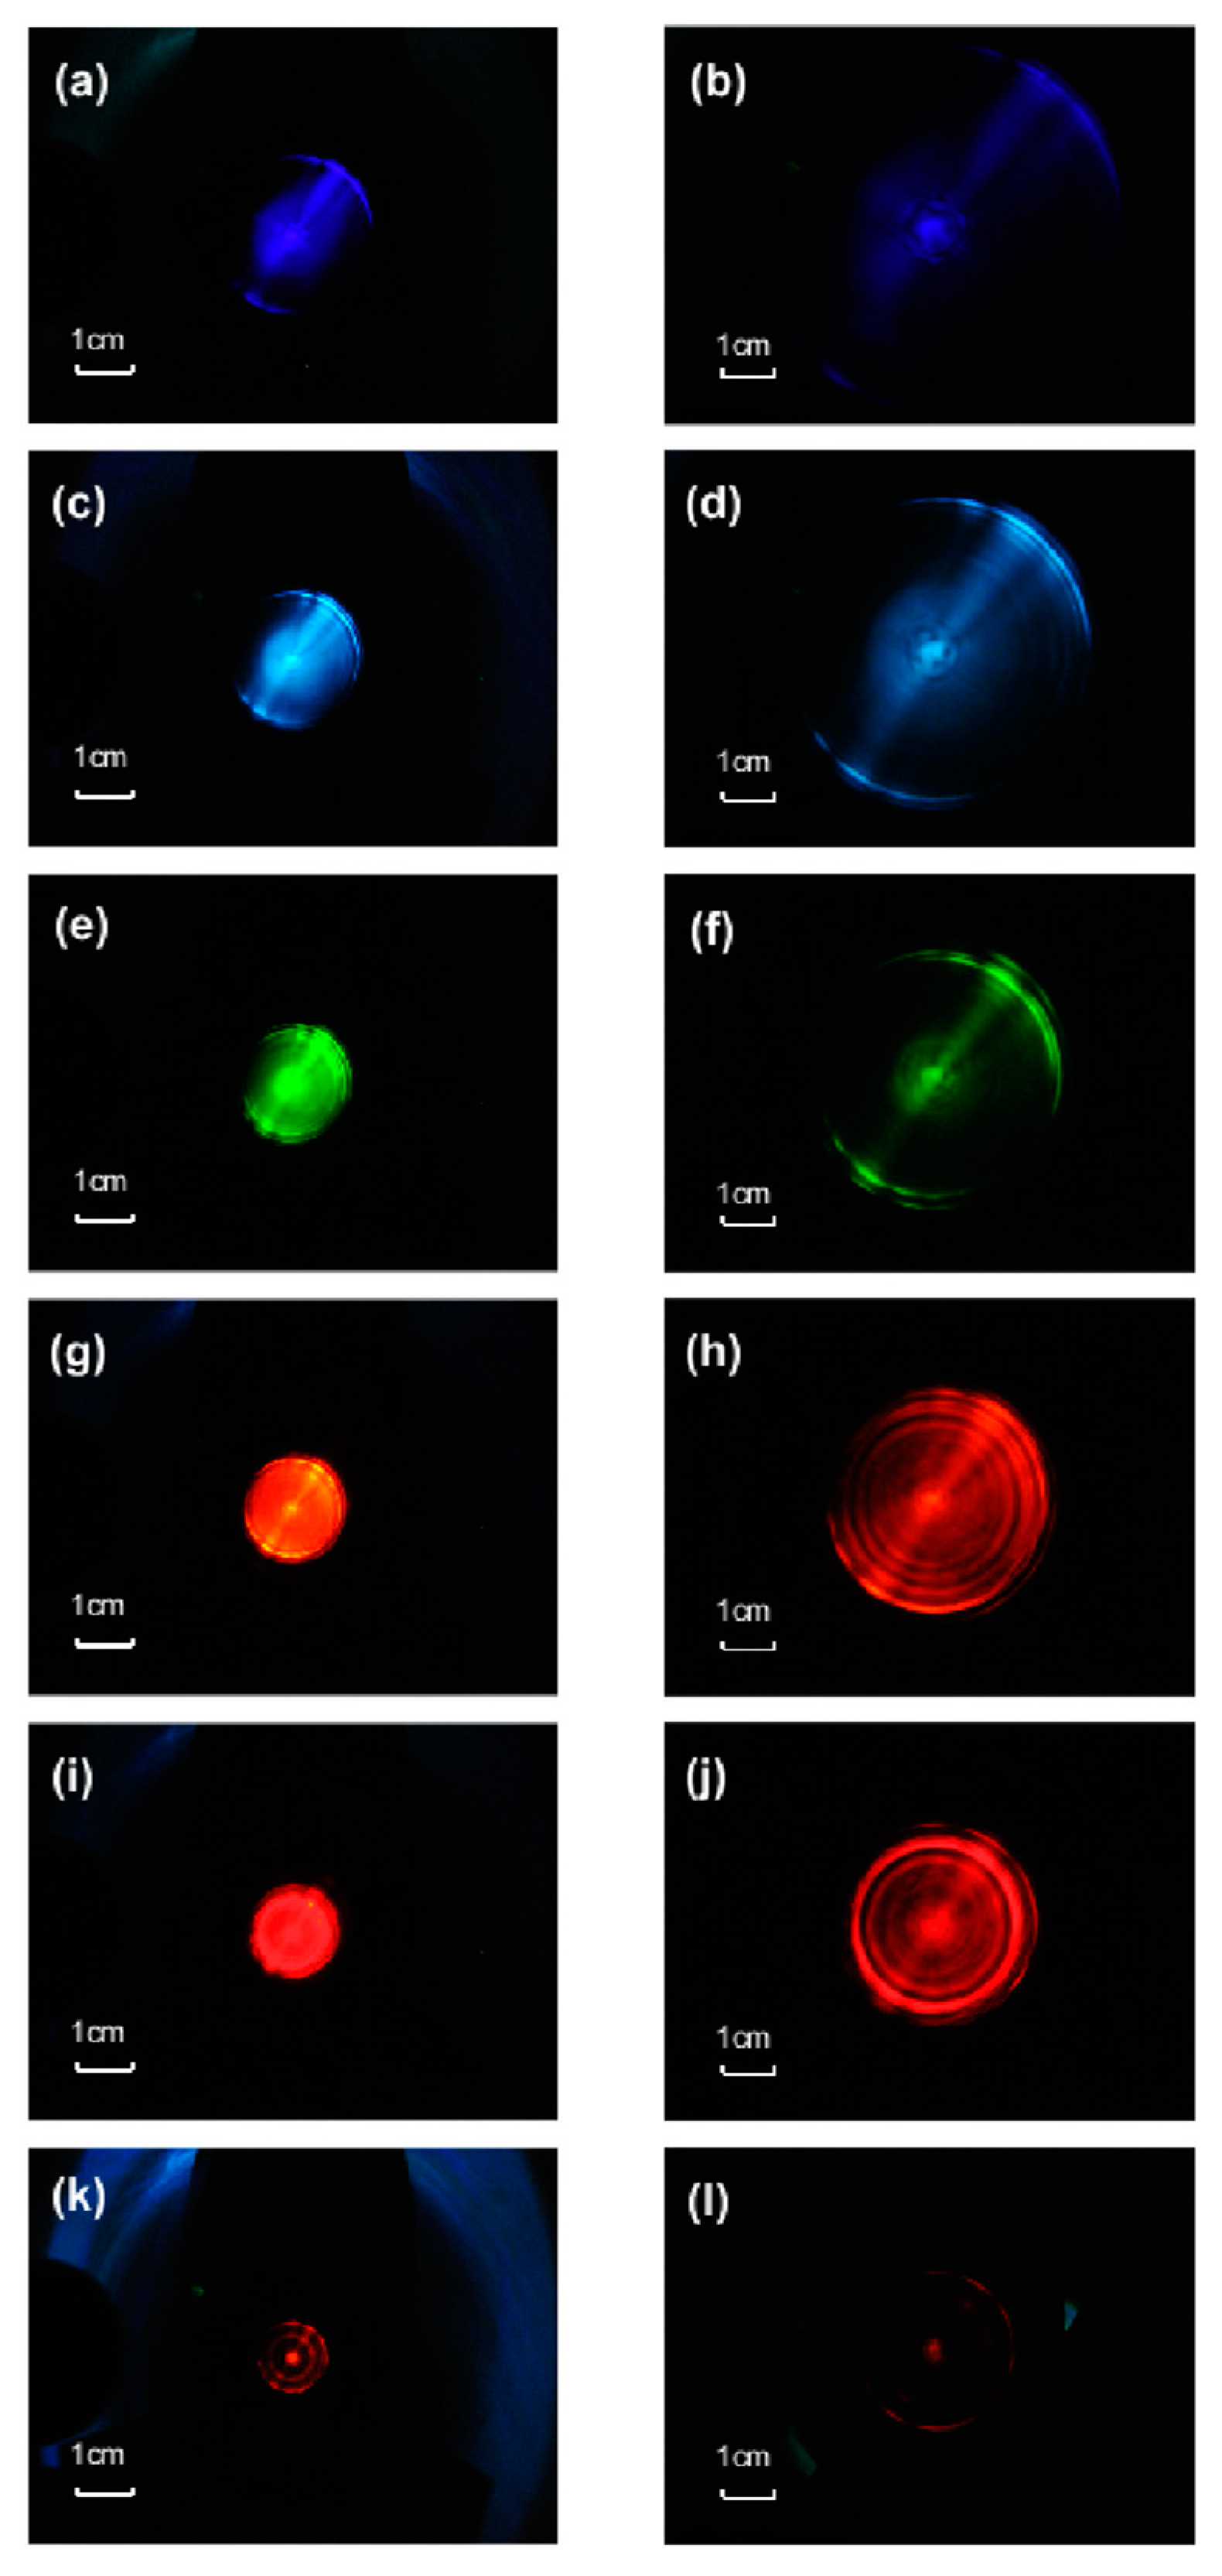
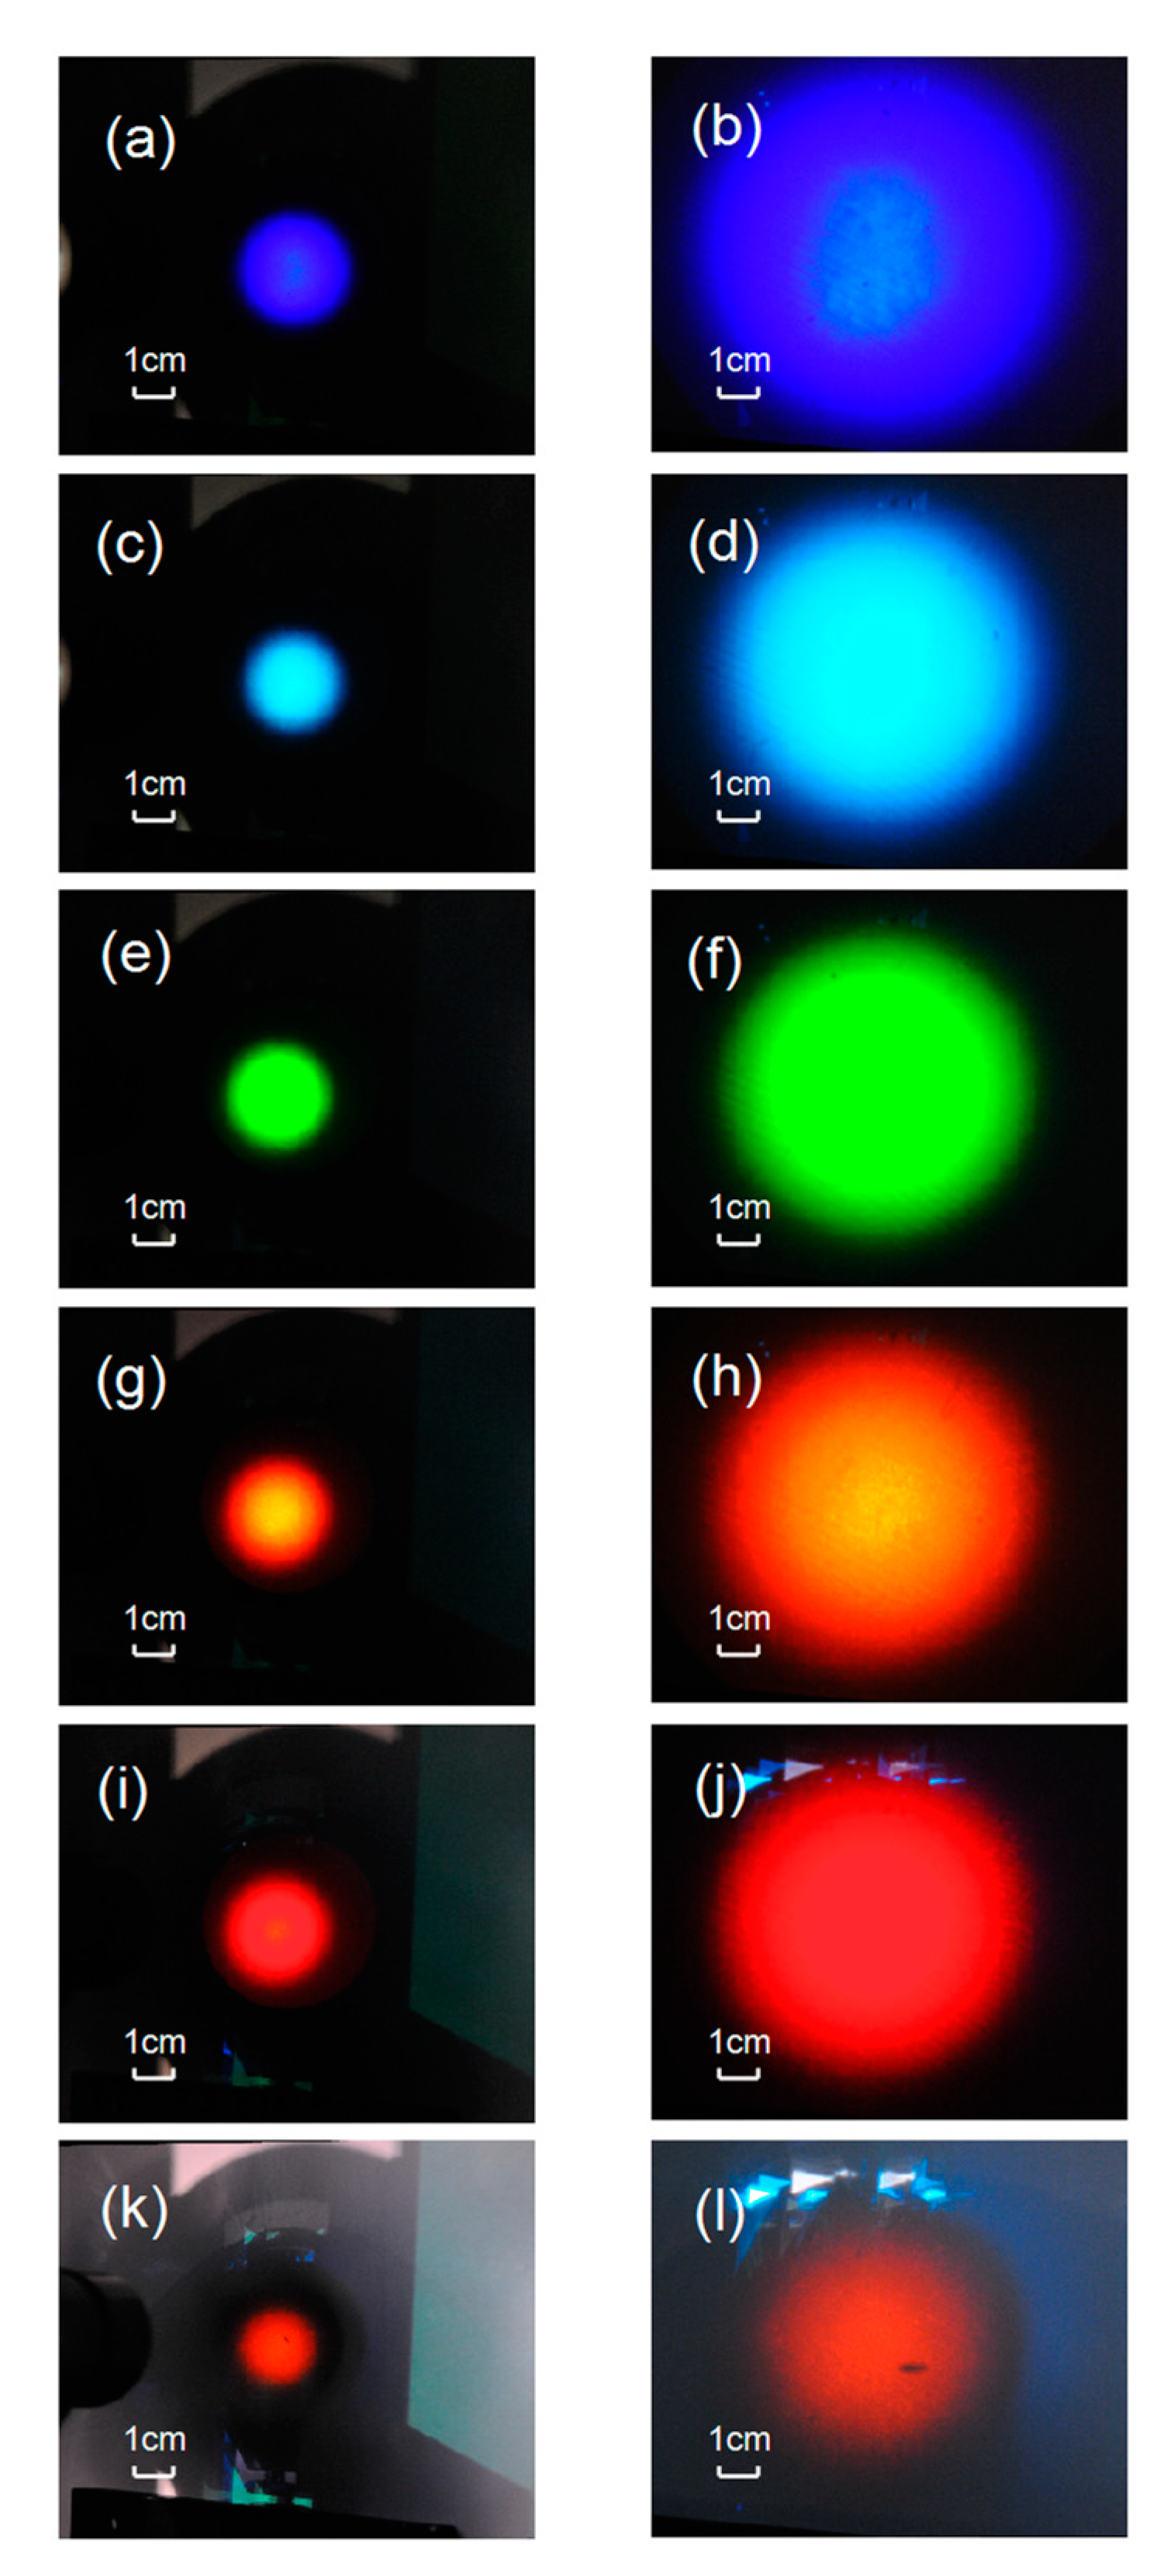
We take the white light induced by the filament generated by the zero-order BG and LG beams as example, and display the light spot patterns for different spectral components of white light on the white screen, as shown in
Figure 4 and
Figure 5. It can been from the figures that with the increase of the wavelength, the radius of the light spot decreases both in the case of LG and BG beams, which is the feature of conical emission. However, there exist a significant difference between the profiles of light spots of the monochromatic components from the white light induced by the two kinds of vortex beams. For the BG beams, the light spot is composed of a central bright spot and several concentric rings, as shown in
Figure 4(b, d, f, h, j, l). It results in a rainbow of concentric rings of white light when all spectral components are mixed together. The central part of the rings contains all the spectral components, making it a white dot, as shown in
Figure 3(a)-3(c), which is similar to the commonly observed white light spot. For the LG beam, each monochromatic component from the white light produced by filamentation of the femtosecond LG beam is a circular disk, as shown in
Figure 5. The different spectral components are mixed together, making the white light spot a circular white disk, which is different from the commonly observed white light spot.
Before conducting further analysis and discussion, we shall review the physical mechanism that accounts for conical emission. Since the self-phase modulation (SPM) is taken as the predominant mechanism for the supercontinuum generation [
19,
20] and the conical emission is a characteristic phenomenon of supercontinuum generation, we prefer to the SPM scheme to qualitatively interpret the conical emission in the following part (in effect, it has been done by numerous work).
The variation of the frequency induced by SPM can be described by [
19,
20,
29,
30]:
where
is the variation of the phase of the laser pulse,
,
z,
n2,
and
are the central frequency of the laser pulse, the propagation distance in media, second order nonlinear refractive index, plasma density and the critical plasma density (
,
,
e and
me are permittivity of vacuum, electron charge, and electron mass), respectively.
During the femtosecond laser filamentation, the temporal evolution of plasma and laser intensity also brings variation to the wave vector, and the general wave vector
is given by:
where
and
are the initial longitudinal and radial wave vectors of the incident femtosecond pulses,
and
are the variation in the longitudinal and radial wave vectors,
and
are the unit vectors of the longitudinal and radial components. Both
and
are related to the plasma generation and temporal evolution of laser intensity [
19,
20]. Since the conical emission arises from the variation in radial wave vectors, here we mainly consider the variation in radial wave vector, which is given by [
19]:
The front of the pulse, where plasma can be neglected, induces a redshift associated with a positive kr(t), i.e. converging toward the filament axis, while the contribution of the plasma in the trail of the pulse leads to a blue-shift associated with a negative radial phase derivative. Hence the conical emission is interpreted as a divergence of the anti-Stokes components of the supercontinuum induced by the plasma. No conical emission was found at Stokes shifted wavelengths. In this paper, we focus on the spectral components at the blue side of the central wavelength (i.e., visible band), always takes the positive values.
From Eqs. (2) and (4), it can be obviously seen that
is positively related to
. As shown in
Figure 4(a), for the newly generated spectral component, the more its frequency deviates from the central frequency of the laser pulse (i.e.,
), the larger its divergence angle with respect to the filament axis is, which can well explain the feature of conical emission.
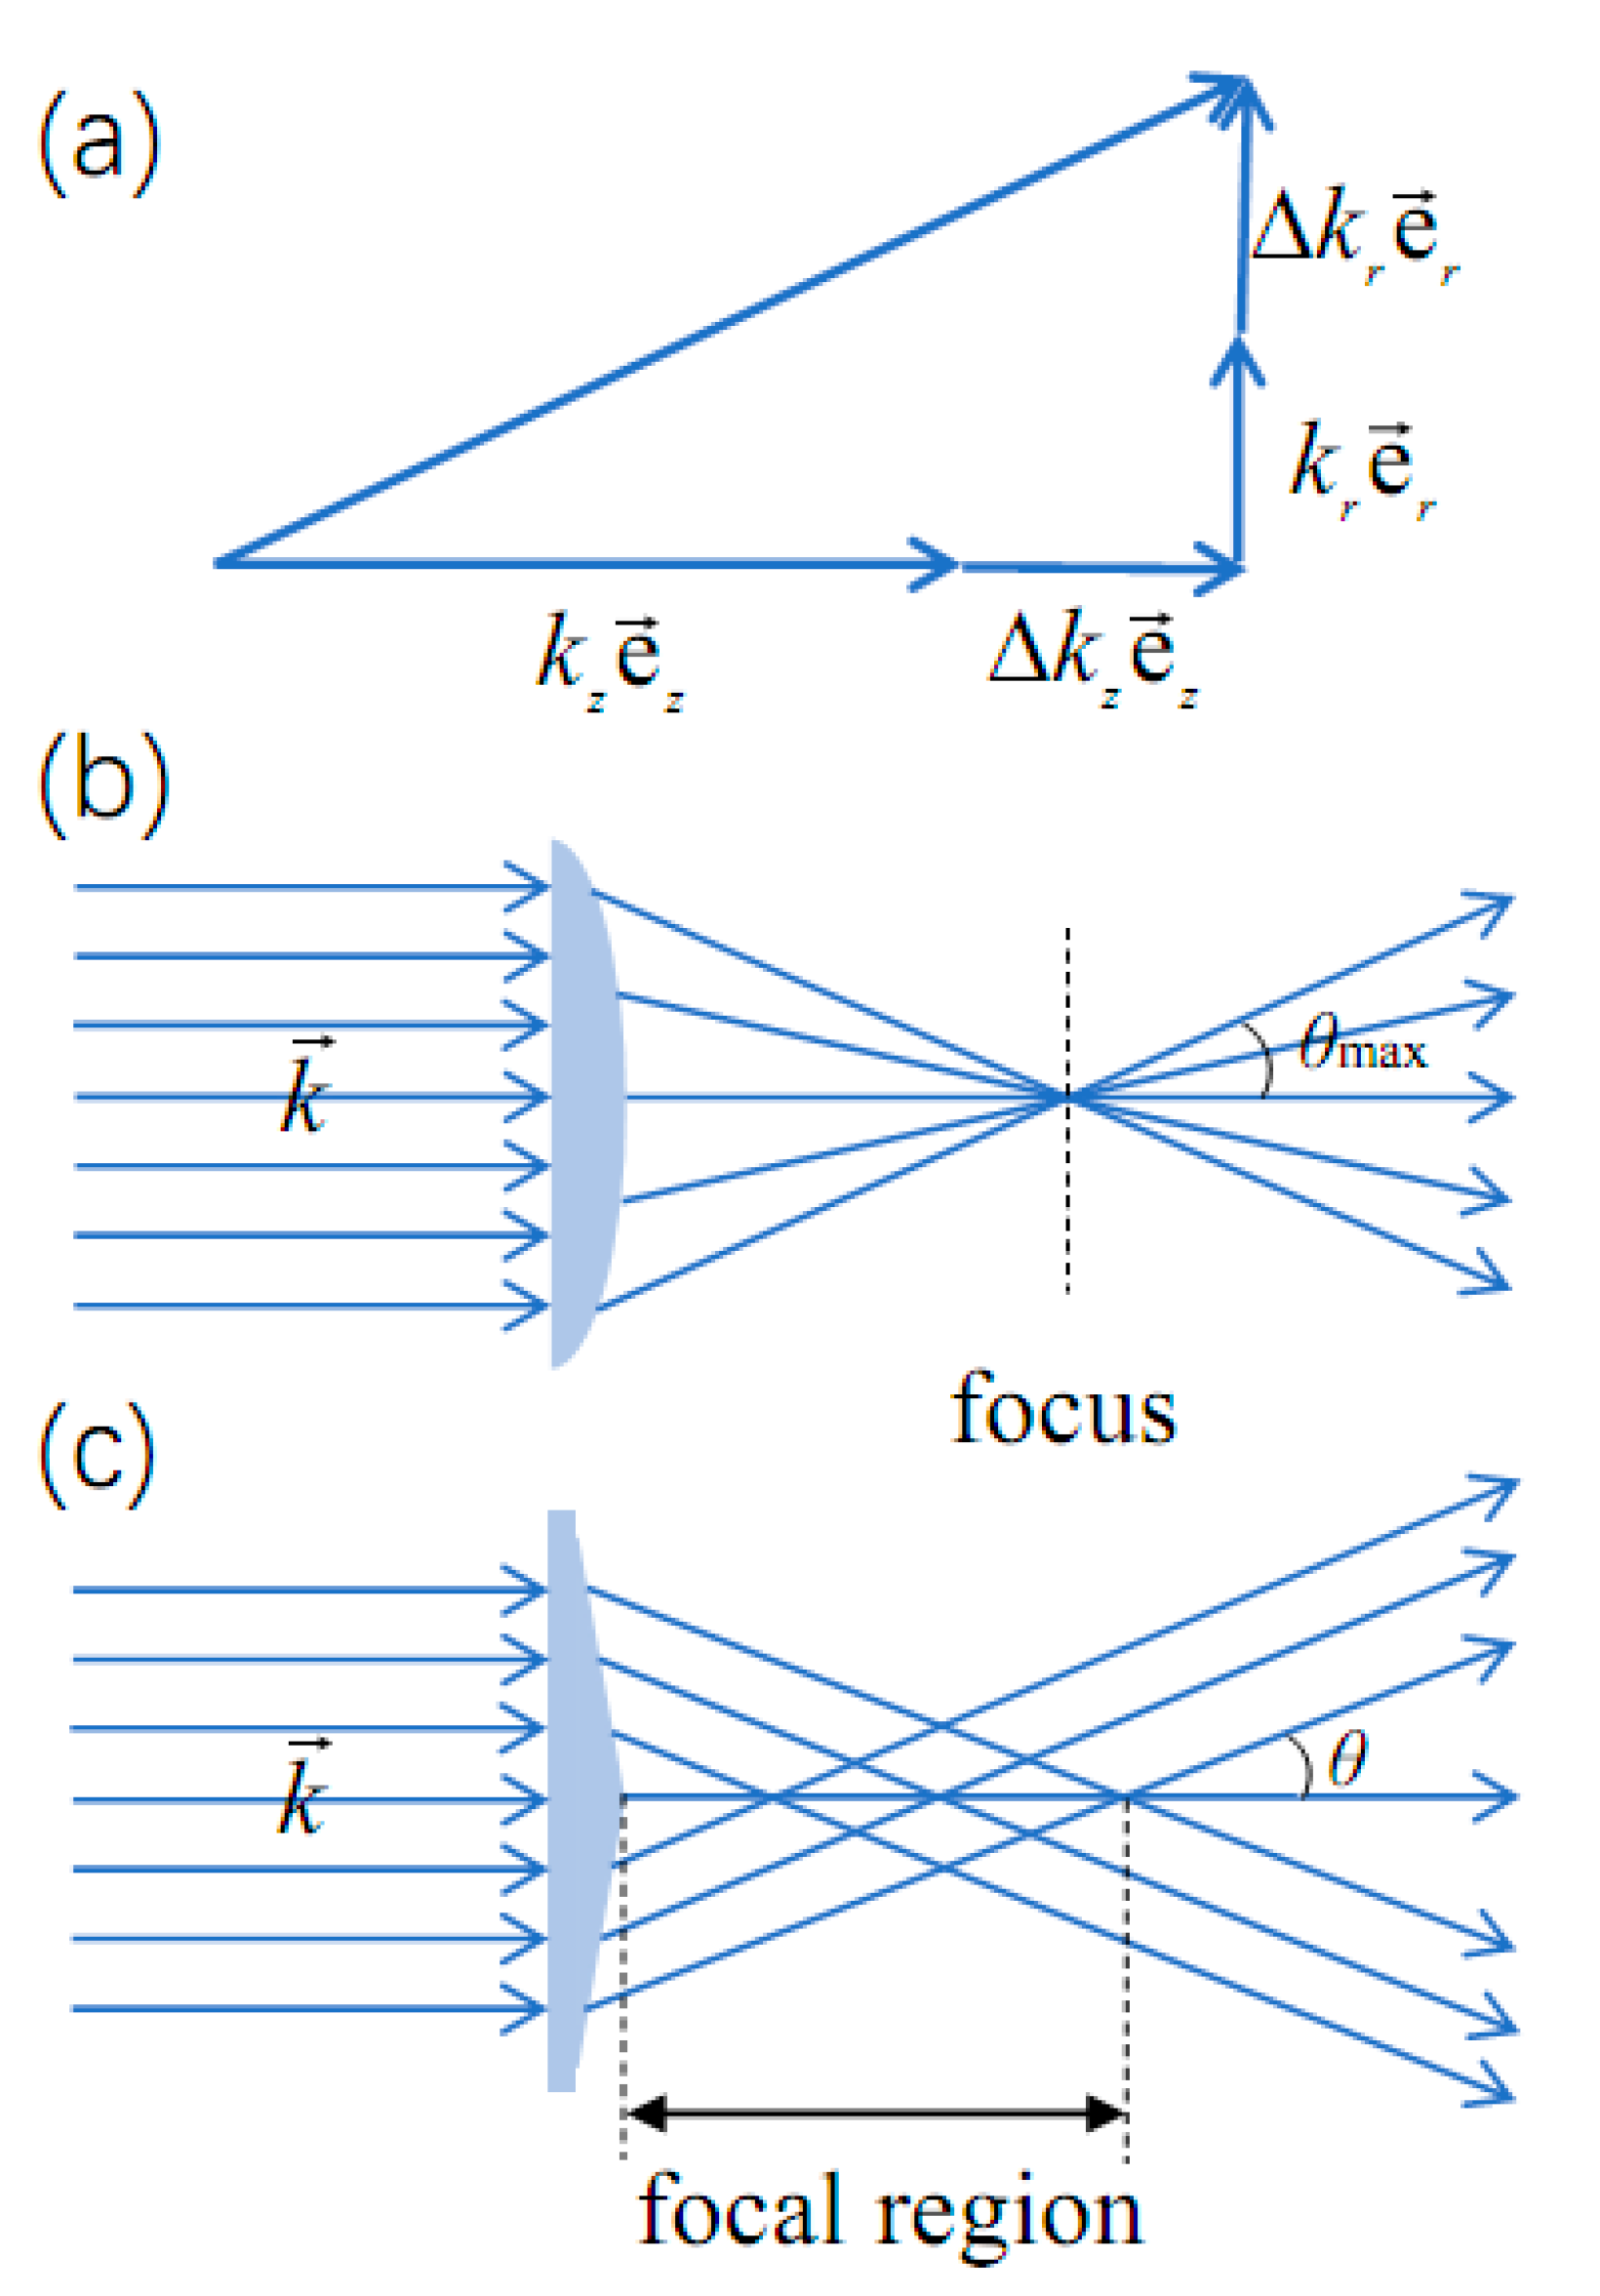
The difference between the conical emission induced by the femtosecond LG and BG beams can be attributed to the using of plano-convex focusing lens and axicon lens. In the experiment, after the laser beams pass the plano-convex focusing lens and axicon lens, due to the different geometries of these lenses, the spatial distribution of the wave vectors differs much in the two cases, as shown in
Figure 6(b) and 6(c). In our work, the numerical aperture of plano-convex focusing lens is high (NA=0.16), making the incident laser beam diverge greatly, and thus the wave vectors point at different directions, as shown in
Figure 6(b). The divergence angle brought by the plano-convex focusing lens takes continuous values between 0° and 3.8°. According to the numerical aperture (NA) of selected focusing lens, the focusing regime can be divided in to the linear and nonlinear ones [
33], which greatly affects the femtosecond laser filamentation process and accompanied nonlinear phenomena like fluorescence and supercontinuum radiation [
34,
35,
36].
For the high NA case, the linear focusing play a dominant role in the filamentation. Once the filament is formed, the wave vectors of the newly generated spectral components also point at different directions, and thus the captured white light spots are circular white disks, which is completely different from the commonly observed white light spot. If we use a plano-convex focusing lens with much longer focal length, the directions of the wave vectors are almost uniform, pointing at the propagation direction. In this case, the filamentation mainly results from the self-focusing, and the normal white light spot can be observed. In contrast, after the laser beam passes the axicon lens, the direction of the wave vectors is the same (the divergence angle brought by the axicon lens is 5°), and thus the captured patterns are rings. Jukna
et al numerically simulated the propagation of femtosecond BG beam in glass, and found that the BG beam can generate a ring-shaped filamentary ionized channel, forming the helical multiple filaments [
37]. They also found that the ring-shaped filamentary ionized channel is merely affected by the TC value. As a consequence, the white light generated by the helical multiple filaments exhibits the rainbow-like conical emission.
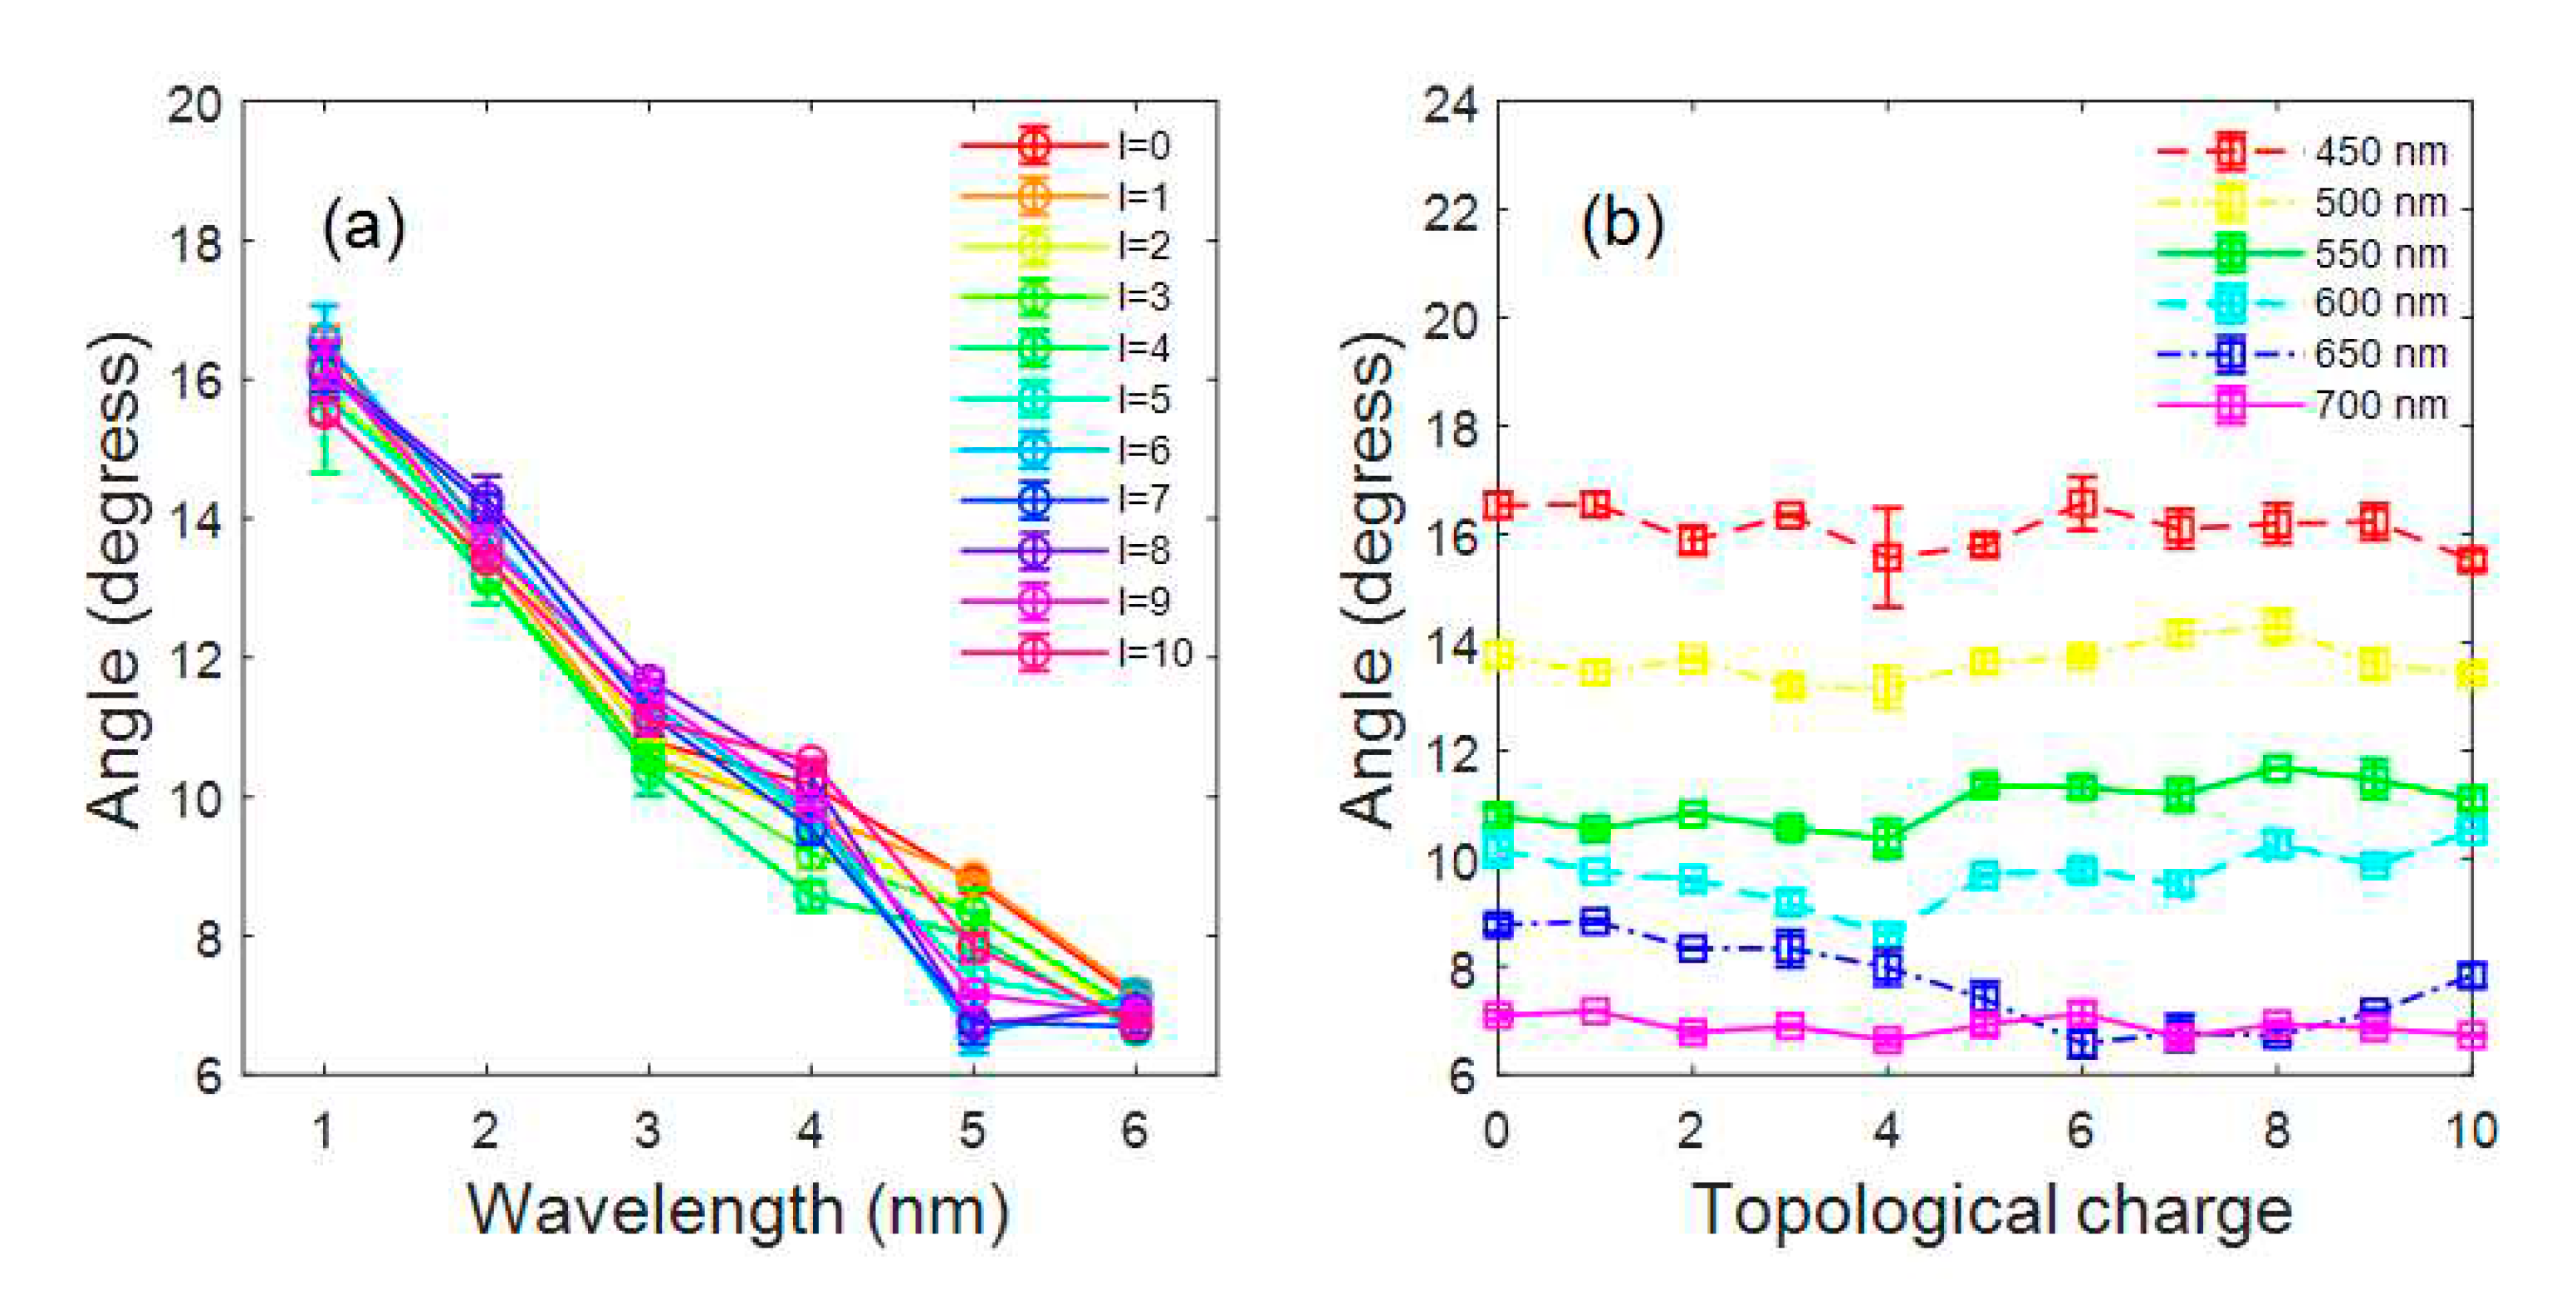
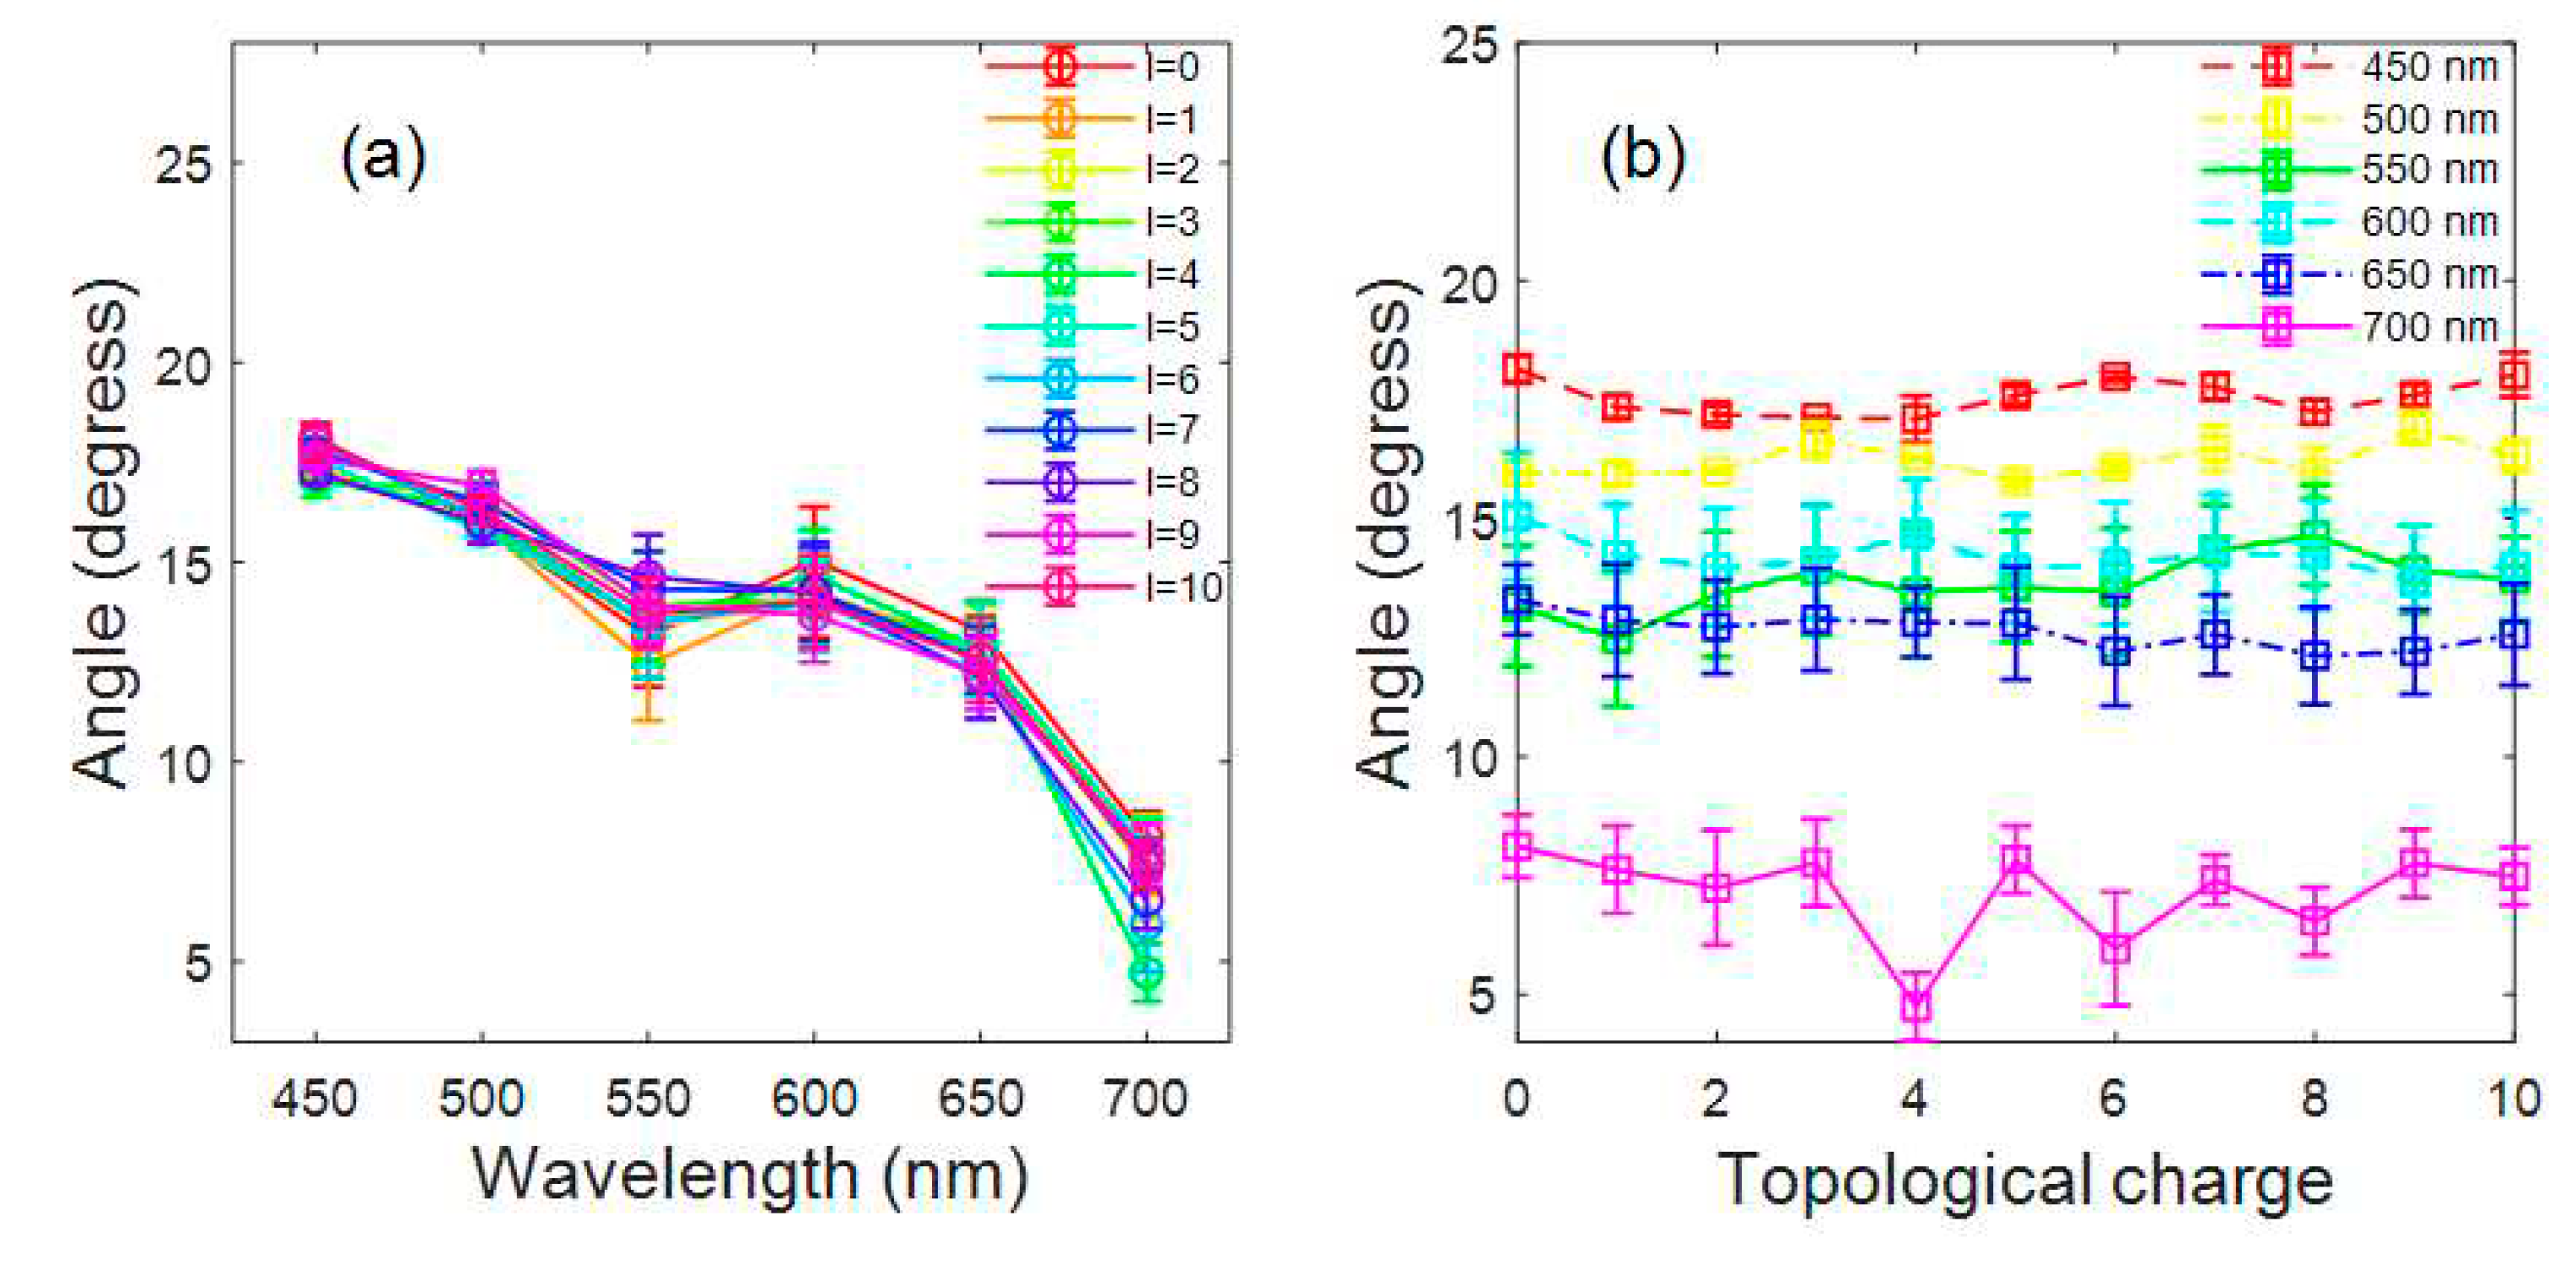
Through the radius of the light spot measured at the two selected positions, we can obtain the maximum divergence angle of the supercontinuum induced by the femtosecond vortex beams by using Eq. (1), as shown in
Figure 7 and
Figure 8. Here, we use the divergence angle rather than the conical angle, because the using of lens contributes partly to the divergence angle. As has been stated in the previous part, the divergence angle
brought by plano-convex focusing lens and axicon lens are 0°-3.8°and 5° respectively. Therefore, the real conical angle is
. It can be seen from
Figure 7(a) and
Figure 8(a) that the divergence angle decreases with increasing wavelength, which is feature of conical emission, and agrees with the quantitative analysis done by the SPM. Interestingly, for all TC values adopted in our work, the change of the divergence angles of the supercontinuum induced by the femtosecond vortex beams with the wavelength are coincident. We also draw the curve showing the variation of the divergence angle with the TC value, as shown in
Figure 7(b) and
Figure 8(b). It can be seen from the figures that within the error, the divergence angle does not change with the TC value for all the wavelengths. The above results suggest that the OAM does not affect the supercontinuum generation and conical emission induced by the filamentation of femtosecond vortex beams. Though the OAM affects the filamentation threshold [
26,
27,
29], and the OAM can be transferred from the input pulse to the atoms/molecules in surrounding media during the interaction between laser and matters [
11,
12,
13], the TC value does not affect the spectral broadening providing the filament is formed [
29,
30]. According to the interpretation of SPM, see Eqs. (2) and (4), the helical phase carried by the light waves does not evolve in time and radial direction in space. As a result, the OAM does not bring any additional information to the supercontinuum and conical emission. More importantly, in the interaction between intense femtosecond laser pulse and condensed matters, the OAM has nearly no effect on the generated phenomena, which can be attributed to several factors. Firstly, the number density of atom/molecule in the condensed medium is high, and numerous plasmas are generated during the interaction. Consequently, the OAM carried by newly generated component of SC is transferred to the electrons, atoms and molecules in the medium, leading to the depletion of the OAM [
32]. Secondly, through the angular momentum conservation is preserved in the optical parametric process like the optical parametric down-conversion [
14], four-wave mixing [
15], stimulated Raman scattering [
38], high-harmonic generation [
39]
etc., leading to the fact that the newly generated spectral components carry the OAM, whereas, the photoionization, SPM and other nonlinear effects that occur during the femtosecond filamentation are non-optical parametric processes, in which the angular momentum conservation is broken. In our future work, we will systematically study the interaction between the intense vortex beams and matters, and thoroughly explore the transfer of angular momentum and coupling of spin-orbital angular momentum during the strong interaction between laser and matter.
Figure 1.
Schematic diagram of the experimental setup to study the colored conical emission induced by the filamentation of femtosecond vortex beams in water. M1, M2: plane mirrors, H: half-wave plate, G: Glan prism, SLM: spatial light modulator, A: axicon lens (the dashed rectangle indicates it can be replaced by a plano-convex focusing lens); S: white screen, F: band-pass filter.
Figure 2.
Schematic diagram of the method to measure the divergence angle of supercontinuum induced by femtosecond vortex beams. θd is the divergence angle. By moving the white screen, the light spot is recorded at two selected positions along the propagation direction of the femtosecond beam. R1 and R2 are the radius of the light spot captured at the two positions.
Figure 3.
White light patterns recorded by the camera when the TC value of the BG beam is (a) l=0, (b) l=1, and (c) l=2. White light patterns recorded when the TC value of the LG beam is (a) l=0, (b) l=1, and (c) l=2.
Figure 3.
White light patterns recorded by the camera when the TC value of the BG beam is (a) l=0, (b) l=1, and (c) l=2. White light patterns recorded when the TC value of the LG beam is (a) l=0, (b) l=1, and (c) l=2.
Figure 4.
Spots of the (a,b) 450 nm, (c,d) 500 nm, (e,f) 550 nm, (g,h) 600 nm, (i,j) 650 nm and (k,l) 700 nm spectral components after the filamentation of the BG beam with l=0. (a, c, e, g, i, k) and (b, d, f, h, j, l) are measured when the distance between the back wall of cuvette and the white screen are 8.1 cm and 23.1 cm, respectively.
Figure 5.
Spots of (a,b) 450 nm, (c,d) 500 nm, (e,f) 550 nm, (g,h) 600 nm, (i,j) 650 nm and (k,l) 700 nm spectral components after the filamentation of the LG beam with l=0. (a, c, e, g, i, k) and (b, d, f, h, j, l) are measured when the distance between the back wall of cuvette and the white screen are 8.1 cm and 23.1 cm, respectively.
Figure 6.
(a) Illustration of the general wave vector. Spatial distribution of the wave vector of the laser beam after it passes the (b) plano-convex focusing lens and (c) axicon lens.
Figure 6.
(a) Illustration of the general wave vector. Spatial distribution of the wave vector of the laser beam after it passes the (b) plano-convex focusing lens and (c) axicon lens.
Figure 7.
(a) Variation of the maximum divergence angle of the supercontinuum induced by the BG beams with the wavelength. (b) Variation of the maximum divergence angle of different spectral components of the supercontinuum induced by the BG beams with the TC value.
Figure 7.
(a) Variation of the maximum divergence angle of the supercontinuum induced by the BG beams with the wavelength. (b) Variation of the maximum divergence angle of different spectral components of the supercontinuum induced by the BG beams with the TC value.
Figure 8.
(a) Variation of the maximum divergence angle of the supercontinuum induced by the LG beams with the wavelength. (b) Variation of the maximum divergence angle of different spectral components of the supercontinuum induced by the LG beams with the TC value.
Figure 8.
(a) Variation of the maximum divergence angle of the supercontinuum induced by the LG beams with the wavelength. (b) Variation of the maximum divergence angle of different spectral components of the supercontinuum induced by the LG beams with the TC value.
