Data analysis
All the data from the study was analyzed using IBM SPSS Statistics 25 and illustrated using Microsoft Office Excel/Word 2021. Quantitative variables weretested for normal distribution using the Shapiro-Wilk Test and werewritten as averageswith standard deviations or medianswith interquartile ranges.Quantitative independent variables with non-parametric distribution were tested between groups using Mann-Whitney U tests. Quantitative variables with non-parametric distribution measured on related samples were tested between measurements (beginning vs. end of study) using the Related-Samples Wilcoxon Signed Rank Test.
Qualitative variables were written as counts or percentages and differences between independent groups were tested using Fisher’s Exact test. Z-tests with Bonferroni corrections were used to further detail the results obtained in the contingency tables. Differences between qualitative variables measured on related samples were tested between measurements (beginning vs. end of study) using the Related-Samples McNemar / Marginal Homogeneity Tests (with further McNemar tests with Bonferroni correction).
Data from
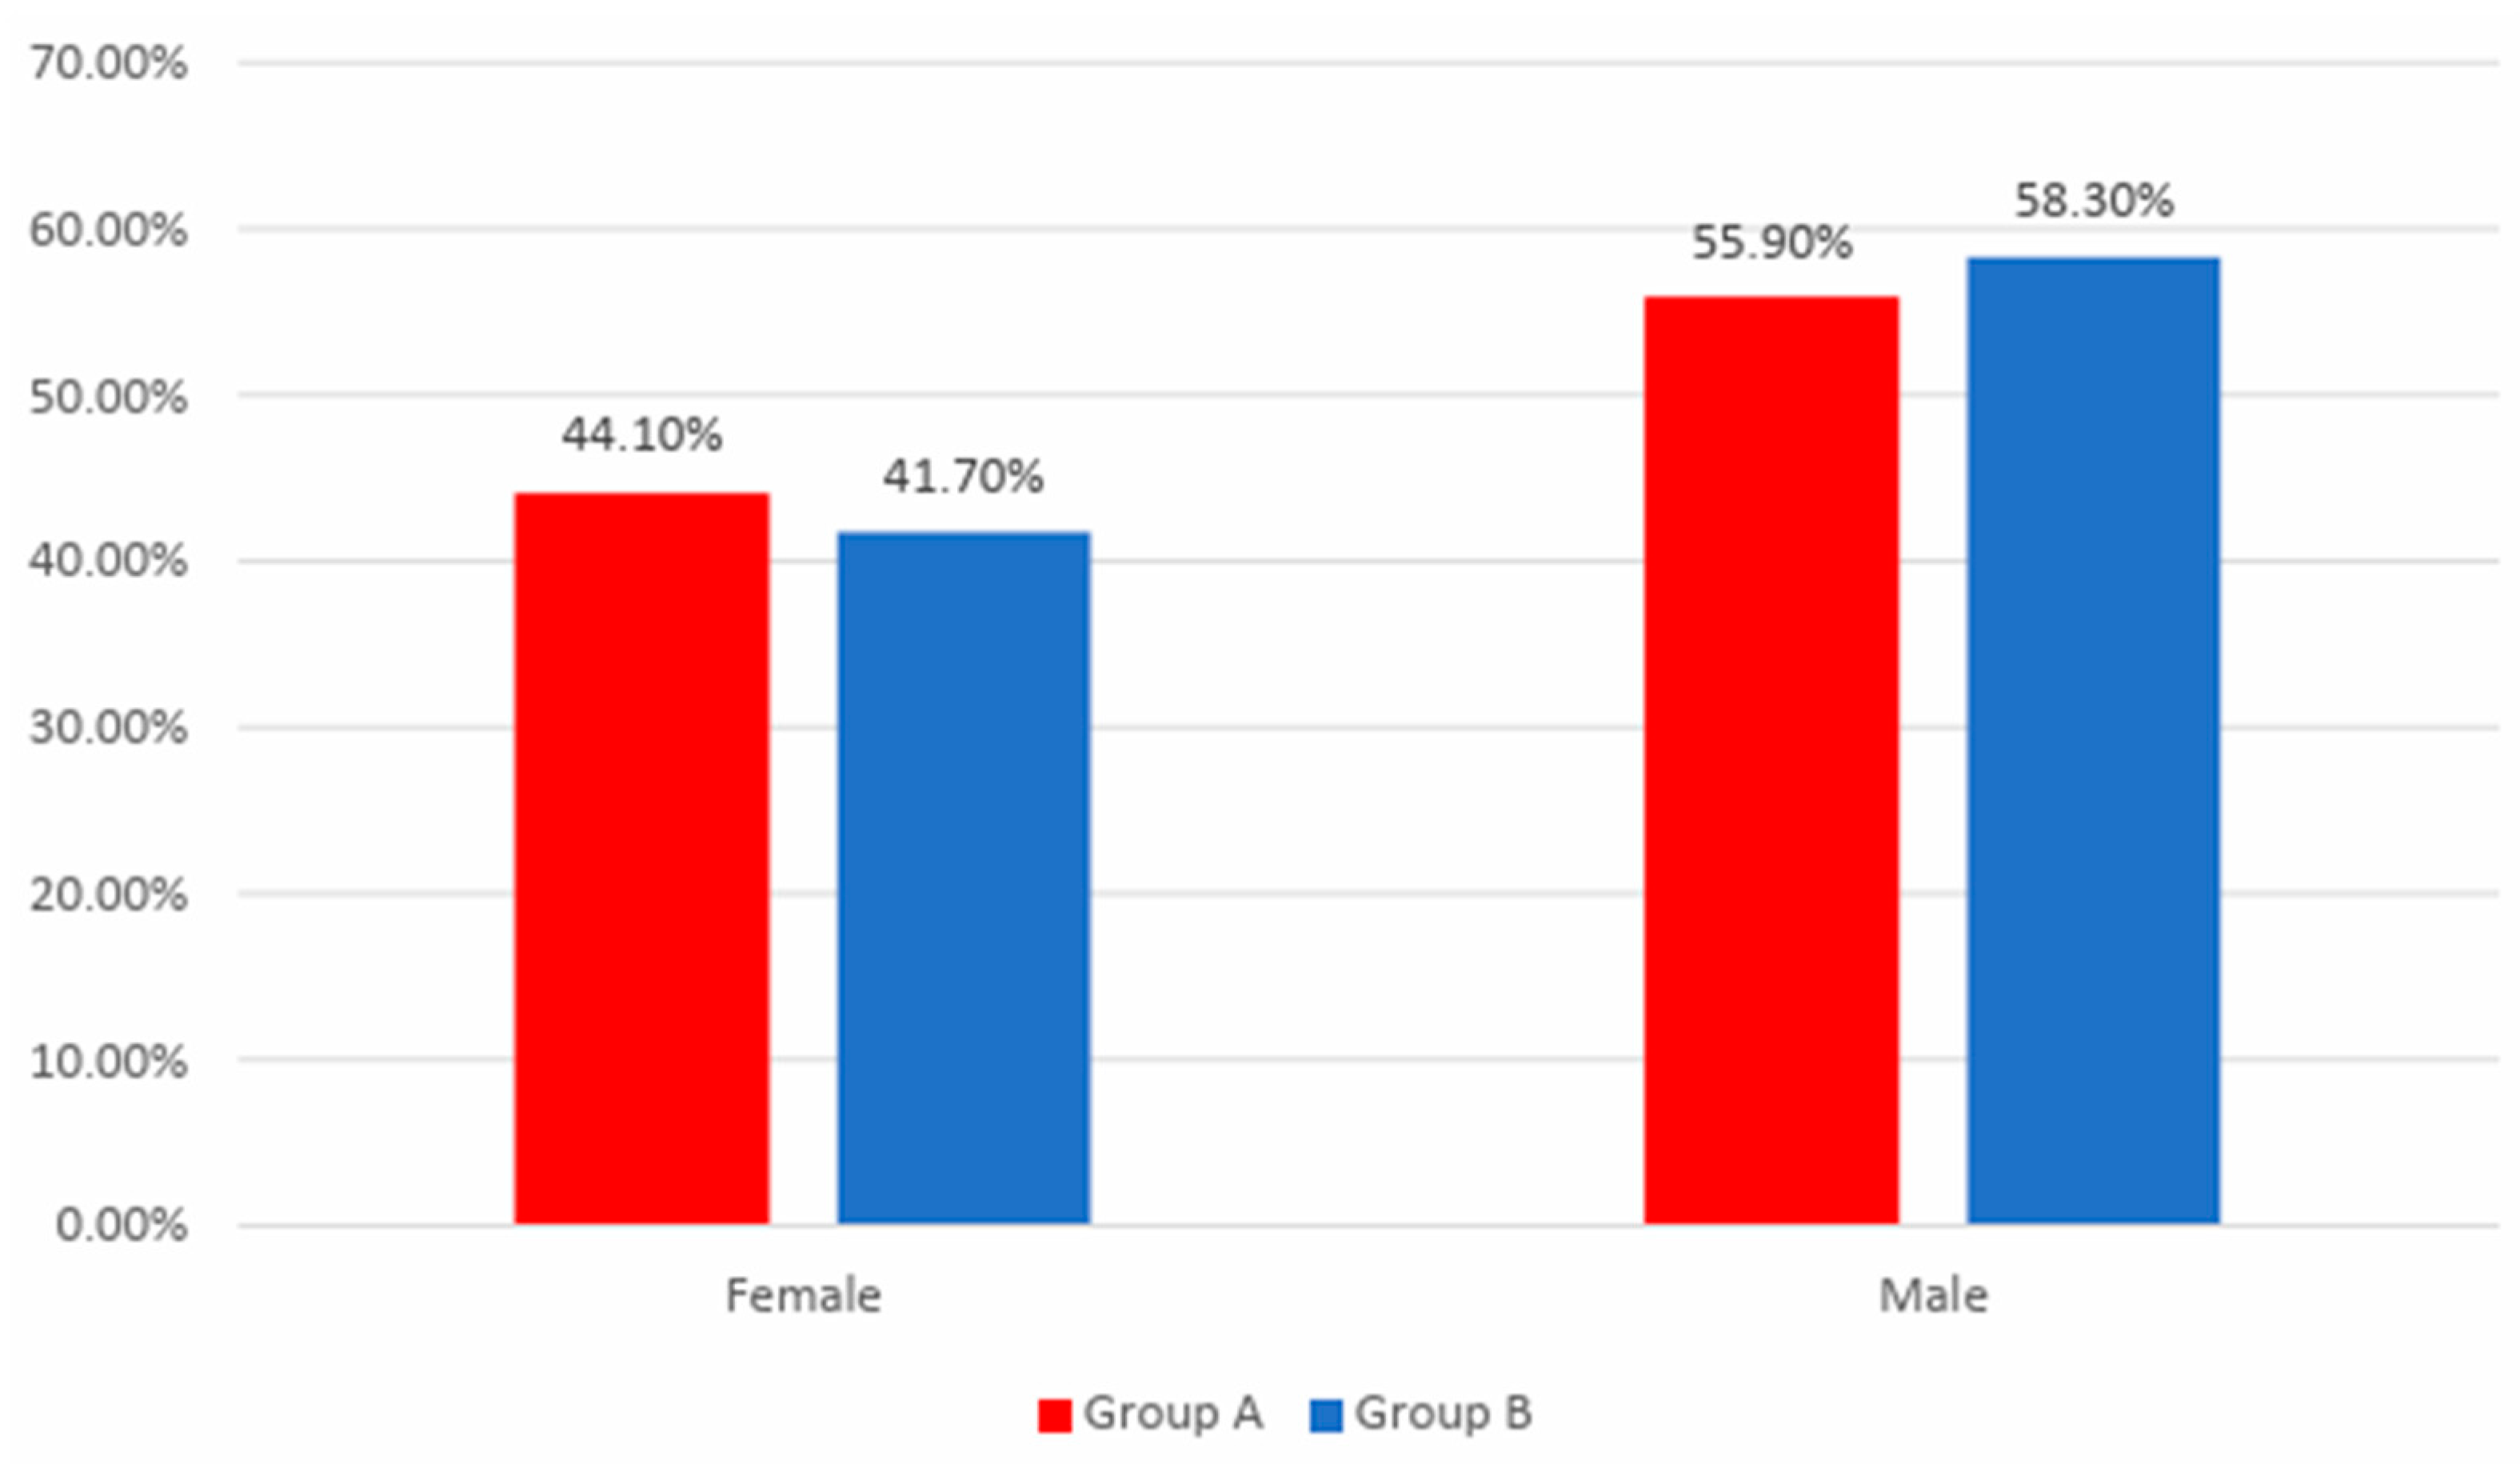
Figure 1 shows the distribution of the patients according to analyzed groups and gender. Differences between groups are not statistically significant
(p=0.781), as such, gender frequencies between the analyzed groups were not statistically significant in this study.
Data from
Table 1 shows the comparison of age between analyzed groups. Distribution of age was non-parametric in both groups
(p<0.05). Differences between groups were statistically significant
(p=0.043), patients in Group A were significantly younger (median age = 65, IQR = 59-72) in comparison to patients in Group B (median age = 67.5, IQR = 60.25-74.75).
Data from
Table 2 shows the distribution of the patients according to analyzed groups and AMI affected territory. Differences between groups were not statistically significant
(p=0.897), as such, frequencies of different AMI affected territory between the analyzed groups were not statistically significant in this study.
Data from
Table 3 shows the distribution of the patients according to analyzed groups and existence of systolic disfunction during hospitalization. Differences between groups were not statistically significant
(p=1.000), as such, frequencies of systolic disfunction during hospitalization between the analyzed groups were not statistically significant in this study.
Data from
Table 4 shows the distribution of the patients according to analyzed groups and existence of arrythmias during hospitalization. Differences between groups were not statistically significant
(p=0.556), as such, frequencies of arrythmias during hospitalization between the analyzed groups were not statistically significant in this study.
Data from
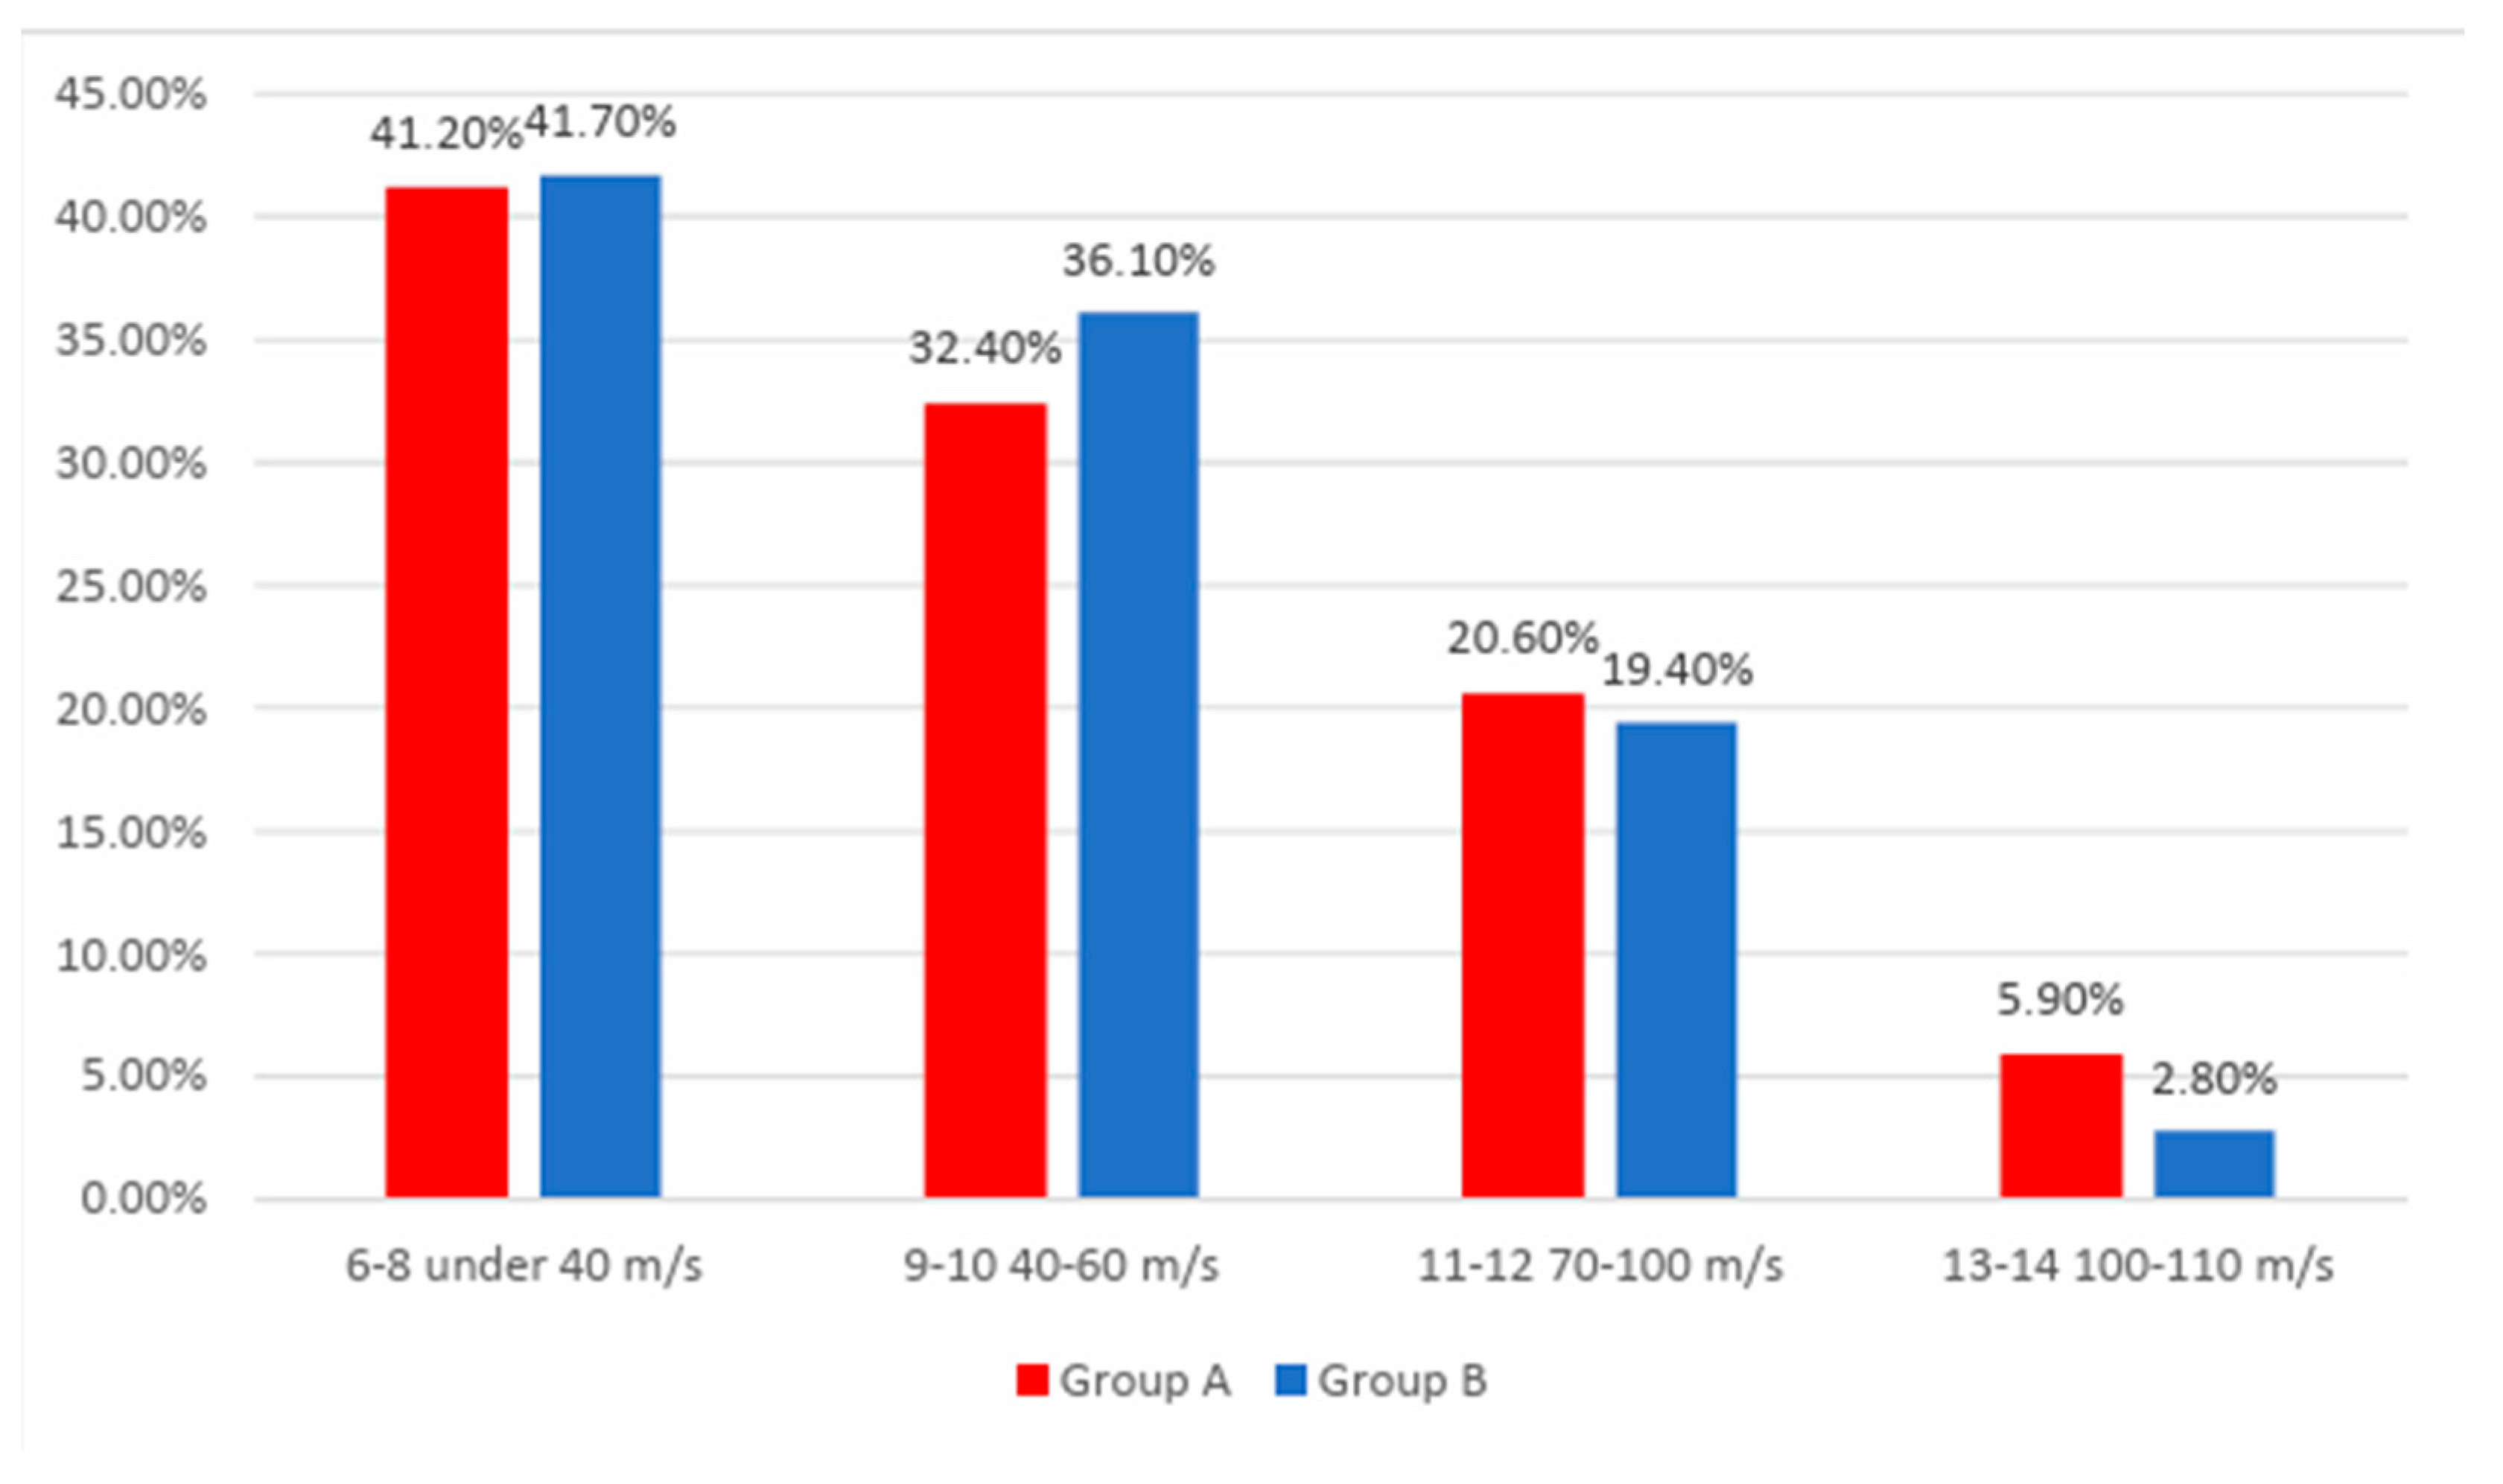
Figure 2 shows the distribution of the patients according to analyzed groups and exercise tolerance at the beginning of the study. Differences between groups were not statistically significant
(p=0.725), as such, frequencies of exercise tolerance at the beginning of the study between the analyzed groups were not statistically significant in this study.
Data from
Table 5 shows the distribution of the patients according to analyzed groups and exercise tolerance at the end of the study. Differences between groups were statistically significant
(p=0.007) and
Z-tests with Bonferroni correction showed that patients with an exercise tolerance of 6-8 under 40 m/s at the end of the study were significantly more frequent in Group B than in Group A (16.7% vs. 2.9%).
Data from
Table 6 and
Table 7 shows the distribution of the patients in Group A according to the exercise tolerance at the beginning and end of the study. Differences between the frequencies of exercise tolerance between the beginning and end of the study were statistically significant
(p<0.001) and post-hoc
McNemar’s Tests with Bonferroni correction showed the following for the patients in Group A:
Frequency of exercise tolerance of 6-8 under 40 m/s significantly decreased at the end of the study (41.2% vs. 2.9%) (p<0.001);
Frequency of exercise tolerance of 9-10 40-60 m/s was not significantly different at the end of the study from the beginning (p=1.000);
Frequency of exercise tolerance of 11-12 70-100 m/s significantly increased at the end of the study (20.6% vs. 41.2%) (p=0.012);
Frequency of exercise tolerance of 13-14 100-110 m/s significantly increased at the end of the study (5.9% vs. 23.5%) (p=0.001).
Data from
Table 8 and
Table 9 shows the distribution of the patients in Group B according to the exercise tolerance at the beginning and end of the study. Differences between the frequencies of exercise tolerance between the beginning and end of the study were statistically significant
(p<0.001) and the following observations were made for the patients in Group B:
Frequency of exercise tolerance of 6-8 under 40 m/s significantly decreased at the end of the study (41.7% vs. 16.7%) (p<0.001);
Frequency of exercise tolerance of 9-10 40-60 m/s was not significantly different at the end of the study from the beginning (p=1.000);
Frequency of exercise tolerance of 11-12 70-100 m/s significantly increased at the end of the study (19.4% vs. 36.1%) (p=0.008);
Frequency of exercise tolerance of 13-14 100-110 m/s significantly increased at the end of the study (2.8% vs. 16.7%) (p<0.001).
Data from
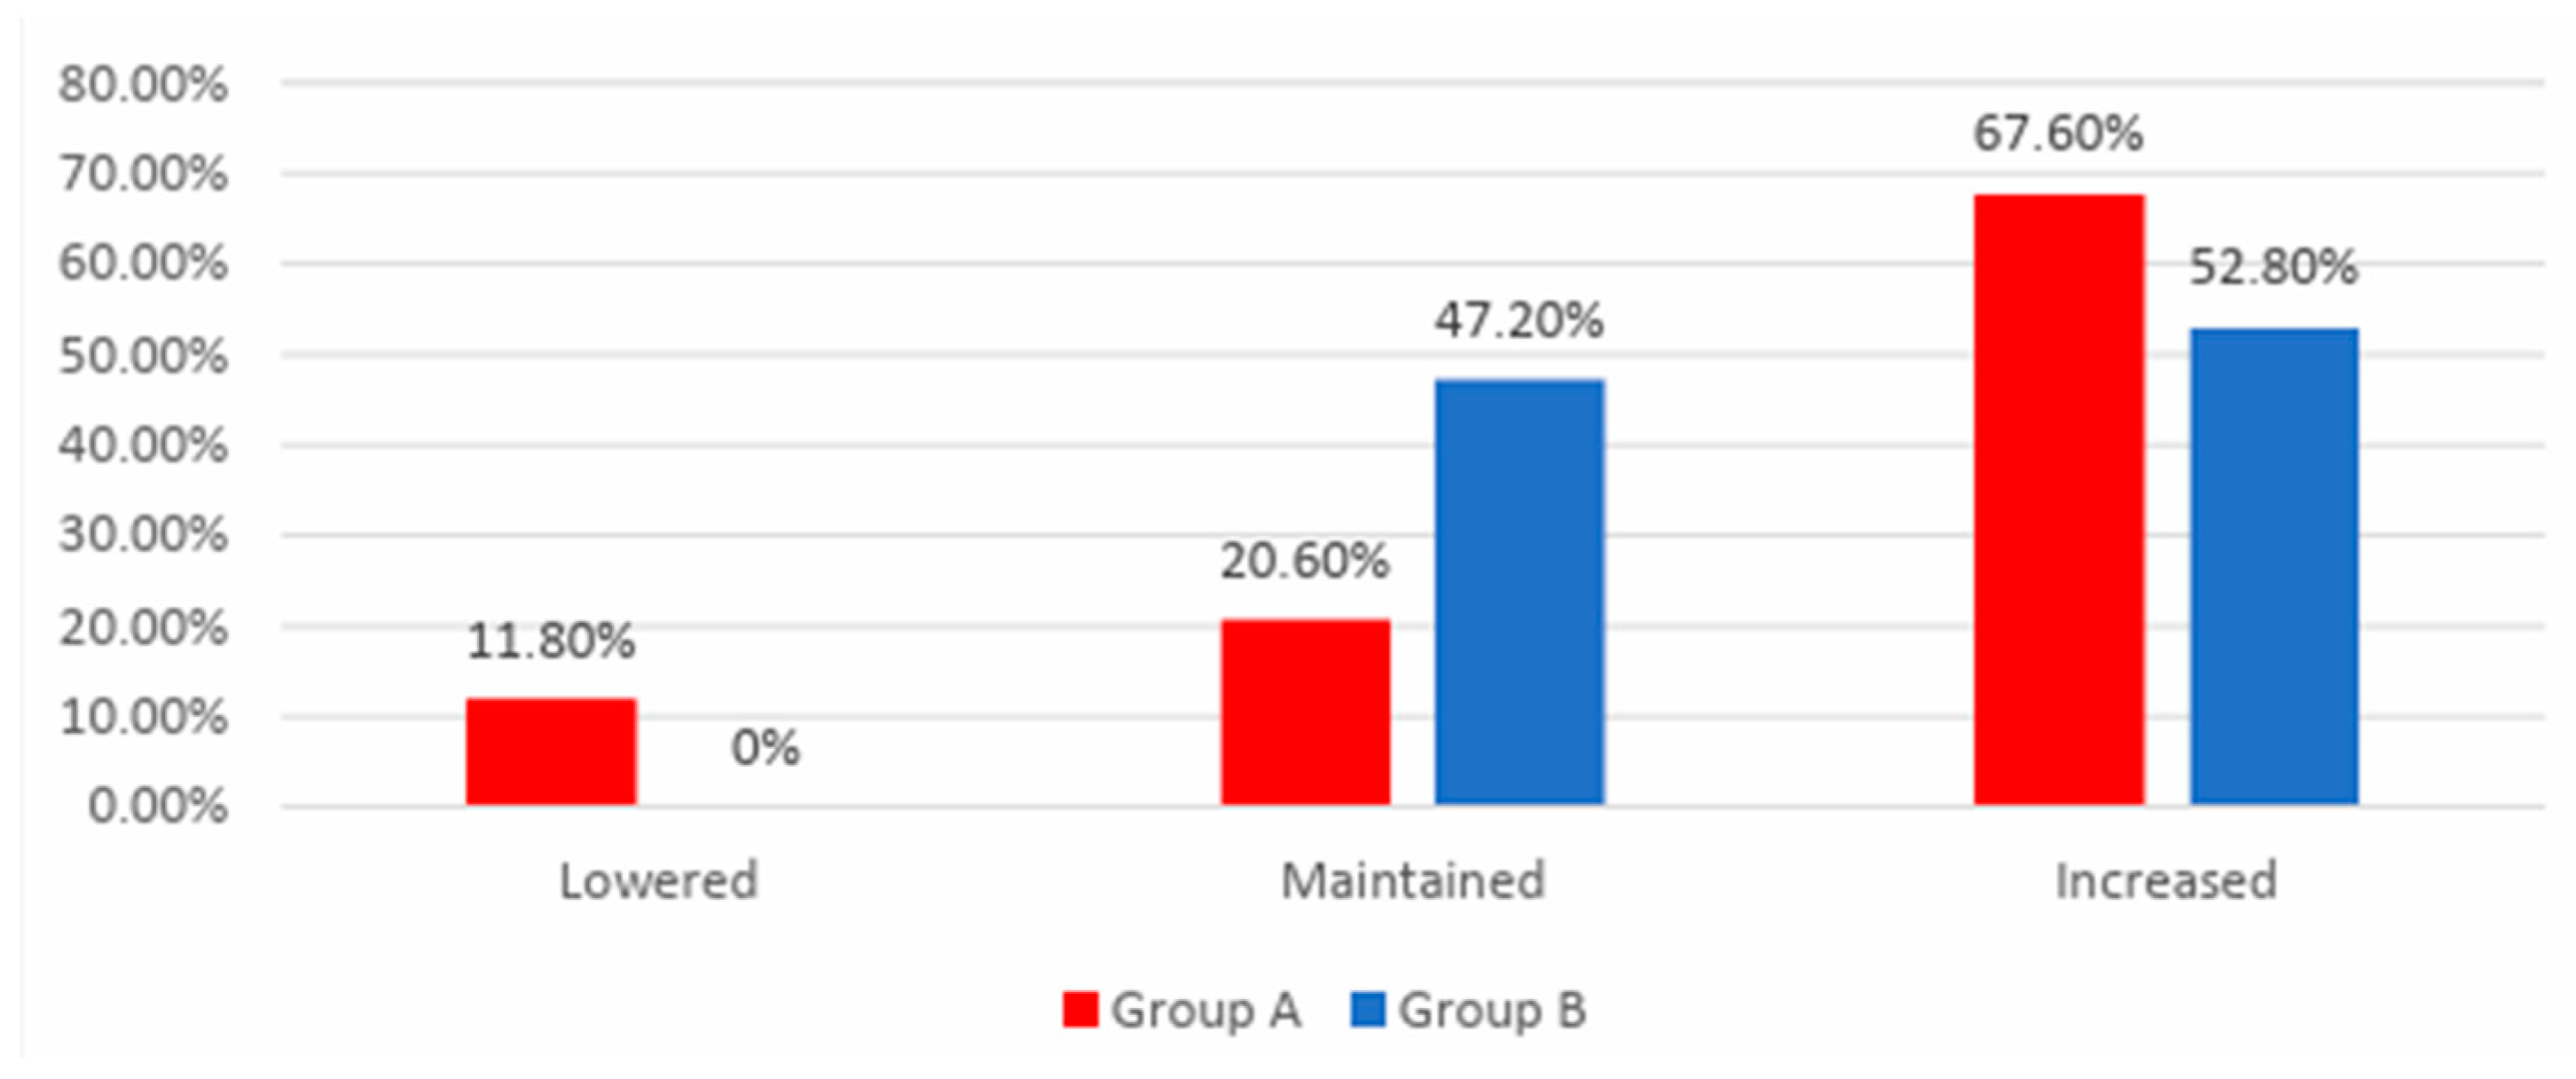
Figure 3 shows the distribution of the patients according to analyzed groups and evolution of exercise tolerance. Differences between groups were statistically significant
(p<0.001) and the following were observed:
Patients with lowered exercise tolerance at the end of the study were significantly more frequent in Group A than in Group B (11.8% vs. 0%);
Patients with increased exercise tolerance at the end of the study were significantly more frequent in Group A than in Group B (67.6% vs. 52.8%);
Patients with maintained exercise tolerance at the end of the study were significantly more frequent in Group B than in Group A (47.2% vs. 20.6%);
According to the results presented above and those in
Table 6 and
Table 8, the results showed that in Group B the exercise tolerance was maintained more frequently or raised at the end of the study, while in Group A the evolution of exercise tolerance was more variable, being more frequently lowered or raised at the end of the study.
Data from
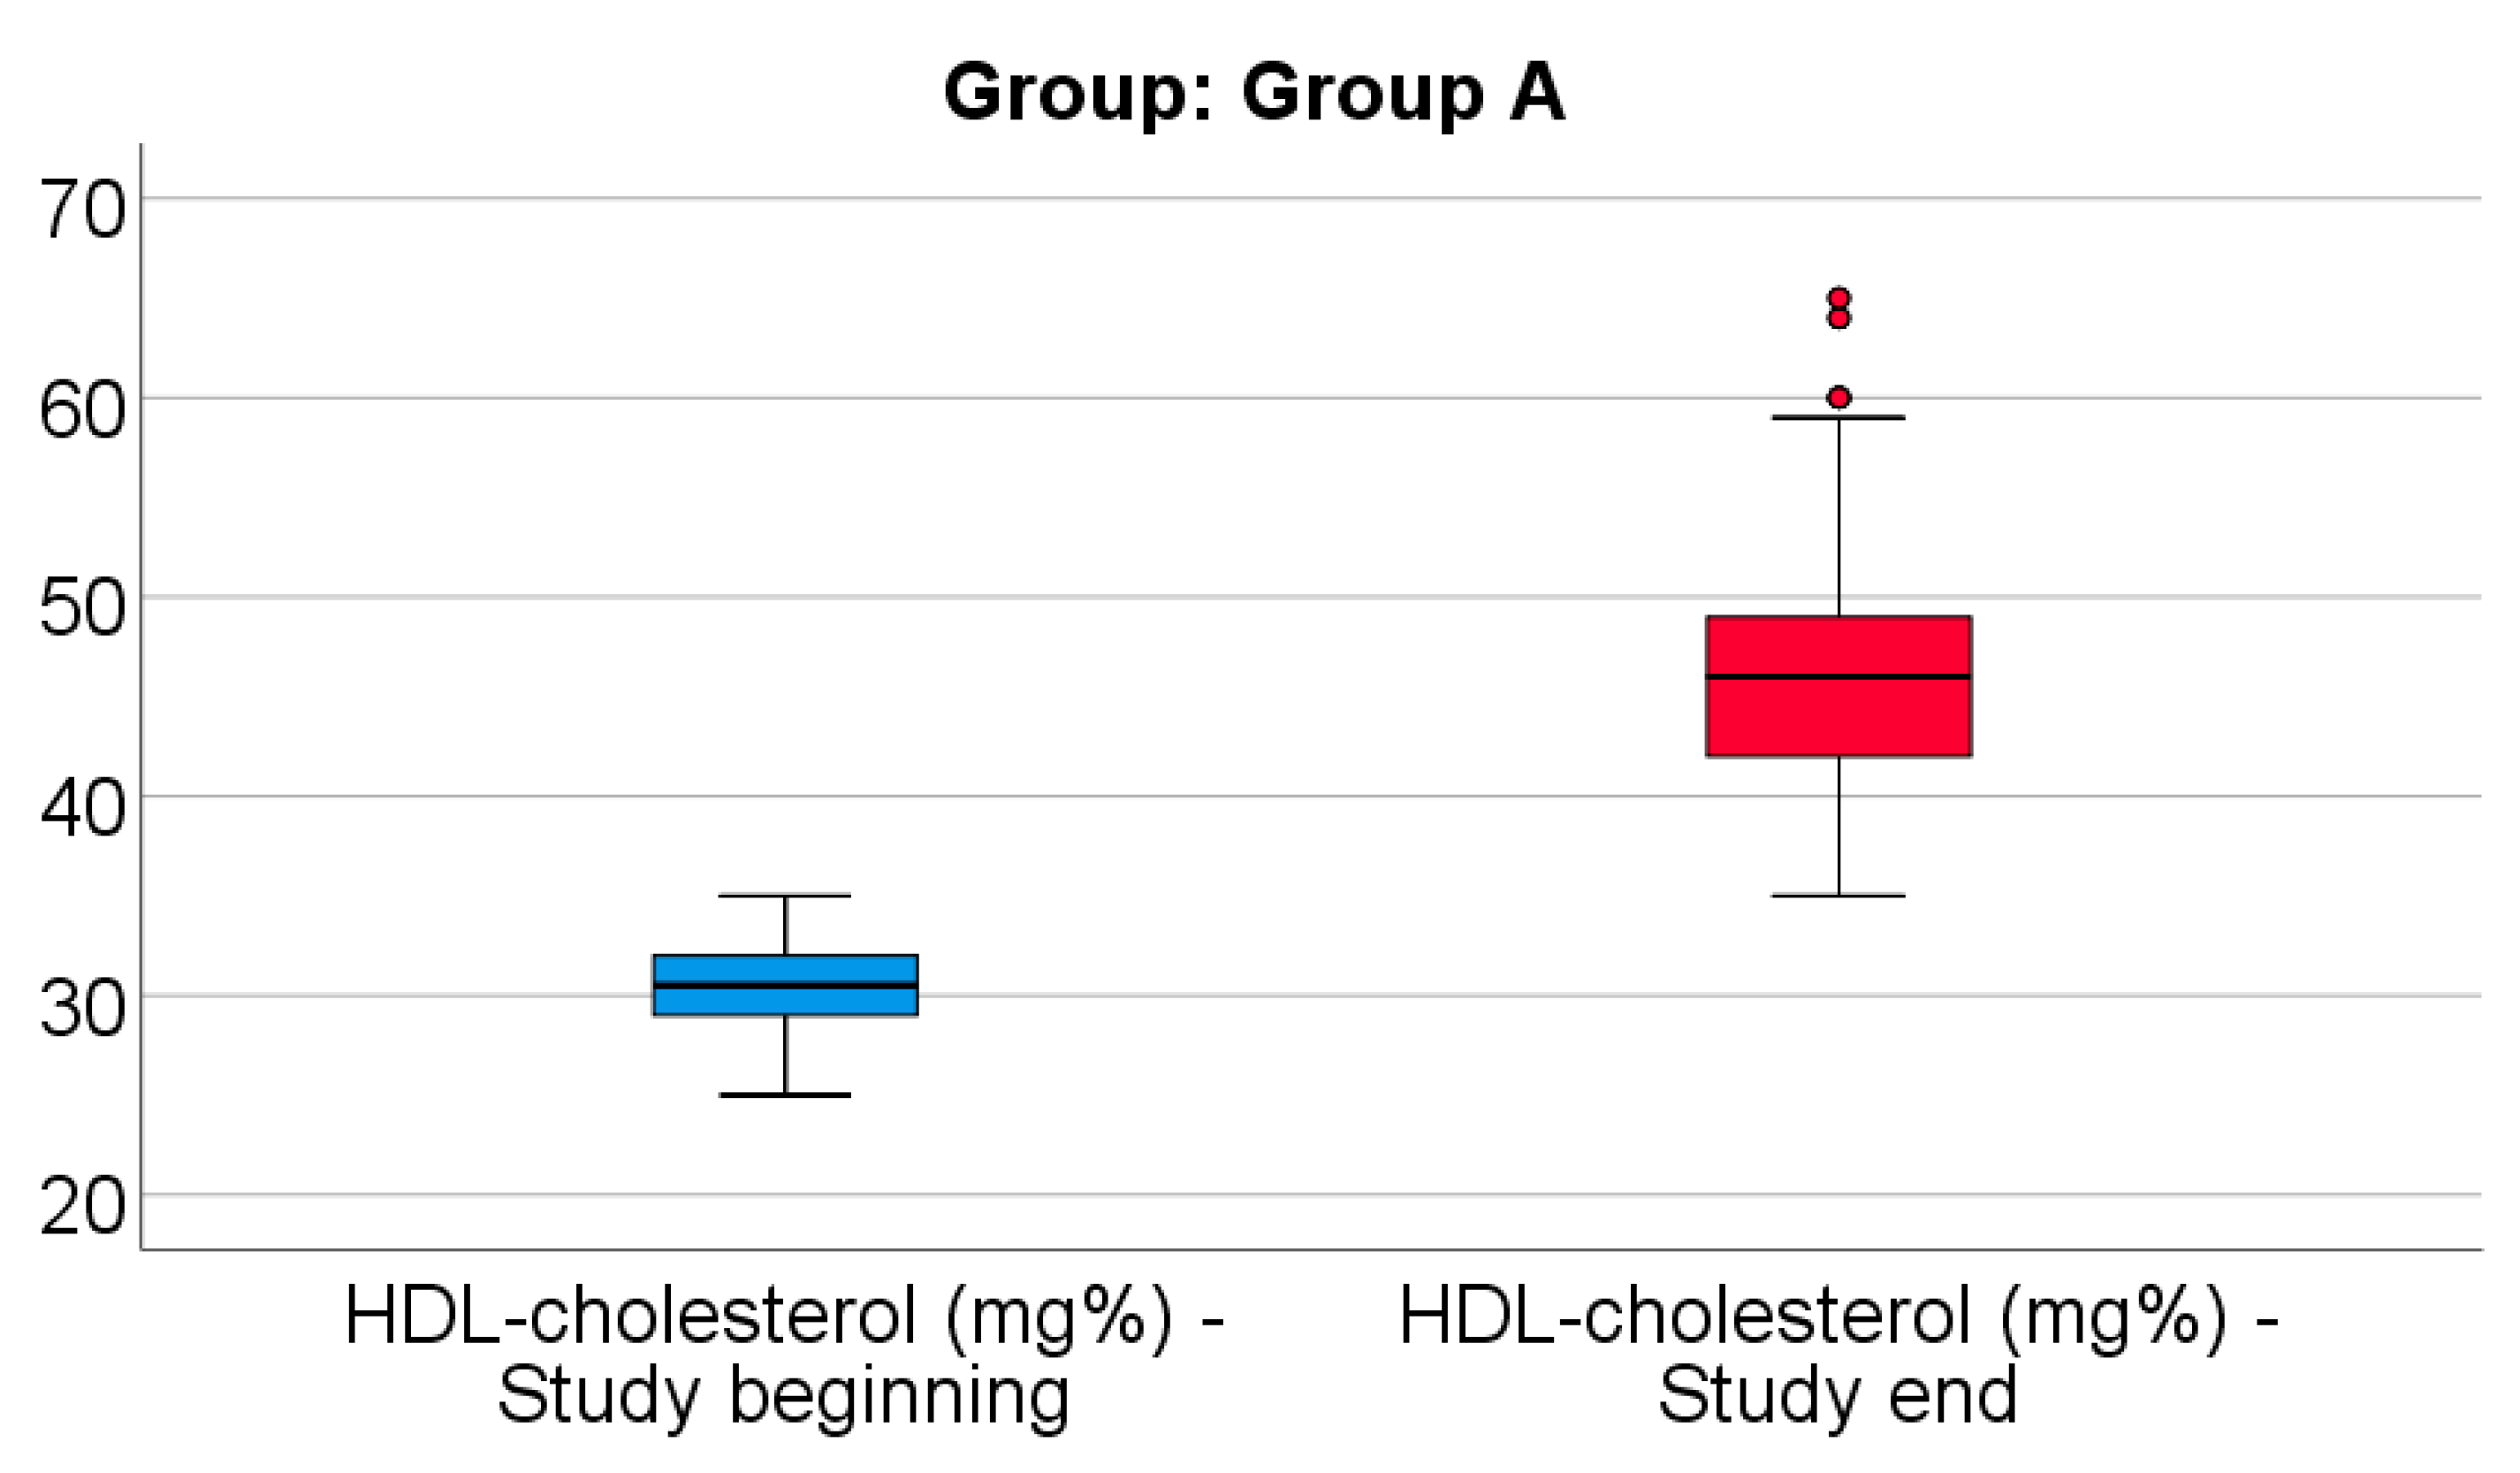
Figure 4 shows the comparison of HDL-cholesterol from the beginning to end of the study in patients from Group A. Distribution of HDL-cholesterol was non-parametric in both measurements
(p<0.05). Differences between the related measurements were statistically significant
(p<0.001), therefore HDL-cholesterol at the end of the study was significantly higher (median = 46, IQR= 42-49) in comparison to the value at the beginning of the study (median = 30.5, IQR = 29-32), the difference between the two measurements being significant (median difference = 14.5, IQR = 11-21 mg/dl and increase % reported for the HDL-cholesterol at the beginning of the study: median % increase: 47.52 %, IQR = 35.3-73.3).
Data from
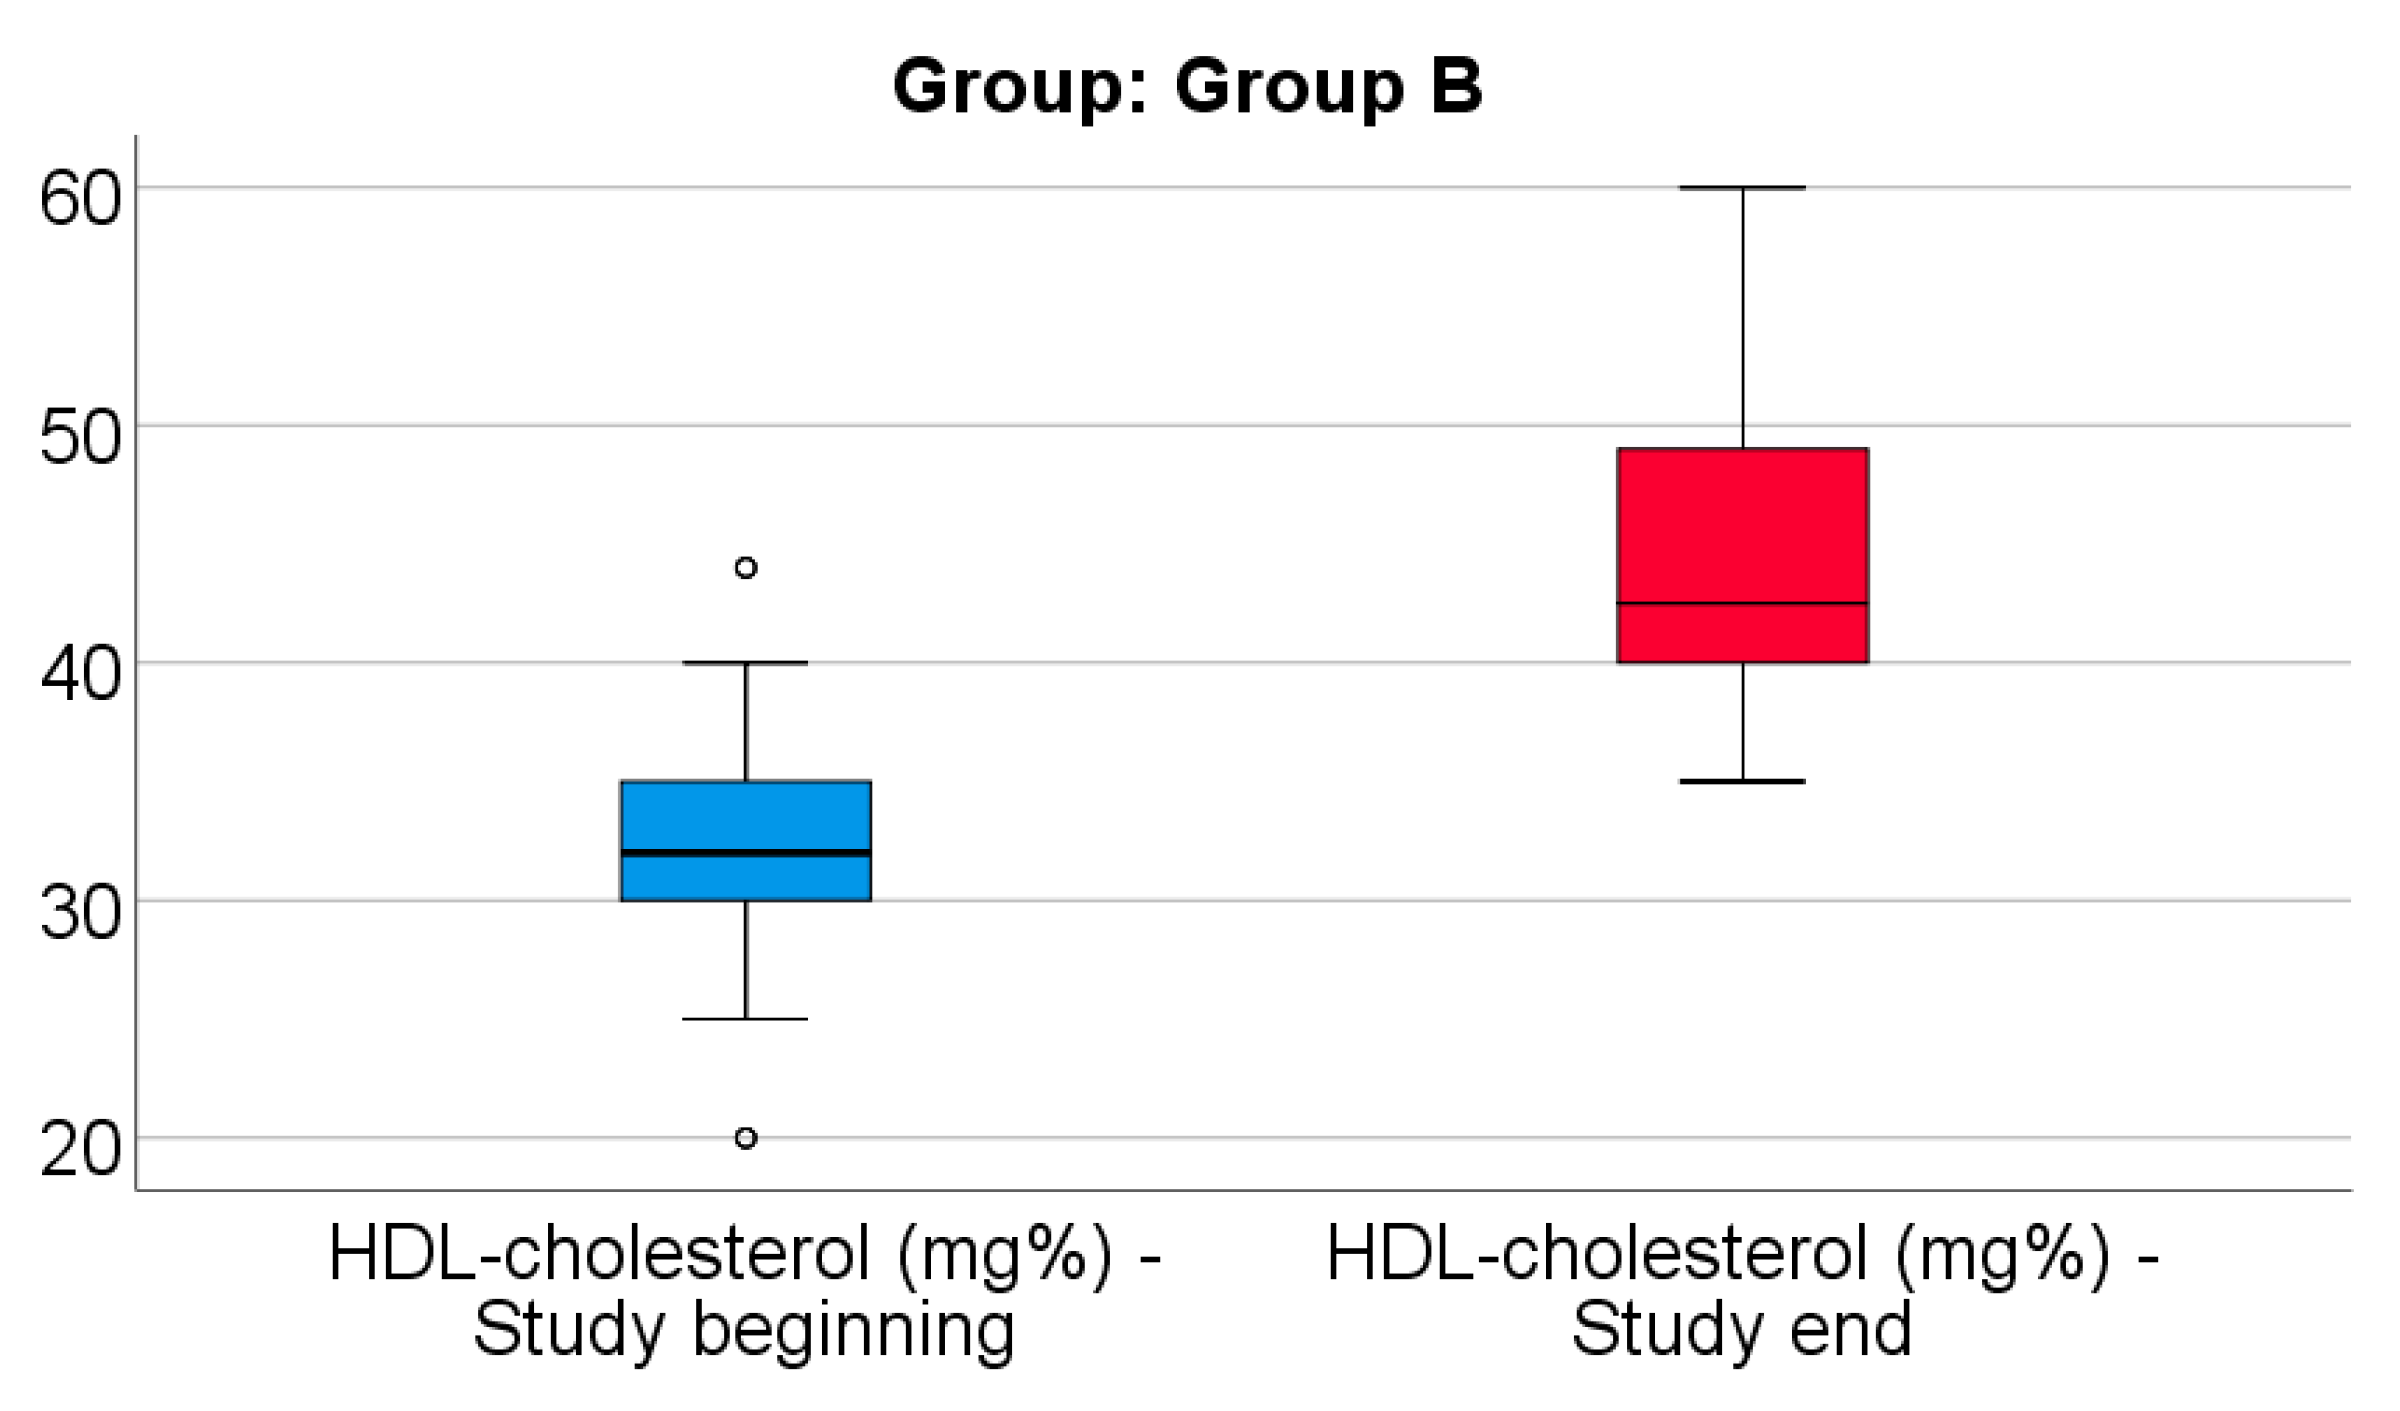
Figure 5 shows the comparison of HDL-cholesterol from the beginning to end of the study in patients from Group B. Distribution of HDL-cholesterol was non-parametric in both measurements
(p<0.05). Differences between the related measurements were statistically significant
(p<0.001), therefore HDL-cholesterol at the end of the study was significantly higher (median = 42.5, IQR= 40-49) in comparison to the value at the beginning of the study (median = 32, IQR = 30-35), the difference between the two measurements being significant (median difference = 12, IQR = 4.25-17 mg/dl and increase % reported for the HDL-cholesterol at the beginning of the study: median % increase: 38.18 %, IQR = 11.26-62.15).
Data from
Table 10 shows the comparison of HDL-cholesterol evolution between analyzed groups. Distribution of HDL-cholesterol difference was non-parametric in both groups
(p<0.05). Differences between groups were statistically significant
(p<0.001/ p<0.001) for both the absolute value of the HDL-cholesterol difference and the increase percentage reported for the HDL-cholesterol at the beginning of the study.
As such, patients in Group A had a significantly higher increase of HDL-cholesterol at the end of study from the beginning (median = 14.5 mg/dl, IQR = 11-21, % - median = 47.52, IQR = 35.3-73.3) in comparison to patients in Group B (median = 12 mg/dl, IQR = 4.25-17, % - median = 38.18, IQR = 11.26-62.15).
Data from
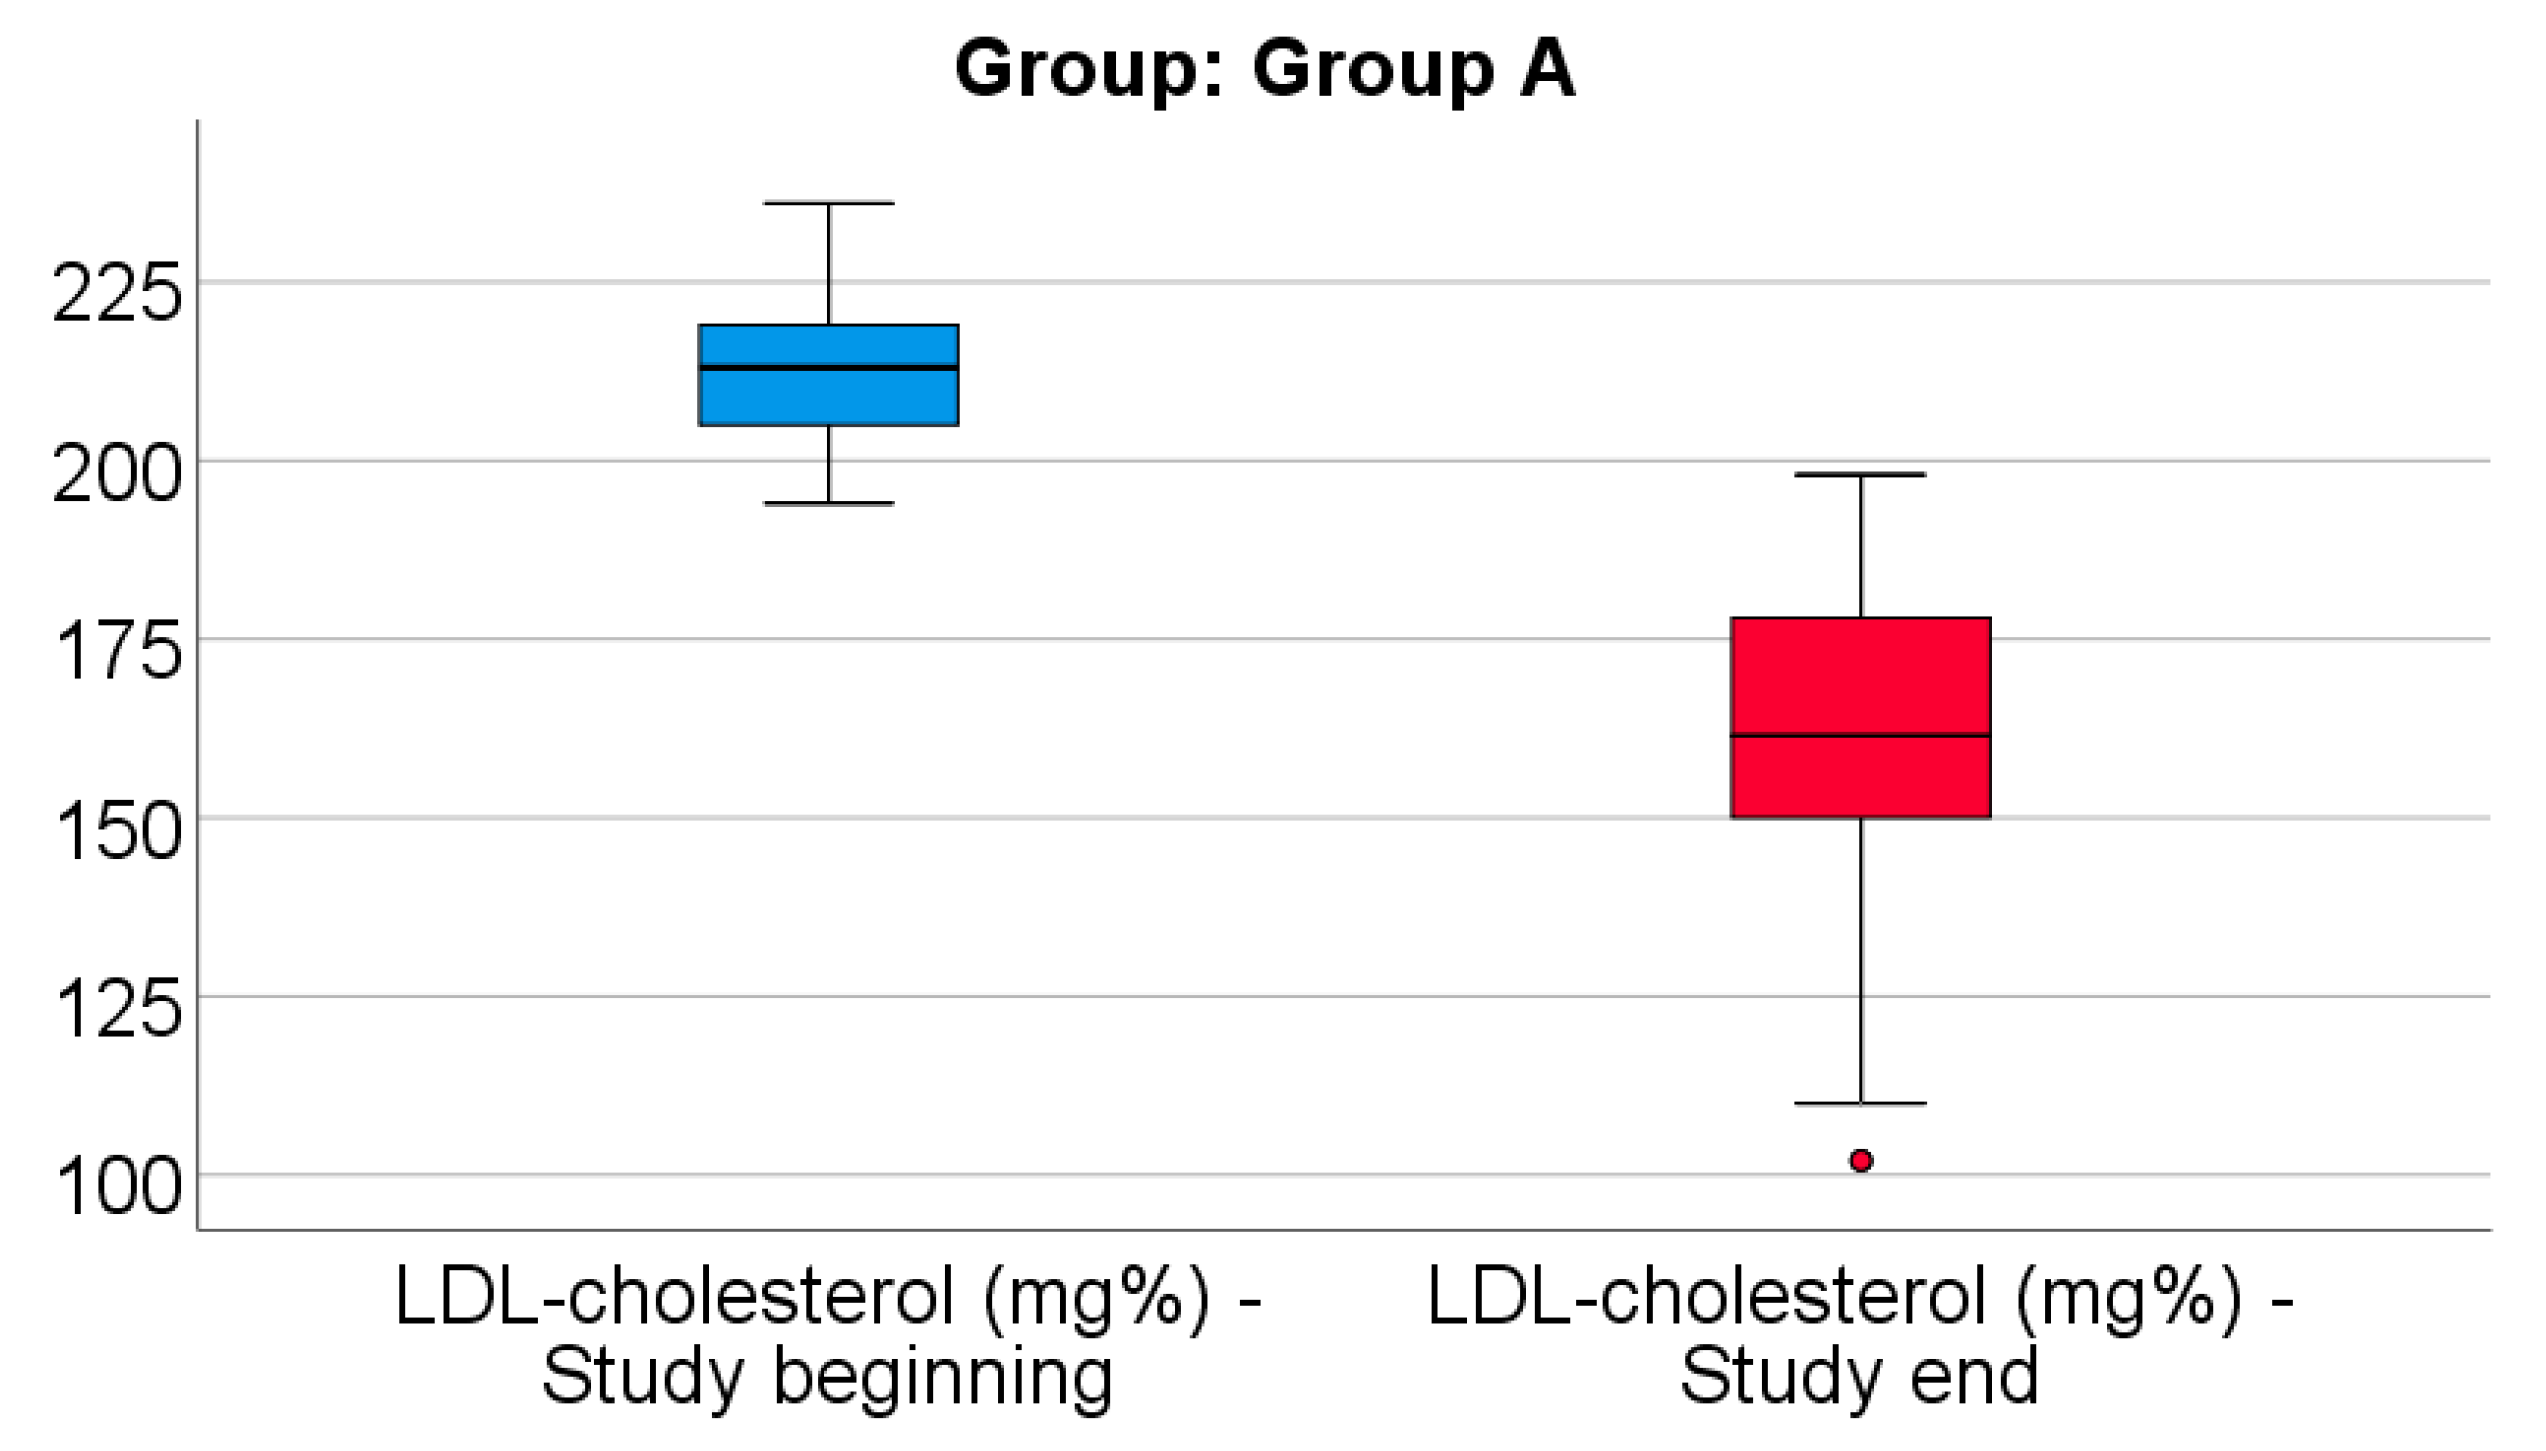
Figure 6 shows the comparison of LDL-cholesterol from the beginning to end of the study in patients from Group A. Distribution of LDL-cholesterol was non-parametric in both measurements
(p<0.05). Differences between the related measurements were statistically significant
(p<0.001), therefore LDL-cholesterol at the end of the study was significantly lower (median = 161.5, IQR= 150-178) in comparison to the value at the beginning of the study (median = 213, IQR = 205-219), the difference between the two measurements being significant (median difference = -46.5, IQR = -69 - -35 mg/dl and decrease % reported for the LDL-cholesterol at the beginning of the study: median % decrease: -22.3 %, IQR = -31.3 - -16.7).
Data from
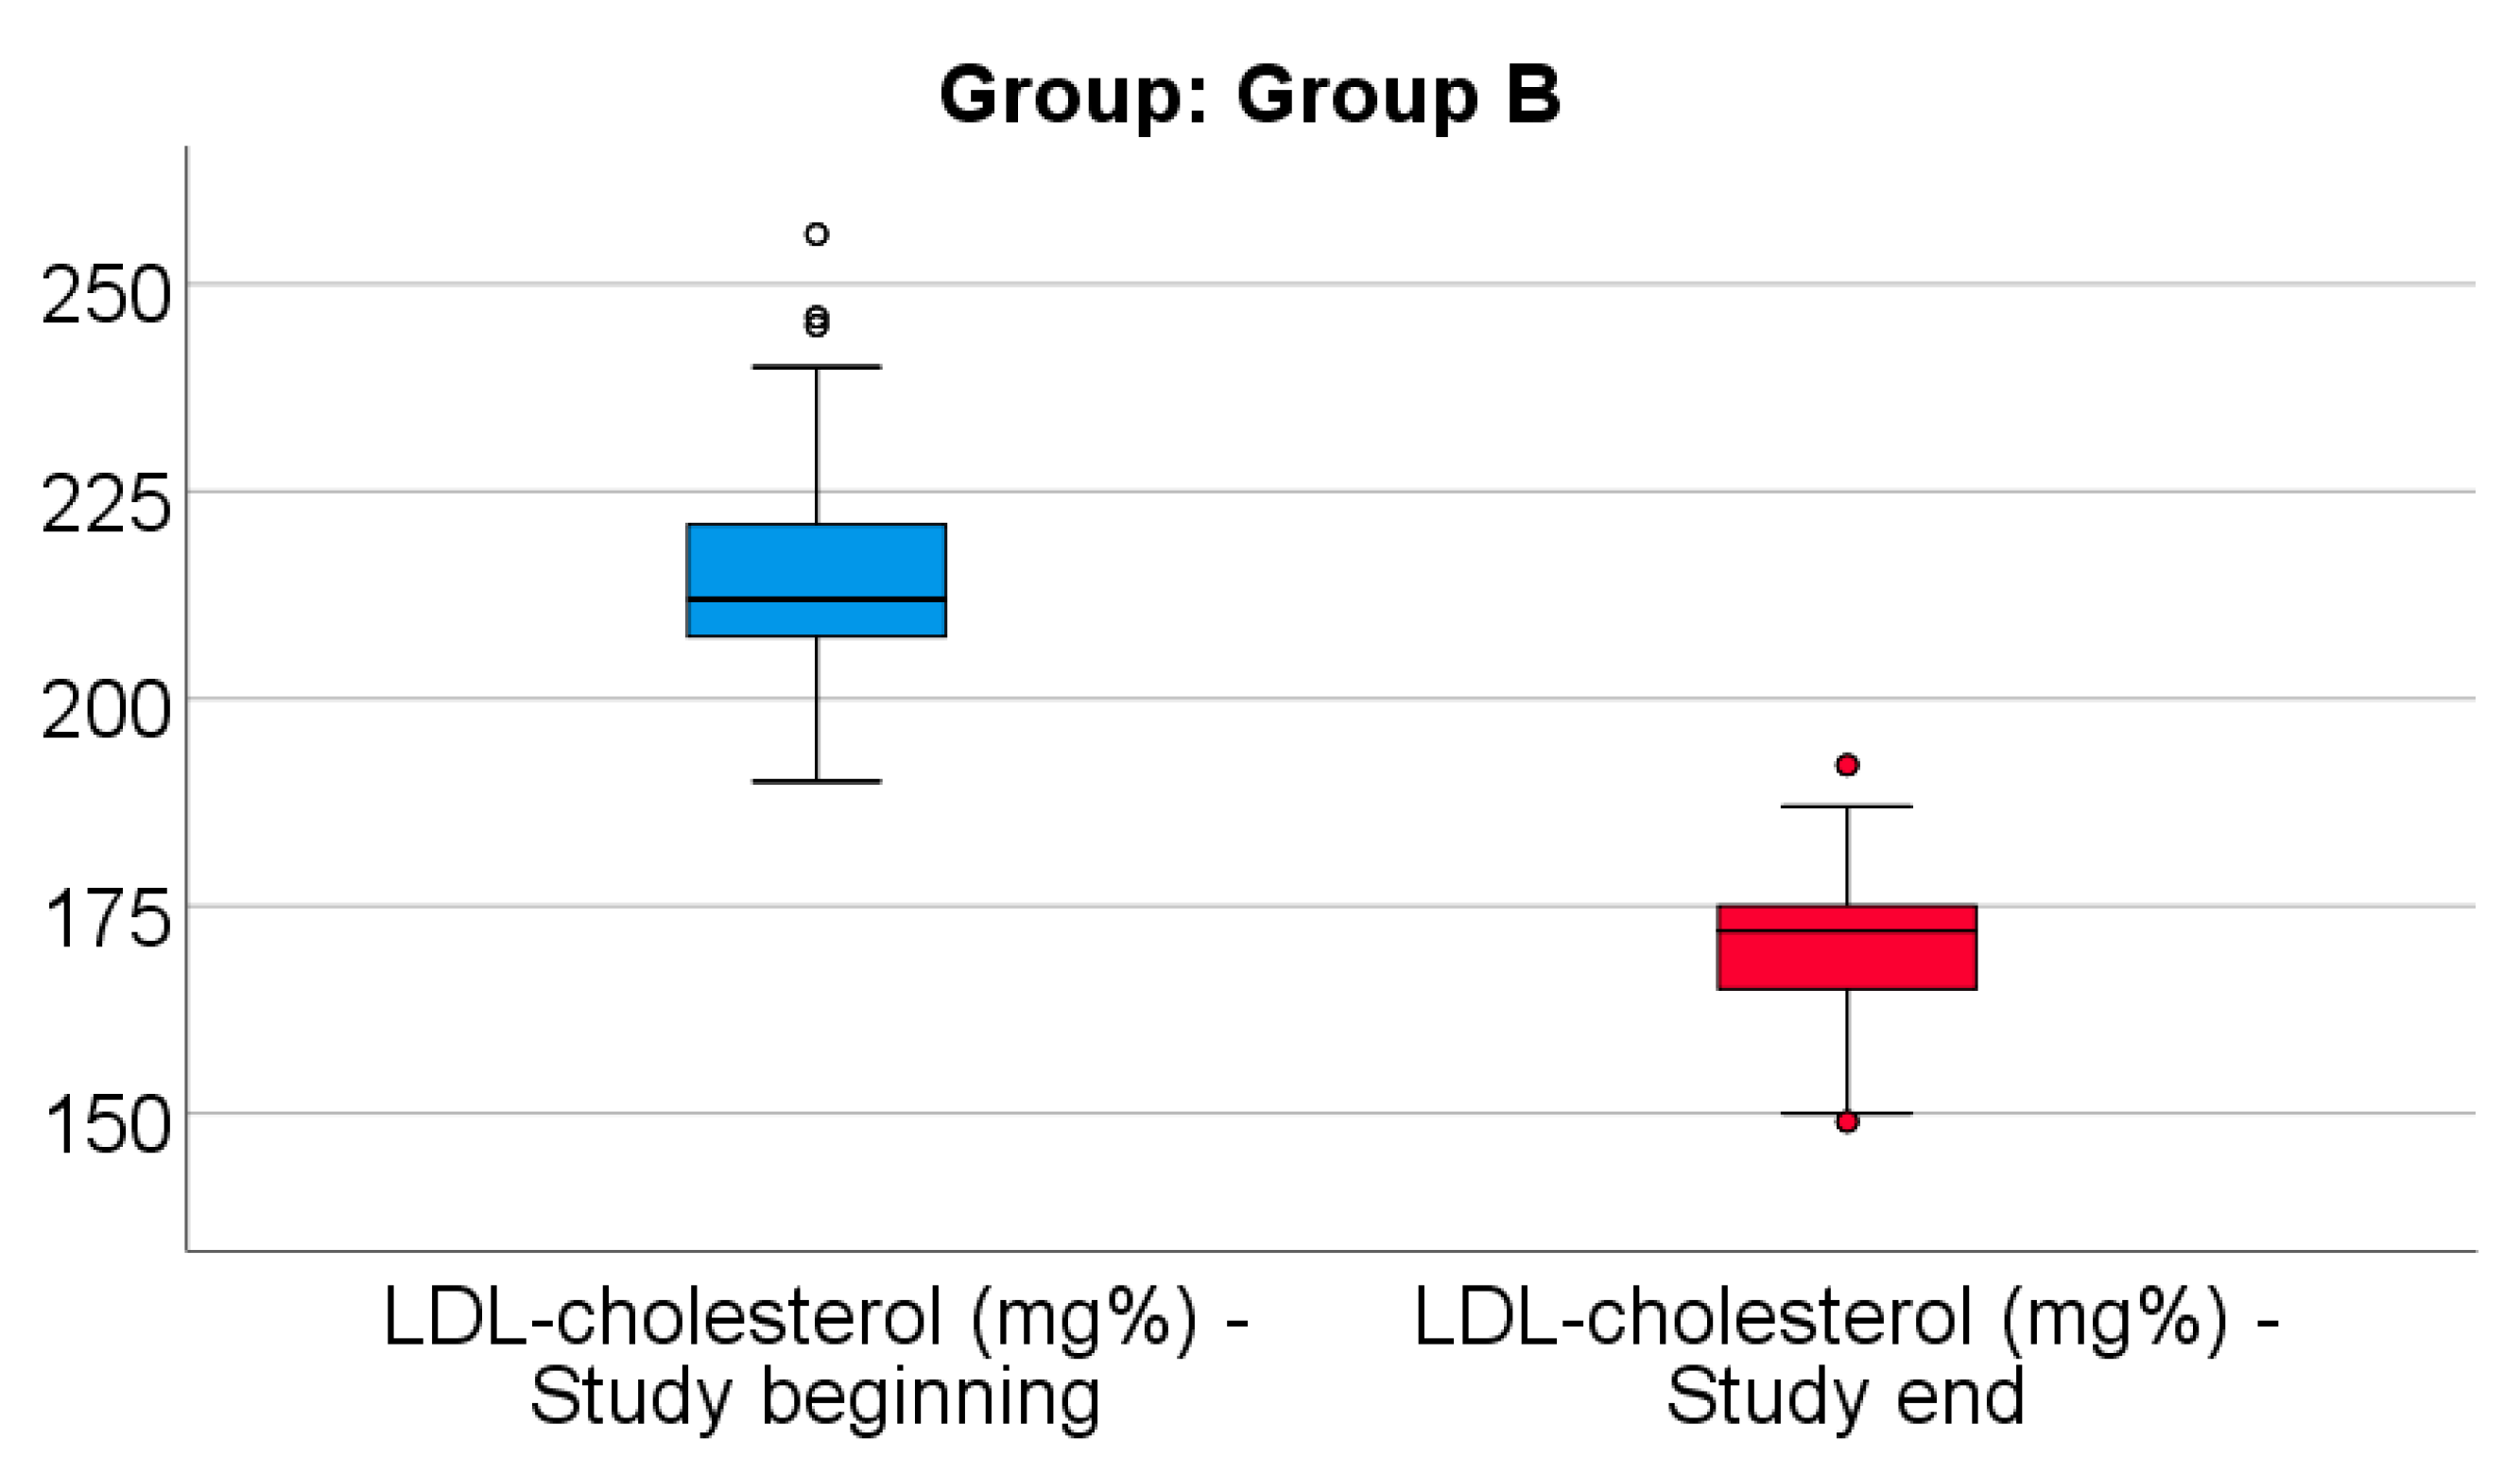
Figure 7 shows the comparison of LDL-cholesterol from the beginning to end of the study in patients from Group B. Distribution of LDL-cholesterol was non-parametric in both measurements
(p<0.05). Differences between the related measurements were statistically significant
(p<0.001), therefore LDL-cholesterol at the end of the study was significantly lower (median = 172, IQR= 165-175) in comparison to the value at the beginning of the study (median = 212, IQR = 206.75-221), the difference between the two measurements being significant (median difference = -41, IQR = -59.5 - -33 mg/dl and decrease % reported for the LDL-cholesterol at the beginning of the study: median % decrease: -19.2 %, IQR = -25.9 - -15.6).
Data from
Table 11 shows the comparison of LDL-cholesterol evolution between analyzed groups. Distribution of LDL-cholesterol difference was non-parametric in both groups
(p<0.05). Differences between groups were statistically significant
(p=0.024/ p=0.008) for both the absolute value of the LDL-cholesterol difference and the decrease percentage reported for the LDL-cholesterol at the beginning of the study.
As such, patients in Group A had a significantly higher decrease of LDL-cholesterol at the end of study from the beginning (median = -46.5 mg/dl, IQR = -69 - -35, % - median = -22.3, IQR = -31.3 - -16.6) in comparison to patients in Group B (median = -41 mg/dl, IQR = -59.5 - -33, % - median = -19.2, IQR = -25.9 - -15.6).
Data from
Table 12 shows the comparison of triglycerides from the beginning to end of the study in patients from Group A. Distribution of triglycerides was non-parametric in both measurements
(p<0.05). Differences between the related measurements were statistically significant (
p<0.001), therefore triglycerides at the end of the study were significantly lower (median = 184.5, IQR= 180-188) in comparison to the value at the beginning of the study (median = 285.5, IQR = 282-294), the difference between the two measurements being significant (median difference = -103, IQR = -110 - -97 mg/dl and decrease % reported for the triglycerides at the beginning of the study: median % decrease: -35.78 %, IQR = -37.58 - -34.6).
Data from
Table 13 shows the comparison of triglycerides from the beginning to end of the study in patients from Group B. Distribution of triglycerides was non-parametric in both measurements
(p<0.05). Differences between the related measurements were statistically significant
(p<0.001), therefore triglycerides at the end of the study were significantly lower (median = 213.5, IQR= 210-221) in comparison to the value at the beginning of the study (median = 305, IQR = 301.25-310), the difference between the two measurements being significant (median difference = -91.5, IQR = -99.5 - -84.25 mg/dl and decrease % reported for the triglycerides at the beginning of the study: median % decrease: -30 %, IQR = -31.82 - -27.78).
Data from
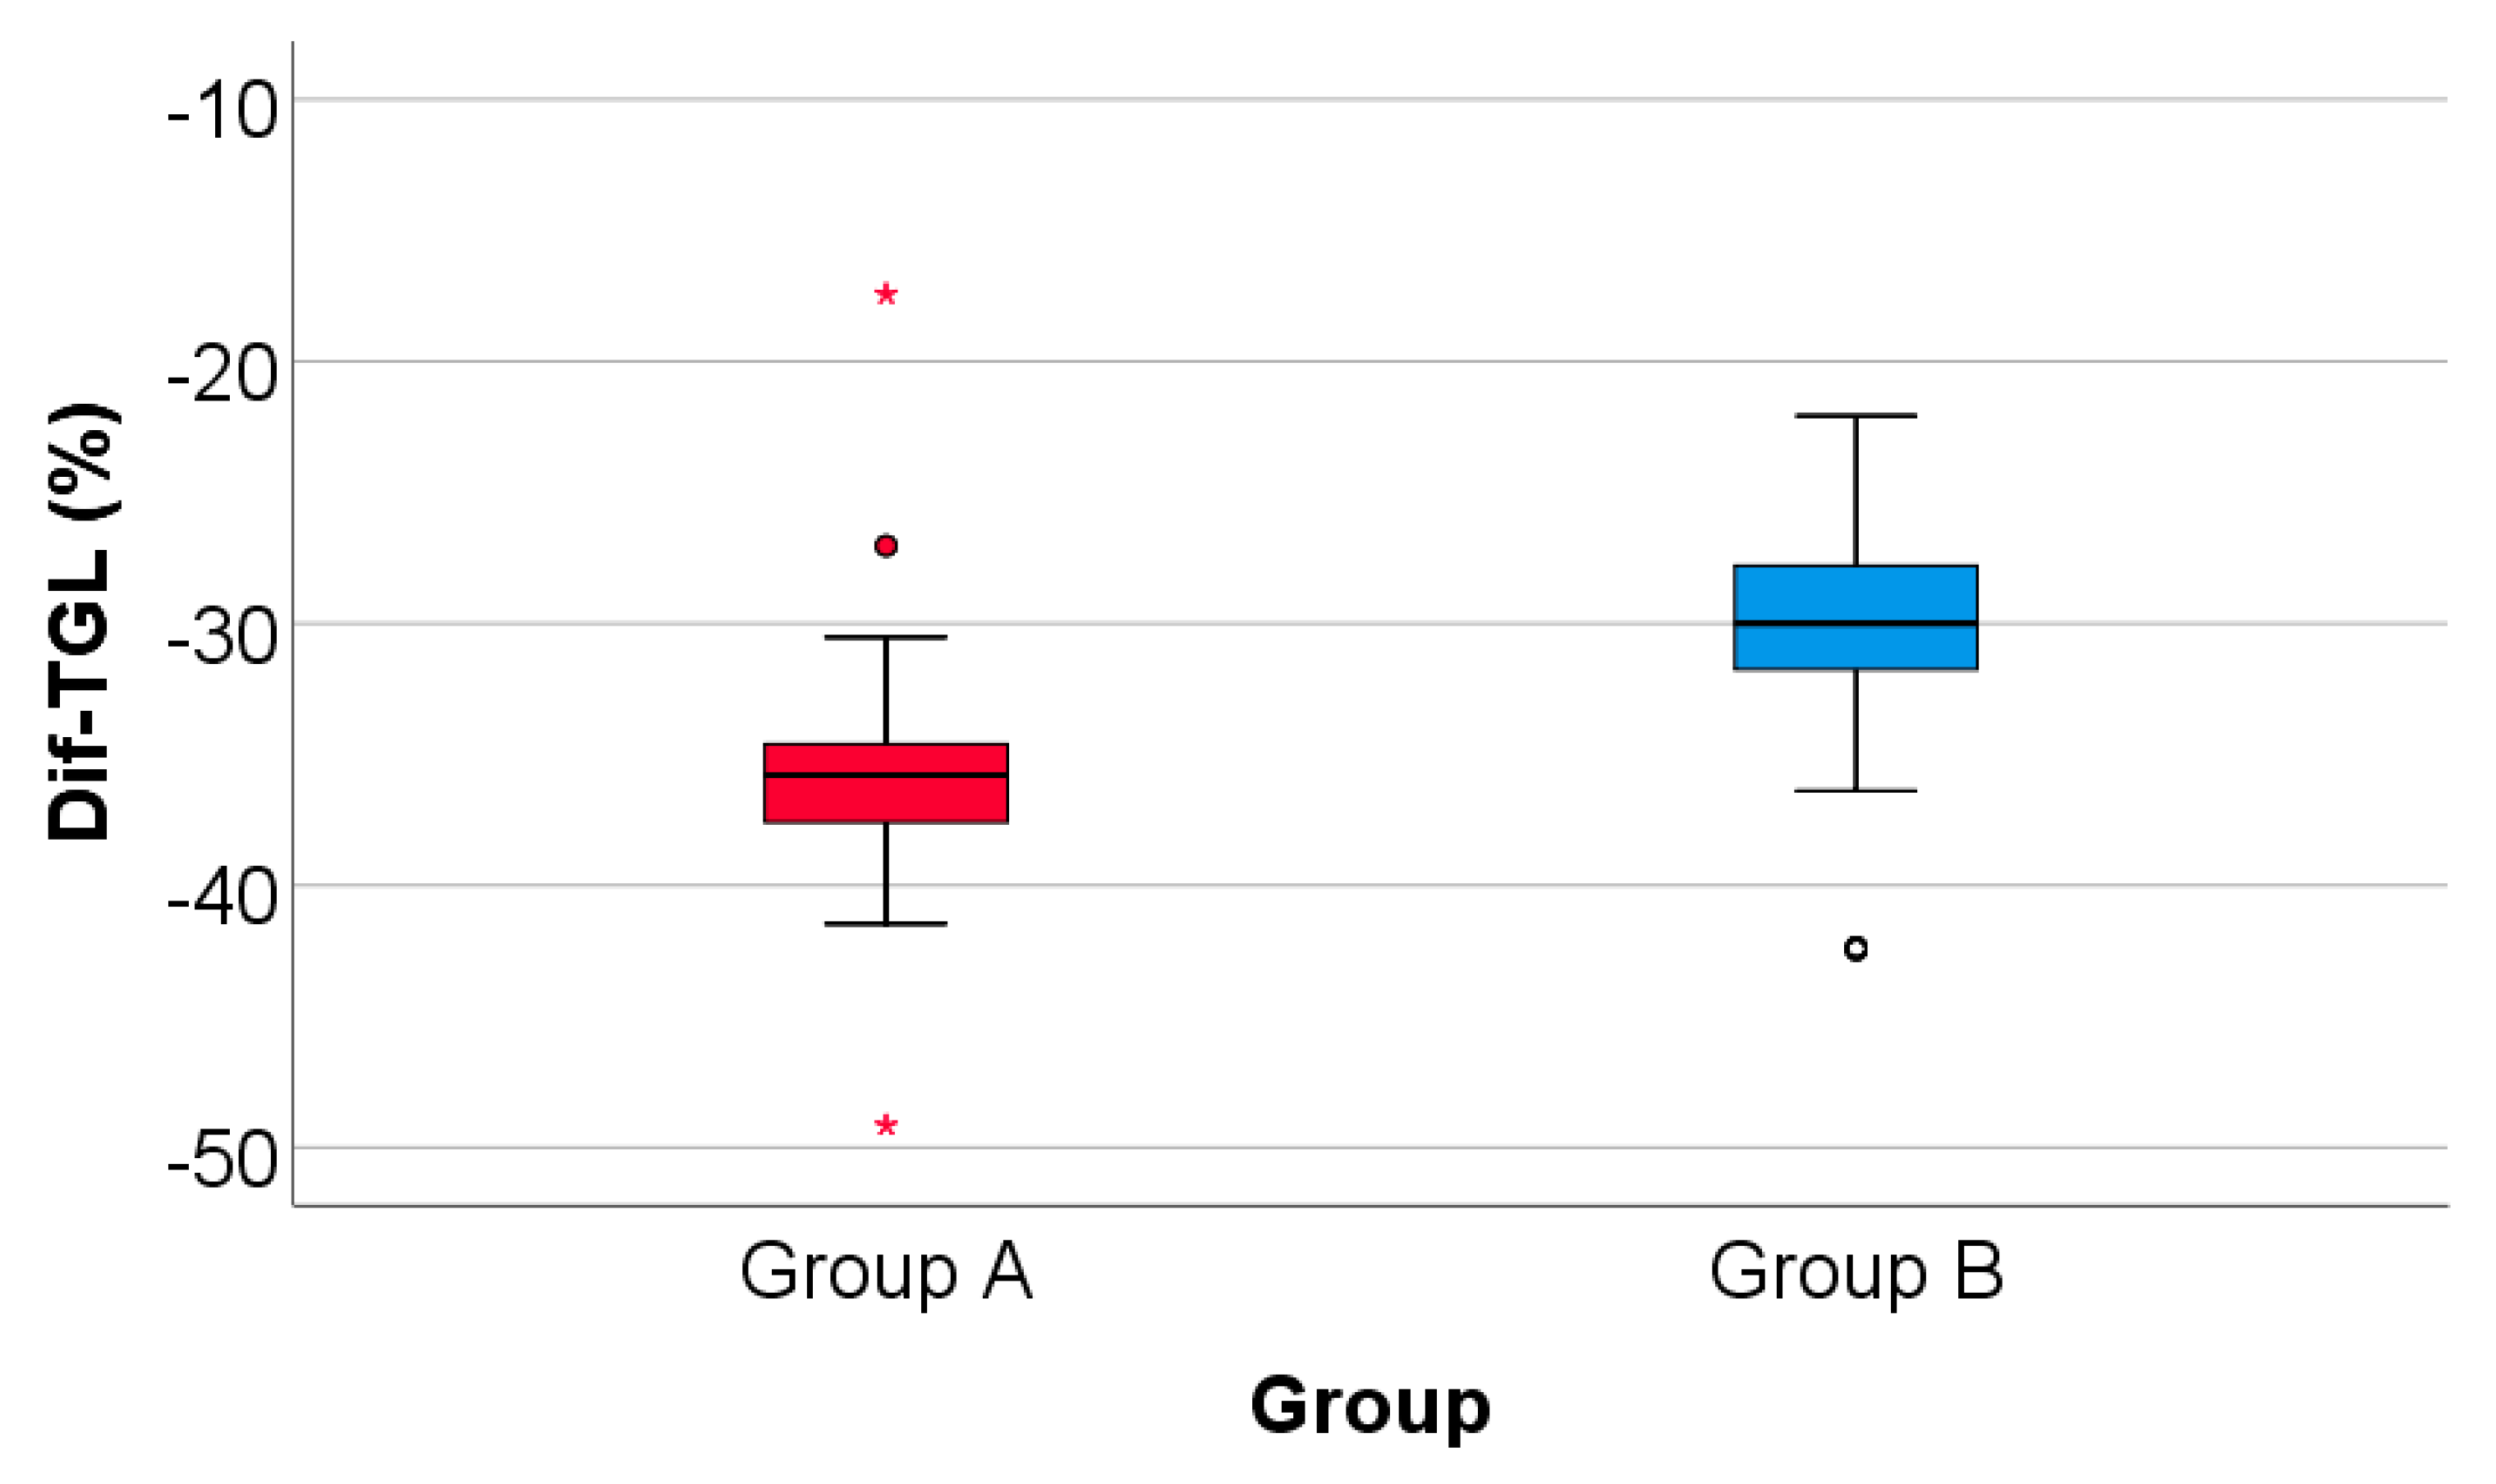
Figure 8 shows the comparison of triglycerides evolution between analyzed groups. Distribution of triglycerides difference was non-parametric in both groups
(p<0.05). Differences between groups were statistically significant
(p<0.001/ p<0.001) for both the absolute value of the triglycerides difference and the decrease percentage reported for the triglycerides at the beginning of the study.
Patients in Group A had a significantly higher decrease of triglycerides at the end of study from the beginning (median = -103 mg/dl, IQR = -110 - -97, % - median = -35.78, IQR = -37.58 - -34.6) in comparison to patients in Group B (median = -91.5 mg/dl, IQR = -99.5 - -84.25, % - median = -30, IQR = -31.82 - -27.7).
Data from
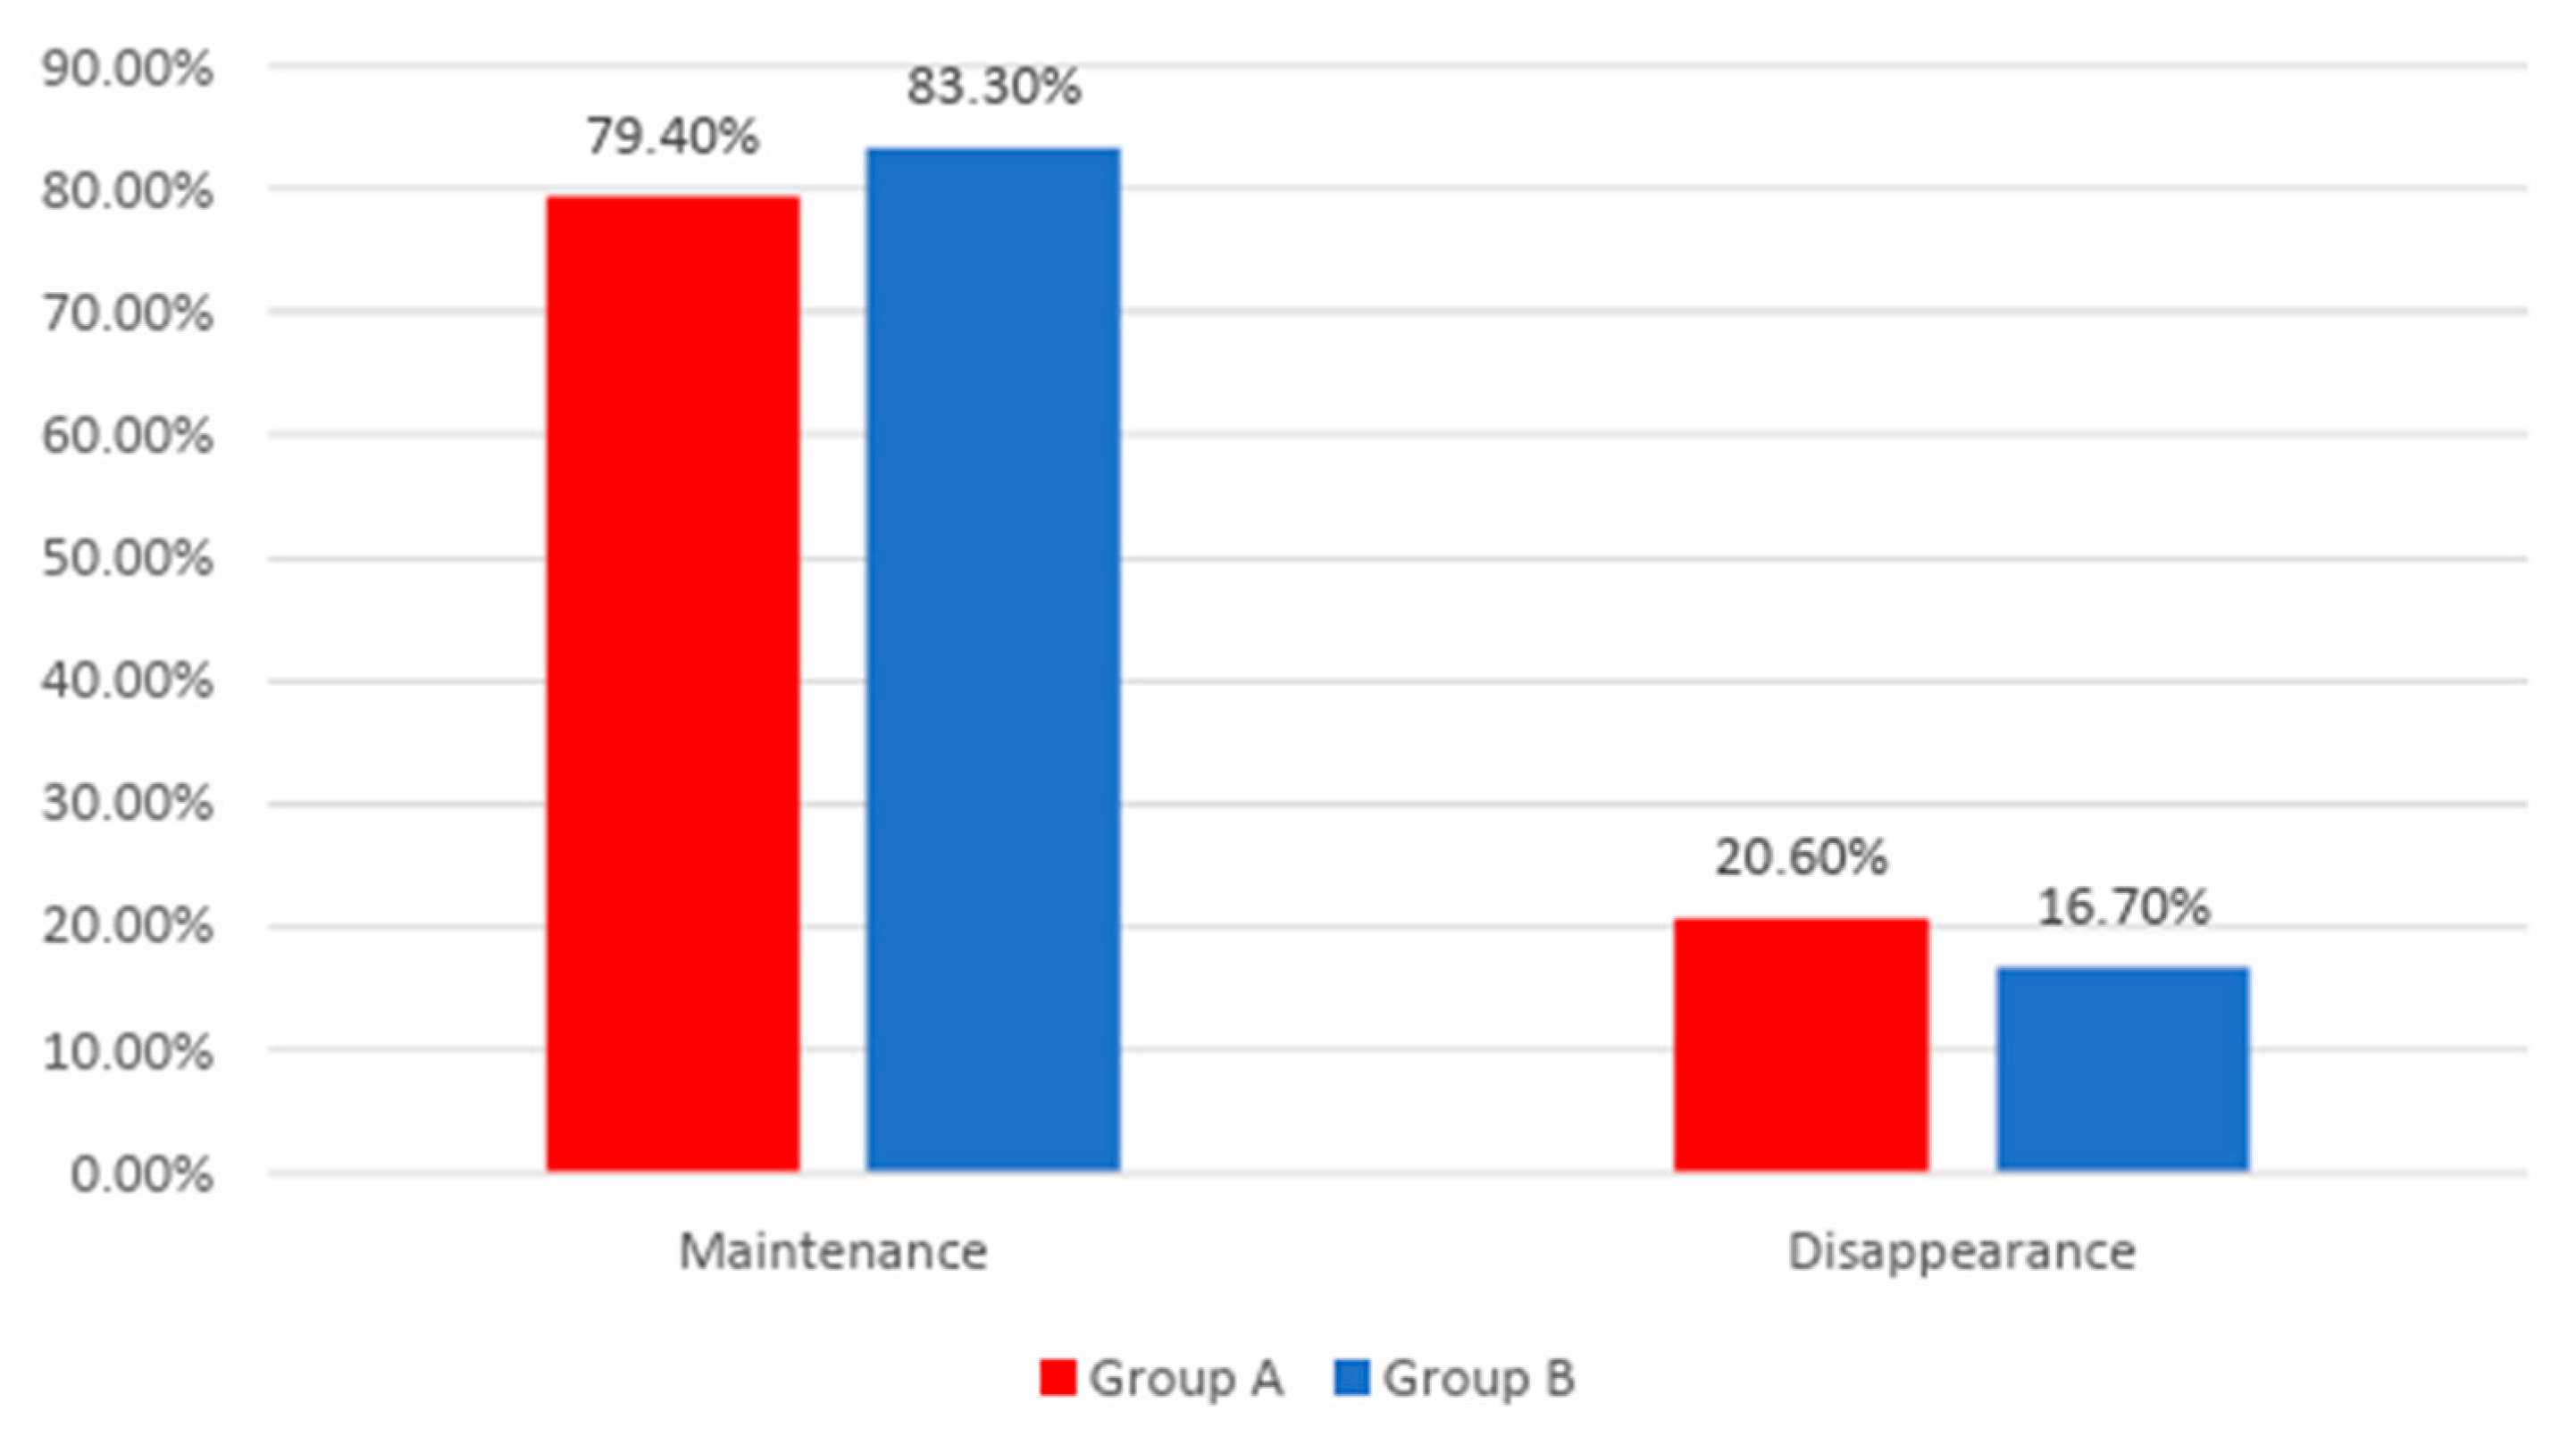
Figure 9 shows the distribution of the patients according to analyzed groups and evolution of angina. Differences between groups were not statistically significant
(p=0.483) therefore, although in an important proportion of the patients, angina disappeared at the end of the study, the frequency of the angina disappearance was not significantly different between analyzed groups.
Data from
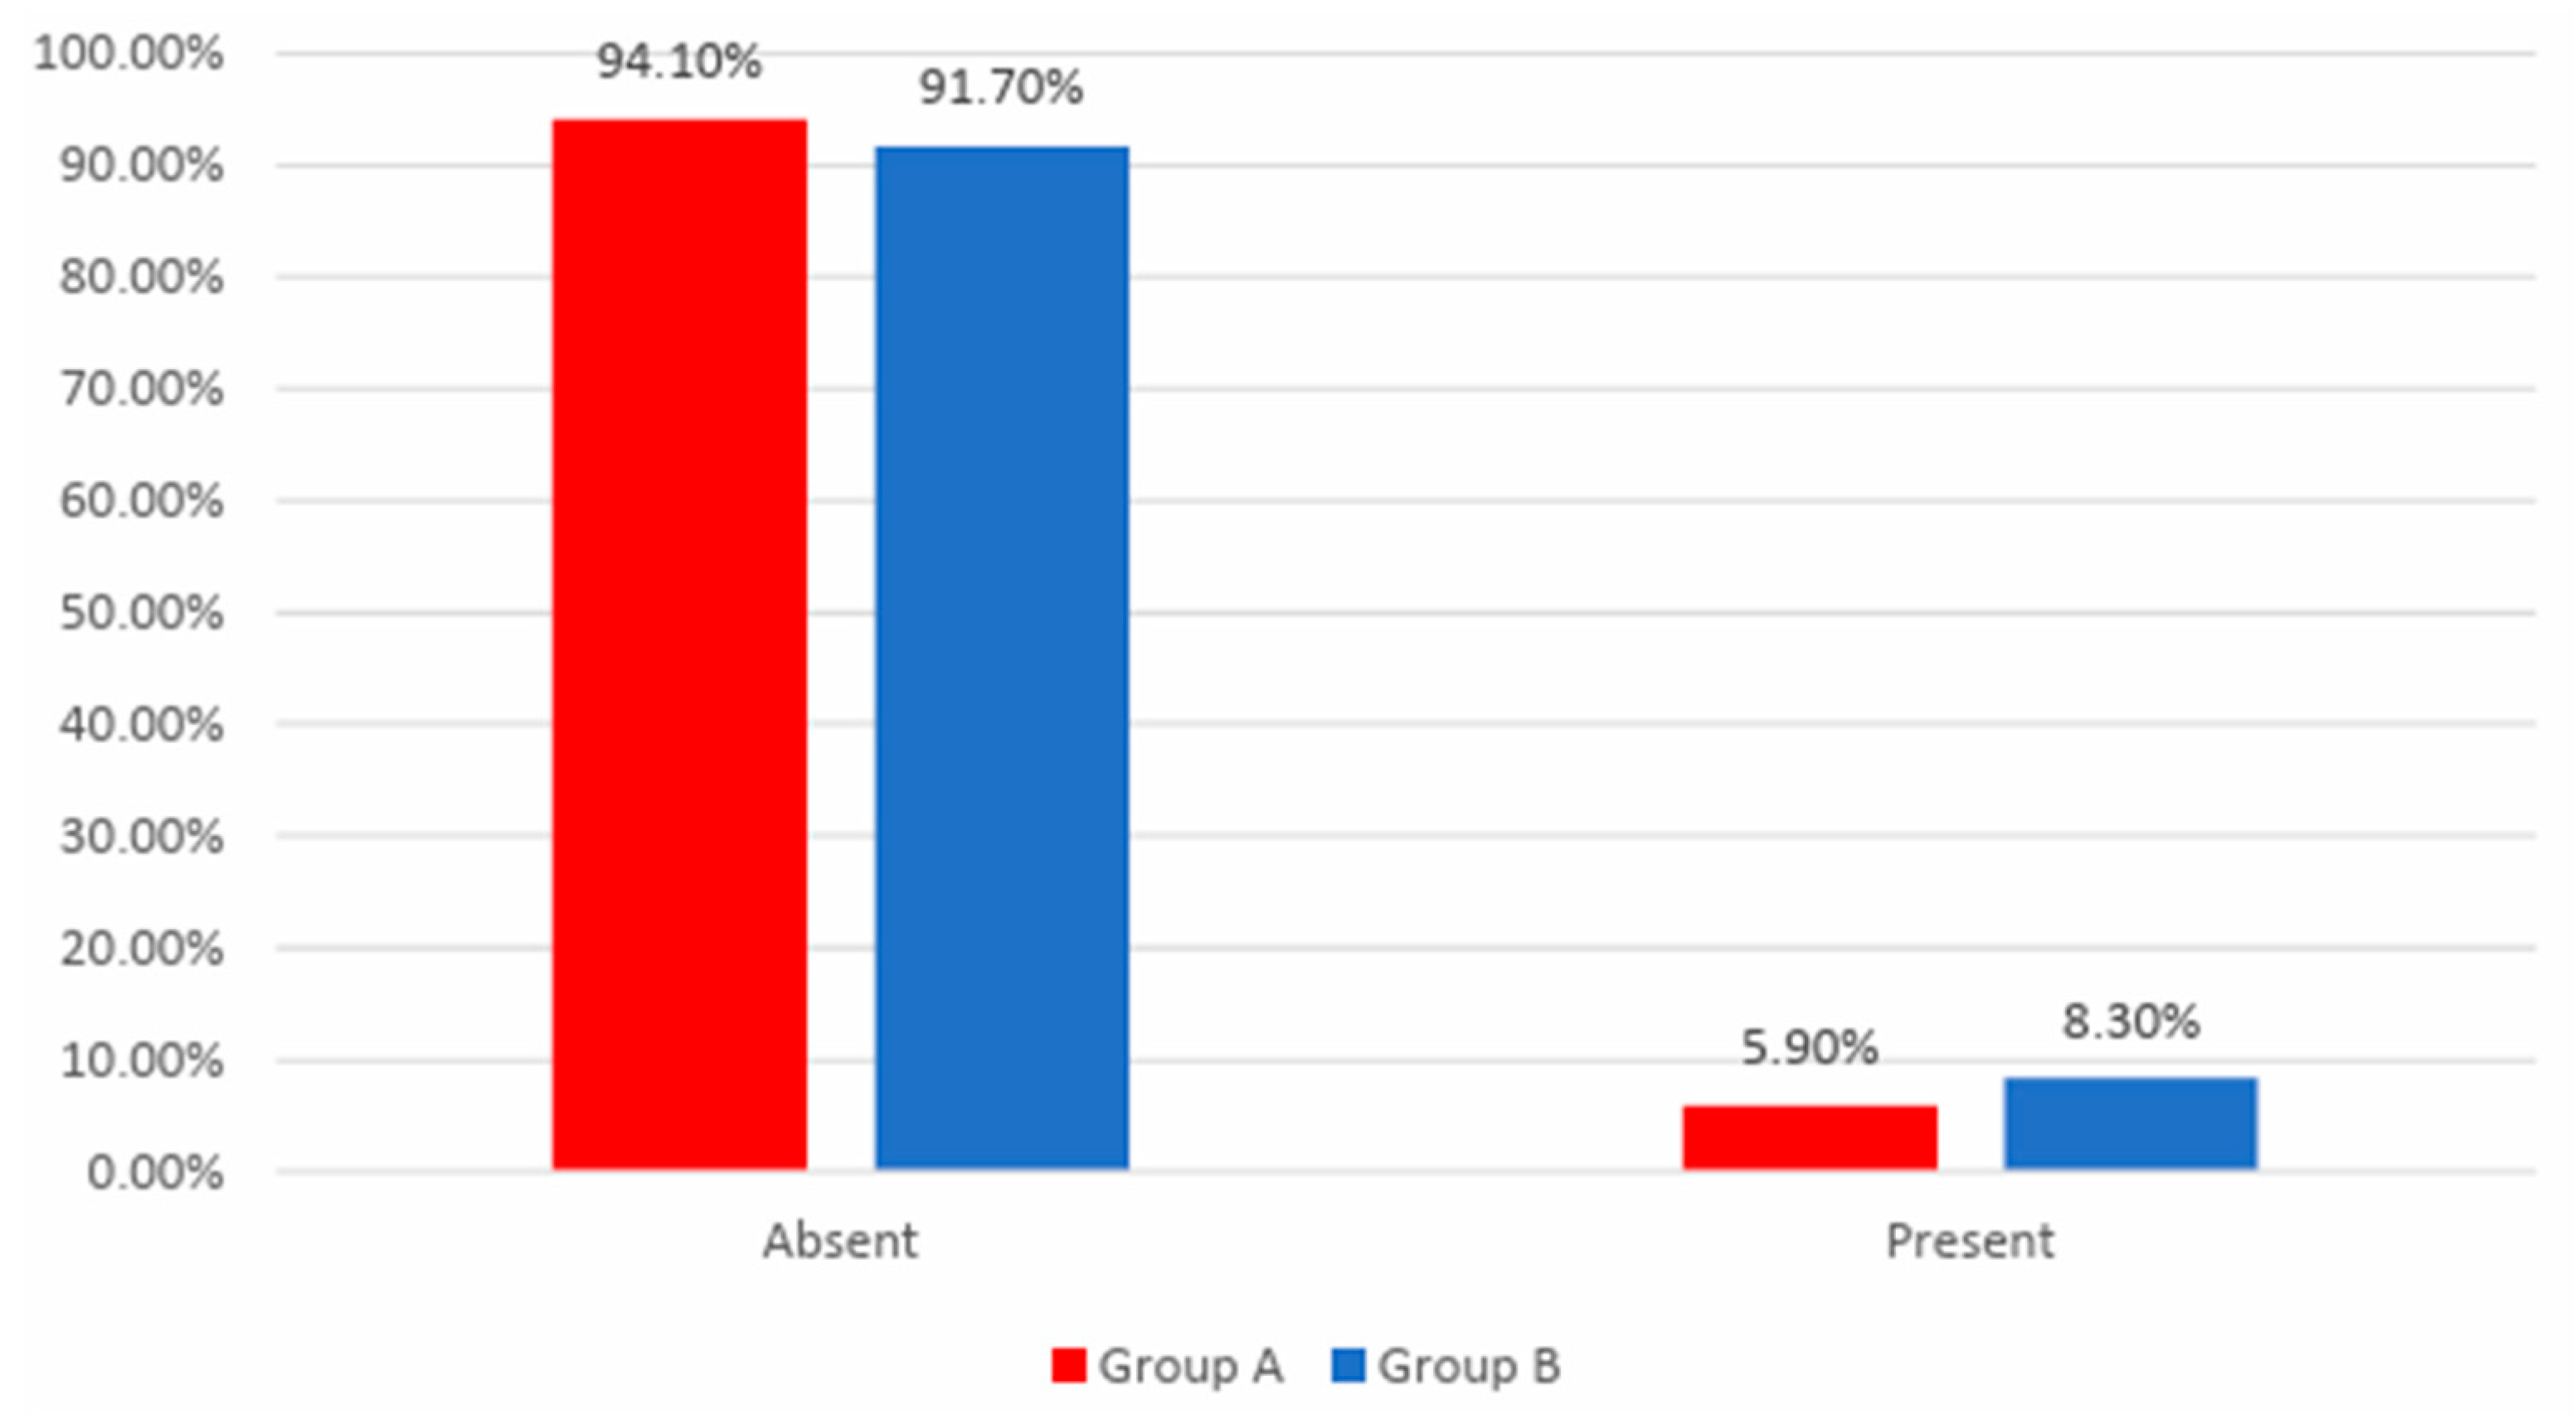
Figure 10 shows the distribution of the patients according to analyzed groups and AMI recurrence. Differences between groups were not statistically significant
(p=0.596), as such, frequencies of AMI recurrence between the analyzed groups were not statistically significant in this study.
Data from
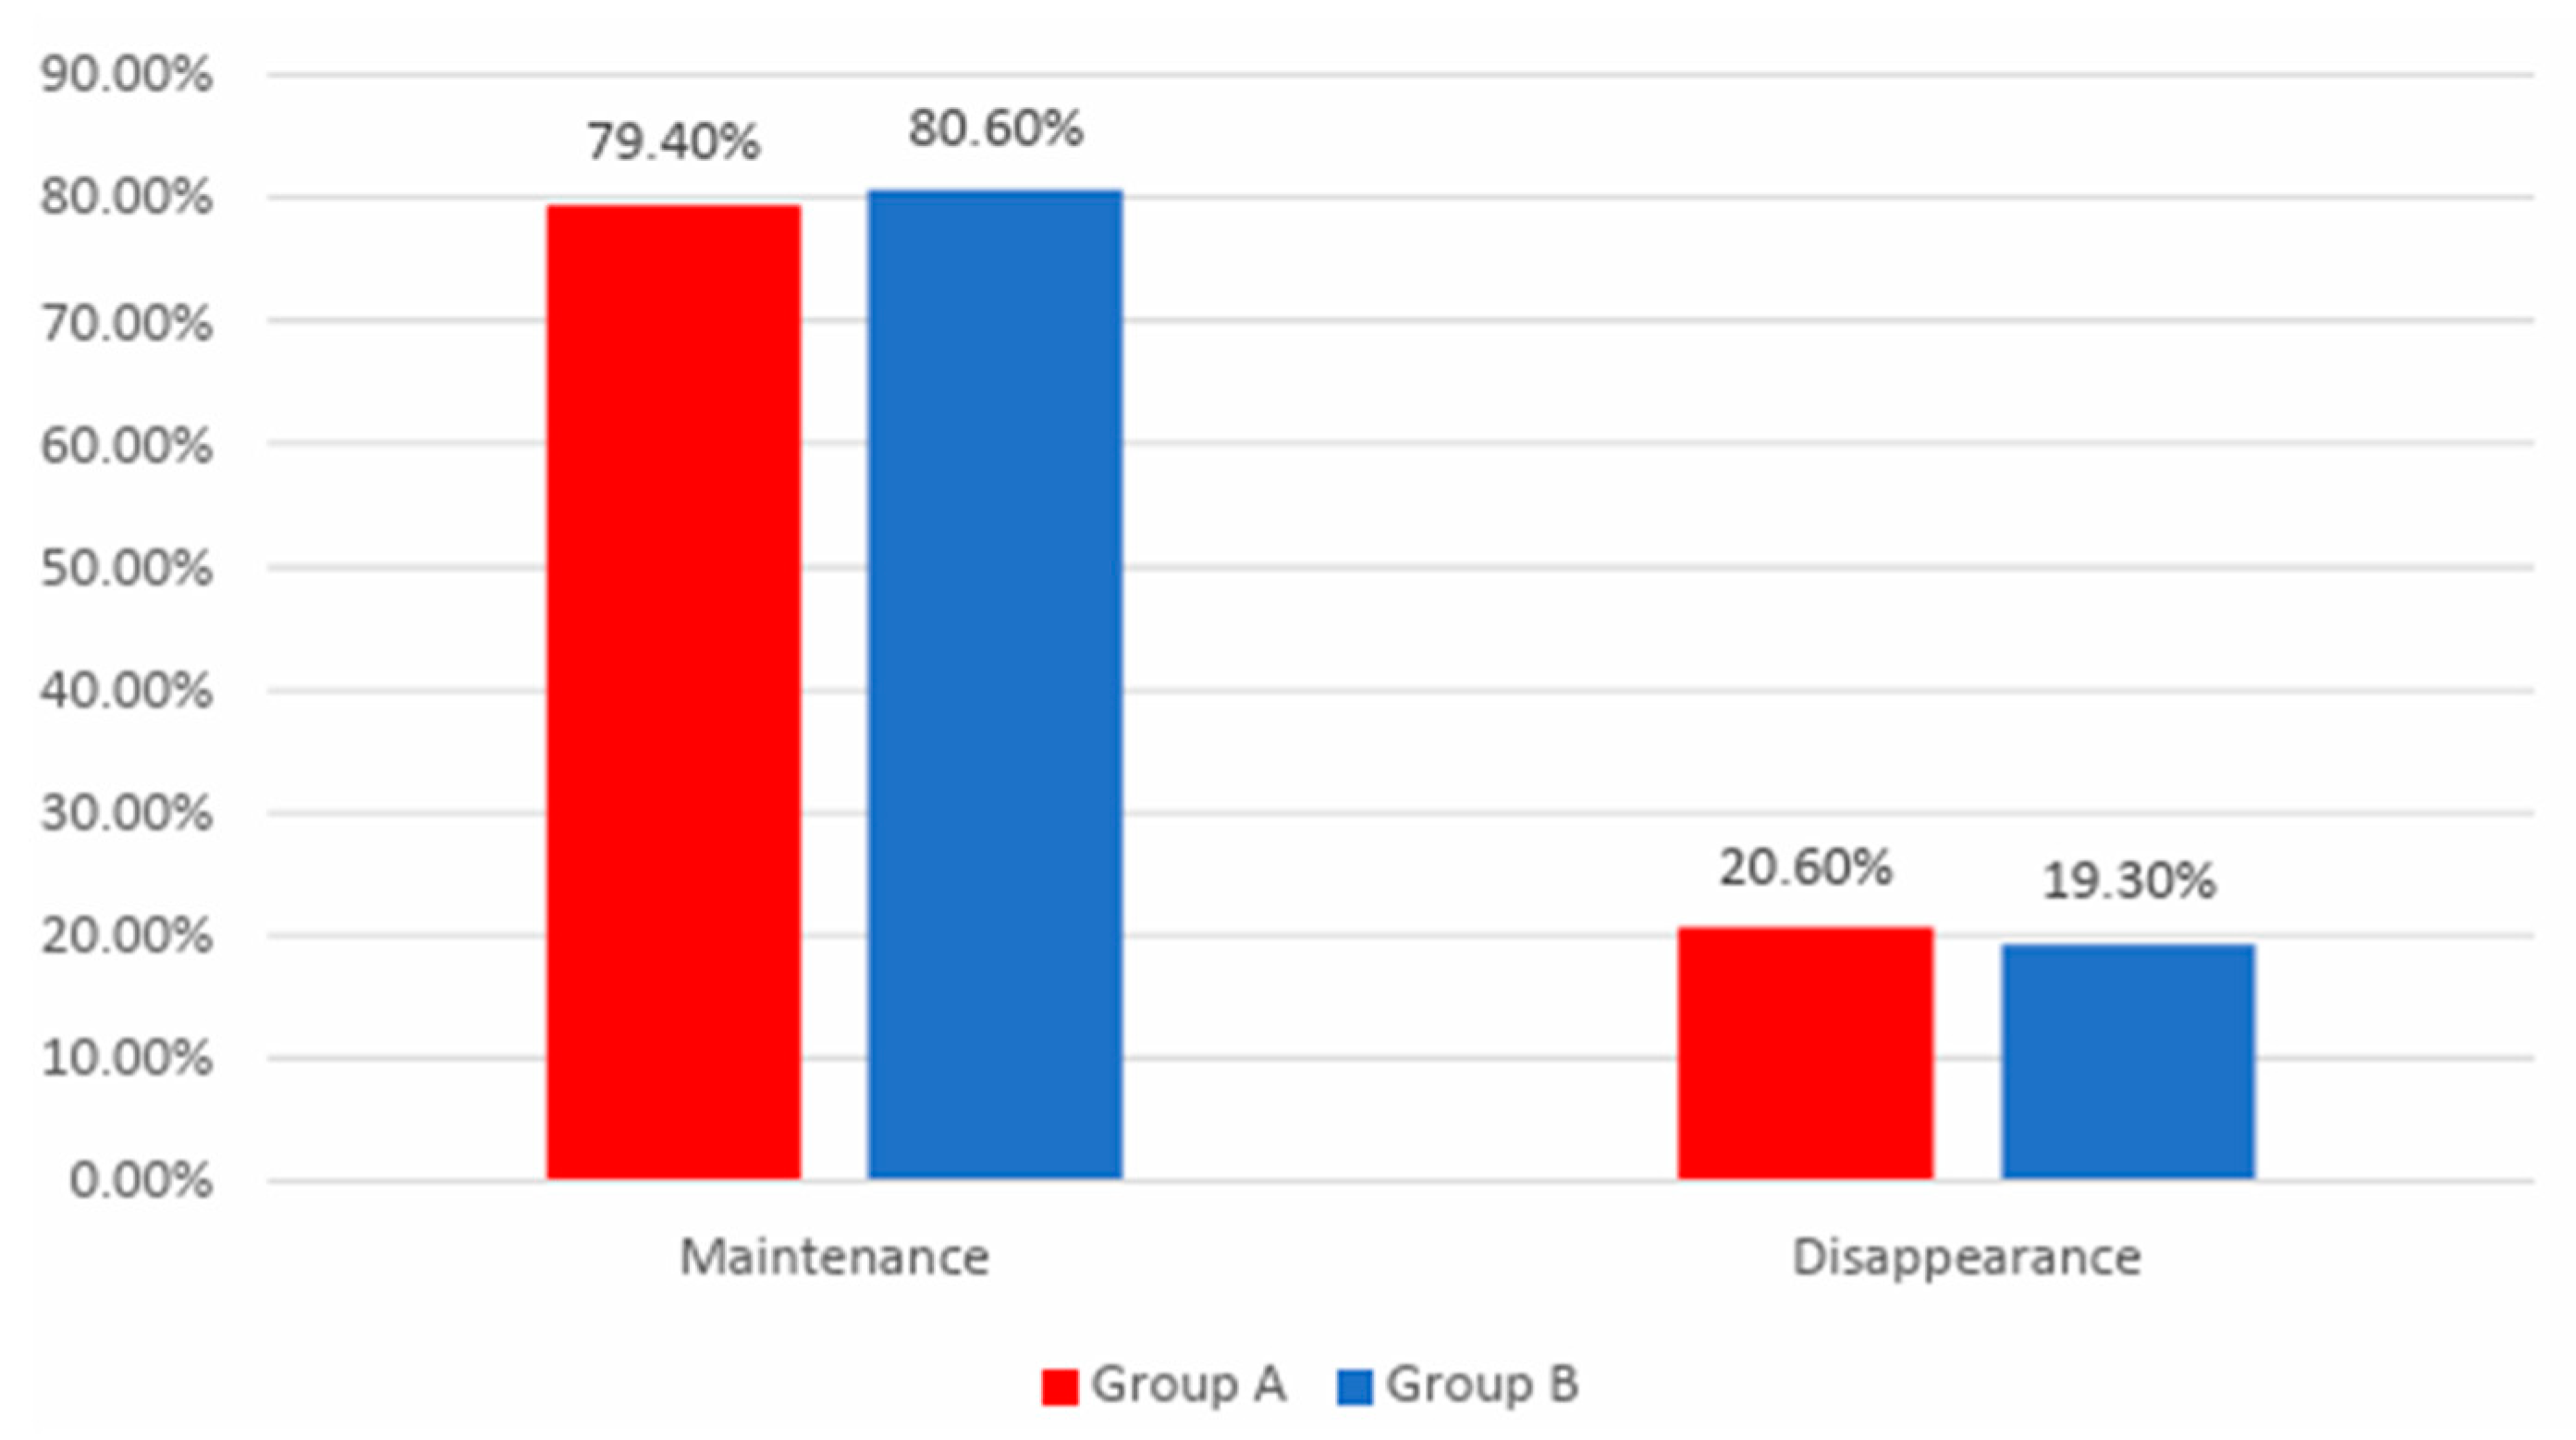
Figure 11 shows the distribution of the patients according to analyzed groups and evolution of arrythmias. Differences between groups were not statistically significant
(p=0.864) therefore, although in an important proportion of the patients, arrythmias disappeared at the end of the study, the frequency of the arrythmias disappearance was not significantly different between analyzed groups.
Data from
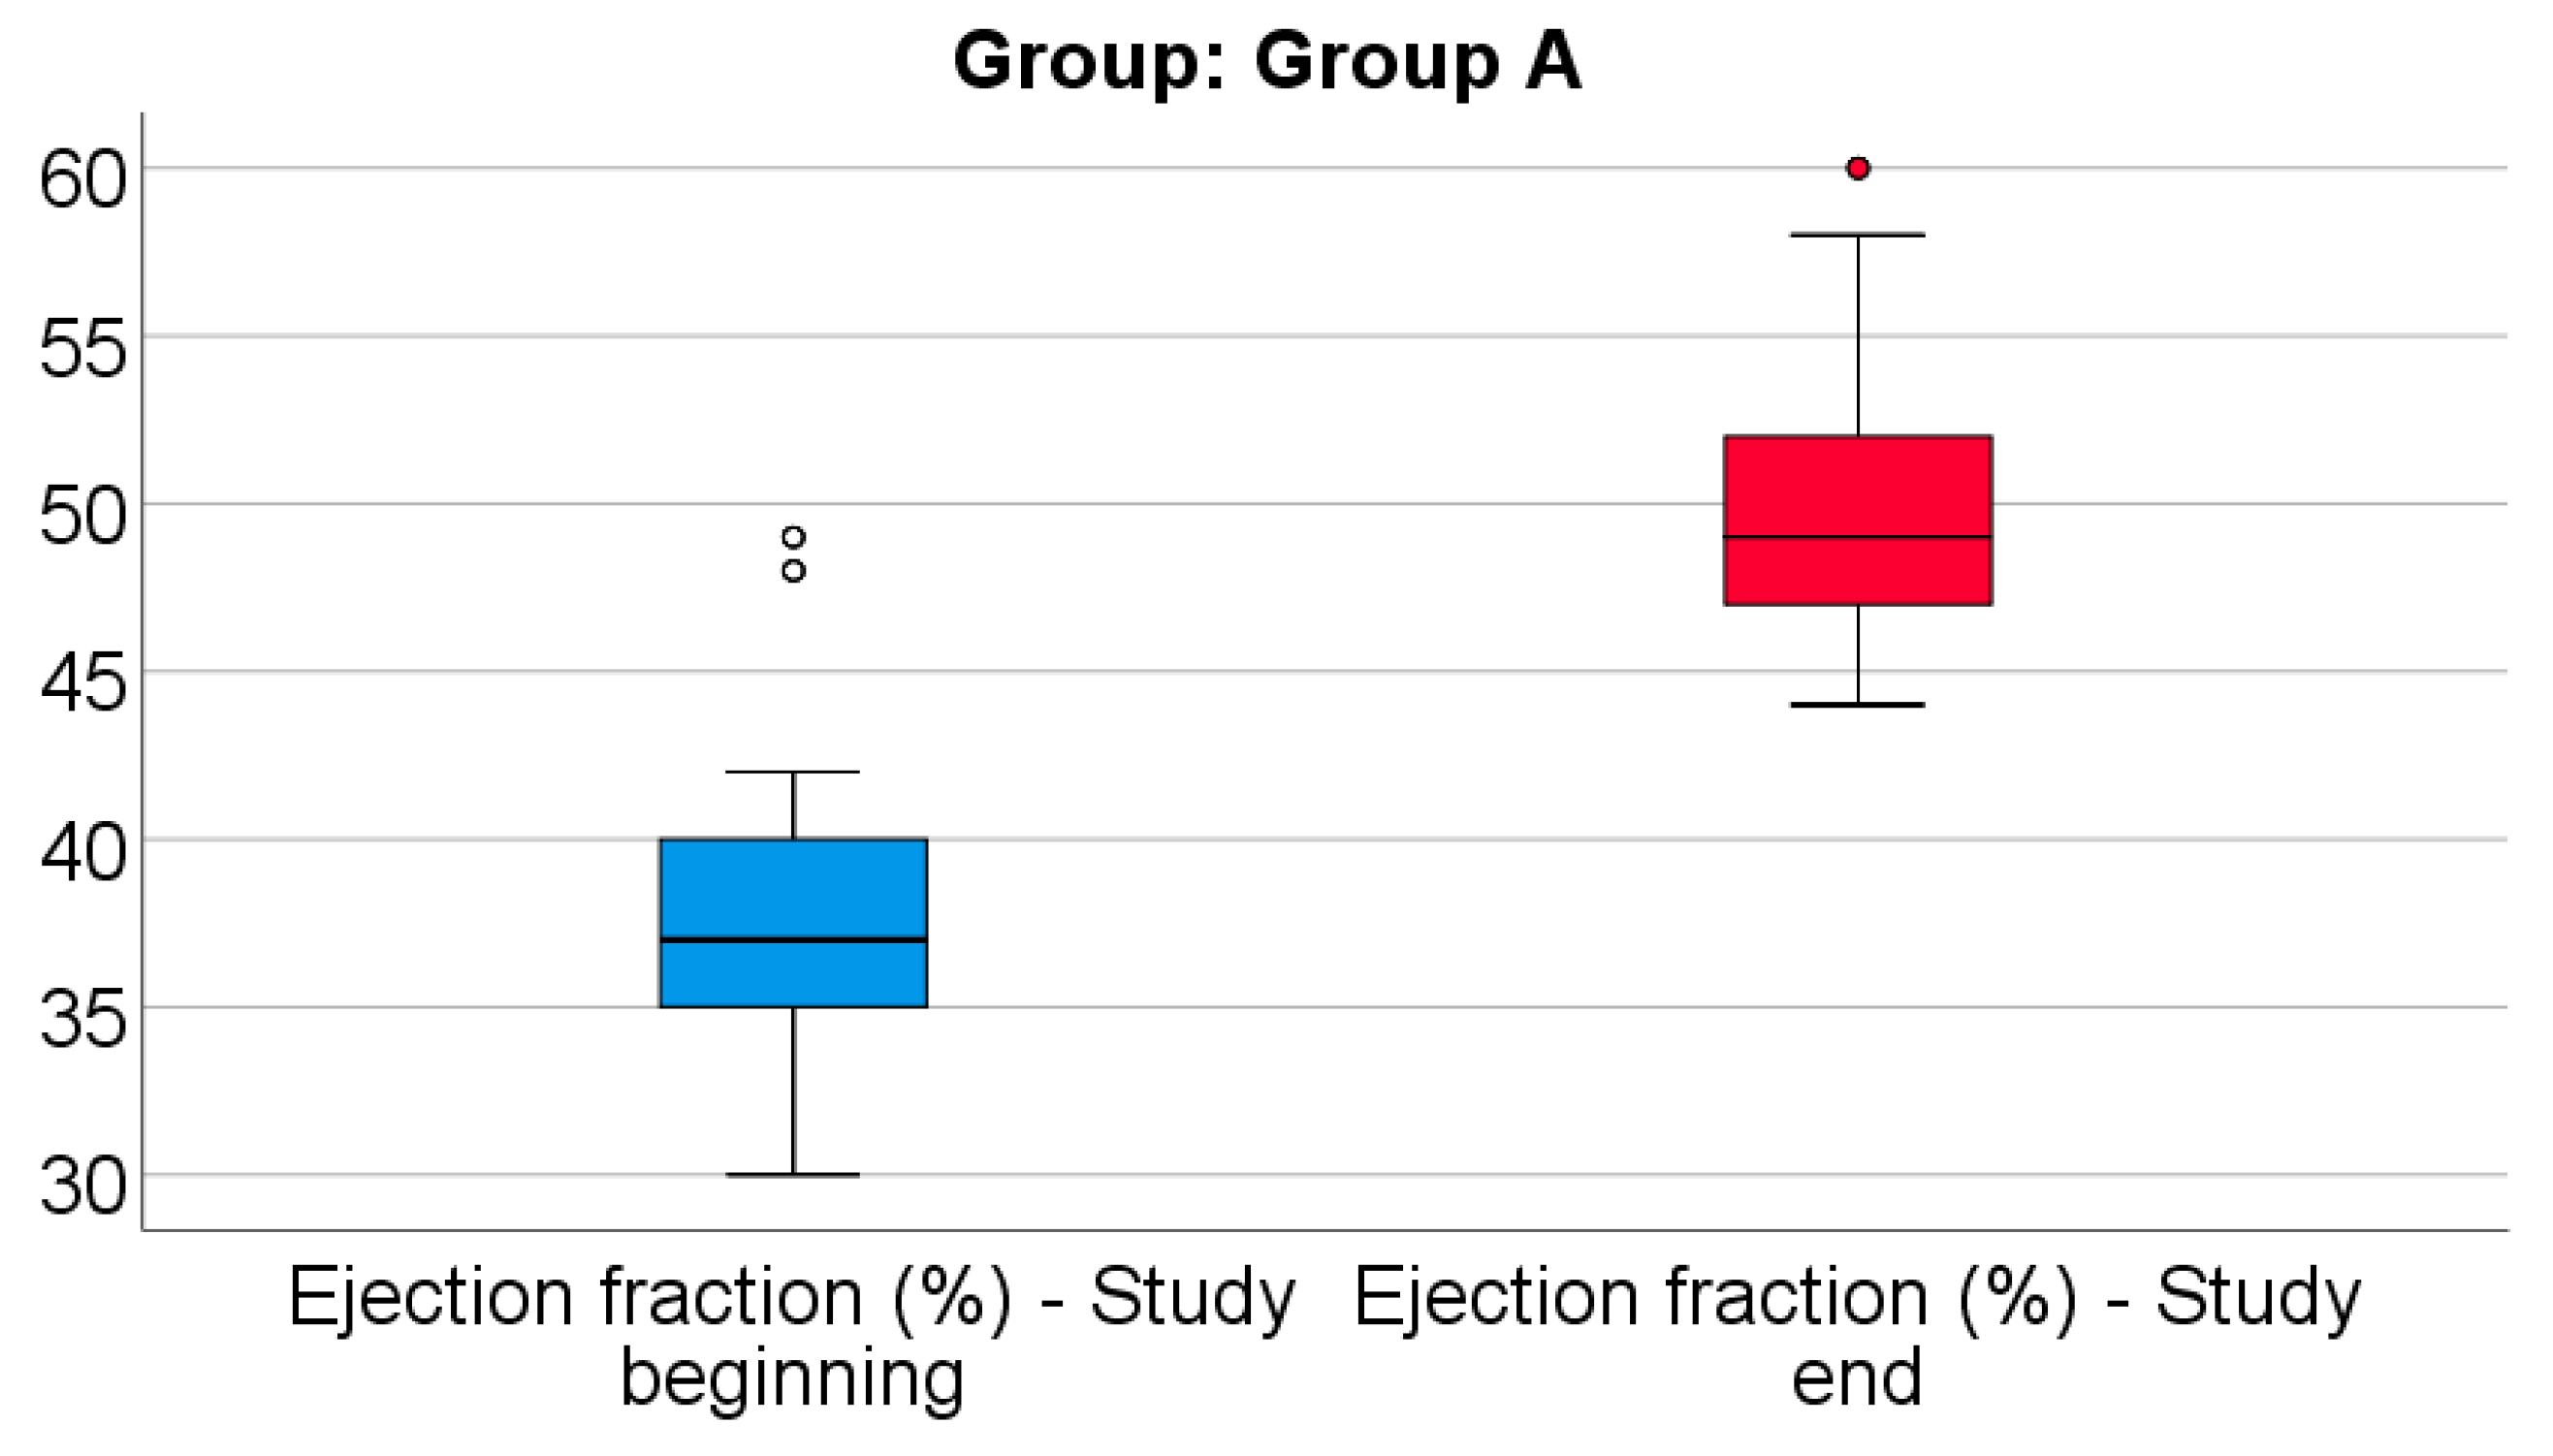
Figure 12 shows the comparison of EF from the beginning to end of the study in patients from Group A. Distribution of EF was non-parametric in both measurements
(p<0.05). Differences between the related measurements were statistically significant
(p<0.001), therefore EF at the end of the study were significantly higher (median = 49, IQR= 47-52) in comparison to the value at the beginning of the study (median = 37, IQR = 35-40), the difference between the two measurements being significant (median difference = 11, IQR = 9-13 and increase % reported for the EF at the beginning of the study: median % increase: 30.57 %, IQR = 22.5-37.14).
Data from
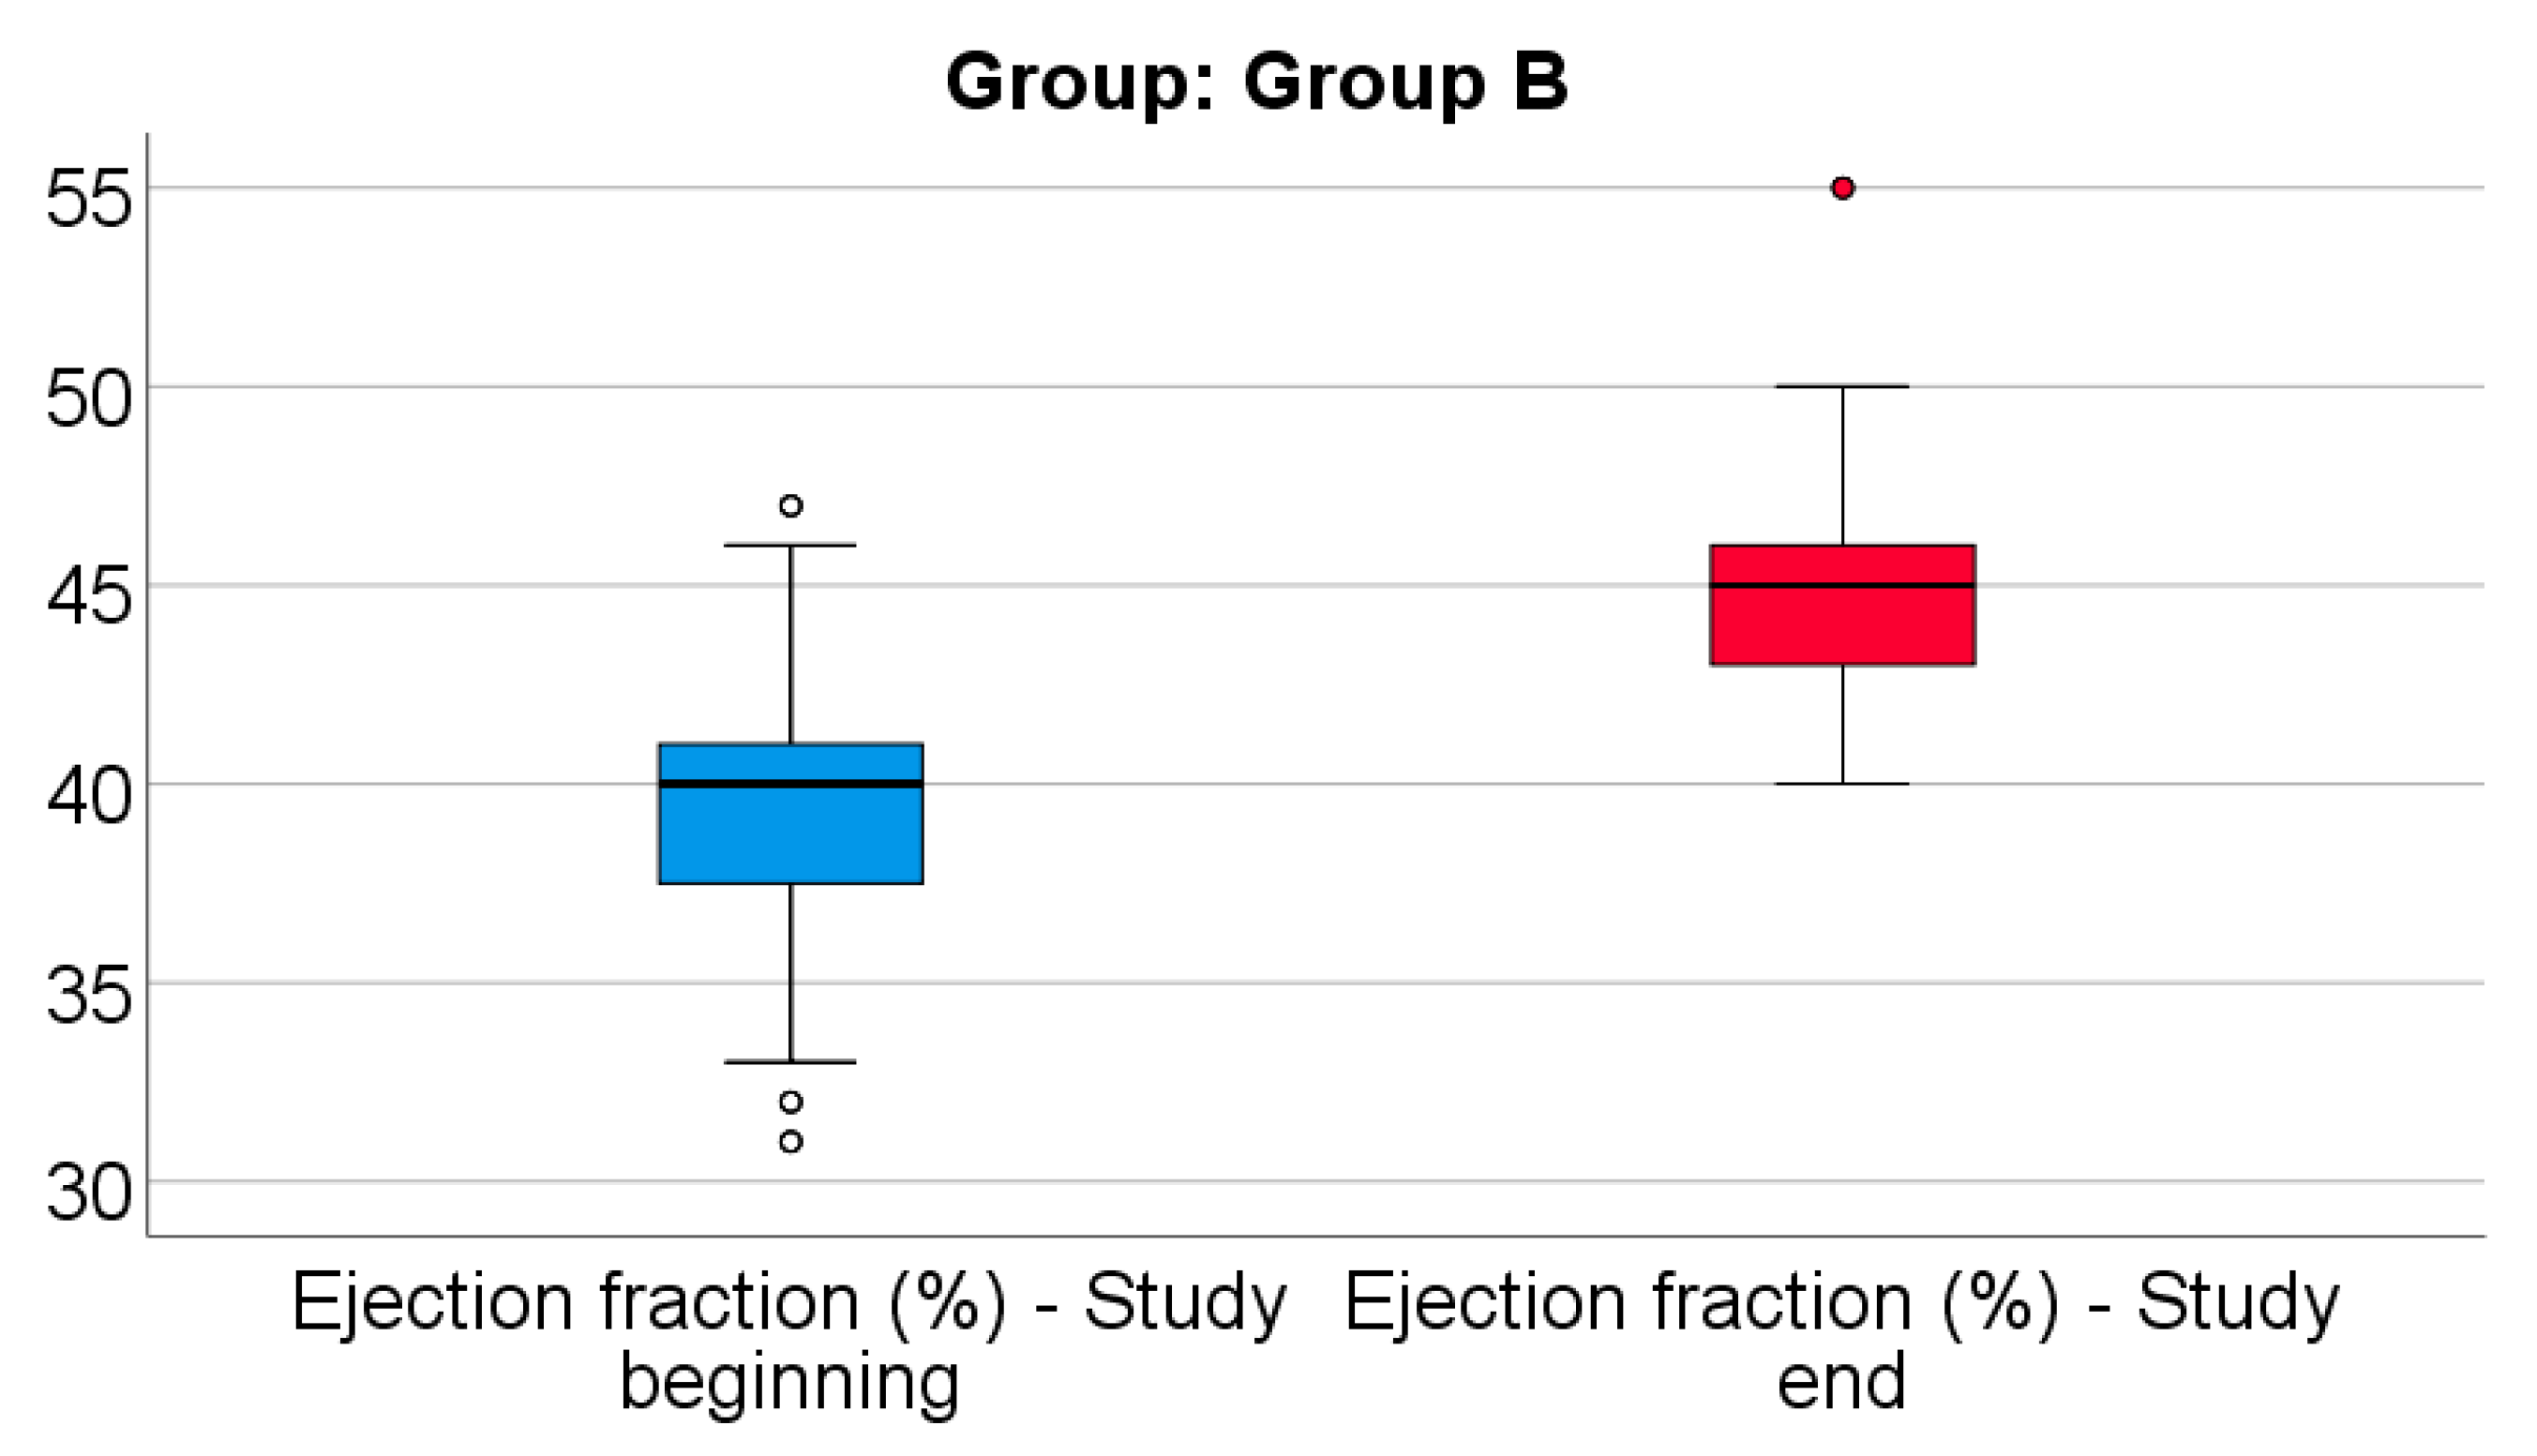
Figure 13 shows the comparison of EF from the beginning to end of the study in patients from Group B. Distribution of EF was non-parametric in both measurements
(p<0.05). Differences between the related measurements were statistically significant
(p<0.001), therefore EF at the end of the study was significantly higher (median = 45, IQR= 43-46) in comparison to the value at the beginning of the study (median = 40, IQR = 37.25-41), the difference between the two measurements being significant (median difference = 5, IQR = 2-8 and increase % reported for the EF at the beginning of the study: median % increase: 12.5 %, IQR = 5.16-21.34).
Data from
Table 14 shows the comparison of EF evolution between analyzed groups. Distribution of EF difference was non-parametric in both groups (p<0.05). Differences between groups were statistically significant (p<0.
001/ p<0.001) for both the absolute value of the EF difference and the decrease percentage reported for the EF at the beginning of the study.
Patients in Group A had a significantly higher increase of EF at the end of study from the beginning (median = 11, IQR = 9-13, % - median = 30.57, IQR = 22.5-37.14) in comparison to patients in Group B (median = 5, IQR = 2-8, % - median = 12.5, IQR = 5.16-21.34).
Data from
Table 15 and
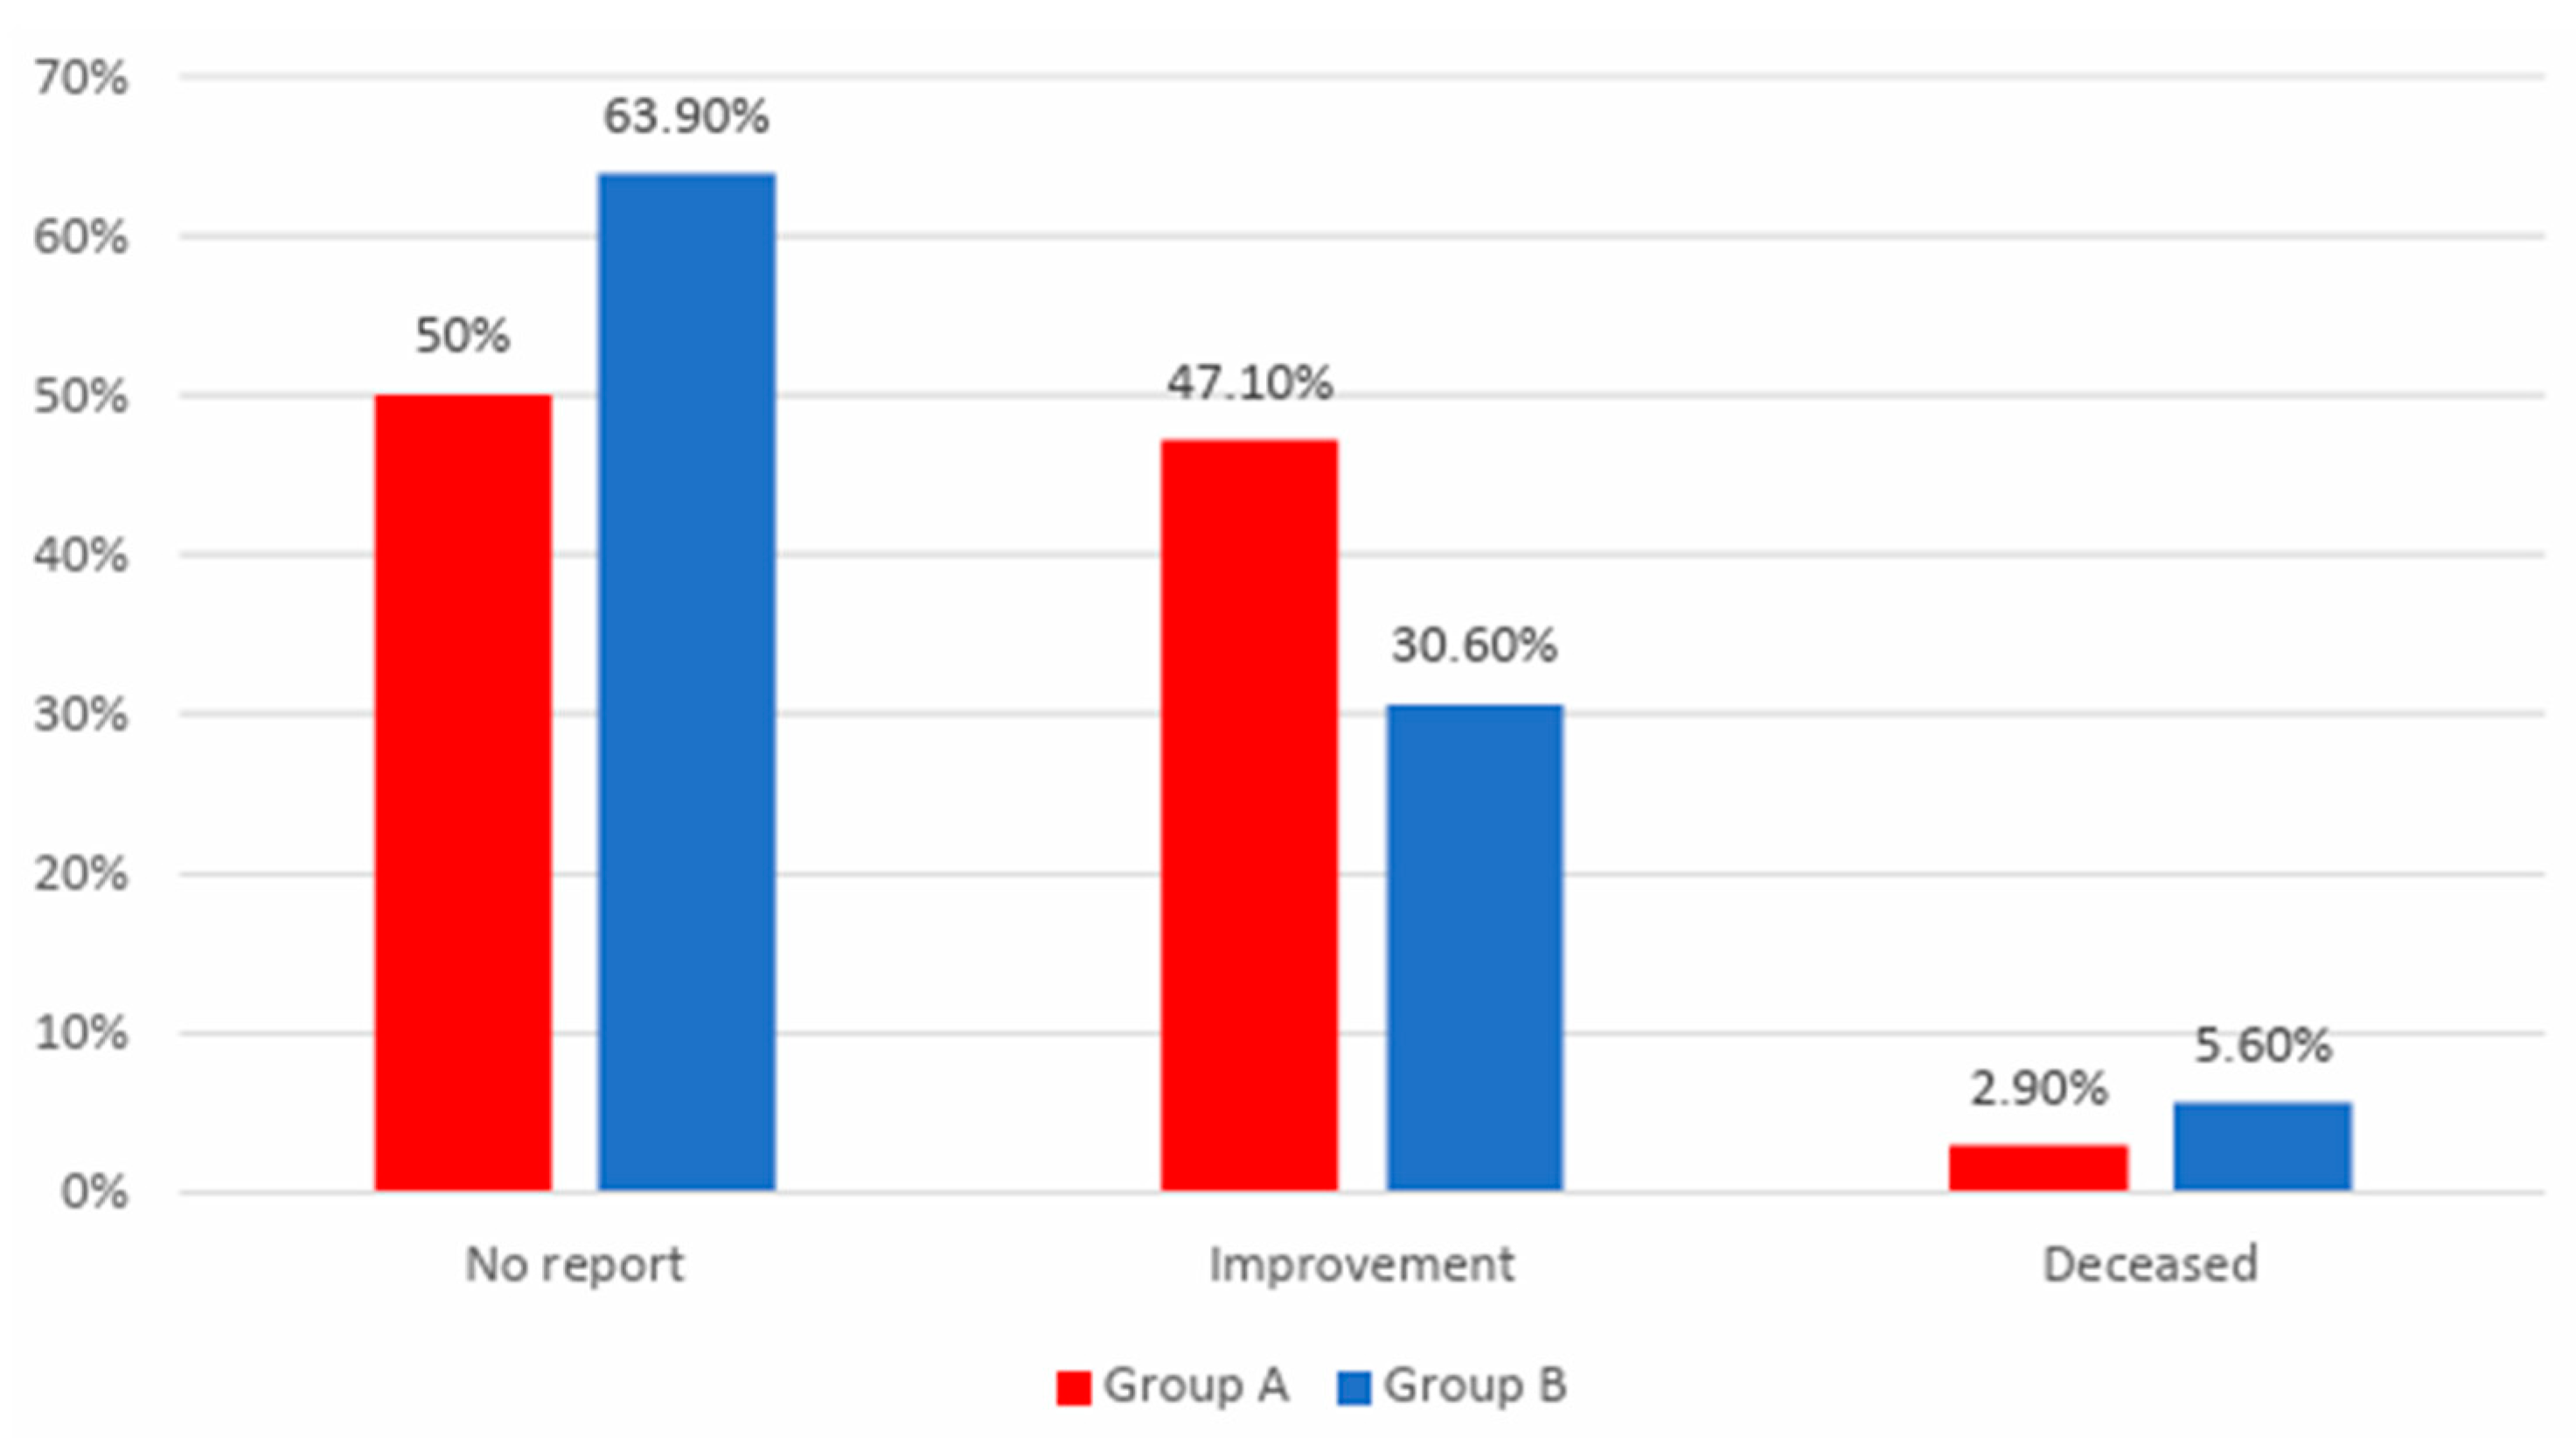
Figure 14 shows the distribution of the patients according to analyzed groups and quality of life. Differences between groups are statistically significant
(p=0.039). The patients that reported no improvement at the end of the study were significantly more frequent in Group B than in Group A (63.9% vs. 50%) while patients that reported an improvement at the end of the study were significantly more frequent in Group A than in Group B (47.1% vs. 30.6%). The frequency of mortality was not significantly different between groups (5.6% vs. 2.9%, p=0.500).
