1. Introduction
Biophilia refers to the inherent and deep-seated human love and connection with the natural world [
1]. This simple feeling, an experience that we can all relate to, especially when being immersed within a natural environment, is the root behind the concept of biophilic design. In an age characterized by rapid urbanization and the pressing challenges of climate change, designing environments that foster human happiness and productivity has never been more critical. Biophilic design is a concept that aims to establish a profound connection between people and the built environment. Drawing inspiration from the effect of Biophilia coming directly from nature, this approach seeks to integrate natural elements and patterns into urban spaces, work areas, and homes.
In addition to direct biophilic stimulation from nature, the human body perceives artificial structures that embody the complex mathematics of nature. Therefore, human artifacts and the built environment can exert the positive biophilic effect if they are designed in a particular way. It is not so much the mimicking of natural forms, which is a superficial effect, but rather using those same generative processes to create the built environment [
2,
3,
4].
Our ultimate objective is to encourage the creation of salutogenic environments, rather than merely “efficient” ones from the point of view of the construction and transportation industries. Not only will this goal help to improve human health, but it could drastically boost sustainability. A major yet low-cost contribution to sustainability is for environments and places to be appreciated by their occupants, often for reasons that are not consciously evident [
5,
6,
7]. Biophilic environments are loved because people feel comfortable in them and will maintain them much more readily than industrial environments that are hated because they are perceived as neutral or even hostile. This “likeability” factor plays a major role in how cities develop, although it is insufficiently discussed in the literature. Sensor systems in “smart” cities are helping to expand the opportunities of real-time feedback to answer questions of likeability linked to use [
8,
9]. Sustainable development strategies for smart cities therefore need to address this as one primary aspect of society maintaining its built fabric.
Urban spaces: As the world’s population increasingly moves towards cities, the dominance of concrete landscapes demolishes our natural surroundings. This rapid urbanization has given rise to ”nature deficit disorder” [
10], where the lack of interaction with nature contributes to declines in physical and mental health. Children’s healthy development is especially affected. Biophilic design offers hope in urban environments by providing a way to reintroduce nature into our lives. Urban spaces that incorporate biophilic effects through their design are more healing to their users [
6].
Work areas: Recognizing that the well-being and productivity of employees directly influence organizational success, biophilic design also presents an opportunity to transform traditional office spaces. Biophilic design is likely to create an environment that promotes creativity, reduces stress, and enhances cognitive performance [
11,
12]. Through the inclusion of indoor plants, natural light, and other biophilic elements, workplaces can offer a significant positive impact on overall happiness and job satisfaction among their workforce. In contrast, by neglecting the fundamental need for human connection with nature, today’s workplaces may experience decreased morale, elevated stress levels, and reduced productivity.
Homes: Mental health issues have become a pressing concern in the modern world. The healing power of nature is well-documented [
13,
14,
15], and biophilic design utilizes this salutogenic effect to create spaces that aid in reducing anxiety, depression, and stress-related disorders. Quite separately, the central role of informationally-rich interiors in helping the developing child to develop its intelligence is beginning to be investigated [
16].
All of this evidence motivates research on why biophilic design can be so impactful on individuals and society alike. This paper introduces two separate but related experiments. The first experiment measures the emotions that people express when confronted with different kinds of architectural imagery. We chose example pictures representative of building environments with an abundance of biophilic design characteristics, while others show few characteristics or none. Through this comparison we hope to generate an insightful analysis that supports the existing research with quantitative as well as visual results. To the best of our knowledge, applying AI to correlate personal assessments of biophilic attractiveness with unconscious facial expressions is novel.
In our second experiment, we want to test how people perform differently according to the biophilic quality of their immediate environment. Since the biophilic effect is salutogenic, then performing a mental task in an environment that decreases stress should influence a person to perform better. We assess productivity and engagement in a team, depending upon how much the environmental setting incorporates natural elements or is even situated in a natural space. Again, we are able to apply AI in an innovative manner (distinct from our first experiment) to extract unconscious information on the subjects’ feelings through analyzing their conversations while performing the mentally intensive task.
These two studies will be described, analyzed, and assessed in the following sections. The discussion begins by describing the biophilic design qualities upon which the project is based. While the two experiments reported here could have been presented separately, they are in fact complementary. Their logical combination provides compelling evidence for how humans connect to the built environment, with either negative or positive consequences depending on its lack or abundance of embedded biophilic properties.
2. The Biophilic Healing Properties
2.1. Biophilic Design Qualities
The degree or intensity of a particular setting’s biophilic attributes can be estimated by looking at different factors that contribute to the biophilic effect on humans. It is instructive to point out that, because this is a developing topic, different authors look for slightly different qualities, yet agree overall [
17]. Below, we present a listing of biophilic qualities by one of the co-authors, whose effect can be easily gauged [
18]. The biophilic qualities combine natural elements together with geometrical properties of the environment. These factors were distilled from the mathematics of organic forms, which prompted the evolution of the human brain so as to interpret environmental information for survival. In addition, some properties relate more deeply to the physics of complex systems.
Biophilic design is an approach that emphasizes incorporating natural elements and patterns into the built environment to improve human well-being. It aims to reduce stress, enhance creativity, and accelerate healing. Previous research explores the relationship between nature, human biology, and design to exploit the benefits of Biophilia in architectural applications. Note how, of the above biophilic qualities, numbers 1, 3, 7, and 8 come from being in contact with nature; whereas biophilic qualities 2, 4, 6, and 10 can either occur naturally or be created artificially. Biophilic quality 9 is strictly artificial. Laying the foundations of our understanding of biophilic design has been the main inspiration and guidance for this project.
In order to understand our project and our study preparations as well as decisions, it is necessary to give a quick introduction of each biophilic design group and their respective components. The terminology of Terrapin Bright Green [
3] was found convenient for our discussion, and so their equivalent terms are listed below in brackets. Since the experiments reported here depended primarily on the visual quality of the settings, we will not describe other biophilic factors such as aural, haptic, or olfactory.
Life (Nature in the space)
Nature refers to the tangible presence of living and natural elements like plants, water, and animals (including other humans). Examples of this in artificial environments can be seen in potted plants, flowerbeds, water features, and green walls. Added to this is humankind’s millennial love of domestic animals, and in rural communities, close contact with farm animals. The most impactful experiences of nature in a space are created when people establish meaningful and direct connections with these elements. Some biophilic elements can be further categorized as follows:
Water (Presence of Water)
Seeing, hearing, or touching water (e.g., water fountain)
Representations-of-nature (Natural Analogues)
Natural analogues in design involve using non-living objects, colors, shapes, and patterns found in nature to evoke a natural feeling in the built environment. This includes art-work, furniture, ornament, and textiles inspired by natural forms. For example, furniture with shapes resembling shells or leaves and using processed natural materials like wood planks or granite tabletops. The evolution of humans progressed alongside sophisticated ornamental traditions, in which artifacts mimicked abstracted natural forms. While these items are not an actual part of nature itself, they can help establish a biophilic connection.
Representations-of-nature (Biomorphic Forms & Patterns)
Textures and patterns similar to natural occurrences (e.g., tree-shaped columns)
Fractals and Detail (Material Connection with Nature)
Minimally processed natural materials (e.g., wood- and stonework)
Organized Complexity (Complexity & Order)
Complex structures similar to natural occurrences (e.g., exposed structure)
Spatial configurations that evoke ancestral settings
The nature of space in design focuses on how spatial arrangements can evoke feelings and behaviors similar to those experienced in natural environments. This includes our yearning to have open views, our fascination with mystery and discovery, and even feelings of fear mixed with a sense of safety. The most powerful experiences in this context come from intentionally designing spaces that combine engaging spatial layouts with patterns of nature and natural analogues. These last spatial qualities are not related to mathematical structure in objects or surfaces, but to the configuration of the lived environment. They were derived by Christopher Alexander as design patterns (before biophilic design was established as a discipline) and investigated by evolutionary anthropologists and geographers. Jay Appleton coined the “prospect-refuge” theory [
19,
20,
21]. Rewritten as a summary, Alexander’s Pattern 114 describes: “Satisfy the feeling of having one’s back protected by a solid structure (refuge), while being able to see out to the world (prospect)” [
5,
22].
Some investigators and even some architects include the following quality as being related to biophilia. Nevertheless, we classify it within the opposite biophobic factors since it triggers a fight-or-flight response. We do not wish to confuse our experimental findings by mixing negative with positive valence responses.
2.2. Existing Research on the Biophilic Effect
Biophilia has a significant impact on how the built environment affects happiness, health, and the productivity of humans. Rhee et al. (2023) [
13] investigated the influence of indoor vegetation density on human well-being, with the goal of promoting a healthy built environment. The results reveal that increased greenery in indoor spaces positively affected mood, reduced stress levels, and improved overall well-being, thus supporting the principles of biophilic design.
Lavdas and Salingaros (2022) [
23] develop in their work a scale to measure architectural beauty in an objective way. They introduce two diagnostic tools to achieve this task and to ultimately identify aspects in architecture that are perceived as beautiful and therefore might influence people’s health positively. Salingaros (2021) [
24] further investigated the relationship between happiness and biophilic urban geometry, showing the negative impact of modern architecture on user happiness. Salingaros (2020) [
15] also proposed neuroscience experiments to verify the geometry of healing environments, a direction of research that reinforces the importance of biophilic design in creating healing spaces.
Similarly, Darby et al. (2019) [
25] propose another human-centered approach in sustainable building design to increase the overall occupant’s happiness and concentration considering lighting, smell, and air quality. Allen et al. (2015) [
14] conducted a comprehensive study on a framework to measure the impact of green buildings on occupant health. They discovered that green buildings positively influence the occupant’s health and through this, their well-being. Benchmarks for green buildings incorporate controls for increased ventilation, use of materials, indoor air quality monitoring, lighting, exposure to daylight, and views. Hu et al. (2021) [
26] investigate how sustainable buildings affect people’s thinking and mental well-being compared to conventional buildings. They measured brain activity to understand this impact and suggest that a sustainable building environment improves focus and processing of the occupants.
Many publications target the impact of biophilic design on health, and it is undeniable that health influences personal well-being, which in turn helps to boost both happiness and productivity. Nevertheless, this topic is not directly related to our target of measuring the impact of biophilic design on happiness and productivity. The rapidly growing number of these research papers suggests the rising importance of this topic.
3. Study 1—Impact of Biophilic Design on Emotional Responses
3.1. Study Objective
This section explores the emotions evoked in individuals when they are confronted with different intensities of biophilic design in architecture. Numerous studies have highlighted the potential health benefits of incorporating biophilic designs into architectural structures. This study aims to add a new dimension to this research. To understand the depth of the impact of biophilic design elements on individuals, we pose the following research question:
Does biophilic design in architecture trigger more positive emotions?
3.2. Study Design
Taking advantage of the progress in artificial intelligence (AI) research in recent years and the resulting improvement in facial emotion recognition technology, we developed an experimental setup in which participants were presented with a curated selection of images, containing different densities of biophilic design elements. The best way to effectively capture as many emotional reactions as possible was by implementing a web-application. The easy shareability of a web-application ensured that we were able to reach a critical number of participants without having to conduct the experiment in person.
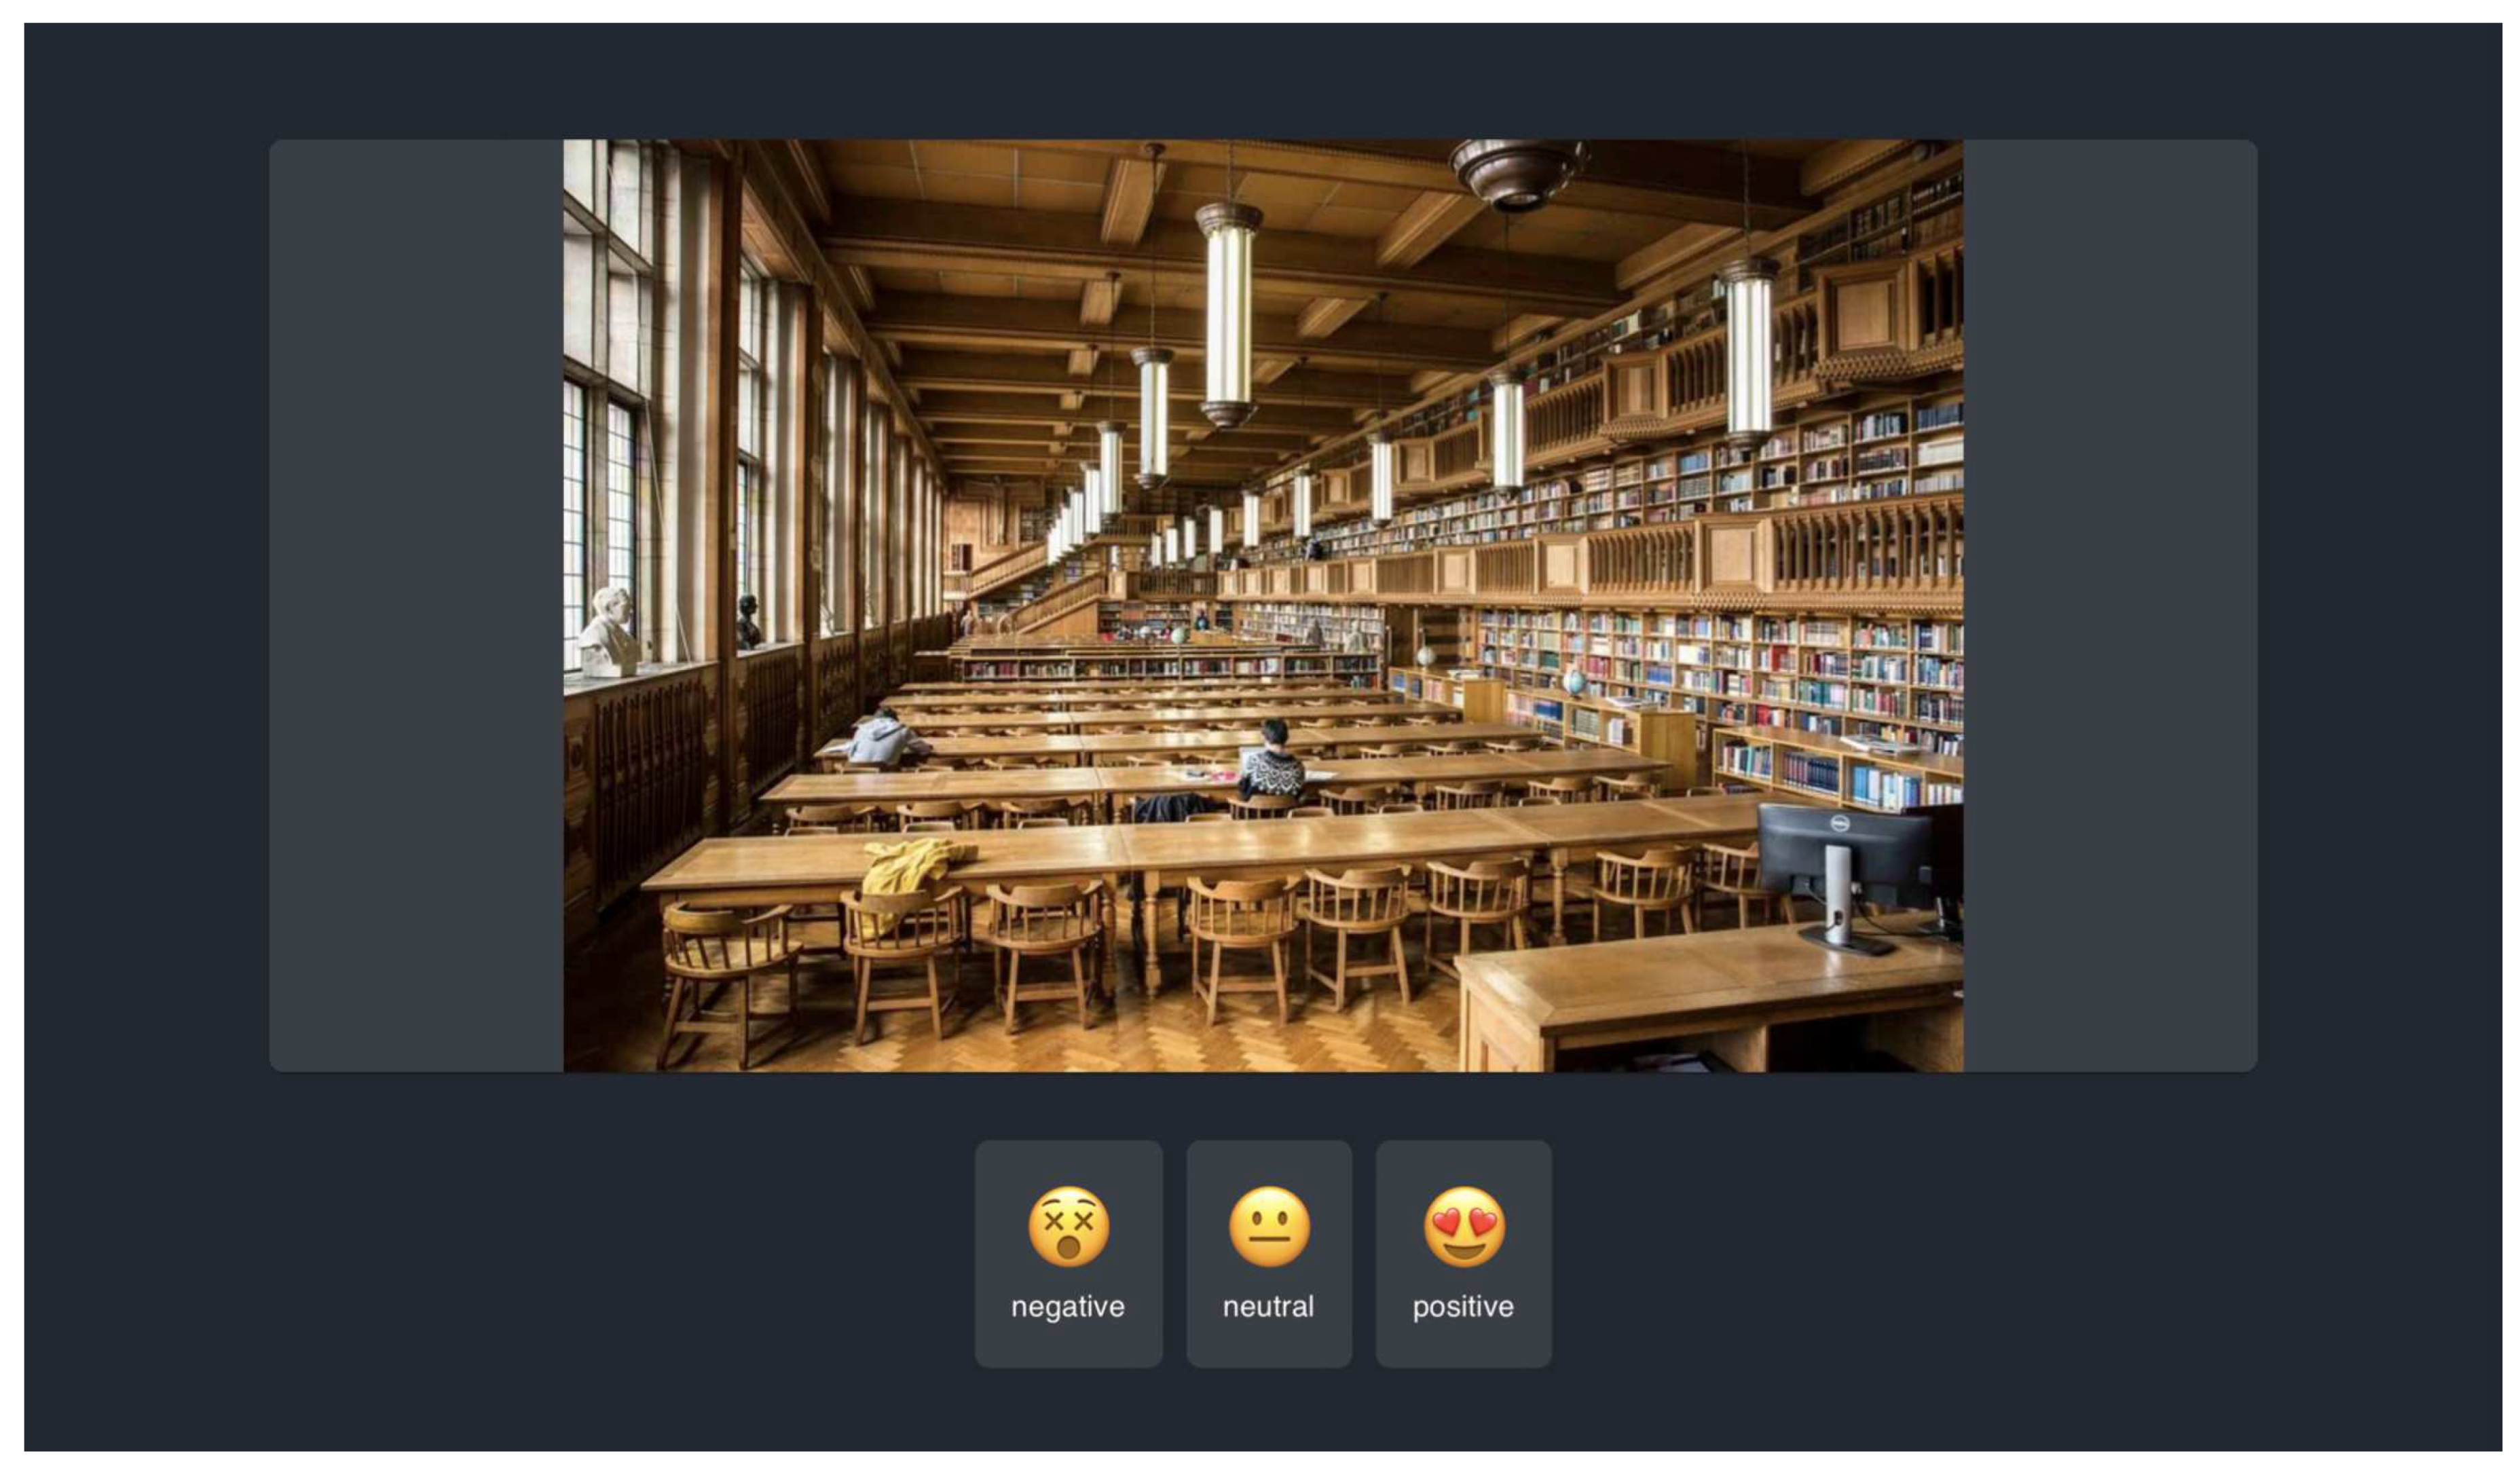
In this application, participants are presented with one image at a time (
Figure 1). For each image, they entered through a survey one of 3 possible reactions as to how they feel (emotionally, not intellectually) about the architecture of the image: Negative, Positive, or Neutral. This click-reaction forms the self-assessment component of the study. While the participants click through the images we capture their facial expressions via a webcam, to later extract the emotions using Facial Emotion Recognition, which builds the actual emotional reaction component of the study.
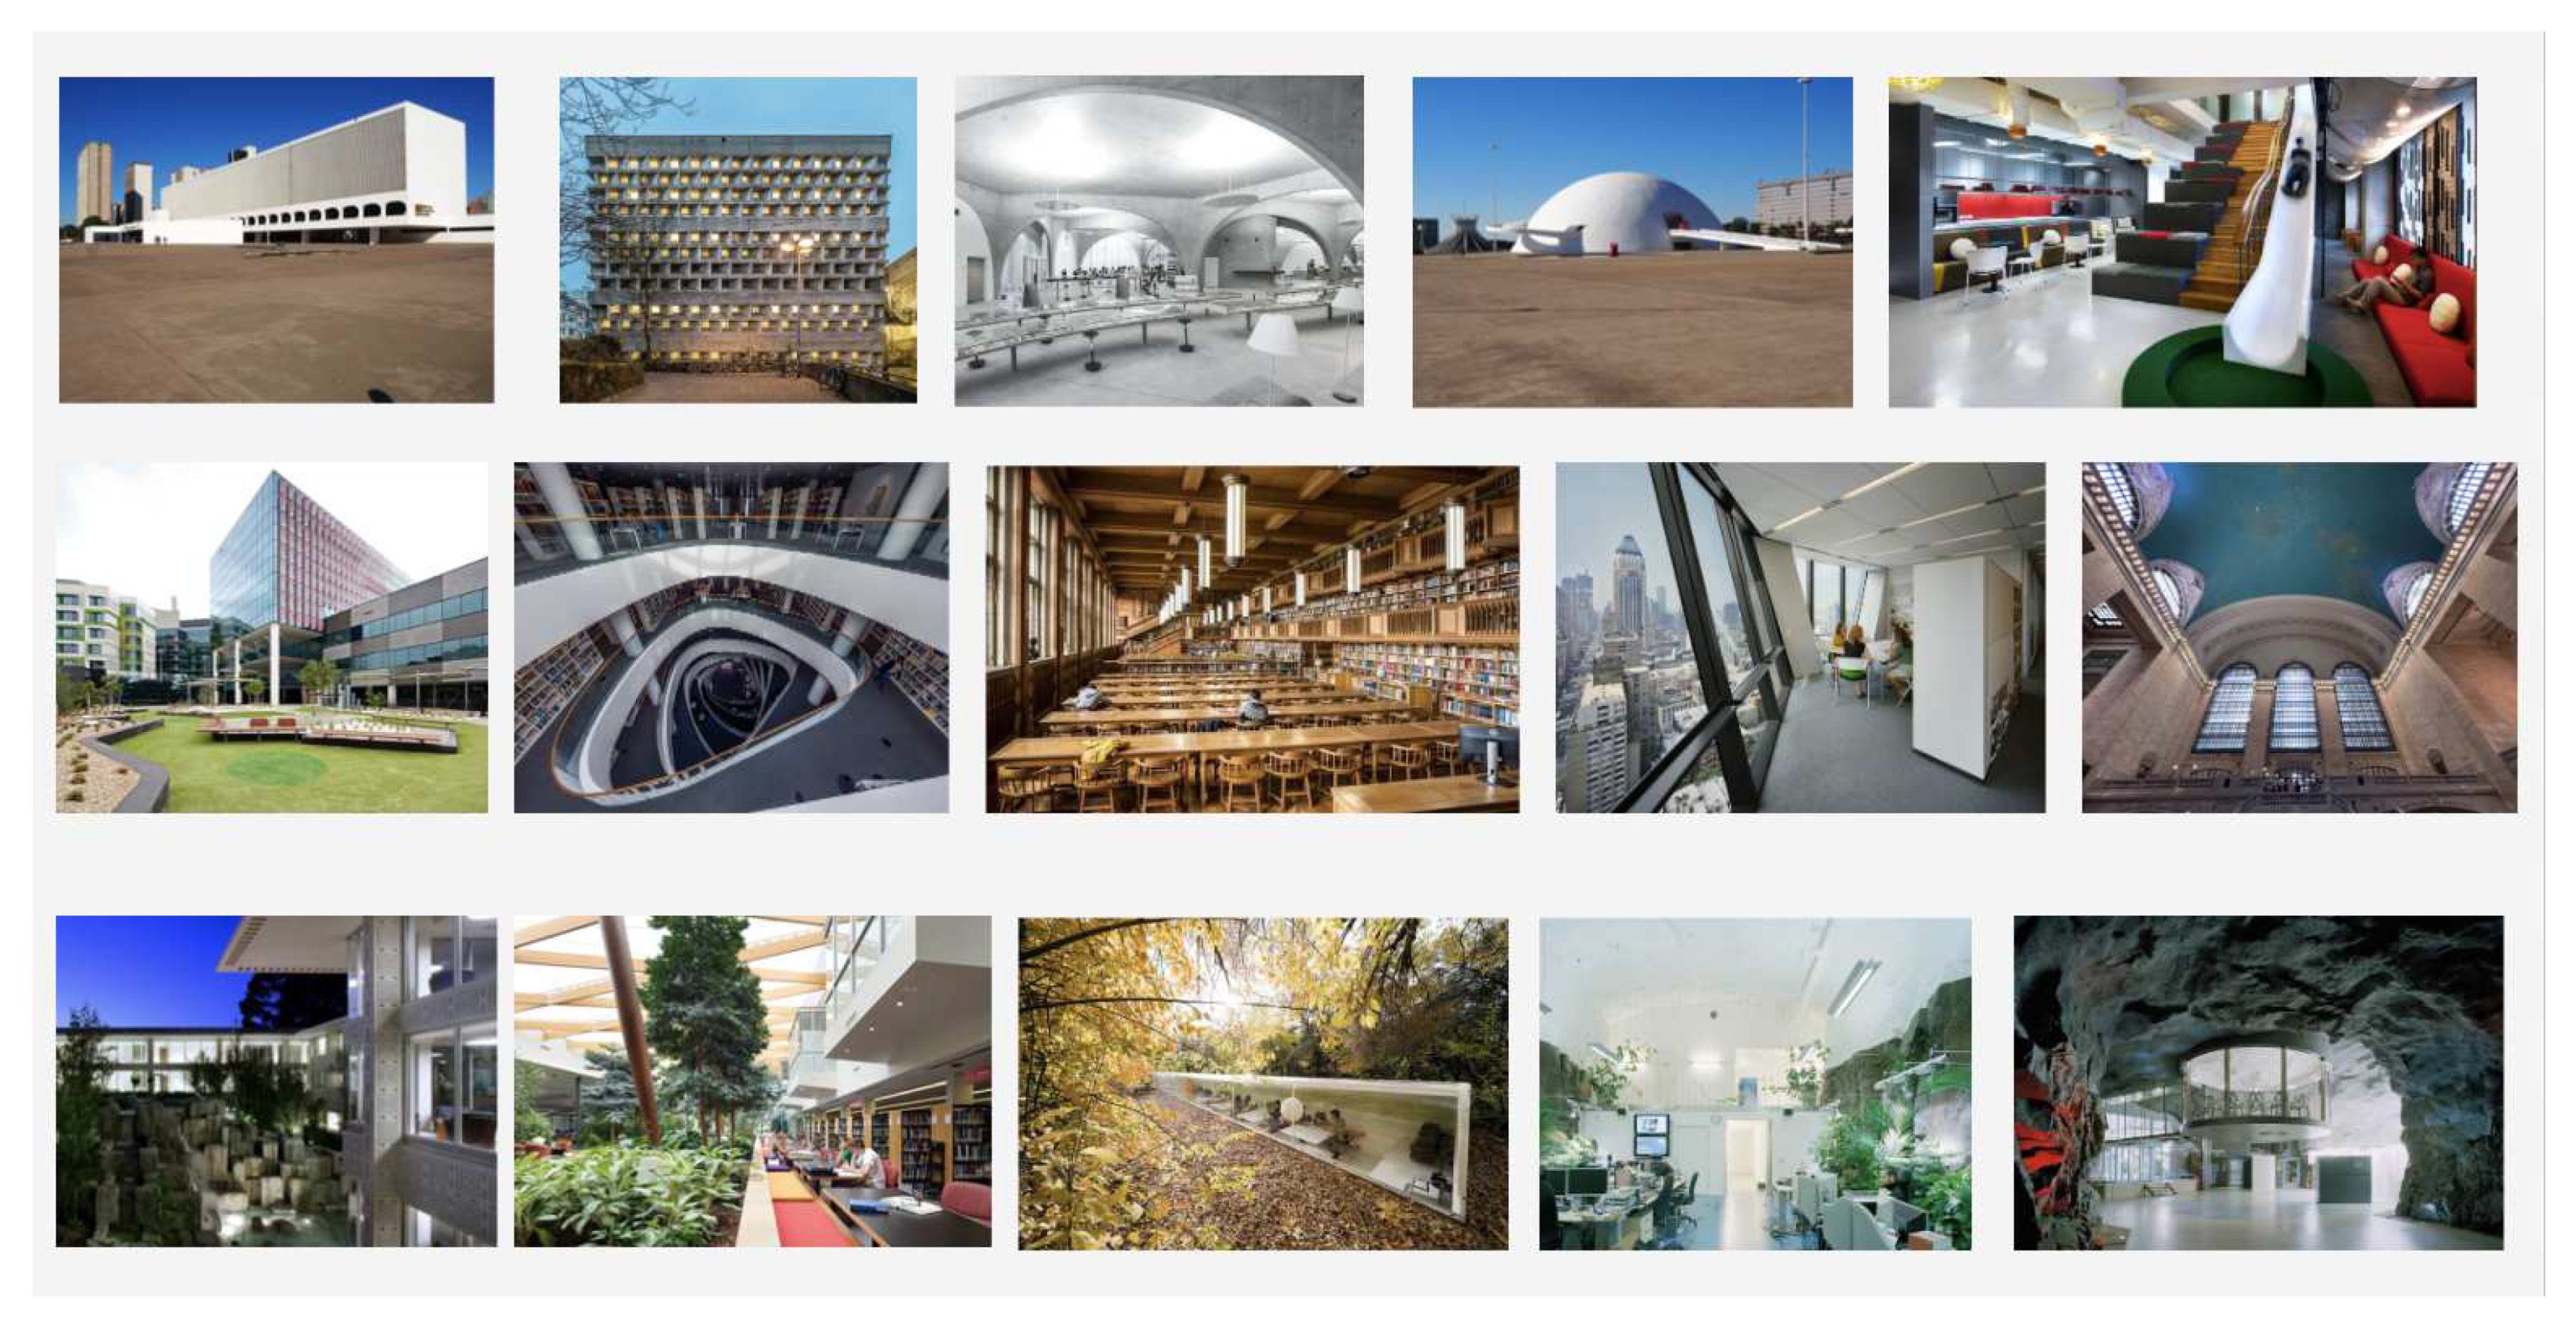
For the image selection we distinguished among three picture categories: Architecture that does not implement any biophilic design, architecture that implements merely a few components, and architecture that is clearly driven by biophilic design. Furthermore, we want to include every Biophilic Design Pattern by Browning et al. [
17] at least once in architecture that we chose to use for this study. The final choice of pictures and a table with the respective biophilic design patterns can be found in the
Appendix A (
Table A1,
Figure A1). In total, there are 15 pictures, five for each picture category, from a diversity of contexts such as offices, hospitals, libraries, and train stations. Through this we intended to get more generalized results, independent of the type of architecture portrayed. For the same reason, we chose to show a mixture of building facades and building interiors.
3.3. Study Execution
We developed the web-application using React, an open-source JavaScript Framework initially developed by Facebook [
27]. The structure was very simple. The participants had to enter their age-range, profession-background and allow us to access their webcam. We used the package react-webcam to take a picture via the webcam every second during the experiment [
28]. After the user had reacted to every picture, we uploaded the data to firebase. This is a cloud-service from Google that provides all necessary functionalities for the development of web and mobile applications, e.g., databases and hosting options [
29].
3.4. Data Processing
We recruited 39 participants over two weeks. We processed the data for every experiment, first by extracting the facial emotions with the open-source package py-feat [
30], which uses a residual masking network proposed by Pham et al., 2020 [
31]. For every picture we obtained 7 emotions, with each assigned a percentage of its probability (
Figure 2).
We grouped all webcam-picture-reactions by the picture that was shown at that time on the web-application and took the average over all emotions. Finally, for every participant, we collected the age, profession category and for every picture, the average facial emotion and the clicked emotion.
3.5. Results of Study 1
3.5.1. Descriptive Analysis
The study subjects were mainly students in the age group of 21-30 years. In the other age groups, we have two subjects each, except for the second oldest age group of 51-60 years, which contained only one participant. Most subjects work in the Education and Information Technology sector. These findings are not surprising, as we recruited mostly people from our direct environment; however, the homogeneity of the test group will be discussed in the limitations section at the end of this paper.
We plotted the distribution of all emotions detected categories by Facial Emotion Recognition (
Figure 3) for all the images. Clearly, the emotion most frequently detected was ‘neutrality’. This was expected but nonetheless poses a limitation which will be discussed later. The emotion detected second was happiness, followed by sadness, anger, and surprise. Therefore, even if we see big differences between the detected emotions, the difference is still marginal compared to the percent of neutrality measured in the participants’ facial expressions. In particular, the emotions ‘Fear’ and ‘Disgust’ need to be interpreted with caution, as they were scarcely detected over the whole dataset.
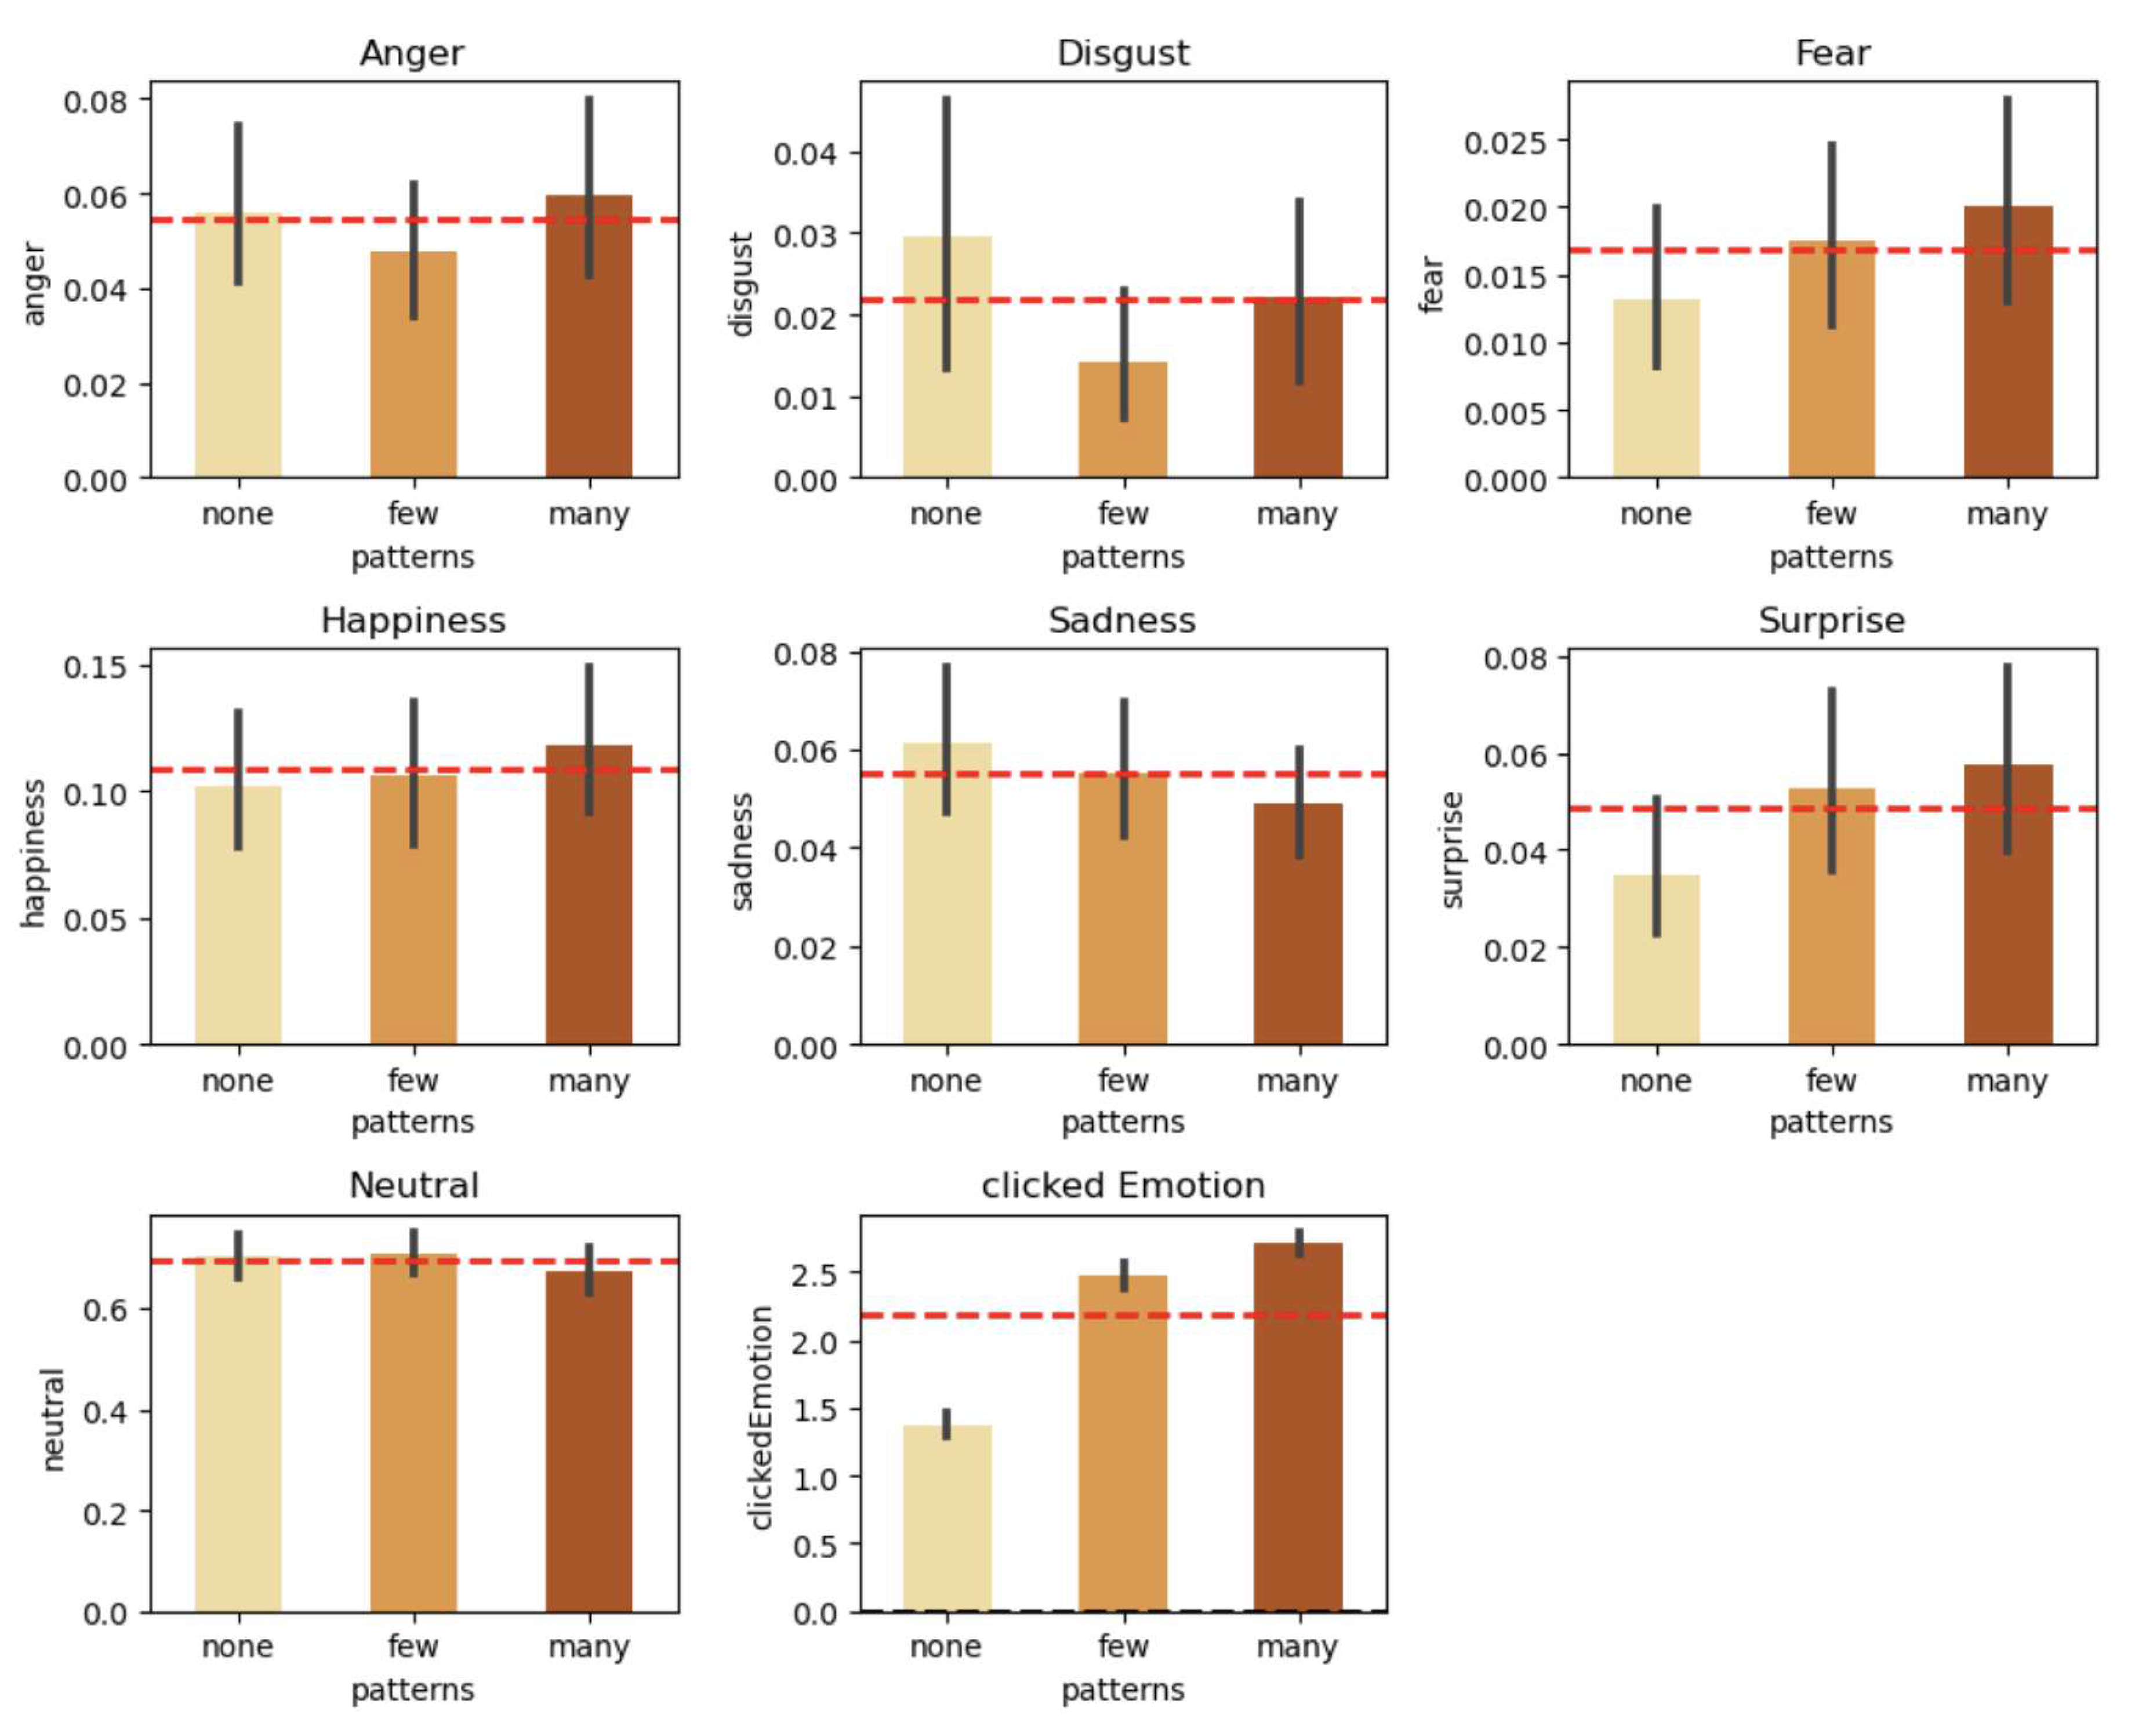
Subsequently, we took a look at these differences between image groups, plotting each emotion independently (
Figure 4).
First we can see that neutral is the same for all groups, which is very helpful because it allows us to neglect the influence on the emotions. We can also see that the different strengths of the emotions according to the intensity groups, can be divided into three different patterns (Note: The percentages are the deviations from the average across all groups):
- (a)
Emotions that get more intense when more biophilic characteristics are present. These are fear where participants showed an 18.9% increase, happiness with a 8.9% increase, surprise with a 19% increase and the self-stated emotion being 24.1% more positive.
- (b)
The Emotion sadness seems to be decreasing when more biophilic characteristics are present, decreasing by 11.4%.
- (c)
Anger (–12.3%) and disgust (–35.7%) seem to be at lowest when only a few biophilic characteristics are included in the images. Anger increases the most with 9.2% when many biophilic patterns are present, and disgust has its highest with an increase of 34.2% when the architecture shown in the images had no aspects of biophilic design at all.
We must make one comment at this point. We can calculate differences between the emotions in relation to the 3 groups of intensity of biophilic design we have chosen. However, due to the statistically small population, we have very high variances that will limit us greatly in significance and correlation testing.
3.5.2. Testing for Significance
To make generalized assumptions and conclusions from these results we need to test each difference in emotion for significance. We did this for each sub-plot and between all three groups. First, we determined the distribution of our collected data. As the Shapiro-Wilk test shows that our data was not normally distributed, we tested our data for significance applying the Wilcoxon signed-rank test with alpha = 0.05. In total there were six cases where we could not show a significant difference between the groups (
Table 1). The first significant result is the difference between ‘disgust’ detected between the [‘few’ and ‘many’ biophilic qualities] image categories. The test for ‘fear’ between the groups [‘few’ and ‘many’], and [‘none’ and ‘many’] both yielded p-values lower than our chosen level of significance. And finally, the difference of the ‘clicked Emotion’ between [‘few’ and ‘none’], [‘few’ and ‘many’], and [‘none’ and ‘many’] groups respectively, proved to be significant in all three cases. As these are self-documented emotions, there is enough evidence in the complete data sample to form a general statement from these results.
We additionally tested the relationship between emotions tracked with FER and the self-stated emotions (negative, neutral, and positive). Because the facial emotional reaction is metric and the self-stated is ordinal, we used the spearman correlation. The FER emotions happiness and surprise have a statistically significant increasing monotonic relationship, which means that participants tend to state that they felt more positive about the shown image when it had more biophilic elements. Furthermore, the emotion sadness has a decreasing monotonic relationship with the self-stated emotion, meaning that participants showed a sadder face when looking at pictures with fewer biophilic elements.
To answer the research question more accurately and counteract the high variance we decided to group the FER emotions into the same three groups as the self-stated emotions. As a basis we used the classification of GoEmotions suggested by Google Research in 2021 [
32]. Anger, disgust, fear, and sadness are classified as negative, happiness and surprise as positive: Neutral and the self-stated emotion remain independent groups. Even though surprise is classified as Ambiguous in Google Research, we decided to include it in the positive group because, based on the previous analysis, we found an increasing relationship with the self-stated positive emotions.
With the grouping we first redid the significance analysis but only the self-stated emotion has a significant difference between the three levels of biophilic design (none, some, a lot). We therefore did a correlation analysis and found that there is a significant increase of self-stated emotion when more biophilic design is present in a picture of a built environment. Then we redid the correlation analysis for the grouped FER emotions (negative, neutral, and positive) and found a statistically significant decreasing monotonic relationship between self-stated and negative FER emotions, and a significant increasing monotonic relationship between self-stated and positive FER emotions.
3.5.3. Answer of Research Question
We revisit our research question from our first study: Does biophilic design in architecture trigger more positive emotions? Considering the study limitation, we answer this question based on our analysis with YES. We find a clear trend indicating that the mere presence of more biophilic design characteristics in the built environment triggers more positive emotions.
4. Study 2—Influence of Biophilic Design on Productivity and Team Engagement
4.1. Study Objective
The second experiment examines the broader impacts of biophilic characteristics on productivity and team engagement. We explore whether the presence of natural elements in a work environment can foster better productivity and engagement levels among team members and generally result in better well-being. We investigate the following research question:
Can the presence of biophilic design elements in a work environment enhance productivity, team engagement, and overall sentiment?
4.2. Study Design
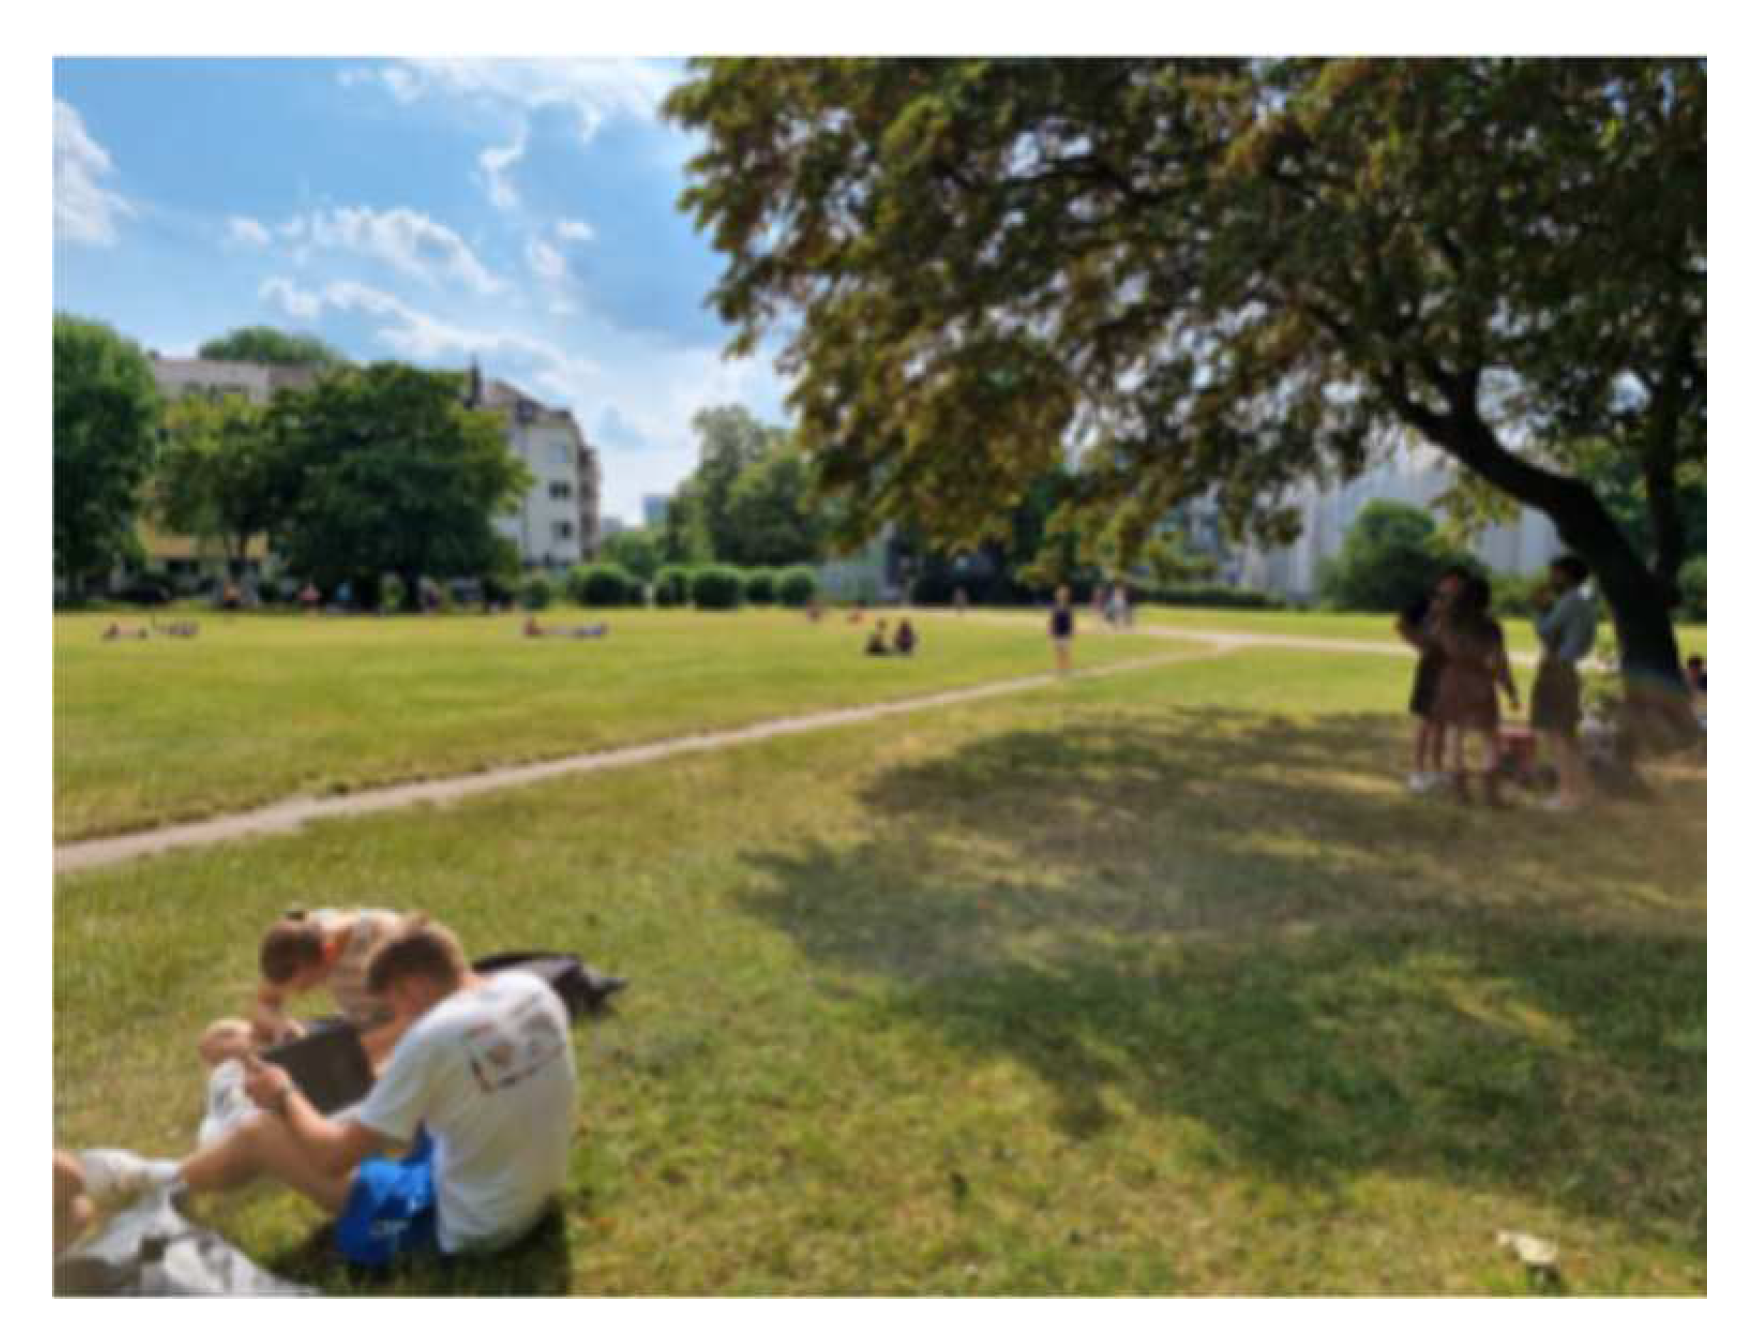
The second study had to be carried out in person to accurately capture the differences between productivity, team-engagement, and sentiment. Due to time and resource restrictions we decided to distinguish only between two different places with opposite biophilic characteristics from each other. The first place chosen was the university meadows on a sunny day, i.e., a very green, spacious and bright place (
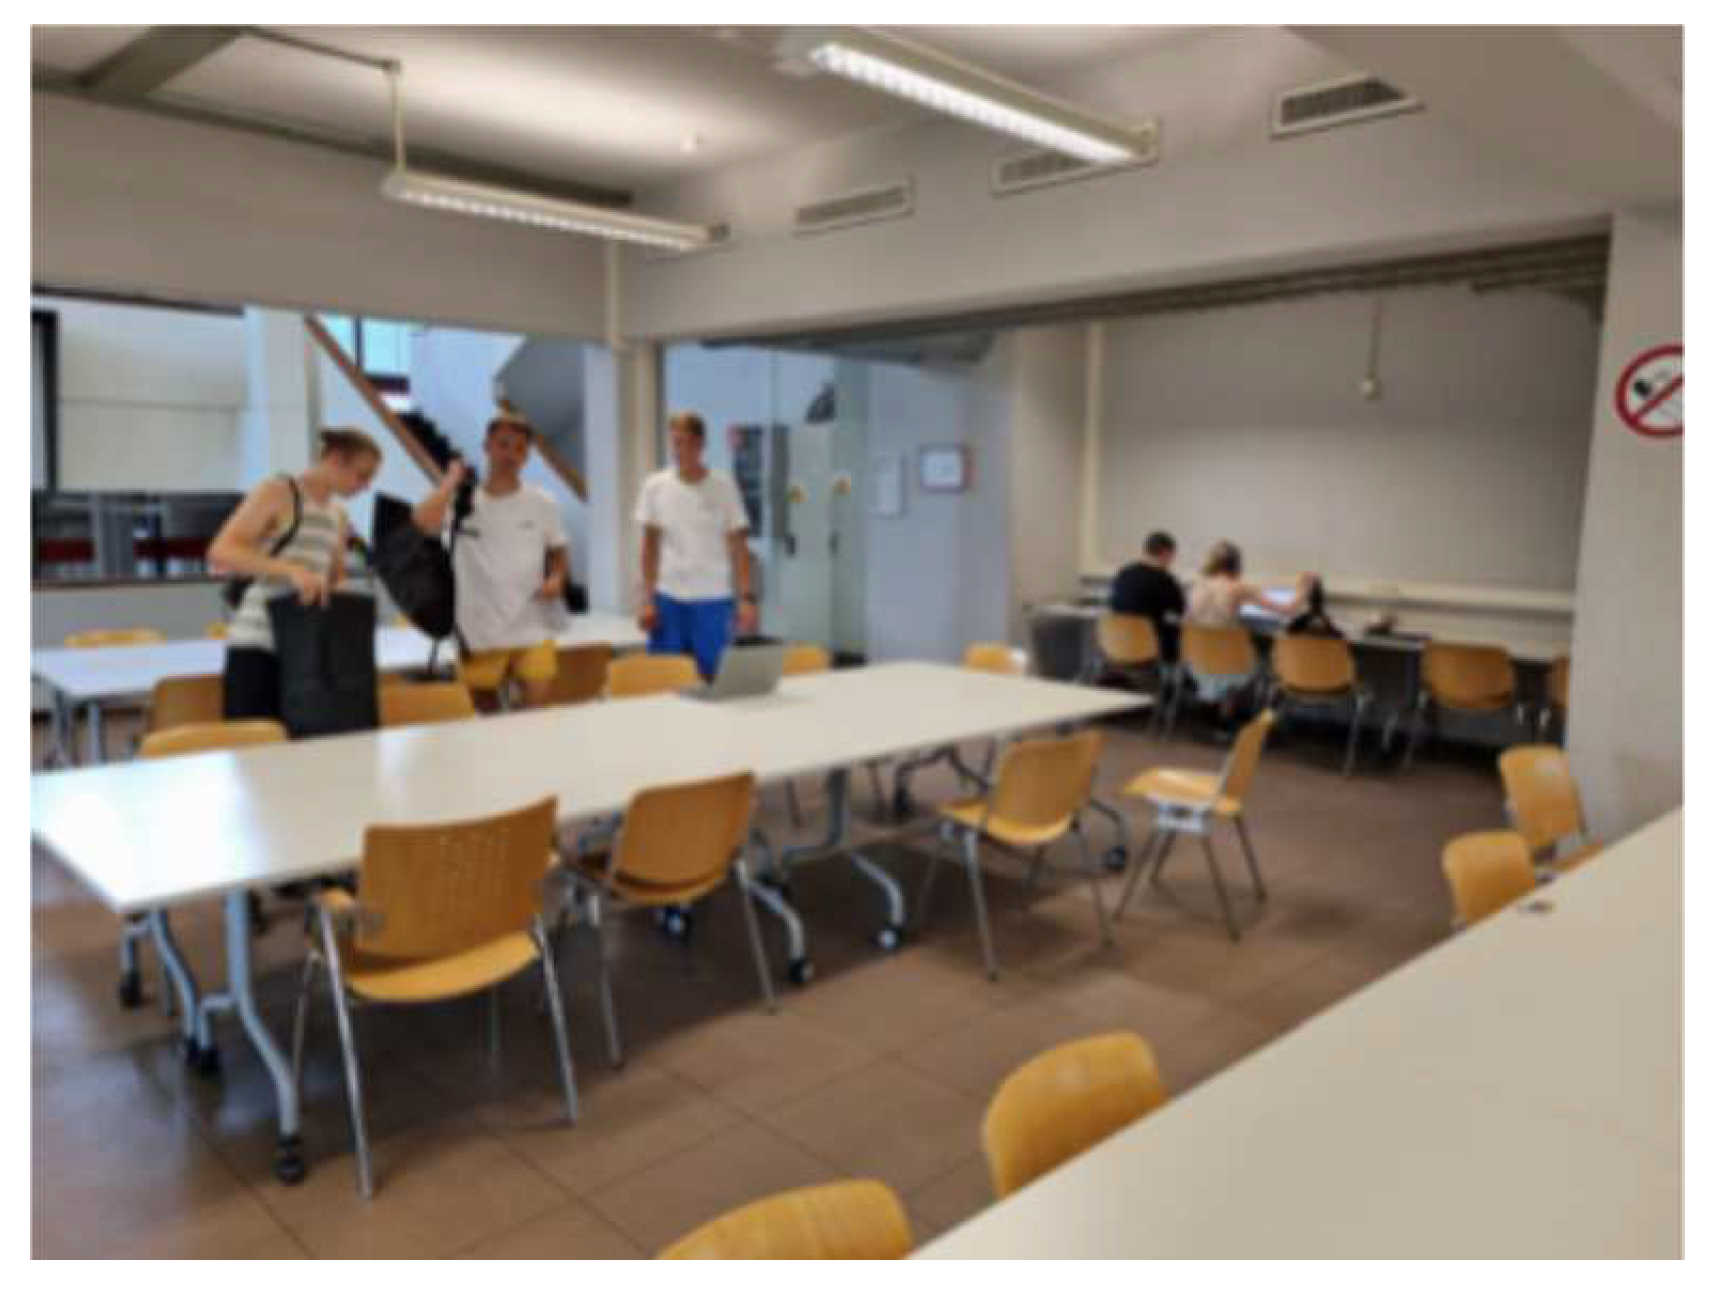
Figure 5). The second place was a study room in the canteen, a narrower, nested, dark room that has few windows and is therefore mainly artificially lit and consisting of many grey walls (
Figure 6). We conducted the study with five groups consisting of three people each, alternately starting at the outside and inside locations. The weather conditions were similar on each experiment day.
4.3. Study Execution
To measure the productivity and stimulate communication we used a digital version of the game ‘memory’ (popular in Europe) [
33]. First, each group member played one solo game, followed by a game played by the team as a whole. This process was repeated at both locations. Through this exercise we could obtain the number of moves and time needed until completion. In addition, we recorded the conversation during the group game to extract spoken words, speaking activity, and detected sentiments for every speaker. Moreover, we asked every participant upon arrival at the study location to rank their current well-being on a scale from 1–10.
4.4. Data Processing
While the metrics obtained from the game and the stated well-beings were already structured for analysis, we had to process the recorded conversations to extract unconscious mood. The first processing task we did was speaker diarization, which is the task of partitioning an audio stream into homogeneous temporal segments according to the identity of the speaker using pyannote.audio [
34,
35]. We then used OpenAI’s WhisperAI Model [
36] to transcribe the audio files and afterwards matched the transcript with the result of speaker diarization using timestamps. To ensure that the speaker diarization did not mix up the order between the speakers, we asked the participants to briefly introduce themselves before each group game in the same order, so that we had assignable audio data to identify each participant. After having determined the sequence and content of individual contributions, we proceeded with the final step of the data processing. For each sentence we extracted the sentiment using the Natural-Language-Processing (NLP) Model germansentiment. The base of this model is Google’s Large Language Model Bard, which was fine-tuned on 1,834 million German-language samples by Guhr et al. [
37]. The output is a percentage of the three sentiment categories: A. positive, B. negative, and C. neutral. We calculated the average count for each speaker and the average over all speakers for the complete game.
4.5. Results of Study 2
4.5.1. Descriptive Analysis
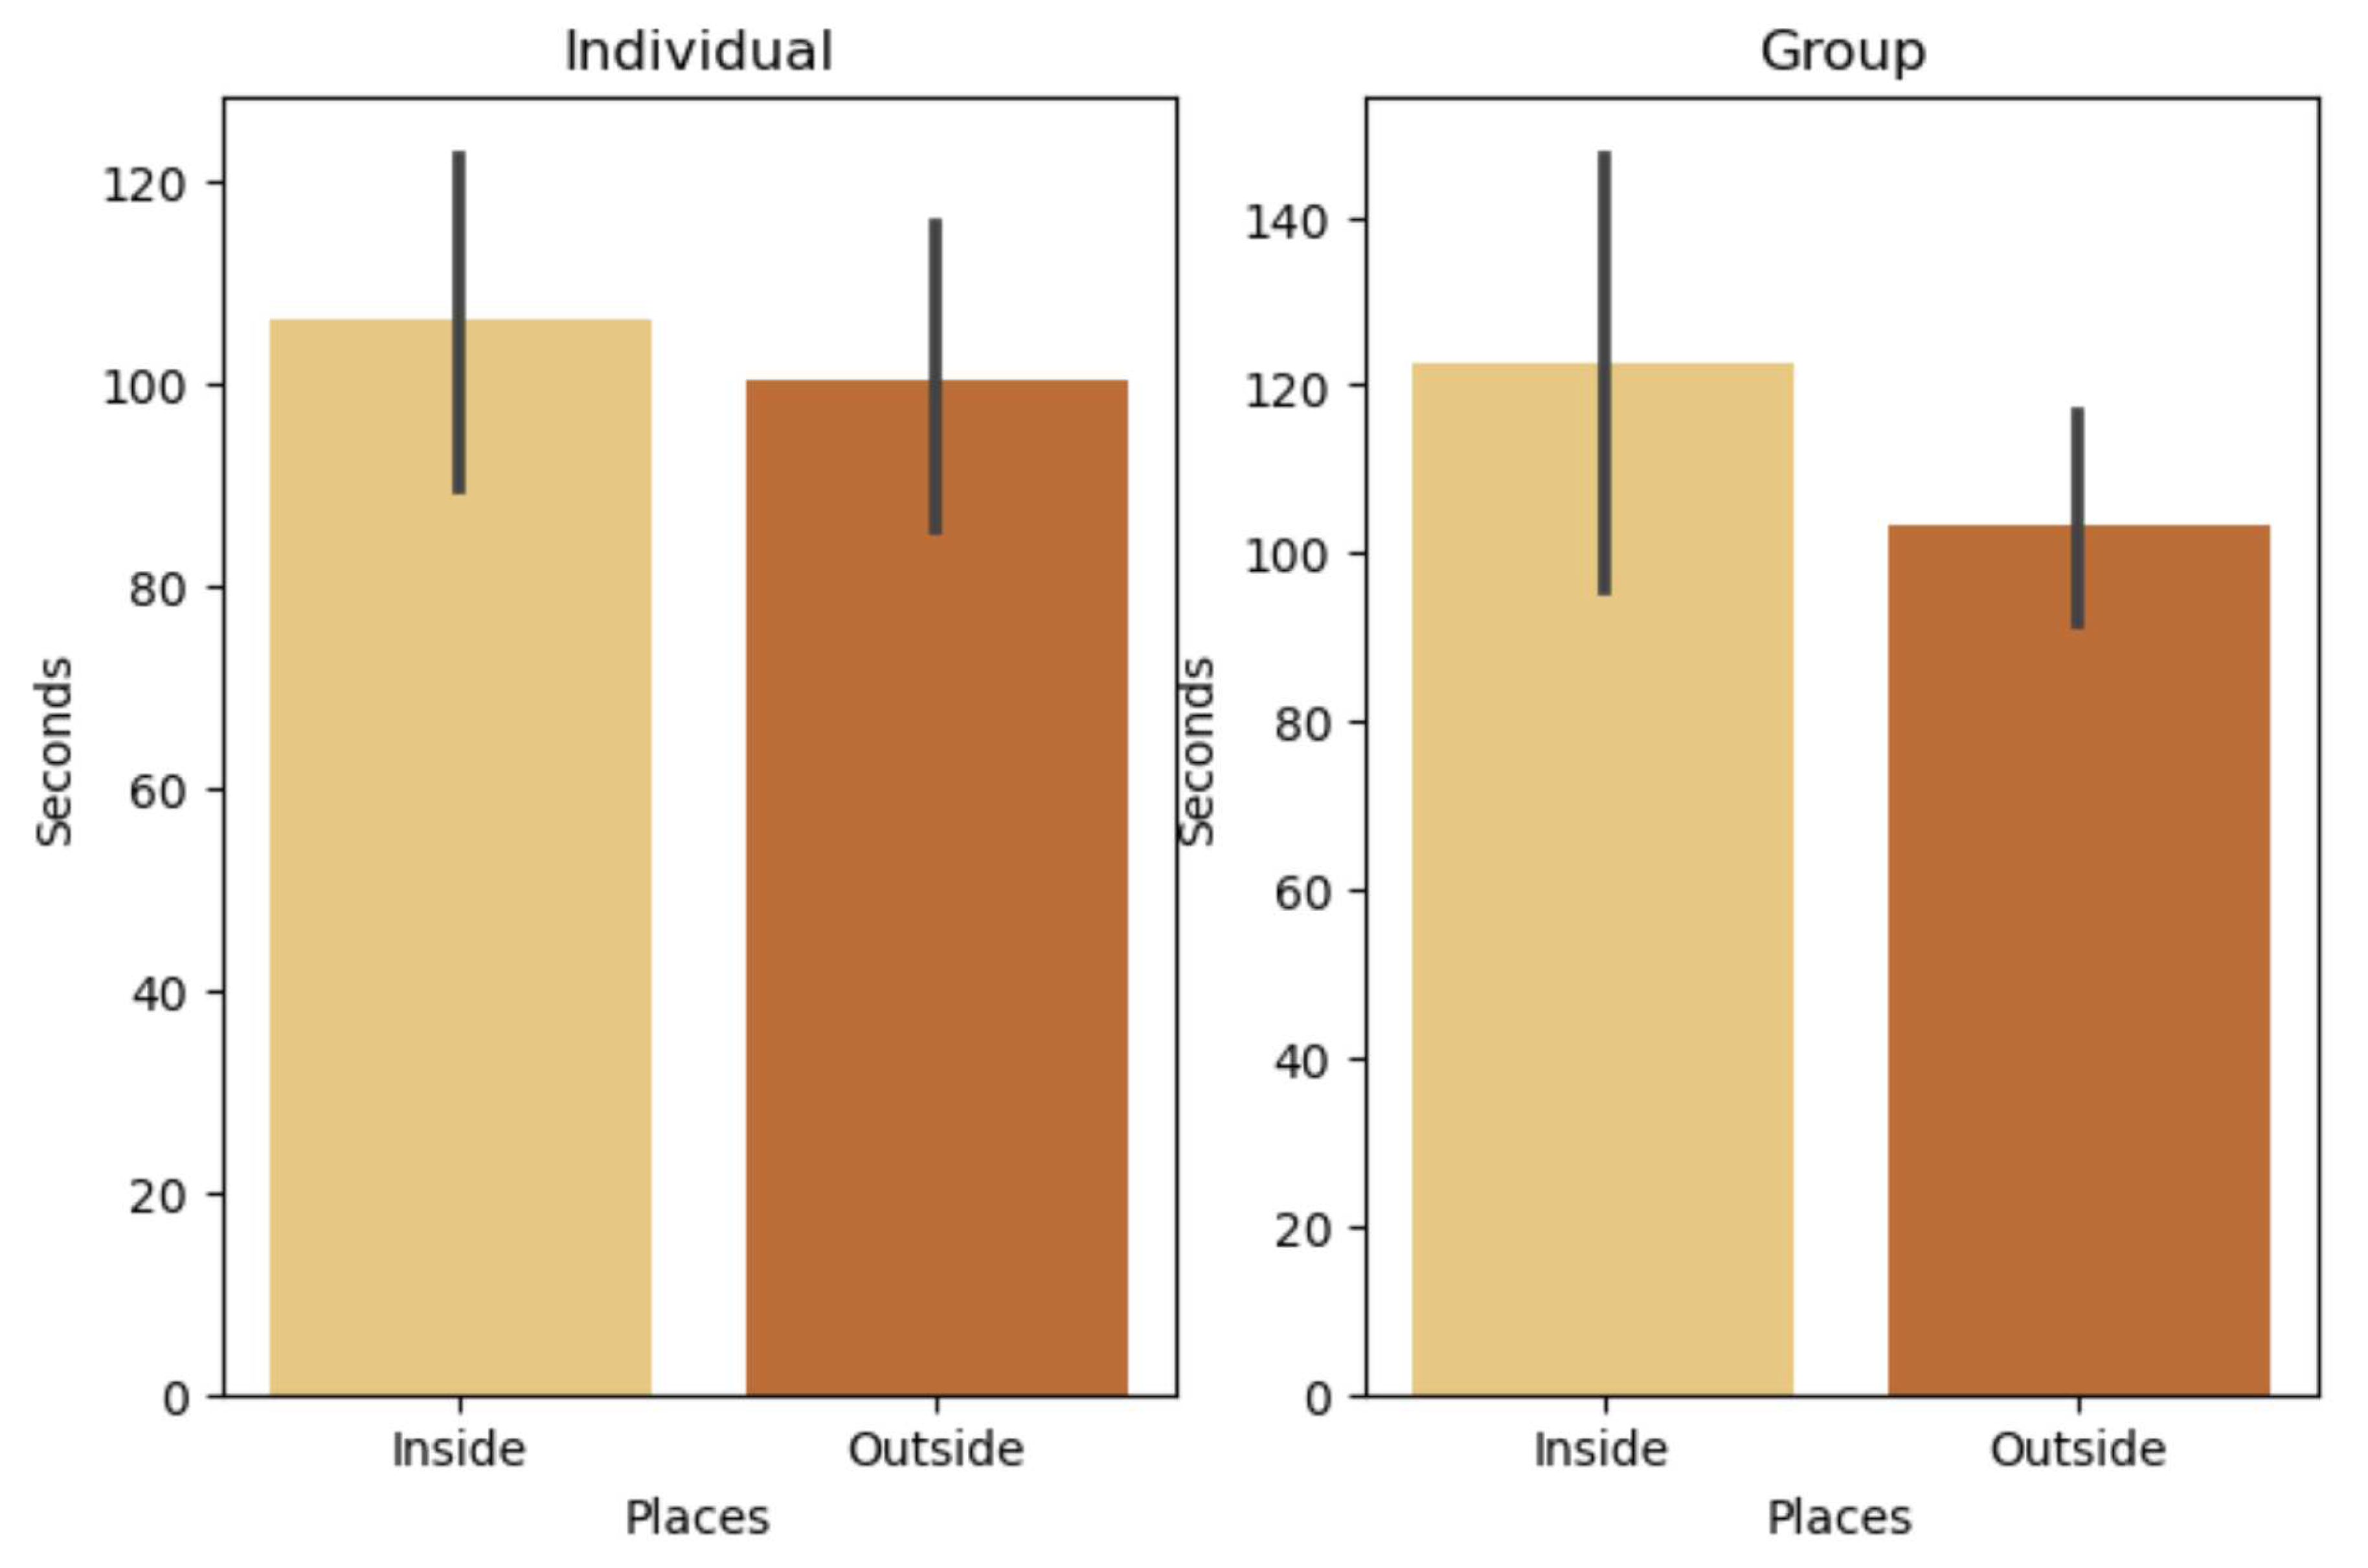
We start this analysis by looking at the productivity differences. We bisected the analysis in the individual and in the group games and compare both, to provide a comprehensive understanding of the factors that influence both individual and group productivity (see
Figure 7). Then we will compare the differences in team engagement and sentiments between outside and inside. Our two parameters that provide insights in productivity are total game time and number of moves. In the individual games, the participants needed on average 106.3 seconds inside and 100.3 seconds outside, which is a decrease of 5.64 percent. The number of moves is even closer, with 39.2 inside and 38.06, which is only a decrease of 2.89 percent. The groups needed a little bit longer in general, but with a more significant difference. 122.4 seconds on average inside and 103.2 seconds outside, which is a decrease of 15.68%. The number of moves differs only 0.32% with 30.4 on average inside and 30.8 outside. We therefore notice an improvement in outside playtime for both individual and group games. Additionally, while groups tend to need longer for games, they generally need fewer moves. In terms of the number of moves, there seems to be no difference between inside and outside.
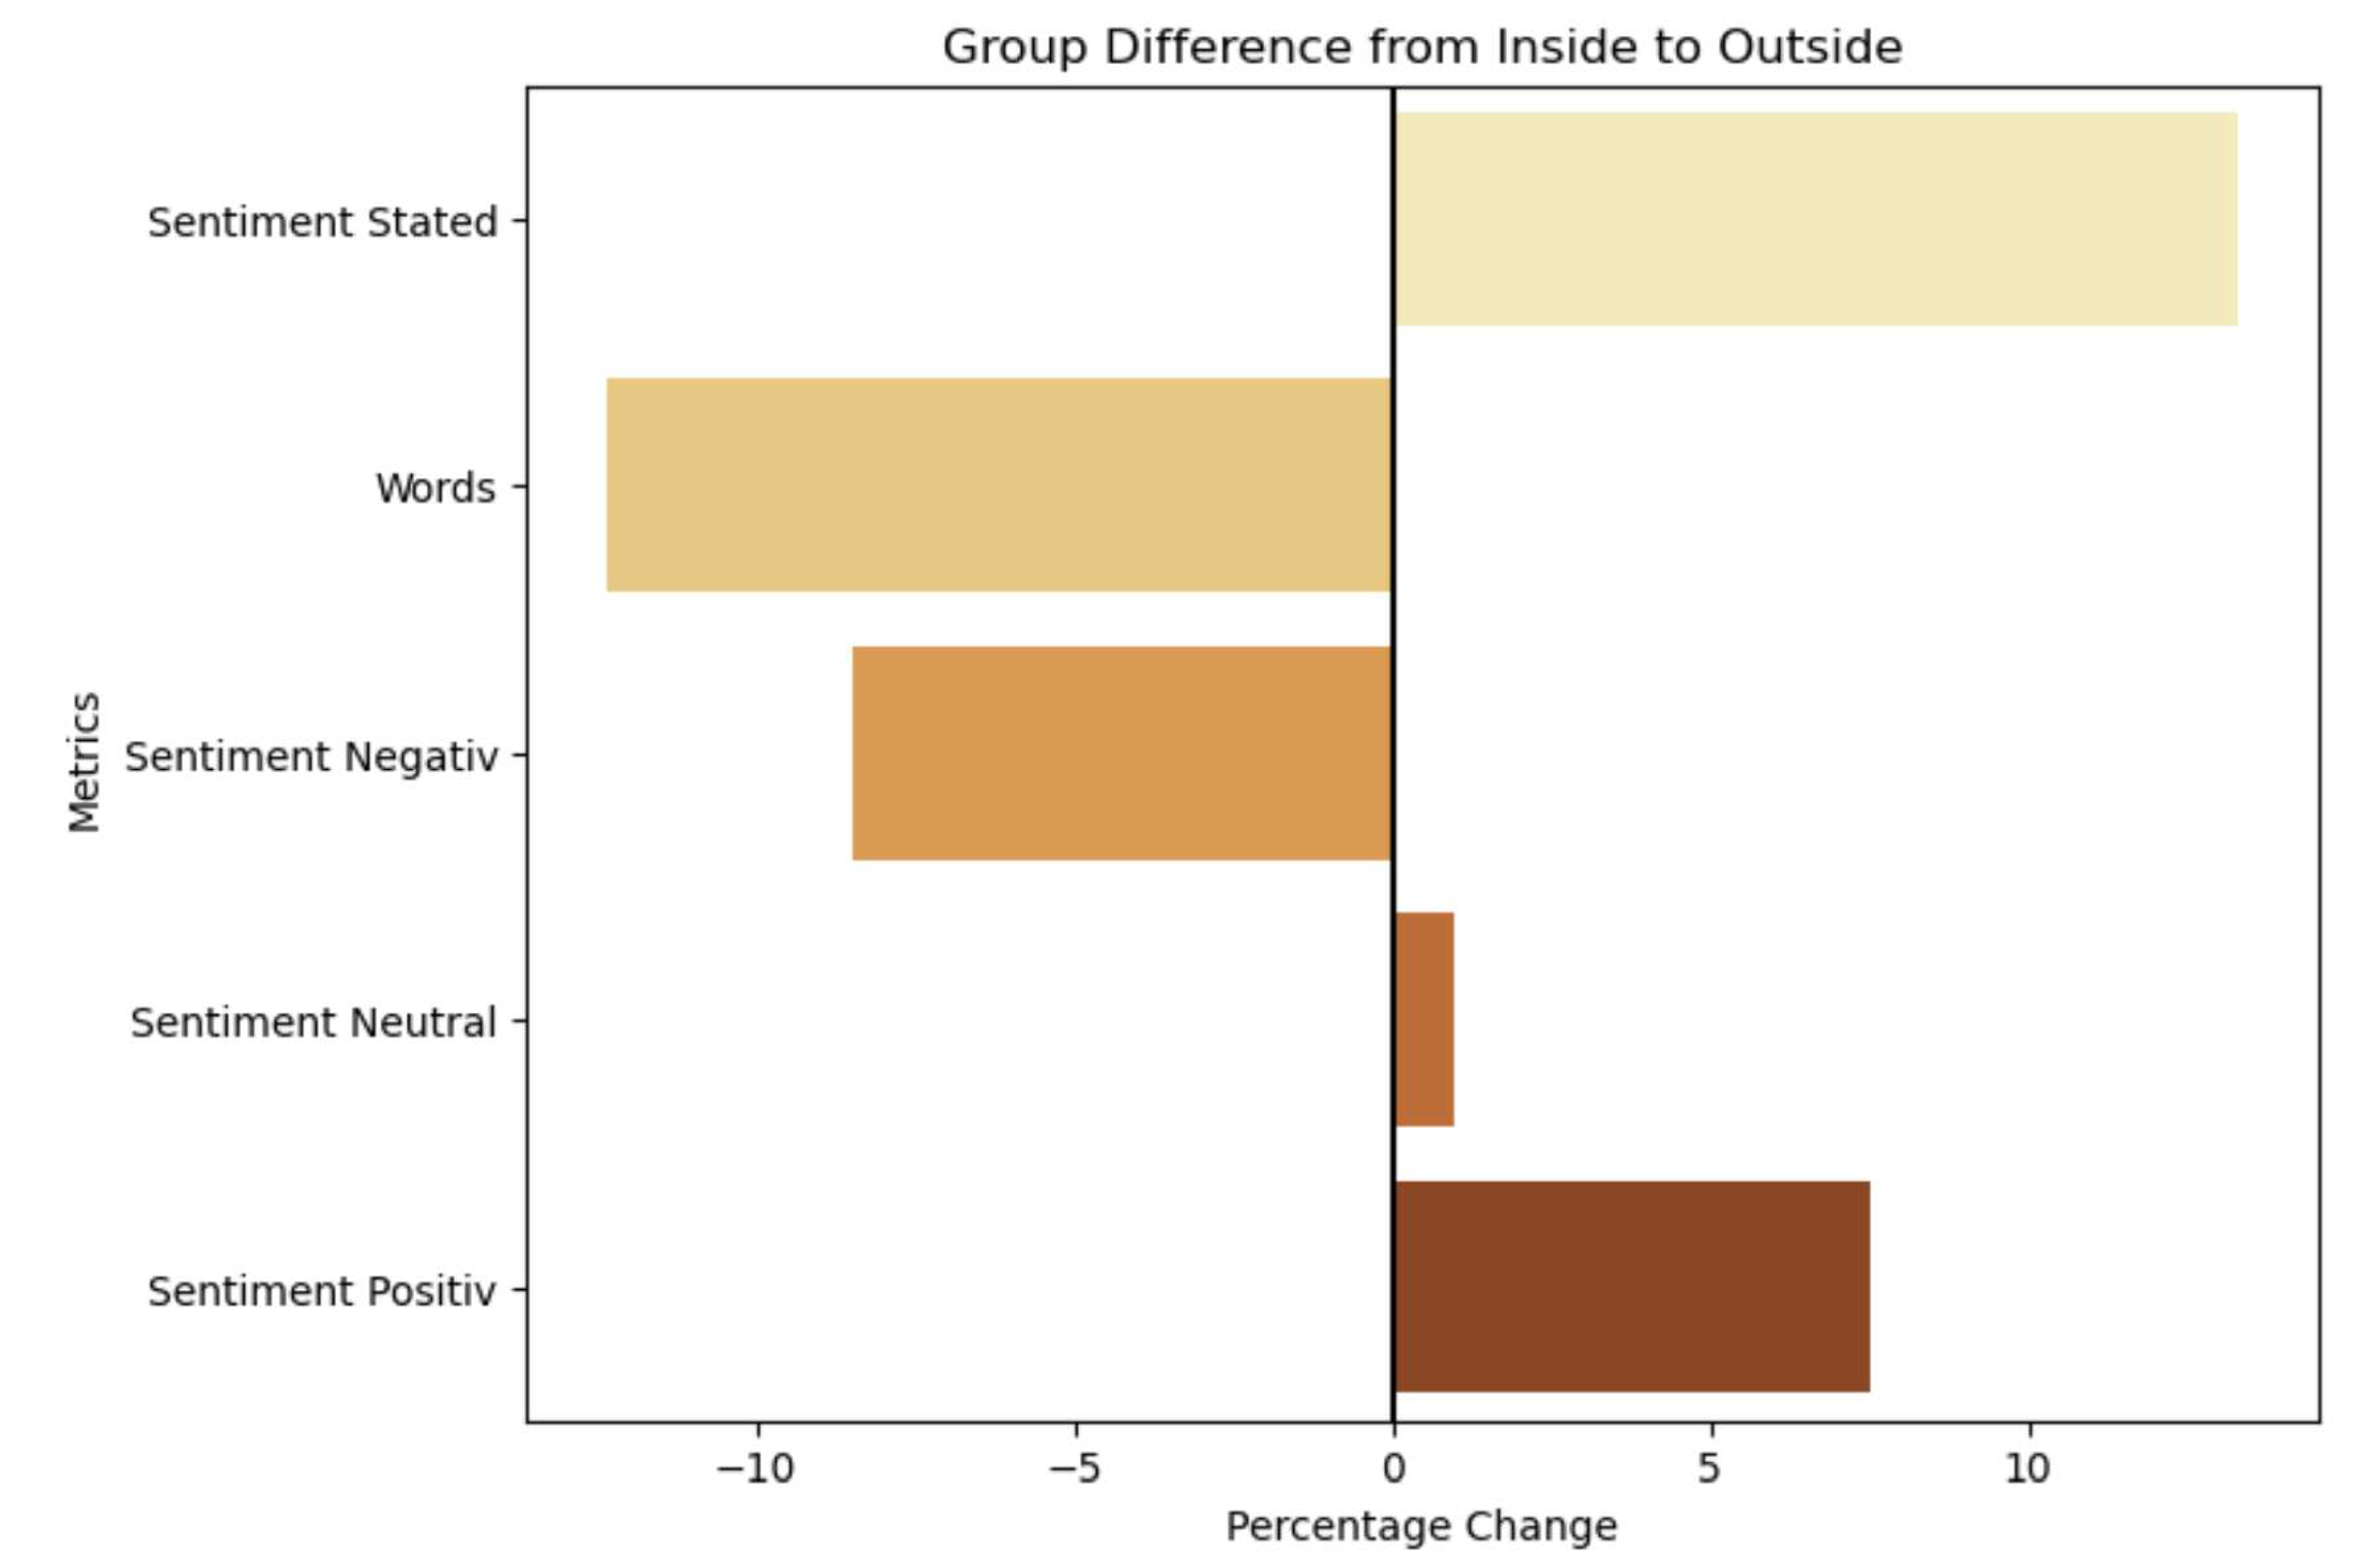
Next, we take a look at the sentiments and team engagement (
Figure 8). The self-stated sentiment improves drastically by 13.88% for the outside location. This also applies to the detected sentiment which improves by 7.51%, while the negative decreased by 8.46%. The measure of spoken words decreased by 12.33% from inside to outside. This data essentially show that the participants experienced a much better emotional state outside, as evidenced by both self-reported and audio-extracted emotional states. Interestingly, productivity also increased outside for groups even though they talked less to each other.
4.5.2. Testing for Significance
In alignment with the procedure outlined in Study 1, our initial step involved employing the Shapiro-Wilk test to unveil the underlying data distribution. As before, we used the Wilcoxon signed-rank test because it doesn’t require normally distributed data. Testing for significance between inside and outside data of the different metrics shows that self-stated sentiment as well as positive sentiment both vary significantly.
4.5.3. Answer to the Research Question
Can the presence of biophilic design elements in a work environment enhance productivity, team engagement, and overall sentiment?
We found a clear trend that in both the individual and the group games, the participants were faster, with the same number of moves. In addition, through both self-assessment and sentiment analysis of the conversations that took place, we answer the research question for the most part with YES. However, we were also able to show that the participants used fewer words outside. Therefore, we do not want to make a direct statement on whether the team engagement was better or worse. Because although fewer words were used outside, the data show that the participants were better at the game.
5. Discussion
The results observed in Study 1 met our assumptions and expectations. The study design was clear, and we were able to obtain enough data to apply a comprehensive analysis. However, there were also some results—such as for the emotions ‘Fear’ and ‘Surprise’—that showed an increase for pictures with more biophilic qualities and decrease for pictures with fewer biophilic qualities. This result is interesting as ‘Fear’ is clearly a negative connoted emotion. We researched a possible explanation for this observation.
As described in
Section 2.1 biophilic design involves not only the addition of plants and water but also refers to the ‘nature of the space’: geometrical qualities such as nested symmetries, colors, fractals, etc. Images that display some kind of peril like the New York Hearst Tower, or the Sir Duncan Rice Library in Aberdeen would be expected to trigger a surprised reaction more often than pictures of purely concrete facades. These might be reasons for the results that show a proportional increase of detected surprise for more biophilic design qualities found in a building.
A closer look at these two emotions (‘Fear’ and ‘Surprise’) and the respective facial expressions reveals that they are in a sense related to each other [
38]. Similarities might be large eyes, raised eyebrows, and an open mouth. When taking this into consideration, the detected ‘Fear’ might as well be a falsely detected ‘Surprise’. The lack of detected emotions other than ‘neutral’ made it important to interpret and assess results (such as these) carefully. This is the reason we decided not to rely too much on the results for ‘fear’ and ‘disgust’, as they were scarcely detected by our FER (Facial Emotion Recognition), being the two least detected emotions overall.
Those two emotions aside, with the results of our data sample, consisting of reactions for 15 architectural structures by 39 people, we are clearly able to answer our first initial research question: Does biophilic design in architecture trigger more positive emotions? Looking at the results for ‘happiness’ (positive), ‘sadness’ and ‘disgust’ (negative), and most of all ‘clicked emotions’ we can confidently say that biophilic design indeed fosters positive emotions, given that reducing negative emotions increases the presence of positive emotions.
We can even assume that this result holds true for a much larger sample, based on the significant results of the clicked emotions. Here, we could even make out significant differences between different amounts of biophilic qualities per picture, and were not only distinguishing a complete lack versus an abundance of them.
Overall, we achieved satisfying results with Study 1, adding to the overall findings of the positive impact of biophilic design. Study 2 yielded similar results. As in the first study, we could clearly make out tendencies for the productivity metrics to decrease when being immersed in a natural setup (
Figure 7 and
Figure 8). The time difference for groups when playing outside and inside was especially impressive to see, though this could not be observed in the individual cases. The difference in words used per locations might be explainable through a kind of flow state, which would be another indicator for improved productivity. However, none of these differences turned out to be significant outside of our data sample. The only thing we were able to show was the positive impact on the sentiment once again, although we were not able to show any correlation between productivity and sentiment within our correlation analysis.
This might be a good point to start further research on this topic. The research question: Does the presence of nature improve productivity? could be answered positively when considering our small data sample. However, we were not able to prove that these results apply on a more general level.
6. Limitations and Future Work
For the first study reported here, the main limitation was the lack of facial expressions of the study participants. This is hard to avoid without changing the complete study design, for example to visiting architectural structures in real life with a group of people. This would probably increase the detectable emotions through a shared, more immersive experience, but this option exceeds our means. Furthermore, our test group proved to be very homogenous, which makes it harder to draw generalized conclusions.
This limitation holds true even more for Study 2, as the increased effort of joining our study at real-life locations made it hard to get people to participate. Additionally, the chosen productivity and team engagement measures might need some reworking, as playing a game of memory does have a huge training effect. We tried to counter this possible bias by alternating each group’s starting position (either inside or outside), but there might be better solutions. The memory game also did not animate the study subjects to communicate like we expected it would. In a time relevant game, sentences like ‘yes’ or ‘no’ are often used and the NLP (Natural-Language-Processing) model used sees those as incomplete, hence detects them as negative. Therefore, another game choice might return better results here.
While we did encounter certain limitations in the course of our project, we are optimistic that the results will serve as a source of inspiration for future research endeavors. With a better FER (Facial Emotion Recognition) setup, or even a real-life application of Study 1, the outcome might prove to yield more generalizable and insightful results. Moreover, the number of images used could be expanded, making it possible to compare the effect of individual biophilic design qualities with one another. For Study 2 future research could target the collection of more data from around 30–40 test subjects in order to produce significant results. It might also be worthwhile to test other productivity measurements instead of only using one task per location. Lastly, it’s worth considering the possibility of expanding the range of locations, perhaps including locations that incorporate different numbers of biophilic design qualities.
7. Conclusions
This project conducted two separate studies to measure the impact of biophilic design on human beings in various ways. As most related work targets the well-being and health aspects related to this design approach, our goal was to measure the emotions evoked through confronting biophilic design confrontation, as well as the difference in productivity depending on one’s immediate environment. Our results showed that biophilic design indeed enhanced positive emotions and productivity, supporting the overall consensus in this research domain of the positive and important impact of biophilic design.
Author Contributions
Methodology, T.R., M.W., T.O., P.G. and N.S.; Software, T.R., M.W. and T.O.; Formal analysis, T.R., M.W., T.O.; Investigation, P.G., N.S.; Data curation, T.R., M.W., T.O.; Writing—original draft, T.R., M.W. and T.O.; Writing—review & editing,T.R., M.W., T.O., P.G. and N.S. All authors have read and agreed to the published version of the manuscript.
Funding
This research received no external funding.
Conflicts of Interest
The authors declare no conflict of interest.
Sample Availability
Samples of the compounds ... are available from the authors.
Appendix A
Table A1.
Chosen images and their respective BDPs.
Table A1.
Chosen images and their respective BDPs.
| Building |
Biophilic Design Patterns |
| New York Grand Central Terminal |
P8, P10, P11 |
| New York Hearst Tower |
P11, P14 |
| Sir Duncan Rice Library, University of Aberdeen |
P8, P10, P14 |
| KU Leuven Central Library, Antwerp |
P9, P10, P12 |
| Royal Children’s Hospital Melbourne |
P1, P2, P10 |
| Stockholm White Mountain Office (1) |
P1, P2, P6, P9 |
| Stockholm White Mountain Office (2) |
P3, P6, P9, P13 |
| Madrid Selgascano Architecture Office |
P1, P6, P7, P12 |
| UP Ipswich Library, University of Queensland, Brisbane |
P1, P2, P7, P11 |
| Community Hospital of the Monterey Peninsula |
P1, P2, P3, P5, P7, P10, P13 |
| Museu Nacional da Republica Brasilia |
- |
| Cologne University Library |
- |
| Hachioji Library, Tama Art University, Hachioji |
- |
| Biblioteca Nacional de Brasilia |
- |
| Jakarta Ogilvy Office |
- |
Figure A1.
Images used in Study 1.
Figure A1.
Images used in Study 1.
References
- Wilson, E. Biophilia; Harvard University Press: Cambridge, 1984. [Google Scholar] [CrossRef]
- Kellert, S.; Heerwagen, J.; Mador, M. Biophilic Design: The Theory, Science and Practice of Bringing Buildings to Life; 2008. [Google Scholar]
- Salingaros, N. Biophilia and Healing Environments. Healthy Principles for Designing the Built World; 2015. [Google Scholar]
- Salingaros, N. The Biophilic Index Predicts Healing Effects of the Built Environment; 2019. [Google Scholar]
- Mehaffy, M.; Salingaros, N. Design for a Living Planet; 2015. [Google Scholar]
- Dovjak, M.; Kukec, A. Creating Healthy and Sustainable Buildings: An Assessment of Health Risk Factors; 2019. [Google Scholar] [CrossRef]
- Altomonte, S.; Allen, J.; Bluyssen, P.; Brager, G.; Heschong, L.; Loder, A.; Veitch, J.; Wang, L.; Wargocki, P. Ten Questions Concerning Well-Being in the Built Environment. 2020. [Google Scholar] [CrossRef]
- Tarek, S.; Ouf, A. Biophilic Smart Cities: The Role of Nature and Technology in Enhancing Urban Resilience. 2021. [Google Scholar] [CrossRef]
- Allam, Z.; Takun, Y. Rethinking Smart Cities; 2022. [Google Scholar]
- Louv, R. What Is Nature-Deficit Disorder; 2029. [Google Scholar]
- Kellert, S. Nature by Design: The Practice of Biophilic Design; 2018. [Google Scholar]
- Silkin, L. Biophilic Design and the Workplace. 2021. (accessed on 1 September 2023).
- Rhee, J.H.; Schermera, B.; Chac, S.H. Effects of Indoor Vegetation Density on Human Well-Being for a Healthy Built Environment; 2023. [Google Scholar] [CrossRef]
- Allen, J.G.; MacNaughton, P.; Laurent, J.G.C.; Flanigan, S.S.; Eitland, E.S.; Spengler1, J.D. Green Buildings and Health; 2015. [Google Scholar] [CrossRef]
- Salingaros, N.A. Neuroscience Experiments to Verify the Geometry of Healing Environments; 2020. [Google Scholar] [CrossRef]
- Lavdas, A.; Salingaros, N. Can suboptimal visual environments negatively affect children’s cognitive development? 2021. [Google Scholar] [CrossRef]
- Browning, W.; Ryan, C.O.; Clancy, J. 14 Patterns of Biophilic Design: Improving Health and Well-Being in the Built Environment; 2014. [Google Scholar]
- Salingaros, N. Rules for Urban Space: Design Patterns Create the Human Scale. 2021. (accessed on 1 September 2023).
- Appleton, J. The Experience of Landscape, revised ed.; 1996. [Google Scholar]
- Appleton, J. Prospects and Refuges Re-Visited; 1984. [Google Scholar] [CrossRef]
- Dosen, A.; Ostwald, M. Evidence for Prospect-Refuge Theory: A Meta-Analysis of the Findings of Environmental Preference Research; 2016. [Google Scholar] [CrossRef]
- Alexander, C.; Ishikawa, S.; Silverstein, S.; Jacobson, M.; Fiksdahl-King, I.; Angel, S. A Pattern Language; 1977. [Google Scholar]
- Lavdas, A.A.; Salingaros, N.A. Architectural Beauty: Developing a Measurable and Objective Scale; 2022. [Google Scholar] [CrossRef]
- Salingaros, N.A. Happiness and Biophlic Urban Geometry; 2021. [Google Scholar]
- Darby, A.P.; Natarajan, S.; Coley, D. Impact of Sustainable Building Design on Occupant Experience: A Human Centred Approch; 2019. [Google Scholar]
- Hu, M.; Simon, M.; Fix, S.; Vivino, A.A.; Bernat, E. Exploring a Sustainable Building’s Impact on Occupant Mental Health and Cognitive Function in a Virtual Environment; 2021. [Google Scholar]
- React, M.O.S. React the Library for Web and Native User Interfaces. 2023. Available online: https://react.dev (accessed on 12 May 2023).
- Community, R.W. React Webcam—Webcam component for React. 2023. Available online: https://github.com/mozmorris/react-webcam (accessed on 22 May 2023).
- Google, I. Firebase. Products and Solutions for Every Stage of Your App Development Journey. 2023. Available online: https://firebase.google.com (accessed on 7 August 2023).
- Py-Feat, C. Py-Feat: Python Facial Expression Analysis Toolbox. 2023. Available online: https://py-feat.org/pages/intro.html (accessed on 16 July 2023).
- Pham, L.; Vu, T.H.; Tran, T.A. Facial Expression Recognition Using Residual Masking Network. 2021. [Google Scholar] [CrossRef]
- Ko, J.; Alon, D. GoEmotions: A Dataset for Fine-Grained Emotion Classification; 2021. [Google Scholar]
- Memozor. Memory—Matching Game for Adults. 2022. Available online: https://www.memozor.com/memory-games/for-adults/black-and-white-1 (accessed on 9 August 2023).
- Bredin, H.; Yin, R.; Coria, J.M.; Gelly, G.; Korshunov, P.; Lavechin, M.; Fustes, D.; Titeux, H.; Bouaziz, W.; Gill, M.P. Pyannote.Audio: Neural Building Blocks for Speaker Diarization; 2020. [Google Scholar] [CrossRef]
- Bredin, H.; Laurent, A. End-to-End Speaker Segmentation for Overlap-Aware Resegmentation; 2021. [Google Scholar]
- Radford, A.; Kim, J.W.; Xu, T.; Brockman, G.; McLeavey, C.; Sutskever, I. Robust Speech Recognition via Large-Scale Weak Supervision. arXiv 2022, arXiv:2212.04356. [Google Scholar]
- Guhr, O.; Schumann, A.K.; Bahrmann, F.; Böhme, H.J. Training a Broad-Coverage German Sentiment Classification Model for Dialog Systems; 2020. [Google Scholar]
- Revina, I.; Emmanuel, W.S. A Survey on Human Face Expression Recognition Techniques; 2018. [Google Scholar] [CrossRef]
|
Disclaimer/Publisher’s Note: The statements, opinions and data contained in all publications are solely those of the individual author(s) and contributor(s) and not of MDPI and/or the editor(s). MDPI and/or the editor(s) disclaim responsibility for any injury to people or property resulting from any ideas, methods, instructions or products referred to in the content. |
© 2023 by the authors. Licensee MDPI, Basel, Switzerland. This article is an open access article distributed under the terms and conditions of the Creative Commons Attribution (CC BY) license (http://creativecommons.org/licenses/by/4.0/).
