1. Introduction
With the recent shift in mobility, which was used as a means of transportation, automated vehicles are accelerating the paradigm shift to future cars with the latest technologies that can significantly change the way drivers drive, the driving behavior itself, and the user behavior. These automated vehicles are divided into six stages according to the roles of users and automation systems (response to emergency situations while driving, monitoring the surrounding environment, and the subject of control or driving responsibility). According to Society of Automotive Engineers (SAE) [
1] criteria, level 3 of automated driving is a conditional driving automation stage that can be entrusted to the system installed in the vehicle to a certain extent, such as perception, judgment, and maneuvering during driving. During automated driving, the driver can take their hands off the wheel, allowing them to drive in a comfortable position. In addition, conditional eye-off, which is the biggest difference from automated driving levels 1 and 2, it is possible to use a smartphone, operate a navigation screen, or watch a movie while driving. However, even when the driving automation system is in operation, the driver must be in a condition to immediately return to driving on behalf of the system at any time if the system requests driver intervention because continuous automated driving is not possible due to vehicle factors such as sensor or system instability or failure and driving environment factors such as sharp curves or road obstacles. Like this, transition from automated driving by the system to manual driving by the driver is called the driver control transition. If a problem occurs in this process, the possibility of a gap or incompleteness occurring in the control subject increases, leading to a traffic accident. According to the automated driving disengagement report of the California Department of Motor Vehicles (DMV) (December 2017 to November 2019), a total of 33 companies reported a total of 106,714 incidents, with driver factors accounting for about 53%, vehicle factors accounting for about 46%, and other external environmental factors accounting for about 1% [
2]. The possibility of a traffic accident is relatively low if the driver determines that it is safe and requests to switch from manual driving to automated driving. However, in the opposite case, the physical and cognitive state of the driver becomes an important variable in the safety of the control transition when the system switches from automated driving to manual driving with an intervention request. In other words, it can be said that it is safe only when the driving control authority is converted in an appropriate state for the driver to drive. If a driver was transferred control from a unstable or inappropriate state, the ability to recognize and respond to changes in surrounding traffic conditions decreases and the ability to cope with situations increases the likelihood of a traffic accident.
In this paper, we proposed a convolutional neural network (CNN) algorithm-based driver state monitoring system that uses multi-sensor data as input, including driver's face image, biometric information, and vehicle behavior information. The probability of drowsiness is calculated for each of the four time periods using a convolutional neural network (CNN) based on ToF camera-based eye blinking, ECG information (pulse) embedded in the steering wheel, and vehicle information (steering angle data). Through this system, it is possible to minimize human errors that may occur when switching control by monitoring the state of an inappropriate driver in real time and warning the driver in case of danger.
The rest of the paper is organized as follows. In
Section 2, we investigated and analyzed driver state monitoring systems, which are essential for automated driving control transition, through conventional research.
Section 3 describes the multi-sensor fusion data-based CNN algorithm for driver state monitoring system. It describes the main sensor configuration of the system and the proposed CNN algorithm.
Section 4 presents the analysis of simulation results, a comparison with existing studies, to demonstrate the validity of the proposed algorithm and discusses improvements and enhancements.
Section 5 discusses the conclusions, limitations, and considerations of this paper.
2. Related Work
In order to safely transfer control in unexpected situations during automated driving, it is necessary to clearly communicate and recognize driving status information, operating status information, emergency situation information, and control transfer request information to the driver. However, first and foremost, it is necessary to transfer control by consideration the driver state. This is because if the driver does not respond within a certain period of time after the automated driving system requests the transfer of control, it should automatically conduct minimal risk maneuver (MRM) from then on. This is closely related to the driver factor, which is one of the before mentioned disabling factors for automated driving. In this regard, techniques for monitoring driver state in real time can be broadly categorized into detecting changes in driver behavior, physiological responses, and vehicle interior environment and behavior [
3,
4,
5]. Typically, driver behavior is a physical change that occurs naturally in the process of drowsiness, such as head shaking, driver's facial movement, the frequency of eye closure and yawning, pupil focus, and pupil movement. Driver physiological responses include electrocardiogram, oxygen saturation, and EEG, and changes in vehicle cabin environment and behavior include the amount of carbon dioxide in the vehicle, the number and width of steering adjustments, and changes in lateral position due to steering wheel maneuvers [
6]. Mbouna et al.[
7] continuously monitored the driver's eye condition and head pose in the vehicle and classified them as warning or non-warning events using Support Vector Machine (SVM) technique using features of eye index, pupil activity, and head pose. The head pose provides useful information about inattention when the driver's eyes are not visible. Experiments with people of different races and genders in real-world road driving conditions demonstrated low error and high warning accuracy. S. Maralappanavar et al. [
8] used driver gaze estimation to determine driver distraction behaviors such as talking on a cell phone and talking to bystanders while driving, and showed a gaze detection accuracy of about 75%. F. Vicente et. al [
9] proposed a camera-based system consisting of facial feature tracking, head pose and gaze estimation, and 3D geometric inference to detect Eyes off the road (EOR). O. Kopuklu et al. [
10] proposed an open set recognition approach for driver state monitoring applications, which is a contrastive learning approach to learn metrics to distinguish between normal and abnormal driving. To this end, they constructed a video-based benchmark, the Driver Anomaly Detection (DAD) dataset. It contains training sets for normal and abnormal driving. We experimented with a 3D CNN structure and found that it performs similarly to the ResNet-18 model but requires 11 times fewer parameters and 13 times less computation. M. Sabet et al. [
11] used Haar feature algorithm for eye and face detection and SVM for drowsiness classification using closed and open eye images, and A. George et al. [
12] used CNN for gaze direction classification. F. Zhang et al. [
13] proposed a CNN-based eye state recognition method using infrared images to detect fatigue by calculating PERCLOS and eye blink frequency. M. Awais et al. [
14] proposed a method to improve driver drowsiness detection performance by combining EEG and ECG and using SVM classifier. G. Zhenhai et al. [
15] proposed a novel driver drowsiness detection method based on time series analysis of steering wheel angular velocity. For this purpose, steering behavior was analyzed under fatigue over time. Meanwhile, J. G. Gaspara et al. [
16] conducted a study to evaluate the effectiveness of warnings against lane departure due to drowsiness. They tested a total of 72 young adult drivers (21-32 years old) and found that multi-stage warnings were more effective than single-stage discrete alerts in reducing drowsy lane departures.
3. Driver State Monitoring System
The driver state monitoring system consists of an input section to collect video, biometric, and vehicle information, a processing section to determine the driver state (drowsiness) based on multi-sensor data, and an output section to provide a danger warning to the driver based on the determined results. The input part consists of a ToF camera for acquiring the driver's face image inside the vehicle, 12 capacitive sensors and 1 capacitive ECG sensor embedded in the steering wheel, and a device for collecting the driver's steering angle data through in vehicle network (IVN). The proposed CNN algorithm based on multi-sensor fusion data determines the drowsiness status and warns the driver with video and audio.
3.1. Configuration Overview
3.1.1. ToF camera
The ToF camera is a Meere company product with a center wavelength of 955nm, VGA-grade (640*480), 30fps, a detection effective range of 0.2~1.8m and is mounted on the top of the steering column to collect images of the driver's face in real time.
Figure 1.
ToF camera Design and Installation.
Figure 1.
ToF camera Design and Installation.
Table 1.
ToF camera specification
Table 1.
ToF camera specification
| Item |
Specification |
| Operation range |
0.2 ~ 1.5m |
| Illuminator |
2W-2VCSEL |
| Depth resolution |
VGA(640 x 480) |
| Field of view |
122°(D) x 76°(V) x 100°(H) |
| Frame rate |
30fps |
| Dimension |
60mm(H) x 28mm(V) x 34mm(D) |
3.1.2. HoD(Hand on Detection) sensor
The steering wheel is equipped with a capacitive sensor 12ch and a capacitive ECG sensor 1ch(
Figure 2 and
Table 2), which can detect changes in pulse, a bio-signal, as well as whether the driver makes contact with the steering wheel while driving.
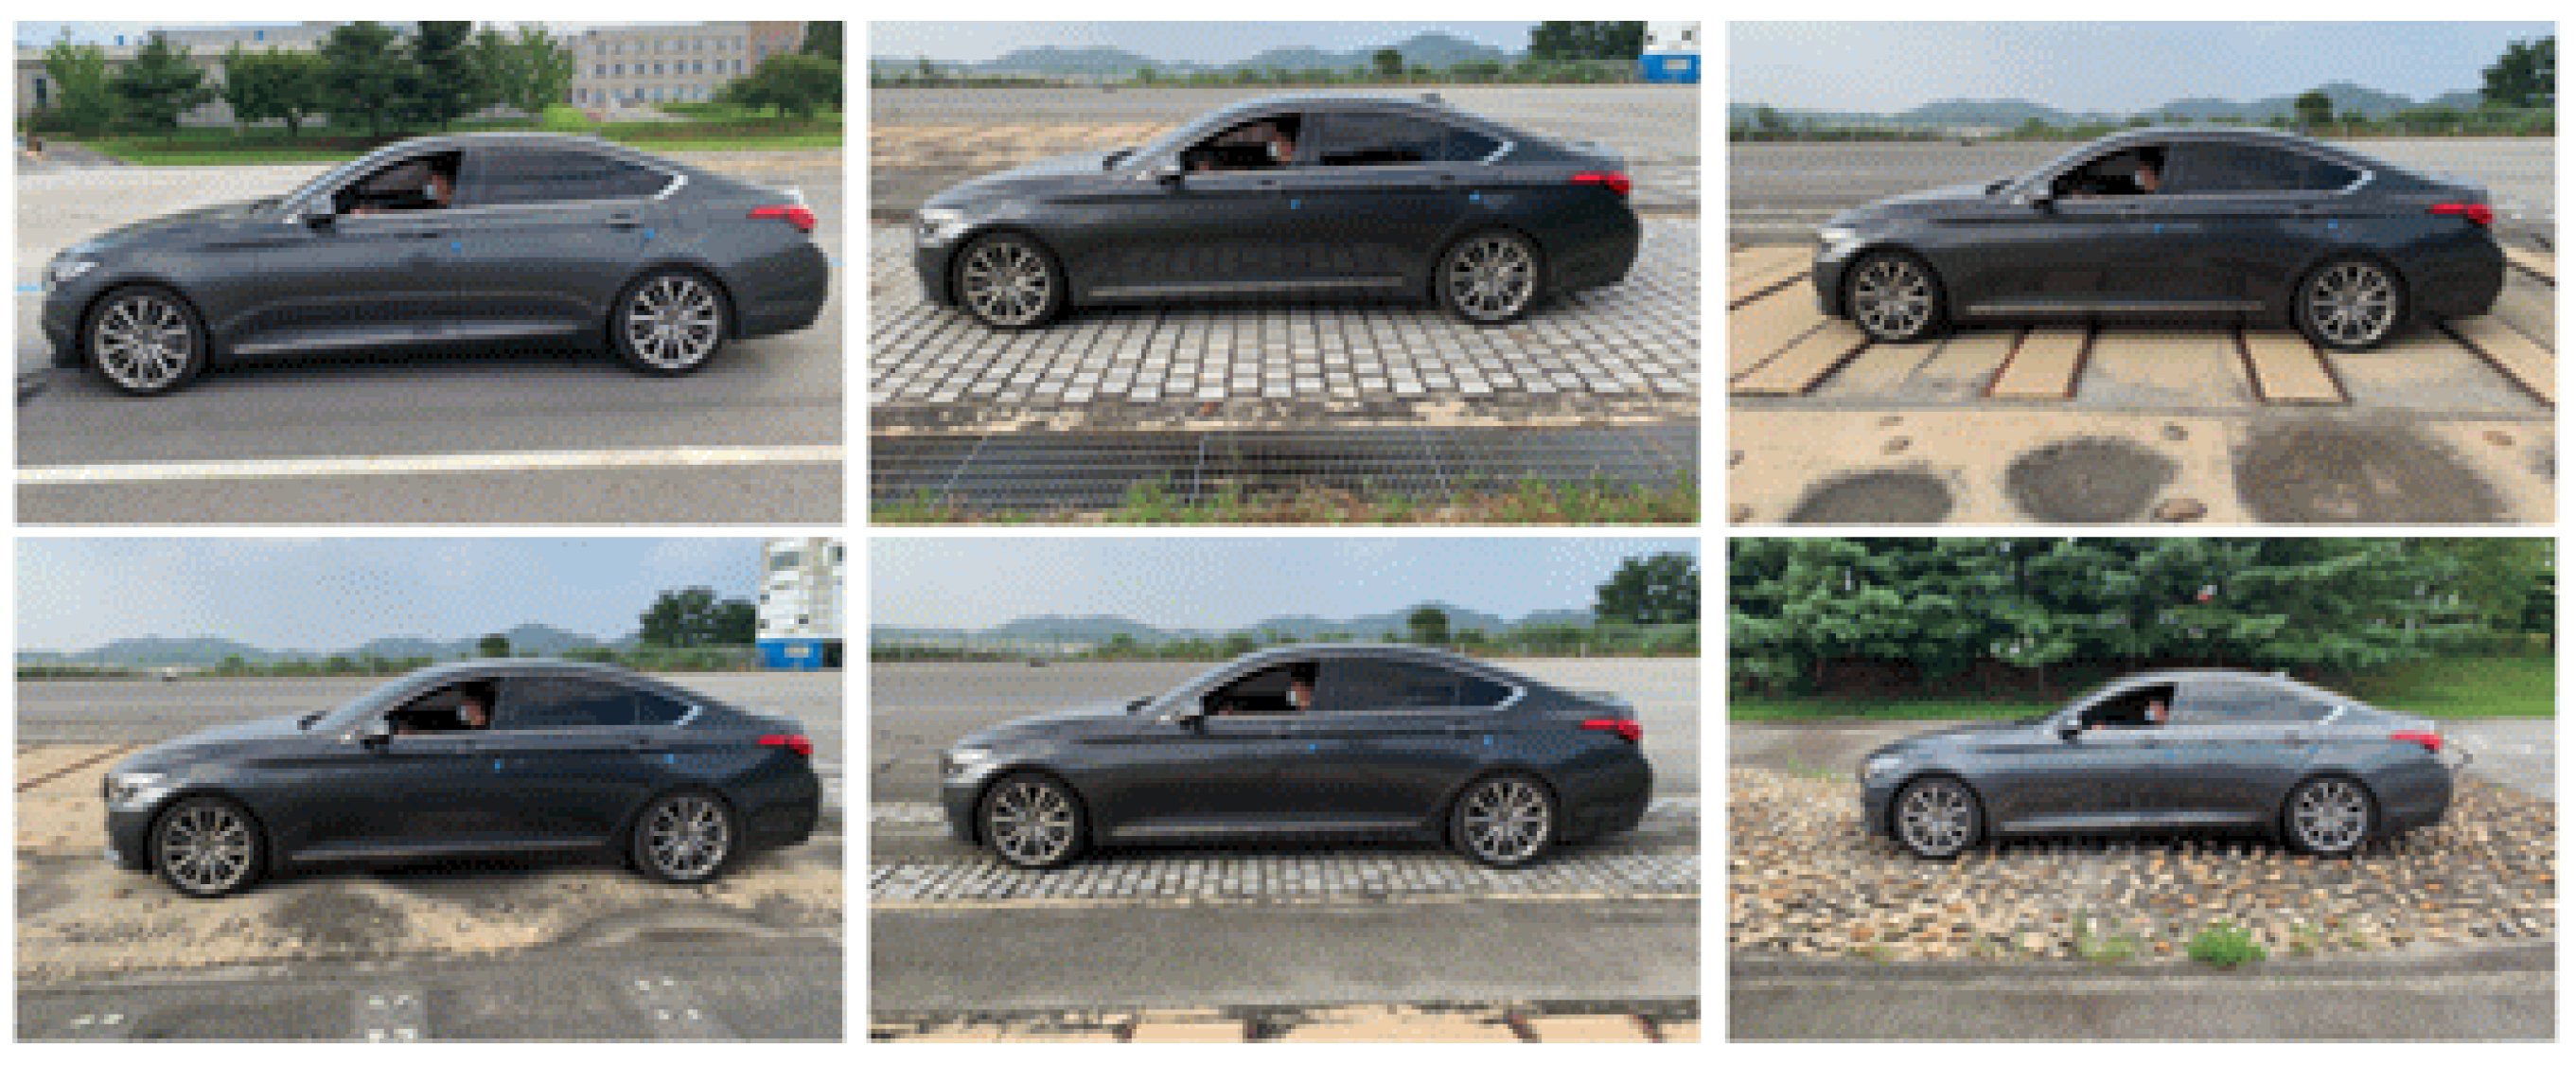
We measured the recognition rate of steering wheel grip (contact) in various road conditions (straight, Belgian, gravel road, etc.) as shown in
Figure 3 by installing HoD sensors in real cars, and the average rate was 97.4%.
3.2. Method
The overall framework of the proposed driver state monitoring system is shown in
Figure 4. The process of determining the probability of driver drowsiness by applying a CNN algorithm based on multi-sensor fusion data from data collection for artificial intelligence learning is described.
3.2.1. Dataset for AI training
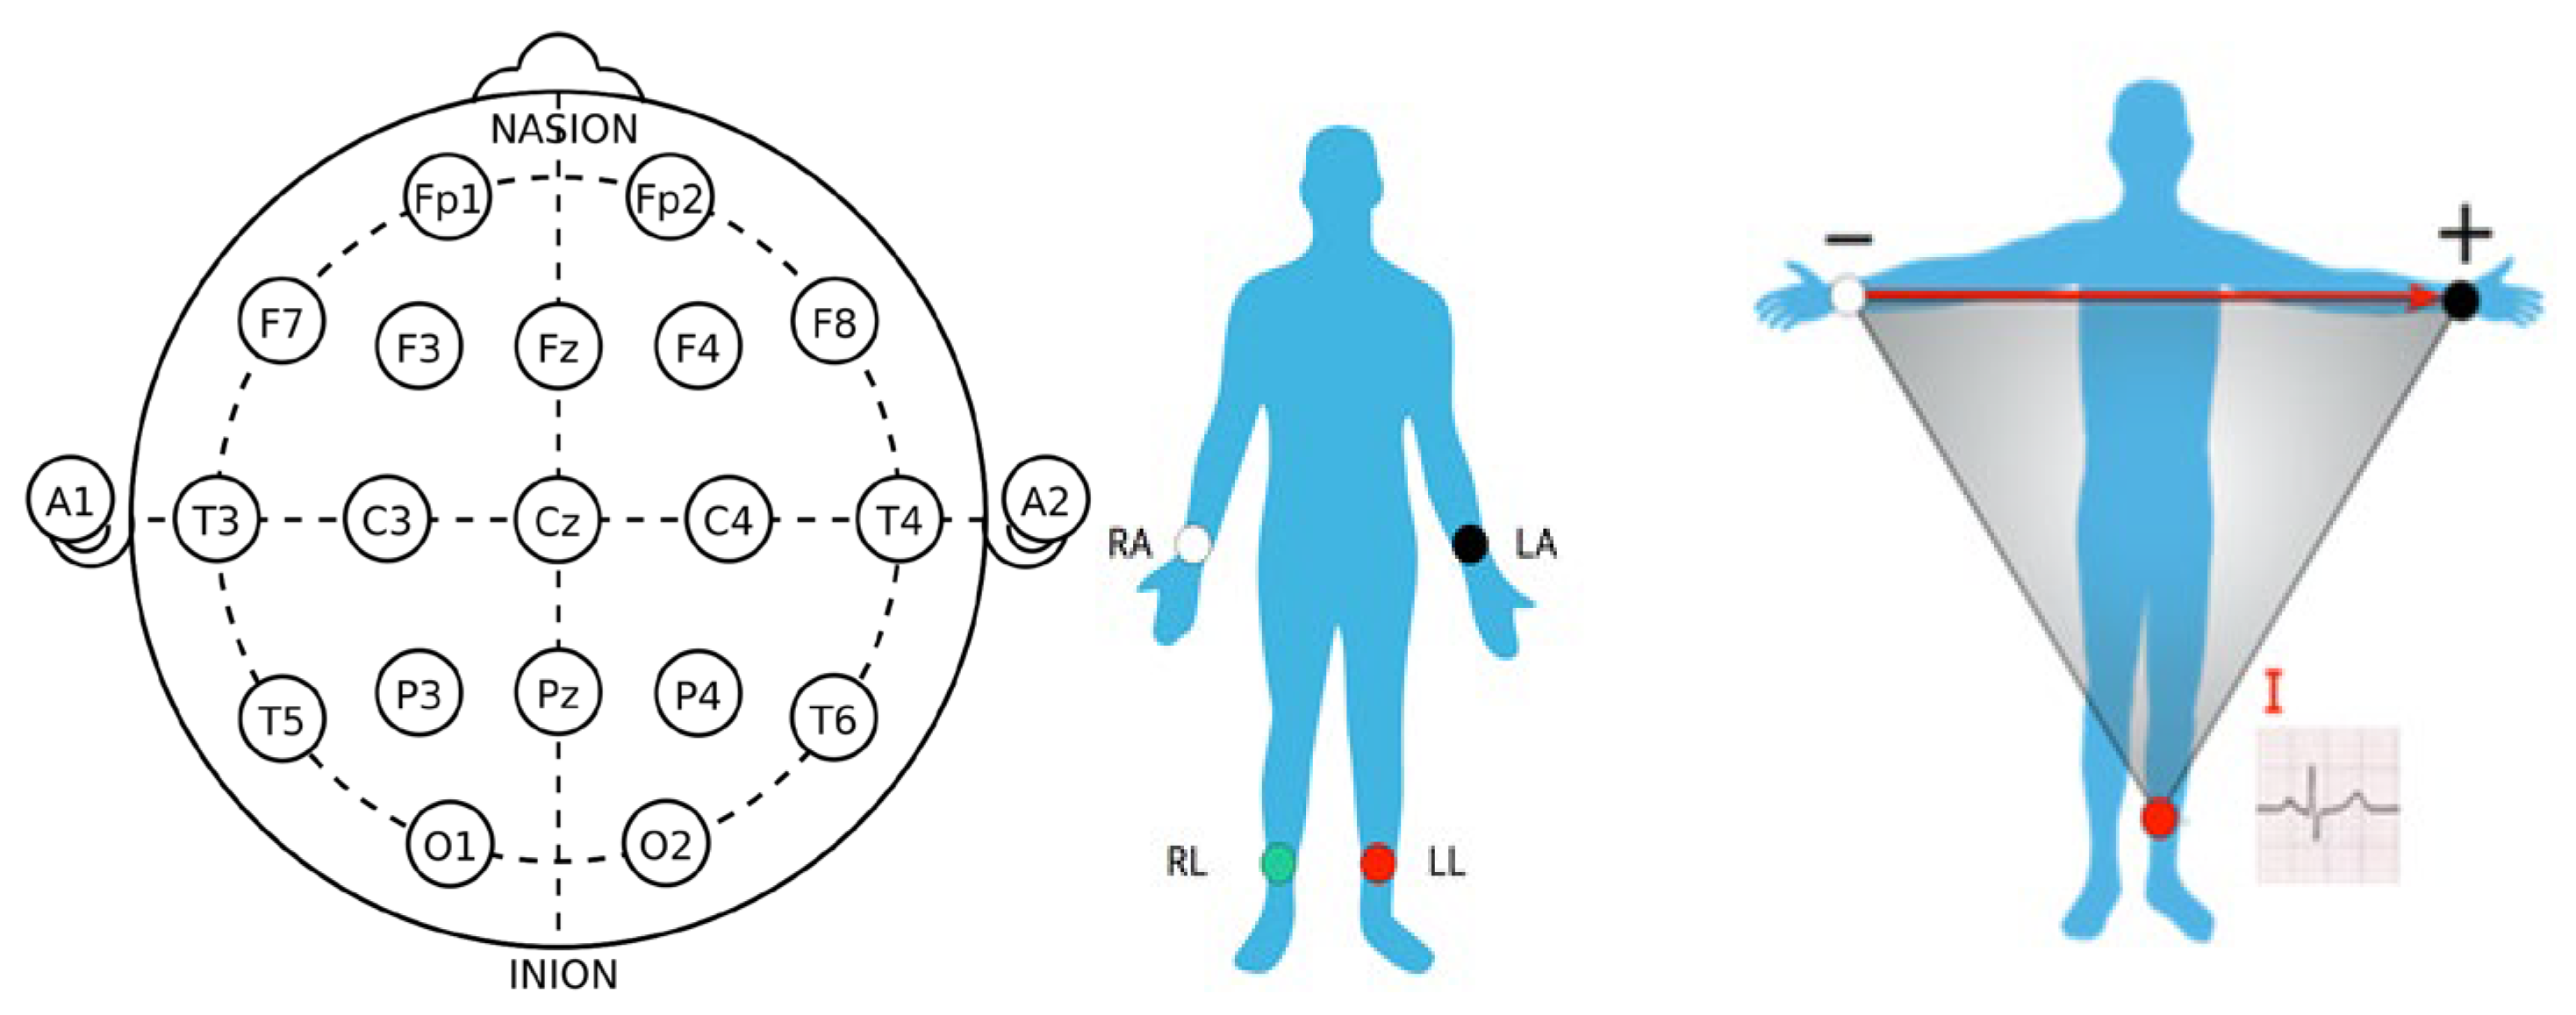
In order to obtain reliable and high quality ground truth for CNN training, we measured EEG data related to the central nervous system and ECG data related to the autonomic nervous system (sympathetic and parasympathetic) in a total of 28 people (14 men and 14 women, with an equal ratio of people in 20s~50s). The collected driver biometric data was then matched with the drowsiness video data and correlated. EEG electrode placement was based on the international 10-20 electrode system. As shown in
Figure 5, Fp1, Fp2, F7, F3, Fz, F4, F8, T3, C3, Cz, C4, T4, T5, P3, Pz, P4, T6, O1, O2 A total of 19 EEG locations were selected to measure EEG signals while driving using a driving simulator, with reference electrode A1 attached behind the right earlobe and ground electrode attached to the forehead. The EEG electrodes were placed according to the standard 12-guidance method, and two electrodes were attached to RA(Right Arm) and LA(Left Arm) to measure the Lead I signal.
The acquired EEG time series data were filtered to the frequency band of interest using BioScan (BioBrain Inc.), a specialized analysis program for bio-signal data, and Fourier transforms were performed to create EEG rhythm data for each frequency domain. Kubios Premium, a heart rate variability (HRV) analysis software, was used to compare the results of preprocessing and analyzing electrocardiogram data.
Table 3 shows the results of calculating the spectrum reflecting the quantitative amount of EEG rhythm during the EEG analysis process. The EEG analysis indicators used here are AT, AA, AB, AG, AFA, ASA, ALB, AMB, AHB, RT, RA, RB, RG, RFA, RSA, RLB, RMB, RHB, RST, RMT, RSMT, RAHB, which are defined by wavelength[
17], were analyzed in batches using an analysis program, and the abbreviations, full names, and frequency ranges of the indicators calculated through the analysis are shown in
Table 4.
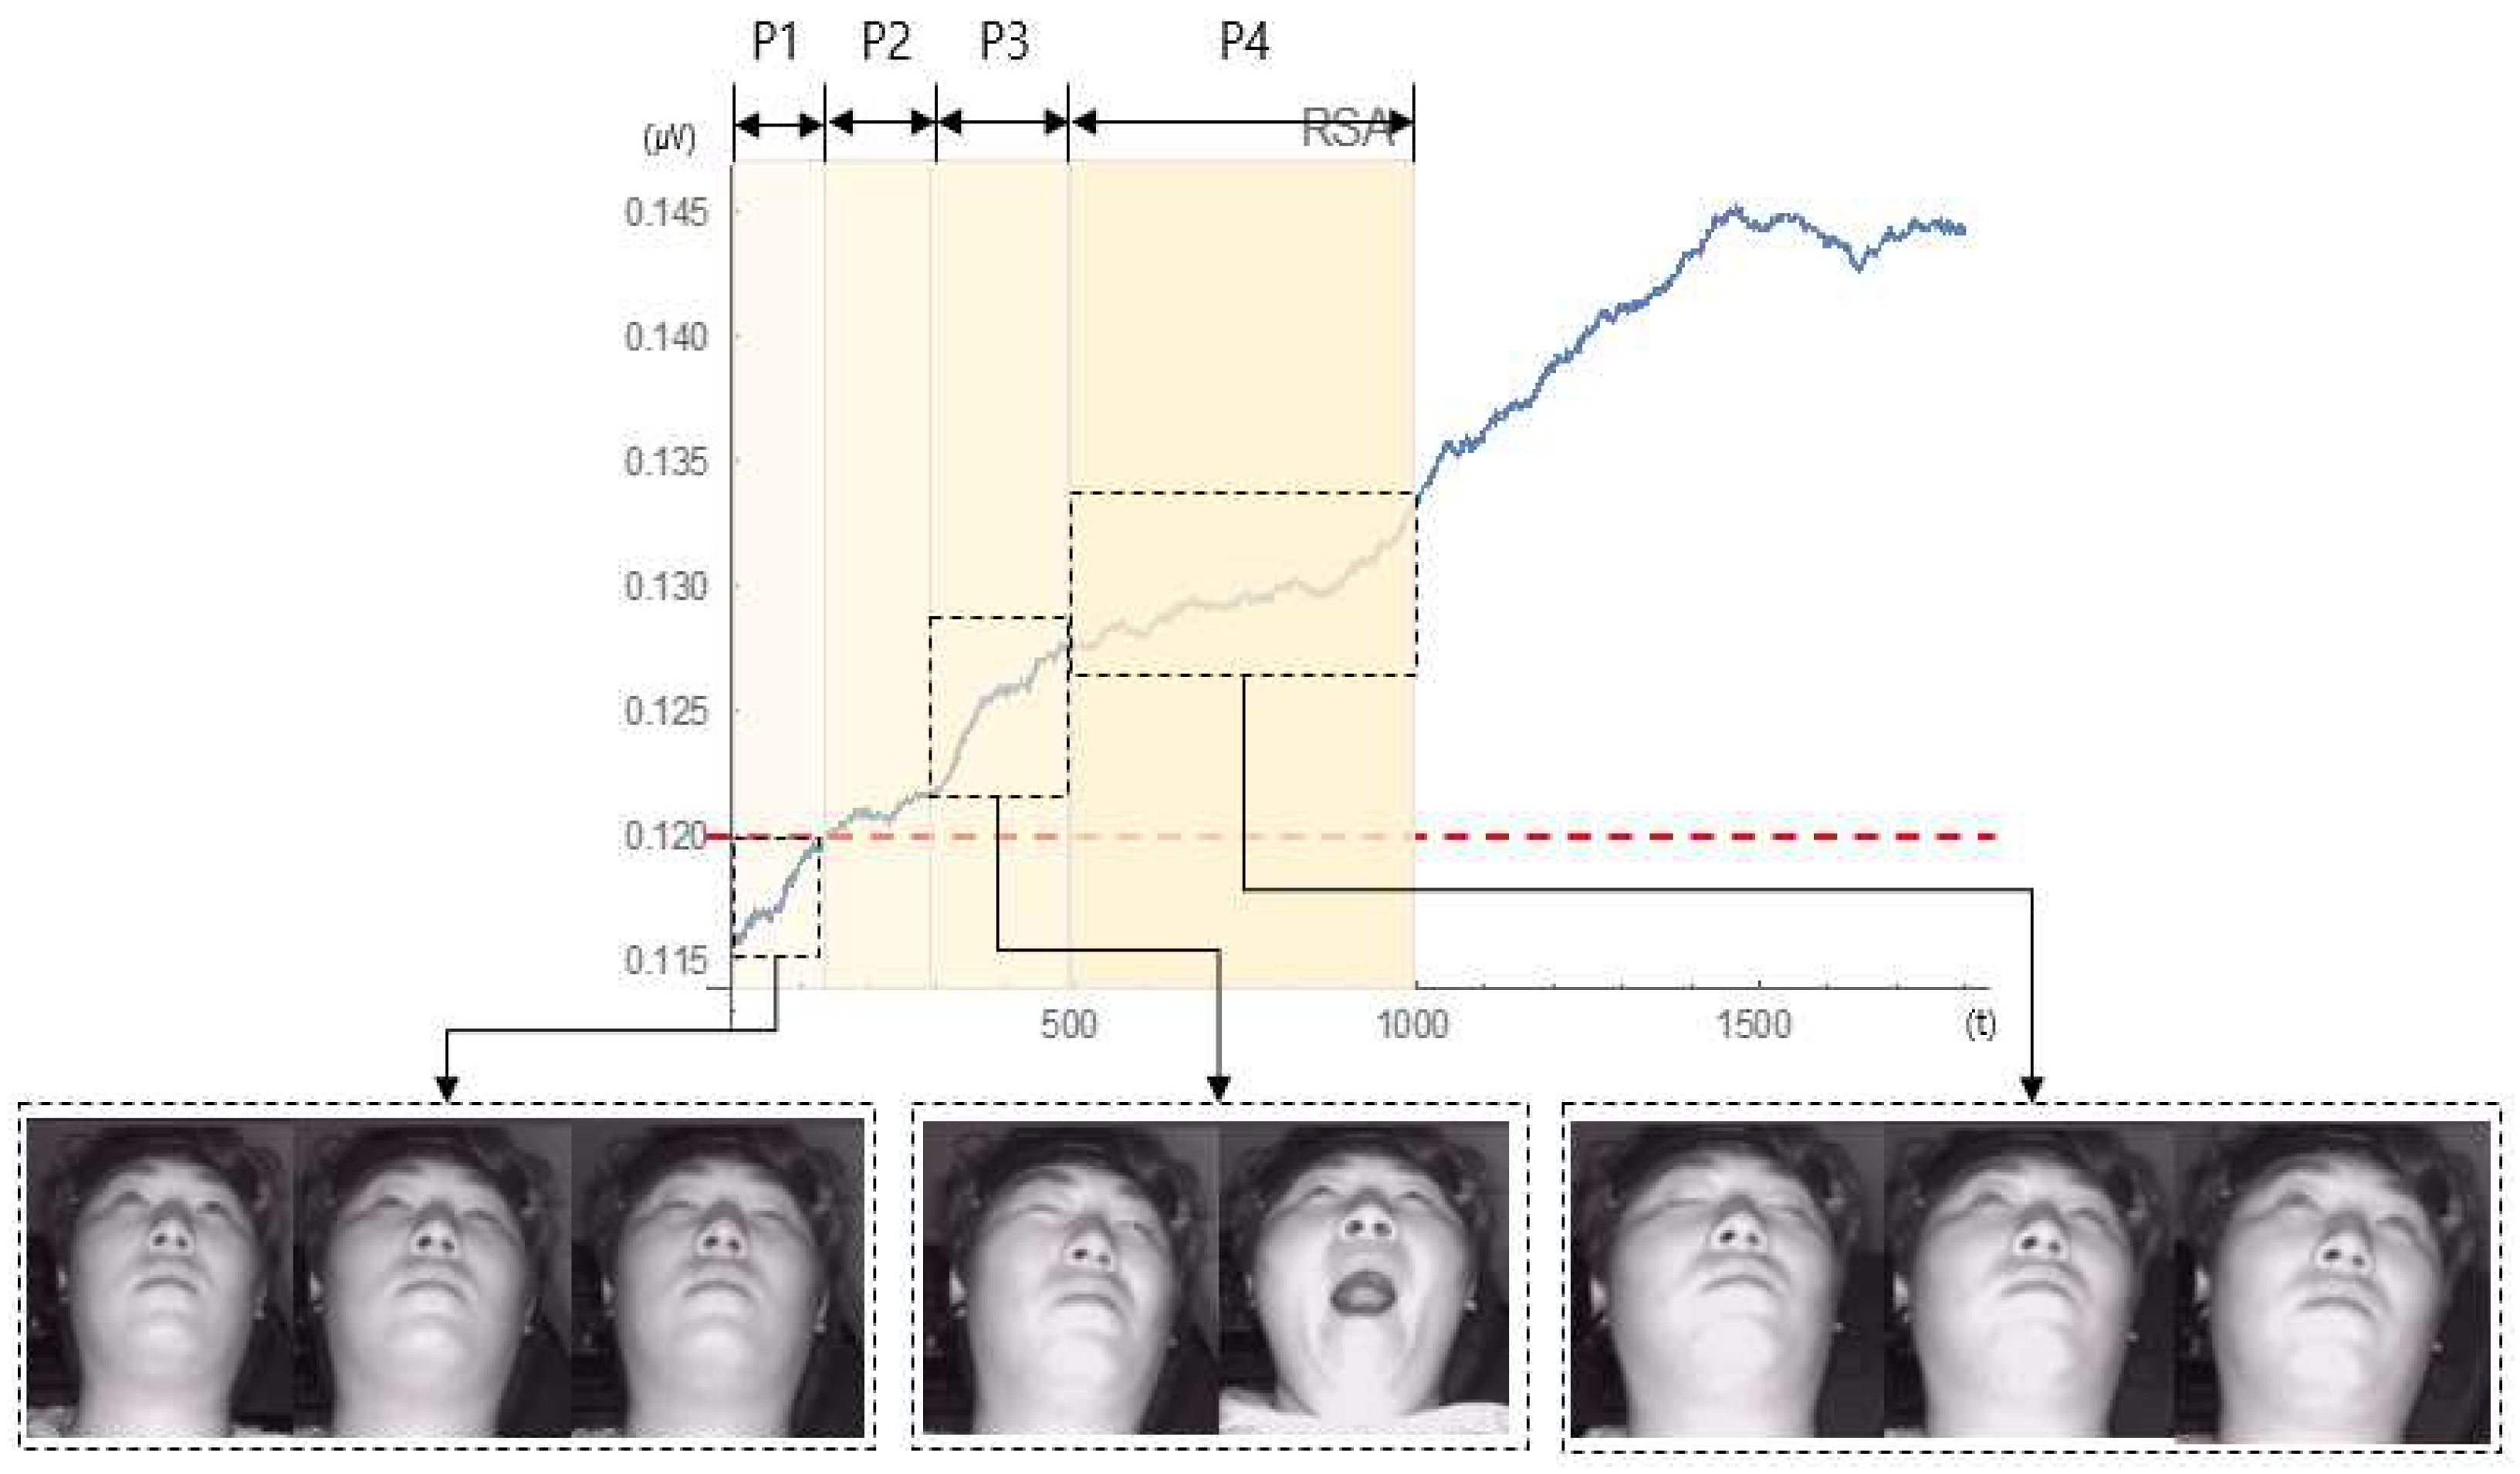
Result of analysis the indicator data of AT, AA, AB, AG, AFA, ASA, ALB, AMB, AHB, RT, RA, RB, RG, RFA, RSA, RLB, RMB, RHB, RST, RMT, RSMT, RAHB, the changes in RSA data were more significant. Among them, the data measured in Fp2_RSA showed features that could distinguish between drowsy and normal states, and this value (above 0.120) was used as the standard. Based on this, the trend of drowsy conditions could be confirmed as a result of matching and comparing with the driver's image in the same section. Therefore, ground truth for four sections (P1~P4) within a one-minute time window was obtained by linking video and biometric data, as shown in
Figure 6. Then, the probabilistic driver drowsiness of P1~P4 was calculated into three intervals [0, 0.5, 1] to form the training data set, and the simulation test and verification data sets were also formed in the same proportion.
3.2.2. Facial and Eye Feature Extraction
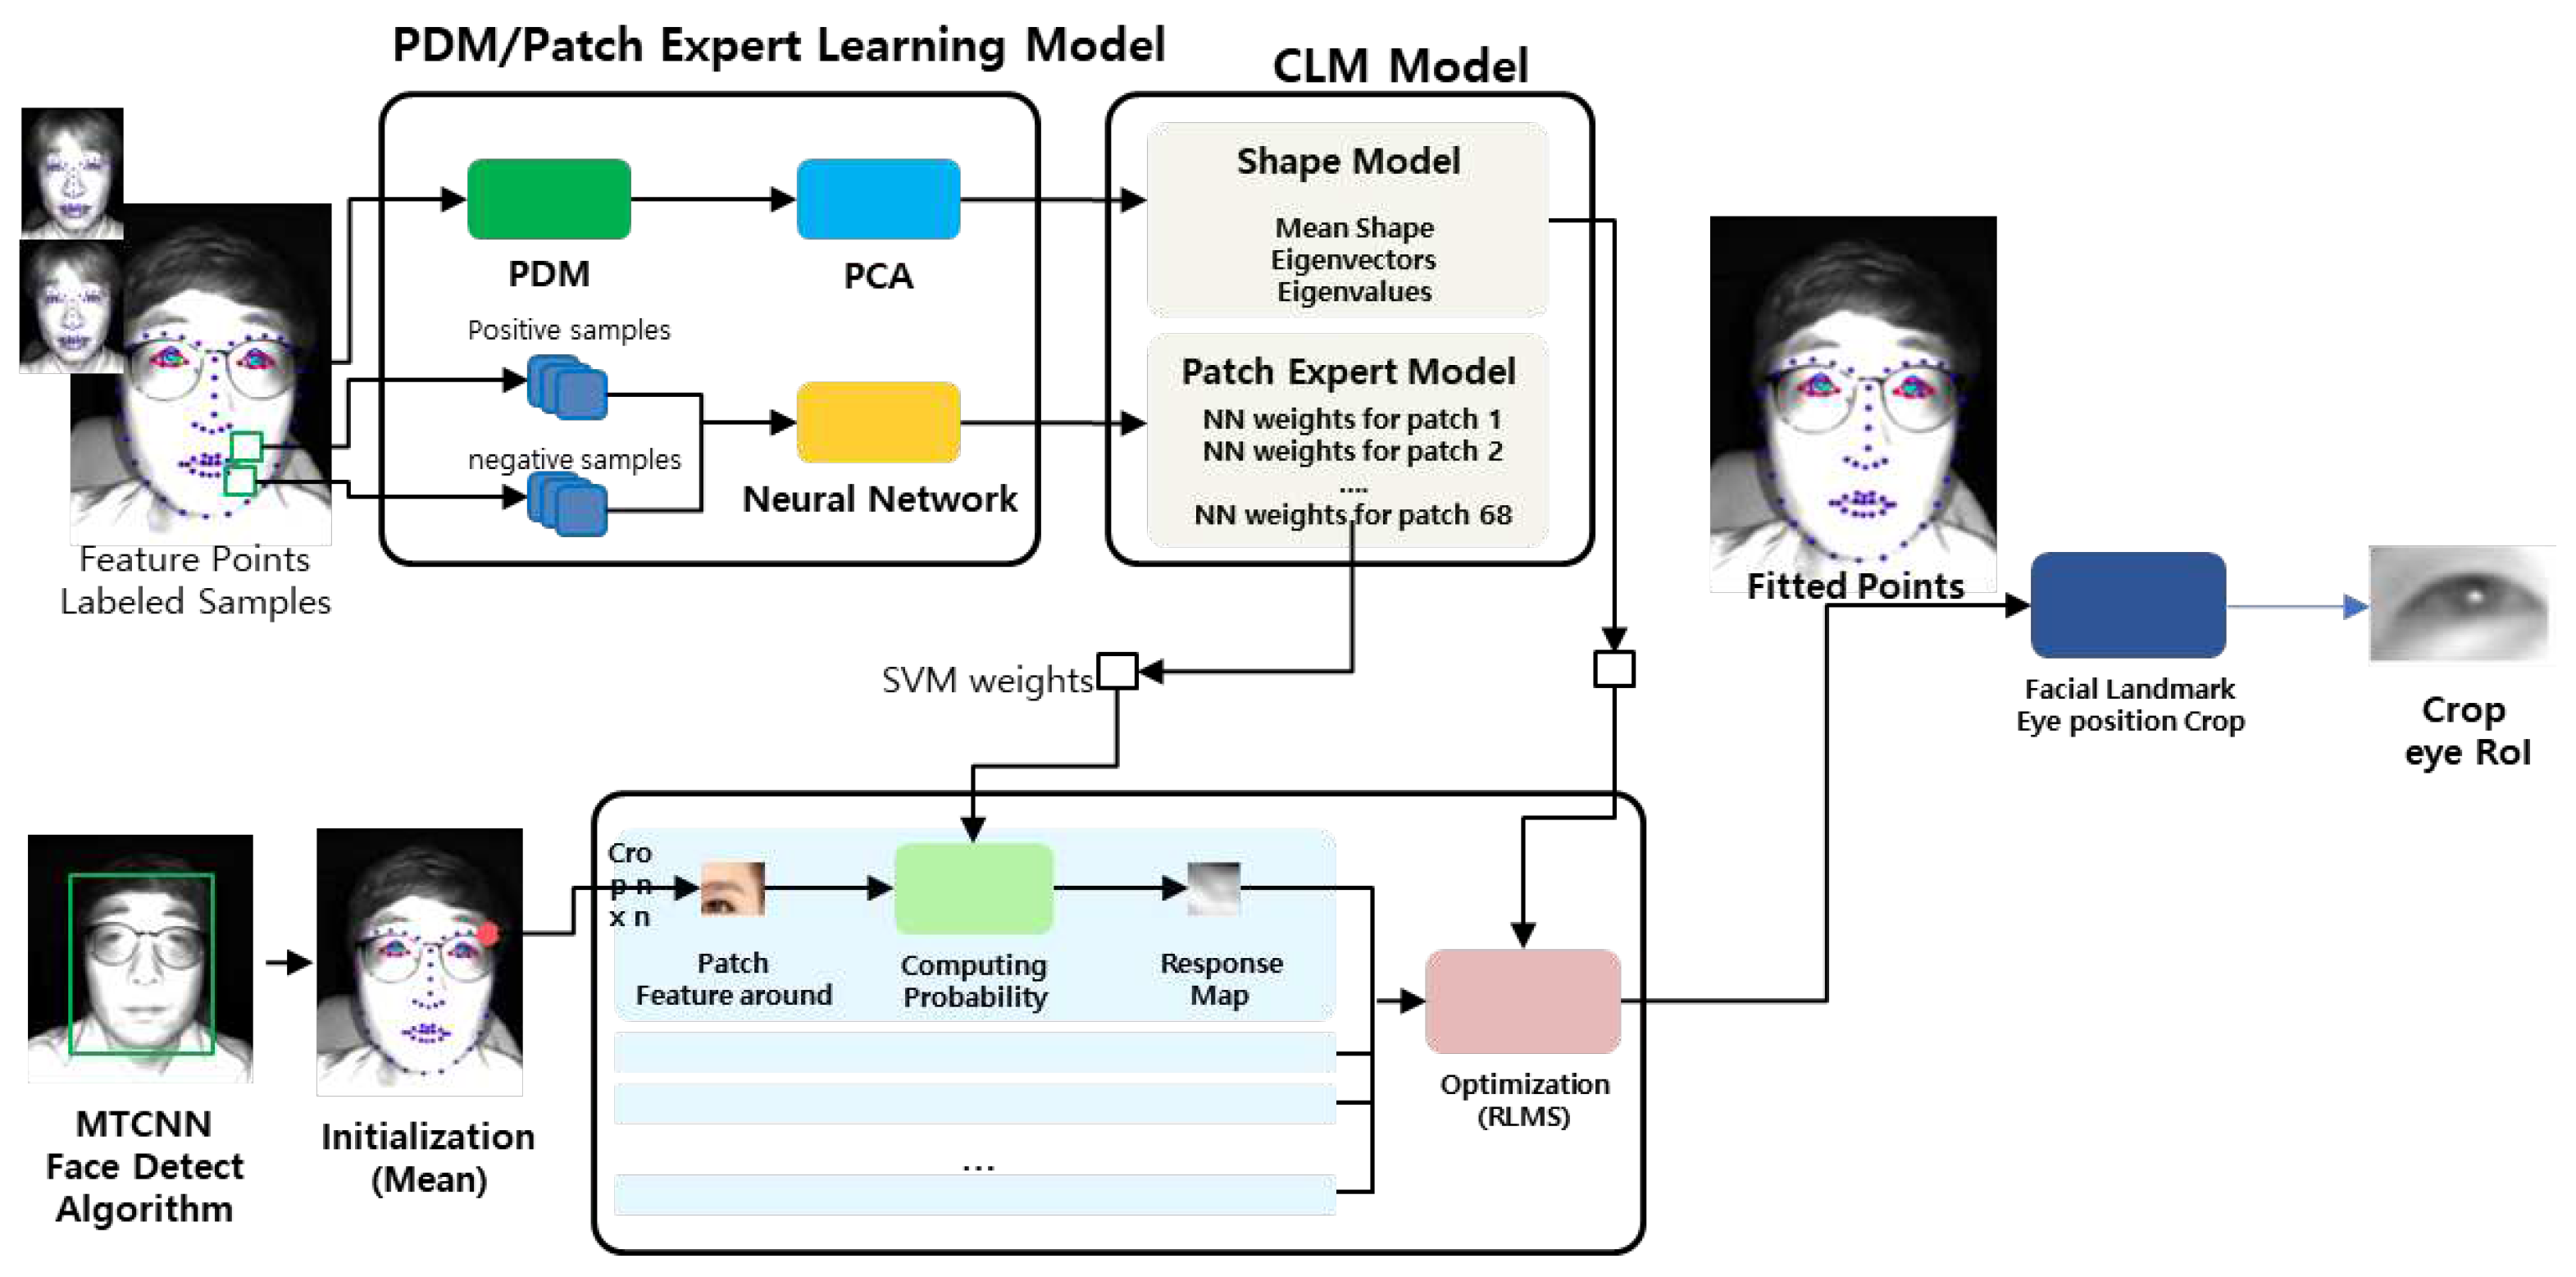
To extract the region of interest (RoI) of both eyes of the driver, an image of size 24 x 24 is extracted through a large four-step process as shown in
Figure 7. First, the Multi-task Cascaded Convolutional Networks (MTCNN) Face Detection model is used to extract the face area of interest from the image data of the ToF camera. Second, we initialize 68 facial feature points set as Mean in the Shape Model, including eyes, nose, mouth, chin, and eyebrows in the recognized face area. Third, we extract the Response Map for 68 feature points using the trained Local Model (CLM) model and finally extract 68 feature points through RLMS (recursive least mean square) optimization. The CLM (Constrained Localization Model) model consists of a shape model by constructing a matrix of feature points of a representative face through principal component (PCA) analysis for the face shape information calculated through PDM (point distribution model), and a patch expert model by extracting feature points for major landmarks and matching them to the correct location. The probability of each landmark is then calculated using the learned parameters. From the 68 extracted points, we calculate the rotation angle for 12 eyelid points to align them horizontally with the center position of the right and left eyes. Finally, the face image region width is reduced to 24%, and the right and left eye images adjusted to 24x24 pixels in size are extracted using the Affine transform to obtain the right and left eye images located at each center.
3.2.3. Calculation of eye aspect ratio(EAR)
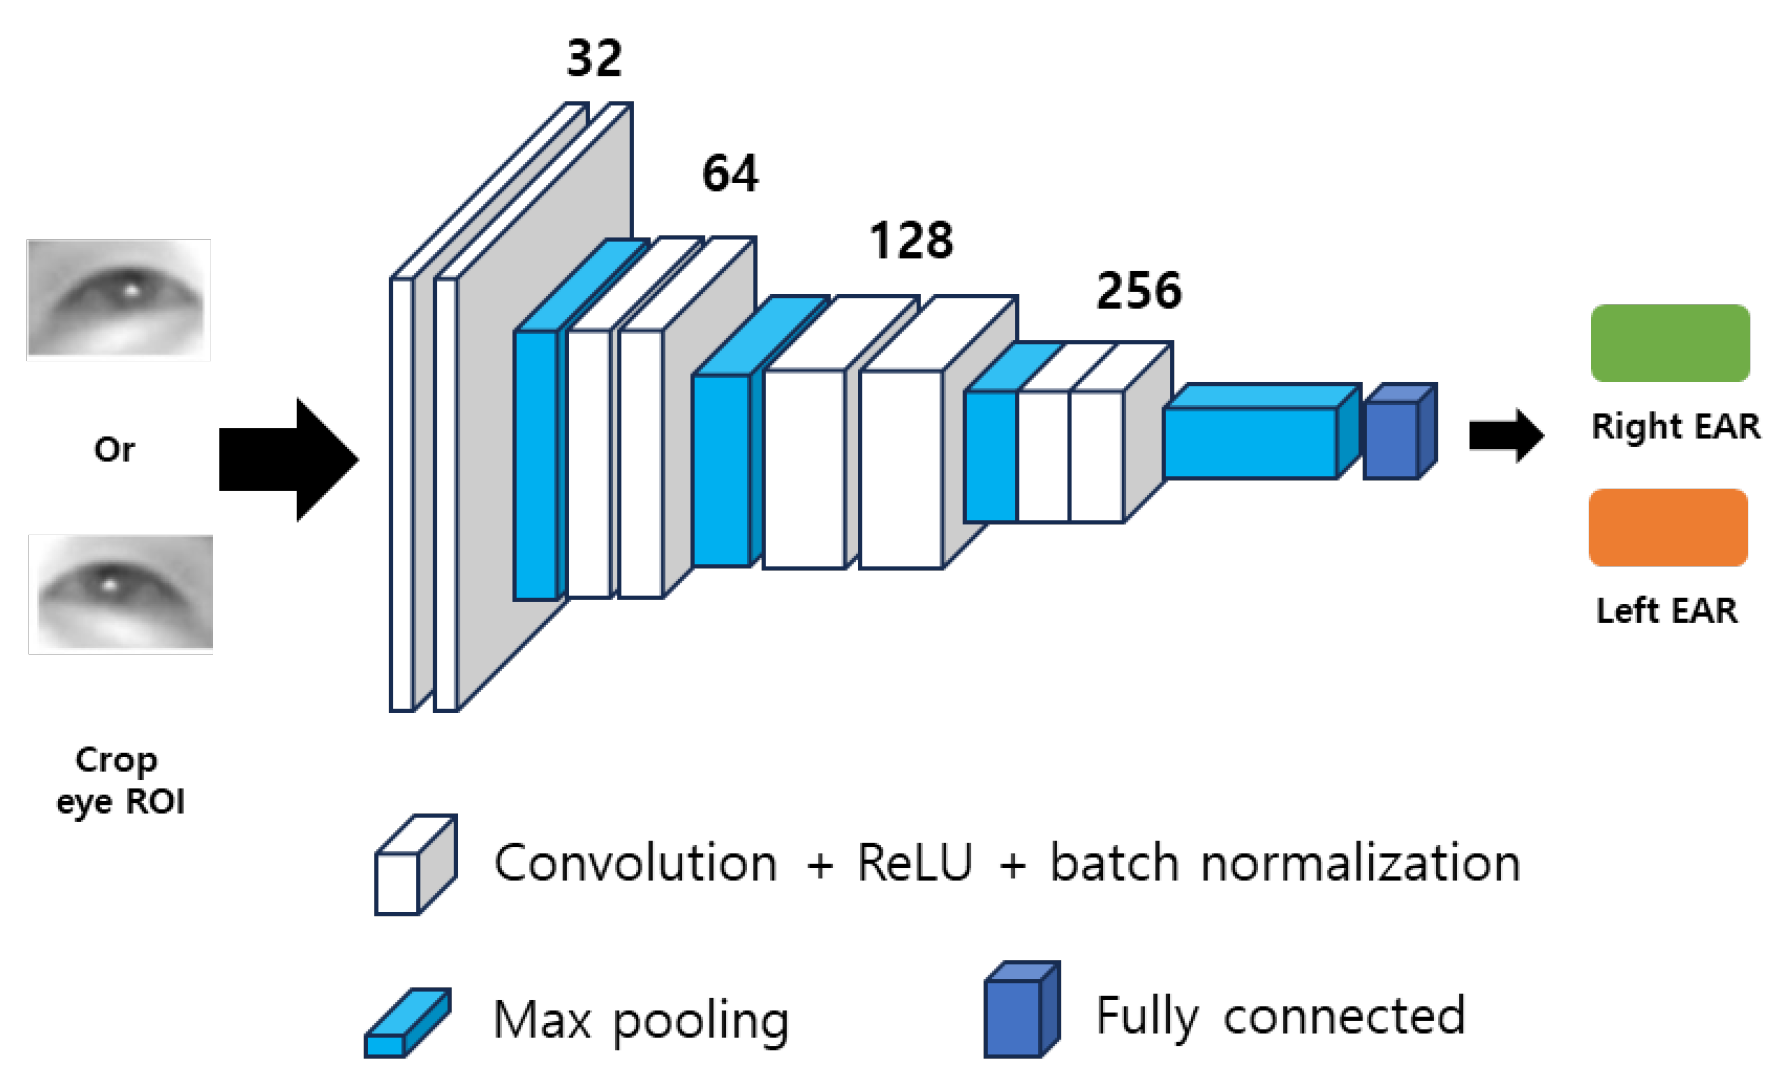
The eye aspect ratio (EAR) of both eyes is obtained by a CNN algorithm with images of the driver's eyes as input. As shown in
Figure 8, the image of the eye passes through eight 3x3 convolutional layers (stride 1, padding 2, depth 32, 32, 64, 64, 128, 128, 256, and 256 respectively, where ReLU and batch normalization are connected). There are three 2x2 Max pooling layers between the convolution layers and one for every two convolution layers. Next, after conducting Global Max Pooling, connect the Fully Connected Layer to derive the EAR. This way through the network calculates a real number type of EAR. Then, the steering angle data is normalized from pulse data and in-vehicle signals via the ECG sensor embedded in the steering wheel.
3.2.4. Proposed CNN algorithm based on multi-sensor fusion data
For real-time driver status judgement, we proposed a system to extract binary drowsiness probabilities for four time series using a convolutional neural network (CNN) based on data on the degree of driver eye closure, pulse, and steering angle for four-time intervals (5s, 15s, 30s, and 60s). Drowsiness induced in short time intervals shows early responsiveness but is a low-accuracy drowsiness estimate, while drowsiness induced in long time intervals is accurate but relatively less responsive than the results estimated in short time intervals. Accuracy and responsiveness were improved with the CNN algorithm using sequential multi-sensor-based fusion data for one minute.
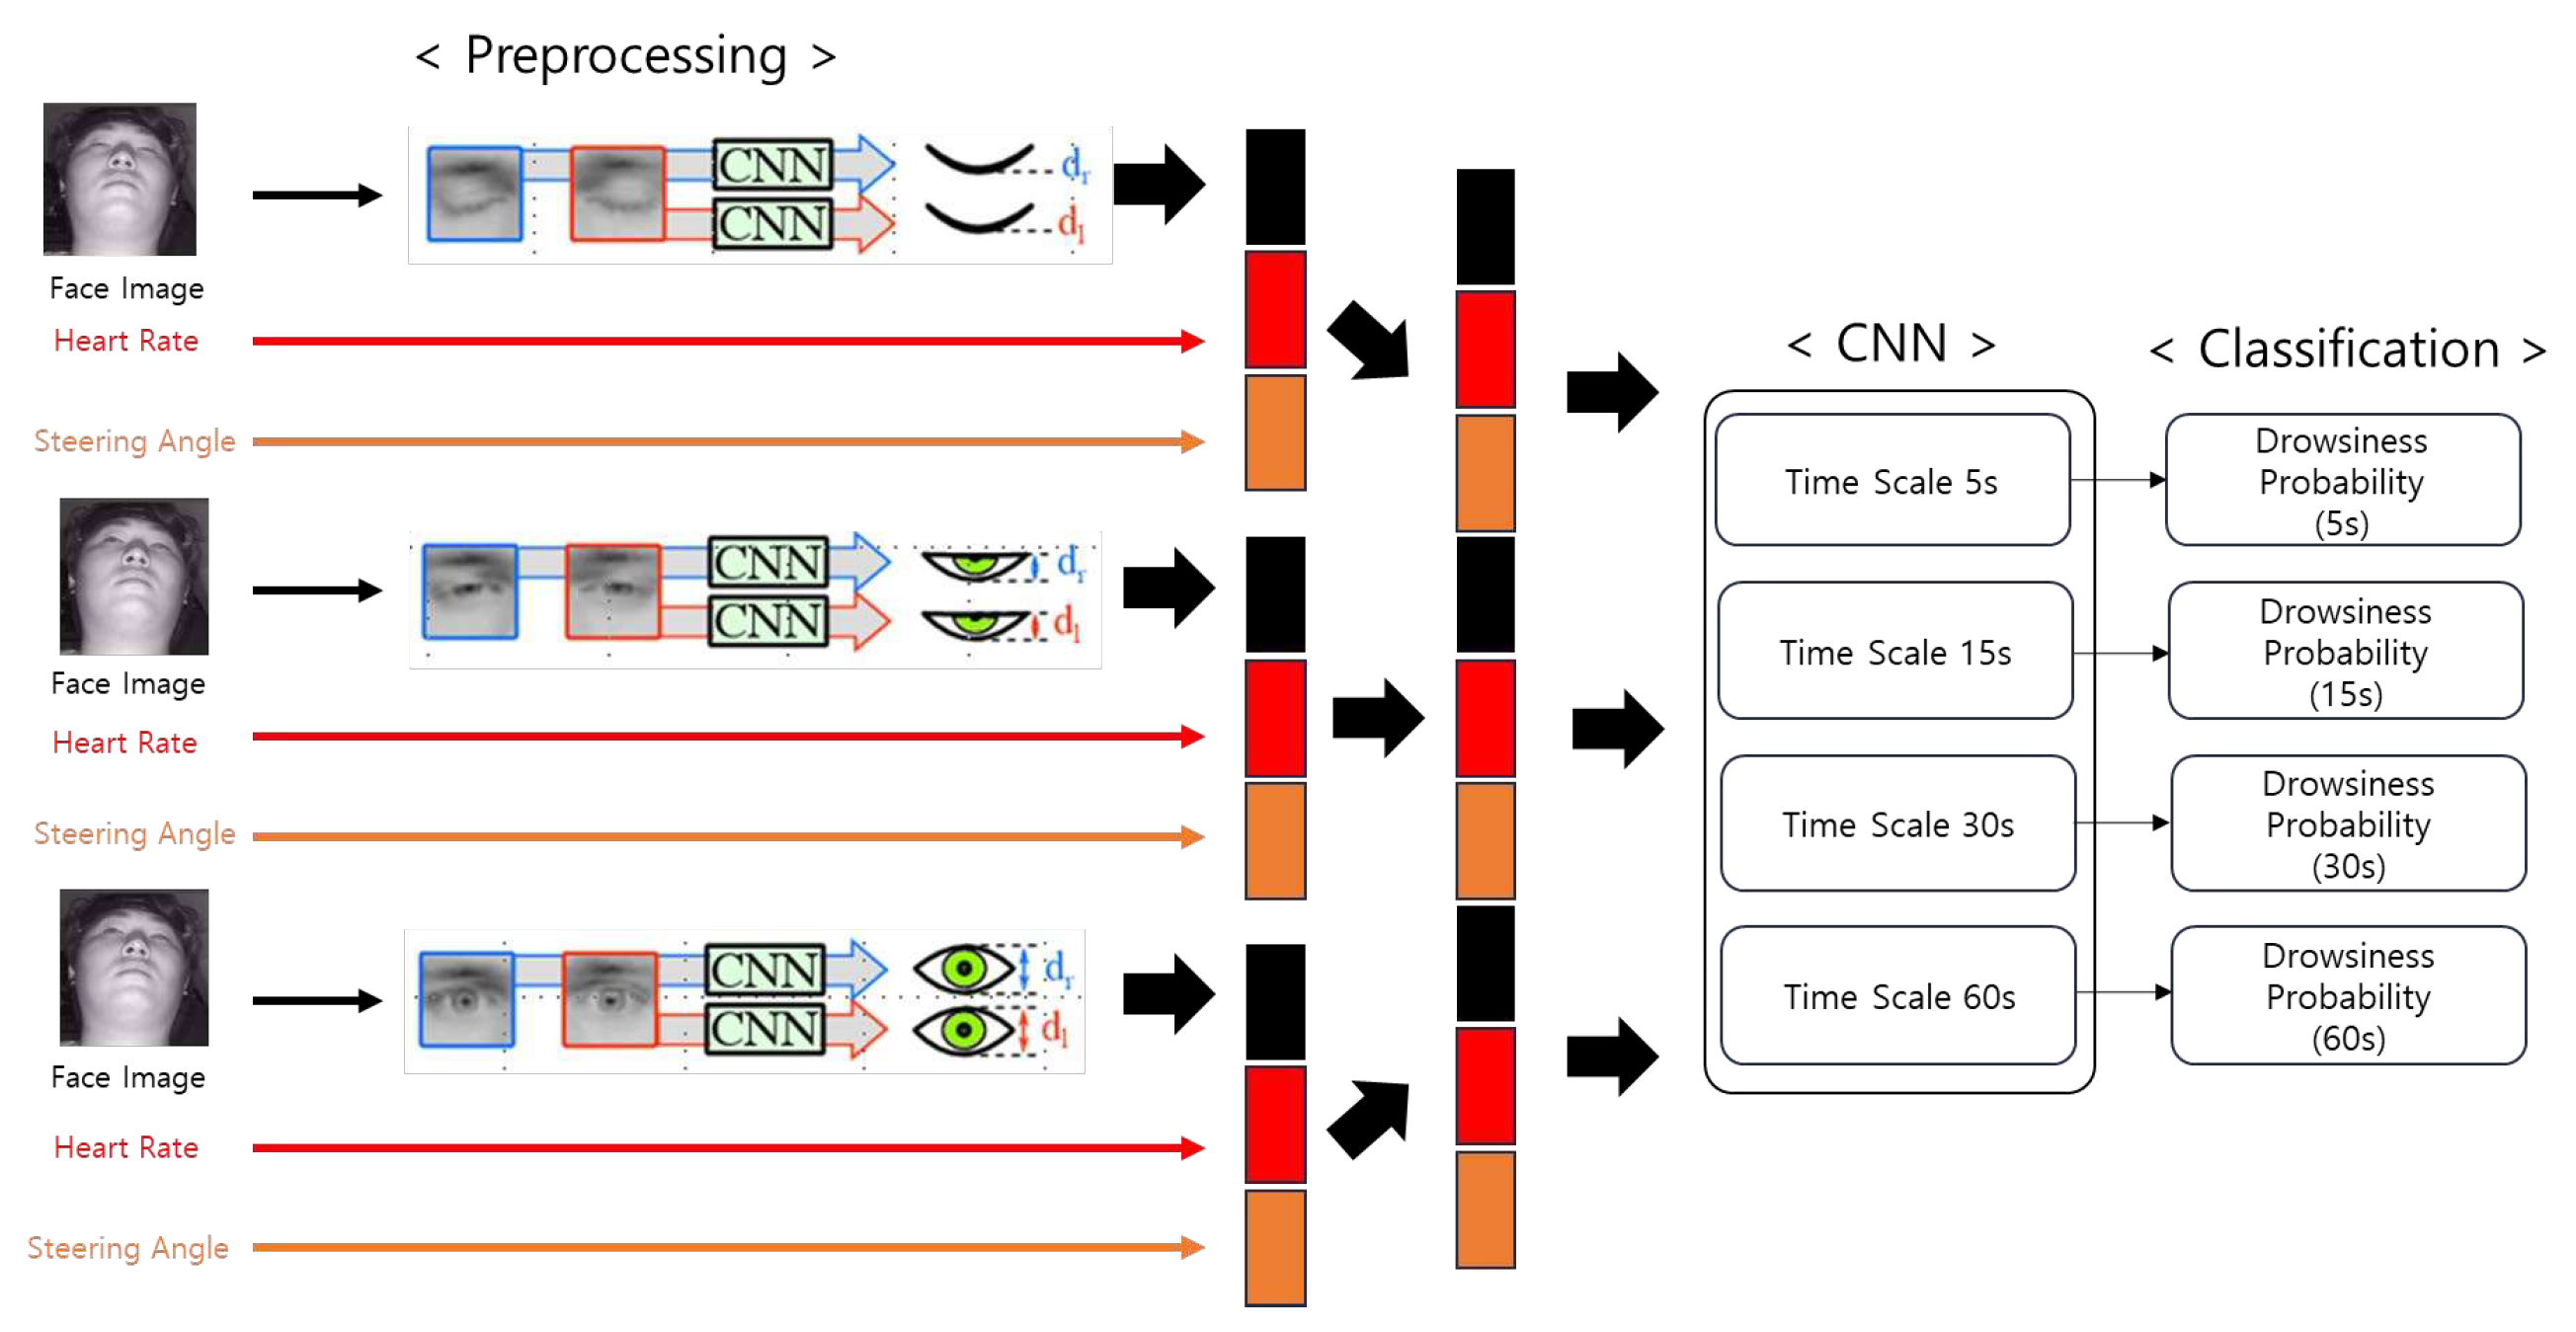
Figure 9 shows the process of using multi-sensor fusion data for one minute to construct the proposed system to make four drowsy inferences.
First, a one-minute face image acquired from the ToF camera is used to extract the RoI regions of the face and eyes using an open-source algorithm, and the EAR (distance between eyelids) is calculated using a CNN algorithm. At the same time, pulse from the ECG sensor embedded in the steering wheel and steering angle data from the in-vehicle network (IVN) are acquired and vectorized to be concatenated in time order for input to the time series CNN algorithm. The concatenated input vectors in four different time section to infer the probability of drowsiness through a convolutional neural network (CNN). Here, the input is a minute-long EAR sequence (30 frames per second, 1800×2 values) associated with both eyes, as well as pulse and steering angle (30x2) data. As shown in
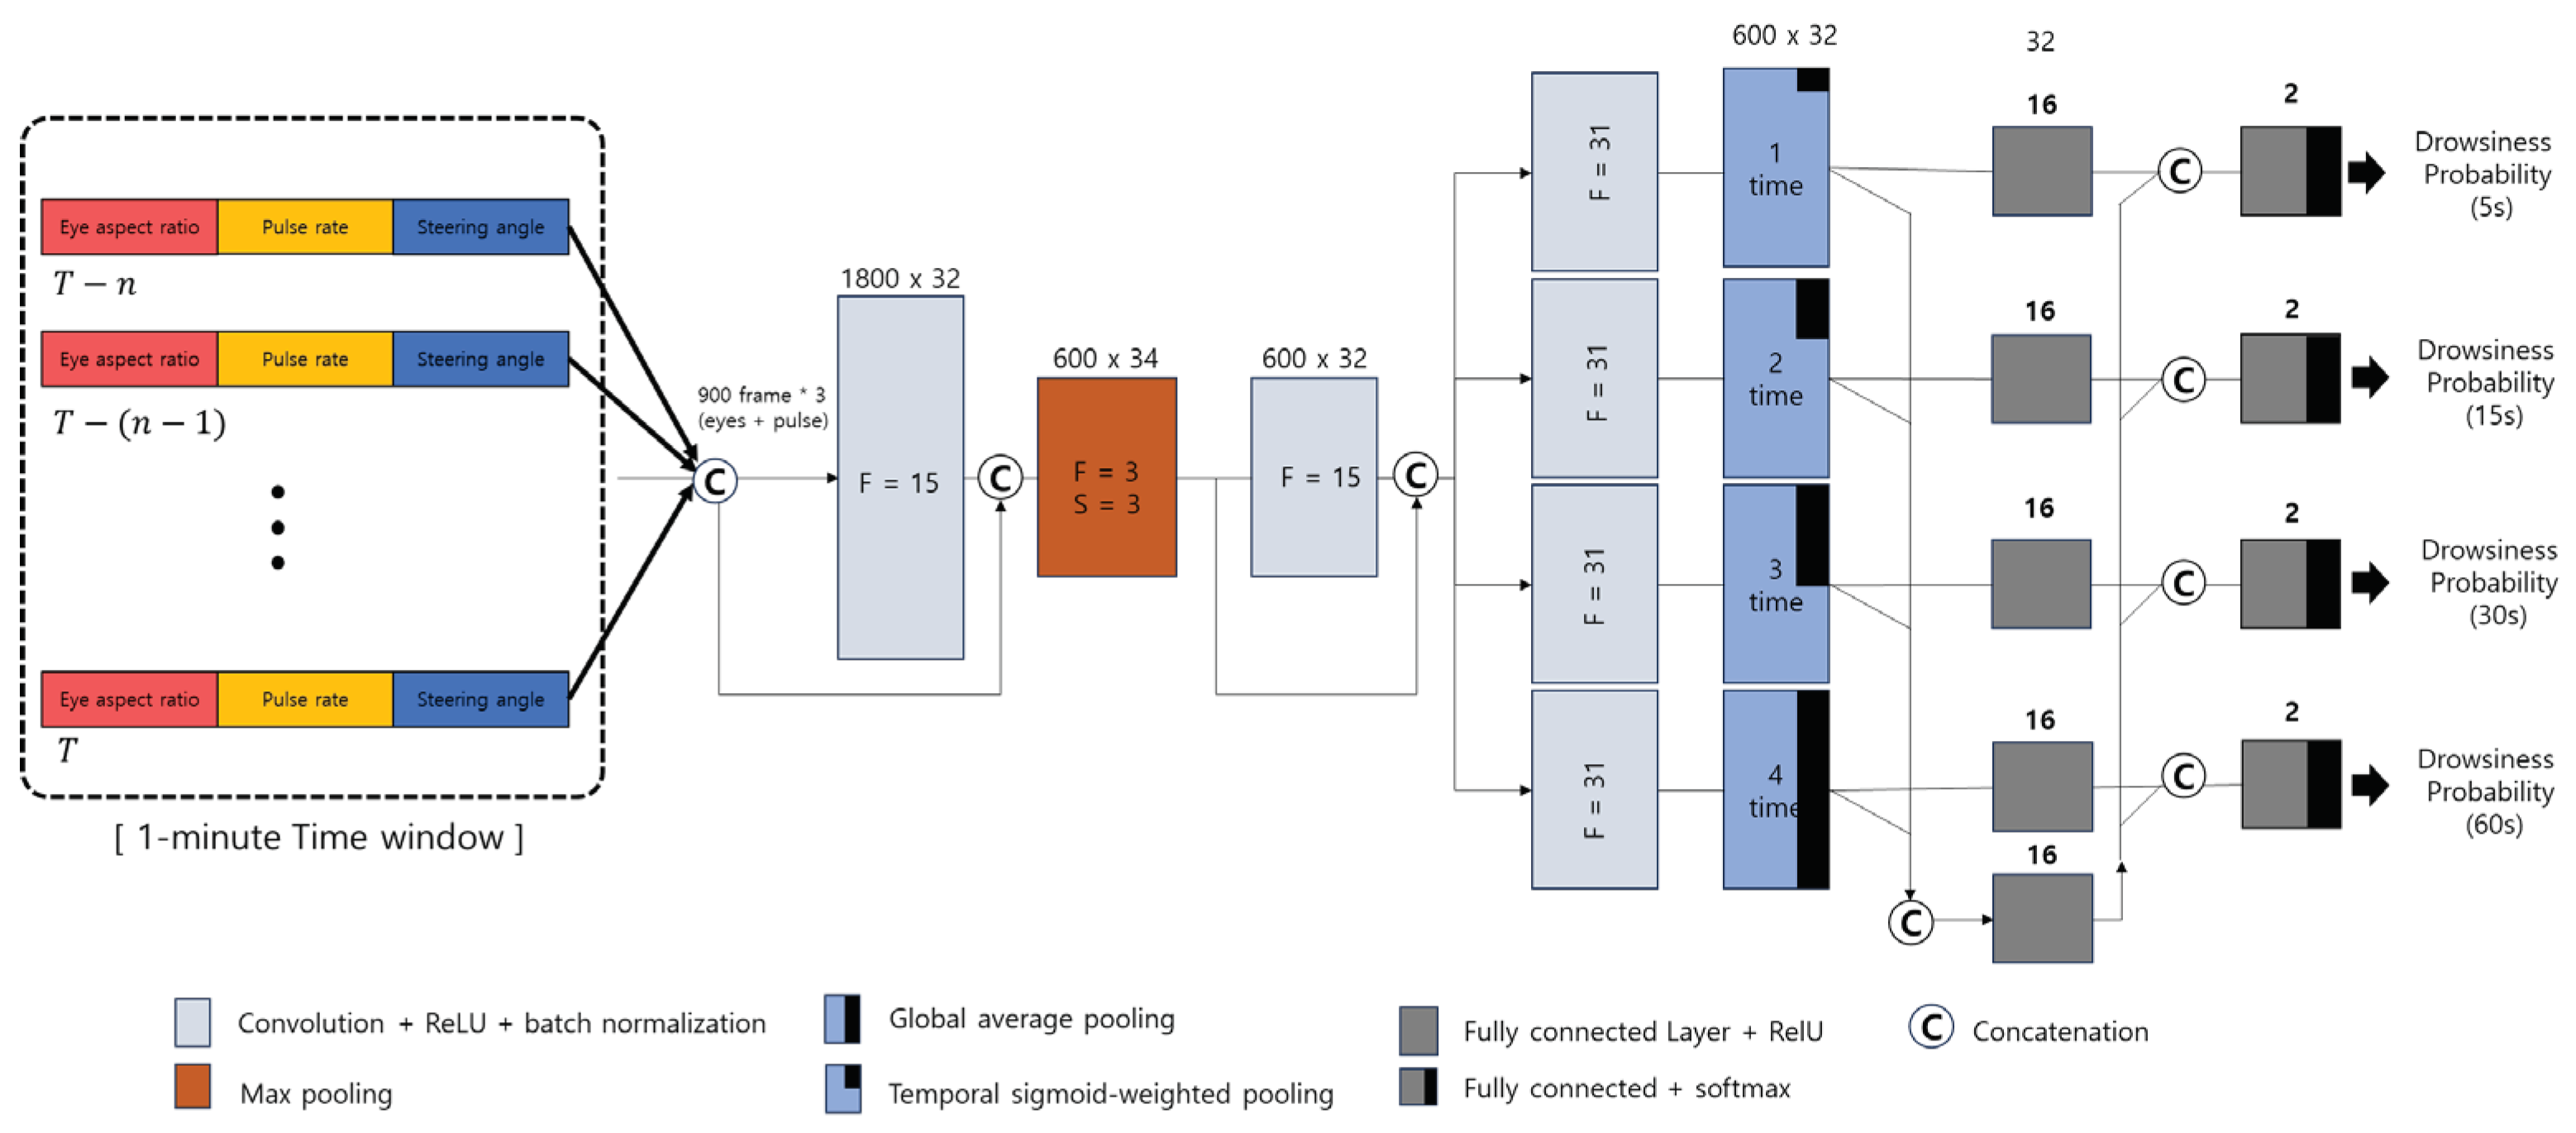
Figure 10, the output produces four estimates of the probability of drowsiness, one for each of the different time interval.
The input sequence of EAR, biometric, and vehicle information is processed by two temporal convolutional layers. These two layers have a depth of 32 each, with a Receptive Field of 15, stride of 1, and padding of 7. Activation ReLU and batch normalization are connected. These two convolutional layers are densely connected so that the CNN layer outputs and previous inputs are concatenated to produce an output sequence with dimensions of 34 and 66. The output sequence (depth 66) is then passed to four branches, each of which performs a task to infer the probability of drowsiness. Each brunch is configured as follows. First a temporal convolutional layer (depth 32, receptive field k is 31, stride s is 1, padding is 15, ReLU and batch normalization are connected, and there is no dropout connection). Second a different global pooling layer for each brunch is connected. Thirdly, the first fully connected layer (depth 16, followed by ReLU), which is connected to the last fully connected layer (depth 2), which is followed by the softmax function. This configuration allows us to estimate the probability of drowsiness in four different time intervals. In fact, since the ground truth drowsiness signal changes rapidly in short time windows, the drowsiness estimation should be based on short time windows, mainly to react to the rapid change of the EAR closing the eyes. Therefore, the global pooling of the first 3 brunches is designed to focus on the length of recent fluctuations (for each time scale of 5, 15, and 30 seconds) through a "Time sigmoid weighted pooling" layer. This layer is calculated by the following equation.
where
is the activation output feature vector,
is the feature vector of the nth position in the input sequence, σ(x) is represented by
as a sigmoid function, and
is the time (in seconds) we are interested in. We chose the sigmoid function to allow the temporal weight to decrease quickly and smoothly at
. And global pooling in brunch (time scale of 60 seconds) is global average pooling. We also add multiple time-branch contexts to each brunch. the output of the global pooling layer of each brunch is concatenated into one and processed through a Fully Connected layer (with depth 16 and ReLU connections), which then goes back to each brunch and connects with the output of the corresponding first Fully Connected layer. This adds dependencies between branches, which can be robust to drowsiness estimation in low time intervals.
4. Simulation results and discussion
Apart from building a dataset for AI training, men and women under the same conditions (high-medium-low lighting conditions and driver wearing masks, hats, sunglasses, etc. We conducted a simulation test of the proposed CNN algorithm using video data (more than 20,000 images) taken when 28 people drove a public road in the simulator. The test results showed TNR of 71.9%, 88.2%, 90.5%, and 94.8%, TPR of 58.8%, 72.1%, 75.8%, and 76.1%, and Accuracy of 70.4%, 84.3%, 90.2%, and 94.2% for four different time scales(t1-t4), respectively. As a result of complementing each other's features in four different time intervals and comprehensively considering video signals, biometric signals, and vehicle signals, it can be seen that the performance is more than equivalent to the existing driver drowsiness judgement algorithm as shown in the
Table 5.
As shown in Table.5 above, it can be said that the characteristics of drowsiness are more expressed as the time window increases. This is because the EAR data-based characteristics are averaged by a long-time window, and the noise is minimized because the proposed algorithm uses the results of previous steps in the final judgement. However, in order to improve responsiveness, good results should be obtained in a short window. Therefore, a trade-off between responsiveness and accuracy is required, and it is necessary to derive the optimal window time. It is also expected that the data from 4 levels can be utilized in driver feedback strategies for real-time response. In addition, there are factors that unexpectedly interfere with detecting the ROI of the driver's eyes (e.g., shielding from hands on the steering wheel and the effects of physical conditions such as driver height), leading to lower accuracy. Several methods to counteract this could include increasing the camera IR resolution, changing the camera mounting location, adding camera or exception handling.
5. Conclusions
In this paper, we proposed a method to calculate the probability of drowsiness according to four different time intervals based on CNN with multi-sensor data inputs such as video, biometric, and vehicle data to develop a driver state monitoring system. Previous studies have used single-sensor-based driver drowsiness measurement methods, including driver behavior, physiological responses, and changes in vehicle interior environment and behavior. In this study, we derived a CNN algorithm that characterizes the degree of blinking to estimate the driver's drowsiness by using multi-sensor fusion data and used the accumulated changes in one minute to estimate drowsiness. To build a reliable dataset (ground truth) for training the CNN algorithm, we matched the changes in the driver's face image based on the electrocardiogram (ECG) and electroencephalogram (EEG) changes in the drowsy and normal states and established the baseline. This can be objectified a reliable by acquiring and comparing bio-signals as a way to compensate for the uncertainty of the ground truth of drowsiness images in previous studies. In addition, it showed better performance than the preceding drowsiness state determination system, which is judged by other single sensors through multiple sensor data fusion. The results of driver drowsiness judgement derived from the four time criteria suggest that there is a trade-off between fast response and high accuracy, requiring a strategic choice of which performance to prioritize. Of course, the response to the recognition performance degradation problem caused by limiting factors in acquiring the driver's face image should be studied continuous in the future. The results of this study can be applied to driver state monitoring systems that are required when switching control of automated vehicles and are expected to be highly useful in the future.
Author Contributions
Conceptualization, S.H.P. and J.W.Y.; methodology, S.H.P. and J.W.Y.; software, J.W.Y.; validation, S.H.P. and J.W.Y.; formal analysis, S.H.P. and J.W.Y.; investigation, S.H.P. and J.W.Y.; resources, S.H.P. and J.W.Y.; data curation, S.H.P.; writing—original draft preparation, S.H.P. and J.W.Y.; writing—review and editing, S.H.P. and J.W.Y.; visualization, S.H.P. and J.W.Y.; supervision, S.H.P.; project administration, S.H.P.; funding acquisition, S.H.P. All authors have read and agreed to the published version of the manuscript.
Funding
This research was funded by the R&D Program of Ministry of Trade, Industry and Energy of Republic of Korea (20014353, The development of passenger interaction system with level 4 of Automated driving).
Institutional Review Board Statement
The study was conducted in accordance with the Declaration of Helsinki, and approved by the Institutional Review Board (or Ethics Committee) of KOREA NATIONAL INSTITUTE FOR BIOETHICS POLLICY (protocol code 2022-0171-002 and date of approval 04-20-2022).” for studies involving humans.
Informed Consent Statement
Informed consent was obtained from all subjects involved in the study.
Data Availability Statement
Not applicable.
Acknowledgments
The authors would like to appreciate the reviewers for their helpful comments and interest.
Conflicts of Interest
The authors declare no conflict of interest.
References
- ISO/SAE PAS 22736:2021, “Taxonomy and definitions for terms related to driving automation systems for on-road motor vehicles”. Available online: https://www.iso.org/standard/73766.html (accessed on 29 September 2023).
- H.N. Yun; S.L. Kim; J.W. Lee; J.H. Yang. Analysis of Cause of Disengagement Based on U.S. California DMV Autonomous Driving Disengagement Report. Transaction of the Korean Society of Automotive Engineers 2018, 26, 464-475. [CrossRef]
- Tian, R.; Ruan, K.; Li, L.; Le, J.; Greenberg, J.; Barbat, S. Standardized evaluation of camera-based driver state monitoring systems. IEEE/CAA J. Autom. Sin. 2019, 6, 716–732. [Google Scholar] [CrossRef]
- Li, G.; Chung, W.-Y. Detection of Driver Drowsiness Using Wavelet Analysis of Heart Rate Variability and a Support Vector Machine Classifier. Sensors 2013, 13, 16494–16511. [Google Scholar] [CrossRef] [PubMed]
- Ramzan, M.; Khan, H.U.; Awan, S.M.; Ismail, A.; Ilyas, M.; Mahmood, A. A Survey on State-of-the-Art Drowsiness Detection Techniques. IEEE Access 2019, 7, 61904–61919. [Google Scholar] [CrossRef]
- Doudou, M.; Bouabdallah, A.; Berge-Cherfaoui, V. Driver Drowsiness Measurement Technologies: Current Research, Market Solutions, and Challenges. Int. J. Intell. Transp. Syst. Res. 2019, 18, 297–319. [Google Scholar] [CrossRef]
- Mbouna, R.O.; Kong, S.G.; Chun, M.-G. Visual Analysis of Eye State and Head Pose for Driver Alertness Monitoring. IEEE Trans. Intell. Transp. Syst. 2013, 14, 1462–1469. [Google Scholar] [CrossRef]
- S. Maralappanavar; R. Behera; U. Mudenagudi. Driver’s distraction detection based on gaze estimation. in Proceedings of IEEE International Conference on Advances in Computing, Communications and Informatics, Jaipur, India, 2016. [CrossRef]
- Vicente, F.; Huang, Z.; Xiong, X.; De la Torre, F.; Zhang, W.; Levi, D. Driver Gaze Tracking and Eyes Off the Road Detection System. IEEE Trans. Intell. Transp. Syst. 2015, 16, 2014–2027. [Google Scholar] [CrossRef]
- Kopuklu; J. Zheng; H. Xu; G. Rigoll. Driver Anomaly Detection: A Dataset and Contrastive Learning Approach. IEEE Winter Conference on Applications of Computer Vision 2021, 91-100. 2021. [CrossRef]
- M. Sabet; R. A. Zoroofi; K. Sadeghniiat-Haghighi; M. Sabbaghian. A new system for driver drowsiness and distraction detection. 20th Iranian Conference on Electrical Engineering, Tehran, Iran, 2012, 1247-1251. [CrossRef]
- George; A. Routray. Real-time eye gaze direction classification using convolutional neural network. 2016 International Conference on Signal Processing and Communications, Bangalore, India, 2016, 1-5. [CrossRef]
- F. Zhang; J. Su; L. Geng; Z. Xiao. Driver Fatigue Detection Based on Eye State Recognition. 2017 International Conference on Machine Vision and Information Technology, Singapore, 2017, 105-110. [CrossRef]
- Awais, M.; Badruddin, N.; Drieberg, M. A Hybrid Approach to Detect Driver Drowsiness Utilizing Physiological Signals to Improve System Performance and Wearability. Sensors 2017, 17, 1991. [Google Scholar] [CrossRef]
- G. Zhenhai; L. DinhDat; H. Hongyu; Y. Ziwen; W. Xinyu. Driver Drowsiness Detection Based on Time Series Analysis of Steering Wheel Angular Velocity. 9th International Conference on Measuring Technology and Mechatronics Automation 2017, Changsha, China, 99-101. [CrossRef]
- Gaspar, J.G.; Brown, T.L.; Schwarz, C.W.; Lee, J.D.; Kang, J.; Higgins, J.S. Evaluating driver drowsiness countermeasures. Traffic Inj. Prev. 2017, 18, S58–S63. [Google Scholar] [CrossRef] [PubMed]
- K. S. Kim. The abbreviated word of EEG analysis, index and its definition. BioBrain Inc. 2017. Available online: http://biobraininc.blogspot.kr/.
- Wang, X.; Xu, C. Driver drowsiness detection based on non-intrusive metrics considering individual specifics. Accid. Anal. Prev. 2016, 95, 350–357. [Google Scholar] [CrossRef] [PubMed]
- P. Ebrahim; A. Abdellaoui; W. Stolzmann; B. Yang. Eyelid-based driver state classification under simulated and real driving conditions. IEEE International Conference on Systems, Man, and Cybernetics 2014, San Diego, CA, USA, 3190-3196. [CrossRef]
- E. Vural; M. Cetin; A. Ercil; G. Littlewort; M. Bartlett; J. Movellan. Machine learning systems for detecting driver drowsiness. In-vehicle corpus and signal processing for driver behavior 2009. 97-110.
- Liang, Y.; Horrey, W.J.; Howard, M.E.; Lee, M.L.; Anderson, C.; Shreeve, M.S.; O’brien, C.S.; Czeisler, C.A. Prediction of drowsiness events in night shift workers during morning driving. Accid. Anal. Prev. 2019, 126, 105–114. [Google Scholar] [CrossRef] [PubMed]
- François, C.; Hoyoux, T.; Langohr, T.; Wertz, J.; Verly, J.G. Tests of a New Drowsiness Characterization and Monitoring System Based on Ocular Parameters. Int. J. Environ. Res. Public Health 2016, 13, 174. [Google Scholar] [CrossRef] [PubMed]
- Garcia; S. Bronte; L. M. Bergasa; J. Almazan; J. Yebes. Vision-based drowsiness detector for real driving conditions. 2012 IEEE Intelligent Vehicles Symposium, Alcalá de Henares, Spain, 618-623. 978-1-4673-2118-1.
- C. H. Weng; Y. H. Lai; S. H. Lai. Driver drowsiness detection via a hierarchical temporal deep belief network. Computer Vision–ACCV 2016 Workshops: ACCV 2016 International Workshops, Taipei, Taiwan, November 20-24, 2016, 117-133. [CrossRef]
- T. H. Shih; C. T. Hsu. MSTN: Multistage spatial-temporal network for driver drowsiness detection. Computer Vision–ACCV 2016 Workshops: ACCV 2016 International Workshops, Taipei, Taiwan, November 20-24, 2016, 146-153, Lecture Notes in Computer Science, 10118, Springer. [CrossRef]
- X. P. Huynh; S. M. Park; Y. G. Kim. Detection of driver drowsiness using 3D deep neural network and semi-supervised gradient boosting machine. Computer Vision–ACCV 2016 Workshops: ACCV 2016 International Workshops, Taipei, Taiwan, November 20-24, 2016, 134-145, Lecture Notes in Computer Science, 10118. Springer.
|
Disclaimer/Publisher’s Note: The statements, opinions and data contained in all publications are solely those of the individual author(s) and contributor(s) and not of MDPI and/or the editor(s). MDPI and/or the editor(s) disclaim responsibility for any injury to people or property resulting from any ideas, methods, instructions or products referred to in the content. |
© 2023 by the authors. Licensee MDPI, Basel, Switzerland. This article is an open access article distributed under the terms and conditions of the Creative Commons Attribution (CC BY) license (http://creativecommons.org/licenses/by/4.0/).


