Submitted:
05 October 2023
Posted:
05 October 2023
You are already at the latest version
Abstract
Keywords:
1. Introduction
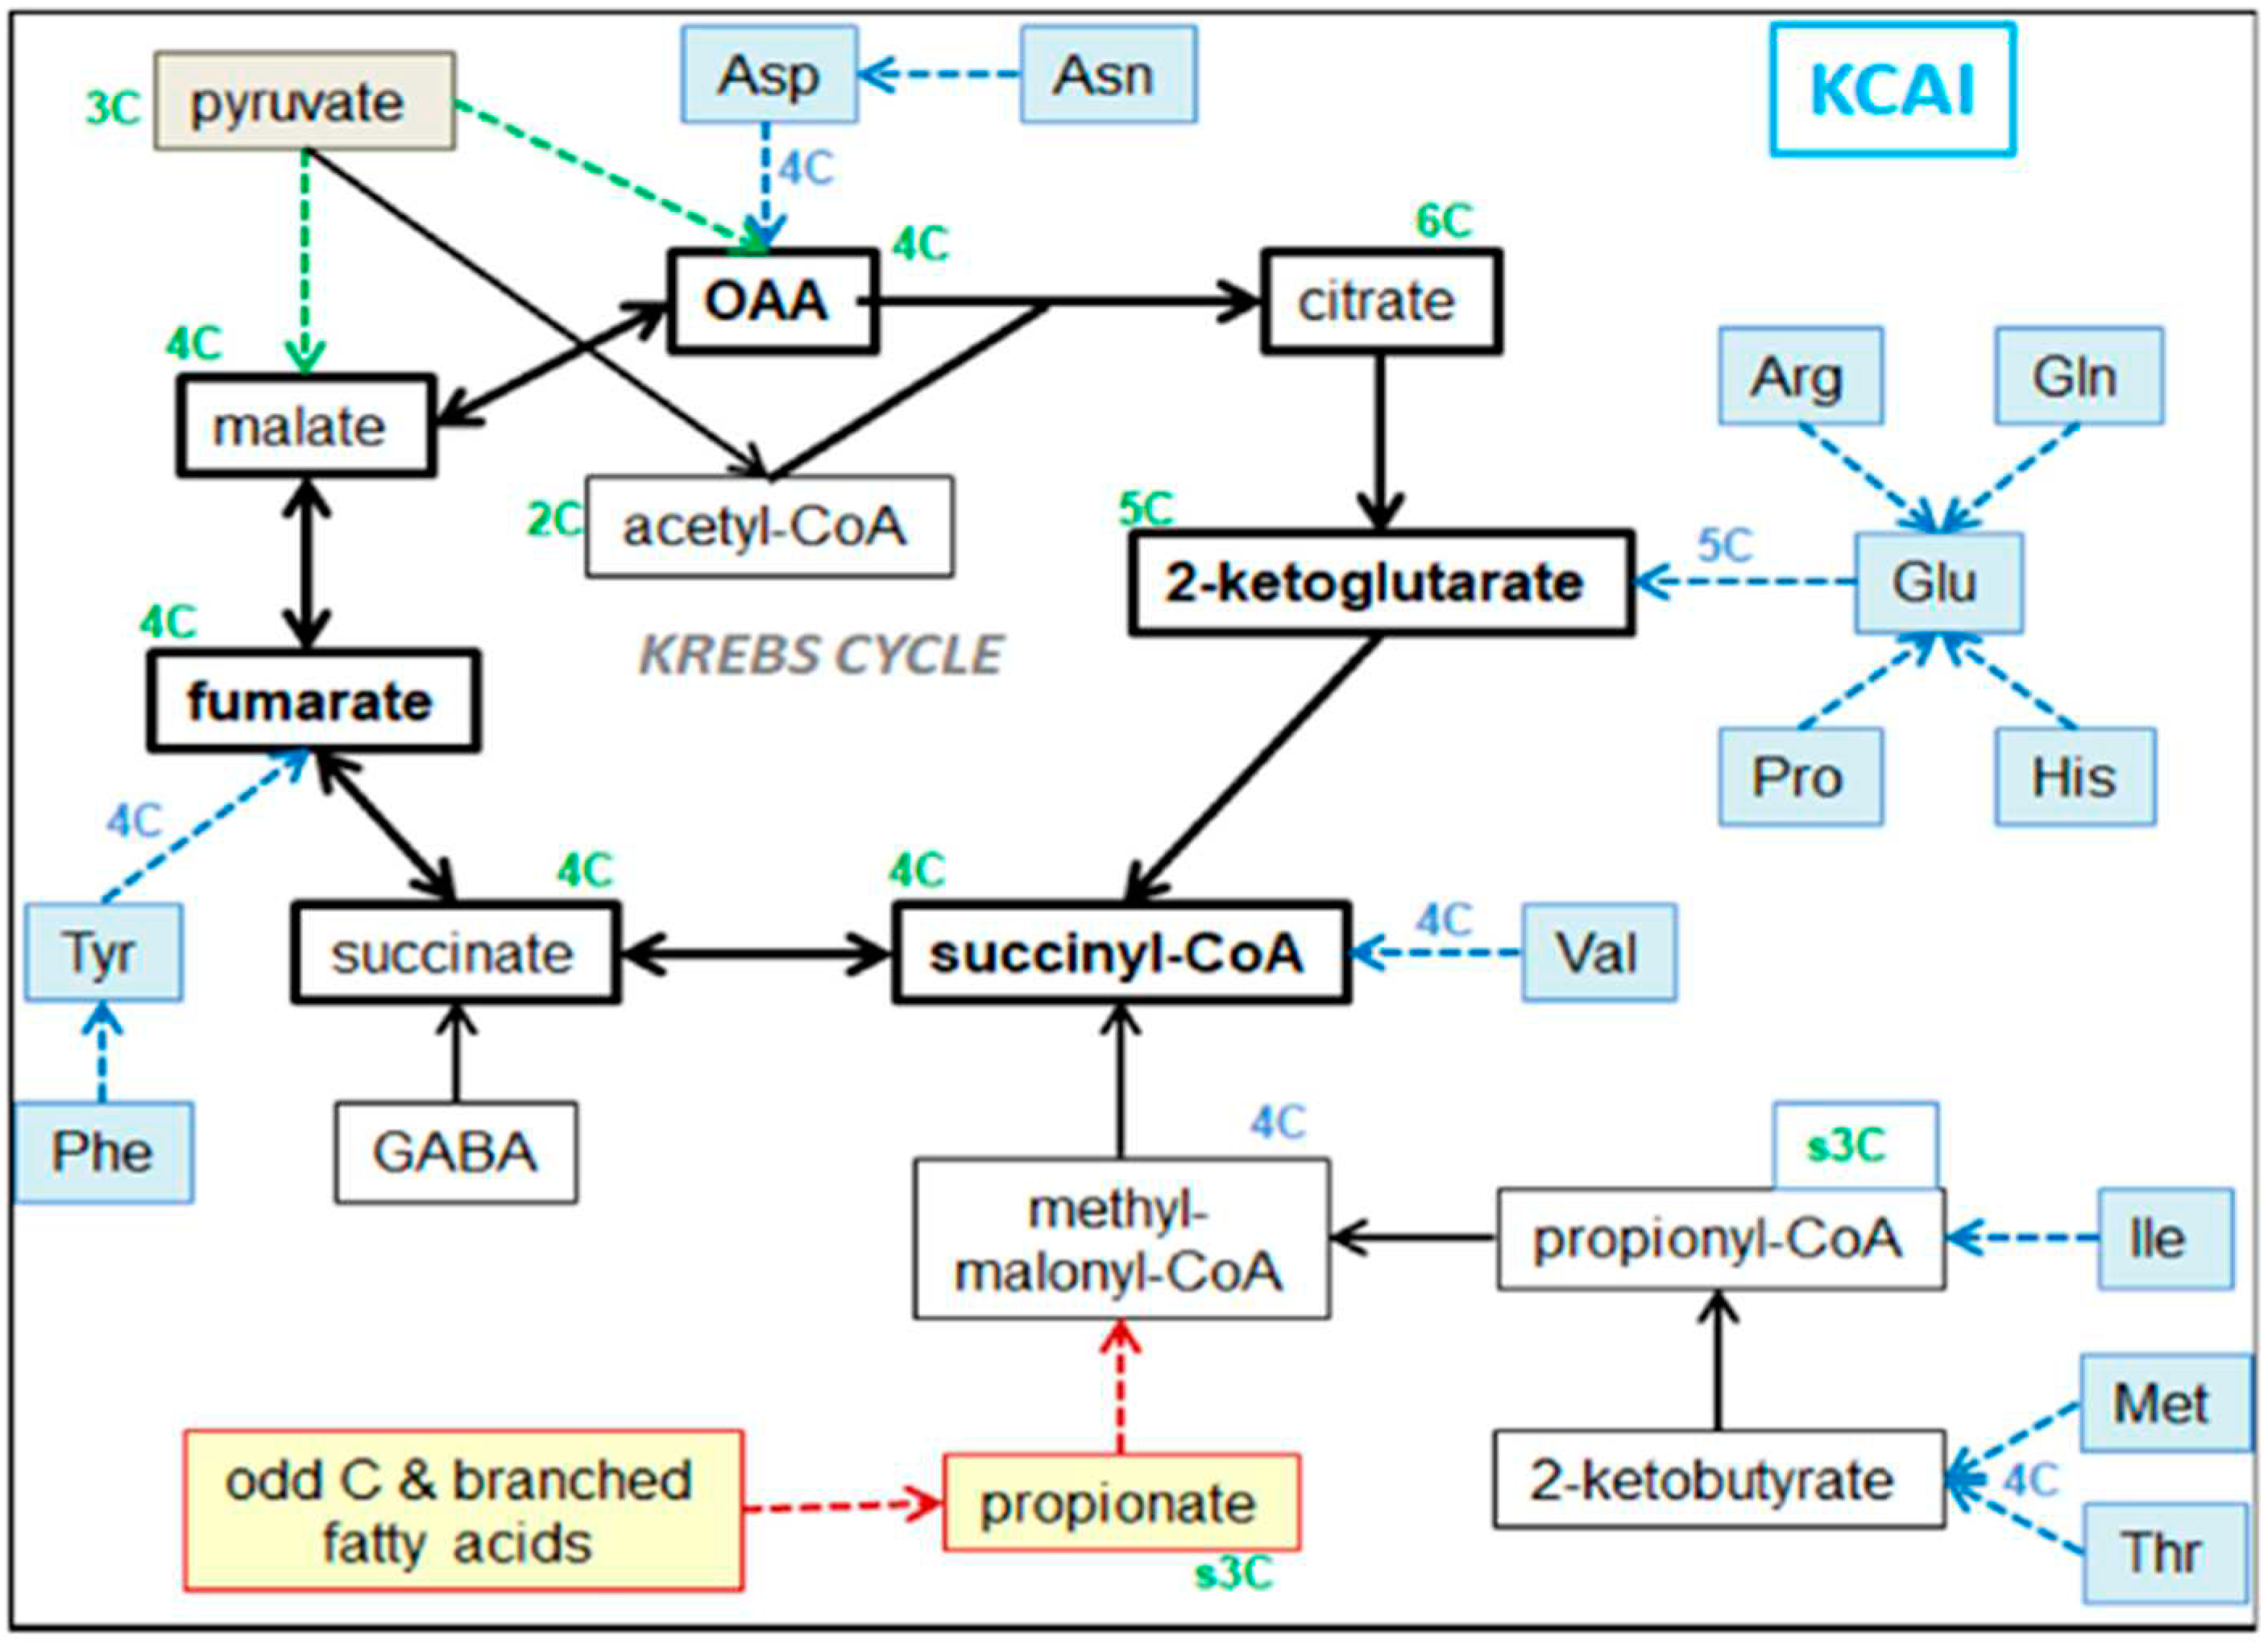
Diet composition and energy partition
Hormones and energy partition
2. Results
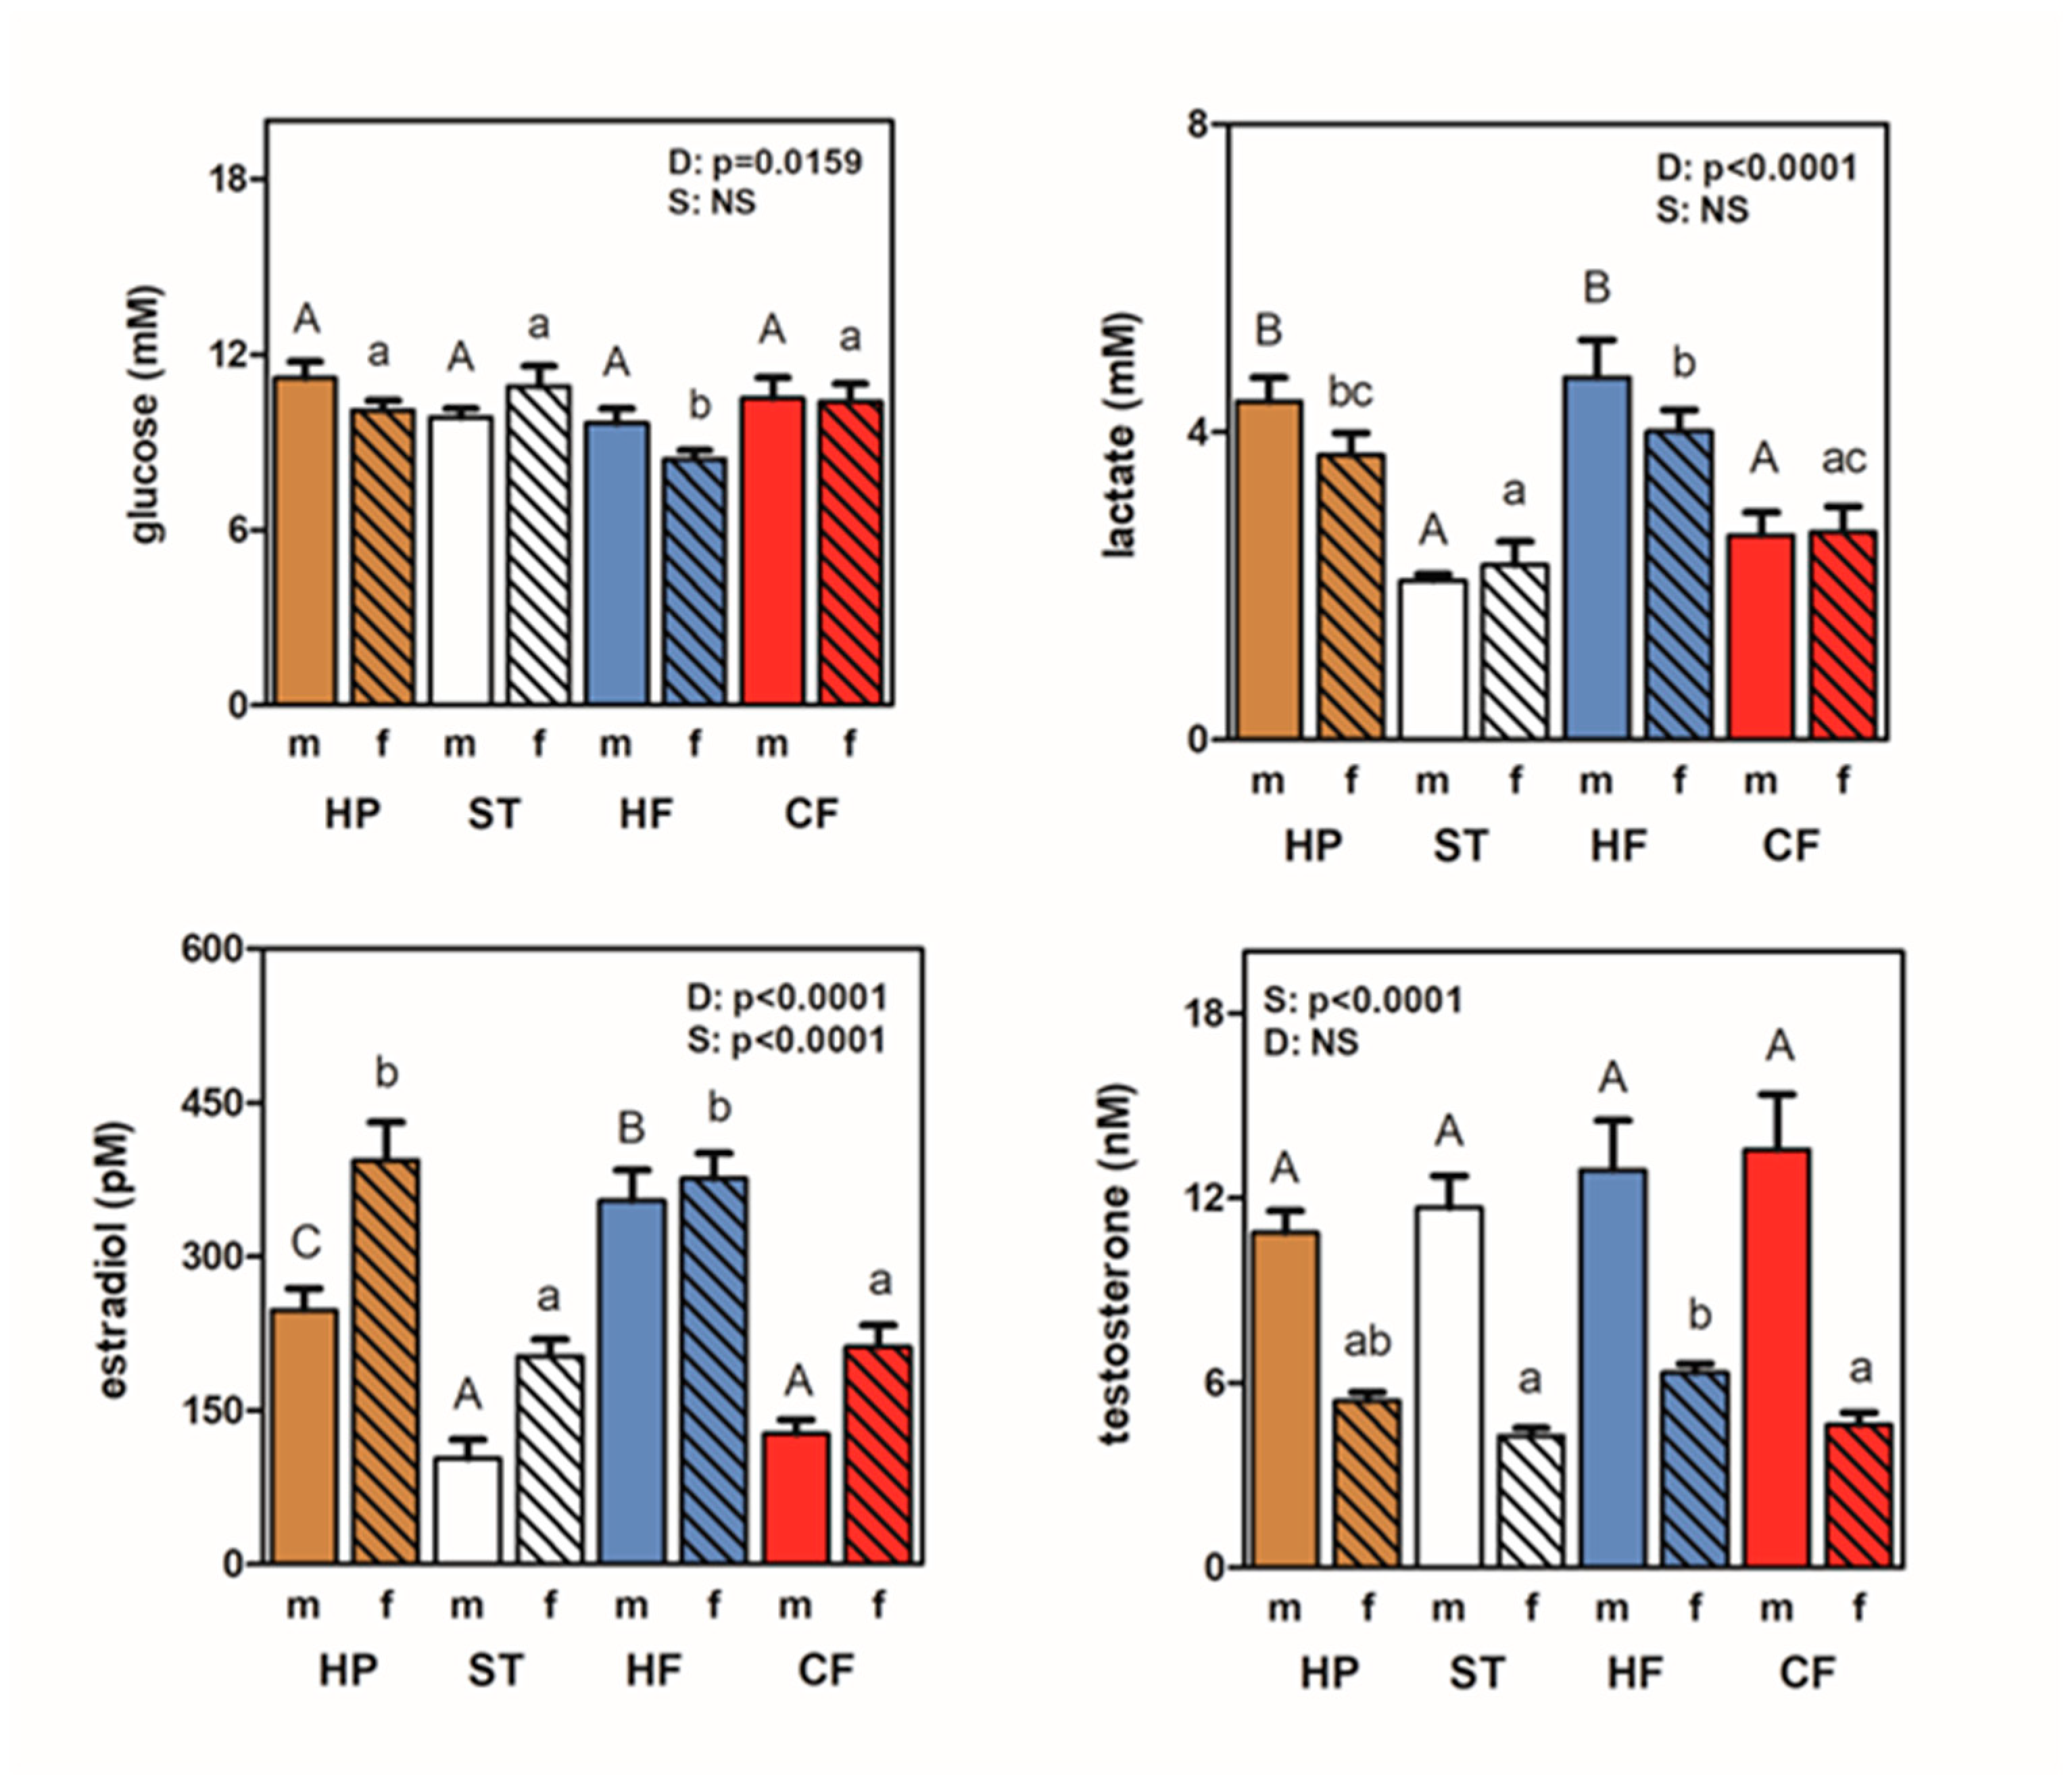
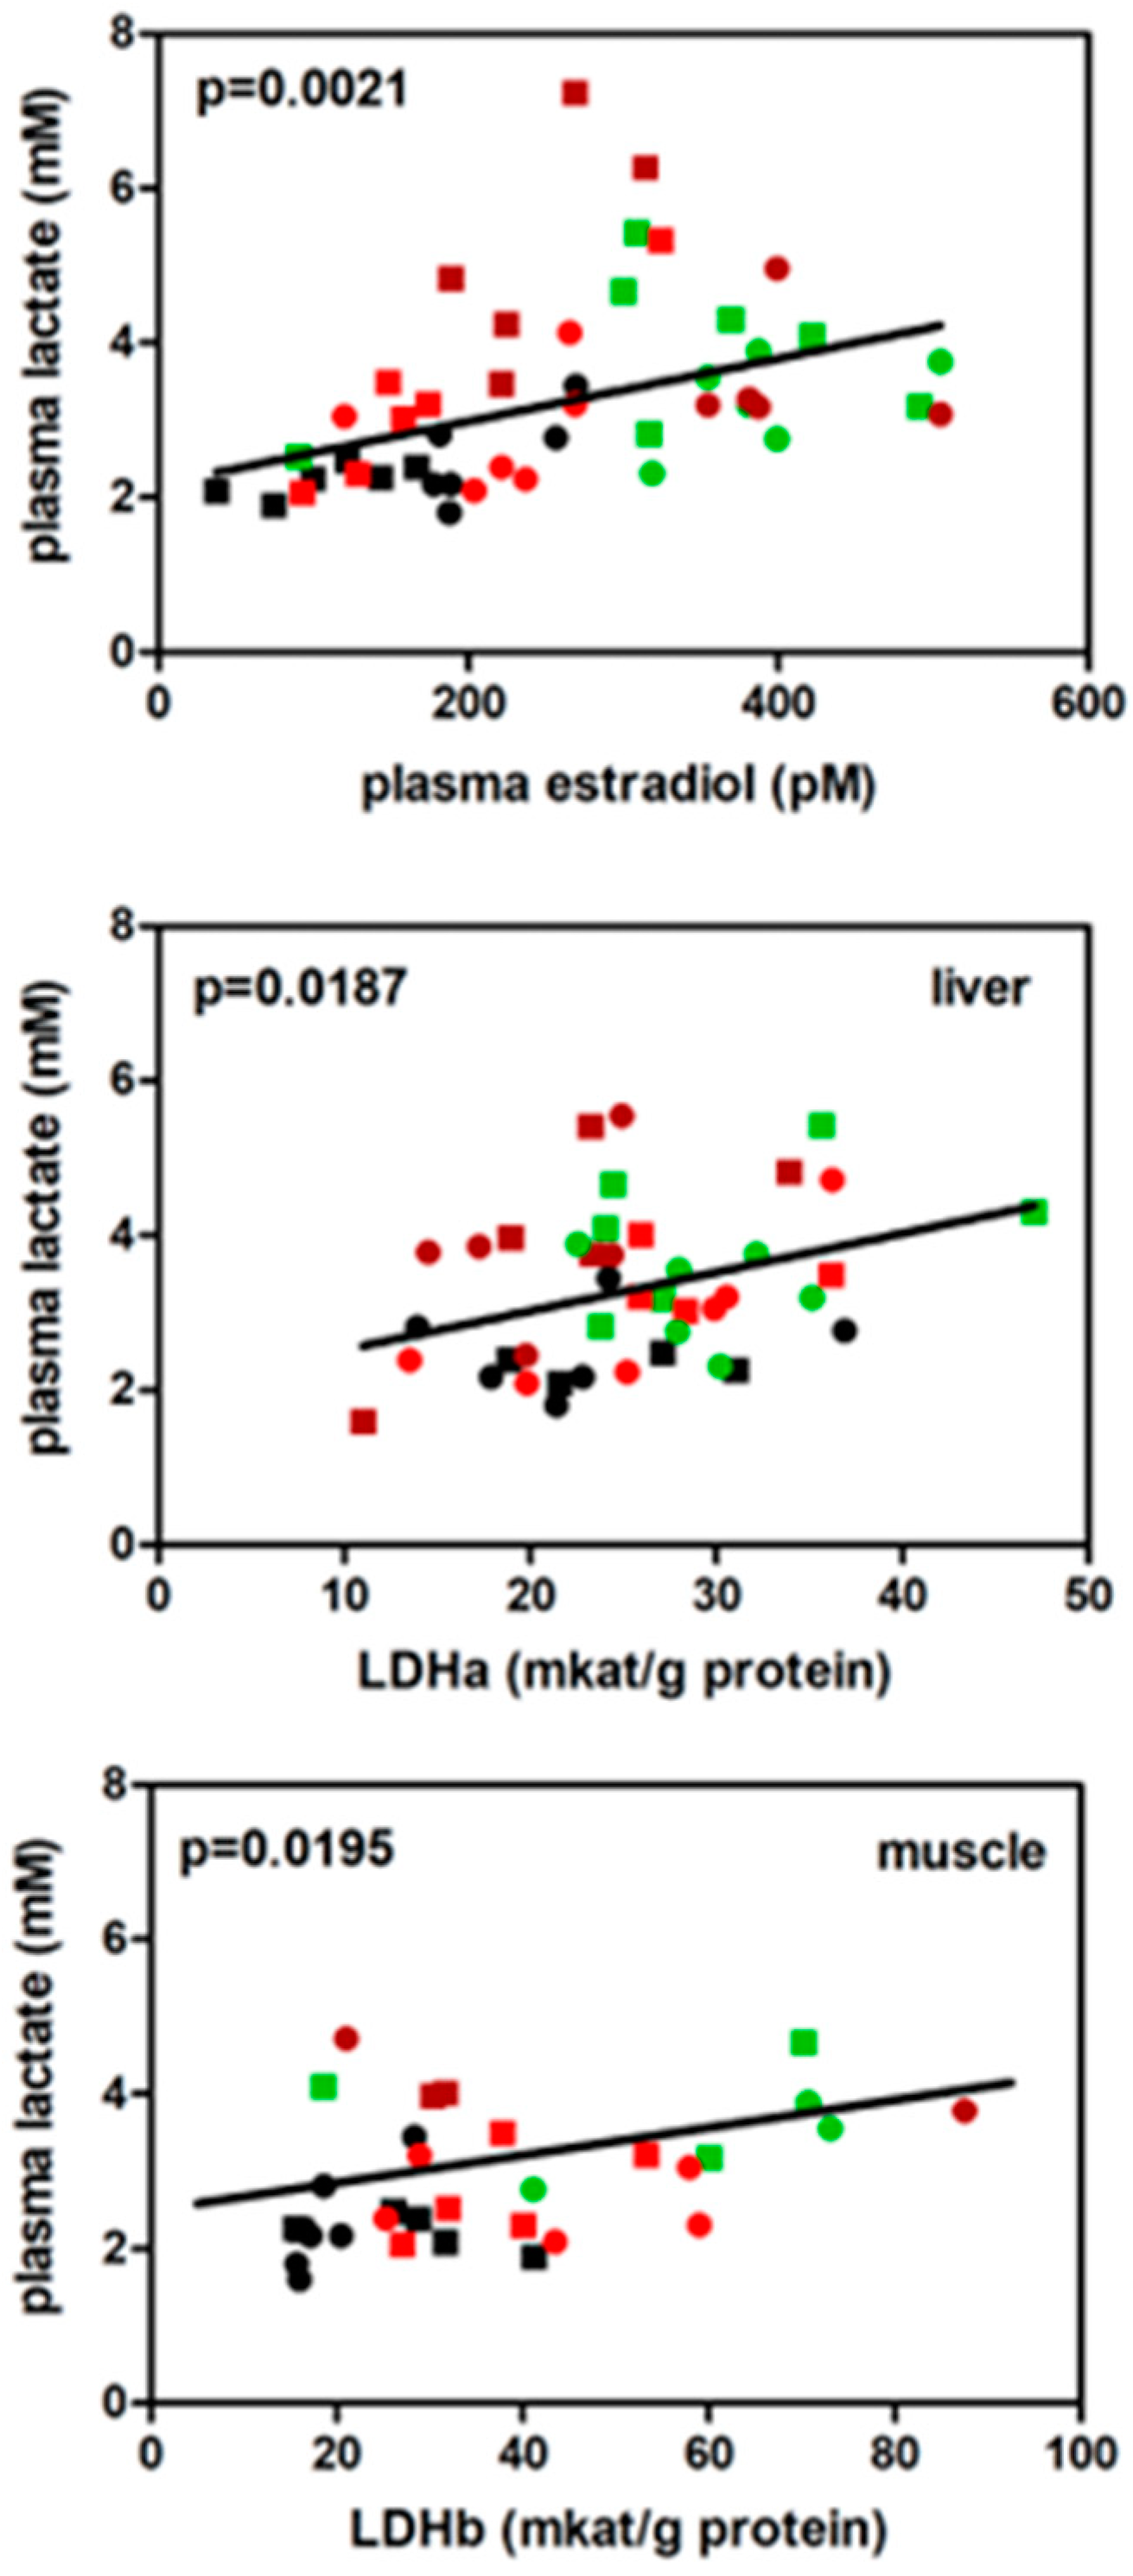
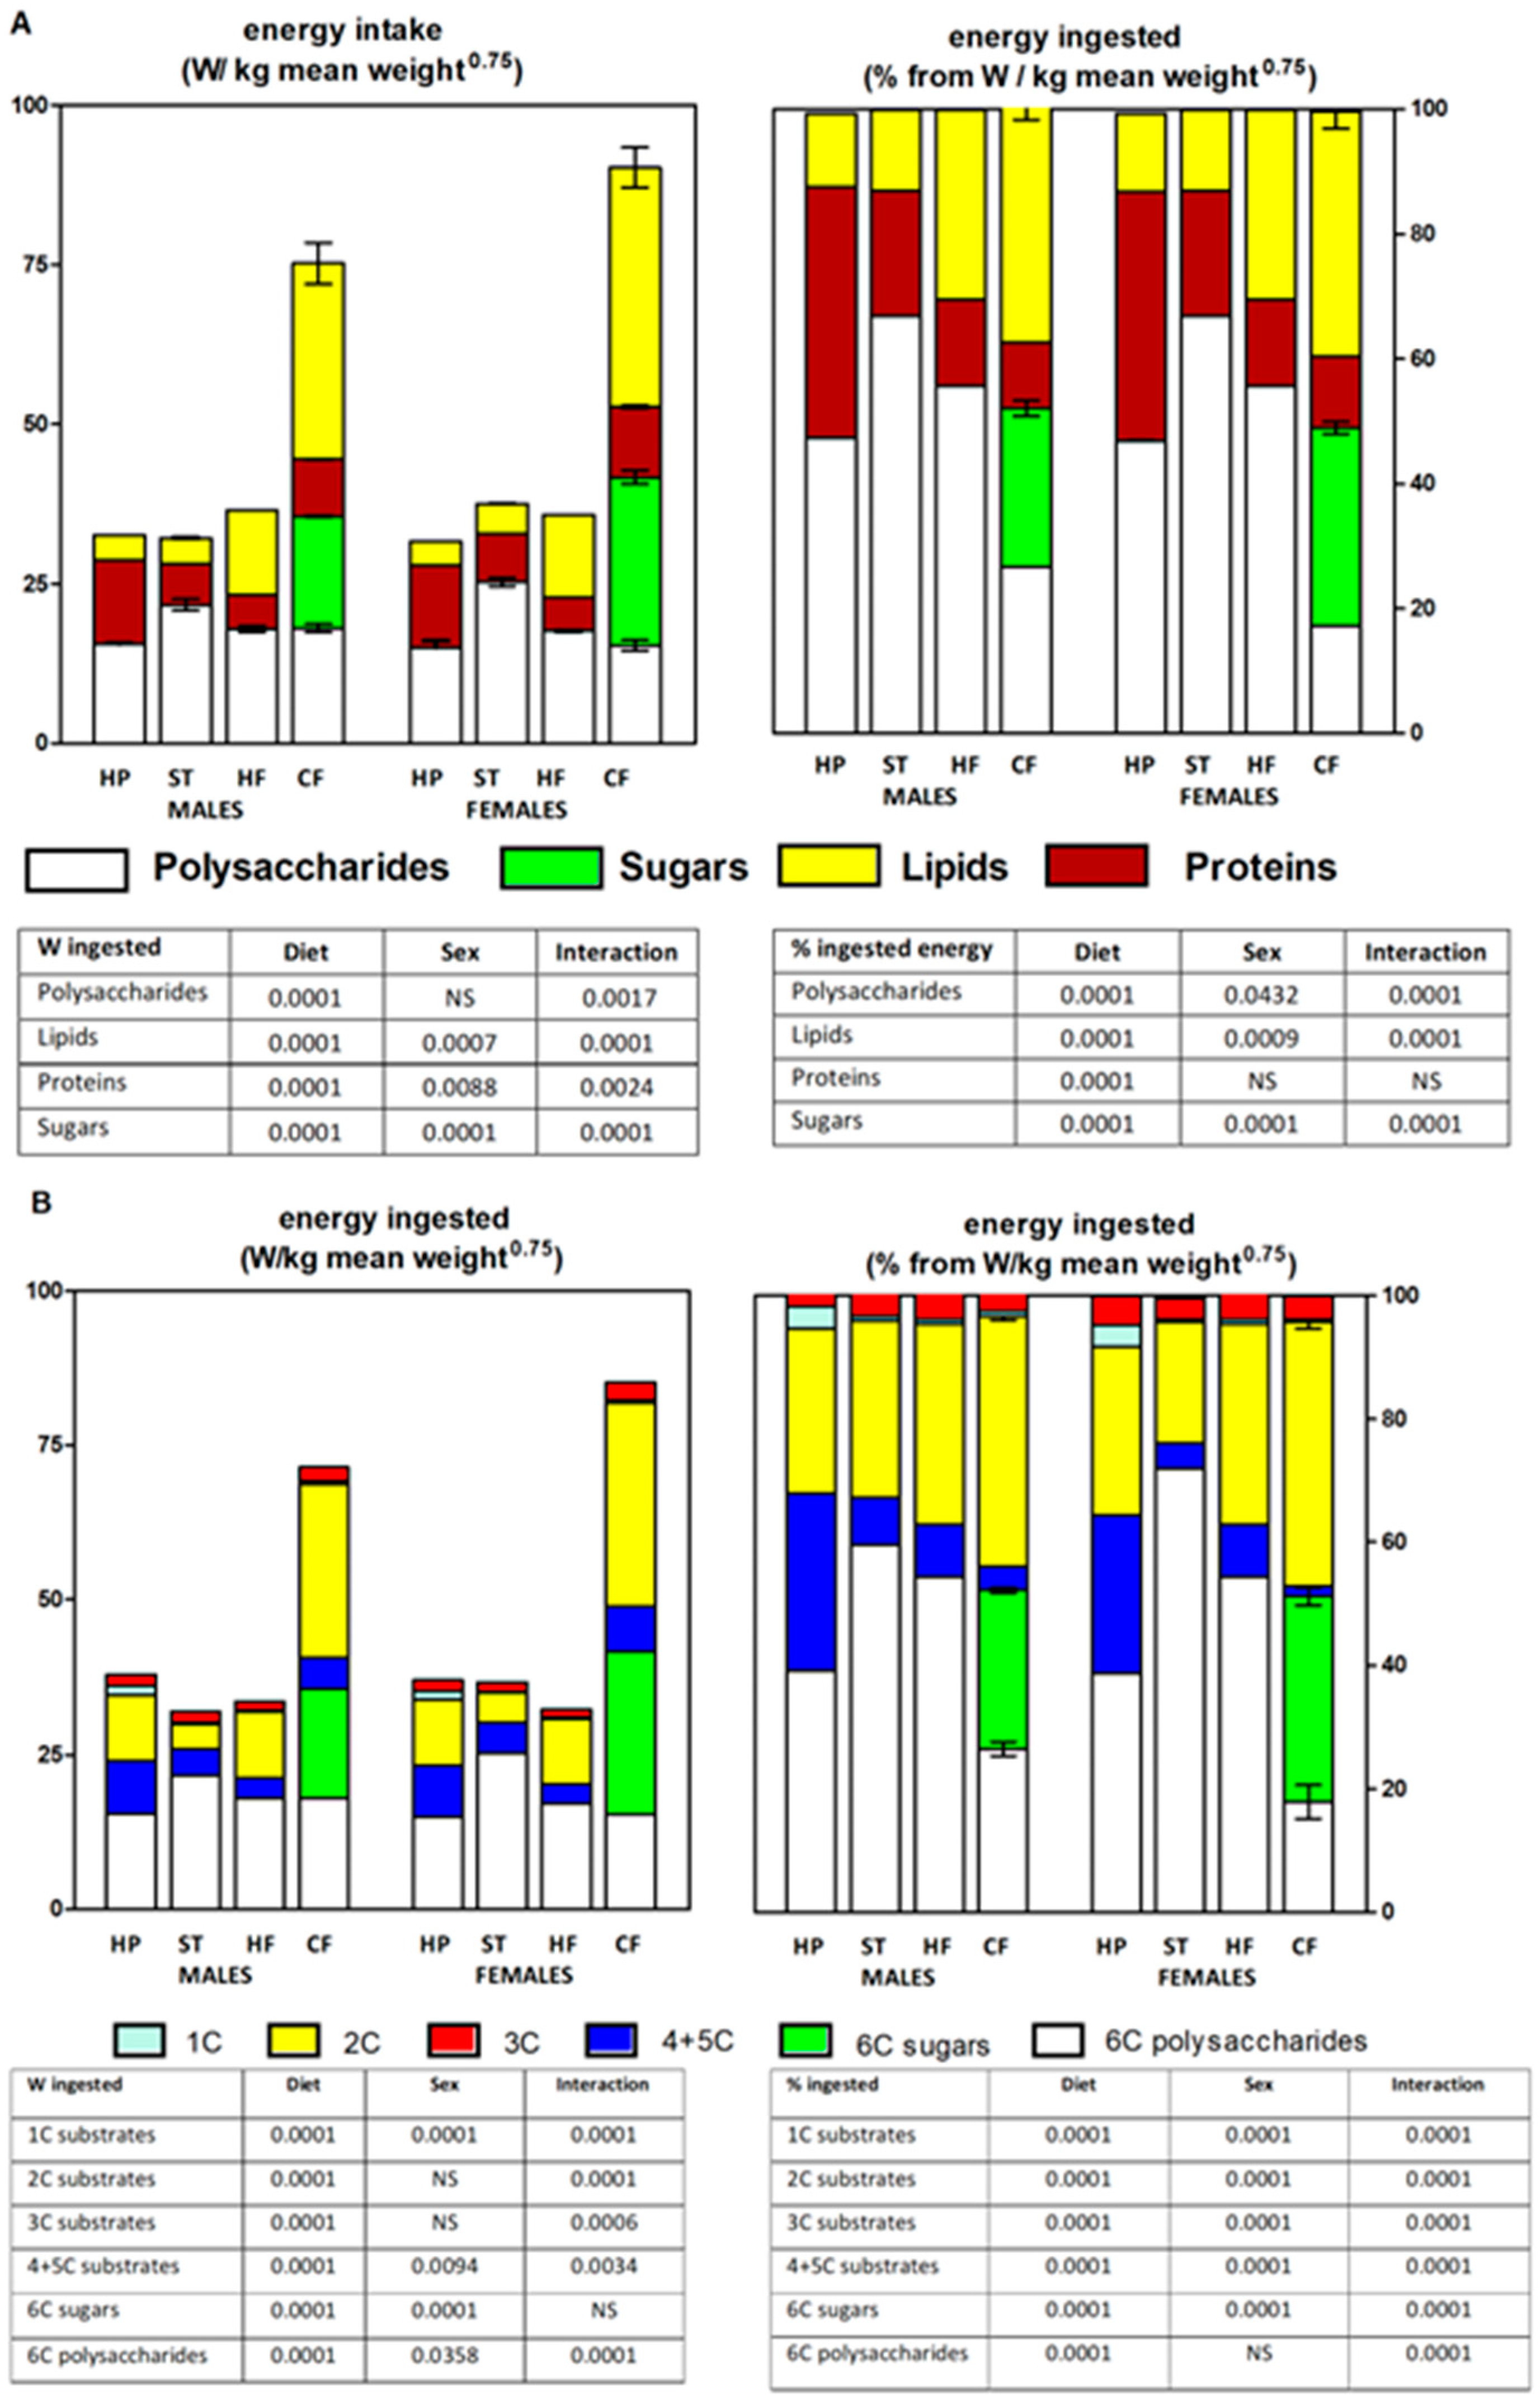

3. Discussion
4. Materials and Methods
4.1. Animals and experimental setup
4.2. Diets
4.3. Experimental procedure
4.4. Analytical procedures
4.5. Data homogenization. Calculations
Supplementary Materials
Author Contributions
Funding
Institutional Review Board Statement
Data Availability Statement
Conflicts of Interest
Appendix A
A question of definitions.
1. Rat weight changes
2. Diet composition and analysis
2.1. Amino acid analyses and composition of diets
2.2. Fatty acid composition of diets
2.3. The model of energy used
2.4. Triacylglycerols
2.5. Amino acids
2.6. Dietary starches and sugars
3. Body composition
References
- Remesar, X.; Alemany, M. Dietary Energy Partition: The Central Role of Glucose. Int J Mol Sci 2020, 21, 7729. [Google Scholar] [CrossRef]
- Oliva, L.; Alemany, M.; Fernández-López, J.A.; Remesar, X. Circulating oestradiol determines liver lipid deposition in rats fed standard diets partially unbalanced with higher lipid or protein proportions. Br J Nutr 2022, 128, 1499–1508. [Google Scholar] [CrossRef]
- Chalvon-Demersay, T.; Blachier, F.; Tomé, D.; Blais, A. Animal models for the study of the relationships between diet and obesity: a focus on dietary protein and estrogen deficiency. Front Nutr 2017, 4, 5. [Google Scholar] [CrossRef]
- Zhou, J.; Keenan, M.J.; Losso, J.N.; Raggio, A.M.; Shen, L.; McCutcheon, K.L.; Tulley, R.T.; Blackman, M.R.; Martin, R.J. Dietary whey protein decreases food intake and body fat in rats. Obesity 2011, 19, 1568–1573. [Google Scholar] [CrossRef]
- Esteve, M.; Rafecas, I.; Fernández-López, J.A.; Remesar, X.; Alemany, M. Dietary amino acid balances in young Wistar rats fed a cafeteria diet. Biochem Mol Biol Int 1993, 29, 1069–1081. [Google Scholar]
- Hariri, N.; Thibault, L. High-fat diet-induced obesity in animal models. Nutr Res Rev 2010, 23, 270–299. [Google Scholar] [CrossRef]
- Romero, M.M.; Roy, S.; Pouillot, K.; Feito, M.; Esteve, M.; Grasa, M.M.; Fernández-López, J.A.; Alemany, M.; Remesar, X. Treatment of rats with a self-selected hyperlipidic diet; increases the lipid content of the main adipose tissue sites in a proportion similar to that of the lipids in the rest of organs and tissues. PloSOne 2014, 9, e90995. [Google Scholar] [CrossRef]
- Davis, C.; Loxton, N.J. A psycho-genetic study of hedonic responsiveness in relation to “Food Addiction”. Nutrients 2014, 6, 4338–4353. [Google Scholar] [CrossRef]
- Oliva, L.; Aranda, T.; Caviola, G.; Fernández-Bernal, A.; Alemany, M.; Fernández-López, J.A.; Remesar, X. In rats fed high-energy diets; taste; rather than fat content; is the key factor increasing food intake: a comparison of a cafeteria and a lipid-supplemented standard diet. PeerJ 2017, 5, e3697. [Google Scholar] [CrossRef]
- Ferrer-Lorente, R.; Fernández-López, J.A.; Alemany, M. Estimation of the metabolizable energy equivalence of dietary proteins. Eur J Nutr 2007, 46, 1–11. [Google Scholar] [CrossRef]
- Owen, O.E.; Kalhan, S.C.; Hanson, R.W. The key role of anaplerosis and cataplerosis for citric acid cycle function. J Biol Chem 2002, 277, 30409–12. [Google Scholar] [CrossRef] [PubMed]
- Wieland, O.H. The mammalian pyruvate dehydrogenase complex: Structure and regulation. Rev Physiol Biochem Pharmacol 1983, 96, 123–170. [Google Scholar] [PubMed]
- Jenkins, B.; West, J.A.; Koulman, A. A review of odd-chain fatty acid metabolism and the role of pentadecanoic acid (C15:0) and heptadecanoic acid (C17:0) in health and disease. Molecules 2015, 20, 2425–2444. [Google Scholar] [CrossRef] [PubMed]
- Simpson, E.; Jones, M.; Misso, M.; Hewitt, K.; Hill, R.; Maffei, L.; Carani, C.; Boon, W.C. Estrogen; a fundamental player in energy homeostasis. J Steroid Biochem Mol Biol 2005, 95, 3–8. [Google Scholar] [CrossRef]
- Xu, Y.; Lopez, M. Central regulation of energy metabolism by estrogens. Mol Metab 2018, 15, 104–115. [Google Scholar] [CrossRef]
- Alemany, M. Estrogens and the regulation of glucose metabolism. World J Diabetes 2021. [Google Scholar] [CrossRef]
- Fukushima, A.; Hagiwara, H.; Fujioka, H.; Kimura, F.; Akema, T.; Funabashi, T. Sex differences in feeding behavior in rats: relationship with neuronal activation in the hypothalamus. Front Neurosci 2015, 9, 88. [Google Scholar] [CrossRef]
- Mauvais-Jarvis, F.; Clegg, D.J.; Henever, A.L. The role of estrogens in control of energy balance and glucose homeostasis. Endocr Rev 2013, 34, 309–338. [Google Scholar] [CrossRef]
- Alemany, M. The roles of androgens in humans: Biology, Metabolic regulation and health. Int J Mol Sci 2022, 23, 11952. [Google Scholar] [CrossRef]
- Muraleedharan, V.; Jones, T.H. Testosterone and the metabolic syndrome. Therapy Adv Endocrinol Metab 2010, 1, 207–223. [Google Scholar] [CrossRef]
- Vermeulen, A.; Kaufman, J.M.; Goemaere, S.; van Pottelberg, I. Estradiol in elderly men. Aging Male 2002, 5, 98–102. [Google Scholar] [CrossRef] [PubMed]
- Kelly, D.M.; Jones, T.H. Testosterone: a metabolic hormone in health and disease. J Endocrinol 2013, 217, R25–R45. [Google Scholar] [CrossRef] [PubMed]
- Guillaume, M.; Handgraaf, S.; Fabre, A.; Raymond-Letron, I.; Riant, E.; Montagner, A.; Vinel, A.; Buscato, M.; Smirnova, N.; Fontaine, C.; Guillou, H.; Arnal, J.F.; Gourdy, P. Selective activation of estrogen receptor α activation function-1 is sufficient to prevent obesity; steatosis; and insulin resistance in mouse. Am J Pathol 2017, 187, 1273–1287. [Google Scholar] [CrossRef] [PubMed]
- Klinge, C.M. Estrogenic control of mitochondrial function. Redox Biol 2020, 31, 101435. [Google Scholar] [CrossRef] [PubMed]
- Bowler-Kinley, M.M.; Davis, W.I.; Wu, P.F.; Harris, R.A. Popov K.M. Evidence for existence of tissue-specific regulation of the mammalian pyruvate dehydrogenase complex. Biochem J 1998, 329, 191–196. [Google Scholar] [CrossRef] [PubMed]
- Bian, C.; Bai, B.; Cao, C.; Li, S.; Zhao, Y. 17β-estradiol regulates glucose metabolism and insulin secretion in rat islet β cells through GPER and Akt/mTOR/GLUT2 pathway. Front Endocrinol 2019, 10, 511. [Google Scholar] [CrossRef]
- Gorres, B.K.; Bomhoff, G.L.; Morris, K.; Geiger, P.C. In vivo stimulation of estrogen receptor α increases insulin-stimulated skeletal muscle glucose uptake. J Physiol 2011, 598, 2041–2054. [Google Scholar] [CrossRef]
- Burning, P.F. : Bonfrèr JMG. Free Fatty Acid Concentrations Correlated with the Available Fraction of Estradiol in Human Plasma. Cancer Res 1986, 46, 2606–2609. [Google Scholar]
- Navarro, G.; Allard, C.; Xu, W.; Mauvais-Jarvis, F. The role of androgens in metabolism; obesity and diabetes in males and females. Obesity 2015, 23, 713–719. [Google Scholar] [CrossRef]
- Rossetti, M.L.; Steiner, J.L.; Gordon, B.S. Androgen-mediated regulation of skeletal muscle protein balance. Mol Cell Endocrinol 2017, 447, 35–44. [Google Scholar] [CrossRef]
- Kuo, T.; McQueen, A.; Chen, T.-C.; Wang, J.-C. Regulation of glucose homeostasiss by glucocorticoids. Adv Exp Med Biol 2015, 872, 99–126. [Google Scholar] [CrossRef] [PubMed]
- Obayashi, M.; Shimomura, Y.; Nakai, N.; Jeoung, N.H.; Nahgasaki, M.; Murakami, T.; Sato, Y.; Harris, R.A. Estrogen controls branched-chain amino acid catabolism in female rats. J Nutr 2004, 134, 26-28-2633. [Google Scholar] [CrossRef]
- Arnold, P.K.; Finley, L.W.S. Regulation and function of the mammalian tricarboxylic acid cycle. J Biol Chem 2023, 299, 102838. [Google Scholar] [CrossRef] [PubMed]
- Kitabchi, A.E.; McDaniel, K.A.; Wan, J.Y.; Tylavsky, F.A.; Jacovino, C.A.; Sands, C.W.; Nyenwe, E.A.; Stentz, F.B. Effects of high-protein versus high-carbohydrate diets on markers of β-cell function; oxidative stress; lipid peroxidation; proinflammatory cytokines; and adipokines in obese; premenopausal women without diabetes. A randomized controlled trial. Diabetes Care 2013, 36, 1919–25. [Google Scholar] [CrossRef]
- Tang, M.H.; Armstrong, C.L.H.; Leidy, H.J.; Campbell, W.W. Normal vs. high-protein weight loss diets in men: effects on body composition and indices of metabolic syndrome. Obesity 2013, 21, E204–E210. [Google Scholar] [CrossRef]
- Cahill, G.F.; Aoki, T.T. Starvation and body nitrogen. Trans Am Clin Climatol Assoc 1971, 82, 43–51. [Google Scholar]
- Karasov, W.H.; Diamond, J.M. Interplay between Physiology and Ecology in digestion. BioScience 1988, 35, 602–611. [Google Scholar] [CrossRef]
- Lindsay, D.B. Amino acids as energy sources. Proc Nutr Soc 1980, 39, 53–59. [Google Scholar] [CrossRef]
- Liu, J.; Bisschop, P.H.; Eggels, L.; Foppen, E.; Ackermans, M.T.; Zhou, J.N.; Fliers, E.; Kalsbeek, A. Intrahypothalamic Estradiol regulates glucose metabolism via the sympathetic nervous system in female rats. Diabetes 2013, 62, 435–443. [Google Scholar] [CrossRef]
- Esteve, M.; Rafecas, I.; Remesar, X.; Alemany, M. Nitrogen balance of lean and obese Zucker rats subjected to a cafeteria diet. Int J Obes 1992, 16, 237–244. [Google Scholar]
- Prats, E.; Monfar, M.; Iglesias, R.; Castellà, J.; Alemany, M. Energy intake of rats fed a cafeteria diet. Physiol Behav 1989, 45, 263–272. [Google Scholar] [CrossRef] [PubMed]
- Oliva, L.; Aranda, T.; Alemany, M.; Fernández-López, J.A.; Remesar, X. Unconnected body accrual of dietary lipid and protein in rats fed diets with different lipid and protein content. Mol Nutr Food Res 2020, 64, 2000265. [Google Scholar] [CrossRef] [PubMed]
- Oliva, L.; Alemany, M.; Remesar, X.; Fernández-López, J.A. The food energy/protein ratio regulates rat urea cycle operation but not total nitrogen losses. Nutrients 2019, 11, 316. [Google Scholar] [CrossRef]
- García-Peláez, B.; Vilà, R.; RemesarX. Maternal treatment with oleoyl-estrone induces resistance to lipid accrual in their descendants. Obesity 2008, 16, 2223–2231. [Google Scholar] [CrossRef] [PubMed]
- Esteve, M.; Rafecas, I.; Fernández-López, J.A.; Remesar, X.; Alemany, M. Fatty acid utilization by young Wistar rats fed a cafeteria diet. Mol Cell Biochem 1992, 118, 67–74. [Google Scholar] [CrossRef]
- Eastoe, J.E. The amino acid composition of mammalian collagen and gelatin. Biochem J 1955, 61, 4, 589–600. [Google Scholar] [CrossRef]
- Hall, W.L.; Millward, D.J.; Long, S.J.; Morgan, L.M. Casein and whey exert different effects on plasma amino acid profiles, gastrointestinal hormone secretion and appetite. Br J Nutr 2003, 89, 239–248. [Google Scholar] [CrossRef]
- Rafecas, I.; Esteve, M.; Fernández-López, J.A.; Remesar, X.; Alemany, M. Individual amino acid balances in young lean and obese Zucker rats fed a cafeteria diet. MolCell Biochem 1993, 121, 45–58. [Google Scholar] [CrossRef]
- Folch, J.; Lees, M.; Sloane- Stanley, G.H. A Simple Method for the Isolation and Purification of Total Lipides from Animal Tissues. J Biol Chem 1957, 226, 497–509. [Google Scholar] [CrossRef]
- Remesar, X.; Antelo, A.; Llivina, C.; Albà, E.; Berdié, L.; Agnelli, S.; Arriarán, S.; Fernández-López, J.A.; Alemany, M. Influence of a hyperlipidic diet on the composition of the non-membrane lipid pool of red blood cells of male and female rats. Peer J 2015, 3, e1083. [Google Scholar] [CrossRef]
- Miwa, I.; Maeda, K.; Okuda, J. Anomeric compositions of D-glucose in tissues and blood of rat. Experientia 1978, 34, 167–169. [Google Scholar] [CrossRef]
- Oliva, L.; Barón, C.; Fernández-López, J.A.; Remesar, X.; Alemany, M. Marked increase in rat red blood cell membrane protein glycosylation by one-month treatment with a cafeteria diet. PeerJ 2015, 3, e1101. [Google Scholar] [CrossRef] [PubMed]
- Arriarán, S.; Agnelli, S.; Sabater, D.; Remesar, X.; Fernández-López, J.A.; Alemany, M. Evidence of basal lactate production in the main white adipose tissue sites of rats. Effects of sex and a cafeteria diet. PlosOne 2015, 10, e0119572. [Google Scholar] [CrossRef] [PubMed]
- Bender, D.A. Amino acid metabolism, 2nd ed.; John Wiley & Sons: Chichester, United Kingdom, 1985; ISBN 9780470661512. [Google Scholar]
- Kalivianakis, M.; Minich, D.M.; Havinga, R.; Kuipers, F.; Stellaard, F.; Vonk, R.J.; Verkade, H, J. Detection of impaired intestinal absorption of long-chain fatty acids: validation studies of a novel test in a rat model of fat malabsorption. Am J Clin Nutr 2000, 72, 174–180. [Google Scholar] [CrossRef] [PubMed]
- Kleiber, M. Body size and metabolic rate. Phys Rev 1947, 27, 511–541. [Google Scholar] [CrossRef]
- Schmidt-Nielsen, K. Energy metabolism; body size and problems of scaling. Fed Proc 1970, 29, 1524–1532. [Google Scholar]
- Roberts, B.; McCrory, M.A.; Saltzman, E. The Influence of Dietary Composition on Energy Intake and Body Weight. J Amer Coll Nutr 2002, 21, 140S–145S. [Google Scholar] [CrossRef]
- López-Martí, J.; Díaz-Silva, M.; Salas, A.; Grasa, M.M.; Fernández-López, J.A.; Remesar, X.; Alemany, M. Oleoyl-estrone induces the massive loss of body weight in Zucker fa/fa rats fed a high-energy diet. J Nutr Biochem 2000, 11, 530–535. [Google Scholar] [CrossRef]
- Huang, Q.; Riviere, J.E. The application of allometric scaling principles to predict pharmacokinetic parameters across species. Expert Opin Drug Metab Toxicol 2014, 10, 1241–1253. [Google Scholar] [CrossRef]
- Palmisano, B.T.; Zhu, L.; Stafford, J.M. Estrogens in the regulation of liver lipid metabolism. Adv Exper Med Biol 2017, 1043, 227–256. [Google Scholar] [CrossRef]
- Della Torre, S.; Mitro, N.; Meda, C.; Lolli, F.; Pedretti, S.; Barcella, M.; Ottobrini, L.; Metzger, D.; Caruso, D.; Maggii, A. Short-term fasting reveals amino acid metabolism as a major sex- discriminating factor in the liver. Cell Metab 2018, 28, 256–267. [Google Scholar] [CrossRef] [PubMed]
- Stubbs, J.; Ferres, S.; Horgan, G. Energy Density of Foods: Effects on Energy Intake. Crit Rev Food Sci Nutr 2000, 6, 481–515. [Google Scholar] [CrossRef] [PubMed]
- Roncal-Jimenez, C.J.; Lanaspa, M.A.; Rivard, C.J. Nakagawa, T.; Sanchez-Lozada, G.; Jalal, D.; Andres-Hernando, A.; Tanabe, K.; Madero, M.; Li, N.; Cicerchi, C.; Mc Fann, K.; Sautin, Y.Y.; Johnson, R.J. Sucrose induces Fatty Liver and Pancreatic Inflammation in Male Breeder Rats Independent of Excess Energy Intake. Metabolism 2011, 60, 1259–1270. [Google Scholar] [CrossRef] [PubMed]
- Basciano, H.; Federico, L.; Adeli, K. Fructose, insulin resistance, and metabolic dyslipemia. Nutr Metab 2005, 2, 5. [Google Scholar] [CrossRef] [PubMed]
- Reaven, G. The metabolic syndrome or the insulin resistance syndrome? Different names; different concepts; and different goals. Endocrinol Metab Clin N Am 2004, 33, 283–303. [Google Scholar] [CrossRef]
- Hodson, L.; Gunn, P.J. The regulation of hepatic fatty acid synthesis and partitioning: The effect of nutritional state. Nat Rev End 2019, 15, 689–700. [Google Scholar] [CrossRef]
- Tran, C.; Jacot-Descombes, D.; Lecoultre, V.; Fielding, B.A.; Carrel, G.; Le, K.A.; Schneiter, P.; Bortolotti, M.; Frayn, K.N.; Tappy, l. Sex differences in lipid and glucose kinetics after ingestion of an acute oral fructose load. Br J Nutr 2010, 104, 1139–1147. [Google Scholar] [CrossRef]
- Sampey, B.P.; Vanhoose, A.M.; Winfield, H.M.; Freemerman, A.J.; Muehlbauer, M.J.; Fueger, P.T.; Newgard, C.B.; Makowski, l. Cafeteria diet is a robust model of human metabolic syndrome with liver and adipose inflammation: comparison to high-fat diet. Obesity 2011, 19, 1109–1117. [Google Scholar] [CrossRef]
- Muriel, P.; López-Sánchez, P.; Ramos-Tovar, E. Fructose and the liver. Int J Mol Sci 2021, 22, 6969. [Google Scholar] [CrossRef]
- Qi, X.; Tester, R.F. Fructose; galactose and glucose – In health and disease. Clin Nutr ESPEN 2019, 33, 18–28. [Google Scholar] [CrossRef]
- Lai, K.; Elsas, L.J.; Wierenga, K.J. Galactose Toxicity in Animals. IUBMB Life 2009, 61, 1063–1074. [Google Scholar] [CrossRef] [PubMed]
- Lalanza, J.F.; Snoeren, E.M.S. The cafeteria diet: A standardized protocol and its effects on behavior. Neurosci. Biobehav. Rev. 2021, 122, 92–119. [Google Scholar] [CrossRef] [PubMed]
- Cahill, G.F. Fuel metabolism in starvation. Annu Rev Nutr 2006, 26, 1–22. [Google Scholar] [CrossRef] [PubMed]
- Alemany, M. Different effects of hyperlipidic diets in human lactation and adulthood: growth versus the development of obesity. Reprod Biol Endocrinol 2011, 9, 101. [Google Scholar] [CrossRef]
- Paoli, A.; Bianco, A.; Grimaldi, K.A. The ketogenic diet and sport. A possible marriage? Exercise and Sports Sci Rev 2015, 43, 153–162. [Google Scholar] [CrossRef]
- Felig, P.; Owen, O.E.; Wahren, J.; Cahill, G.F. Amino acid metabolism during prolonged starvation. J Clin Invest 1969, 48, 584–94. [Google Scholar] [CrossRef]
- Dimski, D.S. Ammonia metabolism in the urea cycle: function and clinical implications. J Vet Int Med 1994, 8, 73–78. [Google Scholar] [CrossRef]
- Carrière, A.; Lagarde, D.; Jeanson, Y.; Portais, J.C.; Galinier, A.; Ader, I.; Casteilla, l. The emerging roles of lactate as a redox substrate and signaling molecule in adipose tissues. J Physiol Biochem, 2020, 76, 241–250. [Google Scholar] [CrossRef]
- Goodman, M.N.; McElaney, M.A.; Ruderman, N.B. Adaptation to prolonged starvation in the rat: curtailment of skeletal muscle proteolysis. Am J Physiol 1981, 241, E321–E327. [Google Scholar] [CrossRef]
- Giordano, M.; Castellino, P. Correlation between amino acid induced changes in energy expenditure and protein metabolism in humans. Nutrition 1997, 1, 309–312. [Google Scholar] [CrossRef]
- Costa, G.; Ullrich, L.; Kantor, F.; Holland, J.F. Production of elemental nitrogen by certain mammals including man. Nature 1918, 218, 546–55. [Google Scholar] [CrossRef]
- Rafecas, I.; Esteve, M.; Fernández-López, J.A.; Remesar, X.; Alemany, M. Whole rat protein content estimation: applicability of the Nx6.25 factor. Br J Nutr 1994, 72, 199–209. [Google Scholar] [CrossRef] [PubMed]
- Sabater, D.; Agnelli, S.; Arriarán, S.; Fernández-López, J.-A.; Romero, M. de M.; Alemany, M.; Remesar, X. Altered nitrogen balance and decreased urea excretion in male rats fed cafeteria diet are related to arginine availability. Biomed Res Int 2014, 959420. [Google Scholar] [CrossRef]
- Matute, M.L.; Kalkhoff, R.K. Sex steroids influence on hepatic gluconeogenesis and glycogen formation. Endocrinology 1973, 92, 762–768. [Google Scholar] [CrossRef] [PubMed]
- Fernández-López, J.A.; Casado, J.; Argilés, J.M.; Alemany, M. Intestinal handling of a glucose gavage by the rat. Mol Cell Biochem 1992, 113, 43–53. [Google Scholar] [CrossRef] [PubMed]
- Ferramosca, A.; Conte, A.; Damiano, F.; Siculella, L.; Zara, V. Differential effects of high-carbohydrate and high-fat diets on hepatic lipogenesis in rats. Eur J Nutr 2014, 53, 1103–1114. [Google Scholar] [CrossRef]
- Bertram, A.C.; Larsen, L.B.; Chen, X.; Jeppesen, B. Impact of high-fat and high-carbohydrate diets on liver metabolism studied in a rat model with a systems biology approach. J Agric Food Chem 2012, 60, 676–684. [Google Scholar] [CrossRef] [PubMed]
- Imbert-Fernandez, Y.; Clem, B.F.; O’Neal, J.; Kerr, D.A.; Spaulding, R.; Lanceta, L.; Clem, A.L.; Telang, S.; Chesney, J. Estradiol stimulates glucose metabolism via 6-fosfofructo-2´kinase (PFKB3). J Biol Chem 2014, 289, 9440–9448. [Google Scholar] [CrossRef]
- Qiu, S.; Torrens-Vazquez, J.; Boulger, E.; Liu, H.; Xue, P.; Hussain, M.A.; Wolfe, A. Hepatic estrogen receptor α is critical for regulation of gluconeogenesis and lipid metabolism in males. PloSOne 2017, 7, 1661. [Google Scholar] [CrossRef]
- Yan, H.; Yang, W.; Zhou, F.; Li, X.; Pan, Q.; Shen, Z.; Han, G.; Newell-Fugate, A.; Tian, Y.; Majeti, R.; Liu, W.; Xu, Y.; Wu, C.; Allred, K.; Allred, C.; Sun, Y.; Guo, S. Estrogen Improves Insulin Sensitivity and Suppresses gluconeogenesis via the Transcription Factor Foxo. Diabetes 2019, 68, 291–304. [Google Scholar] [CrossRef]
- Zhang, Y.; Ma, K.; Sadana, P.; Chowdhury, F.; Gaillard, S.; Wang, F.; McDonnell, D.P.; Unterman, T.G.; Elam, M.B.; Park, E.A. Estrogen-related receptors. J Biol Chem 2006, 281, 39897–39906. [Google Scholar] [CrossRef] [PubMed]
- Maffei, L.; Murata, Y.; Rochira, V.; Tubert, G.; Aranda, C.; Vazquez, M.; Clyne, C.D.; Davis, S.; Simpson, E.R.; Carani, C. Dysmetabolic syndrome in a man with a novel mutation of the aromatase gene: effects of testosterone; alendronate; and estradiol treatment. J Clin Endocrinol Metab 2004, 89, 61–70. [Google Scholar] [CrossRef] [PubMed]
- Miller, C.N.; Della-Fera, M.A.; Baile, C.A. The mediation of hepatic lipogenesis through estrogens. PostDoc J 2013, 1, 27–3. [Google Scholar] [CrossRef] [PubMed]
- Yasuda, J.; Tateyama, K.; Syuto, B.; Too, K. Lactate dehydrogenase and creatine phosphokinase isoenzymes in tissues of laboratory animals. Jpn J Vet Res 1990, 38, 19–29. [Google Scholar] [CrossRef]
- Rotondo, F.; Ho-Palma, A.C.; Romero, M.D.M. , Remesar, X.; Fernández-López, J.A.; Alemany, M. Higher lactate production from glucose in cultured adipose nucleated stromal cells than for rat adipocytes. Adipocyte 2019, 8, 61–76. [Google Scholar] [CrossRef] [PubMed]
- Shen, Y.; Liu, F.; Li, Q.; Tang, J.; Zheng, T.; Lu, F.; Lu, H.; Jia, W. The gonadal hormone regulates the plasma lactate levels in type 2 diabetes treated with and without Metformin. Diabet Technol Therap 2012, 14, 469–474. [Google Scholar] [CrossRef]
- Mumford, S.L.; Chavarro, J.; Zhang, C.; Perkins, N.J.; Sjaarda, L.A.; Pollack, A.Z.; Schliep, K.C.; Michels, K.A.; Zarek, S.M.; Plowden, T.C.; Radin, R.G.; Messer, L.C.; Frankel, R.A.; Wactawski-Wende, J. Dietary fat intake and reproductive hormone concentrations andovulation in regularly menstruating. Am J Clin Nutr 2016, 103, 868–77. [Google Scholar] [CrossRef]
Disclaimer/Publisher’s Note: The statements, opinions and data contained in all publications are solely those of the individual author(s) and contributor(s) and not of MDPI and/or the editor(s). MDPI and/or the editor(s) disclaim responsibility for any injury to people or property resulting from any ideas, methods, instructions or products referred to in the content. |
© 2023 by the authors. Licensee MDPI, Basel, Switzerland. This article is an open access article distributed under the terms and conditions of the Creative Commons Attribution (CC BY) license (http://creativecommons.org/licenses/by/4.0/).


