1. Introduction
Dyslipidemia is a disease characterized by a high level of lipids in the bloodstream [
1]. It has emerged as a potential risk factor in the insurgence of atherosclerosis, a chronic inflammatory disorder of the arterial walls [
1]. Atherosclerosis is commonly defined as the process of hardening of the arteries. It may cause many cardiovascular diseases, such as stroke and coronary artery disease [
2,
3,
4]. The link between dyslipidemia and atherosclerosis has been studied in recent years [
5,
6], and as a result, the pathophysiological mechanisms driving this lethal disease have been partially elucidated. Dyslipidemia is often associated with type 2 diabetes mellitus as a comorbidity [
7,
8,
9].
Lipids molecules, i.e., cholesterol and triglycerides, play an important role in many cellular processes; thus, the imbalance of their normal levels may cause dysfunctions. In particular, high levels of lipids can lead to the formation of lipid-rich plaques bound to the arteries. Consequently, such plaques can modify the elasticity of arterial walls, starting a set of events culminating in atherosclerosis [
10,
11]. Elevated levels of low-density lipoprotein cholesterol (LDL) [
12], contribute to atherogenesis by accumulating in the subendothelial space, triggering an inflammatory response and promoting the recruitment of immune cells. High-density lipoprotein cholesterol (HDL) is thought to exert protective effects against atherosclerosis [
13,
14]. HDL promotes reverse cholesterol transport and removes cholesterol from peripheral tissues, including atherosclerotic plaques. However, dysfunctional HDL particles may lose their protective properties in dyslipidemia, exacerbating atherosclerotic plaque formation [
15].
Many studies exist elucidating the link between dyslipidemia and atherosclerosis, particularly in the context of patients affected by type 2 diabetes mellitus [
16,
17]. Nevertheless, using sex and age as a filtering item for gene characterization is a topic of recent research interest. Using gender and sex donor information in the analysis and study of genes is particularly relevant for diabetic patients. A set of recent studies has provided many insights regarding the molecular causes for insurgence and progression of the pathology in males and females, also considering age values [
7,
8,
17]. Moreover, the underlying pathophysiology of diabetes is exacerbated by the ageing process, by accelerating the progression of many comorbidities [
18,
19,
20,
21,
22,
23,
24,
25].
Man et al., [
26] proposed a clinical study to investigate sexual dimorphism in the incidence and complications of atherosclerosis. By combining multiple histological and imaging, the authors discuss the role of sex as a biological variable in atherosclerosis. The paper also evidences the importance of understanding the differences between men and women in the development and complications of atherosclerosis, as well as how risk factors, plaque size, and plaque characteristics may vary between sexes. The study in [
27] emphasizes that sex hormones significantly alter the immune response during atherosclerosis, resulting in different disease phenotypes in men and women. For instance, women tend to exhibit increased antibody and autoantibody responses in response to infection and damage, while men typically have elevated innate immune activation.
A growing body of evidence suggests that age-related changes in the vascular and various molecular pathways contribute to the initiation and progression of atherosclerosis [
28]. For instance, structural and functional changes occur in the blood vessels with advancing age, collectively called
vascular ageing. The accumulation of senescent cells, which exhibit a senescence-associated secretory phenotype (SASP), contributes to the chronic inflammatory process in the arterial wall, accelerating the atherogenesis process. Finally, epigenetic changes, such as DNA methylation, histone modifications, and non-coding RNA regulation, may impact gene expression patterns during ageing and atherosclerosis.
Starting from demographic data which evidence a different incidence of atherosclerosis and previous studies [
7], we hypothesize that there exist some molecular differences due to age and sex of the basal expression of genes related to dyslipidemia-associated atherosclerosis [
29]. We consider genes for which there is evidence of correlation with dyslipidemia as reported in the T2DiACoD database [
30].
We analyze the expression of such genes and their variations with age and sex in blood, artery aorta, and adipose tissue.
Figure 1 summarizes the steps of our analysis.
Our results show the existence of genes whose expression changes with age and sex and are related to the risk of presenting dyslipidemia-associated atherosclerosis. We also analyze these genes on a network level by gathering information from the STRING [
31] database for deriving the protein interaction networks with a multiscale approach [
32]. Using the proposed analysis, we suggest that ageing and sex may stratify the risk of dyslipidemia-associated atherosclerosis, suggesting the need for further research on the mechanisms of the pathology increasing related to the age [
33].
2. Materials and Methods
We propose to use a methodology based on using and integrating available data sources describing genes, gender, and age associated with gene donors. The methodology uses the following data sources: (i) T2DiACoD database [
30]; (ii) GTEx database [
34,
35], (iii) STRING network database [
36]. The methodology also uses voyAGEr [
37] to analyse sex differences [
17], and GTexVisualiser to access the GTEx database.
The methodology consists of accessing genes and noncoding transcripts related to complications of type 2 diabetes mellitus extracted from T2DiACoD. The database has a curated list of genes related to different comorbidities. Each gene is annotated with one or more associated comorbidities (atherosclerosis, retinopathy, neuropathy, cardiovascular disease). Focussing on atherosclerosis, we obtain a list of 115 genes related to such a disease. GTEx database is queried employing GTExVisualizer, and metadata related to tissue, sex and age of the sample are extracted using genes identified in the T2DiACoD database in the previous step. Expression data are measured as Transcript per Million (TPM). This data integration and gene enrichment process was performed using an ad-hoc realised script that has been integrated into GTExVisualizer [
17,
34]. The integrated data are reported in the data matrix whose snapshot is reported in
Figure 1, while the entire data is available at
https://drive.google.com/drive/folders/1-YpCRGdN_UtdS_3hEKrF7_Icbhq_V09d.
Data processing is performed by grouping gene samples by sex, and for each gene, we calculate the average values of the expression for the following age classes: 20-29, 30-39, 40-49, 50-59, 60-69, 70-79 years. In this way, we summarise the evolution of the average values of each gene during the age in males and in females.
The developed methodology took as input the above-reported matrix and focused on those genes that can be considered of interest, i.e., whose average expression values are monotonically increasing or decreasing in the age intervals. The framework includes a module to evaluate differences among age intervals. A Kruskal-Wallis test is measured. A less than 0.01 (after correction for multiple tests) was considered significant. The calculated has been corrected with the Bonferroni correction method.
The framework builds protein interaction networks induced by increasing or decreasing genes. This is built by using the selected genes to query the STRING database [
35], an available data source capable of building interaction networks. Indeed, the STRING protein interaction network database is used to build protein networks. In the framework instance with the 11 genes defined above and used to query the GTeX database, we considered only physical interactions with a reliability value higher than
. In addition, we calculated the functional enrichment [
38] on the STRING web server. Finally, to verify the extraction process, we compare the results with those obtained using the voyAGEr web portal [
37] to evaluate differences in age and sex. voyAGEr also accesses GTEx data to build a linear model (ShARP-LM) to analyse tissue-specific differential gene expression. The gene expression is linearly modelled considering factors: age, sex, and age-sex interaction effects. Using voyAGEr, we can identify the age periods when significant changes in gene expression occur.
3. Results
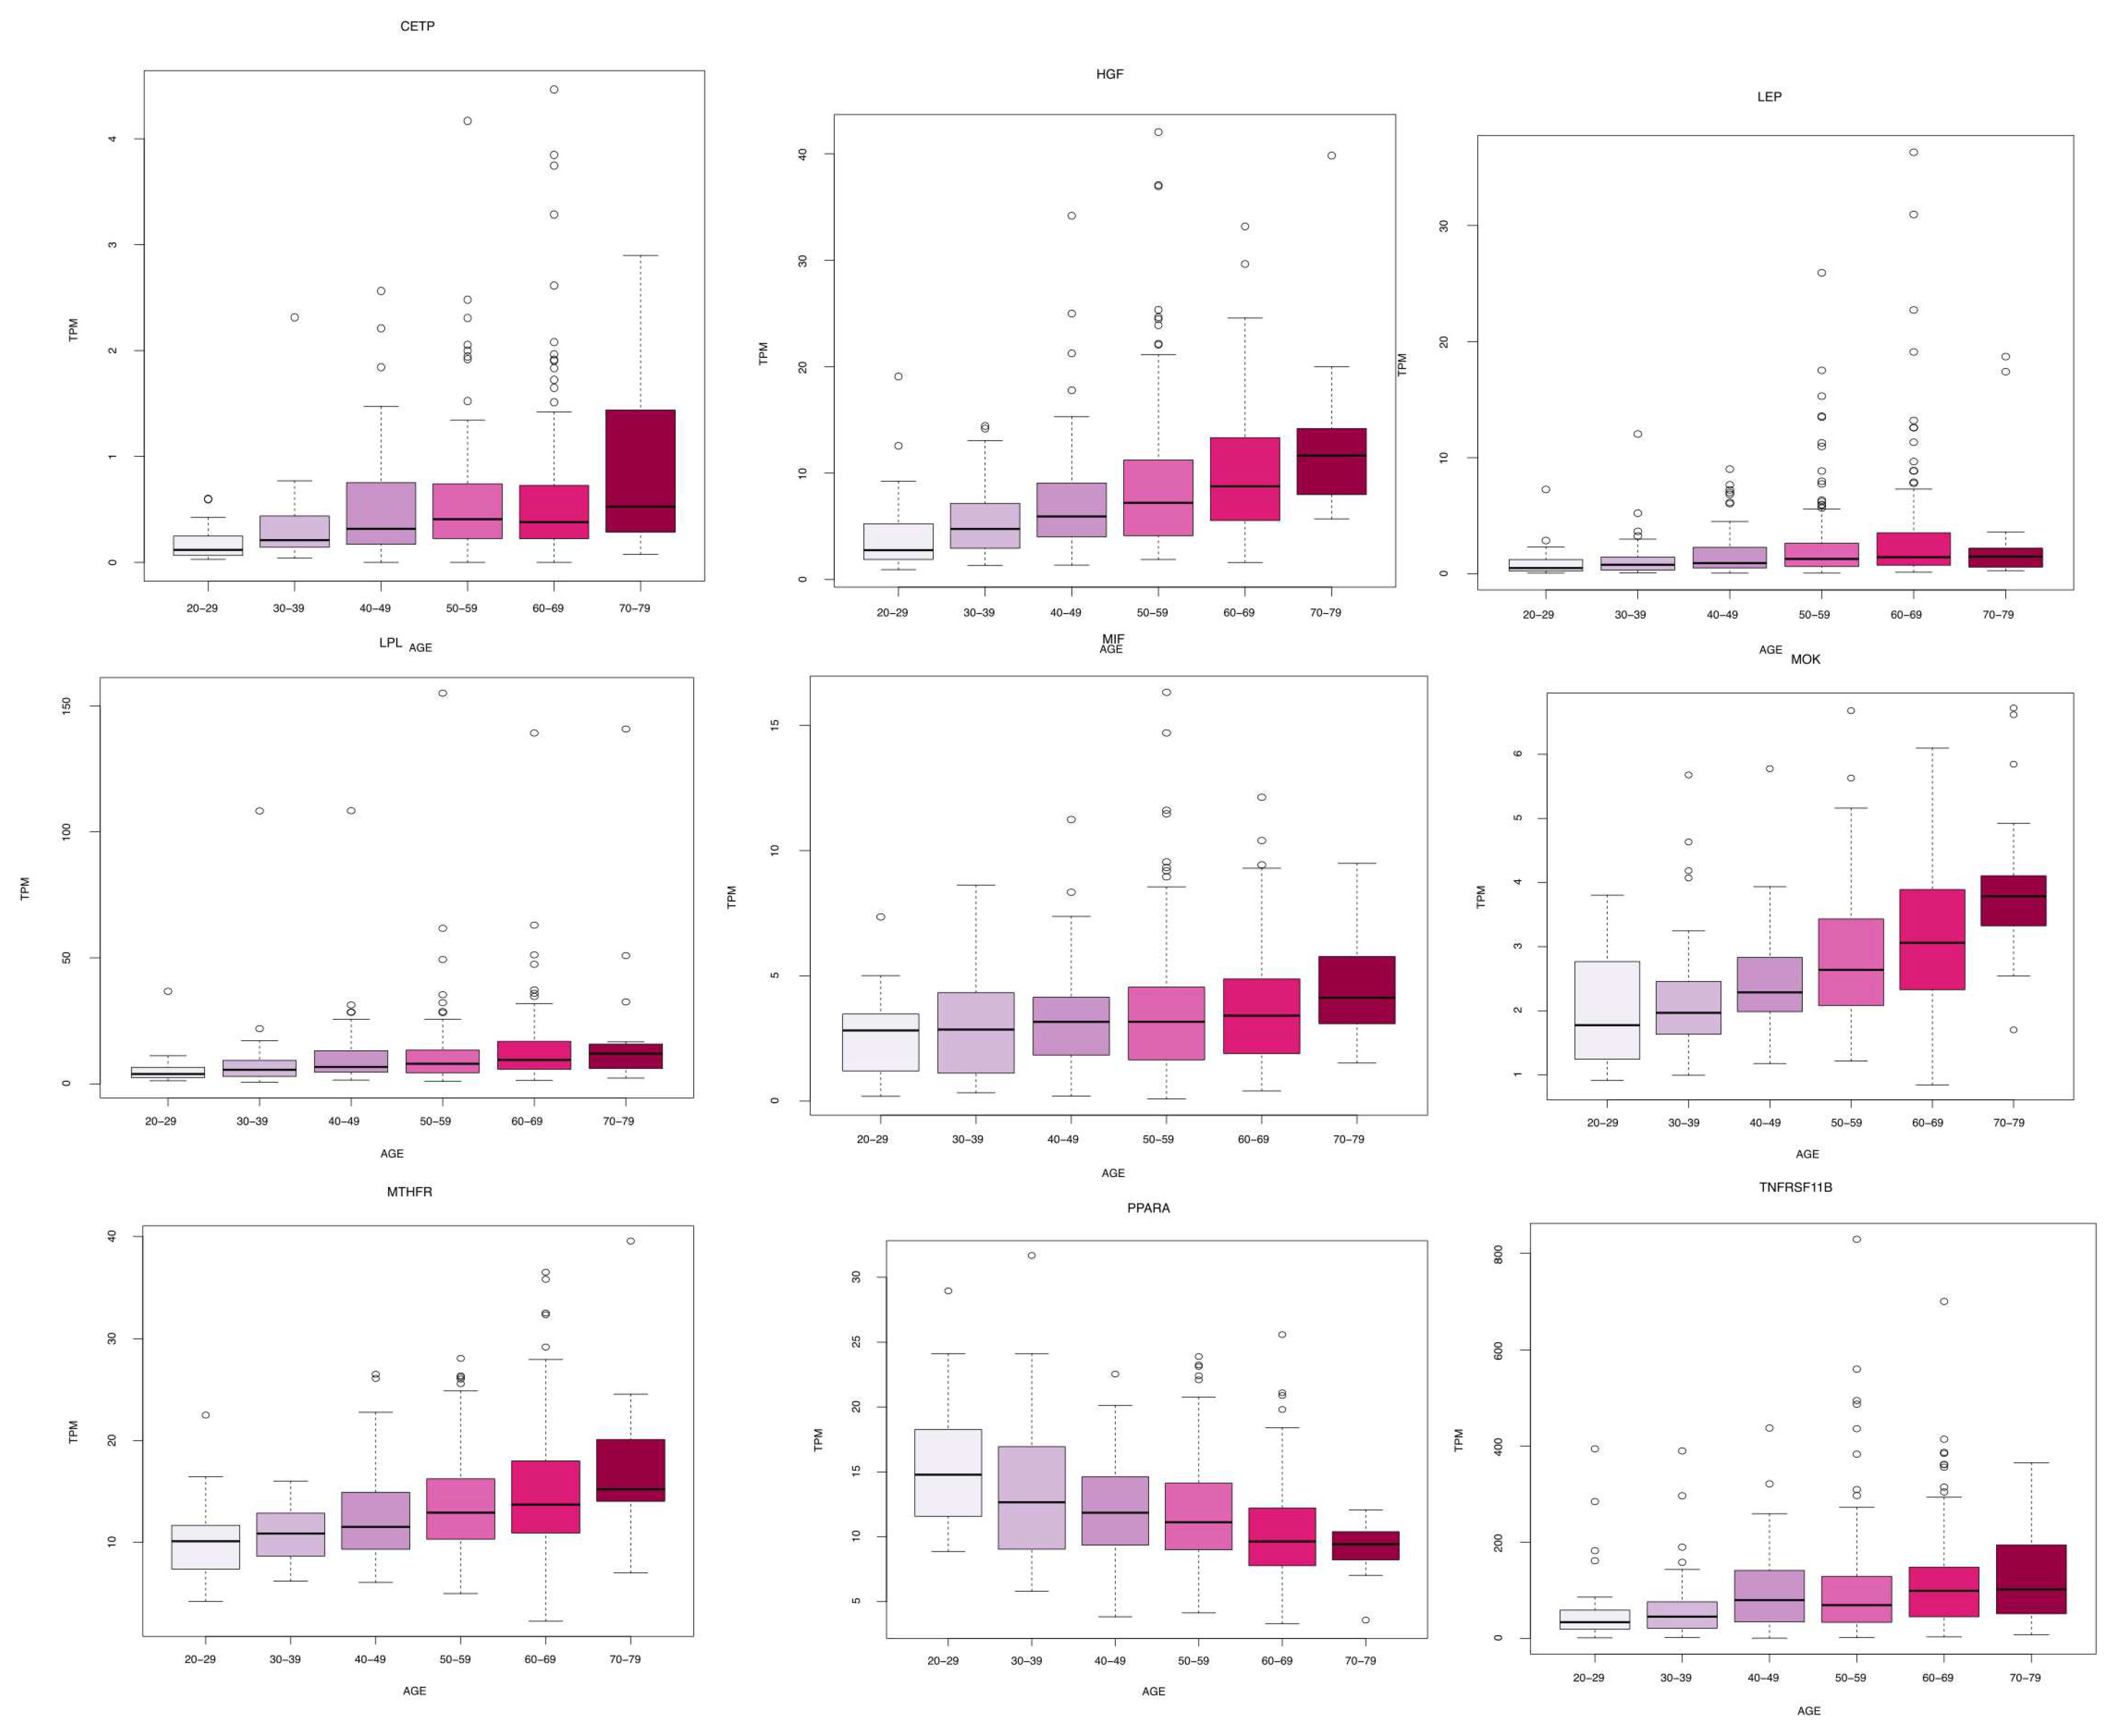
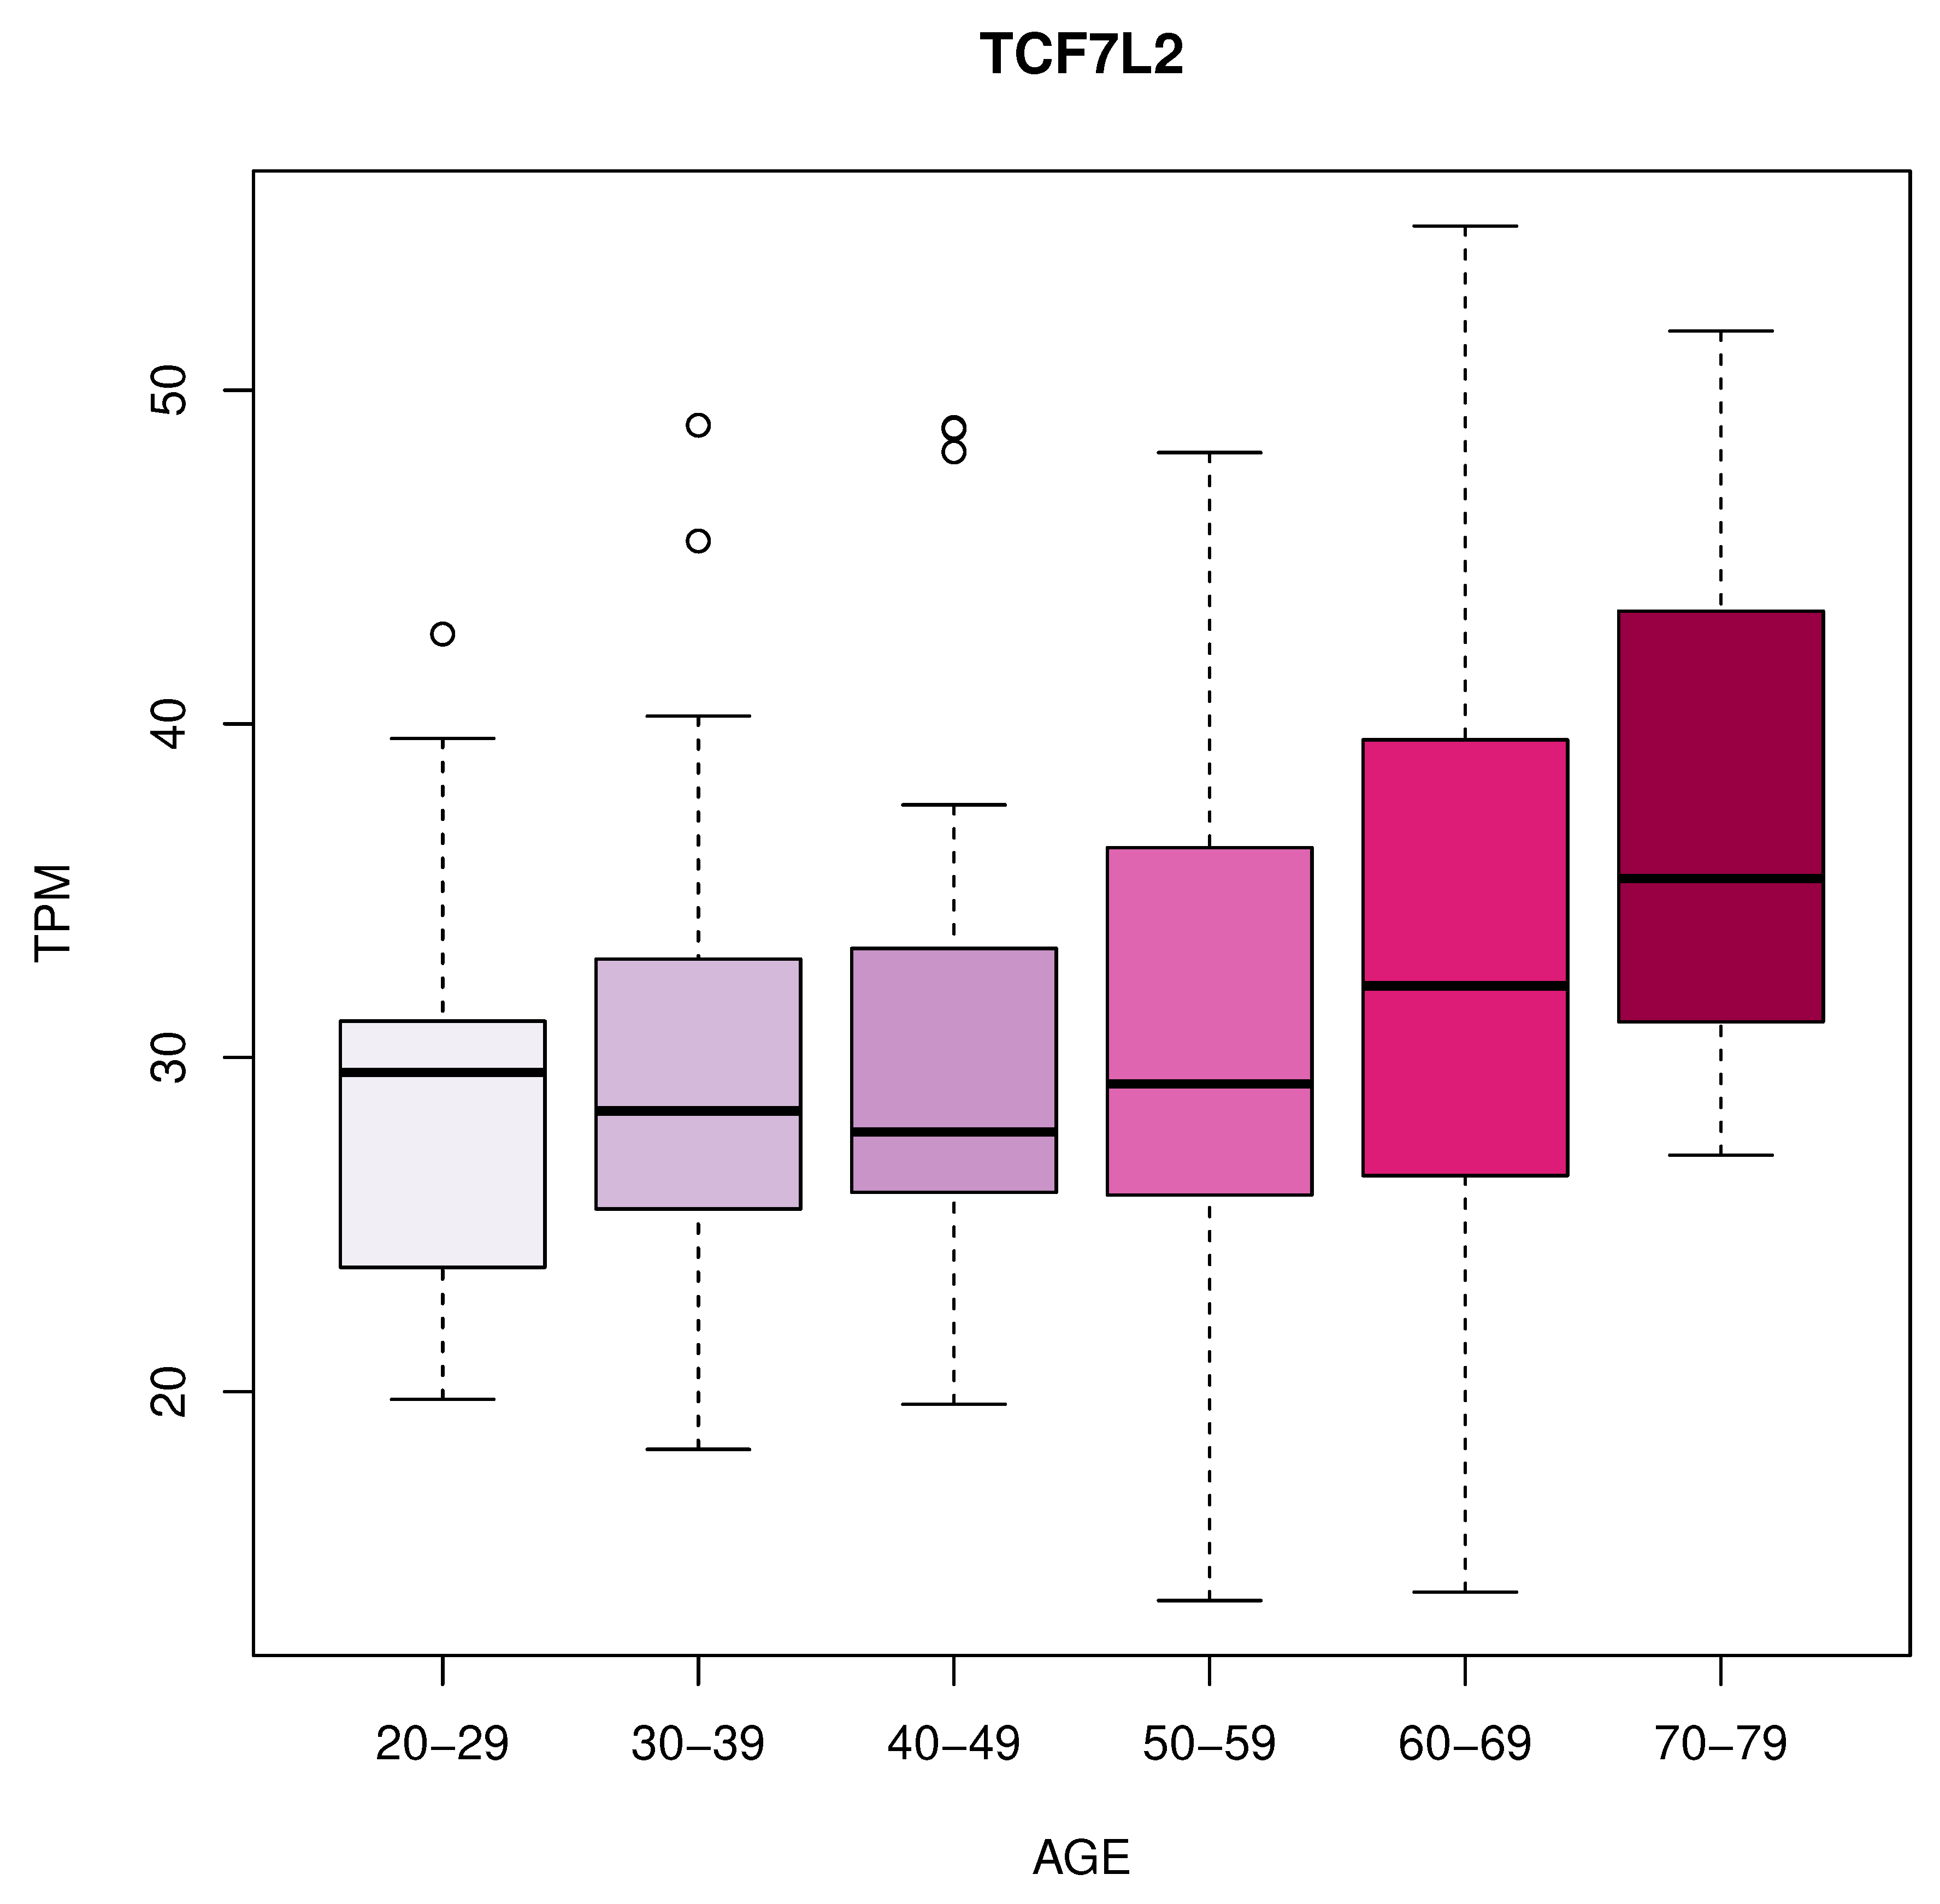
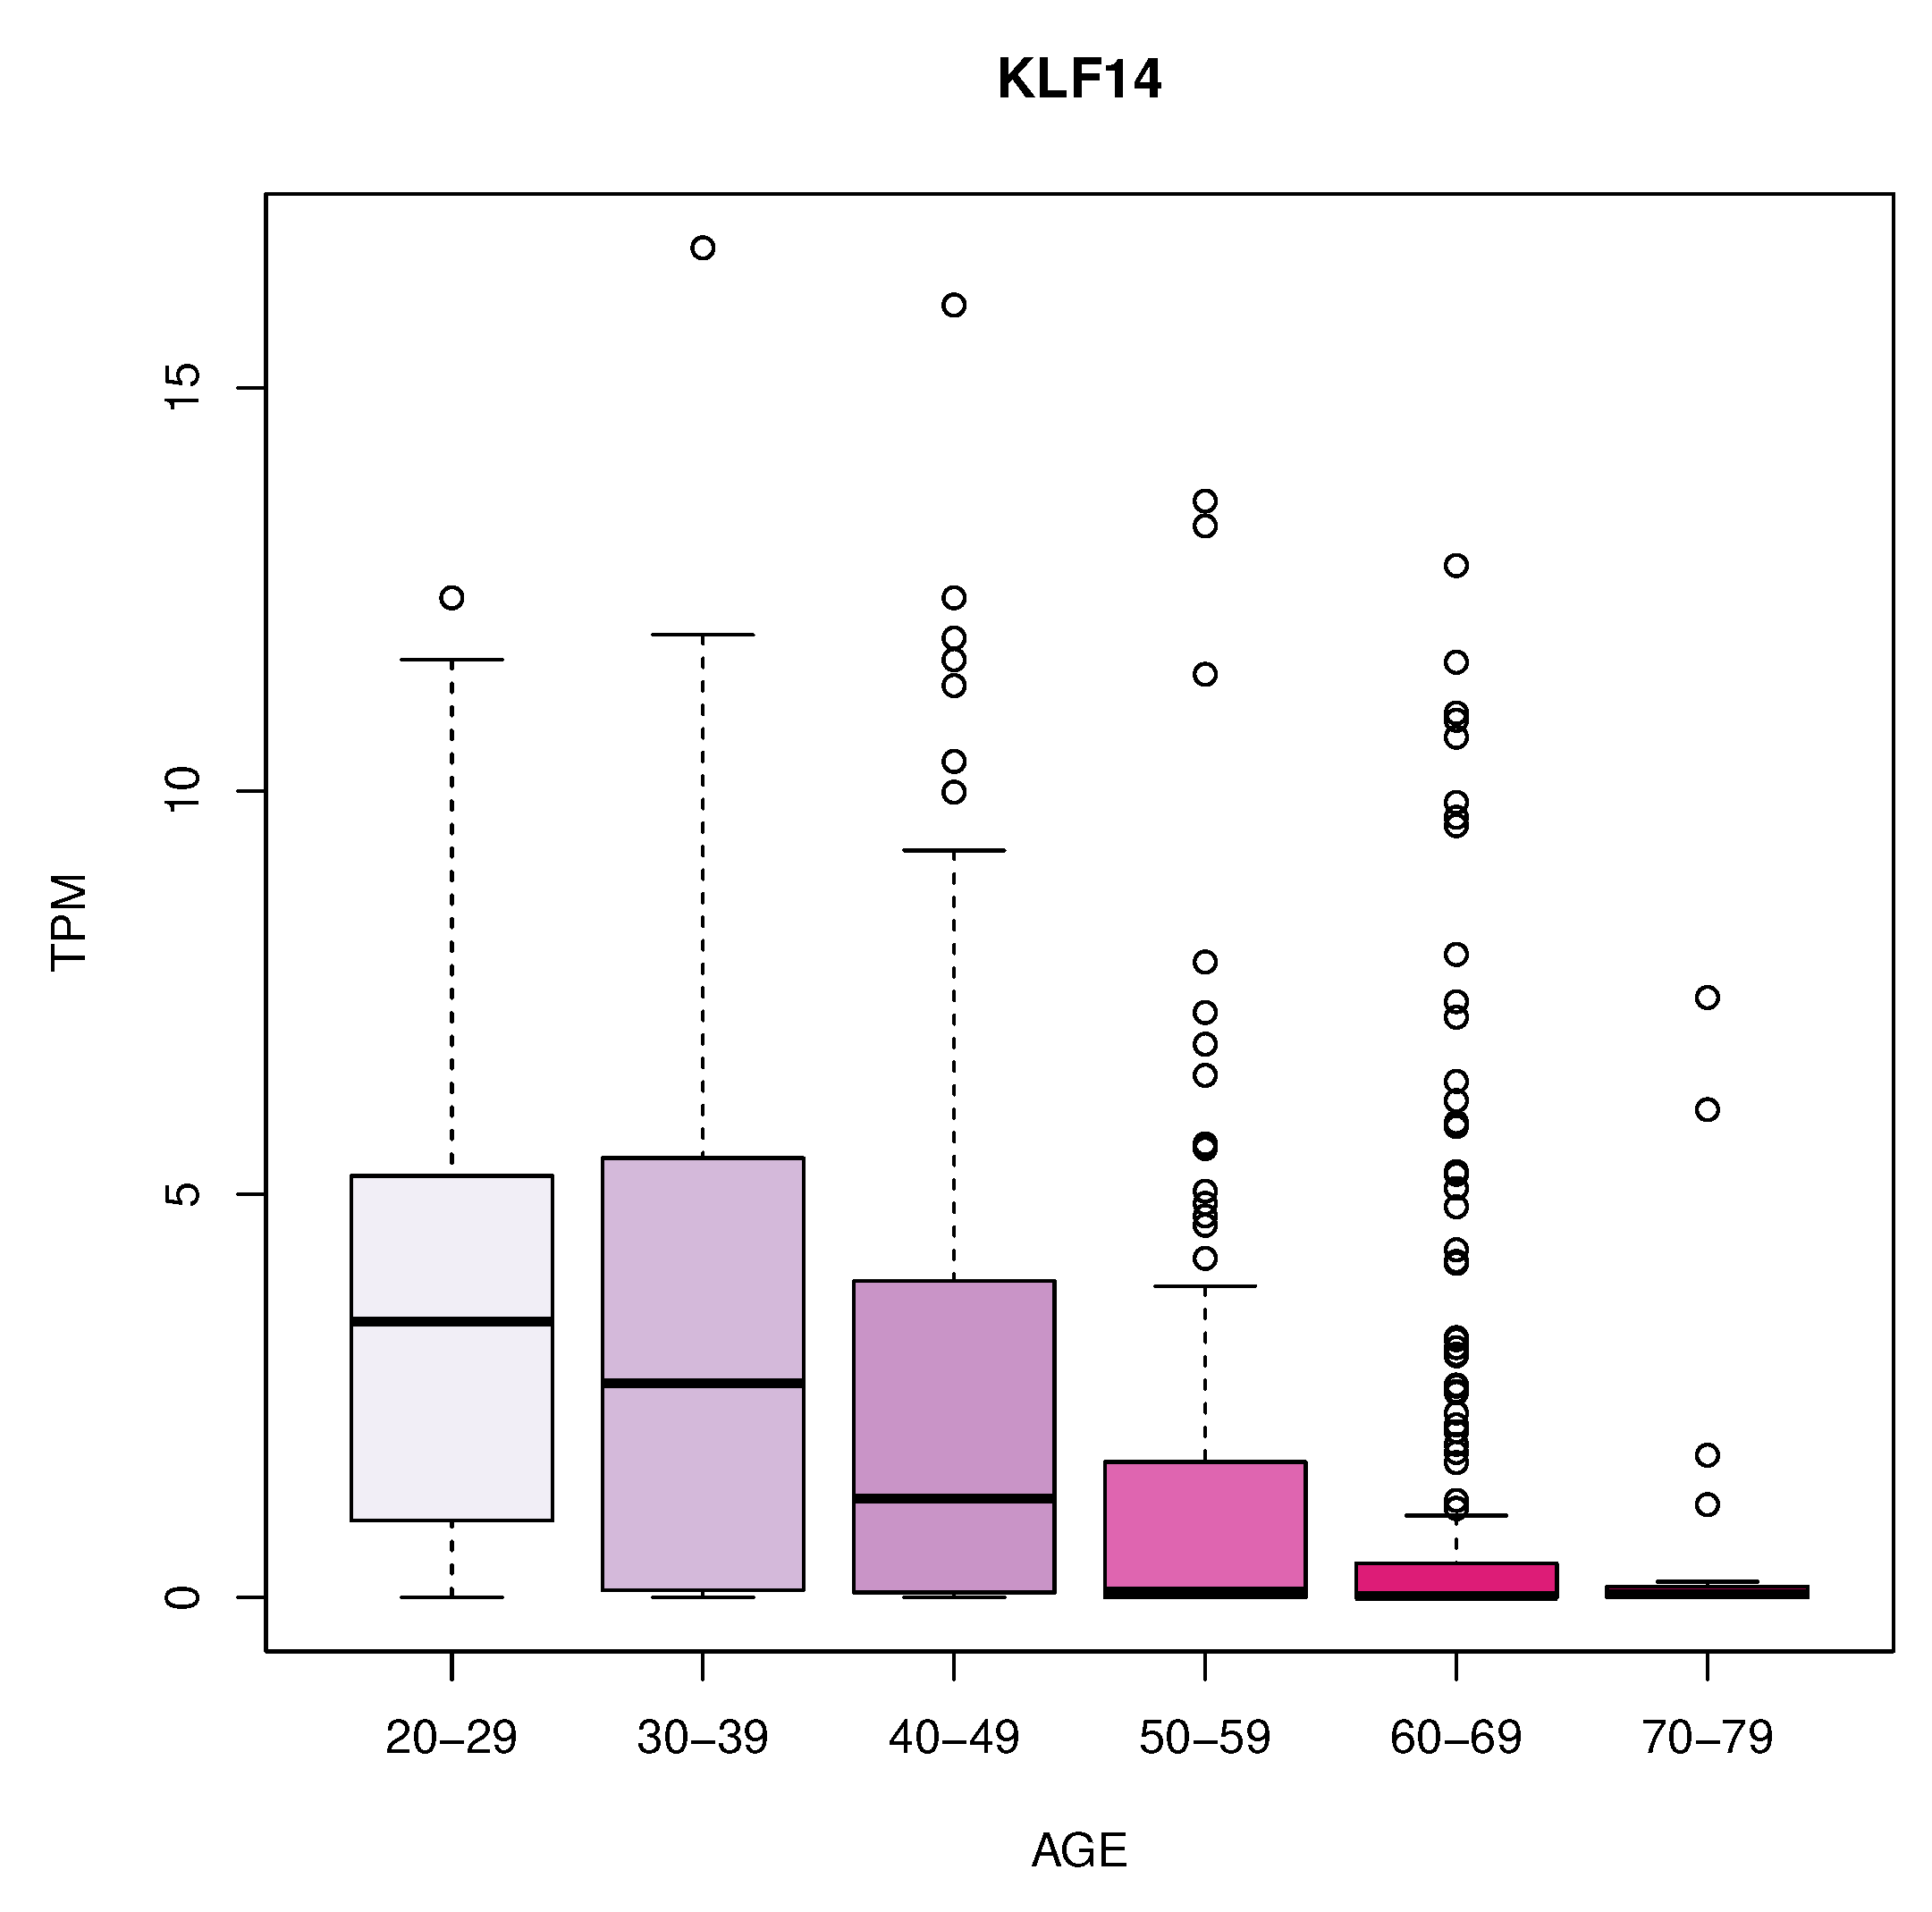
We identified 11 genes whose expression changes with age in blood, artery tibial, and artery aorta tissues. In blood, we found a decrease in KLF14 expression. In the artery tibial, we found a decrease in the expression of the PPARA gene, while the MTHFR, HGF, LEP, LPL, TNFRSF11B, MOK, CETP, and MIF genes increased with age. Finally, we found an increased expression of the TCF7L2 gene in the aorta tissue.
Table 1 summarizes these results while
Figure 2,
Figure 3 and
Figure 4 depicts the gene expression as boxplots.
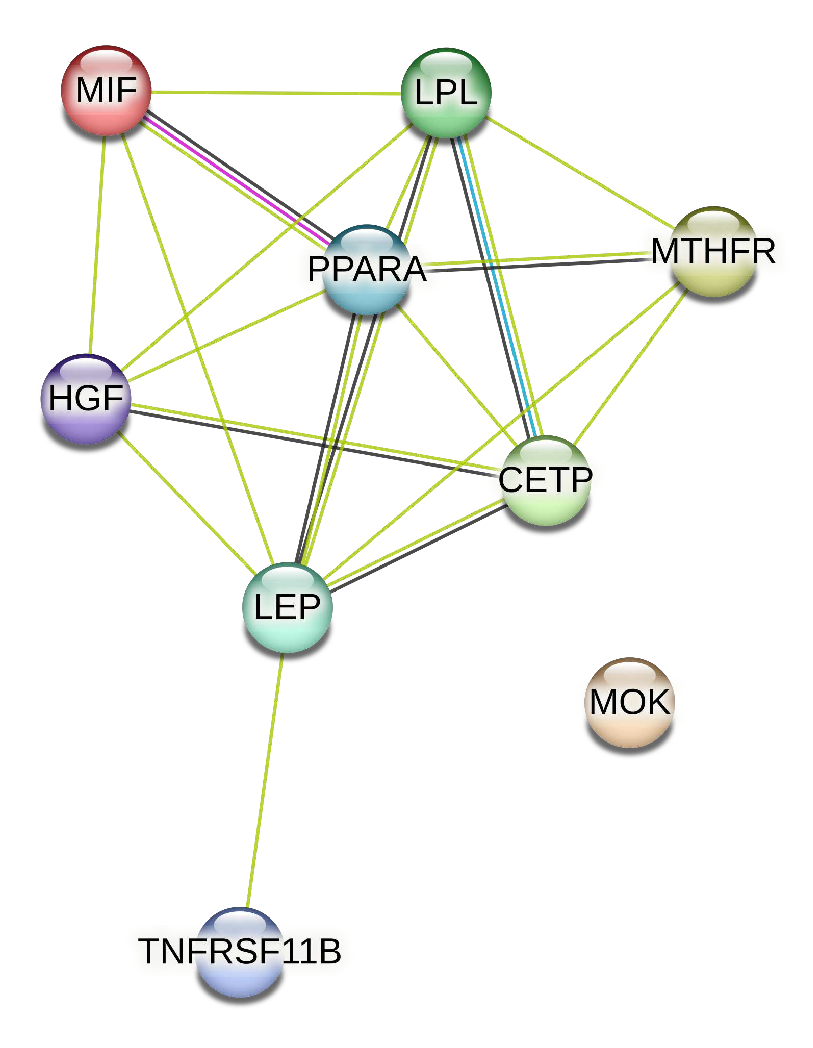
We extracted from the STRING database the protein interaction network associated with the genes of artery tibial, represented in
Figure 5.
We performed a functional analysis of this network on the STRING database, reporting the results depicted in
Figure 6. Using the STRING database, we studied functional analysis of the obtained network. The results are reported in
Figure 6. The Figure represent both the associated protein interaction network of the selected genes and the related associations of such proteins.
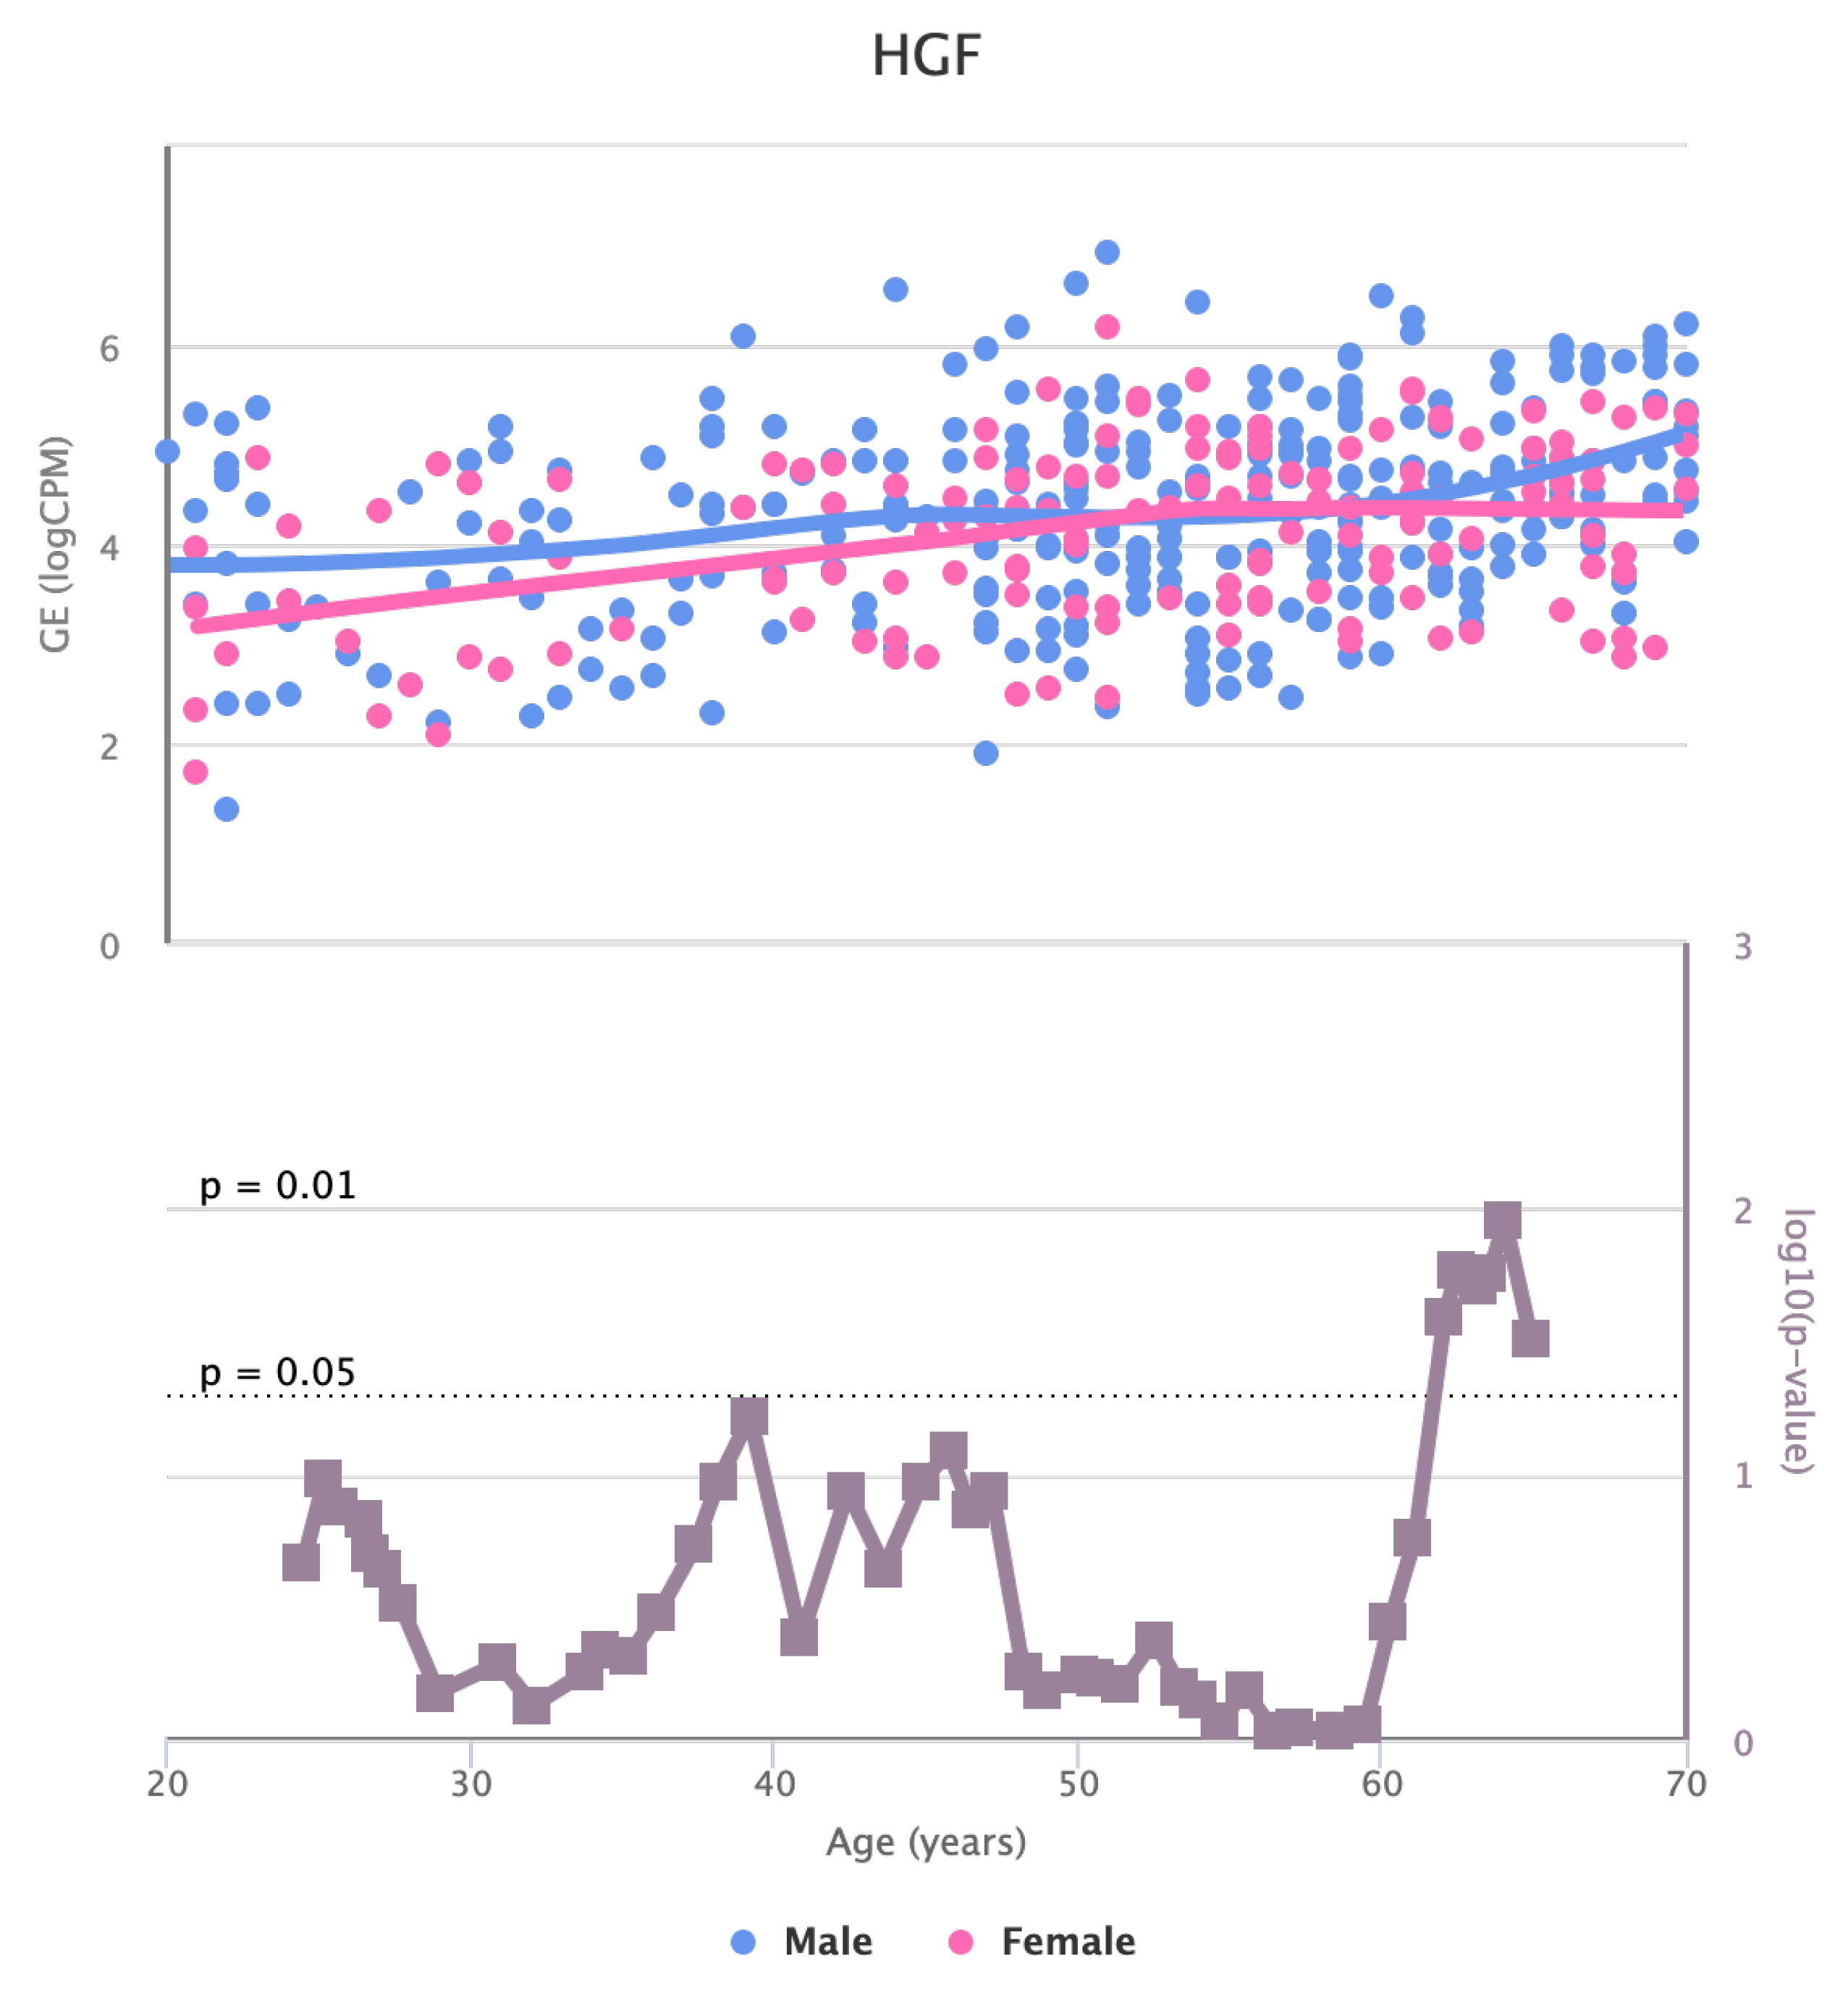
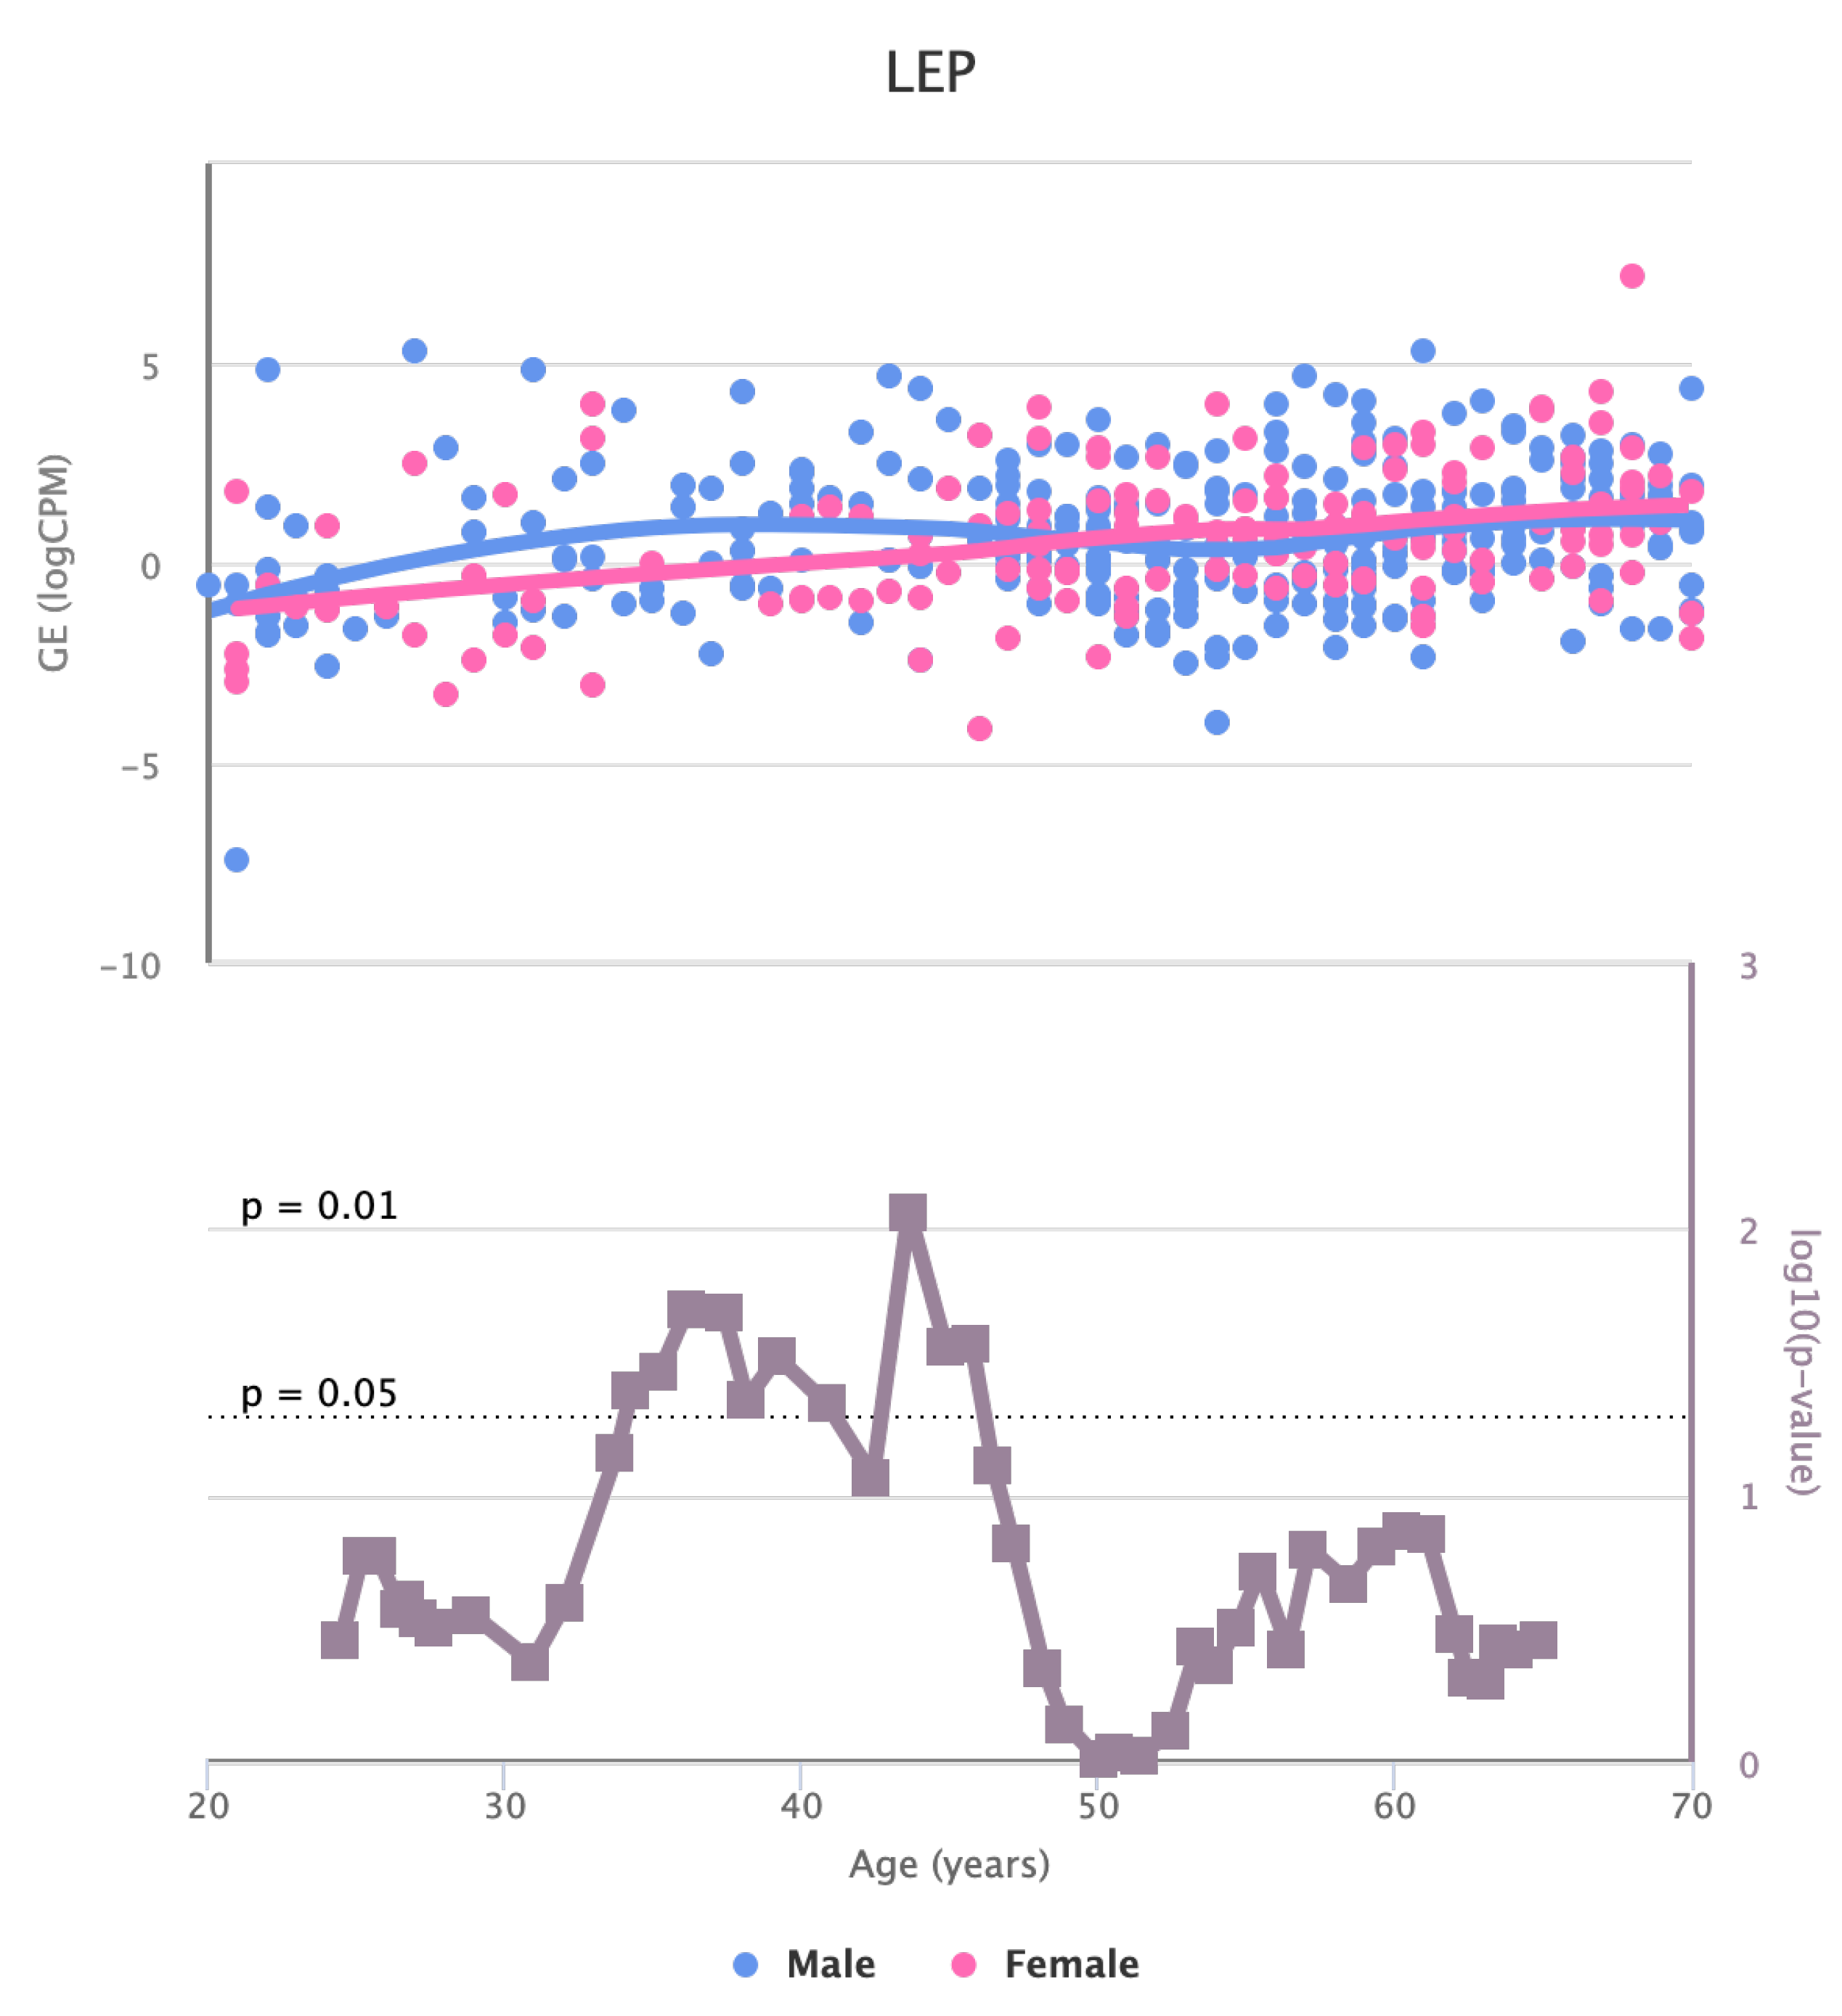
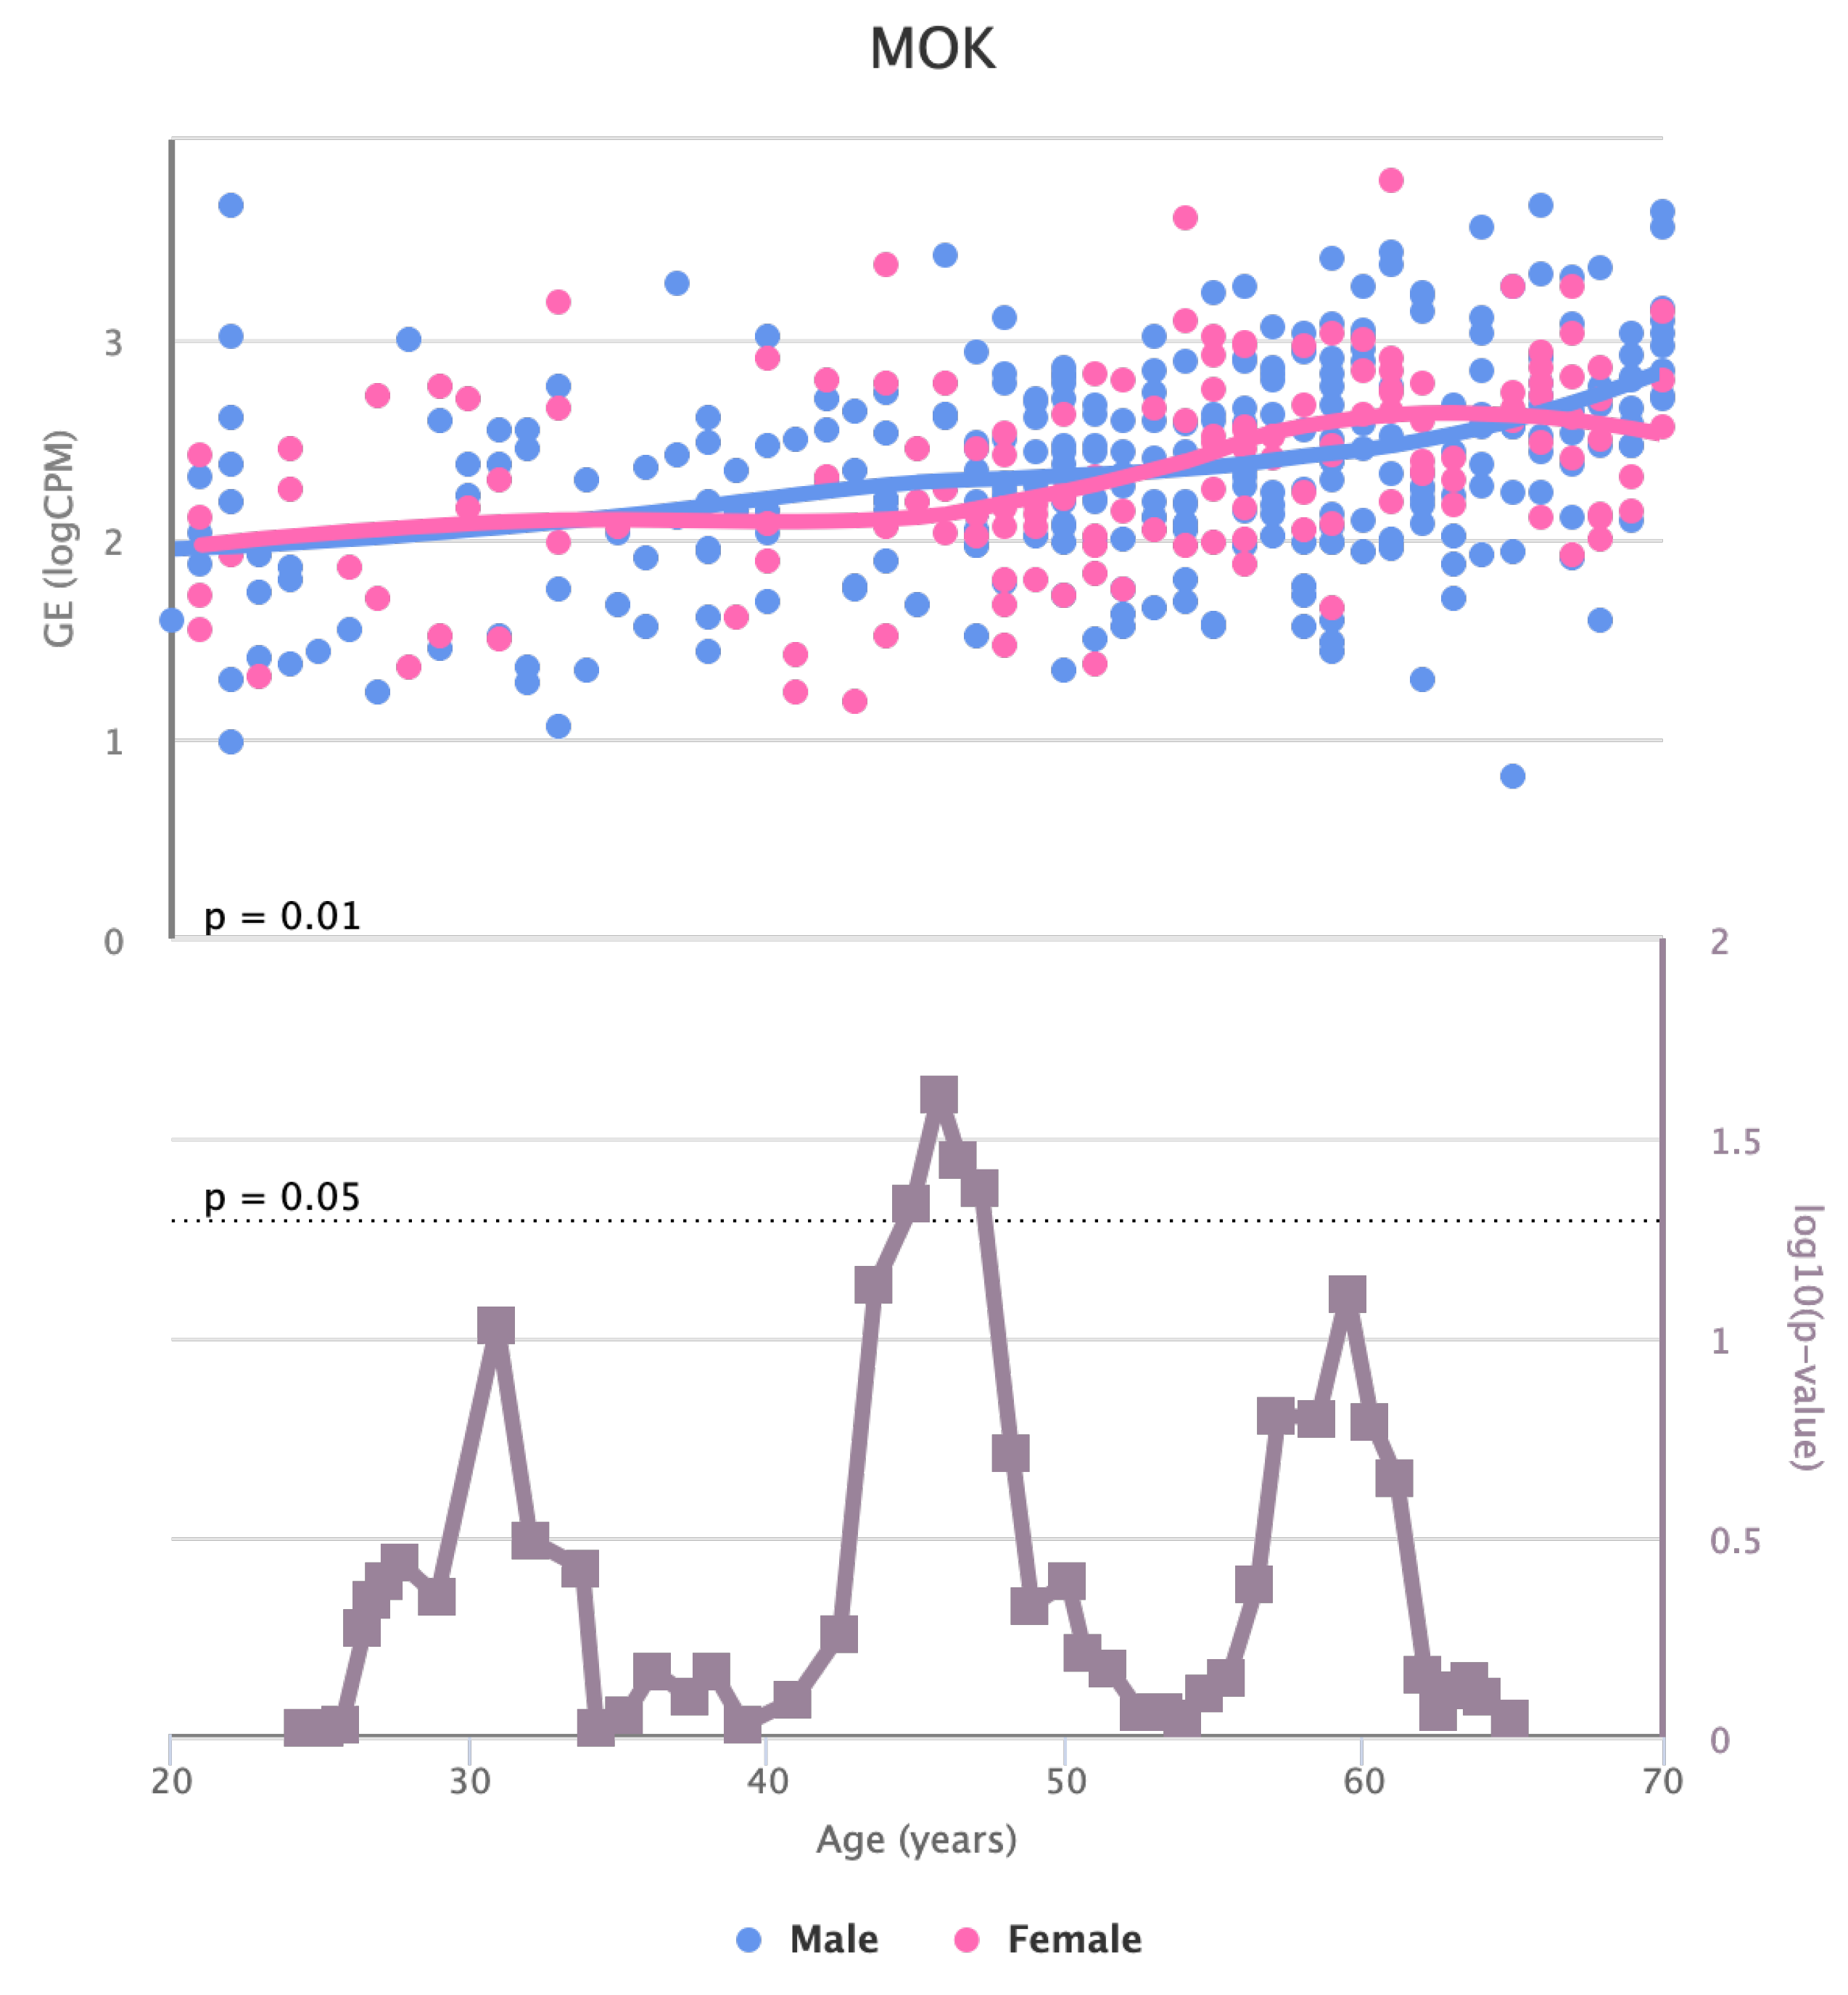
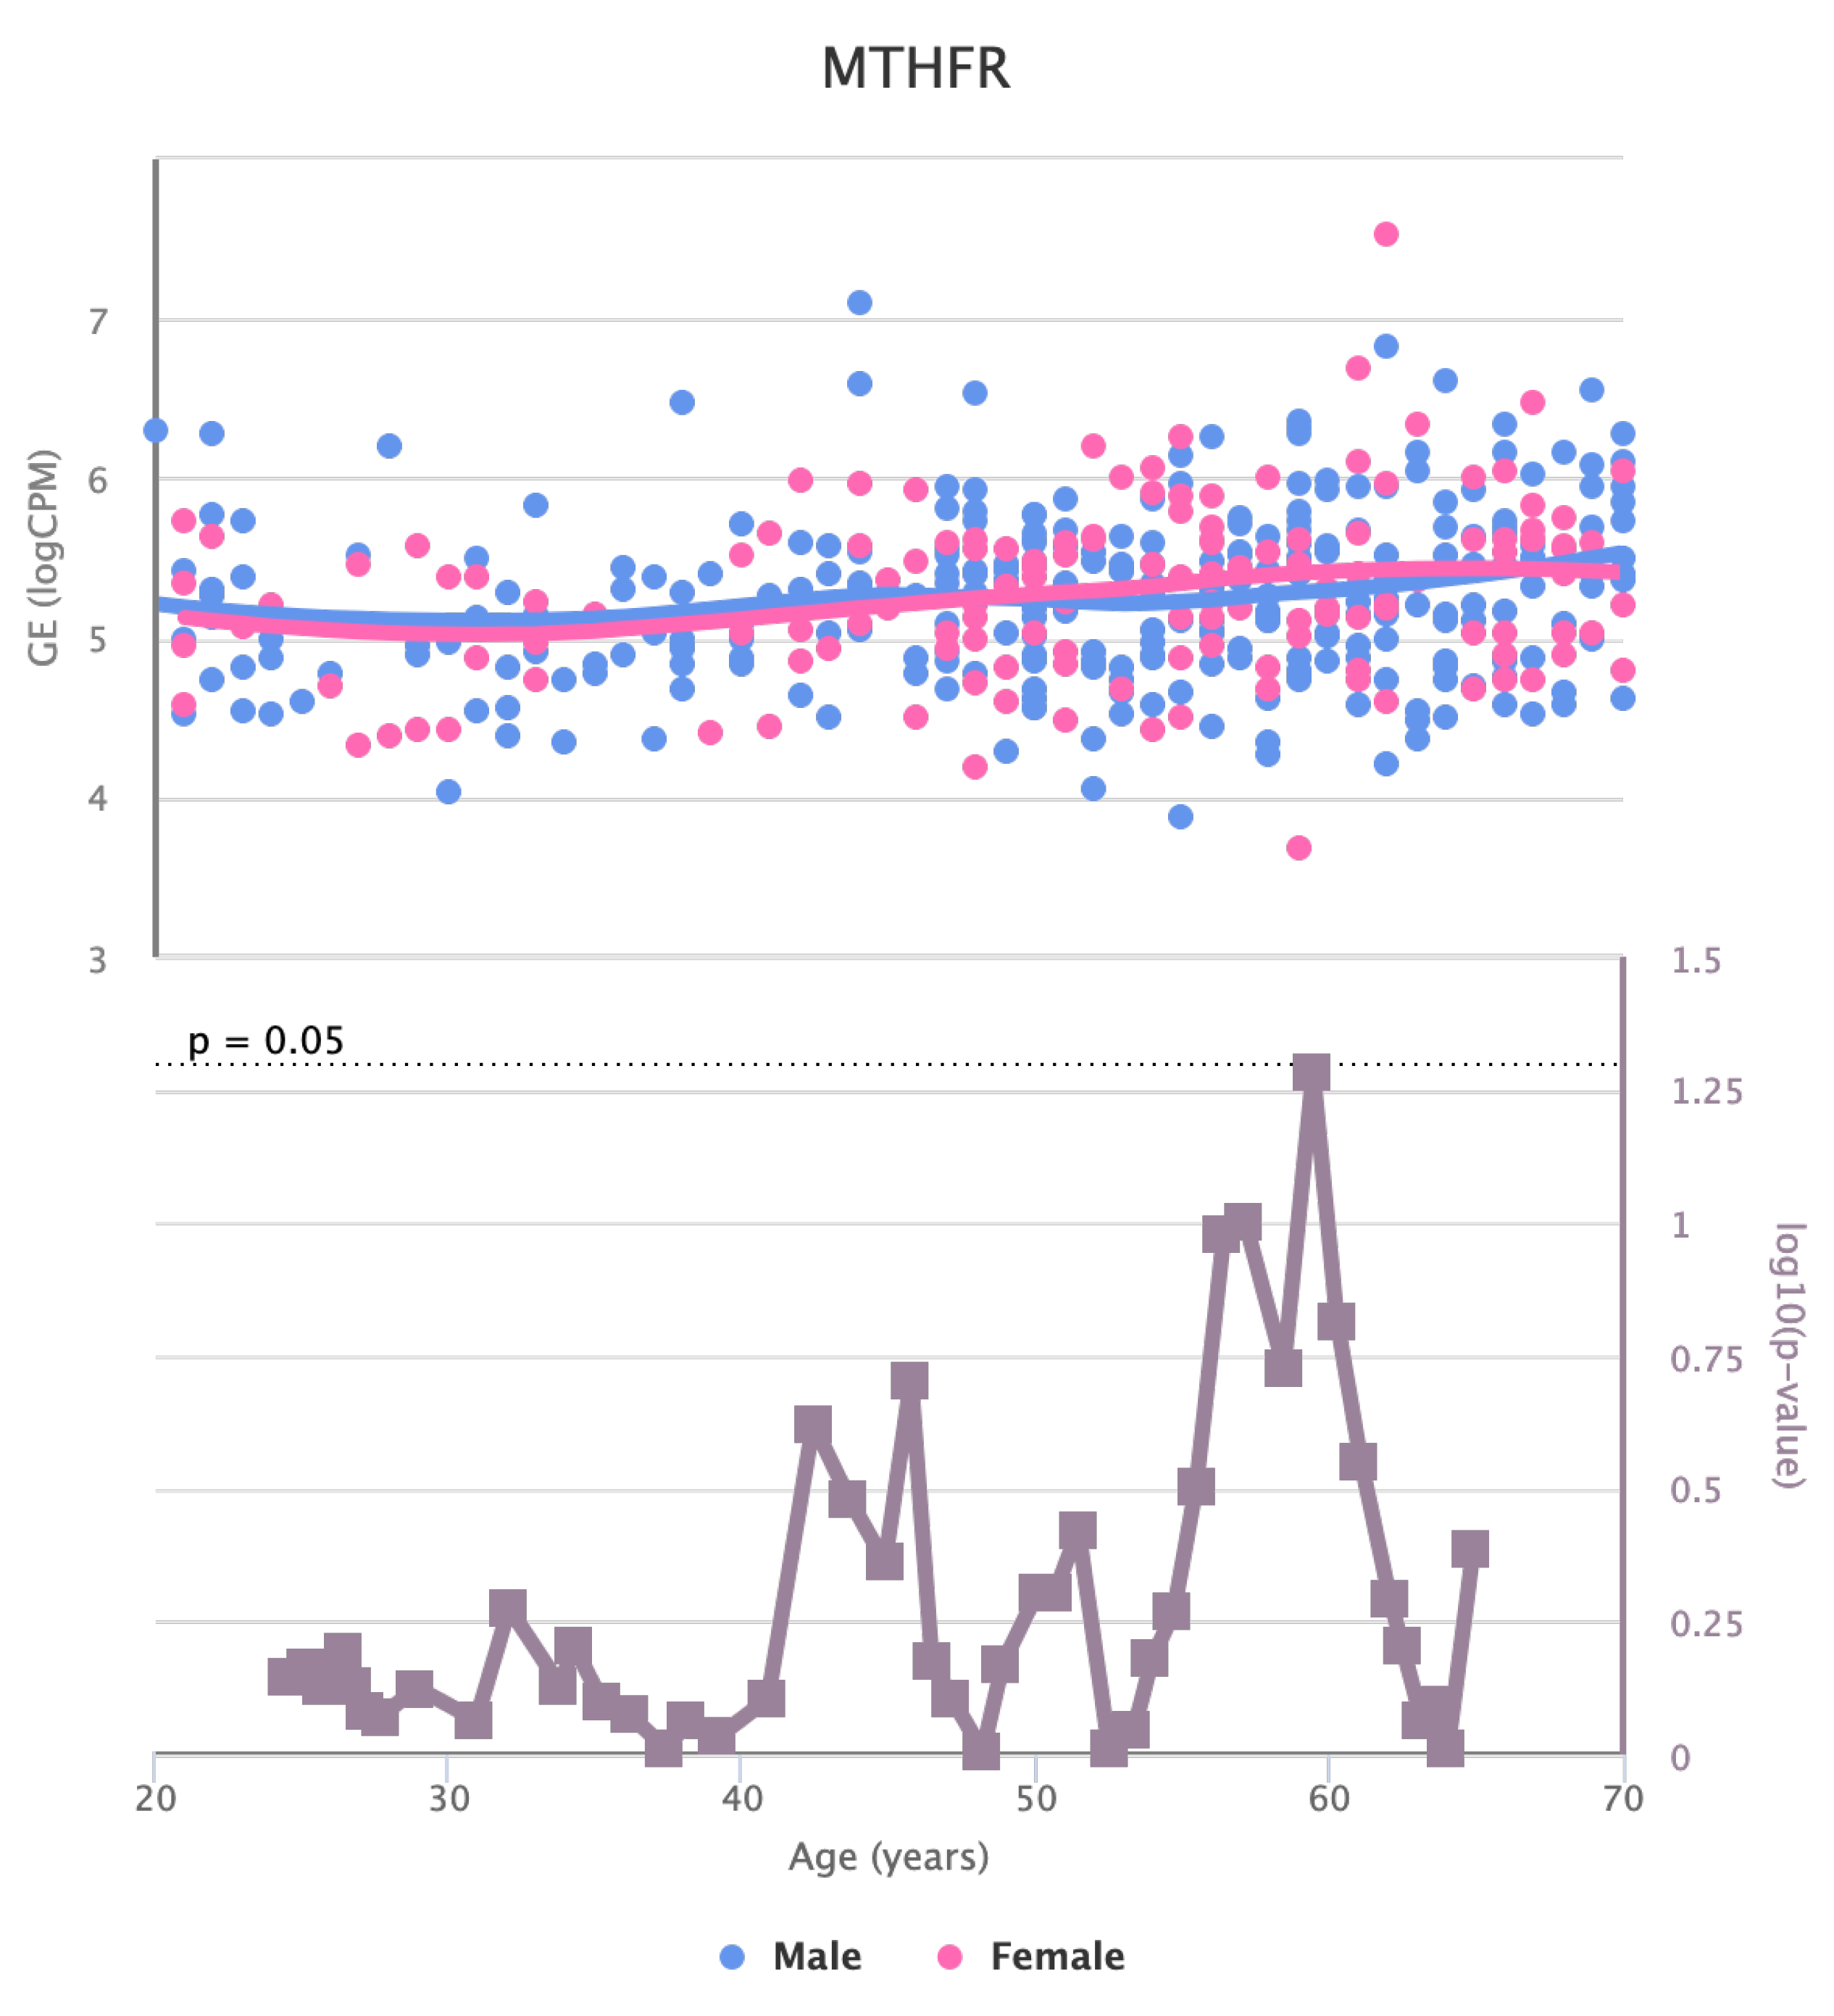
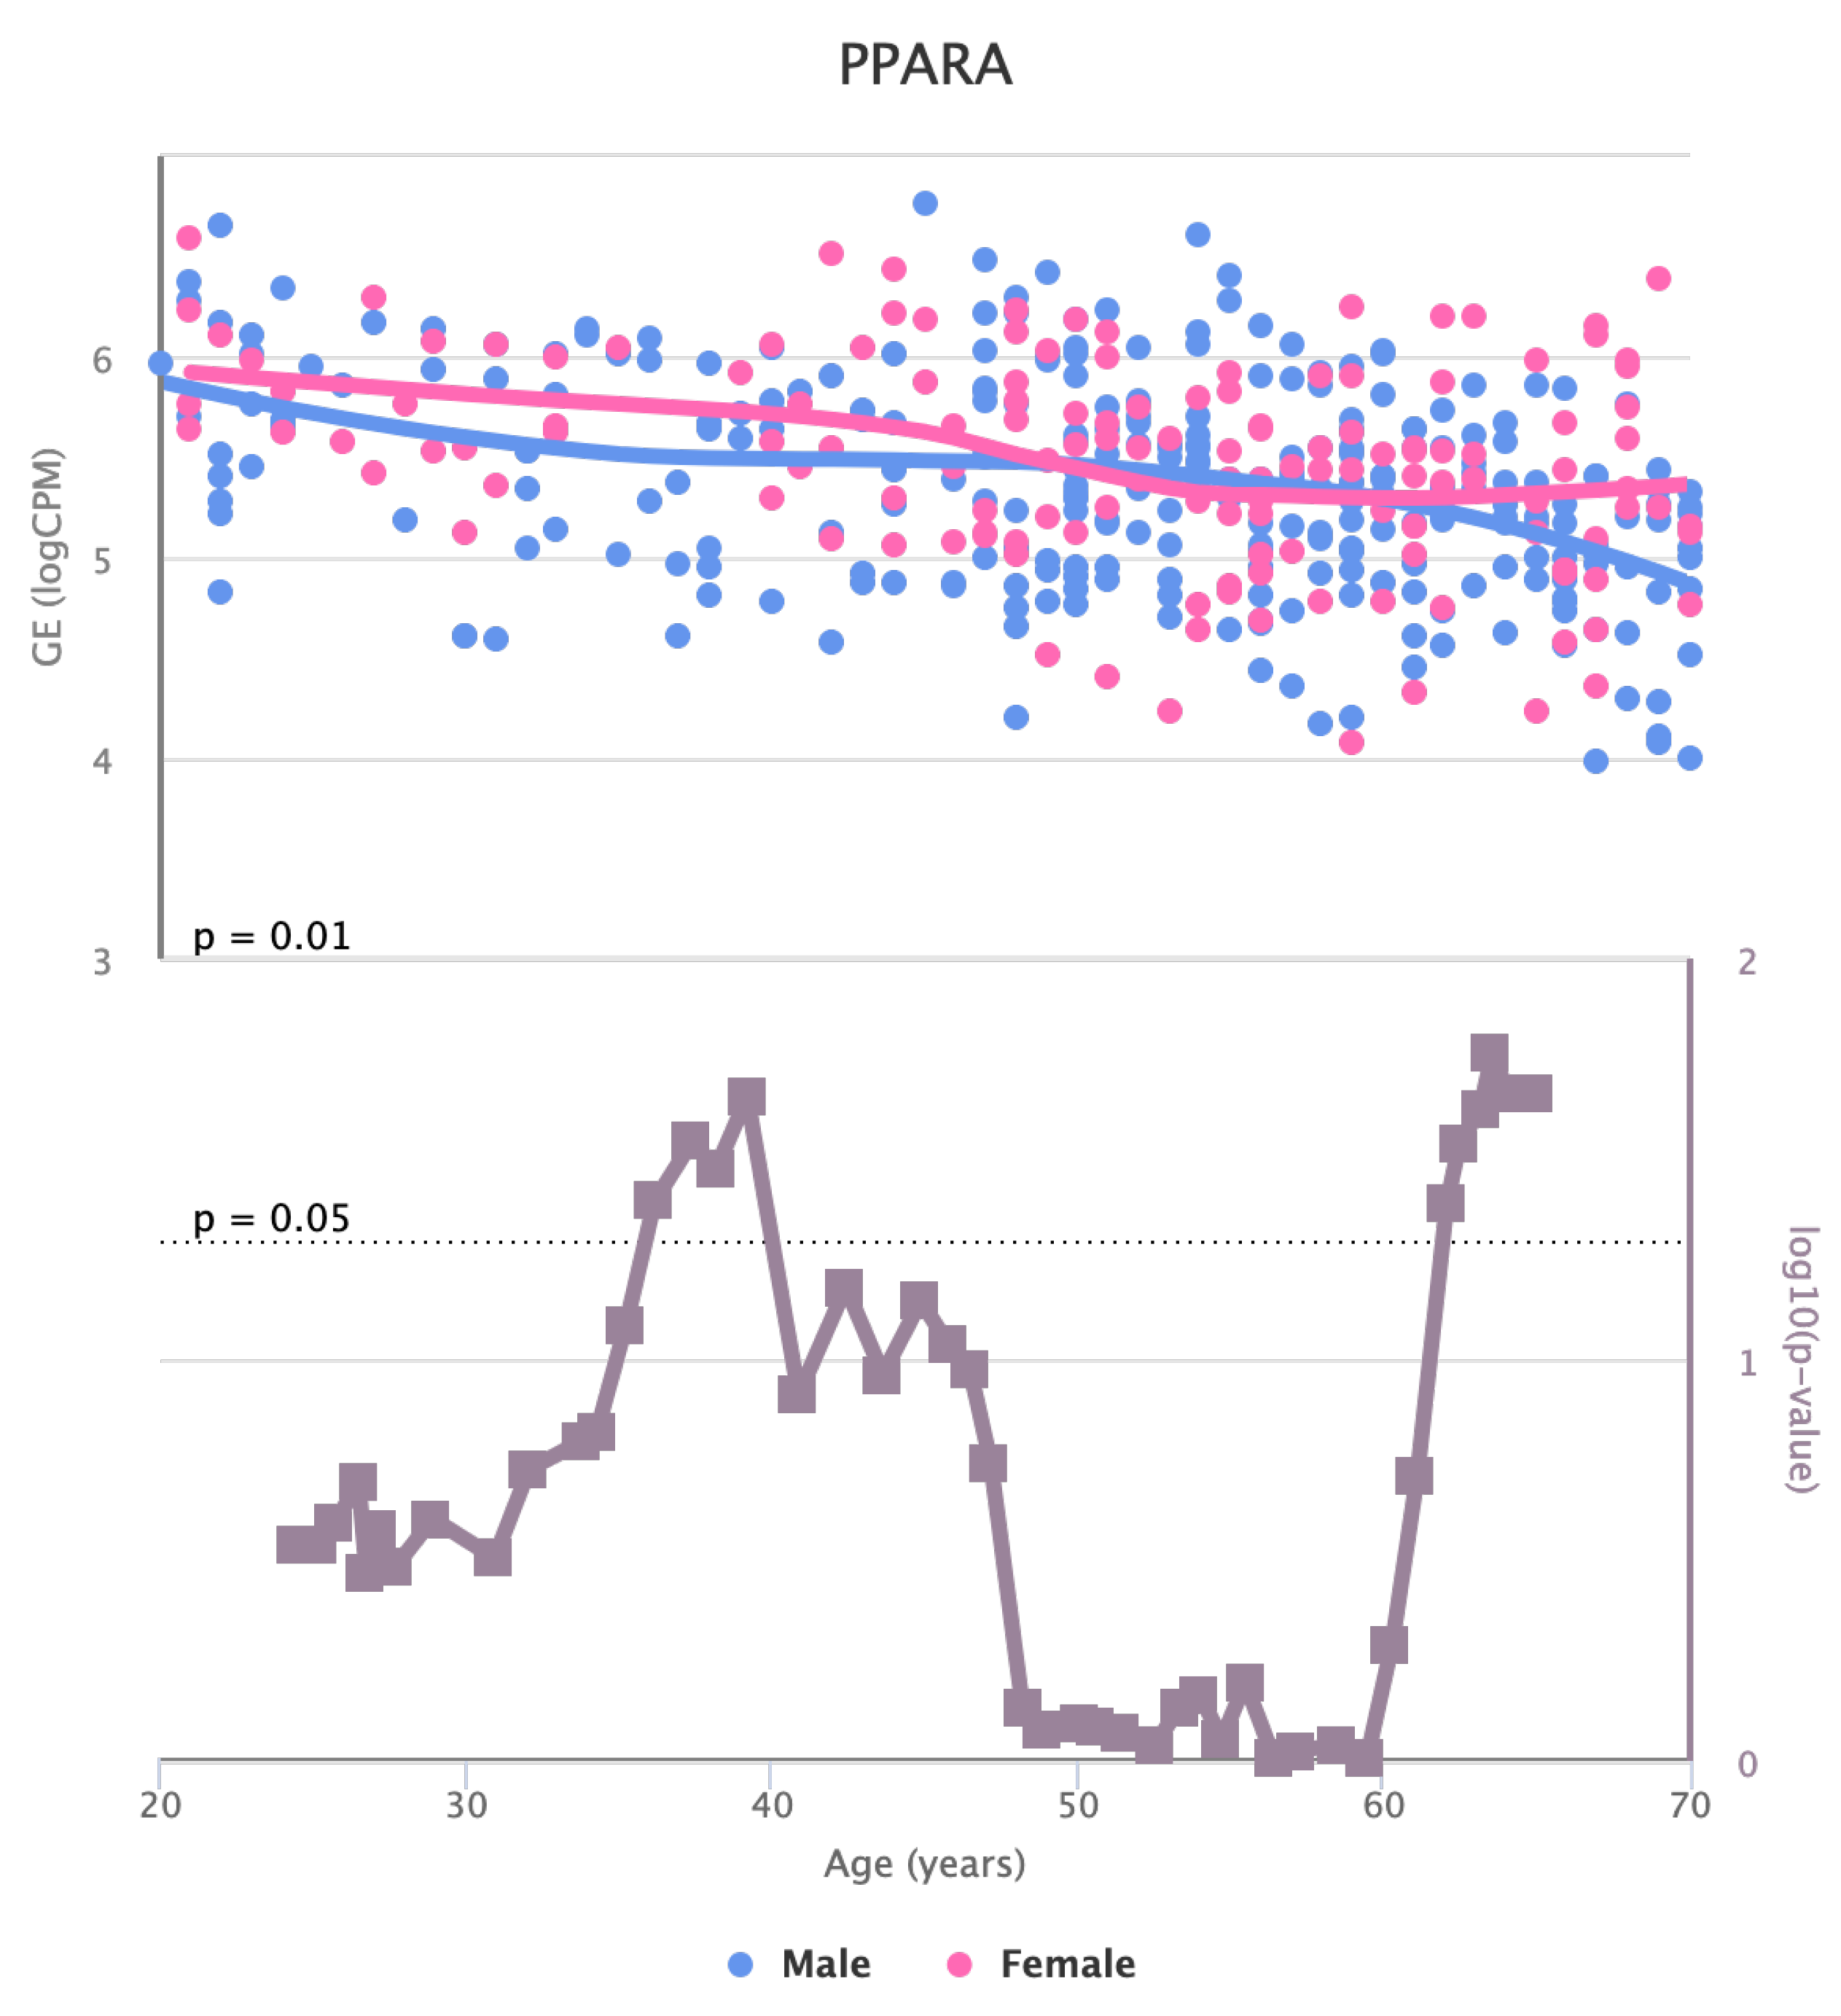
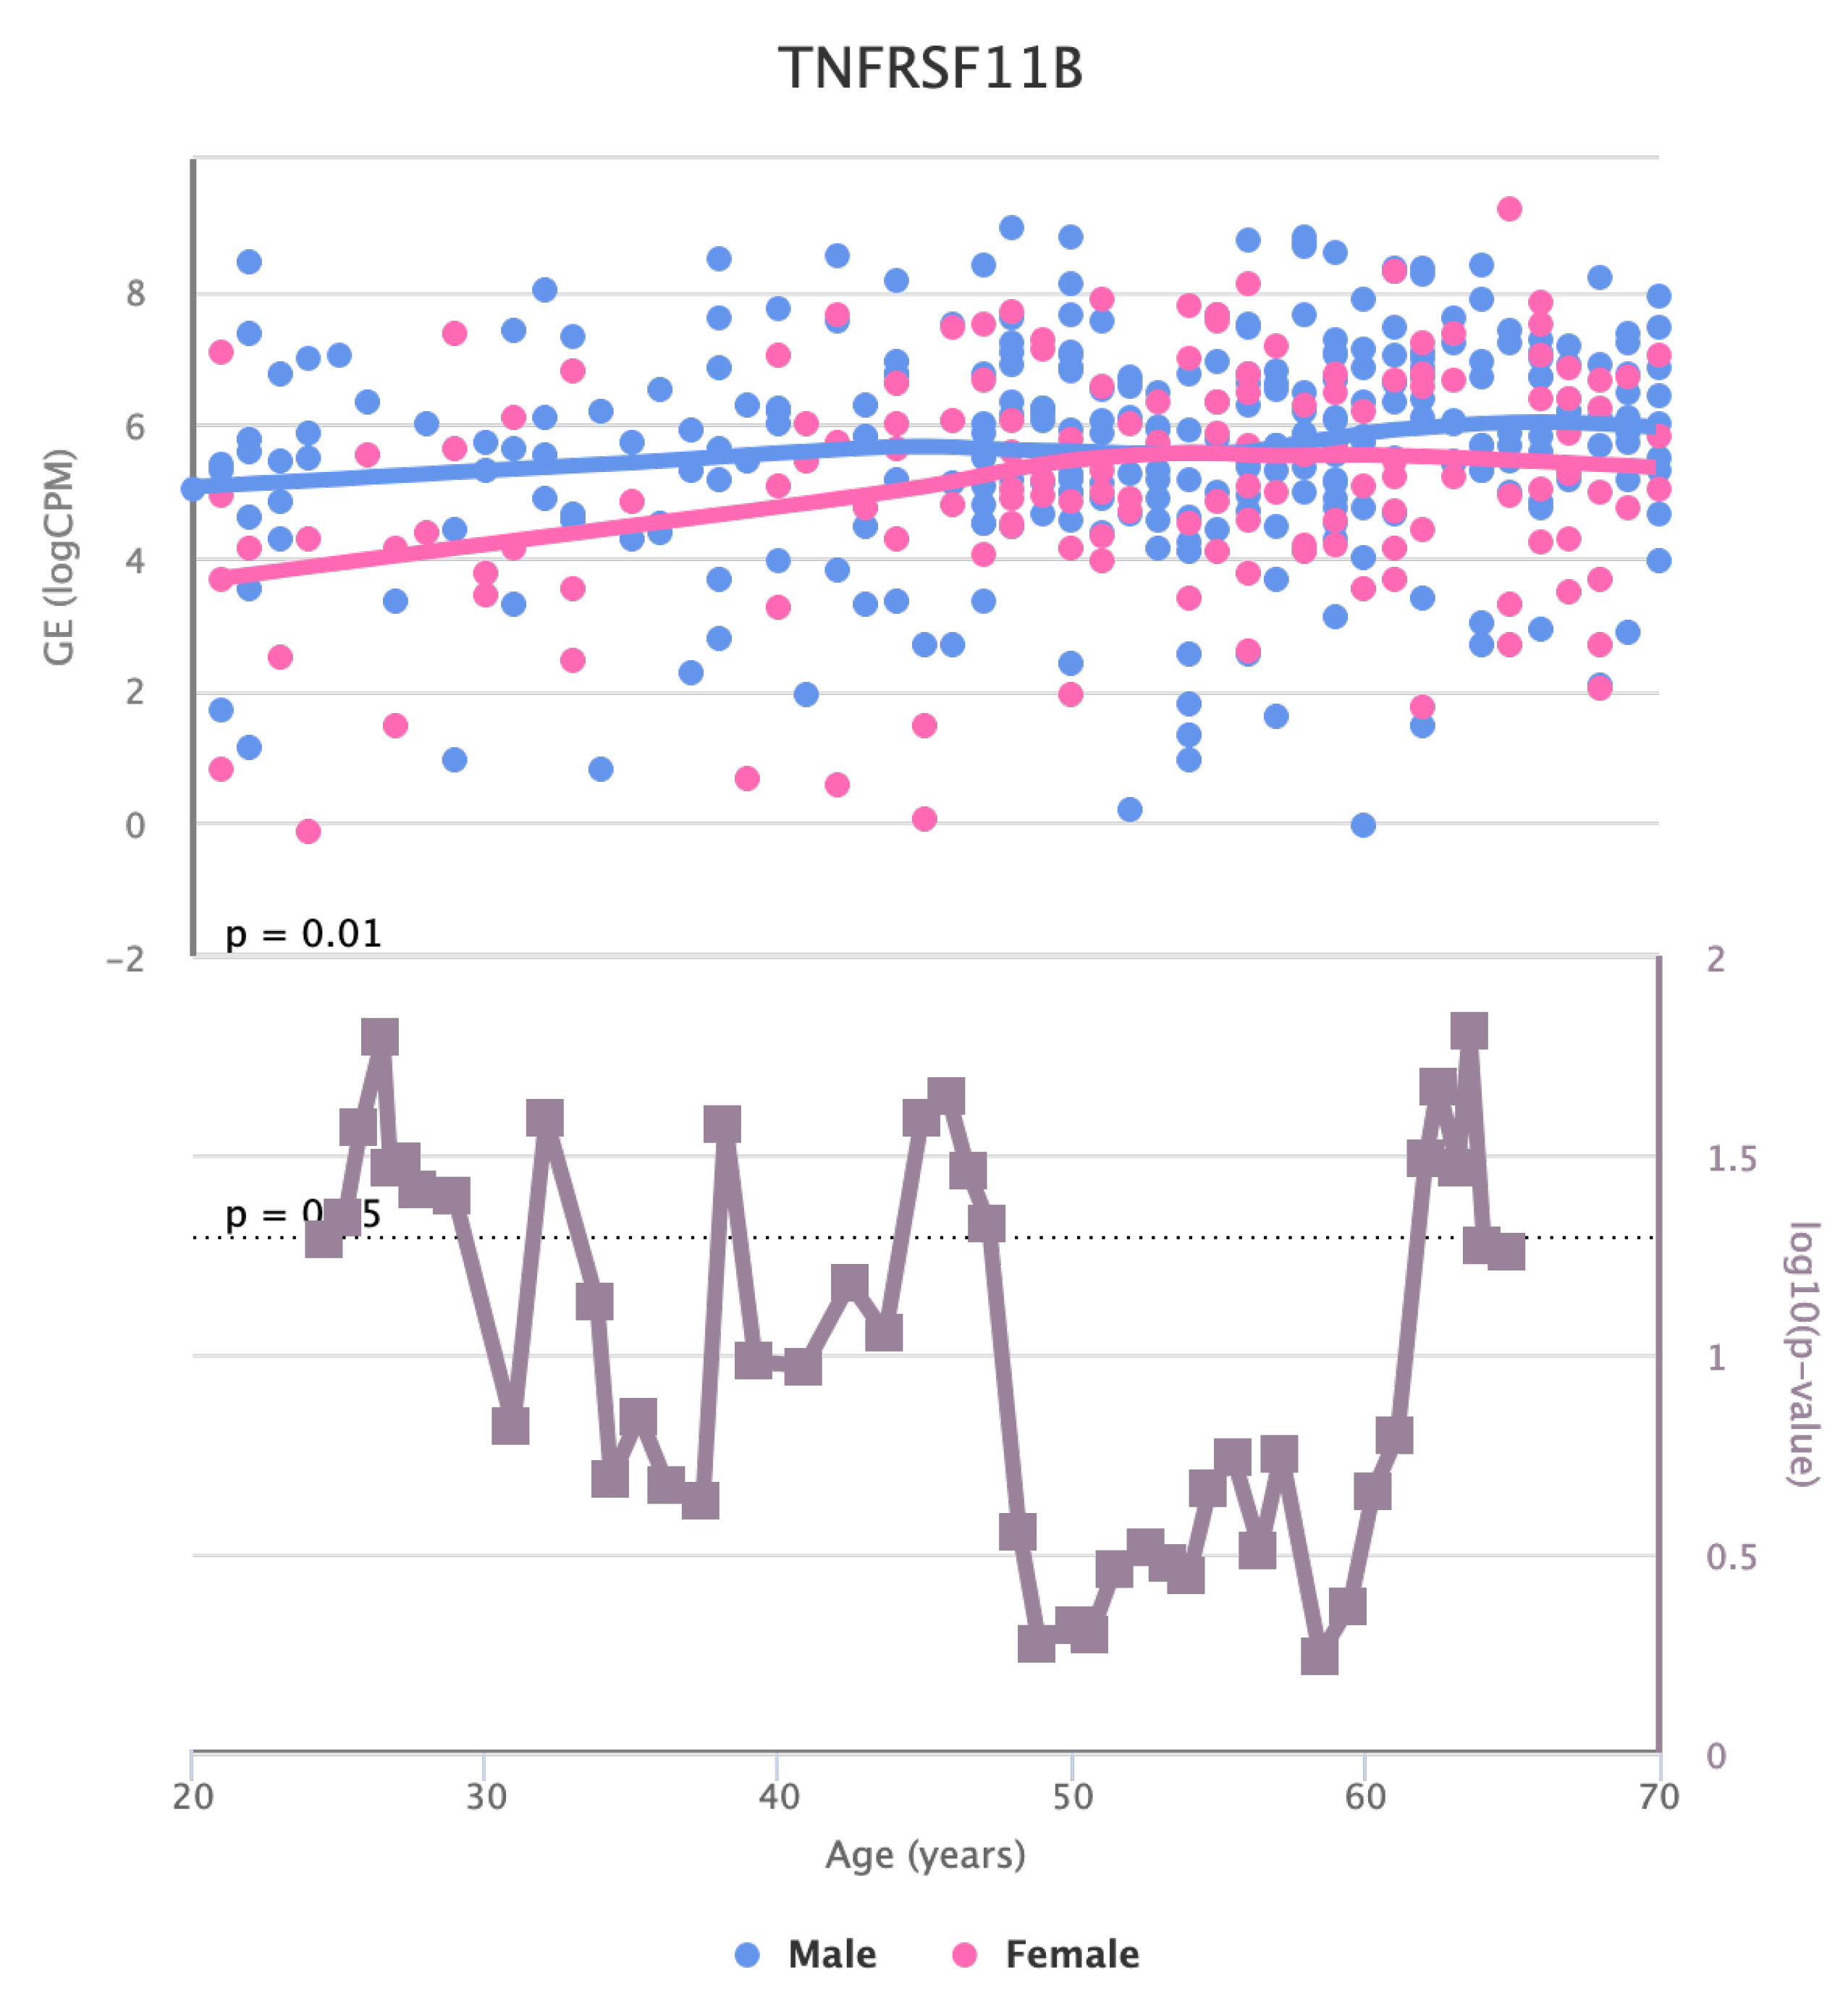
Finally, we also identified for the HGF, LEP, MOK, MTHFR, PPARA, and TNFRSF11B genes a significant change in basal expression with sex as reported in
Figure 7,
Figure 8,
Figure 9,
Figure 10,
Figure 11 and
Figure 12.
4. Discussion
The bioinformatic analysis we carried out in this work evidenced the existence of a set of genes in artery tibial tissue presenting changes in basal expression with age [
39]. Modifying gene expression and other parameters may constitute a risk factor for the insurgence and development of some diseases. We here analyzed genes related to dyslipidemia-based atherosclerosis [
38].
In the artery tibial, we found changes in KLF14 gene, which encodes a transcription factor that regulates several cellular processes. The decrease in its expression in blood with age suggests that it might play a role in age-related changes in the blood and may have implications in aging processes or age-related diseases [
40,
41]. PPARA encodes a nuclear receptor involved in lipid metabolism and inflammation. The decrease in its expression in artery tibial with age may indicate alterations in lipid metabolism and inflammation pathways in this tissue during aging [
28,
42].
The changes in the expression of MTHFR, HGF, LEP, LPL, TNFRSF11B, MOK, CETP, and MIF in artery tibial with age suggests that they might be involved in age-related processes in this tissue [
43,
44].
TCF7L2 encodes a transcription factor in the
wnt signalling pathway and plays a crucial role in various cellular processes [
45]. The increased expression of TCF7L2 in the artery aorta with age indicates its potential involvement in aging-related changes in this tissue and might have implications for cardiovascular health [
46].
The identified genes could be related to molecular mechanisms associated with aging and dyslipidemia-based atherosclerosis. This may illuminate the potential molecular mechanisms associated with ageing and dyslipidaemia-based atherosclerosis. The decrease in KLF14 expression in blood and the expression of PPARA in the tibial artery, along with the increased expression of MTHFR, HGF, LEP, LPL, TNFRSF11B, MOK, CETP, and MIF in the tibial artery, and TCF7L2 in the aorta artery, may indicate their involvement in age-related processes. The protein-interaction network associated with these genes in the tibial artery further provides valuable information on their potential functional relationships.
In general, this study provides valuable information on age-related changes in gene expression in different tissues. It is important to note that gene expression is just one aspect of the complex process of aging, and further research is needed to understand the underlying mechanisms and potential implications of these findings for age-related diseases and health conditions [
47,
48]. Additionally, considering the dynamic nature of gene regulation, factors such as lifestyle, environmental influences, and genetic variations can also contribute to the observed changes in gene expression with age.
The results also open an interesting direction regarding the roles of the identified genes through the aging-related changes.
5. Conclusions
We identified 11 genes whose expression changes with age in the blood tissues, artery tibial, and artery aorta.
It is essential to recognize that changes in gene expression are part of a complex interplay of various factors that contribute to the ageing process. Thus, these findings lay the groundwork for future research to explore the broader implications of these gene expression alterations and how they may influence age-related diseases and overall health.
This work is based on available data, and in silico experiments have been conducted. Even if we keep in mind that our findings stimulate further laboratory and clinical experiments, future work may include the definition of a clinical study to validate results in dysmetabolic patients.
Author Contributions
Conceptualization, P.H.G. and P.V.; methodology, P.H.G. and E.P.; validation, P.H.G. and P.V..; resources, P.V.; data curation, P.H.G.; writing—original draft preparation, P.H.H.; writing—review and editing, P.H.G and P.V.; visualization, X.X.; supervision, P.V.; project administration, P.V.; funding acquisition, P.V. All authors have read and agreed to the published version of the manuscript.
Institutional Review Board Statement
Not applicable.
Informed Consent Statement
Not applicable.
Data Availability Statement
Acknowledgments
This work was funded by the Next Generation EU - Italian NRRP, Mission 4, Component 2, Investment 1.5, call for the creation and strengthening of ’Innovation Ecosystems’, building ’Territorial R&D Leaders’ (Directorial Decree n. 2021/3277) - project Tech4You - Technologies for climate change adaptation and quality of life improvement, n. ECS0000009. This work was partially supported by project SERICS (PE00000014) under the MUR National Recovery and Resilience Plan funded by the European Union - NextGenerationEU. This work reflects only the authors’ views and opinions, neither the Ministry for University and Research nor the European Commission can be considered responsible for them. Authors are grateful to Francesca Cortese for analysis on preliminary results.
Conflicts of Interest
The authors declare no conflict of interest.
References
- Farmer, J.A. Diabetic dyslipidemia and atherosclerosis: evidence from clinical trials. Curr. Diabetes Rep. 2008, 8, 71–77. [Google Scholar] [CrossRef] [PubMed]
- Koba, S.; Hirano, T. Dyslipidemia and atherosclerosis. Nihon Rinsho. Jpn. J. Clin. Med. 2011, 69, 138–143. [Google Scholar]
- Stein, R.; Ferrari, F.; Scolari, F. Genetics, dyslipidemia, and cardiovascular disease: new insights. Curr. Cardiol. Rep. 2019, 21, 1–12. [Google Scholar]
- Chiarella, G.; Tognini, S.; Nacci, A.; Sieli, R.; Costante, G.; Petrolo, C.; Mancini, V.; Guzzi, P.H.; Pasqualetti, G.; Cassandro, E.; others. Vestibular disorders in euthyroid patients with Hashimoto’s thyroiditis: role of thyroid autoimmunity. Clin. Endocrinol. 2014, 81, 600–605. [Google Scholar] [CrossRef]
- Tietge, U.J. Hyperlipidemia and cardiovascular disease: inflammation, dyslipidemia, and atherosclerosis. Curr. Opin. Lipidol. 2014, 25, 94–95. [Google Scholar] [CrossRef]
- Tradigo, G.; De Rosa, S.; Vizza, P.; Fragomeni, G.; Guzzi, P.H.; Indolfi, C.; Veltri, P. Calculation of intracoronary pressure-based indexes with jlabchart. Appl. Sci. 2022, 12, 3448. [Google Scholar] [CrossRef]
- Succurro, E.; Marini, M.A.; Fiorentino, T.V.; Perticone, M.; Sciacqua, A.; Andreozzi, F.; Sesti, G. Sex-specific differences in prevalence of nonalcoholic fatty liver disease in subjects with prediabetes and type 2 diabetes. Diabetes Res. Clin. Pract. 2022, 190, 110027. [Google Scholar] [CrossRef] [PubMed]
- Guzzi, P.H.; Cortese, F.; Mannino, G.C.; Pedace, E.; Succurro, E.; Andreozzi, F.; Veltri, P. Differential network analysis between sex of the genes related to comorbidities of type 2 mellitus diabetes. Appl. Netw. Sci. 2023, 8, 1–16. [Google Scholar]
- Canino, G.; Guzzi, P.H.; Tradigo, G.; Zhang, A.; Veltri, P. On the Analysis of Diseases and Their Related Geographical Data. IEEE J. Biomed. Health Informatics 2017, 21, 228–237. [Google Scholar] [CrossRef]
- Mizuno, Y.; Jacob, R.F.; Mason, R.P. Inflammation and the development of atherosclerosis—effects of lipid-lowering therapy. J. Atheroscler. Thromb. 2011, 18, 351–358. [Google Scholar] [CrossRef]
- Succurro, E.; Cicone, F.; Papa, A.; Miceli, S.; Vizza, P.; Fiorentino, T.V.; Perticone, M.; Sciacqua, A.; Guzzi, P.H.; Veltri, P.; others. Impaired insulin-stimulated myocardial glucose metabolic rate is associated with reduced estimated myocardial energetic efficiency in subjects with different degrees of glucose tolerance. Cardiovasc. Diabetol. 2023, 22, 1–11. [Google Scholar] [CrossRef] [PubMed]
- Holmes, M.V.; Ala-Korpela, M. What is ‘LDL cholesterol’? Nat. Rev. Cardiol. 2019, 16, 197–198. [Google Scholar] [CrossRef] [PubMed]
- Rosenson, R.S.; Brewer Jr, H.B.; Ansell, B.J.; Barter, P.; Chapman, M.J.; Heinecke, J.W.; Kontush, A.; Tall, A.R.; Webb, N.R. Dysfunctional HDL and atherosclerotic cardiovascular disease. Nat. Rev. Cardiol. 2016, 13, 48–60. [Google Scholar] [CrossRef] [PubMed]
- Mottaghi-Dastjerdi, N.; Ghorbani, A.; Montazeri, H.; Guzzi, P.H. A systems biology approach to pathogenesis of gastric cancer: gene network modeling and pathway analysis. BMC Gastroenterol. 2023, 23, 248. [Google Scholar] [CrossRef] [PubMed]
- Navab, M.; Reddy, S.T.; Van Lenten, B.J.; Anantharamaiah, G.; Fogelman, A.M. The role of dysfunctional HDL in atherosclerosis. J. Lipid Res. 2009, 50, S145–S149. [Google Scholar] [CrossRef]
- Libby, P. The biology of atherosclerosis comes full circle: lessons for conquering cardiovascular disease. Nat. Rev. Cardiol. 2021, 18, 683–684. [Google Scholar] [CrossRef]
- Guzzi, P.H.; Cortese, F.; Mannino, G.C.; Pedace, E.; Succurro, E.; Andreozzi, F.; Veltri, P. Analysis of age-dependent gene-expression in human tissues for studying diabetes comorbidities. Sci. Rep. 2023, 13, 10372. [Google Scholar] [CrossRef]
- LeRoith, D.; Biessels, G.J.; Braithwaite, S.S.; Casanueva, F.F.; Draznin, B.; Halter, J.B.; Hirsch, I.B.; McDonnell, M.E.; Molitch, M.E.; Murad, M.H.; others. Treatment of diabetes in older adults: an Endocrine Society clinical practice guideline. J. Clin. Endocrinol. Metab. 2019, 104, 1520–1574. [Google Scholar]
- Mercatelli, D.; Pedace, E.; Veltri, P.; Giorgi, F.M.; Guzzi, P.H. Exploiting the molecular basis of age and gender differences in outcomes of SARS-CoV-2 infections. Comput. Struct. Biotechnol. J. 2021, 19, 4092–4100. [Google Scholar] [CrossRef]
- Bahour, N.; Cortez, B.; Pan, H.; Shah, H.; Doria, A.; Aguayo-Mazzucato, C. Diabetes mellitus correlates with increased biological age as indicated by clinical biomarkers. GeroScience 2022, 44, 415–427. [Google Scholar] [CrossRef]
- Munshi, M.N.; Meneilly, G.S.; Rodríguez-Mañas, L.; Close, K.L.; Conlin, P.R.; Cukierman-Yaffe, T.; Forbes, A.; Ganda, O.P.; Kahn, C.R.; Huang, E.; others. Diabetes in ageing: pathways for developing the evidence base for clinical guidance. Lancet Diabetes Endocrinol. 2020, 8, 855–867. [Google Scholar] [CrossRef]
- Dennis, J.M.; Mateen, B.A.; Sonabend, R.; Thomas, N.J.; Patel, K.A.; Hattersley, A.T.; Denaxas, S.; McGovern, A.P.; Vollmer, S.J. Type 2 diabetes and COVID-19–Related mortality in the critical care setting: a national cohort study in England, March–July 2020. Diabetes Care 2021, 44, 50–57. [Google Scholar] [CrossRef]
- Care, F. Standards of medical care in diabetes-2019. Diabetes Care 2019, 42, S124–S138. [Google Scholar]
- Atlas, D.; others. International diabetes federation. IDF Diabetes Atlas, 7th edn. Brussels, Belgium: International Diabetes Federation 2015, 33. [Google Scholar]
- Antal, B.; McMahon, L.P.; Sultan, S.F.; Lithen, A.; Wexler, D.J.; Dickerson, B.; Ratai, E.M.; Mujica-Parodi, L.R. Type 2 diabetes mellitus accelerates brain aging and cognitive decline: Complementary findings from UK Biobank and meta-analyses. Elife 2022, 11, e73138. [Google Scholar] [CrossRef] [PubMed]
- Man, J.J.; Beckman, J.A.; Jaffe, I.Z. Sex as a biological variable in atherosclerosis. Circ. Res. 2020, 126, 1297–1319. [Google Scholar] [CrossRef] [PubMed]
- Fairweather, D. Sex differences in inflammation during atherosclerosis. Clin. Med. Insights: Cardiol. 2014, 8, CMC–S17068. [Google Scholar] [CrossRef]
- Mangoni, M.; Petrizzelli, F.; Liorni, N.; Bianco, S.D.; Biagini, T.; Napoli, A.; Adinolfi, M.; Guzzi, P.H.; Novelli, A.; Caputo, V.; others. Investigating mitochondrial gene expression patterns in Drosophila melanogaster using network analysis to understand aging mechanisms. Appl. Sci. 2023, 13, 7342. [Google Scholar] [CrossRef]
- Roetker, N.S.; Pankow, J.S.; Bressler, J.; Morrison, A.C.; Boerwinkle, E. Prospective study of epigenetic age acceleration and incidence of cardiovascular disease outcomes in the ARIC study (Atherosclerosis Risk in Communities). Circ. Genom. Precis. Med. 2018, 11, e001937. [Google Scholar] [CrossRef]
- Rani, J.; Mittal, I.; Pramanik, A.; Singh, N.; Dube, N.; Sharma, S.; Puniya, B.L.; Raghunandanan, M.V.; Mobeen, A.; Ramachandran, S. T2DiACoD: a gene atlas of type 2 diabetes mellitus associated complex disorders. Sci. Rep. 2017, 7, 1–21. [Google Scholar] [CrossRef]
- Szklarczyk, D.; Morris, J.H.; Cook, H.; Kuhn, M.; Wyder, S.; Simonovic, M.; Santos, A.; Doncheva, N.T.; Roth, A.; Bork, P.; others. The STRING database in 2017: quality-controlled protein–protein association networks, made broadly accessible. Nucleic Acids Res. 2016, gkw937. [Google Scholar] [CrossRef] [PubMed]
- Gu, S.; Jiang, M.; Guzzi, P.H.; Milenković, T. Modeling multi-scale data via a network of networks. Bioinformatics 2022, 38, 2544–2553. [Google Scholar] [CrossRef] [PubMed]
- Health, T.L.D. Equitable precision medicine for type 2 diabetes, 2022.
- Guzzi, P.H.; Lomoio, U.; Veltri, P. GTExVisualizer: a web platform for supporting ageing studies. Bioinformatics 2023, 39, btad303. Available online: https://academic.oup.com/bioinformatics/article-pdf/39/5/btad303/50394853/btad303.pdf. [CrossRef]
- Lonsdale, J.; Thomas, J.; Salvatore, M.; Phillips, R.; Lo, E.; Shad, S.; Hasz, R.; Walters, G.; Garcia, F.; Young, N.; others. The genotype-tissue expression (GTEx) project. Nat. Genet. 2013, 45, 580–585. [Google Scholar] [CrossRef] [PubMed]
- Szklarczyk, D.; Gable, A.L.; Nastou, K.C.; Lyon, D.; Kirsch, R.; Pyysalo, S.; Doncheva, N.T.; Legeay, M.; Fang, T.; Bork, P.; others. The STRING database in 2021: customizable protein–protein networks, and functional characterization of user-uploaded gene/measurement sets. Nucleic Acids Res. 2021, 49, D605–D612. [Google Scholar] [CrossRef]
- Schneider, A.L.; Saraiva-Agostinho, N.; Barbosa-Morais, N.L. voyAGEr: free web interface for the analysis of age-related gene expression alterations in human tissues. bioRxiv, 2022; 2022–12. [Google Scholar]
- Cho, Y.R.; Mina, M.; Lu, Y.; Kwon, N.; Guzzi, P.H. M-finder: Uncovering functionally associated proteins from interactome data integrated with go annotations. Proteome Sci. 2013, 11, 1–12. [Google Scholar] [CrossRef] [PubMed]
- Ai, R.; Jin, X.; Tang, B.; Yang, G.; Niu, Z.; Fang, E.F. Ageing and Alzheimer’s Disease: Application of Artificial Intelligence in Mechanistic Studies, Diagnosis, and Drug Development. In Artificial Intelligence in Medicine; Springer, 2021; pp. 1–16.
- Spólnicka, M.; Pośpiech, E.; Adamczyk, J.G.; Freire-Aradas, A.; Pepłońska, B.; Zbieć-Piekarska, R.; Makowska, Ż.; Pięta, A.; Lareu, M.V.; Phillips, C.; others. Modified aging of elite athletes revealed by analysis of epigenetic age markers. Aging (Albany NY) 2018, 10, 241. [Google Scholar] [CrossRef] [PubMed]
- Xie, W.; Li, L.; Zheng, X.L.; Yin, W.D.; Tang, C.K. The role of Krüppel-like factor 14 in the pathogenesis of atherosclerosis. Atherosclerosis 2017, 263, 352–360. [Google Scholar] [CrossRef]
- Biswas, D.; Ghosh, M.; Kumar, S.; Chakrabarti, P. PPARa-ATGL pathway improves muscle mitochondrial metabolism: implication in aging. FASEB J. 2016, 30, 3822–3834. [Google Scholar] [CrossRef]
- Darci-Maher, N.; Alvarez, M.; Arasu, U.T.; Selvarajan, I.; Lee, S.H.T.; Pan, D.Z.; Miao, Z.; Das, S.S.; Kaminska, D.; Örd, T.; others. Cross-tissue omics analysis discovers ten adipose genes encoding secreted proteins in obesity-related non-alcoholic fatty liver disease. EBioMedicine 2023, 92. [Google Scholar] [CrossRef]
- Bell, E.J.; Decker, P.A.; Tsai, M.Y.; Pankow, J.S.; Hanson, N.Q.; Wassel, C.L.; Larson, N.B.; Cohoon, K.P.; Budoff, M.J.; Polak, J.F.; others. Hepatocyte growth factor is associated with progression of atherosclerosis: The Multi-Ethnic Study of Atherosclerosis (MESA). Atherosclerosis 2018, 272, 162–167. [Google Scholar] [CrossRef]
- Li, J.; Zhou, L.; Ouyang, X.; He, P. Transcription factor-7-like-2 (TCF7L2) in atherosclerosis: a potential biomarker and therapeutic target. Front. Cardiovasc. Med. 2021, 8, 701279. [Google Scholar] [CrossRef] [PubMed]
- He, L.H.; Gao, J.H.; Yu, X.H.; Wen, F.J.; Luo, J.J.; Qin, Y.S.; Chen, M.X.; Zhang, D.W.; Wang, Z.B.; Tang, C.K. Artesunate inhibits atherosclerosis by upregulating vascular smooth muscle cells-derived LPL expression via the KLF2/NRF2/TCF7L2 pathway. Eur. J. Pharmacol. 2020, 884, 173408. [Google Scholar] [CrossRef] [PubMed]
- Costopoulos, C.; Liew, T.V.; Bennett, M. Ageing and atherosclerosis: Mechanisms and therapeutic options. Biochem. Pharmacol. 2008, 75, 1251–1261. [Google Scholar] [CrossRef] [PubMed]
- Tyrrell, D.J.; Goldstein, D.R. Ageing and atherosclerosis: vascular intrinsic and extrinsic factors and potential role of IL-6. Nat. Rev. Cardiol. 2021, 18, 58–68. [Google Scholar] [CrossRef] [PubMed]
Figure 1.
Figure depicts the main steps of the proposed methodology.
Figure 1.
Figure depicts the main steps of the proposed methodology.
Figure 2.
Boxplots of gene expression in artery tibial tissue. All the genes present a significant increase or decrease of basal levels with age class (20-29, 30-39, 40-49, 50-59, 60-69, 70-79) in different tissues. Differences have been tested by using a Kruskal-Wallis test. Figure evidences a decrease in the expression of PPARA, while MTHFR, HGF, LEP, LPL, TNFRSF11B, MOK, CETP, and MIF increased with age.
Figure 3.
Increased expression of TCF7L2 in the aorta tissue.
Figure 3.
Increased expression of TCF7L2 in the aorta tissue.
Figure 4.
Expression with age of KLF14 gene in blood.
Figure 4.
Expression with age of KLF14 gene in blood.
Figure 5.
Protein Interaction Network Associated with genes presenting changes with age in artery tibial tissue.
Figure 5.
Protein Interaction Network Associated with genes presenting changes with age in artery tibial tissue.
Figure 6.
Functional Enrichment of the Genes
Figure 6.
Functional Enrichment of the Genes
Figure 7.
Changes in the Expression of HGF gene with age due to sex effects. The bottom part of the figure reports the associated p-value.
Figure 7.
Changes in the Expression of HGF gene with age due to sex effects. The bottom part of the figure reports the associated p-value.
Figure 8.
Changes in the Expression of LEP gene with age due to sex effects. The bottom part of the figure reports the associated p-value.
Figure 8.
Changes in the Expression of LEP gene with age due to sex effects. The bottom part of the figure reports the associated p-value.
Figure 9.
Changes in the Expression of MOK gene with age due to sex effects. The bottom part of the figure reports the associated p-value.
Figure 9.
Changes in the Expression of MOK gene with age due to sex effects. The bottom part of the figure reports the associated p-value.
Figure 10.
Changes in the Expression of MTHFR gene with age due to sex effects. The bottom part of the figure reports the associated p-value.
Figure 10.
Changes in the Expression of MTHFR gene with age due to sex effects. The bottom part of the figure reports the associated p-value.
Figure 11.
Changes in the Expression of PPARA gene with age due to sex effects. The bottom part of the figure reports the associated p-value.
Figure 11.
Changes in the Expression of PPARA gene with age due to sex effects. The bottom part of the figure reports the associated p-value.
Figure 12.
Changes in the Expression of PPARA gene with age due to sex effects. The bottom part of the figure reports the associated p-value.
Figure 12.
Changes in the Expression of PPARA gene with age due to sex effects. The bottom part of the figure reports the associated p-value.
Table 1.
Genes presenting a significant increase or decrease of basal levels with age class (20-29, 30-39, 40-49, 50-59, 60-69, 70-79) in different tissues. Differences have been tested by using a Kruskal-Wallis test.
Table 1.
Genes presenting a significant increase or decrease of basal levels with age class (20-29, 30-39, 40-49, 50-59, 60-69, 70-79) in different tissues. Differences have been tested by using a Kruskal-Wallis test.
| Tissue |
Increasing |
Decreasing |
| Blood |
|
KLF14 |
| Artery Tibial |
MTHFR |
PPARA |
| |
HGF |
|
| |
LEP |
|
| |
LPL |
|
| |
TNFRSF11B |
|
| |
MOK |
|
| |
CETP |
|
| |
MIF |
|
| Aorta |
TCF7L2 |
|
|
Disclaimer/Publisher’s Note: The statements, opinions and data contained in all publications are solely those of the individual author(s) and contributor(s) and not of MDPI and/or the editor(s). MDPI and/or the editor(s) disclaim responsibility for any injury to people or property resulting from any ideas, methods, instructions or products referred to in the content. |
© 2023 by the authors. Licensee MDPI, Basel, Switzerland. This article is an open access article distributed under the terms and conditions of the Creative Commons Attribution (CC BY) license (http://creativecommons.org/licenses/by/4.0/).

