
Submitted:
05 October 2023
Posted:
06 October 2023
You are already at the latest version
Preprints on COVID-19 and SARS-CoV-2
Abstract
Background. Waning of neutralizing and cell-mediated immune response after the primary vac-cine cycle (PVC) and the first booster dose (BD) is of concern, especially for PLWH with a CD4 count ≤200 cells/ mm3.Methods.Neutralizing antibodies (nAbs) titers by microneutralization assay against WD614G /Omicron BA.1 and IFNγ production by ELISA assay were measured in samples of PLWH at 4 time points [2 and 4 months post-PVC (T1 and T2), 2 weeks and 5 months after the BD (T3 and T4)]. Participants were stratified by CD4 count after PVC (LCD4, <200/mm3; ICD4, 201-500/mm3 and HCD4, >500/mm3). Mixed models were used to compare mean responses over T1-T4 across CD4 groups. Results. 314 PLWH on ART (LCD4=56; ICD4=120; HCD4=138) were enrolled. At T2, levels of nAbs were significantly lower in LCD4 vs ICD4/HCD4 (p=0.04). BD was crucial for increasing nAbs titres above 1:40 at T3 and up to T4 for WD614G. A positive T cell response after PVC was observed in all groups, regardless of CD4 (p=0.31). Conclusions. Waning of nAbs after PVC was more important in LCD4 group. BD managed to re-establish higher levels of nAbs against WD614G which were retained for 5 months. The level of T-cellular response was significantly higher in HCD4 and ICD4 compared to the LCD4 group although it remained above detectable levels over the entire study period regardless of CD4 count.
Keywords: HIV-1 infection; SARS-CoV-2 infection;
Keywords:
HIV-1 infection
; SARS-CoV-2 infection
; Neutralizing antibodies
; mRNA Vaccines
; T-cell immunity
; Immunity waning
1. Introduction
Although the availability of an effective antiretroviral therapy (ART), immunopathology in HIV-infected persons, characterized by an increased immune activation and phenotypic exhaustion, remains significantly high compared with HIV-uninfected subjects [1,2,3,4], raising concerns about the ability of vaccines to elicit a robust immune response against SARS-CoV-2 and its durability, necessary to confer protection from severe COVID-19.
Vaccine-induced immunity remains highly effective in preventing severe COVID-19 [5] and this is probably mediated by Spike-specific T cells, whose inductions have been shown to correlate with the vaccine efficacy [6] and are largely unaffected by viral mutations [7,8,9,10]. To date, much more importance is given to neutralization antibodies titers (nAbs), accepted by regulatory authorities as a correlate of protection and defined as the immune marker that can be used to reliably predict the level of efficacy of a vaccine in preventing a clinical outcome [11].
There are, however, few studies evaluating the durability of immunity following the vaccination against COVID-19 in PLWH [12,13,14], no studies reporting a comprehensive analysis to date, about the durability of neutralizing activity and T cell responses after a primary cycle and after a first booster dose. Particularly, studies on T cellular responses to these vaccines are sparse, likely due to technical difficulties, but given the possible T-cell dysfunction of HIV infection, it would be of utmost importance to assess the ability of COVID-19 vaccines to induce and maintain SARS-CoV-2–specific T-cells immunity, which have been shown to give protection against the severe forms of COVID-19 [15].
Similarly, to HIV-negative individuals [16,17], PLWH with high CD4 count show waning antibody immunity but persistent T-cell responses 6 months post-vaccination [18,19], pointing to a potential role of vaccine-elicited cellular immune memory in ensuring a long-term protection. Whether this is also true for PLWH with CD4 count <500 cells/m3 remains to be established.
Furthermore, according to non-linear dynamic models [20], humoral responses in the general population following COVID-19 vaccination decreased in all age groups after 6 months and it has been estimated a continuous waning in humoral responses primarily in the older population and individuals with a delayed administration of the second vaccine dose. Still in the general population, natural infection prior to completion of vaccination induced more stable anti SARS-CoV-2 IgG and neutralizing antibodies (nAbs) titres, and higher levels of IFN-γ release from activated T-cells so this is a confounding factor when examining the response to vaccine [20].
We assessed waning of nAbs and IFN-γ production in response to Spike stimulation, as a surrogate of a specific T-cell function, at four fixed time points after the primary vaccine cycle (PVC) and after the first booster dose (BD) in PLWH with different CD4 count at the time of their first vaccine dose.
2. Materials and Methods
Study design and population
The HIV-VAC study is an observational cohort study on the outcomes of COVID-19 mRNA vaccination in PLWH. Details of this study have been described elsewhere [21].In brief, demographic, epidemiologic, clinical and laboratory characteristics of PLWH undergoing vaccination were collected. For this analysis, which focused on the rate of waning after PVC and BD, we only considered response markers measured at the following four time points: 1- and 4-months post PVC (T1 and T2); 2 weeks and 5 months after the BD (T3 and T4).
The study was conducted according to the guidelines of the Declaration of Helsinki and wasapproved by the Scientific Committee of the Italian Drug Agency (AIFA) and by the Ethical Committee of the Lazzaro Spallanzani Institute, as National Review Board for COVID-19 pandemic in Italy (approval number 423/2021; amendment adopted with no.91/2022). In the present analysis, the study population consisted of PLWH who: i) completed the two-dose PVC with BNT162b2 or mRNA-1273 vaccines; ii) received the first booster dose (BD; third vaccine shot); iii) had repeated measurements of immune-response parameters available at T2 and at ≥2 of the four time points in study: 2 months post-PVC (T1), 4 months post-PVC (T2), 2 weeks (T3), and 5 months after the BD (third vaccine shot) (T4). Individuals with a natural SARS-CoV-2 infection diagnosis, defined by a RT-PCR positive on the nasopharyngeal swab, or positivity to anti-N and/or to anti-S/RBD antibodies at the time of the first dose of vaccine or to anti-N at any time point, were excluded from this analysis. Participants were stratified according to the CD4-T cell count registered at the end of their PVC into three groups as follows: 1) patients with CD4-T cell count <200/mm3 (Low CD4 count, LCD4); 2) patients with CD4-T cell count between 200 and 500 cell/mm3 (intermediate CD4 count, ICD4); 3) patients with CD4-T cell count >500/mm3 (high CD4 count, HCD4).
Laboratory procedures
Micro-neutralization assay (MNA) was performed as previously described, using SARS-CoV-2/Human/ITA/PAVIA10734/2020 and BA.1 (GISAID accession ID EPI_ISL_7716384) as challenging virus [22] Briefly, serum samples were heat-inactivated at 56°C for 30 minutes and titrated in duplicate in 7 two-fold serial dilutions (starting dilution 1:10). Equal volumes (50μl) of serum and medium containing 100 TCID50 SARS-CoV-2 were mixed and incubated at 37 °C for 30 min. Serum-Virus mixtures were then added to sub-confluent Vero E6 cell monolayers and incubated at 37°C and 5% CO2. After 48 hours, microplates were observed by light microscope for the presence of cytopathic effect (CPE). The highest serum dilution inhibiting 90% of CPE was defined as MNA90. To standardize inter-assay procedures, positive control samples showing high (1:160) and low (1:40) neutralizing activity were included in each assay session. Serum from the National Institute for Biological Standards and Control, UK (NIBSC) with known neutralization titer (Research reagent for anti-SARS-CoV-2 Ab NIBSC code 20/130) was used as reference in MNA. The cut-off of MNA90 > 1:10 is used to define the presence of neutralizing activity, samples resulted >=1:640 were arbitrarily considered =1:1280. In the analyses we define as sub-optimal a neutralizing activity of MNA90 < 1:40, as discussed in Matusali et al [23]. We studied IFN-γ production in response to Spike stimulation as a surrogate of specific T-cell function. Briefly, whole blood was stimulated in vitro at 37°C (5% CO2) with a pool of peptides covering the sequence of wild type SARS−CoV−2 spike protein (SARS−CoV−2 PepTivator® Prot_S1, Prot_S, and Prot_S+, Miltenyi Biotec, Germany). After 16-20 hours of incubation, plasma was harvested and stored at -80°C until use. IFN-γ levels were measured by an automatic ELISA (ELLA, protein simple), and the IFN-γ values obtained from the stimulated samples were subtracted from the unstimulated-control value. The Staphylococcal enterotoxin B (SEB) was used as positive control. The detection limit of these assays was 0.17 pg/ml for IFN-γ and the cut-off used in this analysis to define the T-specific cell response was 12 pg/ml, calculated as the mean 2DS of the response to spike peptides of unvaccinated uninfected healthy donors [24].For computational and statistical purposes, nAbs titres were expressed as the log2 of the reciprocal of serum dilution achieving MNA90, and IFN-γ as the log2 of measured pg/ml.
Statistical analyses
Characteristics of patients by CD4 count groups were described and reported as number of participants with relative frequencies for categorical factors and as median and interquartile range (IQR) for continuous variables. Repeated measurements of immune-response parameters were available at four fixed time points of the study (T1-T4). We set the threshold (expressed in log2) at 5.32 log2 (1:40) chosen for a good level of neutralization and to 3.58 log2 that for a detectable cellular mediated response (12 pg/mL) [23,24]. Box-plots were used to describe the distribution of the raw data at these time points. Kruskal-Wallis test was used to compare the ranking distributions by time and CD4 count groups. We then performed unadjusted and adjusted parametric mixed linear models with random intercept and slopes including the main effects (CD4 count group and time) as well as the interaction term. Multivariable models included the three main identified potential measured confounding factors: gender, age and CD4 count nadir. We fitted separate models for each of the parameters and estimated at each time point the mean levels and difference by CD4 count groups with the corresponding 95% CI. Unadjusted and adjusted estimates are reported both in Tables and Figures. We conducted 3 symmetric analyses, the first using as the outcome the absolute parameters values and a second analysis using the changes from T2 as the main response. This second analysis and the related statistical tests essentially compare the slopes over T1-T2, T3-T2 and T4-T2 by CD4 count group. Each of these contrasts has a specific meaning: T1-T2 tests the rate of waning over the 4 months post PVC; T3-T2 tests the boosting effect of the 3rd dose and finally T4-T2 tests the waning of the 3rd dose by 5 months from BD compared to what was achieved with PVC. Finally, because we were also interested in estimating and comparing the waning after the peak response achieved with the 3rd dose (T4-T3) by CD4 groups, we fitted a third model with outcome changes from T3 instead of T2.In all mixed linear model analyses specific contrasts (i.e. the mean nAbs difference by CD4 count groups at times T1-T4 ) were highlighted only when there was an overall type-3 significant p-value (<0.05) for the global test for interaction between CD4 count exposure group and time. All the above-mentioned analyses were performed by SAS version 9.4 (Carey North Caroline USA) Prism 6.0 (GraphPad, La Jolla, CA) and STATA 13.0 (College Station, TX) softwares.
3. Results
3.1. Study population
A total of 314 PLWH with Wuhan-D614 (WD614G) nAbs at time T2 were included in the analysis (LCD4=56; ICD4 =120; HCD4 =138); they were those who performed the PVC and, as per study protocol, returned to perform the first booster (third vaccine shot). All markers at all four time points (T1-T4) were not available for all 314 participants. For example, at T2, we were able to measure Omicron BA.1 nAbs and IFN-gamma in 103 and 299 participants, respectively. Supplementary Table 1 describes the number of markers used at each of the four time points overall and by CD4 count groups. Reasons for missing values at the other time points were due to participants own decision to not continue with the follow up or to technical reasons.The main characteristics at T2 of the 314 HIV-infected participants according to CD4 T cell count groups are reported in Table 1. Briefly, the median age was 56 years (IQR 50, 61), all participants were on ART, 95% had HIV-RNA <50 copies/mL with a median time since HIV diagnosis of 9 years (4-21) and of 5 years (4-8) since AIDS, if diagnosed, with a median number of comorbidities of 1 (1-2). The breakdown of participants according to type of vaccine used for PVC was as follows: 156 BNT162b2 (50%), 153 mRNA1273 (49%) and the remaining 1% adenoviral vector vaccines. For the 3rd dose the vaccine used was mRNA1273 for 66% of participants and BNT162b2 for 34%. Overall, the median time from the date of PVC completion to first response evaluation (T1) was 57 days (IQR: 51-58); there was evidence that this length of time was slightly longer in the CD4 count >200/mm3 groups (58 days, IQR:51-59) vs. the LCD4 group (51; IQR:51-53, Kruskal Wallis test p=0.005). The median distance between subsequent time-points were 119 days (108-130; T1-T2), 17 days (14-21; T2-T3) and 146 days (143-157; T3-T4). The three groups also significantly differed for CD4 count nadir (p<0.001) and time since HIV diagnosis (p=0.007). Proportion of PLWH with HIV-RNA≤ 50 copies/mL at T2 was 79% in LCD4, 98% in ICD4, and 99% in HCD4 (p<0.001). The distribution of response markers over T1-T4 are shown as median and IQR by means of the box-plots in Figure 1A, Figure 2 amd Figure 3B.
3.2. Neutralization activity
Concerning nAbs against WD614G, at all the time points there was a clear relationships to CD4 count with nAbs titres in HCD4 higher than those in ICD4 which, in turn, were higher than those seen for LCD4 (for example at T1: 6.32 log2 HCD4 vs. 5.32 ICD4 vs. 3.32 LCD4; Kruskal-Wallis p-value <0.0001, Figure 1A). Of note, over T1-T2, the nAbs levels in LCD4 remained below 5.32 log2, the chosen threshold for neutralization while for HCD4 this value was 6.32 log2 at T1 (Figure 1B). This was confirmed by estimates from the mixed linear model, after adjusting for age and CD4 count nadir, showing also that the BD was crucial for increasing the nAbs average levels and retaining them above suboptimal neutralization until T4 in all CD4 count groups (Figure 1A). From fitting this same multivariable mixed-linear regression model, we found evidence for a significant difference in nAbs trajectories over time by CD4 count groups (interaction p=0.04). When we investigated contrasts at specific time-points, using HCD4 as the comparator, LCD4 showed a significant lower mean nAbs WD614G at all time points: T1 [-2.6 (-3.3,-1.8); p<0.001], at T2 [-2.1 (-2.7,-1.5); p<0.001], at T3 [-1.4 (-2.1,-0.7); p<0.001] and at T4 [-1.2 (-2.0,-0.3); p=0.006, Table 2A]. From the analysis of the changes from T2 there was no evidence for a difference between groups in the changes of nAbs over T1-T2 (Table 2B). In contrast, the increase over T2-T3 was 0.9 log2 larger in HCD4 as compared to ICD4/LCD4 (p<0.002, Table 2B). Similarly, at T4 nAbs remained above the levels observed at T2 in all CD4 groups but the difference was 0.8 log2 larger for HCD4 vs LCD4/ICD4 (p<0.02, Table 2aB). Finally, nAbs appeared to decrease by 0.2 log2 faster in LCD4 vs. HCD4 over T3-T4 but the difference was not significant (p=0.68) (Table 2C). Concerning omicron BA.1 nAbs (Supplementary Figure 1A) response levels were undetectable (<3.32 log2) over T1-T2 in all CD4 count groups. The third dose again was pivotal for increasing these levels above suboptimal neutralization at T3 but waning over T3-T4 reset the levels to below 5.32 log2 at T4 in all groups (Supplementary Figure 1A). For this outcome, there was little evidence for a difference in trend by group over time (interaction p=0.13, Supplementary Table 2A, B).
3.3. IFN-γ
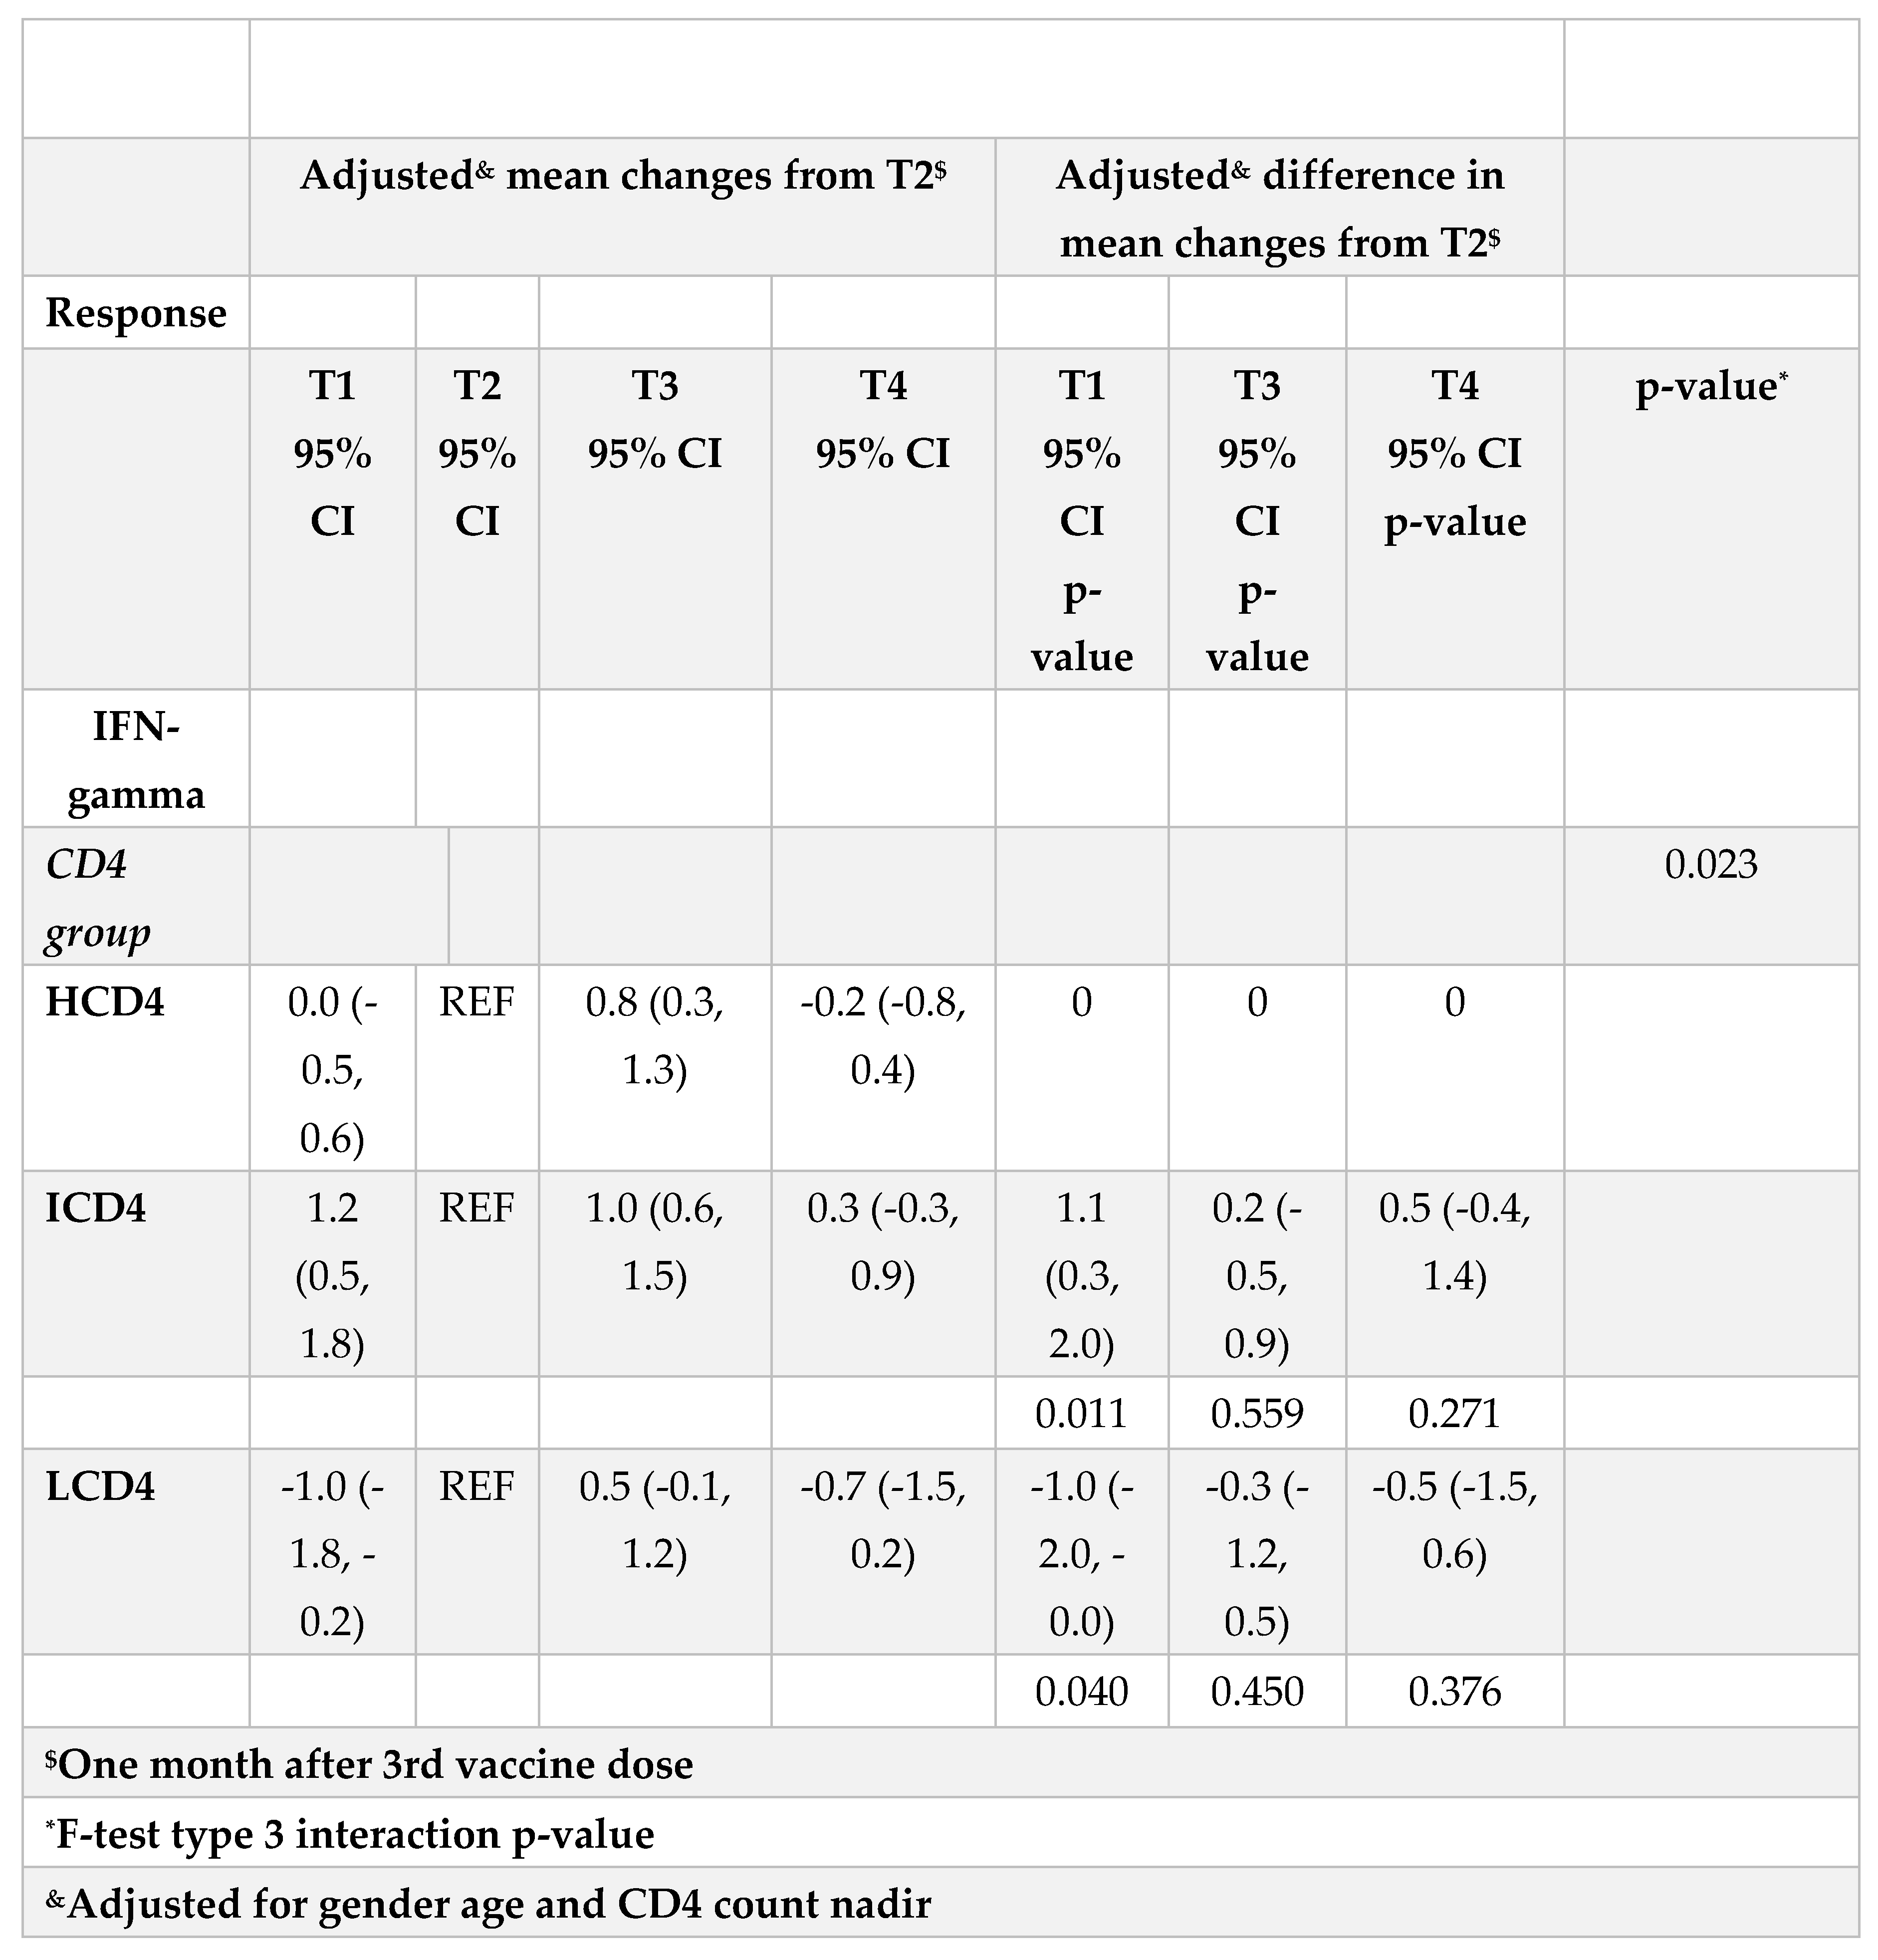
At all the time points identified, IFN-γ levels were above the threshold of 3.32 log2 (12 pg/ml) for the duration of the study and regardless of CD4 count groups (Figure 3A, B). Values of spike-specific T cell response in HCD4 and ICD4 were higher than those seen for LCD4 (for example at T1: 8.2 log2 HCD4 vs 7.7 ICD4 vs 5.2 LCD4; Figure 2, p=???), suggesting a stronger T cell function in HCD4. Of note, no evidence was observed from the mixed-linear model for a difference in time trajectories by CD4 count group (interaction p-vale=0.31, Table 3A, B).
4. Discussion
Our data show that PLWH with low CD4 count at end of PVC had always lower values of nAbs vs. ICD4 and HCD4 at all timepoints and that there was a CD4-response relationship with nAbs waning over time. The additional BD appeared pivotal for increasing the average of these levels for all CD4 count groups, also for the subvariant omicron BA.1.Advanced PLWH (low CD4+T cell counts, detectable viremia and/or previous AIDS) have weaker humoral responses to mRNA vaccines [21,25,26,27,28,29,30,31], suggesting that they might benefit from additional vaccine doses in order to increase plasma antibody concentrations and subsequently to achieve an optimal nAbs titer that could be effective against COVID-19. This seems particularly important if the vaccine used was not specific to elicit responses against new circulating VoCs as the waning rate is quicker. Indeed, it is well known that vaccine efficacy wanes over time and can be enhanced by a booster vaccine dose and that higher antibody titers are associated with higher estimates of efficacy although precise predictions are difficult to make [32]. Waning immunity, also after a booster dose, has been associated with increased vulnerability to SARS-CoV-2 infection/reinfection, particularly in case of immune-evasive VOCs [33,34,35]. Our results are consistent with other reports that showed a similar decay of humoral immune responses after 6 months in PLWH with high CD4 count and in healthy donors following SARS-CoV-2 vaccinations [18,19,36,37], but the peculiarity of this work is the inclusion of participants with CD4 count <500 cells/mm3. In addition, we also evaluated the levels of neutralizing antibodies over time and according to CD4 count at end of PVC, which is the marker currently accepted as a primary correlate of protection against COVID-19. Nonetheless, memory B- and T-cells—which modulate adaptive immune responses, serve as a tool of defense against disease severity and may exhibit greater durability [38] and this is why a lot of attention has been given to cell-mediated immune responses post-COVID-19 vaccination. Although T-cell responses was previously assessed in small cohorts, it is encouraging that persistent Spike-specific T-cells 6-months post-primary mRNA vaccination was found among older PLWH [36] and which retained activity against viral mutations [9]. In our study, IFN-γ production, as a surrogate of T specific cell immunity, remained stable, with no evidence for a significant difference in trajectories over time between groups, confirming the importance of PVC in the induction of a protective effect from severe COVID-19, regardless of current CD4 count, even though IFN-γ levels appear to be the effect of PVC on T-cell response appears to compensate the effects of the observed dramatic decline below the threshold of humoral responses by 4 months from the second dose, and it is consistent with data showing that vaccination protects against hospitalization even up to 6 months after the injection [16,39]. Thus, despite an increased risk of getting infected over that period, the risk of severe disease after acquiring SAR-CoV2 remains low. Our analysis has some limitations to be acknowledged. First, this is an observational setting and in the association analysis with CD4 count, unmeasured confounding bias cannot be ruled out. Second, the study period mainly covers alpha/delta circulating VoCs and only a restricted group of participants has been tested for BA.1 omicron sub-variant which was instead predominant at the time of follow up. Third, these estimates strictly depend on the chosen optimal neutralizing cut-off of <1:40 which might not be meaningful also for people infected with the latest Omicron sub-lineages. Lastly, comparisons of the measured levels of nAbs titers between studies are difficult because of the well-known variability in the assays used. Further although participants remain in active follow-up, we currently have no data to estimate a longer waning of immune response post BD. The strength of this work is certainly that it provides data on vaccine efficacy in PLWH with different stages of disease based on the correlate of protection currently considered most reliable, such as those based on neutralizing activity and vaccine efficacy. Another key finding was the fact that cellular T immunity appears to be robust and stable, regardless of CD4 count and time, suggesting full clinical protection against severe infections, hospitalizations, and deaths in subjects with immune dysfunction.
5. Conclusions
Waning of humoral response against WD614G was important both 4 months after PVC and 5 months after BD although remained above population average levels by the end of the study regardless of CD4 count. Importantly, humoral response against BA.1 fell on average below population average levels 5 months after BD regardless of CD4 count.The level of T-cellular response was significantly higher in HCD4 and ICD4 compared to the LCD4 group although it remained above detectable levels over the entire study period regardless of CD4 count. Further evaluations on the effectiveness and waning of new mRNA bivalent vaccines against the current circulating omicron sub-lineages are warranted in order to establish more suitable booster vaccination strategies in case of endemic evolution of SARS-CoV-2 with increased pathogenicity.
Supplementary Materials
The following supporting information can be downloaded at the website of this paper posted on Preprints.org: Table 1. Number of marker values used at each of the time points from the 314 participants; Figure 1A. Adjusted absolute mean Omicron BA.1 nAbs values over T1-T4 from fitting a mixed linear model (left panel) and boxplots (right panel) of the raw data by CD4 count groups; Table 2A. Adjusted absolute mean Omicron BA.1 nAbs values over T1-T4 from fitting a mixed linear model (left panel) and mean differences (right panel) by CD4 count groups; Table 2B. Adjusted mean changes from T2 in Omicron BA.1 nAbs values over T1-T4 from fitting a mixed linear model (left panel) and mean differences (right panel) by CD4 count groups.
Author Contributions
Conceptualization: AV, AA and ACL. Methodology, AV, GM, ACL, AA, FM; Investigation, AV, GM, SC, EC, FC, DL, DM; Data Curation, AV, GM, EC, MF, SC, GG; Writing-Original Draft, AV; Writing, Review & Editing, AV, GM, ACL, FM, EC, AA, VM, RG, SM, SN, SL; Supervision, EG, FV, FM, AA.
Funding
the study was supported by Ricerca Corrente Line 1 and 2 from Italian Ministry of Health and by SHARP JA Grant Number 848096
Institutional Review Board Statement
The study was conducted according to the guidelines of the Declaration of Helsinki and was approved by the Scientific Committee of the Italian Drug Agency (AIFA) and by the Ethical Committee of the Lazzaro Spallanzani Institute, as National Review Board for COVID-19 pandemic in Italy (approval number 423/2021; amendment adopted with no.91/2022)
Informed Consent Statement
Informed consent was obtained from all subjects involved in the study.
Data Availability Statement
Data used in this analysis is available upon reasonable request.
Acknowledgments
HIV-VAC Study Group: Alessandra Amendola, Francesco Baldini, Rita Bellagamba, Licia Bordi, Marta Camici, Rita Casetti, Sabrina Coen, Flavia Cristofanelli, Federico De Zottis, Massimo Francalancia, Marisa Fusto, Roberta Gagliardini, Paola Gallì, Giuseppina Giannico, Simona Gili, Germana Grassi, Elisabetta Grilli, Susanna Grisetti, Denise Iafrate, Daniele Lapa, Alessandra Marani, Erminia Masone, Stefano Marongiu, Silvia Meschi, Klizia Mizzoni, Annalisa Mondi, Sandrine Ottou, Carmela Pinnetti, Maria Maddalena Plazzi, Adriano Possi, Gianluca Prota, Marika Rubino, Eleonora Tartaglia
Conflicts of Interest
The authors declare no competing interests.
References
- Martin, G.E.; Sen, D.R.; Pace, M.; Robinson, N.; Meyerowitz, J.; Adland, E.; Thornhill, J.P.; Jones, M.; Ogbe, A.; Parolini, L.; et al. Epigenetic Features of HIV-Induced T-Cell Exhaustion Persist Despite Early Antiretroviral Therapy. Front. Immunol. 2021, 12. [Google Scholar] [CrossRef]
- Hileman CO, Funderburg NT. Inflammation, immune activation, and antiretroviral therapy in HIV. Curr HIV/AIDS Rep. 2017, 14, 93–100. [Google Scholar] [CrossRef]
- Nakanjako, D.; Ssewanyana, I.; Mayanja-Kizza, H.; Kiragga, A.; Colebunders, R.; Manabe, Y.C.; Nabatanzi, R.; Kamya, M.R.; Cao, H. High T-cell immune activation and immune exhaustion among individuals with suboptimal CD4 recovery after 4 years of antiretroviral therapy in an African cohort. BMC Infect. Dis. 2011, 11, 1–9. [Google Scholar] [CrossRef] [PubMed]
- Almeida, C.-A.M.; Price, P.; French, M.A.; Evans, C.; Humphrey, J.H.; Ntozini, R.; Prendergast, A.J.; Brunt, S.J.; Cysique, L.A.; Lee, S.; et al. Brief Communication: Immune Activation in Patients Infected with HIV Type 1 and Maintaining Suppression of Viral Replication by Highly Active Antiretroviral Therapy. AIDS Res. Hum. Retroviruses 2002, 18, 1351–1355. [Google Scholar] [CrossRef] [PubMed]
- Collie, S.; Champion, J.; Moultrie, H.; Bekker, L.-G.; Gray, G. Effectiveness of BNT162b2 Vaccine against Omicron Variant in South Africa. New Engl. J. Med. 2021, 386, 494–496. [Google Scholar] [CrossRef] [PubMed]
- Kalimuddin, S.; Tham, C.Y.L.; Qui, M.; de Alwis, R.; Sim, J.X.Y.; Lim, J.M.E.; Tan, H.-C.; Syenina, A.; Zhang, S.L.; Le Bert, N.; et al. Early T cell and binding antibody responses are associated with COVID-19 RNA vaccine efficacy onset. Med 2021, 2, 682–688. [Google Scholar] [CrossRef]
- Gao Y, Cai C, Grifoni A, et al. Ancestral SARS-CoV-2-specific T cells cross-recognize the Omicron variant. Nat Med. 2022, 28, 472–476. [Google Scholar] [CrossRef] [PubMed]
- Tarke A, Coelho CH, Zhang Z, et al. SARS-CoV-2 vaccination induces immunological T cell memory able to cross-recognize variants from Alpha to Omicron. Cell. 2022, 185, 847–859. [Google Scholar] [CrossRef]
- Keeton R, Tincho MB, Ngomti A, et al. T cell responses to SARS-CoV-2 spike cross-recognize Omicron. Nature. 2022, 603, 488–492. [Google Scholar] [CrossRef]
- Liu J, Chandrashekar A, Sellers D, et al. Vaccines elicit highly conserved cellular immunity to SARS-CoV-2 Omicron. Nature. 2022, 603, 493–496. [Google Scholar] [CrossRef]
- Gilbert, P.B.; Donis, R.O.; Koup, R.A.; Fong, Y.; Plotkin, S.A.; Follmann, D. A Covid-19 Milestone Attained — A Correlate of Protection for Vaccines. New Engl. J. Med. 2022, 387, 2203–2206. [Google Scholar] [CrossRef] [PubMed]
- Widge AT, et al. Durability of responses after SARS-CoV-2 mRNA-1273 vaccination. N Engl J Med. 2020, 384, 80–82. [Google Scholar]
- Mateus, J.; Dan, J.M.; Zhang, Z.; Moderbacher, C.R.; Lammers, M.; Goodwin, B.; Sette, A.; Crotty, S.; Weiskopf, D. Low-dose mRNA-1273 COVID-19 vaccine generates durable memory enhanced by cross-reactive T cells. Science 2021, 374, 420. [Google Scholar] [CrossRef] [PubMed]
- Pegu A, et al. Durability of mRNA-1273 vaccine-induced antibodies against SARS-CoV-2 variants. Science. 2021, 373, 1372–1377. [Google Scholar] [CrossRef] [PubMed]
- Sette A, Crotty S. Adaptive immunity to SARS-CoV-2 andCOVID-19. Cell. 2021, 184, 861–80. [Google Scholar] [CrossRef] [PubMed]
- Goel RR, Painter MM, Apostolidis SA, Mathew D, Meng W, Rosenfeld AM, et al. mRNA vaccines induce durable immune memory to SARS-CoV-2 and variants of concern. Science. 2021, 374, abm0829. [Google Scholar] [CrossRef]
- Agrati C, Castilletti C, Goletti D, Sacchi A, Bordoni V, Mariotti D, et al. Persistent spike-specific T cell immunity despite antibody reduction after 3 months from SARS-CoV-2 BNT162b2- mRNA vaccine. Sci Rep. 2022, 12, 6687. [Google Scholar] [CrossRef]
- Woldemeskel, B.A.; Karaba, A.H.; Garliss, C.C.; Beck, E.J.; Aytenfisu, T.Y.; Johnston, T.S.; Laeyendecker, O.; Cox, A.L.; Blankson, J.N. Decay of coronavirus disease 2019 mRNA vaccine-induced immunity in people with HIV. AIDS 2022, 36, 1315–1317. [Google Scholar] [CrossRef]
- Ogbe, A.; Pace, M.; Bittaye, M.; Tipoe, T.; Adele, S.; Alagaratnam, J.; Aley, P.K.; Ansari, M.A.; Bara, A.; Broadhead, S.; et al. Durability of ChAdOx1 nCoV-19 vaccination in people living with HIV. J. Clin. Investig. 2022, 7. [Google Scholar] [CrossRef]
- Pérez-Alós, L.; Armenteros, J.J.A.; Madsen, J.R.; Hansen, C.B.; Jarlhelt, I.; Hamm, S.R.; Heftdal, L.D.; Pries-Heje, M.M.; Møller, D.L.; Fogh, K.; et al. Modeling of waning immunity after SARS-CoV-2 vaccination and influencing factors. Nat. Commun. 2022, 13, 1–11. [Google Scholar] [CrossRef]
- Antinori, A.; Cicalini, S.; Meschi, S.; Bordoni, V.; Lorenzini, P.; Vergori, A.; Lanini, S.; De Pascale, L.; Matusali, G.; Mariotti, D.; et al. Humoral and Cellular Immune Response Elicited by mRNA Vaccination Against Severe Acute Respiratory Syndrome Coronavirus 2 (SARS-CoV-2) in People Living With Human Immunodeficiency Virus Receiving Antiretroviral Therapy Based on Current CD4 T-Lymphocyte Count. Clin. Infect. Dis. 2022, 75, e552–e563. [Google Scholar] [CrossRef] [PubMed]
- Vergori A, Cozzi-Lepri A, Matusali G, Colavita F, Cicalini S, Gallì P, Garbuglia AR, Fusto M, Puro V, Maggi F, Girardi E, Vaia F, Antinori A; HIV-VAC Study Group SARS-CoV-2 Omicron Variant Neutralization after Third Dose Vaccination in PLWH. Viruses 2022, 14, 1710.
- Matusali, G.; Sberna, G.; Meschi, S.; Gramigna, G.; Colavita, F.; Lapa, D.; Francalancia, M.; Bettini, A.; Capobianchi, M.R.; Puro, V.; Castilletti, C.; Vaia, F.; Bordi, L. Differential Dynamics of SARS-CoV-2 Binding and Functional Antibodies upon BNT162b2 Vaccine: A 6-Month Follow-Up. Viruses 2022, 14, 312. [Google Scholar] [CrossRef] [PubMed]
- Agrati, C.; Castilletti, C.; Goletti, D.; Sacchi, A.; Bordoni, V.; Mariotti, D.; Notari, S.; Matusali, G.; Meschi, S.; Petrone, L.; et al. Persistent Spike-specific T cell immunity despite antibody reduction after 3 months from SARS-CoV-2 BNT162b2-mRNA vaccine. Sci. Rep. 2022, 12, 1–5. [Google Scholar] [CrossRef] [PubMed]
- Nault, L.; Marchitto, L.; Goyette, G.; Tremblay-Sher, D.; Fortin, C.; Martel-Laferrière, V.; Trottier, B.; Richard, J.; Durand, M.; Kaufmann, D.; et al. Covid-19 vaccine immunogenicity in people living with HIV-1. Vaccine 2022, 40, 3633–3637. [Google Scholar] [CrossRef]
- Sisteré-Oró, M.; Andrade, N.; Wortmann, D.D.; Du, J.; Garcia-Giralt, N.; González-Cao, M.; Güerri-Fernández, R.; Meyerhans, A. Anti-SARS-COV-2 specific immunity in HIV immunological non-responders after mRNA-based COVID-19 vaccination. Front. Immunol. 2022, 13, 994173. [Google Scholar] [CrossRef]
- Tau L, Turner D, Adler A, Marom R, Ahsanov S, Matus N, et al. SARS-CoV-2 humoral and cellular immune responses of patients with HIV after vaccination with BNT162b2 mRNA COVID-19 vaccine in the Tel-Aviv Medical Center. Open Forum Infect Dis. 2022, 9, ofac089. [Google Scholar] [CrossRef]
- Spinelli, M.A.; Peluso, M.J.; Lynch, K.L.; Yun, C.; Glidden, D.V.; Henrich, T.J.; et al. Differences in post-mRNA vaccination severeacute respiratory syndrome coronavirus 2 (SARS-CoV-2) immunoglobulin G (IgG) concentrations and surrogate virus neutralization test response by human immunodefciency virus (HIV) status and type of vaccine: a matched case-control observational study. Clin Infect Dis. 2022, 75, e916–9 https://doi org/101093/cid/ciab1009. [Google Scholar]
- Benet, S.; Blanch-Lombarte, O.; Ainsua-Enrich, E.; Pedreño-Lopez, N.; Muñoz-Basagoiti, J.; Raïch-Regué, D.; Perez-Zsolt, D.; Peña, R.; Jiménez, E.; de la Concepción, M.L.R.; et al. Limited Humoral and Specific T-Cell Responses After SARS-CoV-2 Vaccination in PWH With Poor Immune Reconstitution. J. Infect. Dis. 2022, 226, 1913–1923. [Google Scholar] [CrossRef]
- Hensley, K.S.; Jongkees, M.J.; Geers, D.; GeurtsvanKessel, C.H.; Mueller, Y.M.; Dalm, V.A.S.H.; Papageorgiou, G.; Steggink, H.; Gorska, A.; Bogers, S.; den Hollander, J.G.; Bierman, W.F.W.; Gelinck, L.B.S.; Schippers, E.F.; Ammerlaan, H.S.M.; van der Valk, M.; van Vonderen, M.G.A.; Delsing, C.E.; Gisolf, E.H.; Bruns, A.H.W.; Lauw, F.N.; Berrevoets, M.A.H.; Sigaloff, K.C.E.; Soetekouw, R.; Branger, J.; de Mast, Q.; Lammers, A.J.J.; Lowe, S.H.; de Vries, R.D.; Katsikis, P.D.; Rijnders, B.J.A.; Brinkman, K.; Roukens, A.H.E.; Rokx, C. Immunogenicity and reactogenicity of SARS-CoV-2 vaccines in people living with HIV in the Netherlands: A nationwide prospective cohort study. PLoS Med. 2023, 19, e1003979. [Google Scholar] [CrossRef]
- Corma-Gómez, A.; Fernández-Fuertes, M.; García, E.; Fuentes-López, A.; Gómez-Ayerbe, C.; Rivero-Juárez, A.; Domínguez, C.; Santos, M.; Viñuela, L.; Palacios, R.; et al. Severe immunosuppression is related to poorer immunogenicity to SARS-CoV-2 vaccines among people living with HIV. Clin. Microbiol. Infect. 2022, 28, 1492–1498. [Google Scholar] [CrossRef] [PubMed]
- Yang, Z.-R.; Jiang, Y.-W.; Li, F.-X.; Liu, D.; Lin, T.-F.; Zhao, Z.-Y.; Wei, C.; Jin, Q.-Y.; Li, X.-M.; Jia, Y.-X.; et al. Efficacy of SARS-CoV-2 vaccines and the dose–response relationship with three major antibodies: a systematic review and meta-analysis of randomised controlled trials. Lancet Microbe 2023, 4, e236–e246. [Google Scholar] [CrossRef]
- Chemaitelly H, Ayoub HH, AlMukdad S, et al. Duration of mRNA vaccine protection against SARS-CoV-2 omicron BA.1 and BA.2 subvariants in Qatar. Nat Commun 2022, 13, 3082. [Google Scholar] [CrossRef] [PubMed]
- Abu-Raddad LJ, Chemaitelly H, Ayoub HH, et al. Association of prior SARS-CoV-2 infection with risk of breakthrough infection following mRNA vaccination in Qatar. JAMA 2021, 326, 1930–9. [Google Scholar] [CrossRef] [PubMed]
- Qu, P.; Faraone, J.N.; Evans, J.P.; Zheng, Y.-M.; Yu, L.; Ma, Q.; Carlin, C.; Lozanski, G.; Saif, L.J.; Oltz, E.M.; et al. Durability of Booster mRNA Vaccine against SARS-CoV-2 BA.2.12.1, BA.4, and BA.5 Subvariants. New Engl. J. Med. 2022, 387, 1329–1331. [Google Scholar] [CrossRef] [PubMed]
- Tuan, J.J.; Zapata, H.; Barakat, L.; Andrews, L.; Behnegar, A.; Kim, Y.W.; Kayani, J.; Mutic, S.; Ryall, L.; Turcotte, B.; et al. Long-term quantitative assessment of anti-SARS-CoV-2 spike protein immunogenicity (QUASI) after COVID-19 vaccination in older people living with HIV (PWH). BMC Infect. Dis. 2022, 22, 1–8. [Google Scholar] [CrossRef]
- Tau, L.; Turner, D.; Adler, A.; Marom, R.; Ahsanov, S.; Matus, N.; Levi, I.; Gerber, G.; Lev, S.; Ziv-Baran, T.; et al. SARS-CoV-2 Humoral and Cellular Immune Responses of Patients With HIV After Vaccination With BNT162b2 mRNA COVID-19 Vaccine in the Tel-Aviv Medical Center. Open Forum Infect. Dis. 2022, 9, ofac089. [Google Scholar] [CrossRef]
- Liu Y, Zeng Q, Deng C, et al. Robust induction of B cell and T cell responses by a third dose of inactivated SARS-CoV-2 vaccine. Cell Discov. 2022, 8, 10. [Google Scholar] [CrossRef]
- Tartof, S.Y.; Slezak, J.M.; Fischer, H.; Hong, V.; Ackerson, B.K.; Ranasinghe, O.N.; Frankland, T.B.; Ogun, O.A.; Zamparo, J.M.; Gray, S.; et al. Effectiveness of mRNA BNT162b2 COVID-19 vaccine up to 6 months in a large integrated health system in the USA: a retrospective cohort study. Lancet 2021, 398, 1407–1416. [Google Scholar] [CrossRef]
Figure 1.
Adjusted absolute mean WD614G nAbs values over T1-T4 from fitting a mixed Linear Model (left panel) and Box-plots (right panel) of the raw data by CD4 count groups. . Y-axis reports nAbs values expressed in Log2 (cut off 5.32 log2);X-axis T1-T4 timepoints. The timepoints are: T1: 2 months after PVC , T2: 4 months after PVC , T3: 2 weeks after 3rd dose , T4: 5 months after 3rd dose.
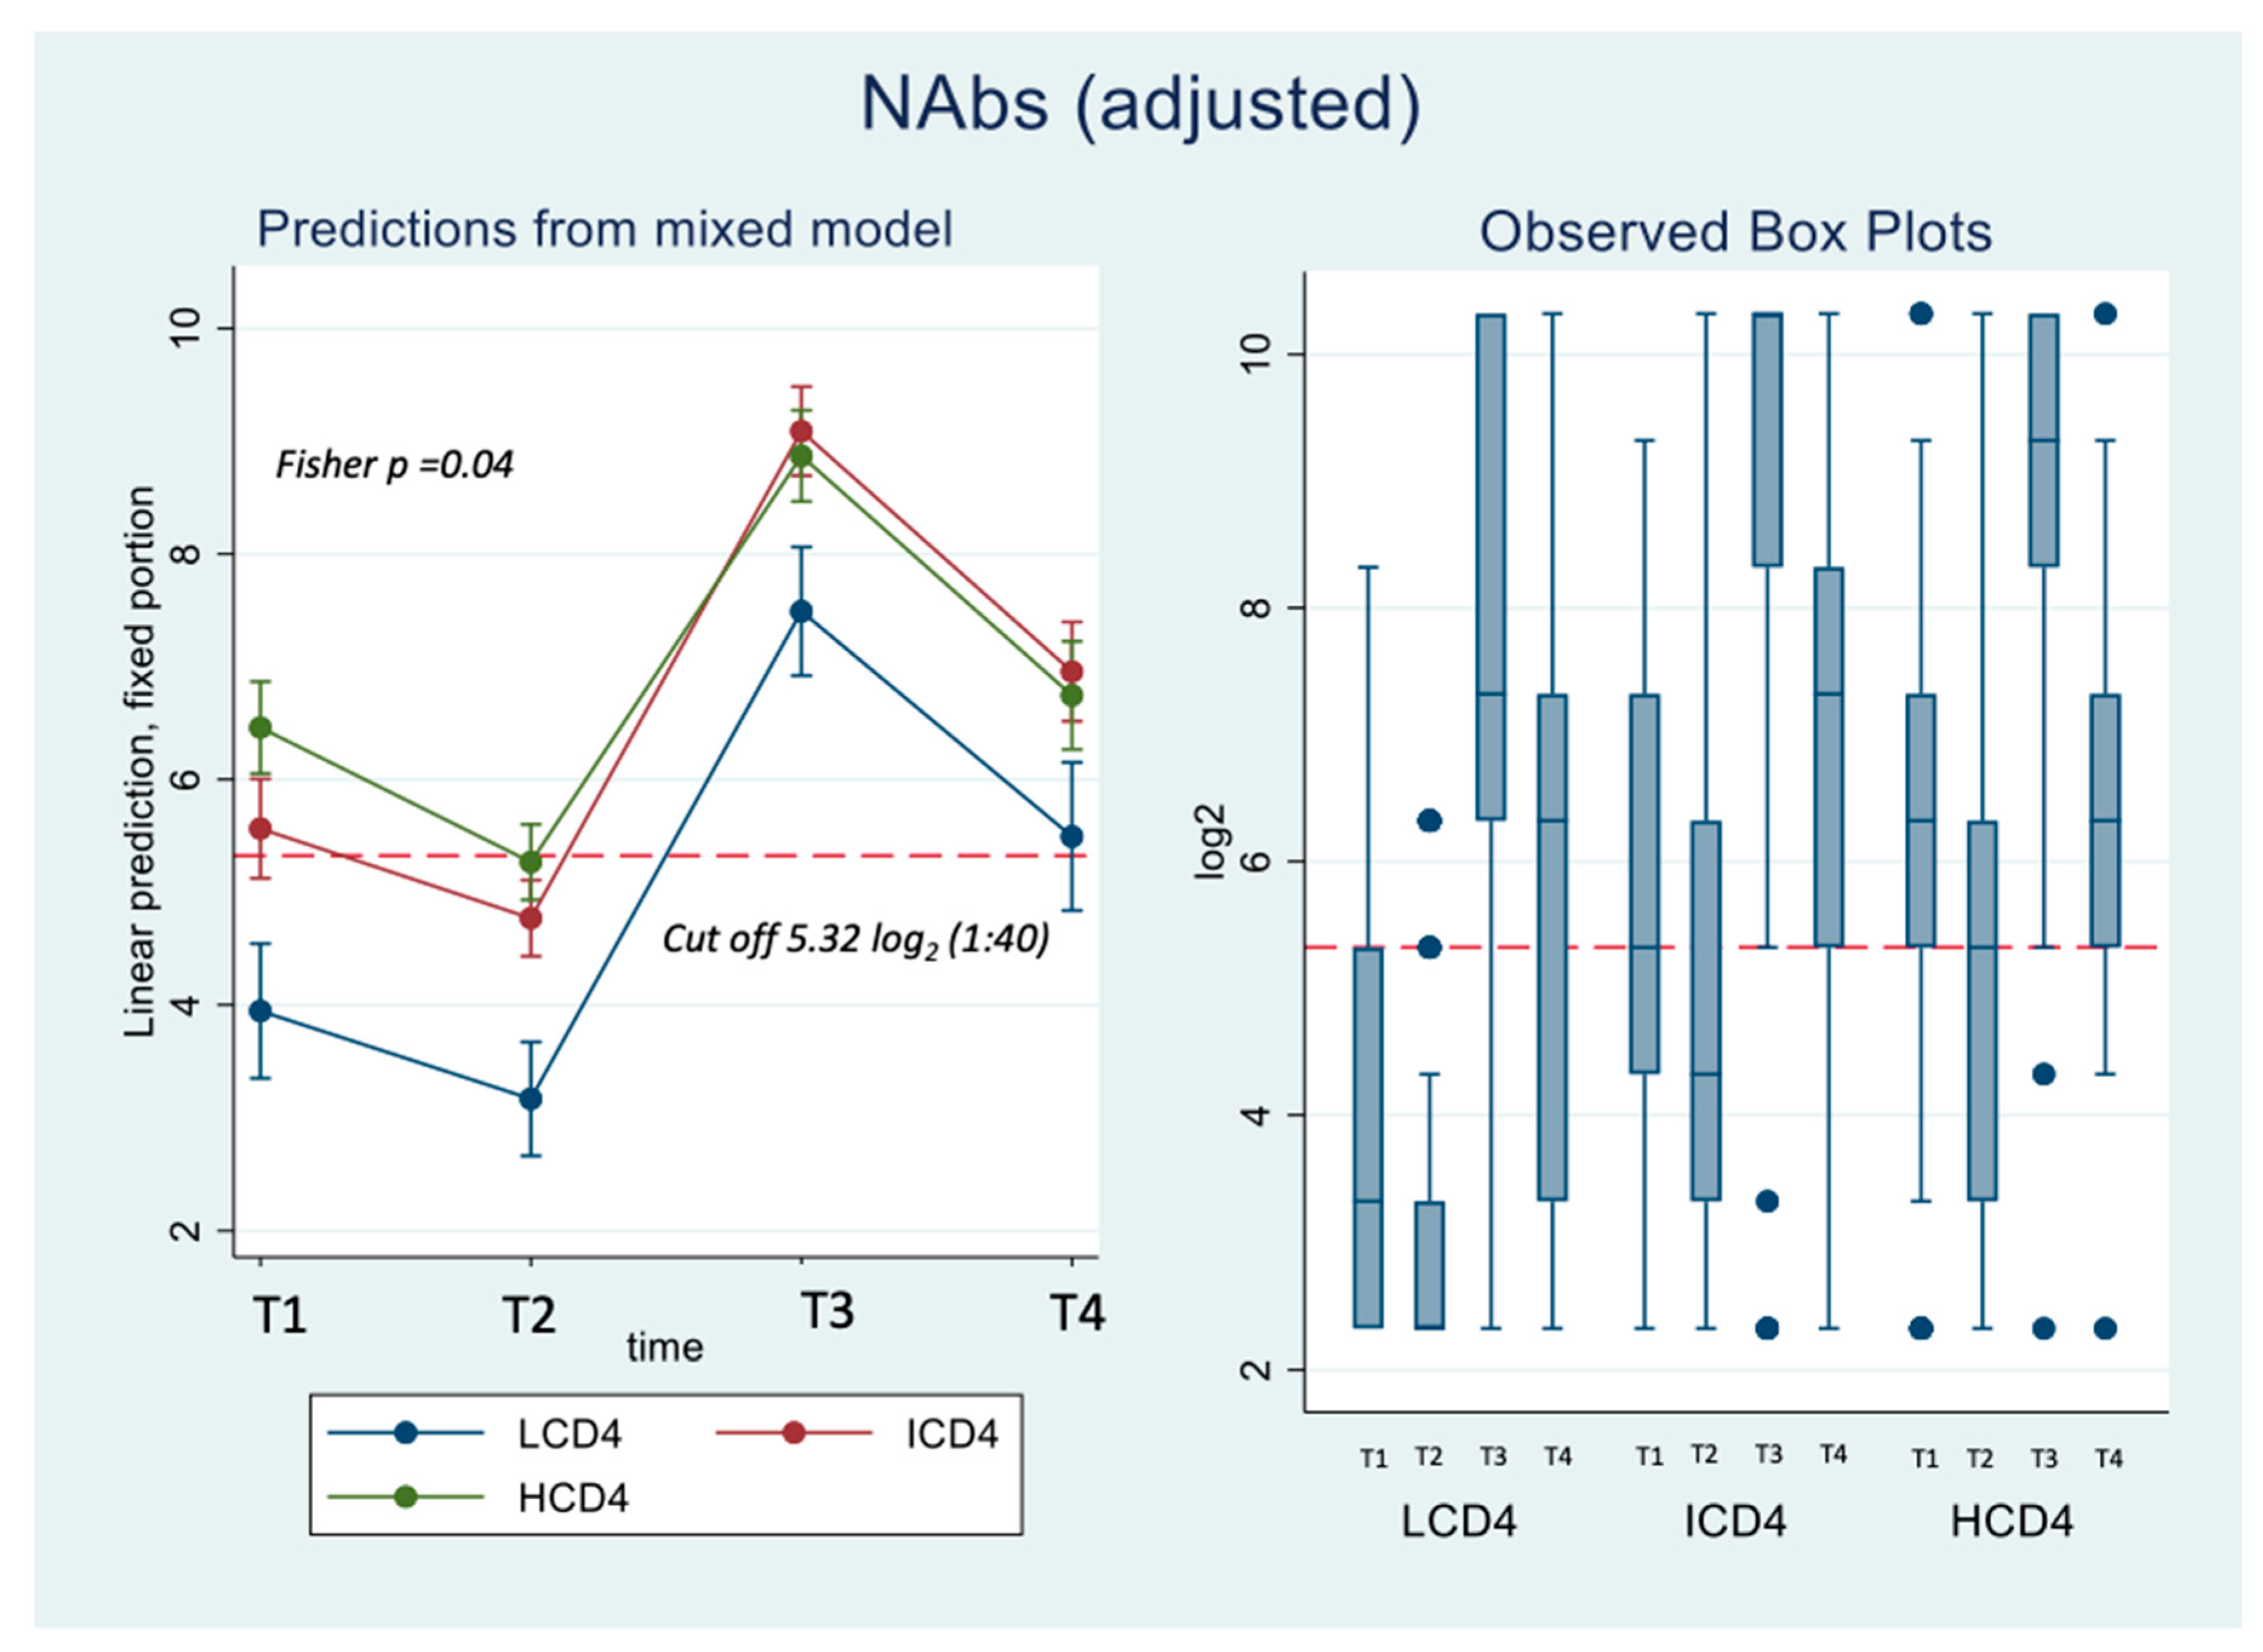
Figure 2.
Adjusted absolute mean IFN-γ values over T1-T4 from fitting a mixed linear model (left panel) and boxplots (right panel) of the raw data by CD4 count groups. Y-axis reports IFN-γ values expressed in Log2 (cut off 3.58 log2); X-axis T1-T4 timepoints. The timepoints are: T1: 2 months after PVC, T2: 4 months after PVC, T3: 2 weeks after 3rd dose, T4: 5 months after 3rd dose.
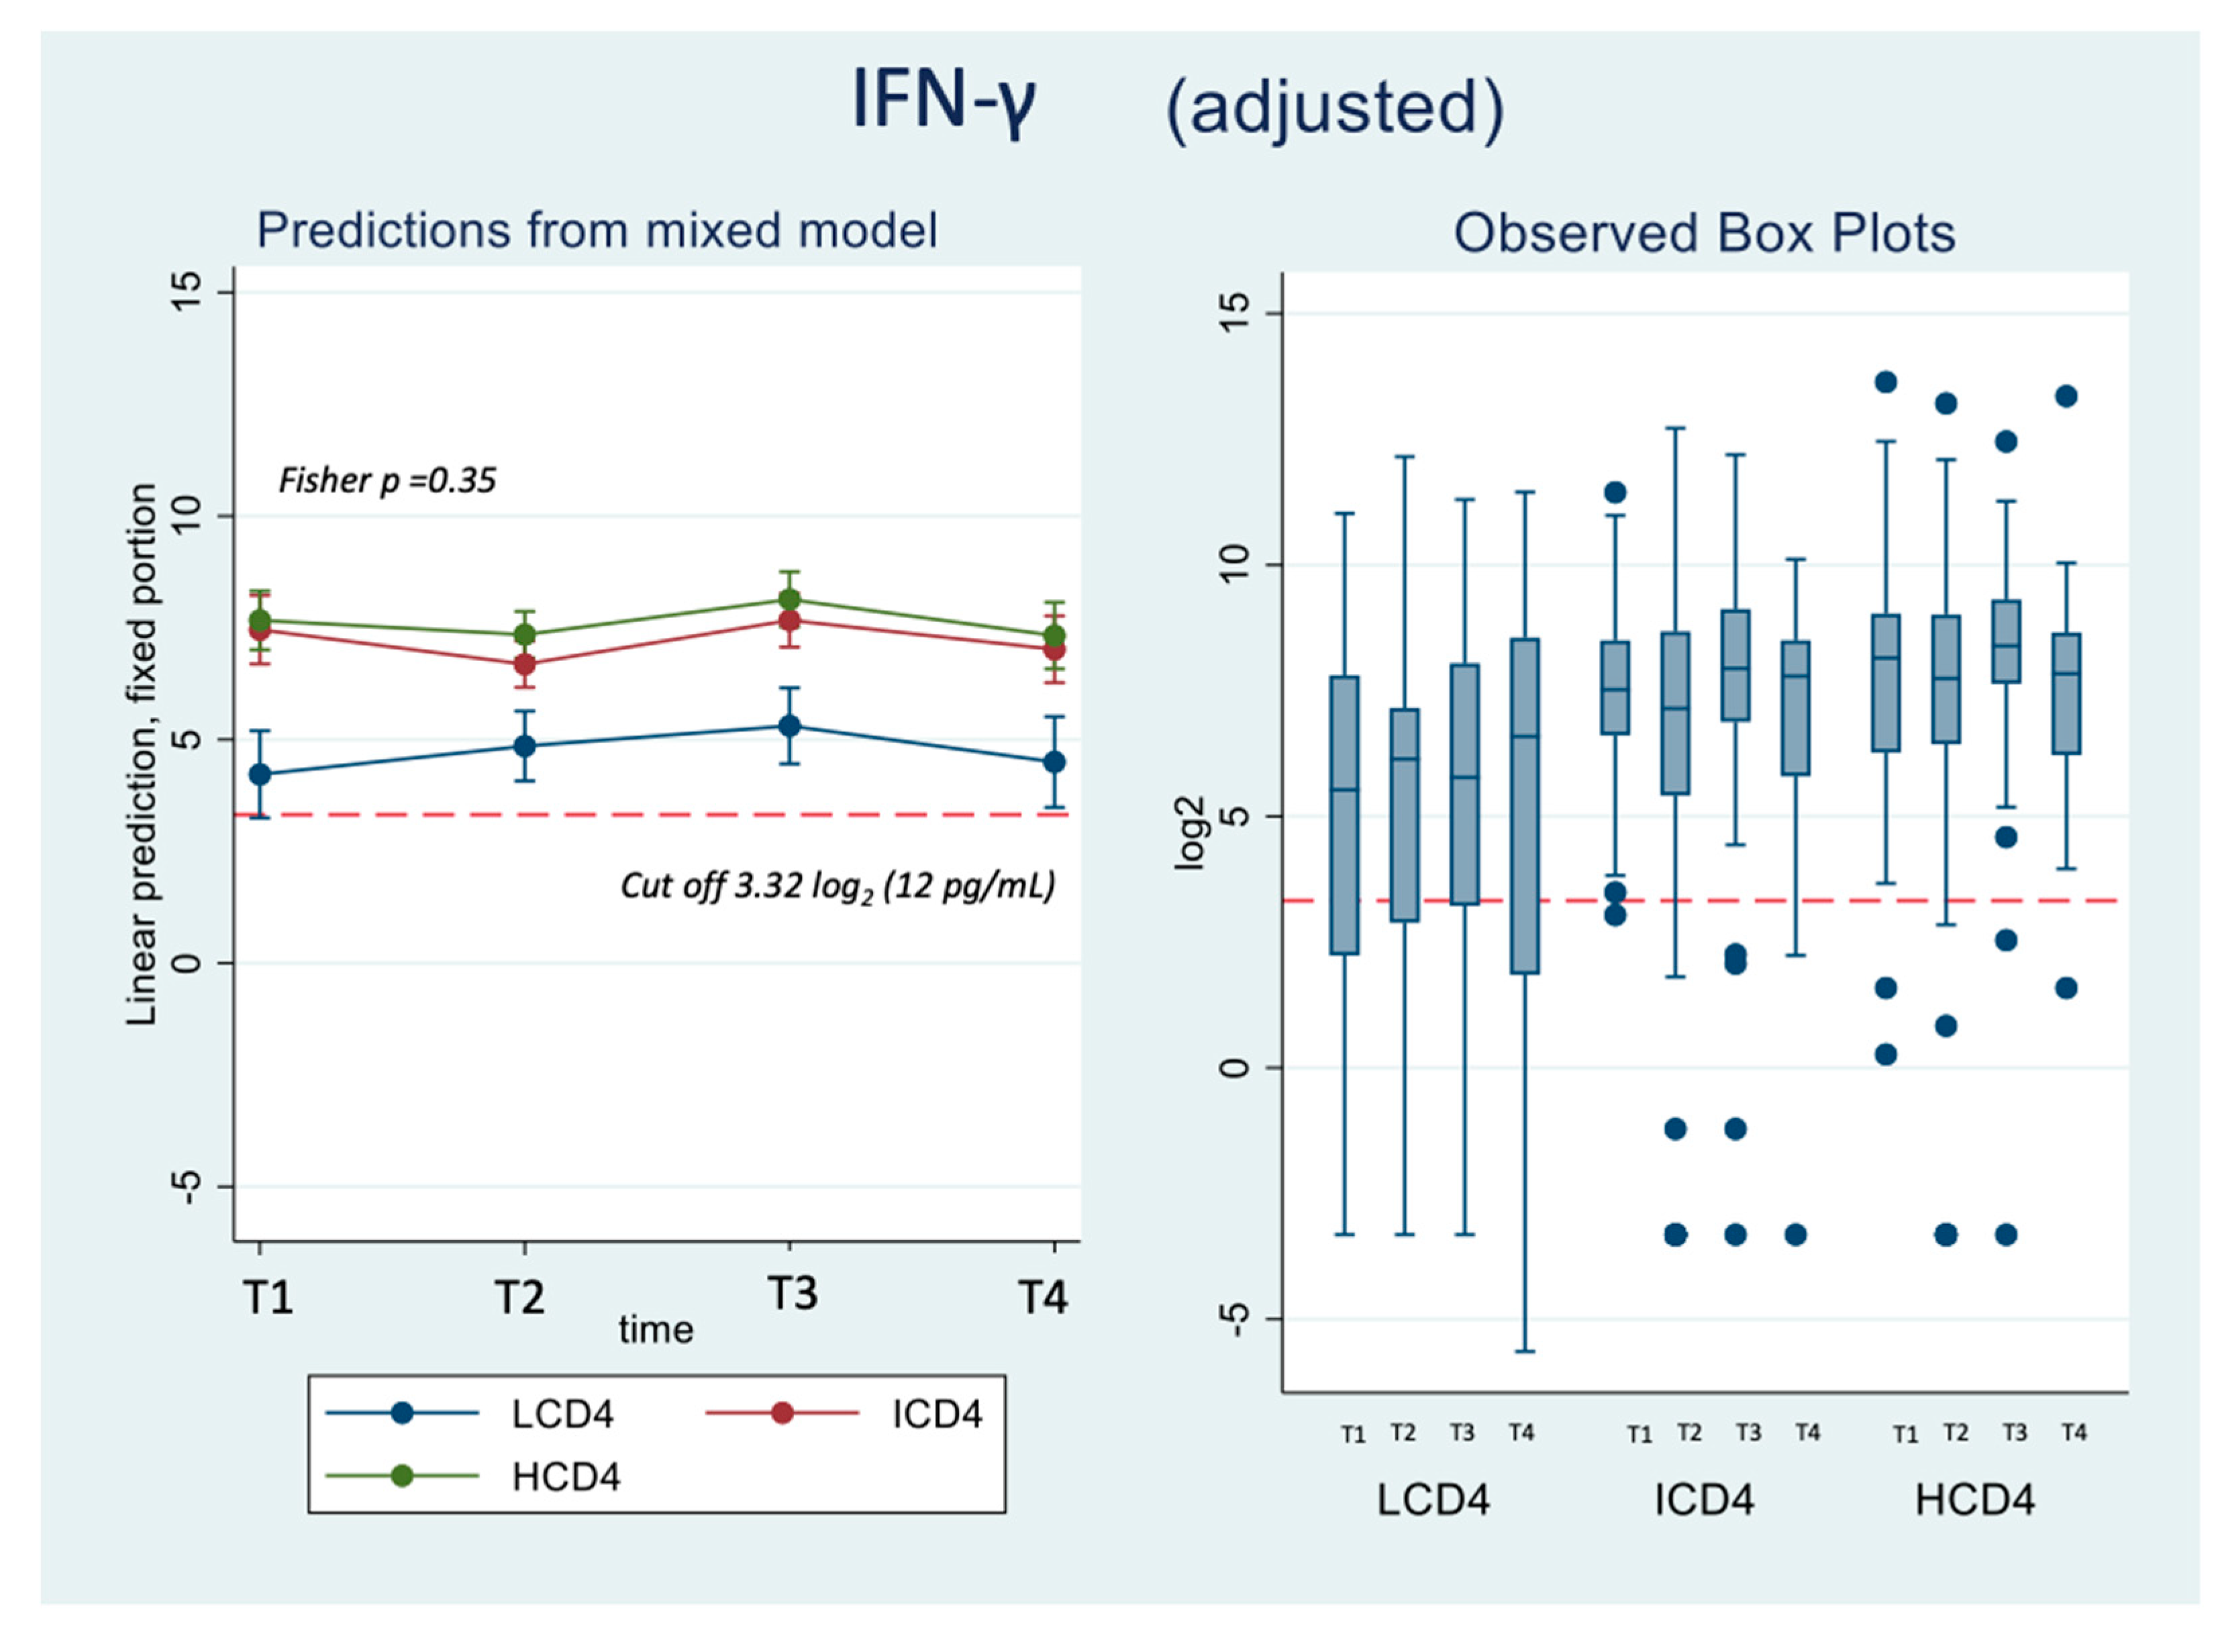

Table 1.
Descriptive characteristics of the study population.
| CD4 count at T1$ (cells/mm3) | ||||||
|---|---|---|---|---|---|---|
| Characteristics | LCD4 0-200/mm3 |
ICD4 201-500/mm3 |
HCD4 >500/mm3 |
p-value* | Total | |
| N= 56 | N= 120 | N= 138 | N= 314 | |||
| Age, years | 0.208 | |||||
| Median (IQR) | 58 (53, 63) | 56 (50, 62) | 56 (48, 60) | 56 (50, 61) | ||
| Female, n(%) | 17 (30.4) | 16 (13.3) | 22 (15.9) | 0.018 | 55 (17.5) | |
| Caucasian, n(%) | 37 (66.1) | 77 (64.2) | 115 (83.3) | 0.001 | 229 (72.9) | |
| Nadir CD4 count, cells/mm3 | <.001 | |||||
| Median (IQR) | 32 (7, 70) | 48 (23, 129) | 166 (52, 298) | 74 (26, 180) | ||
| Time from HIV diagnosis, years | 0.007 | |||||
| Median (IQR) | 17 (2, 24) | 6 (2, 13) | 10 (5, 15) | 9 (4, 21) | ||
| Time from AIDS diagnosis, years | 0.069 | |||||
| Median (IQR) | 2 (1, 2) | 6 (3, 7) | 5 (5, 10) | 5 (4, 8) | ||
| AIDS, n(%) | 14 (25.9) | 32 (30.2) | 27 (21.3) | 0.297 | 73 (25.4) | |
| Year of starting ART | 0.029 | |||||
| Median (IQR) | 2009 (2000, 2020) | 2016 (2010, 2019) | 2013 (2010, 2016) | 2014 (2009, 2018) | ||
| VL<=50 at T1, n(%) | 44 (78.6) | 116 (97.5) | 137 (99.3) | <.001 | 297 (94.9) | |
| Cancer, n(%) | 2 (3.6) | 6 (5.0) | 12 (8.7) | 0.308 | 20 (6.4) | |
| BMI, median (IQR) | 22 (21, 24) | 24 (21, 26) | 23 (22, 26) | 0.109 23 (21, 26) | ||
| Autoimmune disease, n(%) | 0 (0.0) | 1 (0.9) | 0 (0.0) | 0.426 | 1 (0.3) | |
| Cardiopathy, n(%) | 0 (0.0) | 0 (0.0) | 1 (0.8) | 0.533 | 1 (0.3) | |
| CKD, n(%) | 8 (14.8) | 9 (8.5) | 9 (7.1) | 0.246 | 26 (9.1) | |
| COPD, n(%) | 3 (5.6) | 6 (5.7) | 4 (3.1) | 0.606 | 13 (4.5) | |
| MI, n(%) | 1 (1.9%) | 1 (0.9%) | 1 (0.8%) | 0.806 | 3 (1.0) | |
| Hypertension, n(%) | 8 (14.8) | 17 (16.0) | 11 (8.7) | 0.205 | 36 (12.5) | |
| Mild liver disease, n(%) | 12 (22.2) | 23 (21.7) | 29 (22.8) | 0.979 | 64 (22.3) | |
| Severe liver disease, n(%) | 4 (7.4) | 3 (2.8) | 1 (0.8) | 0.047 | 8 (2.8) | |
| No. of comorbidities& | 0.189 | |||||
| Median (IQR) | 1 (1, 2) | 1 (1, 2) | 1 (1, 1) | 1 (1, 2) | ||
| Time from T1 to T3, days | 0.472 | |||||
| Median (IQR) | 178 (175, 183) | 174 (162, 187) | 175 (167, 199) | 175 (166, 186) | ||
| Time from T3 to T4, days | 0.110 | |||||
| Median (IQR) | 126 (122, 130) | 119 (103, 133) | 119 (109, 130) | 120 (108, 130) | ||
| $When CD4 at T1 was missing we used a last observation carried forward approach by imputing the most recent value prior to T1; T1= time of first vaccination | ||||||
| &In those with >=1 comorbidities | ||||||
|
*Chi-square or Kruskal-Wallis test as appropriate Abbreviations: LCD4, low CD4 count; ICD4, intermediate CD4 count, HCD4, high CD4 count; AIDS, Acquired Immunodeficiency syndrome; ART, antiretroviral therapy; BMI, Body Mass Index; CKD, Chronic Kidney Disease; COPD, Chronic Obstructive Pulmonary Disease; MI, Miocardial Infarction | ||||||
Table 2A.
Adjusted absolute mean WD614G nAbs values over T1-T4 from fitting a mixed linear model (left panel) and mean differences (right panel) by CD4 count groups.
Table 2A.
Adjusted absolute mean WD614G nAbs values over T1-T4 from fitting a mixed linear model (left panel) and mean differences (right panel) by CD4 count groups.
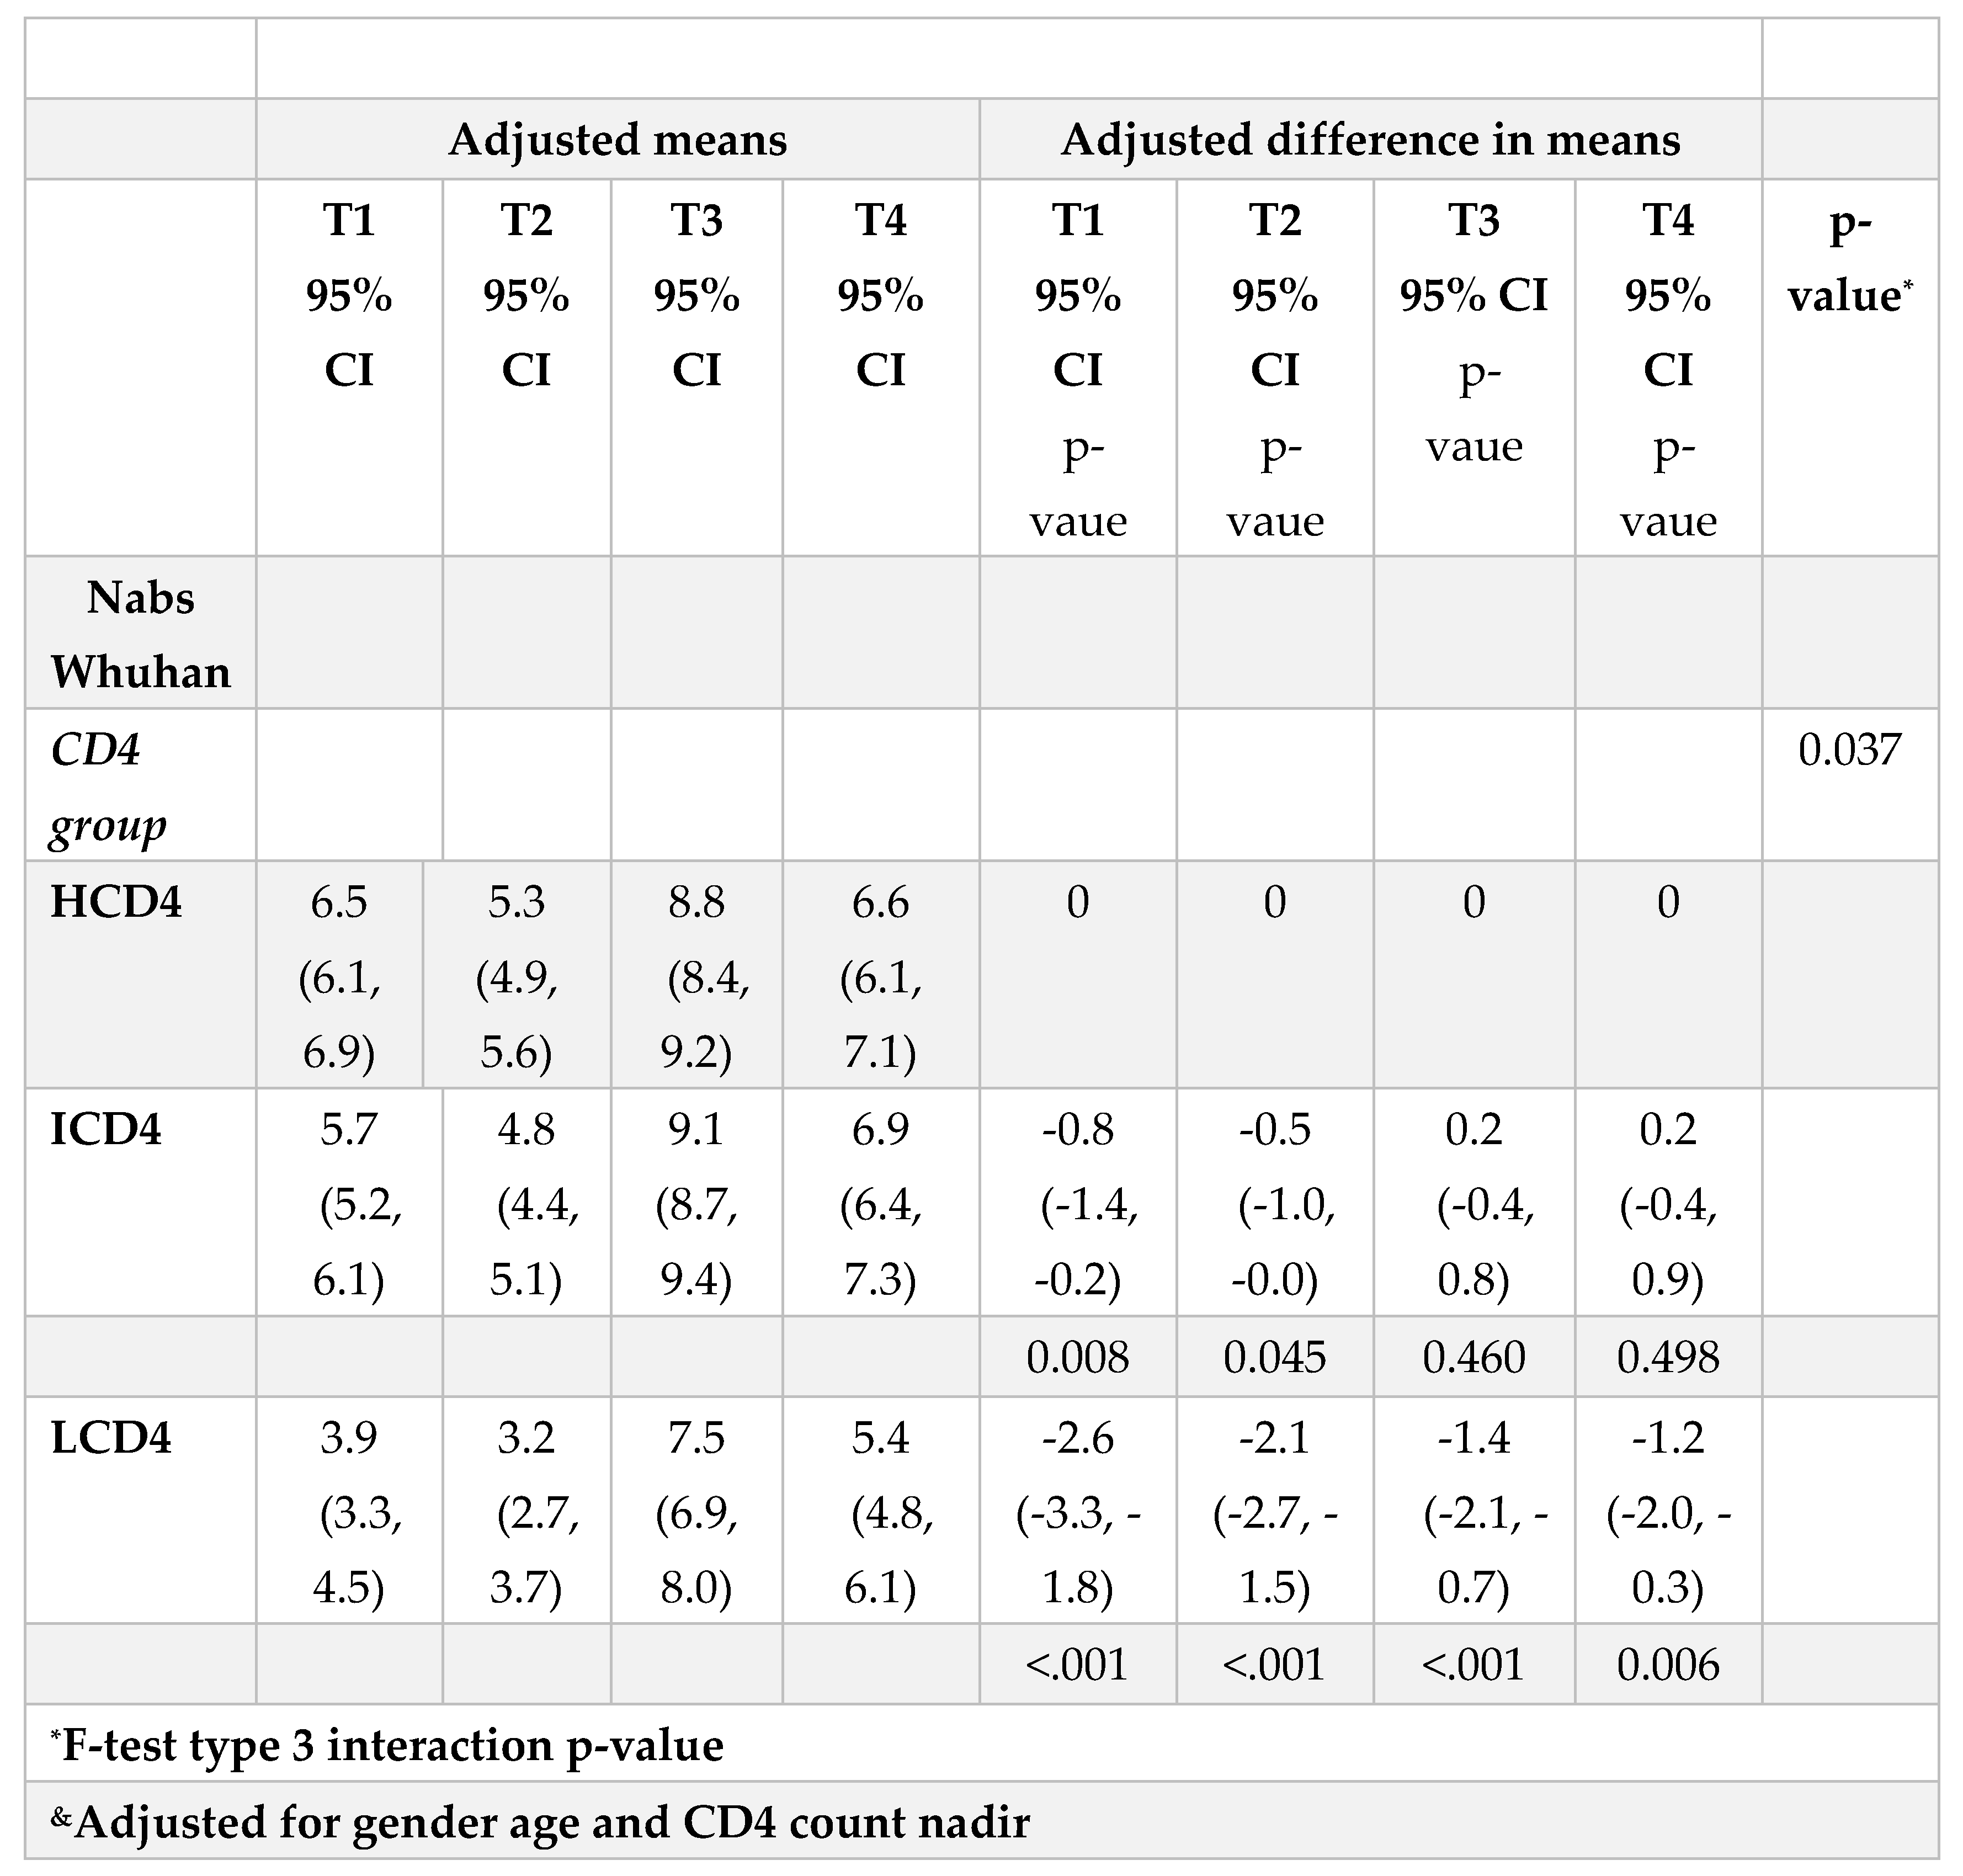 |
Table 2B.
Adjusted mean changes from T2 in WD614G nAbs values over T1-T4 from fitting a mixed linear model (left panel) and mean differences (right panel) by CD4 count groups.
Table 2B.
Adjusted mean changes from T2 in WD614G nAbs values over T1-T4 from fitting a mixed linear model (left panel) and mean differences (right panel) by CD4 count groups.
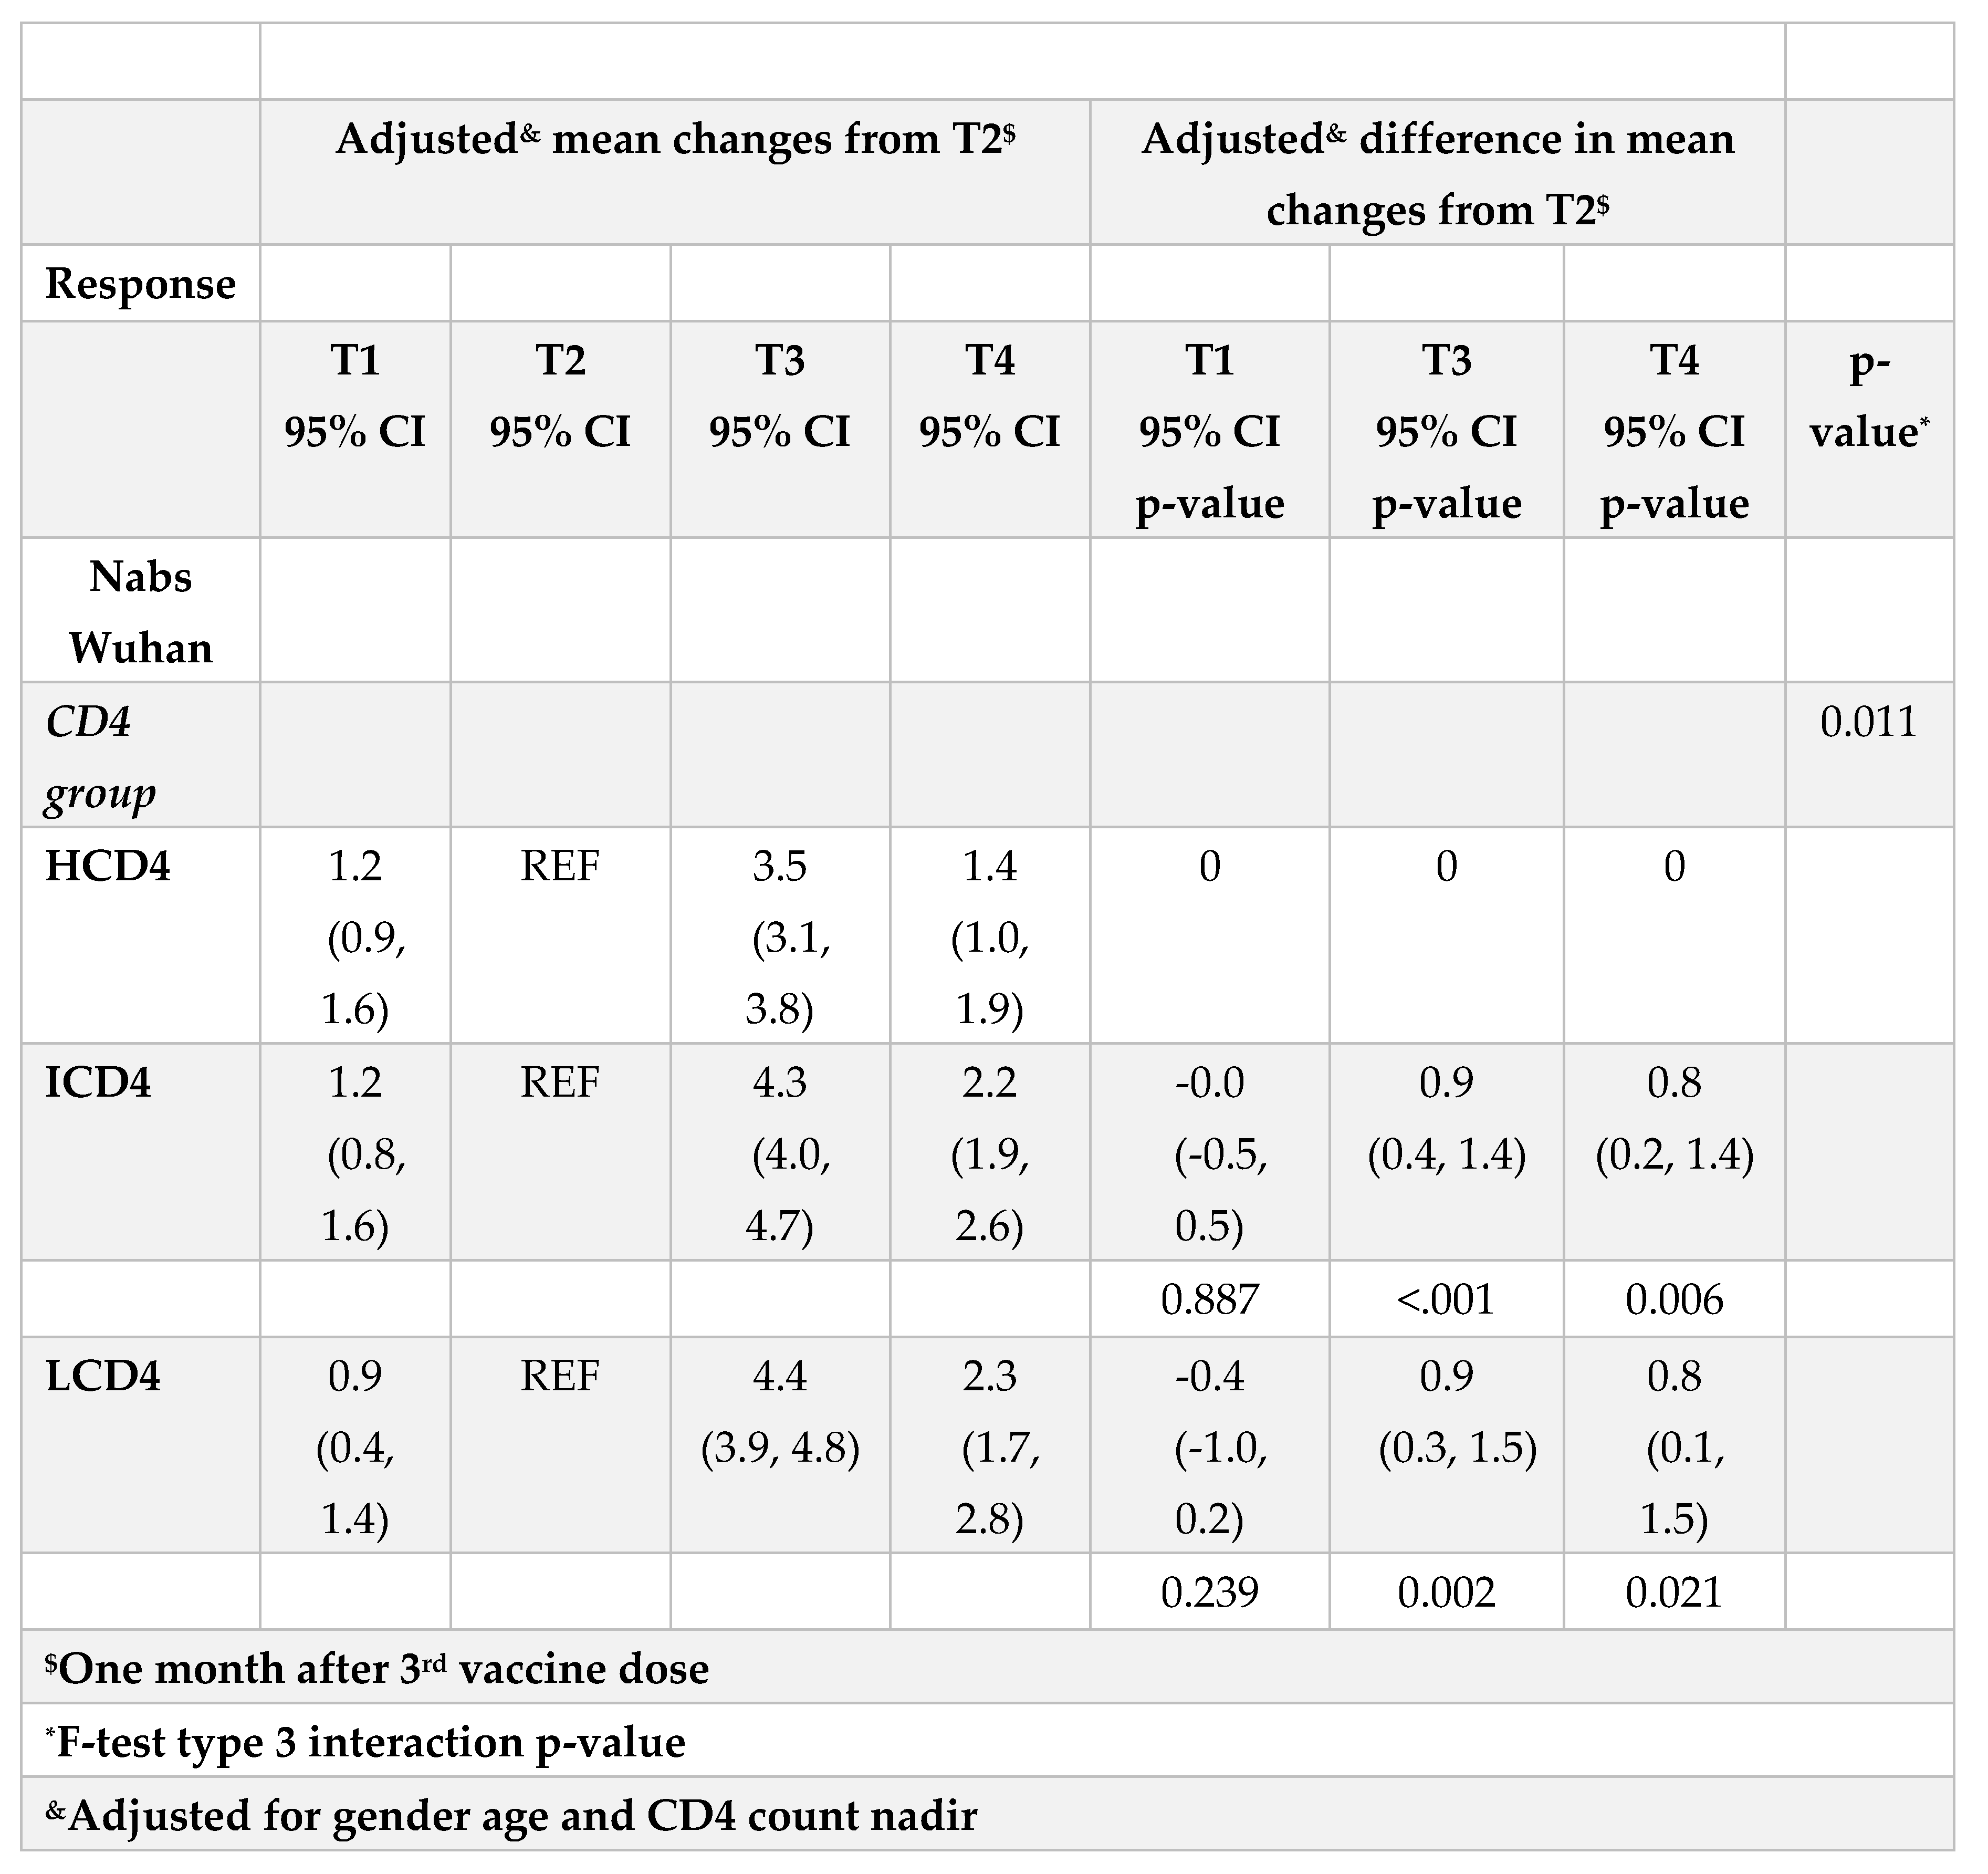 |
Table 2C.
Adjusted mean changes from T3 in WD614G nAbs values over T1-T4 from fitting a mixed linear model (left panel) and mean differences (right panel) by CD4 count groups.
Table 2C.
Adjusted mean changes from T3 in WD614G nAbs values over T1-T4 from fitting a mixed linear model (left panel) and mean differences (right panel) by CD4 count groups.
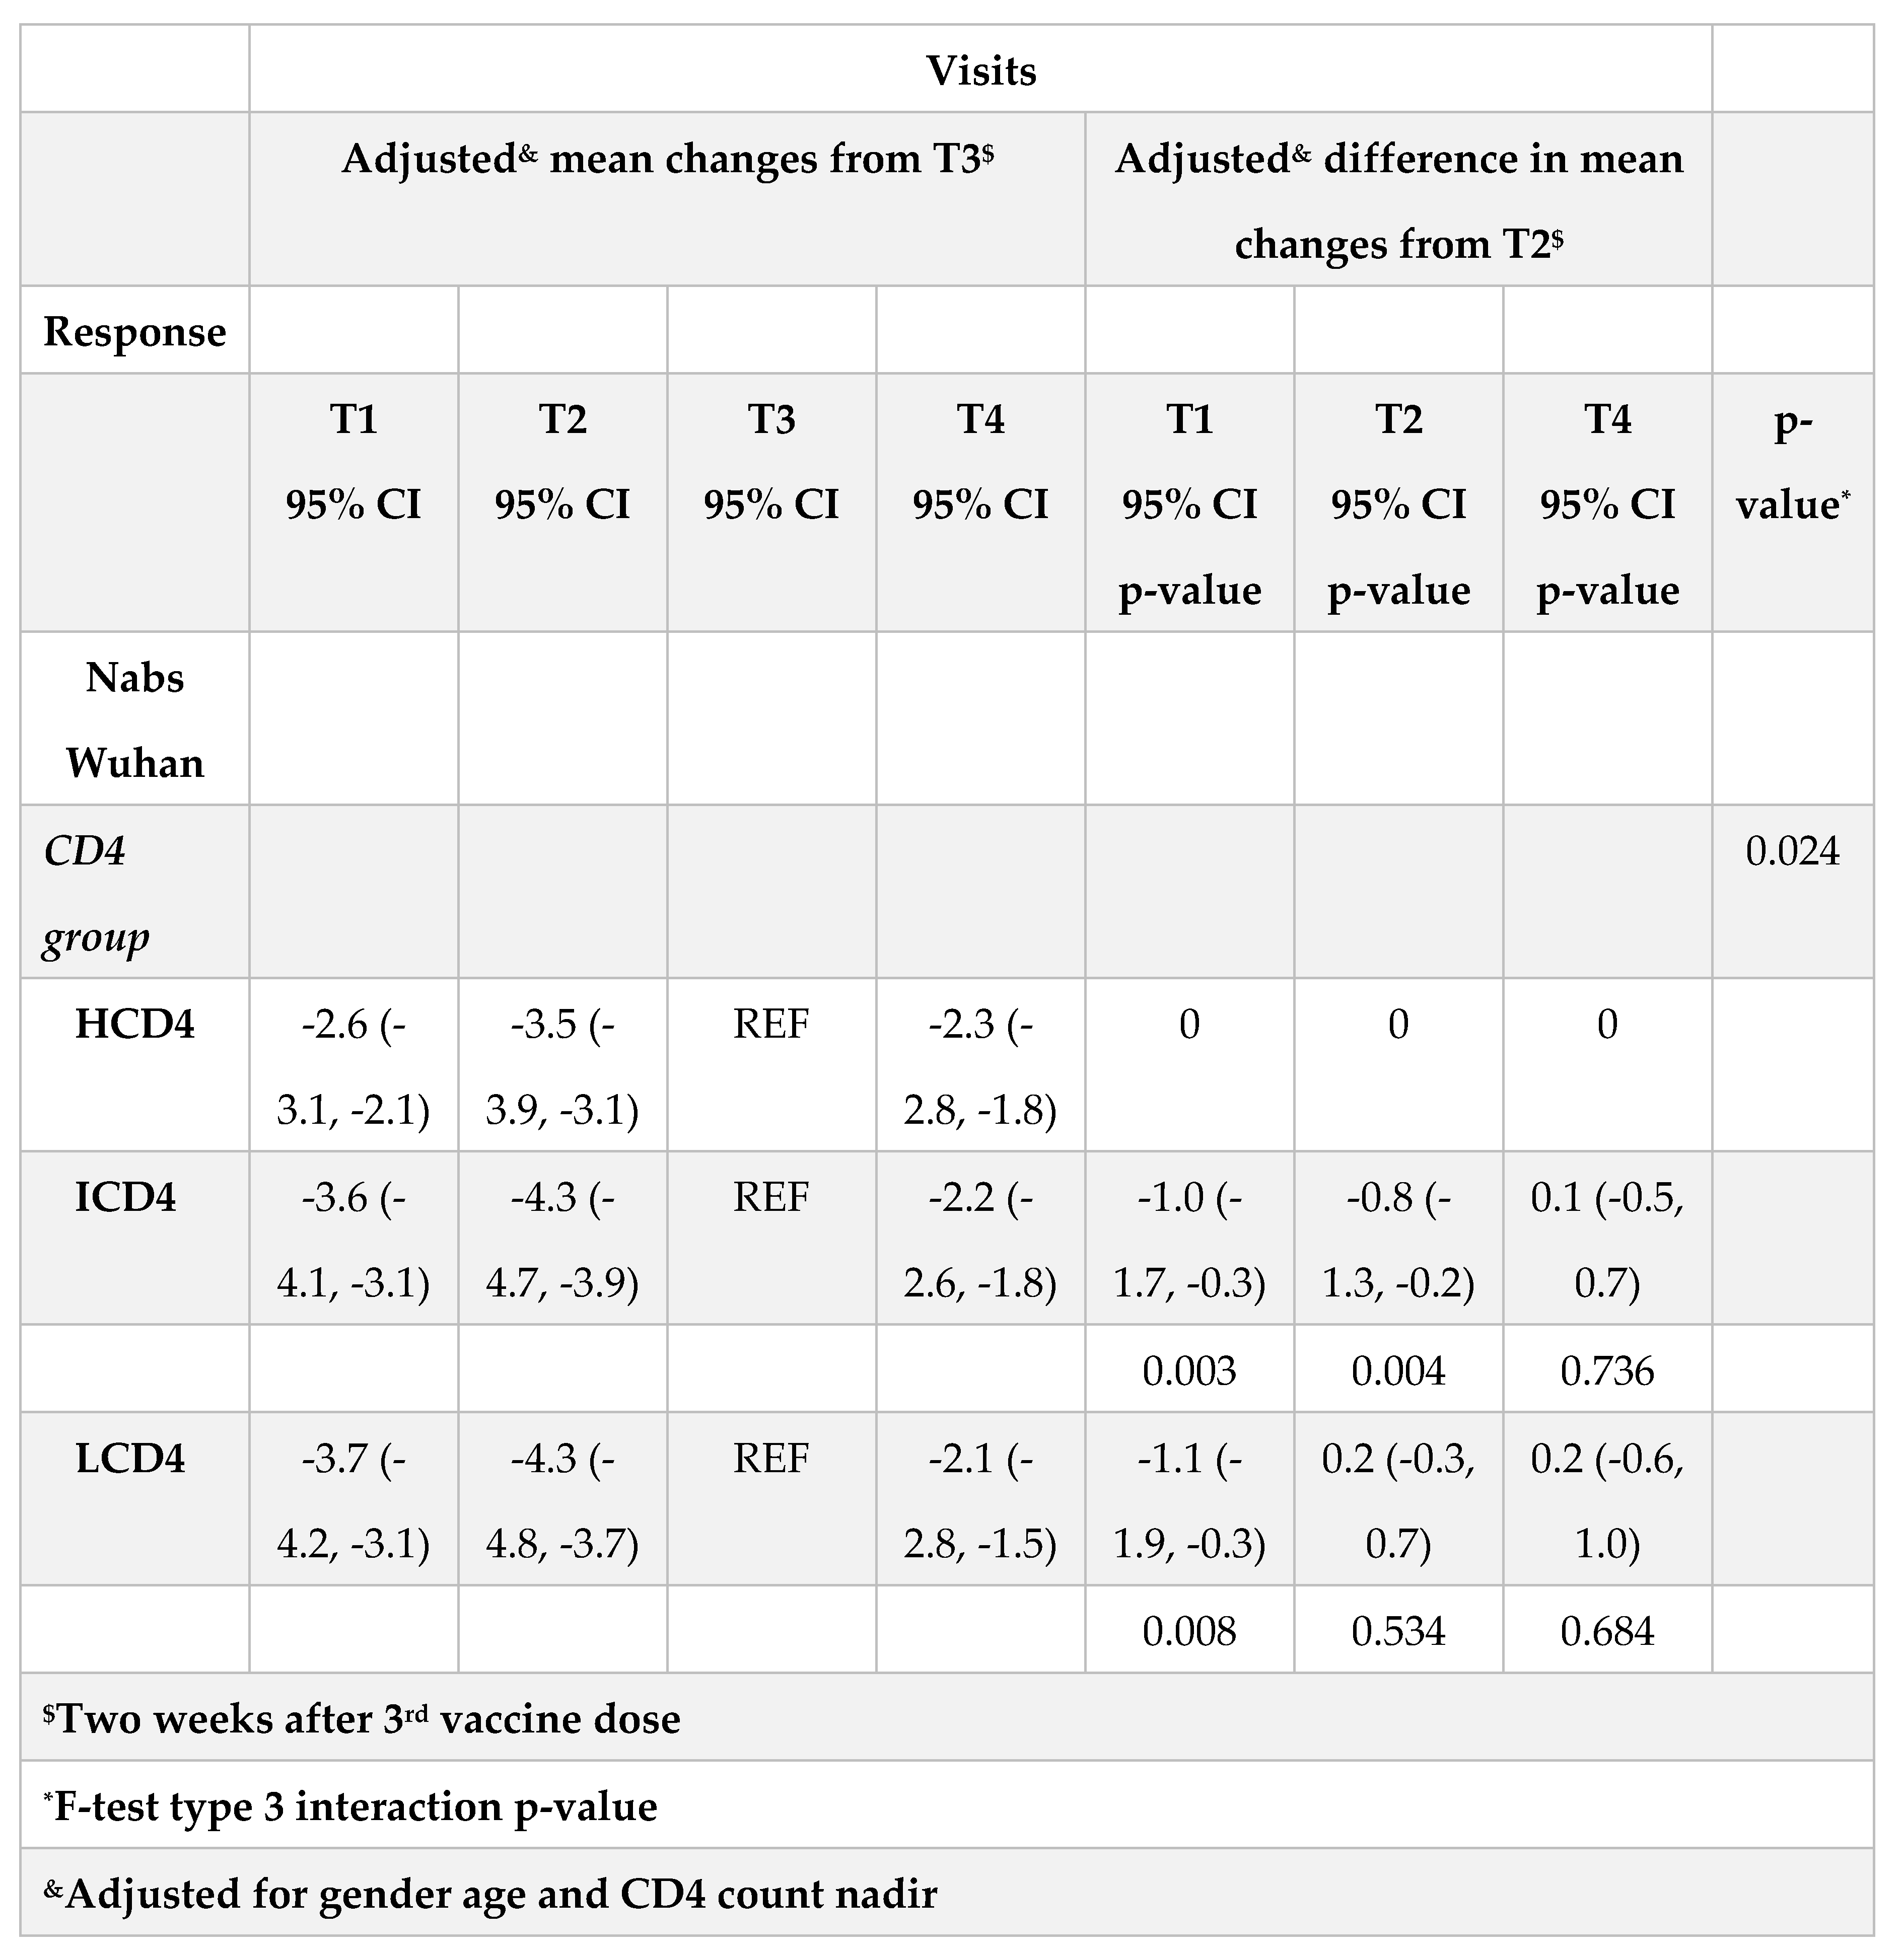 |
Table 3A.
Adjusted absolute mean IFN-γ values over T1-T4 from fitting a mixed linear model (left panel) and mean differences (right panel) by CD4 count groups.
Table 3A.
Adjusted absolute mean IFN-γ values over T1-T4 from fitting a mixed linear model (left panel) and mean differences (right panel) by CD4 count groups.
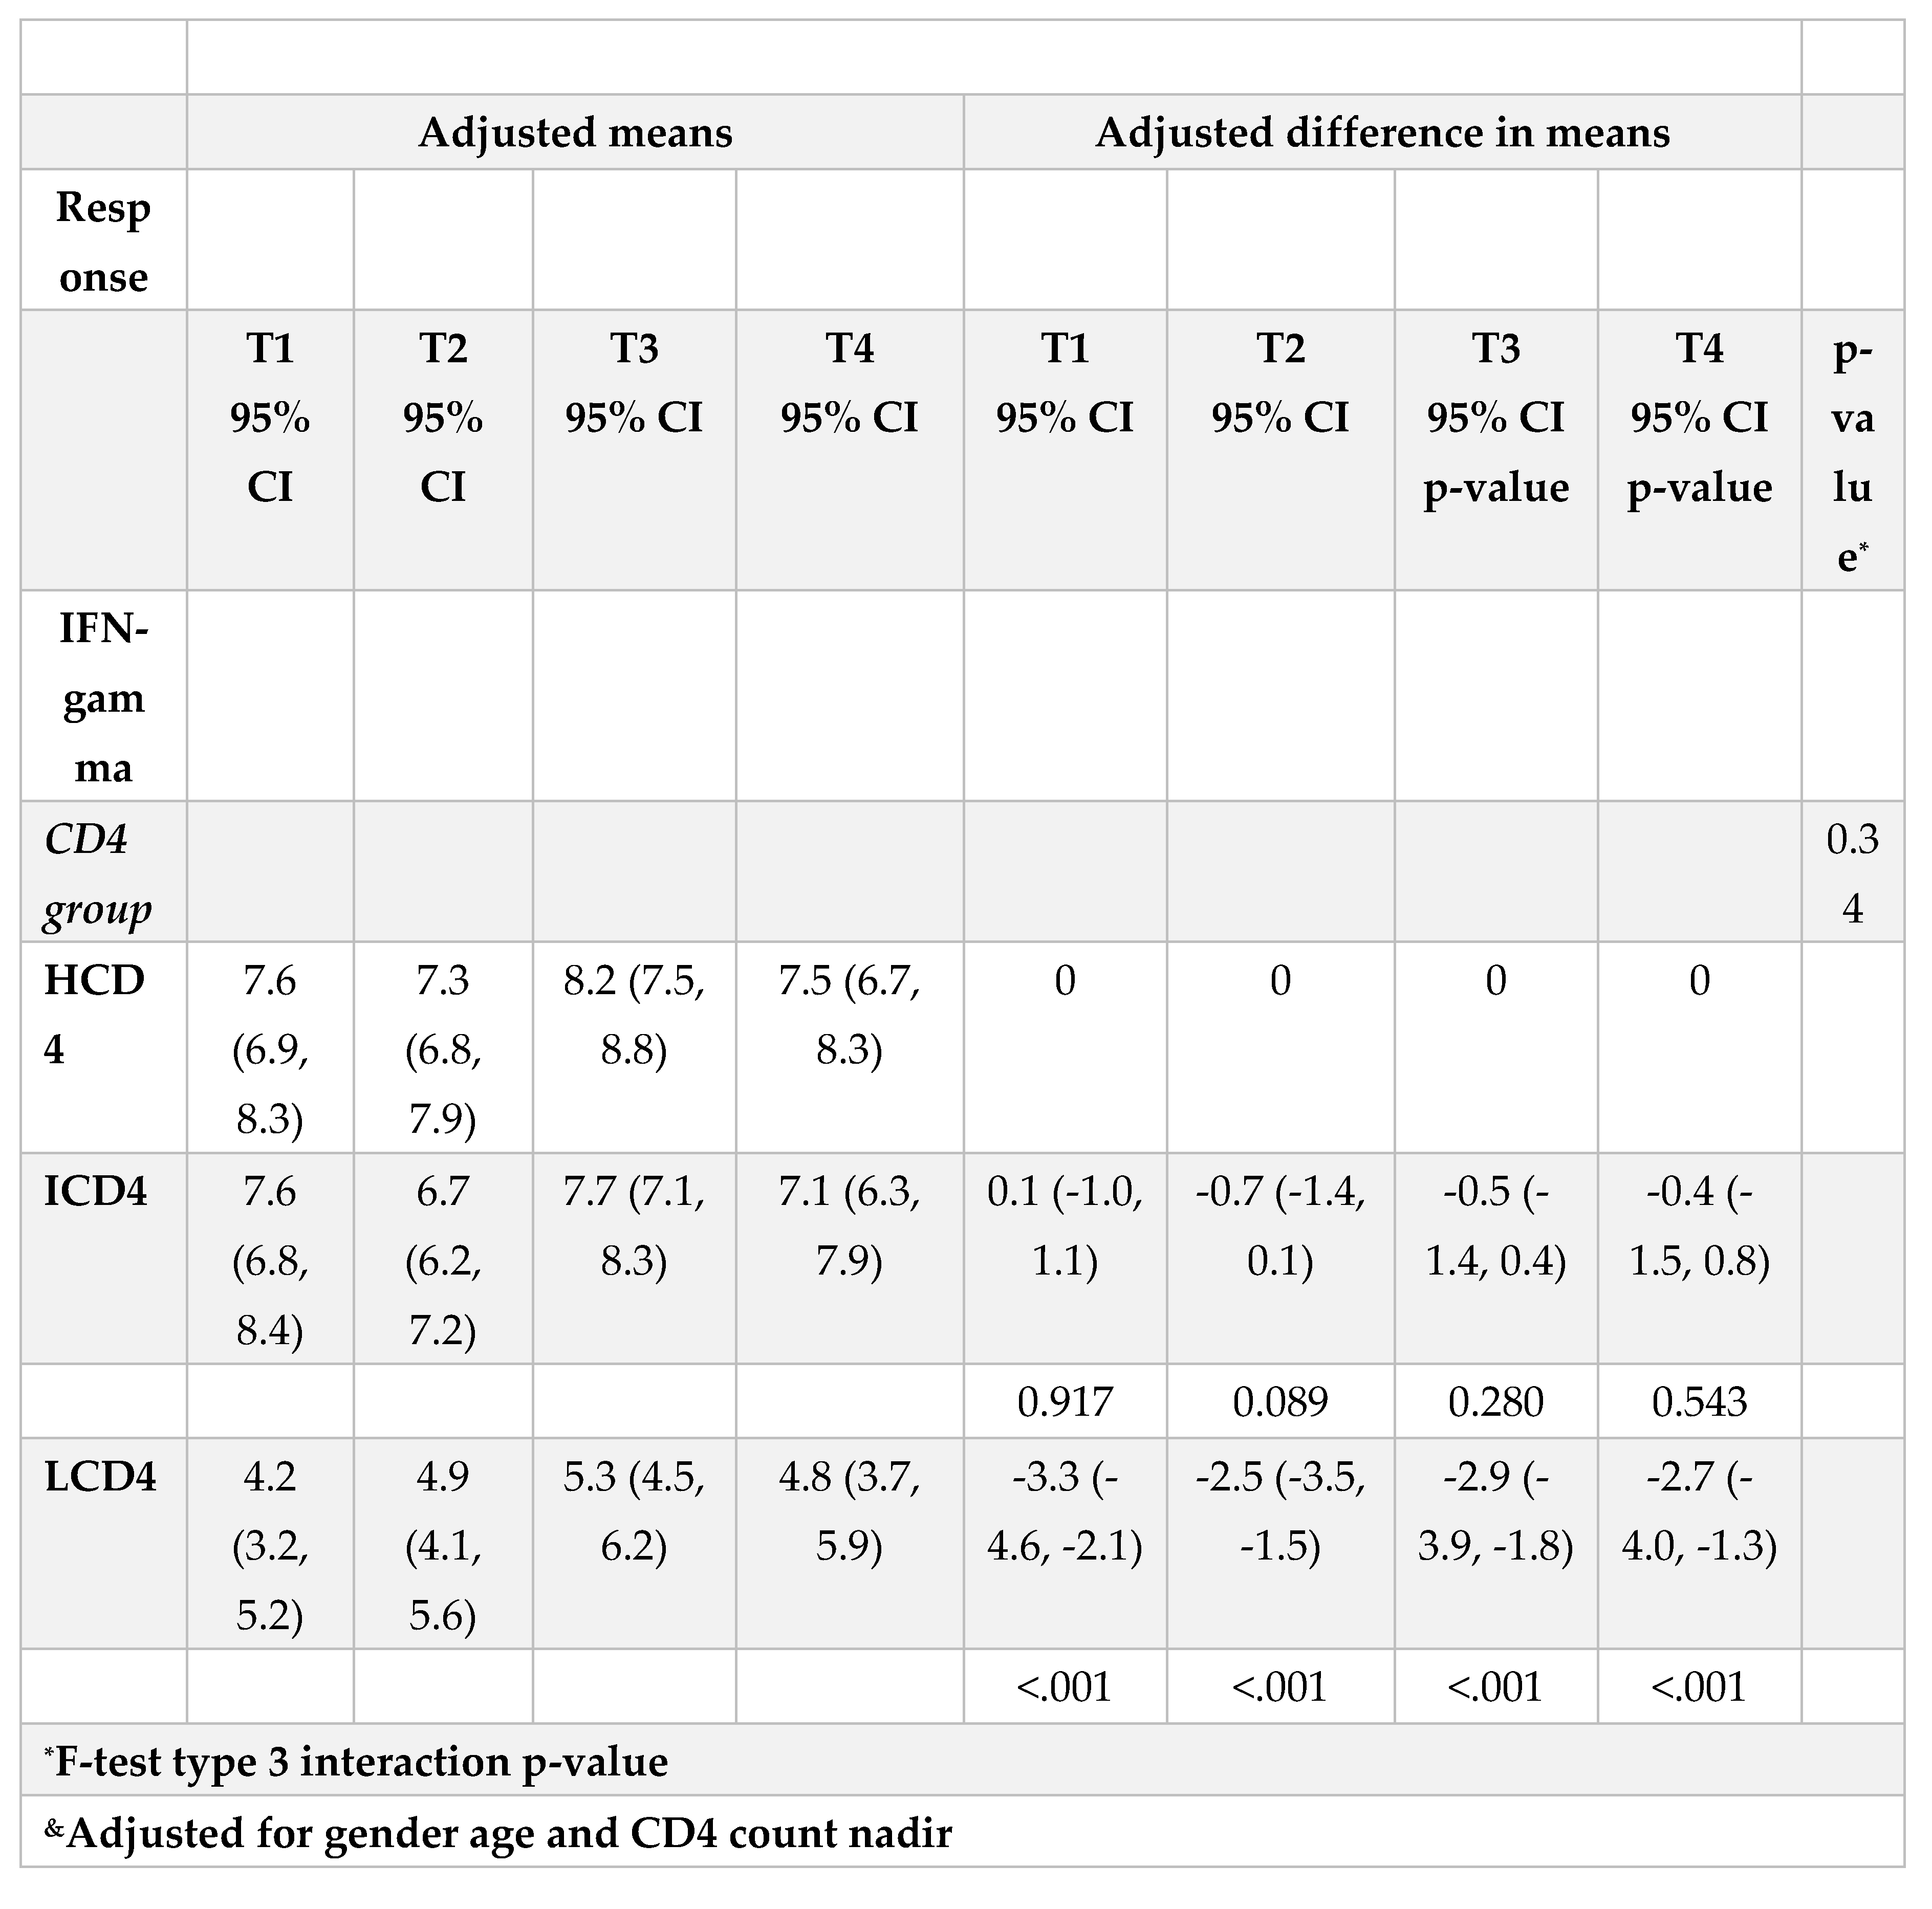 |
Table 3B.
Adjusted mean changes from T2 in IFN-γ values over T1-T4 from fitting a mixed linear model (left panel) and mean differences (right panel) by CD4 count groups.
Table 3B.
Adjusted mean changes from T2 in IFN-γ values over T1-T4 from fitting a mixed linear model (left panel) and mean differences (right panel) by CD4 count groups.
 |
Disclaimer/Publisher’s Note: The statements, opinions and data contained in all publications are solely those of the individual author(s) and contributor(s) and not of MDPI and/or the editor(s). MDPI and/or the editor(s) disclaim responsibility for any injury to people or property resulting from any ideas, methods, instructions or products referred to in the content. |
© 2023 by the authors. Licensee MDPI, Basel, Switzerland. This article is an open access article distributed under the terms and conditions of the Creative Commons Attribution (CC BY) license (http://creativecommons.org/licenses/by/4.0/).
Copyright: This open access article is published under a Creative Commons CC BY 4.0 license, which permit the free download, distribution, and reuse, provided that the author and preprint are cited in any reuse.


