Preprint
Article

H2S Removal via Sorption Process on Activated Carbon-Metal Oxide Composites Derived from Different Biomass Sources

Altmetrics

Downloads

190

Views

71

Comments

0

A peer-reviewed article of this preprint also exists.

Submitted:

05 October 2023

Posted:

06 October 2023

You are already at the latest version

Alerts
Abstract
Biomass exploitation is a global trend due to the circular economy and the environmentally friendly spirit. Numerous applications are now based on the use of biomass derived products. Hydrogen sulfide (H2S) is a highly toxic and environmentally hazardous gas, which emitted from various processes. Thus, the efficient removal of this toxic hazardous gas following cost effective processes is an essential requirement. In this study, we present the synthesis and characterization of biomass-derived activated-carbon/zinc-oxide (ZnO@AC) composites from different biomass sources as potential candidates for H2S sorption. The synthesis involved a facile method for activated carbon production via pyrolysis and chemical activation of biomass precursors (spent coffee, Aloe-Vera waste leaves, and corncob). Activated carbon production was followed by the incorporation of zinc oxide nanoparticles into the porous carbon matrix using a simple melt impregnation method. The synthesized ZnO@AC composites were characterized using X-ray diffraction (XRD), infrared spectroscopy (IR), thermogravimetric analysis (TGA), scanning electron microscopy (SEM) and nitrogen porosimetry. The H2S removal performance of the ZnO@AC composites was evaluated through sorption experiments using a handmade apparatus. Our findings demonstrate that the Aloe-Vera, Spent-coffee, and Corncob derived composites exhibit superior H2S sorption capacity up to 106 mgH2S/gads., 66 mgH2S/gads., and 47 mgH2S/gads. respectively.
Keywords: 
Subject: Chemistry and Materials Science  -   Chemical Engineering

1. Introduction

The continuous growth of industrial processes in combination with the increasing demand for clean energy sources, have led to a substantial rise in the emission of hazardous gases into the atmosphere. Among these harmful emissions, hydrogen sulfide (H2S) poses significant environmental and health risks due to its corrosive nature and toxic properties [1,2]. Anthropogenic activities such as waste landfilling, home heating, and biogas production contribute substantially to H2S emissions. Industrial processes, such as petroleum refining, pulp and paper manufacturing, and wastewater treatment, are some sources which release H2S to the atmosphere [3]. Consequently, there is a growing urgency to develop efficient and sustainable processes for H2S removal from industrial flue gases, biogas, and natural gas streams.
There are several procedures for H2S removal such as biological processes, oxidation, physical separation, solid-phase reactions, dry scrubbing, chemical absorption and adsorption [3,4,5]. Each method has its own benefits and challenges, and the selection of the appropriate method depends on the specific requirements of the application, efficiency considerations, and cost-effectiveness [5].
However, among the various techniques, adsorption has emerged as the most widely applied approach for H2S removal, due to its favorable balance between cost and effectiveness for large and small scale applications even at low concentrations and temperatures [1,5,6]. Different adsorbent materials have been used for this purpose such as zeolites, activated carbons, and metal oxides [5]. Among these materials, activated carbons are very promising materials as effective adsorbents for H2S because exhibit interesting surface chemistry, high surface area and tunable porosity, which enhances their sorption capacity [3,7,8]. Such materials, act both as catalysts for oxidation of H2S by air and as adsorbents effectively eliminating sulphur and its oxides from the fuel gas stream[8]. Moreover, biomass-derived activated carbons which are products from carbonized biomass waste are very attractive and environmentally friendly materials for H2S adsorption applications because of their natural waste origin [9,10,11,12,13,14].
In the recent years, porous carbon/metal oxide composites have emerged as promising materials for H2S sorption due to their unique combination of properties [15,16,17,18,19]. The incorporation of metal oxides into the carbon matrix enhances the chemical reactivity, improving the overall sorption performance. Metal oxides, such as iron oxide (Fe2O3), zinc oxide (ZnO), and manganese oxide (MnO2), can chemically react with H2S to form stable metal sulfides, increasing the overall sorption capacity and efficiency [3]. Among various metal oxides, ZnO seems to exhibit the highest equilibrium constant for sulfidation, reducing H2S levels to fractions of 1 ppm [20] and several studies have been reported about desulfurization using ZnO [3,21,22]. The combination of activated carbon and zinc oxide in composites could exhibits synergistic effects in H2S capture [23,24]. High surface area and micropore hierarchical pore structure of activated carbons, support and enhance the physical and/or chemical adsorption of H2S molecules. Zinc oxide reacts chemically according to the exothermic reaction presented below and leading to the chemisorption of H2S.
ZnO + H2S ↔ ZnS + H2O
This combined mechanism, results in higher H2S sorption capacities and faster kinetics compared to individual components. Continued research and innovation in this field will lead to advance technologies and will address the challenges posed by H2S pollution.
In this study, high porous activated carbons derived from three different kinds of biomass waste materials (spent coffee, Aloe-Vera waste leaves and corncob) have been investigated as effective matrices for zinc oxide incorporation and for hydrogen sulfide removal application. Inspired from Geng et al. [25] who adopted the novel melt infiltration technique to fabricate ZnO-based adsorbents, we produced novel composite ZnO@AC materials for H2S sorption, meeting the demands of modern times, fulfilling the criteria for simplicity, cost-effectiveness, and environmental friendliness. Overall, this study presents a promising possibility for the development of efficient H2S sorbents, emphasizing the significance of activated carbon/zinc oxide composites as potential candidates for mitigating H2S emissions in various industrial processes and environmental applications.

2. Materials and Methods

2.1. Materials

Spent coffee (sc) was collected from the student café of the University of Ioannina and dried at 80 °C for 24 h. Aloe-Vera (av) waste leaves were supplied by the Greek Industrial Company, Hellenic Aloe, Ethnikis Antistasews 21, Heraklion, Crete, 71306, Greece, whereas Corncob waste (cc) was supplied by Agricultural Cooperative Agrinio Union, Agrinio, 30100, Greece. Both of them were washed with tap water and dried at 80 °C for 24 h. The dried Aloe-Vera leaves and corncob were milled in order to produce fine brown powder. Potassium hydroxide (KOH, 85%), hydrochloric acid (HCl, 37%), and Zinc nitrate (Zn(NO3)2·H2O, 98%), were purchased from Merck (Darmstadt, Germany) and used without further purification.

2.2. Preparation of Activated Carbons

Activated carbon (AC) were produced via the pyrolysis and chemical activation processes of, spent coffee, Aloe-Vera leaves, and corncob. A certain amount of each biomass was pyrolyzed at 500 oC for 2 h under argon flow. The produced chars were grounded and mixed with KOH (1/1 wt/wt) and pyrolyzed again under argon flow at 800 oC for 2h. The pyrolysis process took place in a tubular furnace with a temperature increasing rate of 5 °C/min. The produced activated carbon was stirred for 24 h in an HCl solution (1 N), washed with deionized water to approximately neutral pH of 7, and finally was dried at 80 °C for 24 h.

2.3. Preparation of ZnO@AC composites

ZnO@AC composites were synthesized by melt impregnation method [25], using Zn(NO3)2·H2O as metal precursor. An amount of 150 mg of pure AC, was mixed and grounded with 108 mg Zn(NO3)2·H2O, placed inside a 5 ml closed glass vial, and heated at 42 oC for 24 h to melt the zinc salt which then intruded to the porous carbon. The mixture further heated at 400 oC for 4h under vacuum with heating rate 5 oC/min to produce zinc oxide molecules inside activated carbon pores.

2.4. Characterization techniques

For the chemical and structural characterization of the ZnO@AC composites as well as of the initial activated carbon matrices, X-ray Diffraction (XRD), ThermoGravimetric analysis (TG%), Fourier Transformer-InfraRed spectroscopy (FT-IR), nitrogen (N2) porosimetry, Scanning Electron Microscopy (SEM), and EDX analysis were used. The XRD patterns were determined via powder X-ray diffraction technique using a D8 Advance Bruker diffractometer equipped with Cu Kα (40 kV, 40 mA, λ=1.541 78 Å) radiation source and a secondary beam graphite monochromator (measuring conditions: 2 to 80° 2θ range, 0.02° steps, 2s/ step). The FT-IR spectra were collected using an FT/IR-6000 JASCO Fourier transform spectrometer in the wavenumber range of 4000–400 cm-1 and 4 cm-1 resolution. The samples were in powder form and dispersed in KBr to produce pellets. TG% analysis was performed using a Perkin Elmer Pyris Diamond TG/DTA instrument. About 5 mg of each sample was heated in air from 25 oC to 850 oC, with a temperature increasing rate at 5 oC/min. N2 adsorption-desorption isotherms were collected via porosimetry measurements at 77 K using a Quantachrome Autosorb iQ porosimeter. Before the analysis the sample was outgassed at 150 °C for 20 h under a high vacuum (10-6 mbar). Brunauer-Emmett-Teller (SBET) [26] Langmuir (SLang.), and Corrugated Pore Structure Model (CPSM) [27,28], methods were applied to determine the specific surface area. Pore volume distribution of the material was estimated by applying the Density Functional Theory (DFT) [29] and the Corrugated Pore Structure Model (CPSM)[27,28]. The total pore volume was calculated by transform the overall (i.e. at around P/P0=0.998) adsorbed gas nitrogen STP volume to liquid nitrogen volume. The micropore volume fraction estimation were carried out using the Dubinin-Radushkevich and the CPSM model [30,31] while the pore number (population) distribution were estimated using the CPSM model [27]. Finally, Scanning electron microscopy (SEM) images were obtained using a JEOM JSM 6510-LV instrument (Ltd., Tokyo, Japan) equipped with an X-Act EDS-detector from Oxford Instruments, Abingdon, Oxfordshire, UK (an acceleration voltage of 20 kV was applied). EDX measurements were also carried out.

2.5. H2S sorption experimental measurements

The H2S removal capacity of the prepared AC samples was estimated via experiments in an i.d.=4.4 mm inox 316 adsorption column, total length of 22 mm, mounted on a handmade apparatus presented in Figure 1.
For the construction of this apparatus, we used PARKER 13HE inox 316 gas plug valves 1/8” (GPV), 172 bar, 38 °C, Parker Hannifin Sales Company Germany, Pat-parker-platz 1, 41564 Kaarst, Germany, AALBORG calibrated ball gas flow meters (rotameter), Aalborg Instruments & Controls, Inc., 20 Corporate Drive, Orangeburg, New York 10962 USA, an electrochemical instrument, CROWCON Xgard Bright, Ribble Enviro Ltd., Unit 4, Gisburn Business Park, Gisburn, Nr Clitheroe, BB7 4JP, UK for H2S sensing, and outlet concentration recording using a akYtec MSD200 4-20 mA Modbus Data Logger, GmbH, Vahrenwalder Str. 269 A, 30179 Hannover, Germany, recorder. The instrument is tuned to operate in the range of 0-6000 v/v ppm H2S (ml/m3) outlet concentration. Experiments were carried out under ambient conditions of temperature and pressure. After the adsorption column, the outlet H2S was firstly captured by a NaOH aqueous solution 0.25M and secondly by a CdSO4 aqueous solution 0.1 M. The AC sample was placed in the adsorption column supported by glass wool in front and back of the solid fixed bed. The length of this bed is measured before the experimental measurement starts for Gas Hourly Space Velocity (GHSV) calculations. Outlet (v/v) ppm concentrations (ml/m3) versus time in (min) were recorded and values exported in an excel file at the end (fully saturated AC) of each experiment. Concentration values were normalized with the maximum value, i.e. 6000 v/v ppm (ml/m3), and the breakthrough integral of equation 2 and the saturation integral of equation 3 were calculated numerically (Simpson or Trapezoid rule).
b r e a k t h r o u g h   i n t e g r a l = I b ( m i n ) = 0 t b 1 C ( t ) C i n · d t
s a t u r a t i o n   i n t e g r a l = I s m i n = 0 t s 1 C ( t ) C i n · d t
where tb (min) was the breakthrough time, i.e., time where C(t)/Cin=0.05, and ts (min) was the fully saturation time, i.e., time where C(t)/Cin=1.
The breakthrough adsorption capacity qb (mgH2S/gads.) was calculated using equation (5) while the fully saturation adsorption capacity qs (mgH2S/gads.) was calculated using equation (6). For such calculations we assumed the ideality of the inlet gas and the inlet maximum concentration, i.e., 6000 v/v ppm (ml/m3), was converted to mgH2S/Lgas according to equation 4.
C i n m g H 2 S m l g a s = M W H 2 S g H 2 S m o l H 2 S 22400 m l H 2 S m o l H 2 S · 10 6 m g a s 3 m l g a s · C i n m l H 2 S m g a s 3   o r v v p p m
q b m g H 2 S g a d s . = C i n m g H 2 S m l g a s · V ˙ m l g a s m i n m a d s . g a d s . · I b m i n
q s m g H 2 S g a d s . = C i n m g H 2 S m l g a s · V ˙ m l m i n m a d s . g a d s . · I s m i n
where Cin is the inlet gas concentration, MWH2S is the H2S molecular weight, 22400 is the molecular volume of ideal gasses, is the gas volume flow rate, Ib and Is the breakthrough and fully saturation integral respectively, mads. the adsorbent (AC) mass in the adsorption column, qb the breakthrough adsorption capacity of the adsorbent (AC), and the qs the fully saturated adsorption capacity of the adsorbent (AC).

3. Results and Discussion

3.1. XRD Analysis of pure AC and ZnO@AC composites

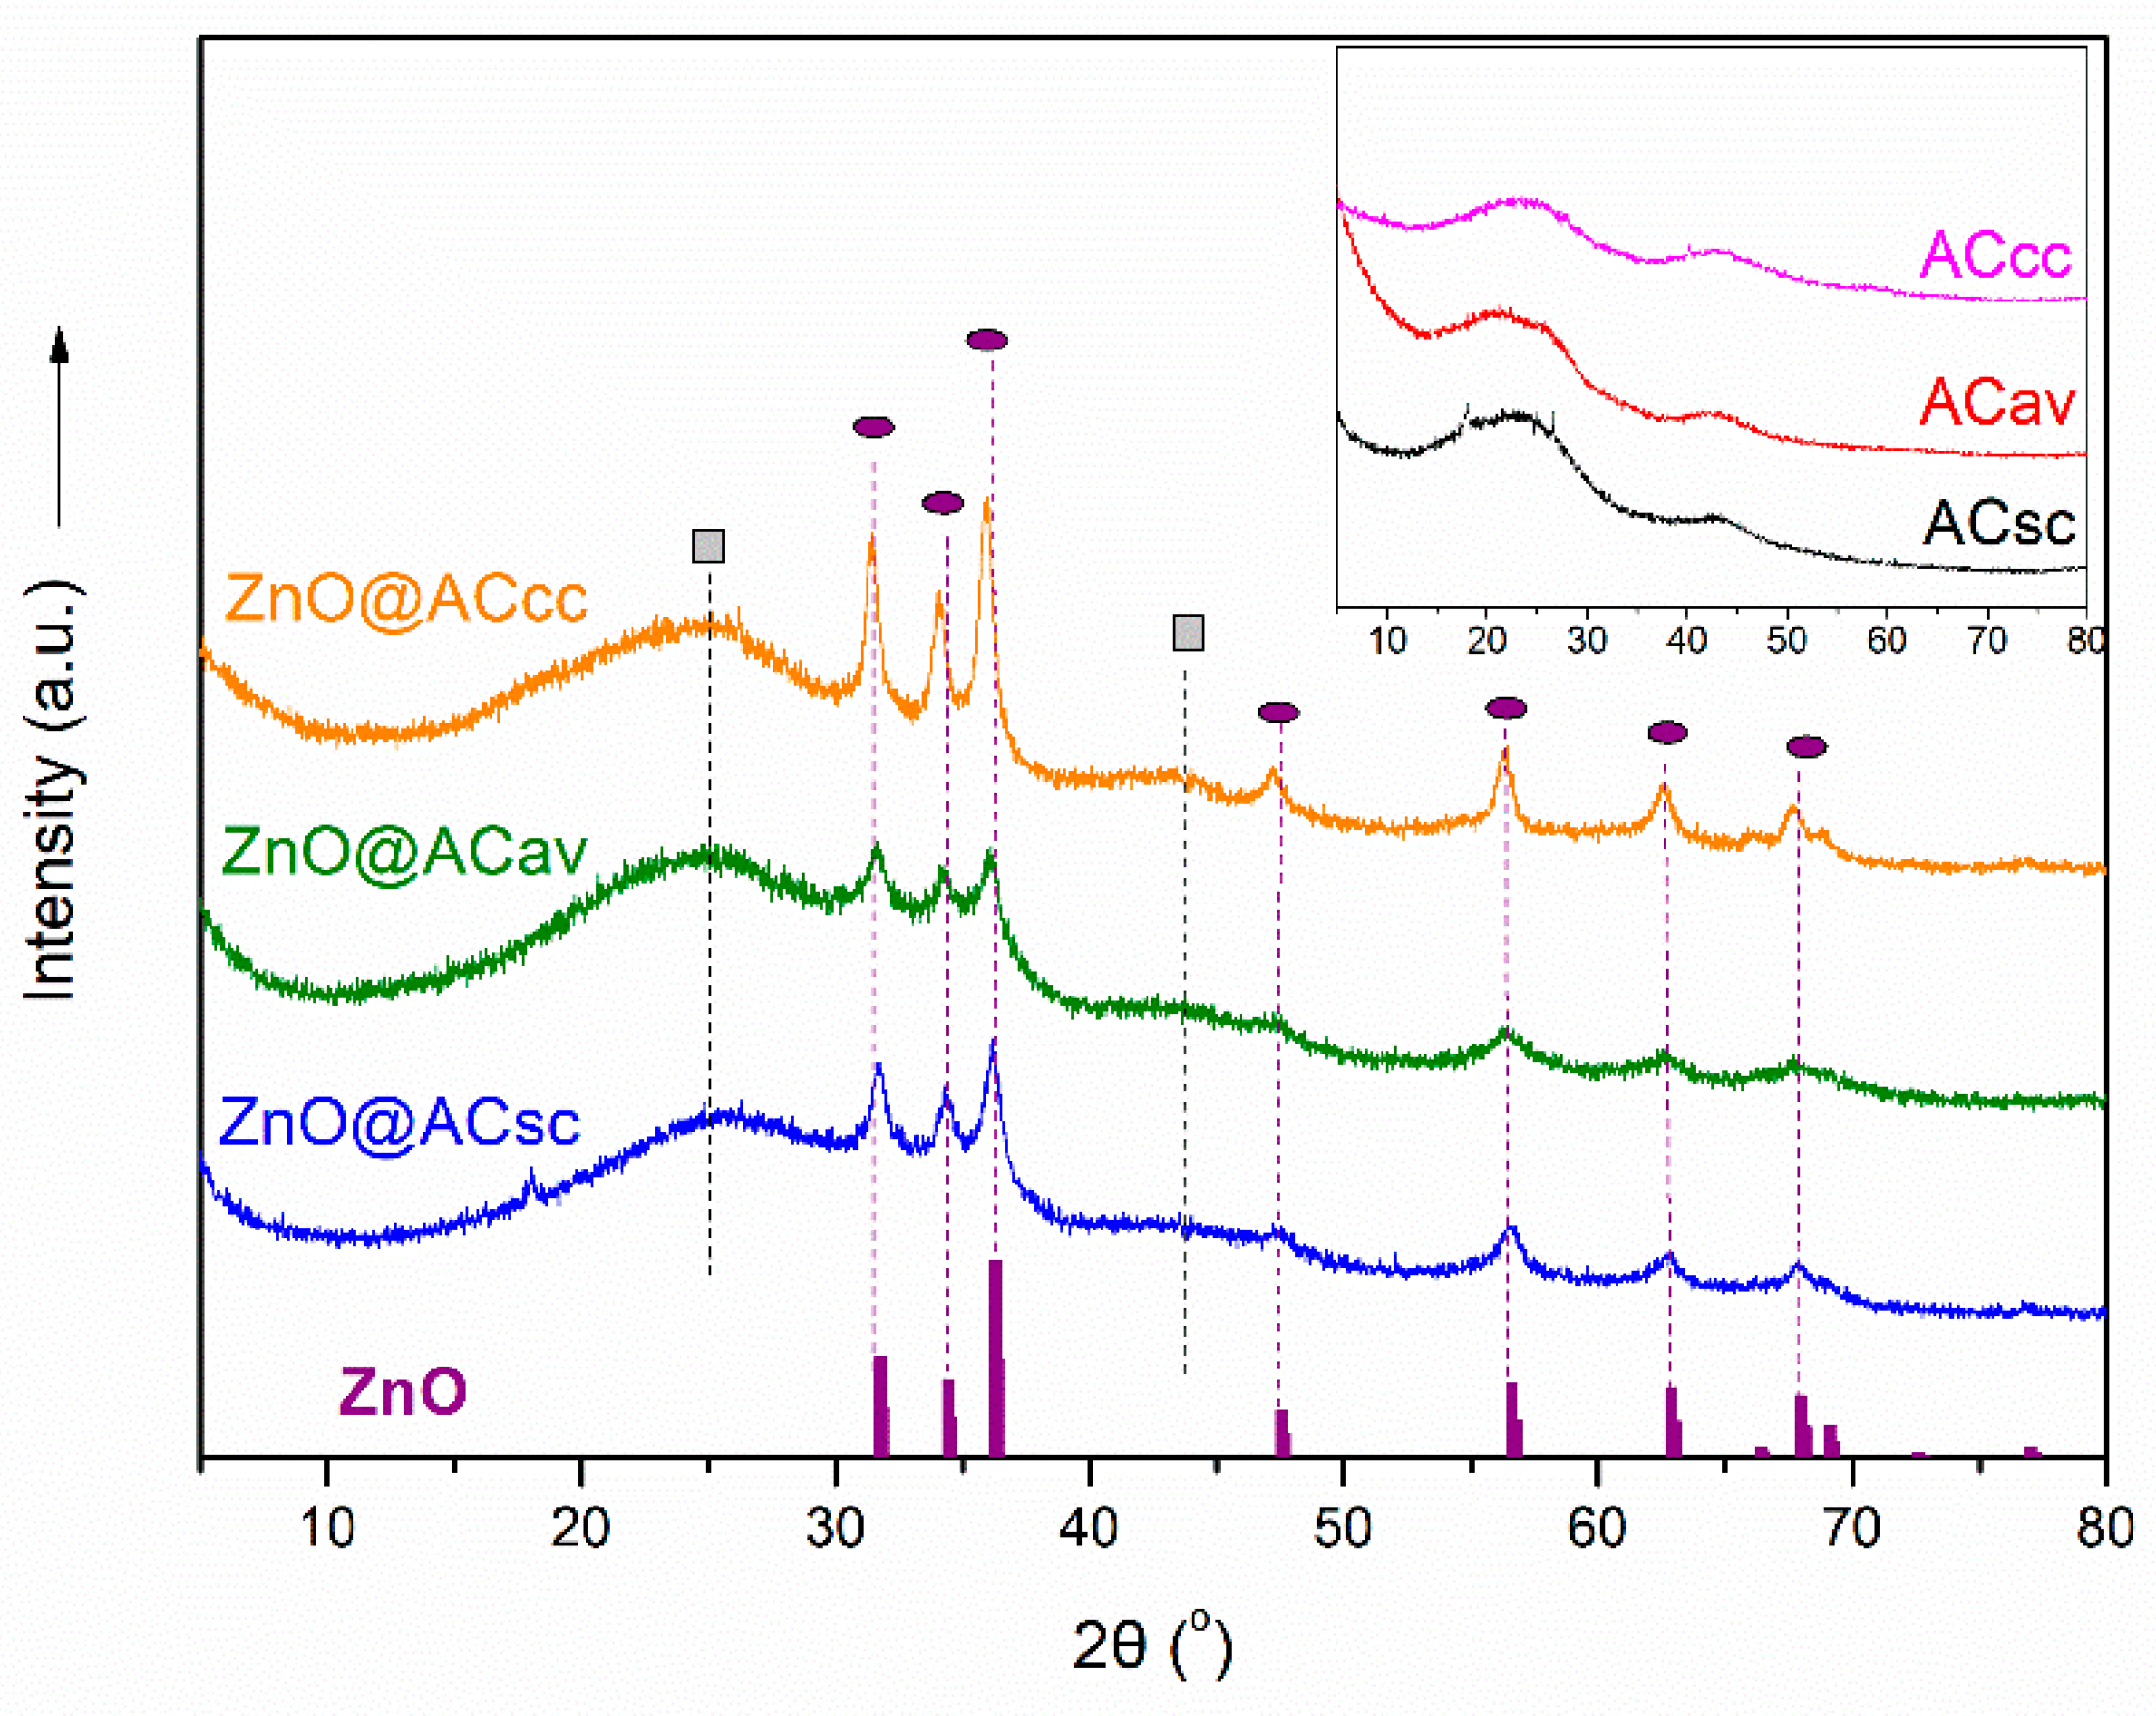
The X-ray diffraction (XRD) analysis was performed on the ZnO@AC composites to investigate their structural properties and phase composition. The obtained XRD pattern are shown in Figure 2 in comparison with the patterns of initial activated carbon matrices (Figure 2-inset). The XRD patterns of composite materials exhibit crystalline diffraction peaks (marked with purple circles in Figure 2), due to the presence of crystalline phases of ZnO particles (JCPDS 96-230-0113) within the composite. The presence of ZnO within the activated carbon matrix is further confirmed by the overlapping of the characteristic peaks of both materials. The characteristic broad peaks at 2θ ~24o and 44o (marked with grey squares in Figure 2) become from the amorphous nature of the three activated carbon matrices as it shown in Figure 2 inset. This suggests successful incorporation and dispersion of ZnO nanoparticles into the activated carbon structure. By analyzing the full width at half maximum (FWHM) of the peaks, it is possible to estimate the average crystalline size of ZnO nanoparticles within the composites, using Scherrer’s equation [32,33] at 2θ ~36o, the more intense peak for ZnO phase. The average crystalline size for ZnO particles is calculated equal to 11, 8.3 and 13.4 nm for spent coffee, aloe leaves, and corncob ZnO@AC composites respectively. Overall, the observed XRD patterns confirm the successful formation of ZnO@AC composite materials.

3.2. FTIR Spectroscopy of pure AC and ZnO@AC composites

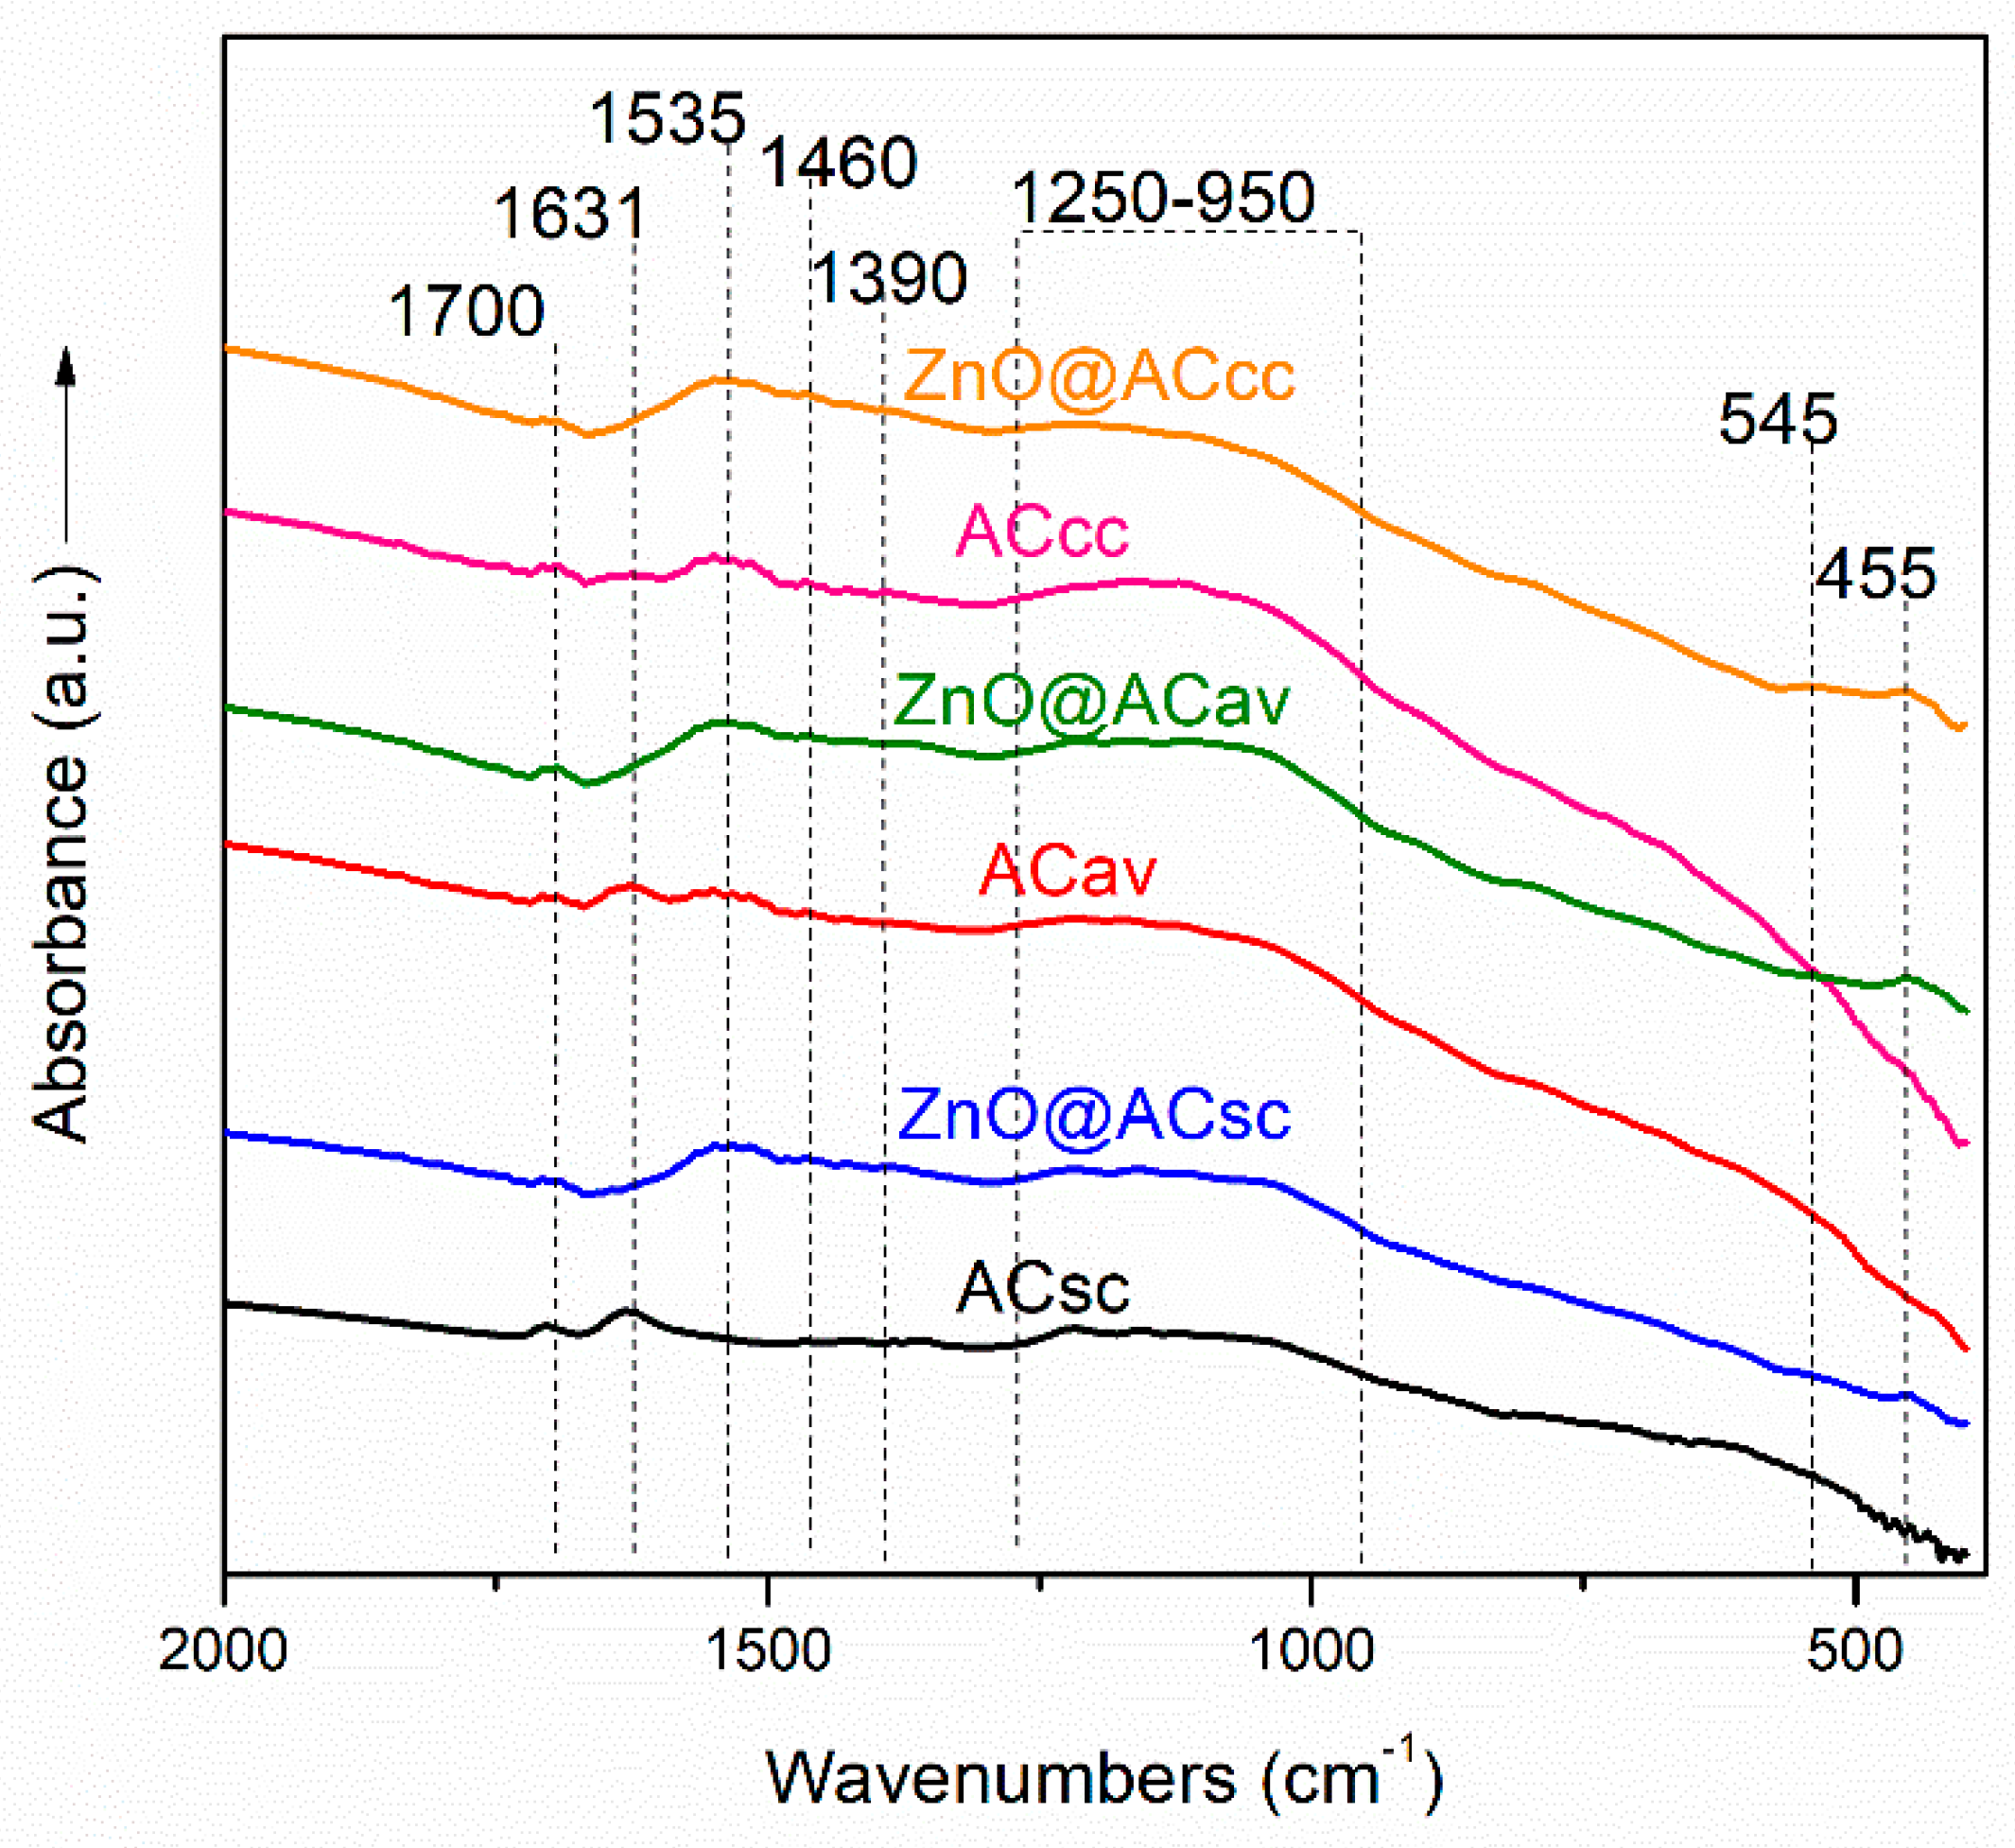
The FT-IR spectroscopy analysis was conducted to examine the chemical bonding and functional groups present in the ZnO@AC composites. The FT-IR spectra of the ZnO@AC composites (Figure 3) exhibited a combination of characteristic absorption bands from both activated carbon and ZnO components. The bands observed in the composite spectra were compared with the individual spectra of activated carbon to identify any shifts or new band, indicating potential chemical interactions. The band observed at 1700 cm-1 in all spectra, is attributed to the C=O stretching vibration, indicating the presence of carbonyl groups. This band may arise from the surface functional groups of activated carbon, such as carboxylic acids or ketones [34]. The absorption bands at 1460, 1535 and 1631 cm-1, can be attributed to bending vibrations of CH2, stretching vibrations of C=C groups in aromatic rings, and/or to –COO- groups as well as physically adsorbed water molecules [34,35,36]. The band at 1631 cm-1, is shifted at 1535 cm-1 in the composite’s spectra, probably due to the interaction of COO- groups with ZnO nanoparticles[37]. Also, in the composite’s spectra, it is observed an increase to the intensity of the weak band at 1390 cm-1 which could be assigned to C-OH vibration modes of activated carbon’s functional groups probably once more, due to the interactions of ZnO nanoparticles with these groups [37,38]. The broad absorption band at ~1250-950 cm-1 region, in all spectra can be assigned to the overlapping of C-O-O stretching, C-O stretching and O-H bending modes of alcoholic, phenolic and carboxylic groups [10,39]. Furthermore, the FT-IR spectra of the composites show two weak bands at low frequency range, at 545 and 455 cm-1, which can be assigned to the characteristic stretching vibration of the Zn-O bond in ZnO nanoparticles [40]. This peak indicates the successful incorporation of ZnO into the activated carbon matrix. The FT-IR analysis confirmed that the ZnO@AC composite basically, retains the characteristic functional groups of activated carbons, indicating the coexistence of its surface chemistry with ZnO particles in the composite structure without any significant chemical degradation or transformation during the synthesis process.

3.3. Thermogravimetric TG% analysis of pure AC and ZnO@AC composites

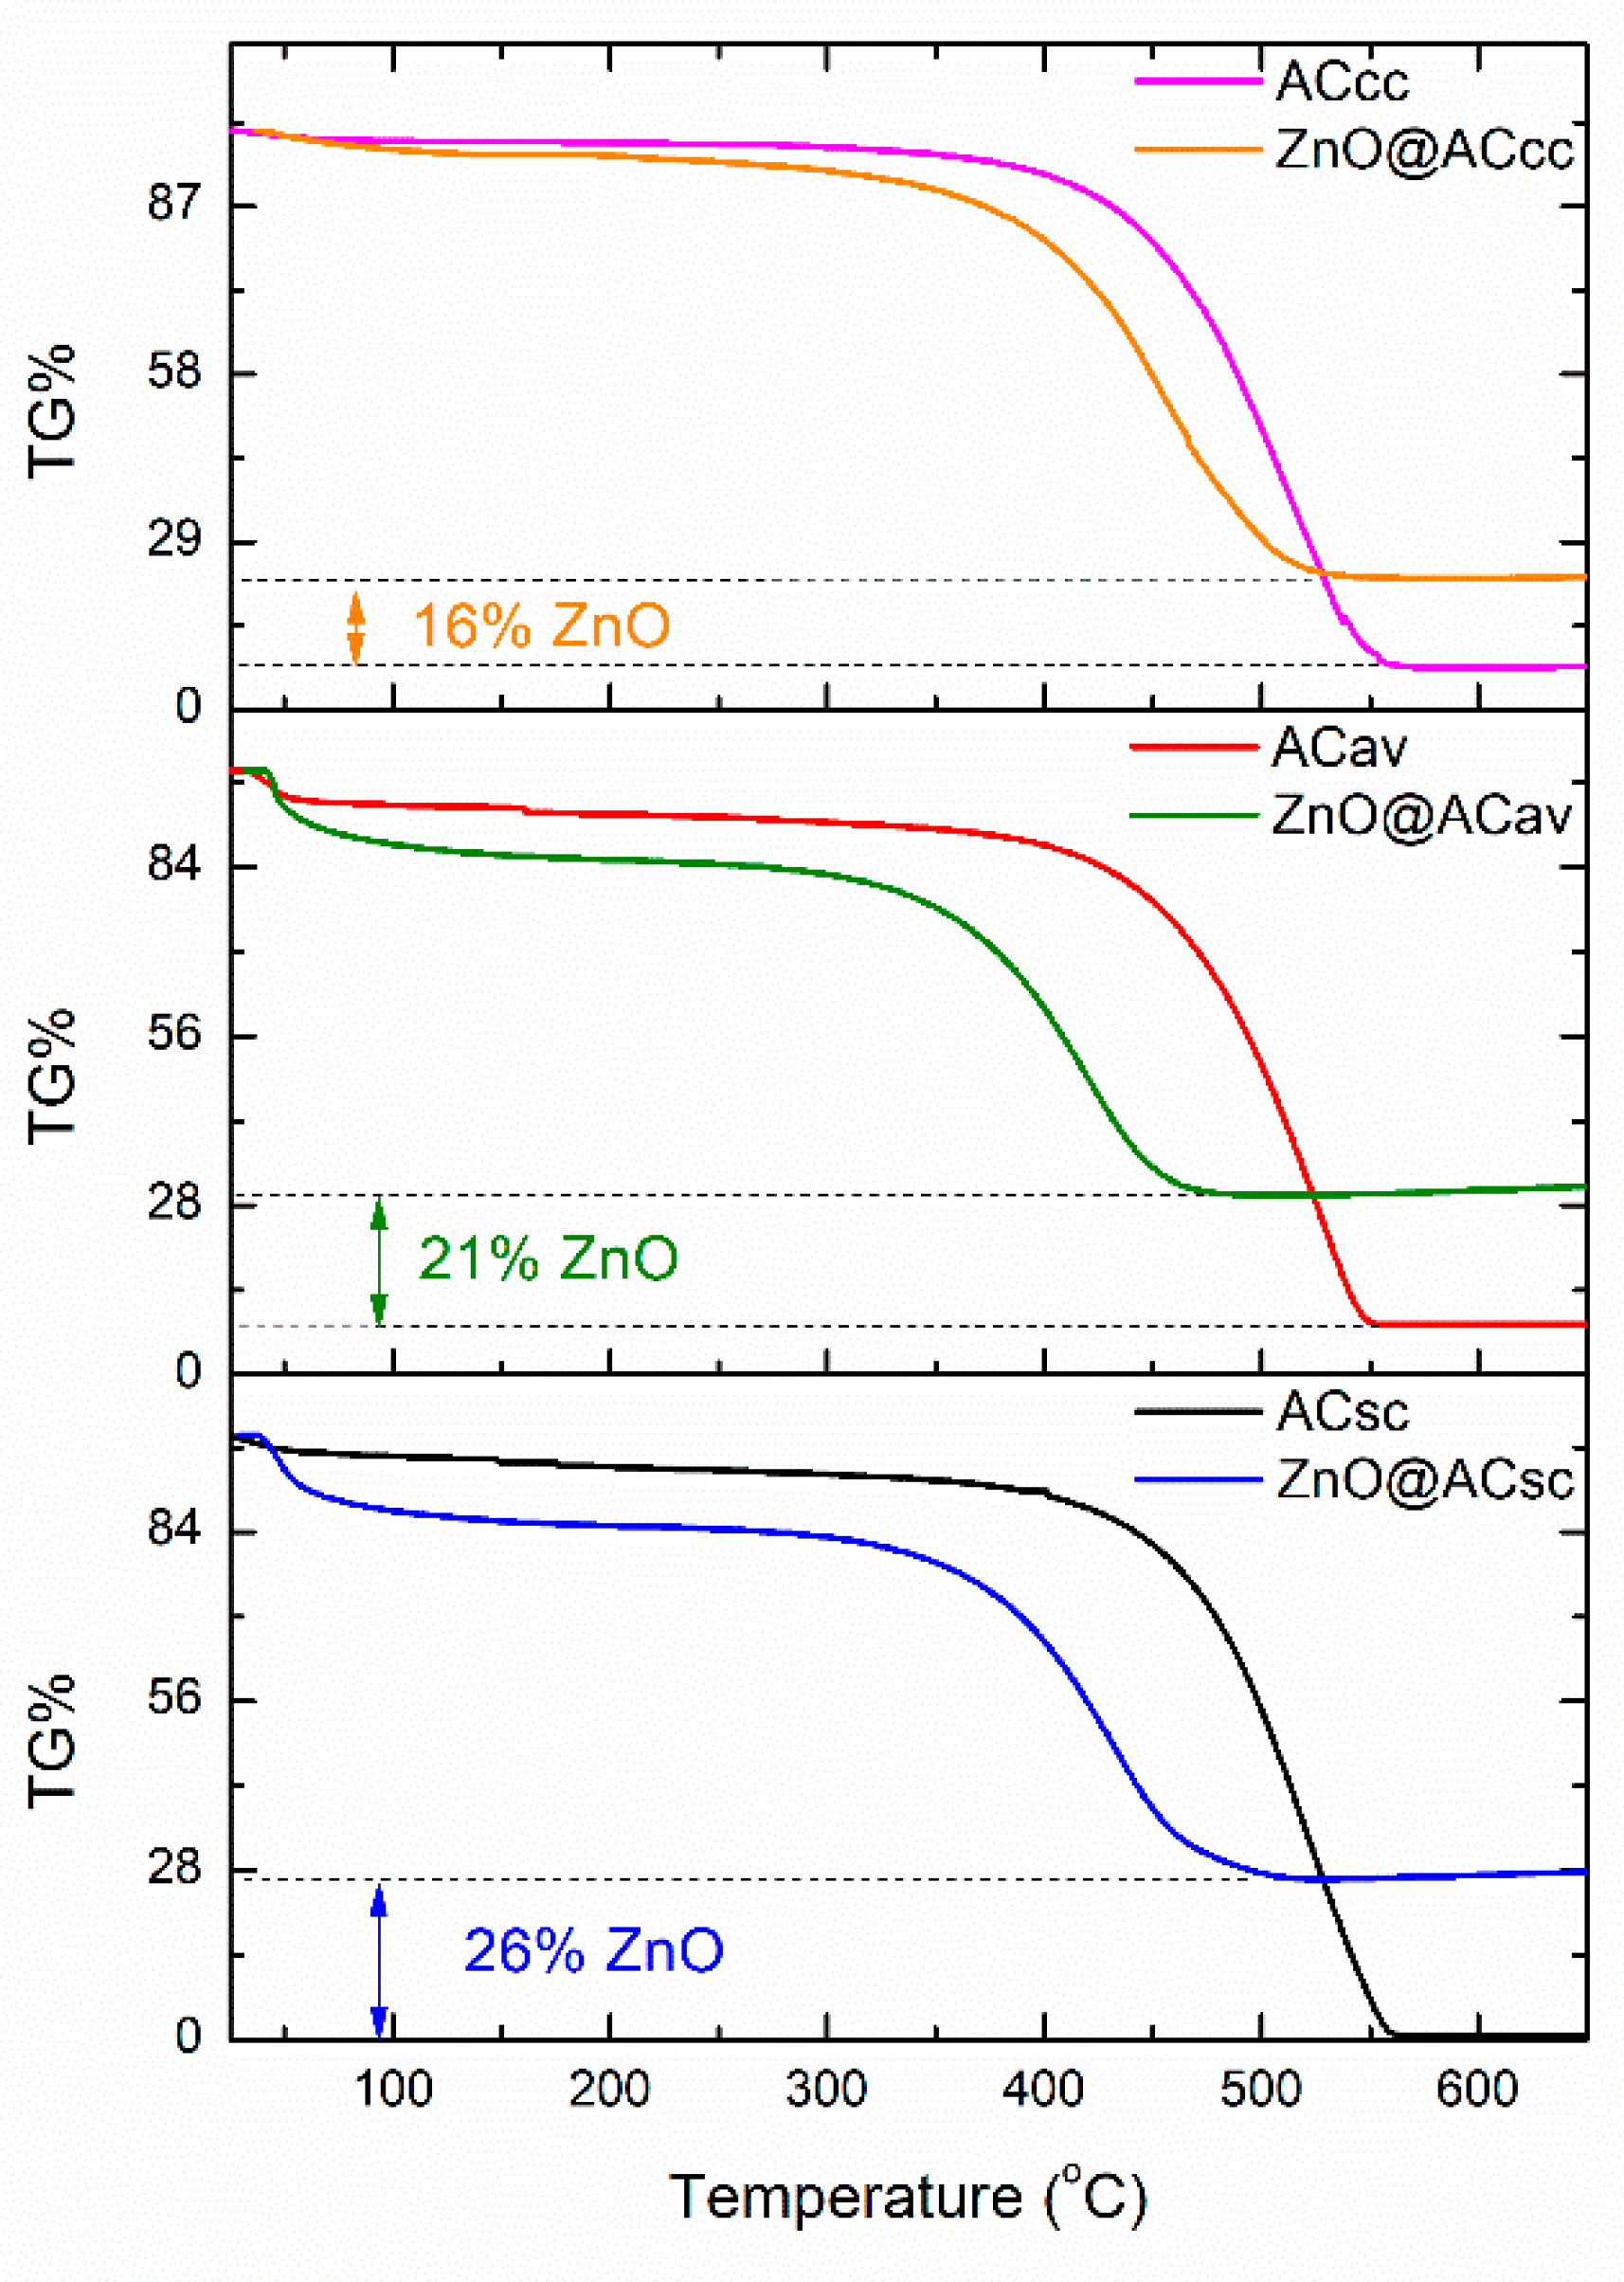
The TG% curves obtained for the ZnO@AC composites in comparison with the corresponding curves of the initial activated carbon matrices, are presented in Figure 4. All TG% curves show a small initial weight loss of approximately 4-15% in the temperature range of 30°C to 120°C due to the removal of adsorbed moisture on the surface of the materials. A significant weight loss of approximately 55-70% is observed between 300°C and 560°C due to thermal degradation/combustion of activated carbon. The residual mass at this point, in the case of the ZnO@AC composite materials is attributed to the presence of inorganic components, particularly ZnO, which has a higher thermal stability compared to activated carbon. This mass is calculated equal to 26%, 21% and 16% for spent coffee, aloe leaves, and corncob derived ZnO@AC composites, respectively.

3.4. Nitrogen porosimetry for pore structure analysis of pure AC and ZnO@AC composites

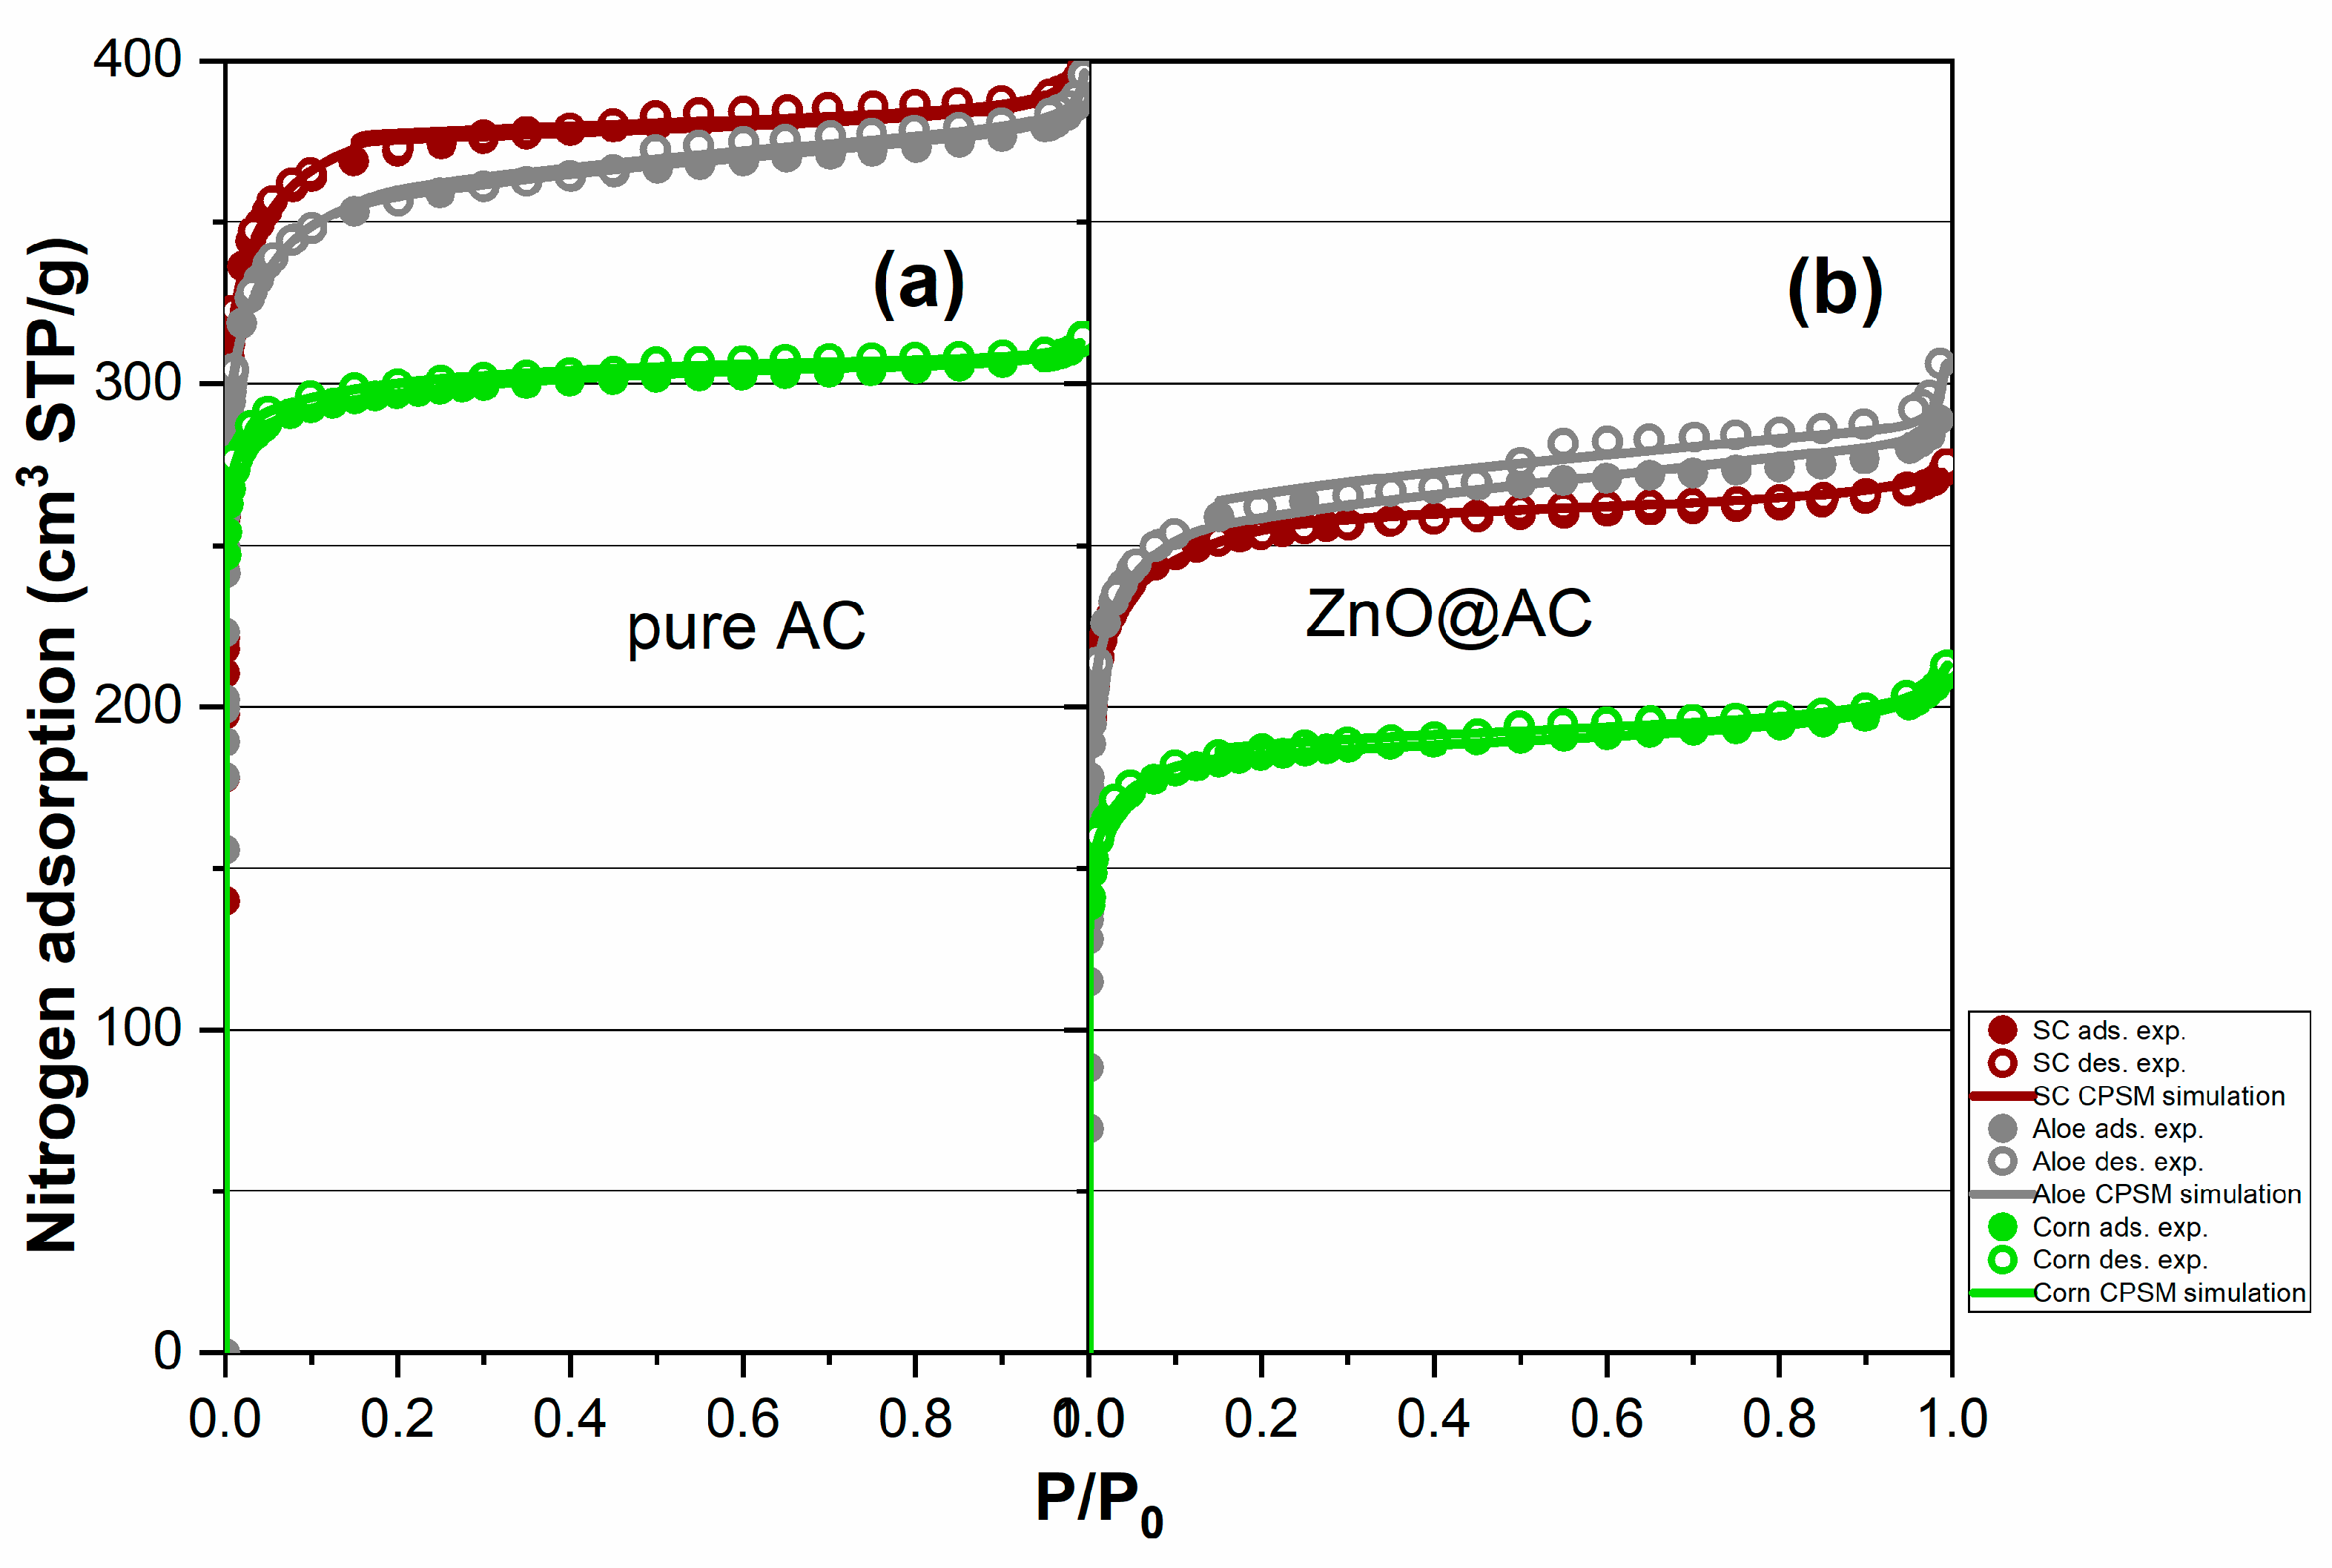
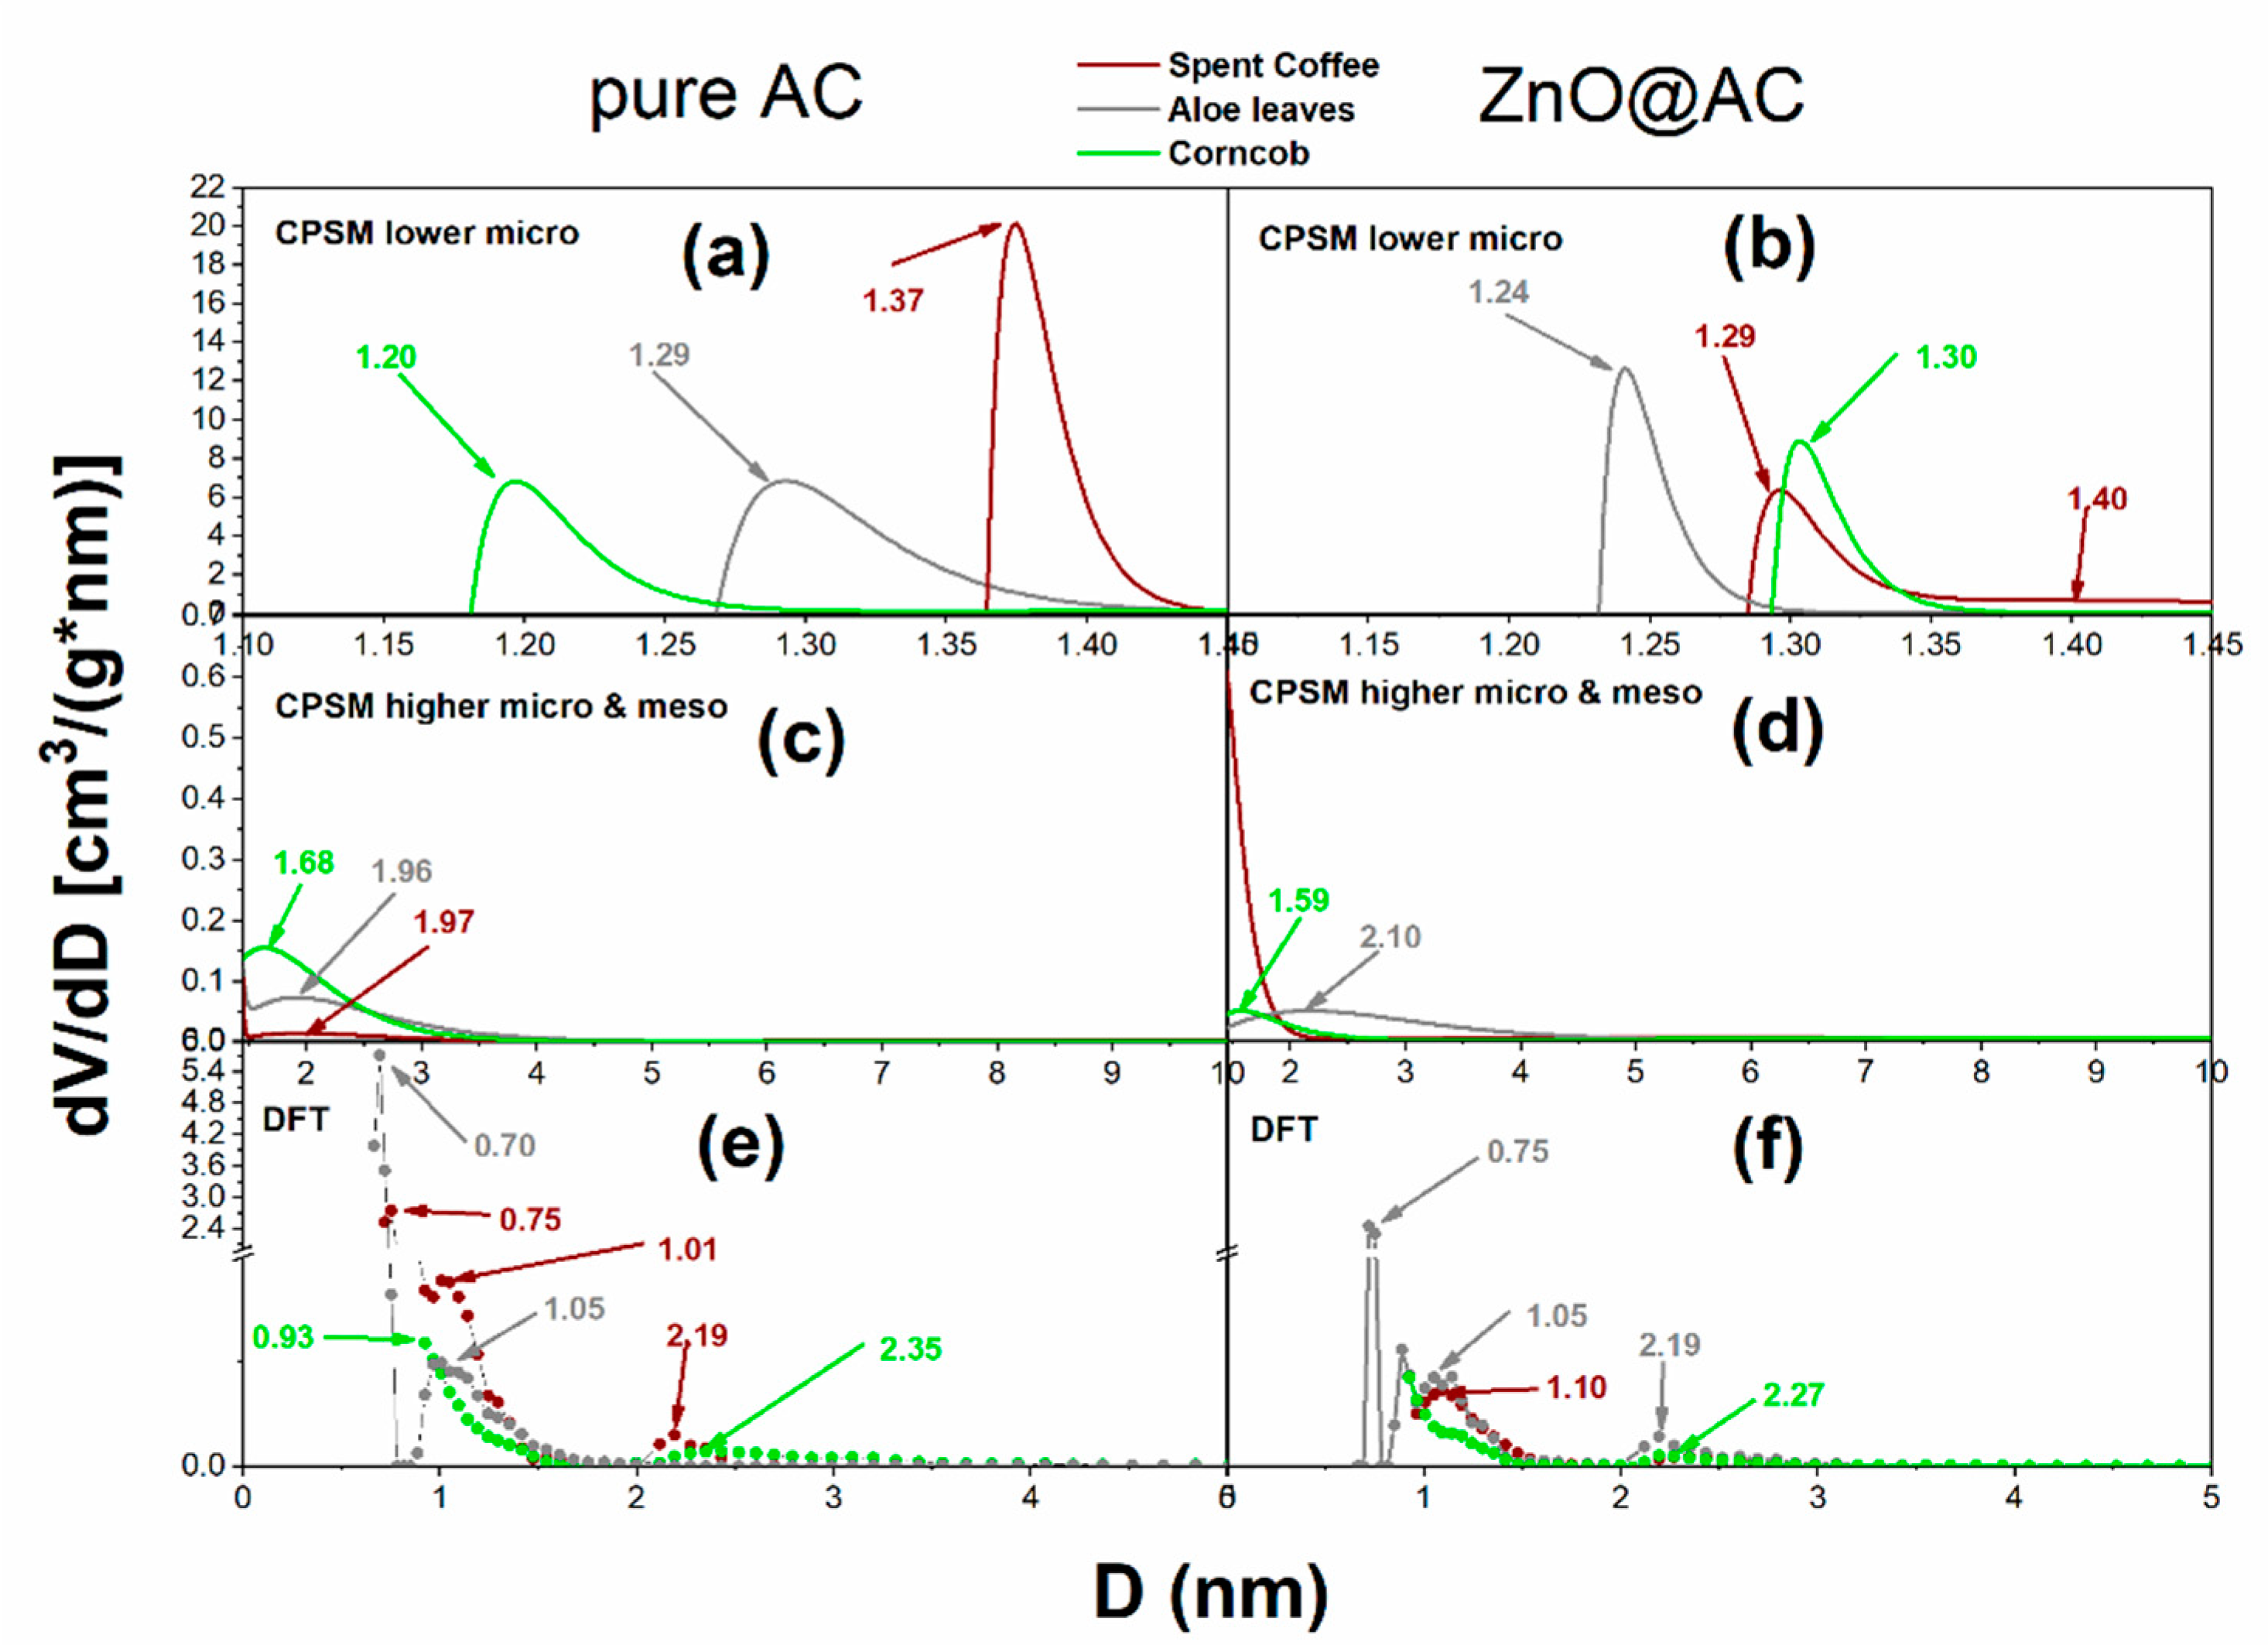
The N2 adsorption-desorption isotherms were measured to investigate the pore structure properties and porosity of the AC and the Zn@AC composites. The resulted hysteresis loops for all materials as well as the simulation of nitrogen adsorption-desorption process using the CPSM model free code downloaded from [41] are shown in Figure 5. Such results can provide us some first general results. The isotherms of all the materials are type I, showing steep increase in adsorption at low relative pressures (P/P0), suggesting the existence of a mainly microporous structure [42]. There is a significant decrease of the total sorbed volume in the isotherms of Zn@AC composites, in comparison with the corresponding AC matrices. However, the isotherm’s shape which remains similar, suggests that ZnO nanoparticles did not significantly alter the textural properties of the materials and are well-dispersed within the porous framework [24]. For more detail information CPSM and DFT pore size distributions were obtained and presented in Figure 4. It is obvious from this Figure that the two methods indicated lower micropores in the range of 1-1.5 nm. The ZnO addition seems to block slightly the very low micropores while new microporosity is formed due to the ZnO lay down in mesopore and higher micropore structure and the relevant diameters were reduced. This could be probably an explanation for the shift of corncob microporous distribution peak from the 1.20 nm for pure AC to 1.30 nm to ZnO@AC composite. Also, the same explanation could be fit to the aloe material for the shift of the microporous distribution peak from the 1.29 nm for pure AC to 1.24 nm for ZnO@AC and to the spent coffee material for the shift of the microporous distribution peak from the 1.37 nm for pure AC to 1.29 nm for ZnO@AC. This hypothesis is also supported by the higher micropores peak shift which is presented in Figure 6(c) and Figure 6(d).
Numerical details for pore specific surface area according to BET, Langmuir, and CPSM model are presented in Table 1. The negative CBET values indicates a strong effect of the microporosity to BET specific surface area calculation. This was expected because of the strong pore curvature effect in such cases which is explained in detail in literature[43] where calculations shown that BET underestimates the specific surface close to 100%. Thus, in our case herein the values of Langmuir and CPSM specific surface seems to be more realistic.
It is obvious from Table 1 that in all cases the underestimated specific surface areas according to the BET equation were around 1000-1100 m2/g when the real values seem to be around 1350-1600 m2/g. The ZnO addition in the AC matrix mostly affected the corncob derived porous carbon and least the aloe leaves derived porous carbon. Although in the case of pure AC the higher specific surface area belongs to spent coffee derived matrix, in the case of composites it belongs to aloe leaves.
The micropore fraction as well as the mean pore diameter in low microporous region and the total pore volume of all the tested materials are presented in Table 2. Micropore fraction was estimated via two independent models i.e., the Dubinin-Radushkevich and the CPSM model. It is obvious from such values that the main portion of the pores is microporous while according to Figure 4(c) and 4(d) a very small fraction is mesoporous. Furthermore, according to hysteresis loops of Figure 3 there is an extremely small fraction of macropores. The combination of these three observations could be supported by the hierarchicity of the activated carbons which is reported extensively in literature [44,45,46]. Finally, the mean values of low micropores (i.e., from 1.0 nm to 1.5 nm) diameter is around to 1.30 nm for all cases.

3.5. SEM-EDS images analysis of pure AC and ZnO@AC composites

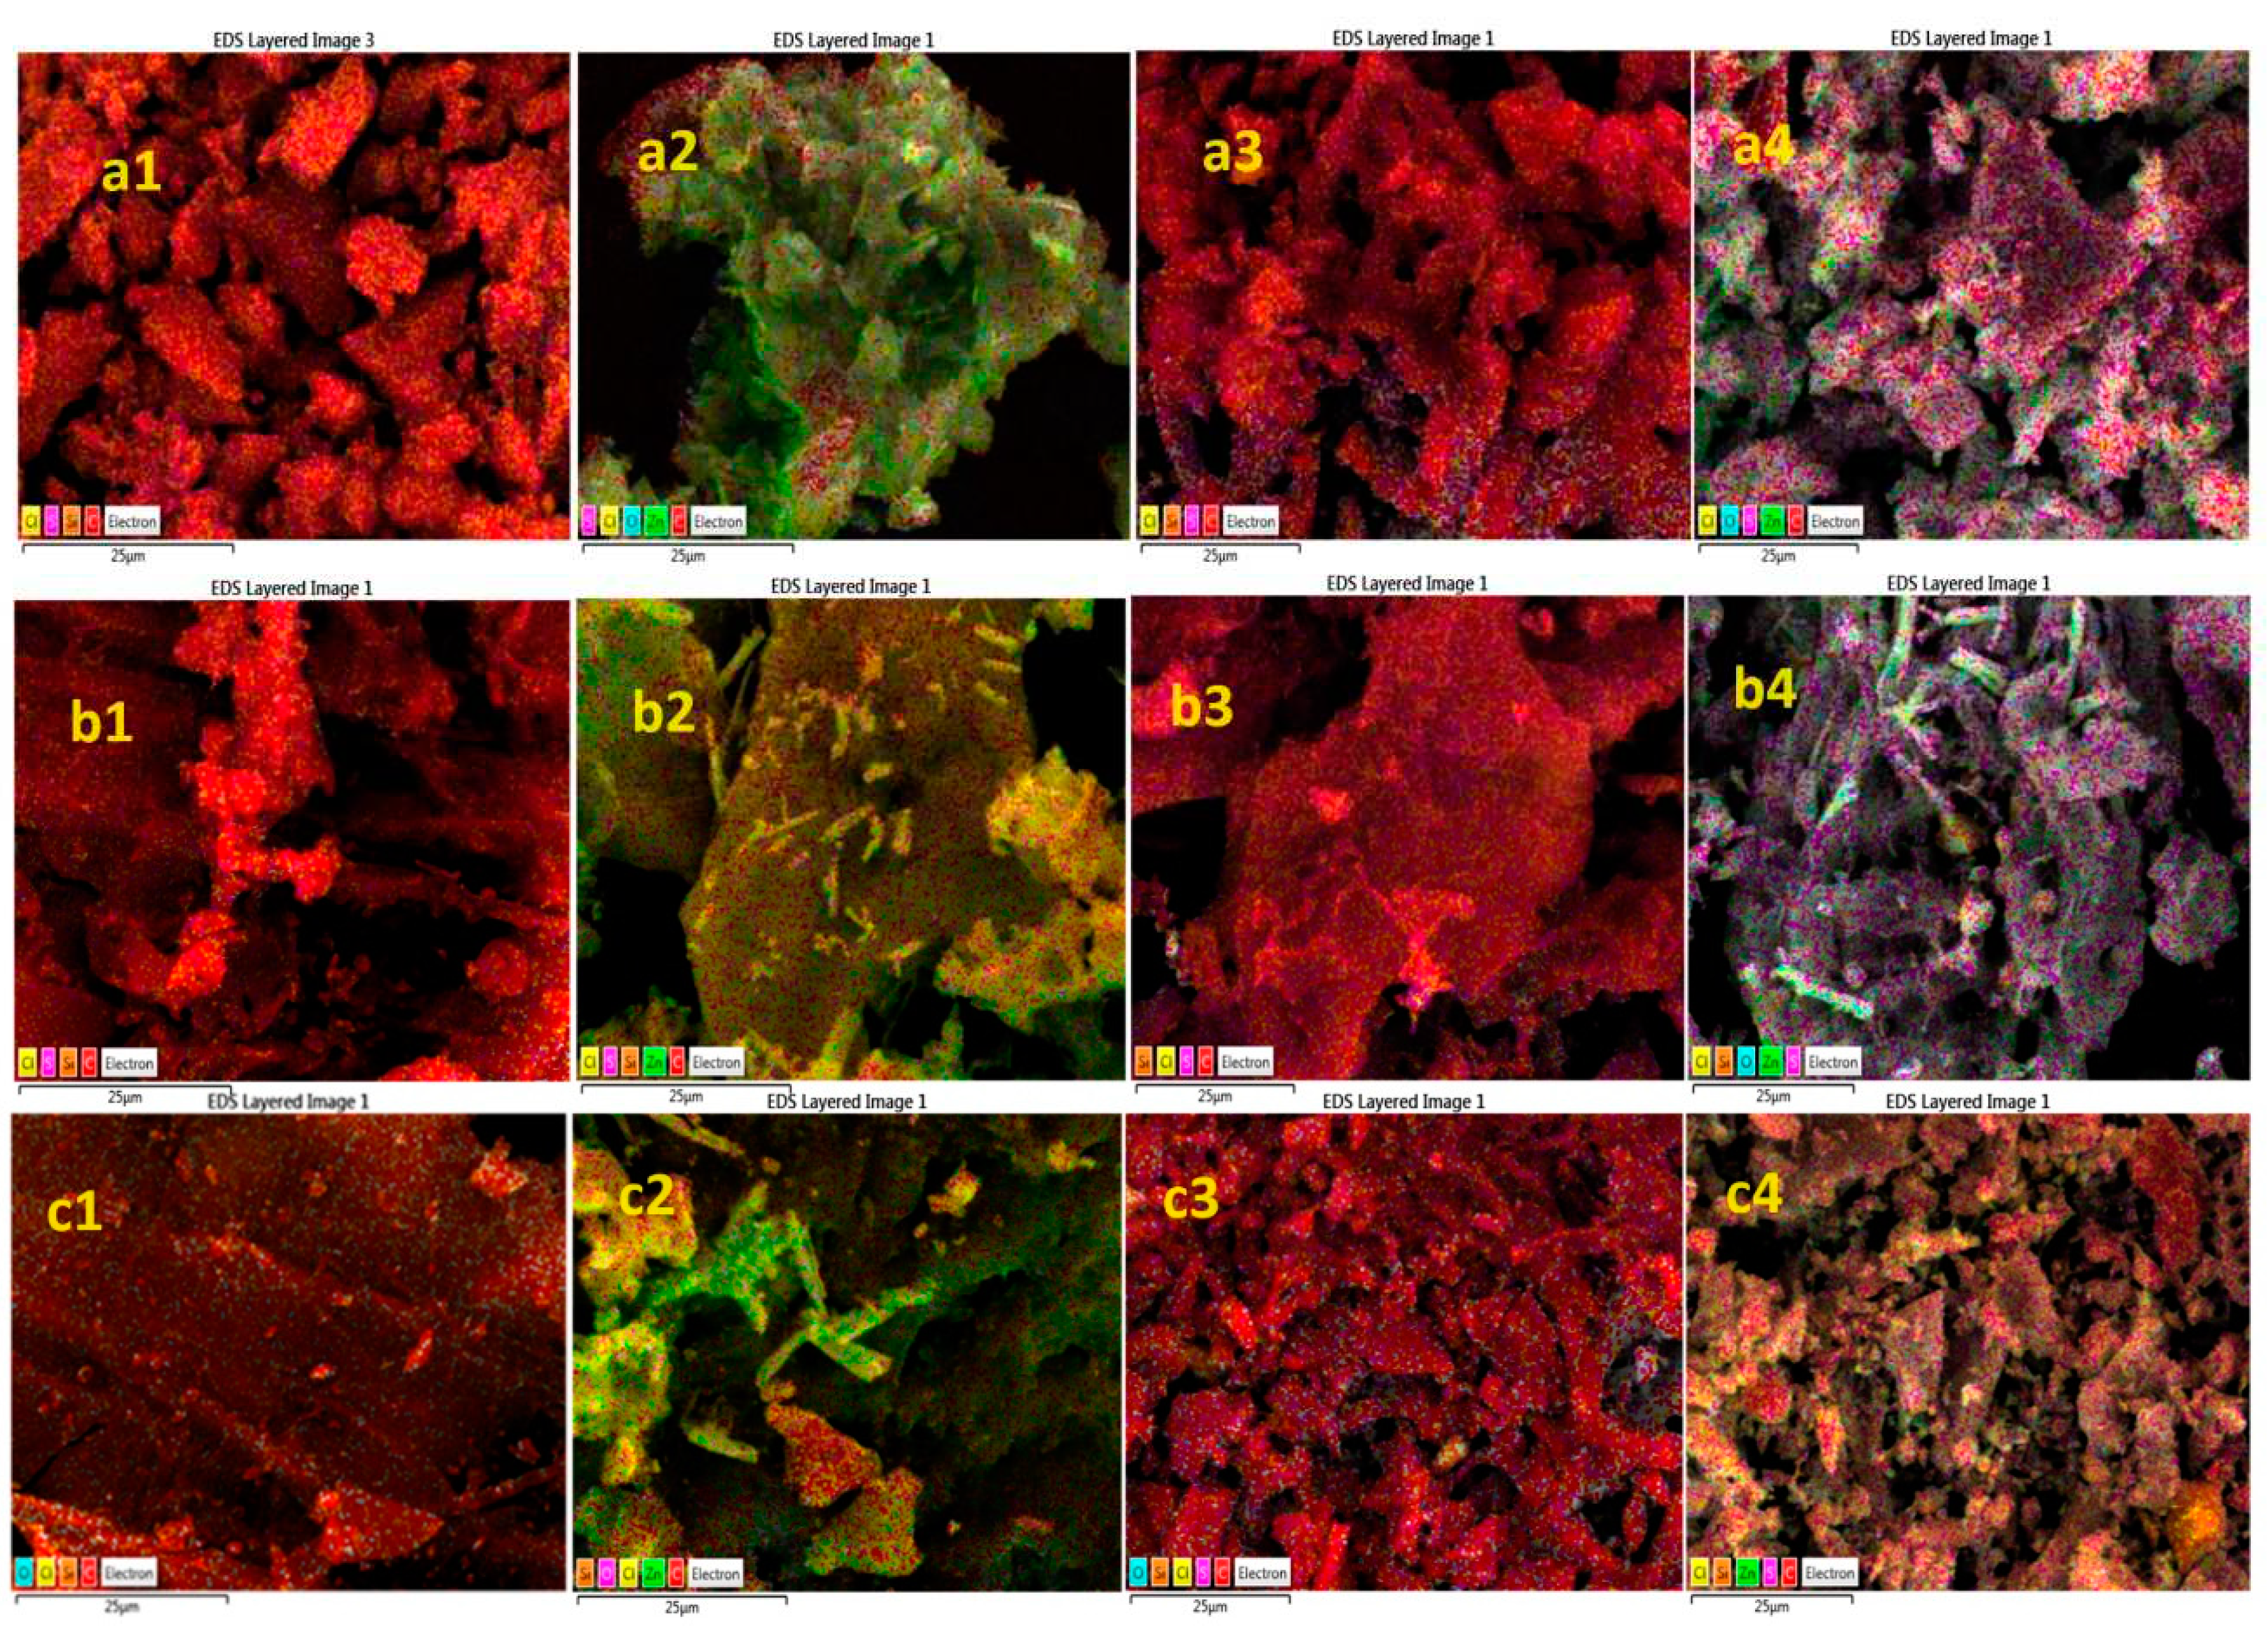
Figure 7 shows SEM-EDS elemental mapping images from the AC matrices and ZnO@AC composites, before and after the H2S sorption process while Figure S1 displays the corresponding SEM images. It is obvious qualitatively from the change of color of Figure 7 columns 1(pure) and 2(composite) that the ZnO (green-yellow color) was spread homogeneously on the surface and inside the pores of the AC matrix. From the same figure, from columns 4(composite), we can observe that the sulfur (purple color) is much more abundant on composite materials surface compared to the relevant from columns 3 of pure AC. Thus, the composites were far more active for H2S removal compared to the pure AC probably because of the chemical reaction equation (1). Finally, from a4 and b4 images, spent coffee and aloe leaves composites ZnO@AC seems to be the most active materials.
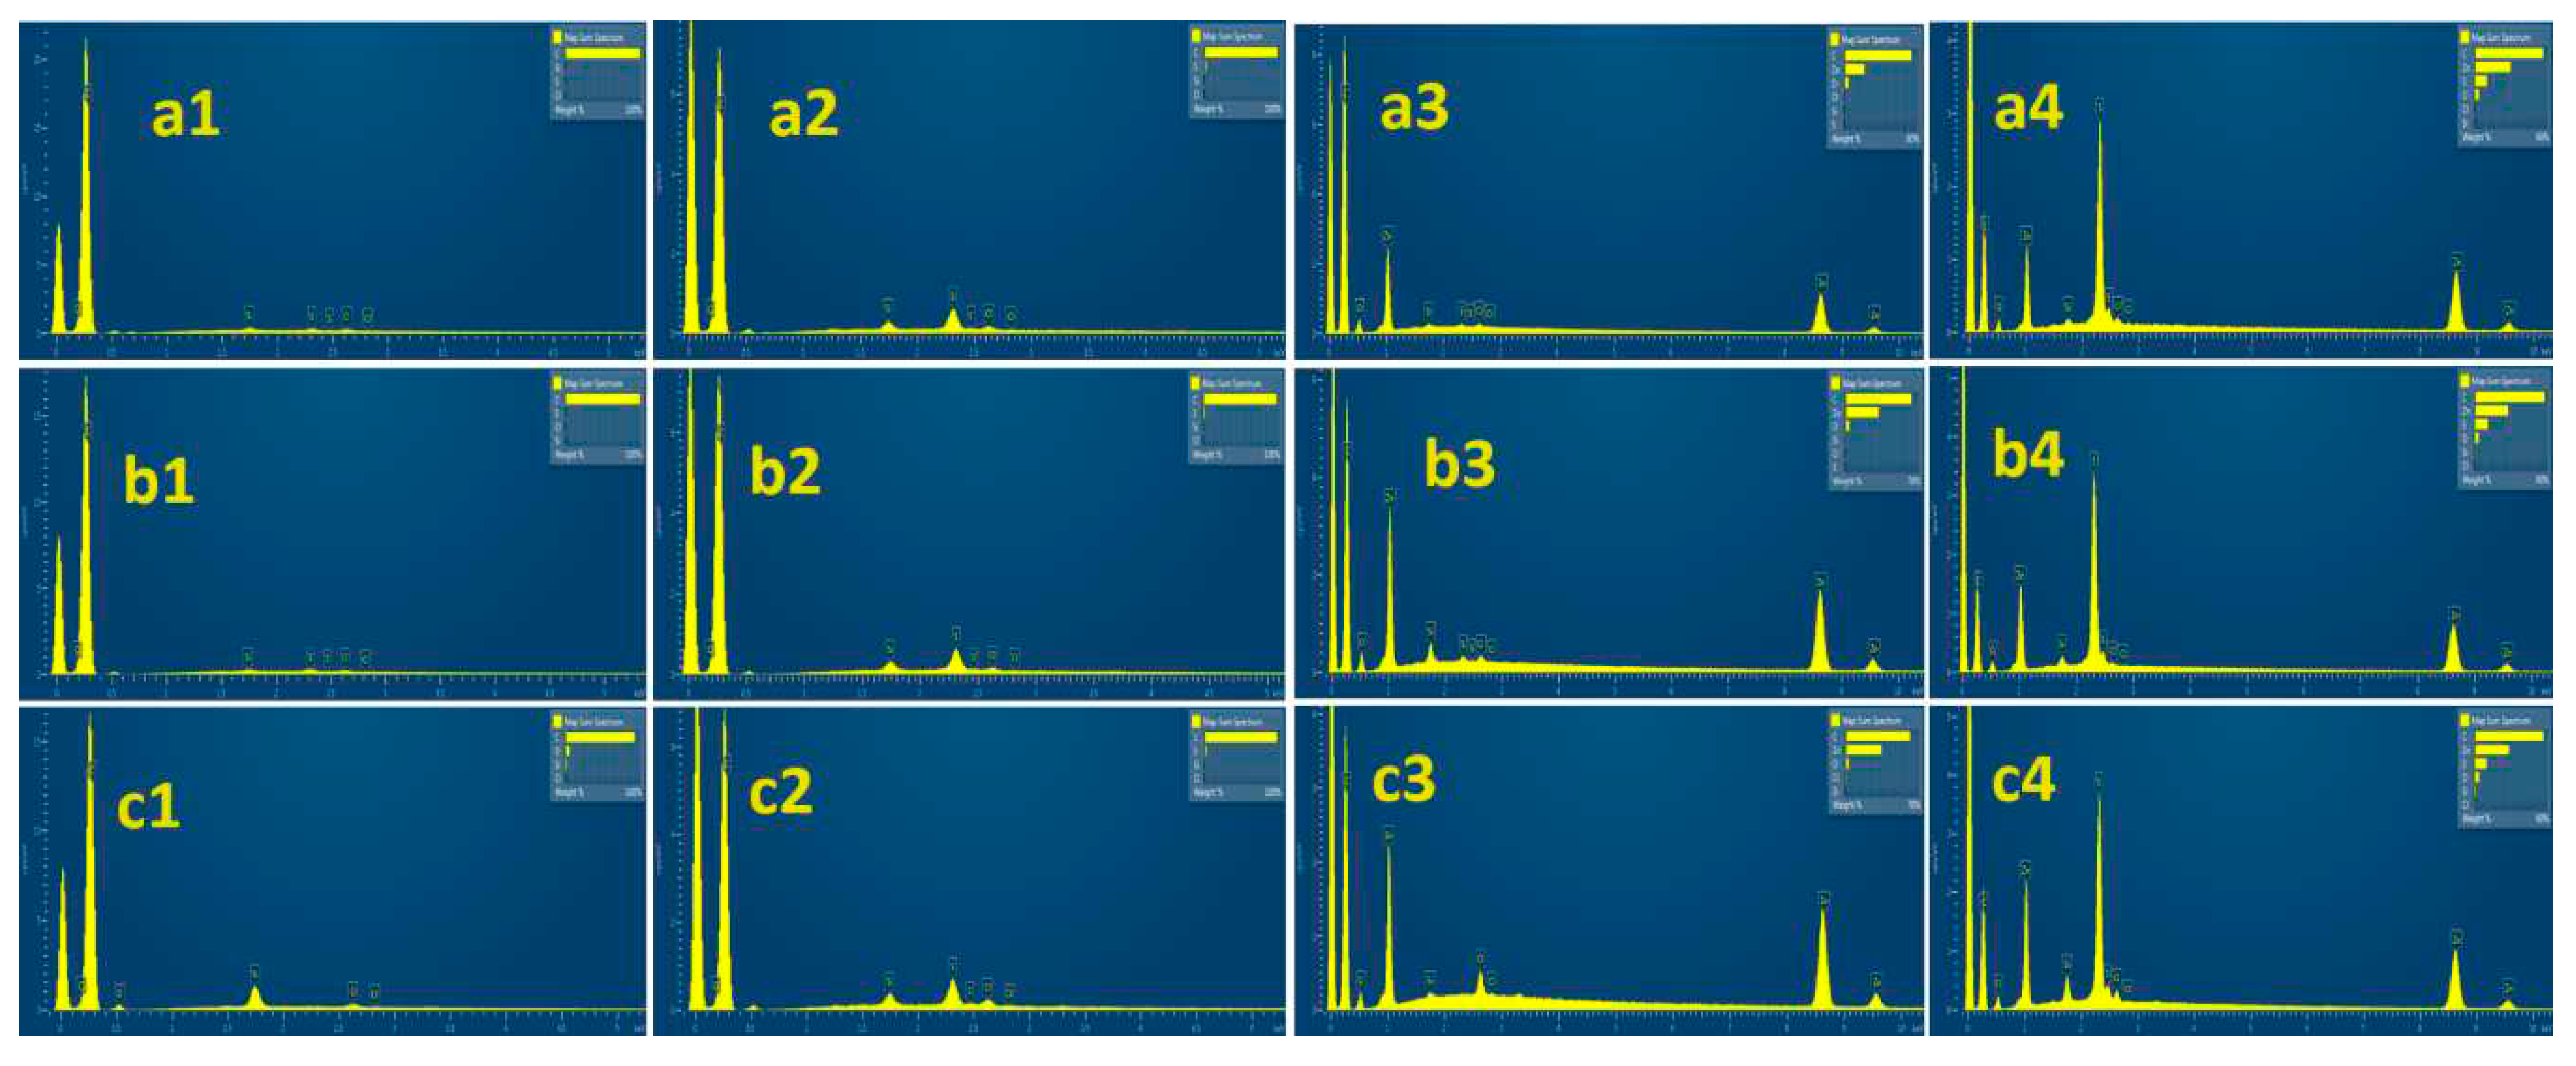
These results are also supported by the EDS spectrum presented quantitatively in Figure 8. It is obvious columns 1(pure before) and 3(composite before) that no sulfur exists in materials before the H2S removal process. It is also obvious from columns 2(pure after) and 4(composite after) that all materials exhibit an activity on H2S removal process more or less. According to inset images, pure AC materials clearly exhibit lower sulfur concentration compared to AC composites. Thus, it is confirmed that ZnO@AC composite materials are more active compared to pure AC materials.
Table 3 reports the EDS analysis values of the % wt. presence on materials surface area. It is shown by the differences between fresh and used materials, that sorption and probably chemical reaction processes occur in all cases. Furthermore, despite the fact that, according to Table 1, the addition of ZnO decreases the pore surface area, the H2S removal activity is enhanced by this addition and aloe leaves originated composite was the most active.

3.6. Hydrogen sulfide (H2S) removal experiments

Hydrogen sulfide sorption experiments were carried out using a handmade apparatus described in section 2.5. Measurements were treated with equations 2 to 6 and the total sorption capacity of each sample was calculated and presented in Table 4. All AC matrixes were prepared and activated via a pyrolysis process, using KOH as activator, and under identical conditions. All ZnO@AC composites were developed via a melt-intrusion process under exactly the same conditions again. The sorption experiments were executed at ambient conditions of temperature and pressure.
Considering the column %yield, which refer to the % yield of AC using an amount of initial biomass, it is shown that corncob was the most productive source for AC. Aloe leaves was the least productive biomass probably because of the gel content which produces more gasses. Considering Table 1, the arrangement according to the specific surface area for the three sources, was almost in reverse order compared to the %yield. Moreover, the H2S removal capacity of the pure AC originated from the corncob source is a little higher than the relevant of the spent coffee. The highest is that of pure AC produced from Aloe leaves. When the porous carbon matrixes were impregnated with Zn salt and the composites ZnO@AC were formed, the composite originated from Aloe leaves was again the most active material for H2S removal. The total capacity of 106 mgH2S/gads. is higher than values referred to other activated carbons and different types of ZnO composite materials (Table 5).
Also, total capacities of the other two ZnO@AC composites i.e., 66 mgH2S/gads. for spent coffee and 47 mgH2S/gads. for corncob, they are remarkable. Although the specific surface was decreased because of the ZnO presence, this oxide was boosting the AC activity 6.5 times in the case of spent coffee, 5.8 times in the case of aloe leaves, and 3.8 times in the case of corncob. This indicates the presence of the chemical reaction presented in the introduction section as equation (1). It is obvious that the results about H2S removal activity obtained from SEM-EDS analysis agree with the results obtained from sorption experiments. Finally, even though the specific surface area and the pore structure values of the spent coffee and the aloe leaves derived ZnO@AC composites were close, there was a gap between the respective H2S sorption capacities. This observation could be explained assuming different surface chemistry effect.

5. Conclusions

In this study, we successfully synthesized and characterized biomass derived pure AC and ZnO@AC composites from three different biomass sources for efficient H2S removal. Using spent coffee, Aloe-Vera waste leaves, and corncob as biomass sources, three different activated carbon matrices were obtained by pyrolysis and chemical activation process. Their ZnO@AC composites were also synthesized, and all the prepared materials exhibited mainly microporous structure with high specific surface area values. XRD results revealed the formation of crystalline zinc oxide particles inside the pore structure with average crystallite size 11, 8.3 and 13.4 nm for ZnO@AC derived from spent coffee, aloe leaves and corncob respectively. The H2S sorption measurements were confirmed the results of the SEM-EDS analysis that the presence of ZnO significantly enhanced the material activity during this process. Moreover, from the overall study we can conclude that surface chemistry of materials plays a key role in this process.
Overall, the proposed biomass derived ZnO@AC composites, seems to be a very promising cost-effective and eco-friendly solution for H2S removal process and the aloe leaves derived material, with 106 mgH2S/gads. adsorption capacity, was the most functional for this process. Future research should focus on scaling up the production of these composites and exploring their performance under real-world conditions to accelerate their practical implementation.

Supplementary Materials

The following supporting information can be downloaded at the website of this paper posted on Preprints.org. Figure S1: SEM images for pure AC and ZnO@AC composites before and after H2S removal process.

Author Contributions

Conceptualization, C.E.S. and M.A.K.; methodology, M.B., C.E.S. and M.A.K.; validation, C.E.S.; formal analysis, M.B. and C.E.S.; investigation, A.G., C.G., D.M., A.E.G., A.A. and M.B.; data curation, M.B. and C.E.S.; writing—original draft preparation, M.B., C.E.S. and M.A.K.; supervision, C.E.S. and M.A.K.;. All authors have read and agreed to the published version of the manuscript.”

Data Availability Statement

The data presented in this study are available on request from the corresponding author.

Acknowledgments

We would like to thank Dr. Ch. Papachristodoulou for XRD measurements. This work was co-financed by the European Union and Greek national funds through the Operational Program Competitiveness, Entrepreneurship and Innovation, under the call RESEARCH—CREATE—INNOVATE (acronym: Eco-Bio-H2-FCs; project code: T2EDK-00955).

Conflicts of Interest

The authors declare no conflict of interest.

References

  1. Thomou, E.; Basina, G.; Spyrou, K.; Wahedi, Y.A.; Rudolf, P.; Gournis, D. H2S Removal by Copper Enriched Porous Carbon Cuboids. Carbon Trends 2022, 7, 100145. [Google Scholar] [CrossRef]
  2. Ahmed Daham Wiheeb; Ili Khairunnisa Shamsudin; Mohd Azmier Ahmad; Muhamad Nazri Murat; Jinsoo Kim; Mohd Roslee Othman Present Technologies for Hydrogen Sulfide Removal from Gaseous Mixtures. Reviews in Chemical Engineering 2013, 29, 449–470. [CrossRef]
  3. Georgiadis, A.G.; Charisiou, N.D.; Goula, M.A. Removal of Hydrogen Sulfide From Various Industrial Gases: A Review of The Most Promising Adsorbing Materials. Catalysts 2020, 10. [Google Scholar] [CrossRef]
  4. Vikrant, K.; Kailasa, S.K.; Tsang, D.C.W.; Lee, S.S.; Kumar, P.; Giri, B.S.; Singh, R.S.; Kim, K.-H. Biofiltration of Hydrogen Sulfide: Trends and Challenges. Journal of Cleaner Production 2018, 187, 131–147. [Google Scholar] [CrossRef]
  5. Pudi, A.; Rezaei, M.; Signorini, V.; Andersson, M.P.; Baschetti, M.G.; Mansouri, S.S. Hydrogen Sulfide Capture and Removal Technologies: A Comprehensive Review of Recent Developments and Emerging Trends. Separation and Purification Technology 2022, 298, 121448. [Google Scholar] [CrossRef]
  6. Khabazipour, M.; Anbia, M. Removal of Hydrogen Sulfide from Gas Streams Using Porous Materials: A Review. Ind. Eng. Chem. Res. 2019, 58, 22133–22164. [Google Scholar] [CrossRef]
  7. Zulkefli, N.N.; Noor Azam, A.M.; Masdar, M.S.; Isahak, W.N. Adsorption–Desorption Behavior of Hydrogen Sulfide Capture on a Modified Activated Carbon Surface. Materials 2023, 16. [Google Scholar] [CrossRef]
  8. Bashkova, S.; Baker, F.S.; Wu, X.; Armstrong, T.R.; Schwartz, V. Activated Carbon Catalyst for Selective Oxidation of Hydrogen Sulphide: On the Influence of Pore Structure, Surface Characteristics, and Catalytically-Active Nitrogen. Carbon 2007, 45, 1354–1363. [Google Scholar] [CrossRef]
  9. Sawalha, H.; Maghalseh, M.; Qutaina, J.; Junaidi, K.; Rene, E.R. Removal of Hydrogen Sulfide from Biogas Using Activated Carbon Synthesized from Different Locally Available Biomass Wastes - a Case Study from Palestine. Bioengineered 2020, 11, 607–618. [Google Scholar] [CrossRef]
  10. Rambabu, N.; Azargohar, R.; Dalai, A.K.; Adjaye, J. Evaluation and Comparison of Enrichment Efficiency of Physical/Chemical Activations and Functionalized Activated Carbons Derived from Fluid Petroleum Coke for Environmental Applications. Fuel Processing Technology 2013, 106, 501–510. [Google Scholar] [CrossRef]
  11. Mochizuki, T.; Kubota, M.; Matsuda, H.; D’Elia Camacho, L.F. Adsorption Behaviors of Ammonia and Hydrogen Sulfide on Activated Carbon Prepared from Petroleum Coke by KOH Chemical Activation. Fuel Processing Technology 2016, 144, 164–169. [Google Scholar] [CrossRef]
  12. Nam, H.; Wang, S.; Jeong, H.-R. TMA and H2S Gas Removals Using Metal Loaded on Rice Husk Activated Carbon for Indoor Air Purification. Fuel 2018, 213, 186–194. [Google Scholar] [CrossRef]
  13. Kazmierczak-Razna, J.; Gralak-Podemska, B.; Nowicki, P.; Pietrzak, R. The Use of Microwave Radiation for Obtaining Activated Carbons from Sawdust and Their Potential Application in Removal of NO2 and H2S. Chemical Engineering Journal 2015, 269, 352–358. [Google Scholar] [CrossRef]
  14. de Oliveira, L.H.; Meneguin, J.G.; Pereira, M.V.; do Nascimento, J.F.; Arroyo, P.A. Adsorption of Hydrogen Sulfide, Carbon Dioxide, Methane, and Their Mixtures on Activated Carbon. Chemical Engineering Communications 2019, 206, 1533–1553. [Google Scholar] [CrossRef]
  15. Chen, Y.; Ma, C.; Wu, Y.; Ke, C.; Liu, X.; Wang, J.; Qiao, W.; Ling, L. Efficient Removal of H2S with Zinc Oxide/Nitrogen-Doped Ordered Mesoporous Carbons at Room Temperature. Microporous and Mesoporous Materials 2022, 333, 111712. [Google Scholar] [CrossRef]
  16. Elyassi, B.; Wahedi, Y.A.; Rajabbeigi, N.; Kumar, P.; Jeong, J.S.; Zhang, X.; Kumar, P.; Balasubramanian, V.V.; Katsiotis, M.S.; Andre Mkhoyan, K.; et al. A High-Performance Adsorbent for Hydrogen Sulfide Removal. Microporous and Mesoporous Materials 2014, 190, 152–155. [Google Scholar] [CrossRef]
  17. Wang, L.-J.; Fan, H.-L.; Shangguan, J.; Croiset, E.; Chen, Z.; Wang, H.; Mi, J. Design of a Sorbent to Enhance Reactive Adsorption of Hydrogen Sulfide. ACS Appl. Mater. Interfaces 2014, 6, 21167–21177. [Google Scholar] [CrossRef] [PubMed]
  18. Karvan, O.; Atakül, H. Investigation of CuO/Mesoporous SBA-15 Sorbents for Hot Gas Desulfurization. Fuel Processing Technology 2008, 89, 908–915. [Google Scholar] [CrossRef]
  19. Yang, J.H. Hydrogen Sulfide Removal Technology: A Focused Review on Adsorption and Catalytic Oxidation. Korean J. Chem. Eng. 2021, 38, 674–691. [Google Scholar] [CrossRef]
  20. Portela, R.; Rubio-Marcos, F.; Leret, P.; Fernández, J.F.; Bañares, M.A.; Ávila, P. Nanostructured ZnO/Sepiolite Monolithic Sorbents for H2S Removal. J. Mater. Chem. A 2014, 3, 1306–1316. [Google Scholar] [CrossRef]
  21. Samokhvalov, A.; Tatarchuk, B.J. Characterization of Active Sites, Determination of Mechanisms of H2S, COS and CS2 Sorption and Regeneration of ZnO Low-Temperature Sorbents: Past, Current and Perspectives. Physical Chemistry Chemical Physics 2011, 13, 3197–3209. [Google Scholar] [CrossRef] [PubMed]
  22. Awume, B.; Tajallipour, M.; Nemati, M.; Predicala, B. Application of ZnO Nanoparticles in Control of H2S Emission from Low-Temperature Gases and Swine Manure Gas. Water, Air, & Soil Pollution 2017, 228, 147. [Google Scholar] [CrossRef]
  23. Hernández, S.P.; Chiappero, M.; Russo, N.; Fino, D. A Novel ZnO-Based Adsorbent for Biogas Purification in H2 Production Systems. Chemical Engineering Journal 2011, 176–177, 272–279. [Google Scholar] [CrossRef]
  24. Yang, C.; Yang, S.; Fan, H.; Wang, Y.; Shangguan, J. Tuning the ZnO-Activated Carbon Interaction through Nitrogen Modification for Enhancing the H2S Removal Capacity. Journal of Colloid and Interface Science 2019, 555, 548–557. [Google Scholar] [CrossRef]
  25. Geng, Q.; Wang, L.-J.; Yang, C.; Zhang, H.-Y.; Zhao, Y.-R.; Fan, H.-L.; Huo, C. Room-Temperature Hydrogen Sulfide Removal with Zinc Oxide Nanoparticle/Molecular Sieve Prepared by Melt Infiltration. Fuel Processing Technology 2019, 185, 26–37. [Google Scholar] [CrossRef]
  26. Brunauer, S.; Emmett, P.H.; Teller, E. Adsorption of Gases in Multimolecular Layers. 1938, 60, 11. 60.
  27. Androutsopoulos, G.P.; Salmas, C.E. A New Model for Capillary Condensation−Evaporation Hysteresis Based on a Random Corrugated Pore Structure Concept: Prediction of Intrinsic Pore Size Distributions. 1. Model Formulation. Industrial & Engineering Chemistry Research 2000, 39, 3747–3763. [Google Scholar] [CrossRef]
  28. Androutsopoulos, G.P.; Salmas, C.E. A New Model for Capillary Condensation−Evaporation Hysteresis Based on a Random Corrugated Pore Structure Concept: Prediction of Intrinsic Pore Size Distribution. 2. Model Application. Industrial & Engineering Chemistry Research 2000, 39, 3764–3777. [Google Scholar] [CrossRef]
  29. Dombrowski, R.J.; Hyduke, D.R.; Lastoskie, C.M. Pore Size Analysis of Activated Carbons from Argon and Nitrogen Porosimetry Using Density Functional Theory. 10.
  30. Salmas, C.E.; Androutsopoulos, G.P. Preparation and Characterization of Anodic Aluminum Oxide Films Exhibiting Microporosity. Chemical Engineering Communications 2008, 196, 407–442. [Google Scholar] [CrossRef]
  31. Marsh, H.; Rand, B. The Characterization of Microporous Carbons by Means of the Dubinin-Radushkevich Equation. Journal of Colloid and Interface Science 1970, 33, 101–116. [Google Scholar] [CrossRef]
  32. Scherrer, P. Nachrichten von Der Gesellschaft Der Wissenschaften Zu Göttingen. Göttinger Nachrichten Math. Phys. 1918, 2, 98–100. [Google Scholar]
  33. Patterson, A.L. The Scherrer Formula for X-Ray Particle Size Determination. Phys. Rev. 1939, 56, 978–982. [Google Scholar] [CrossRef]
  34. Daffalla, S.; Mukhtar, H.; Shaharun, M. Properties of Activated Carbon Prepared from Rice Husk with Chemical Activation. Int. J. of Global Environmental Issues 2012, 12, 107–129. [Google Scholar] [CrossRef]
  35. Baikousi, M.; Georgiou, Y.; Daikopoulos, C.; Bourlinos, A.B.; Filip, J.; Zbořil, R.; Deligiannakis, Y.; Karakassides, M.A. Synthesis and Characterization of Robust Zero Valent Iron/Mesoporous Carbon Composites and Their Applications in Arsenic Removal. Carbon 2015, 93, 636–647. [Google Scholar] [CrossRef]
  36. Altıntıg, E.; Yenigun, M.; Sarı, A.; Altundag, H.; Tuzen, M.; Saleh, T.A. Facile Synthesis of Zinc Oxide Nanoparticles Loaded Activated Carbon as an Eco-Friendly Adsorbent for Ultra-Removal of Malachite Green from Water. Environmental Technology & Innovation 2021, 21, 101305. [Google Scholar] [CrossRef]
  37. Fan, B.; Guo, H.; Shi, J.; Shi, C.; Jia, Y.; Wang, H.; Chen, D.; Yang, Y.; Lu, H.; Xu, H.; et al. Facile One-Pot Preparation of Silver/Reduced Graphene Oxide Nanocomposite for Cancer Photodynamic and Photothermal Therapy. Journal of Nanoscience and Nanotechnology 2016, 16, 7049–7054. [Google Scholar] [CrossRef]
  38. Rochman, R.; Wahyuningsih, S.; Ramelan, A.; Hanif, Q. Preparation of Nitrogen and Sulphur Co-Doped Reduced Graphene Oxide (rGO-NS) Using N and S Heteroatom of Thiourea. IOP Conference Series: Materials Science and Engineering 2019, 509, 012119. [Google Scholar] [CrossRef]
  39. Chunlan, L.; Shaoping, X.; Yixiong, G.; Shuqin, L.; Changhou, L. Effect of Pre-Carbonization of Petroleum Cokes on Chemical Activation Process with KOH. Carbon 2005, 43, 2295–2301. [Google Scholar] [CrossRef]
  40. Handore, K.; Bhavsar, S.; Horne, A.; Chhattise, P.; Mohite, K.; Ambekar, J.; Pande, N.; Chabukswar, V. Novel Green Route of Synthesis of ZnO Nanoparticles by Using Natural Biodegradable Polymer and Its Application as a Catalyst for Oxidation of Aldehydes. Journal of Macromolecular Science Part A Pure and Applied Chemistry 2014, 51, 941. [Google Scholar] [CrossRef]
  41. Salmas, C.E. DOWNLOADS, CPSM_Nitrogen Available online: http://users.uoi.gr/ksalmas/.
  42. Thommes, M.; Kaneko, K.; Neimark, A.V.; Olivier, J.P.; Rodriguez-Reinoso, F.; Rouquerol, J.; Sing, K.S.W. Physisorption of Gases, with Special Reference to the Evaluation of Surface Area and Pore Size Distribution (IUPAC Technical Report). Pure and Applied Chemistry 2015, 87, 1051–1069. [Google Scholar] [CrossRef]
  43. Salmas, C.E.; Androutsopoulos, G.P. Rigid Sphere Molecular Model Enables an Assessment of the Pore Curvature Effect upon Realistic Evaluations of Surface Areas of Mesoporous and Microporous Materials. Langmuir 2005, 21, 11146–11160. [Google Scholar] [CrossRef]
  44. Surya, K.; Michael, M.S. Hierarchical Porous Activated Carbon Prepared from Biowaste of Lemon Peel for Electrochemical Double Layer Capacitors. Biomass and Bioenergy 2021, 152, 106175. [Google Scholar] [CrossRef]
  45. Ding, Y.; Qi, J.; Hou, R.; Liu, B.; Yao, S.; Lang, J.; Chen, J.; Yang, B. Preparation of High-Performance Hierarchical Porous Activated Carbon via a Multistep Physical Activation Method for Supercapacitors. Energy Fuels 2022, 36, 5456–5464. [Google Scholar] [CrossRef]
  46. Wei, H.; Wang, H.; Li, A.; Li, H.; Cui, D.; Dong, M.; Lin, J.; Fan, J.; Zhang, J.; Hou, H.; et al. Advanced Porous Hierarchical Activated Carbon Derived from Agricultural Wastes toward High Performance Supercapacitors. Journal of Alloys and Compounds 2020, 820, 153111. [Google Scholar] [CrossRef]
  47. Hussain, M.; Abbas, N.; Fino, D.; Russo, N. Novel Mesoporous Silica Supported ZnO Adsorbents for the Desulphurization of Biogas at Low Temperatures. Chemical Engineering Journal 2012, 188. [Google Scholar] [CrossRef]
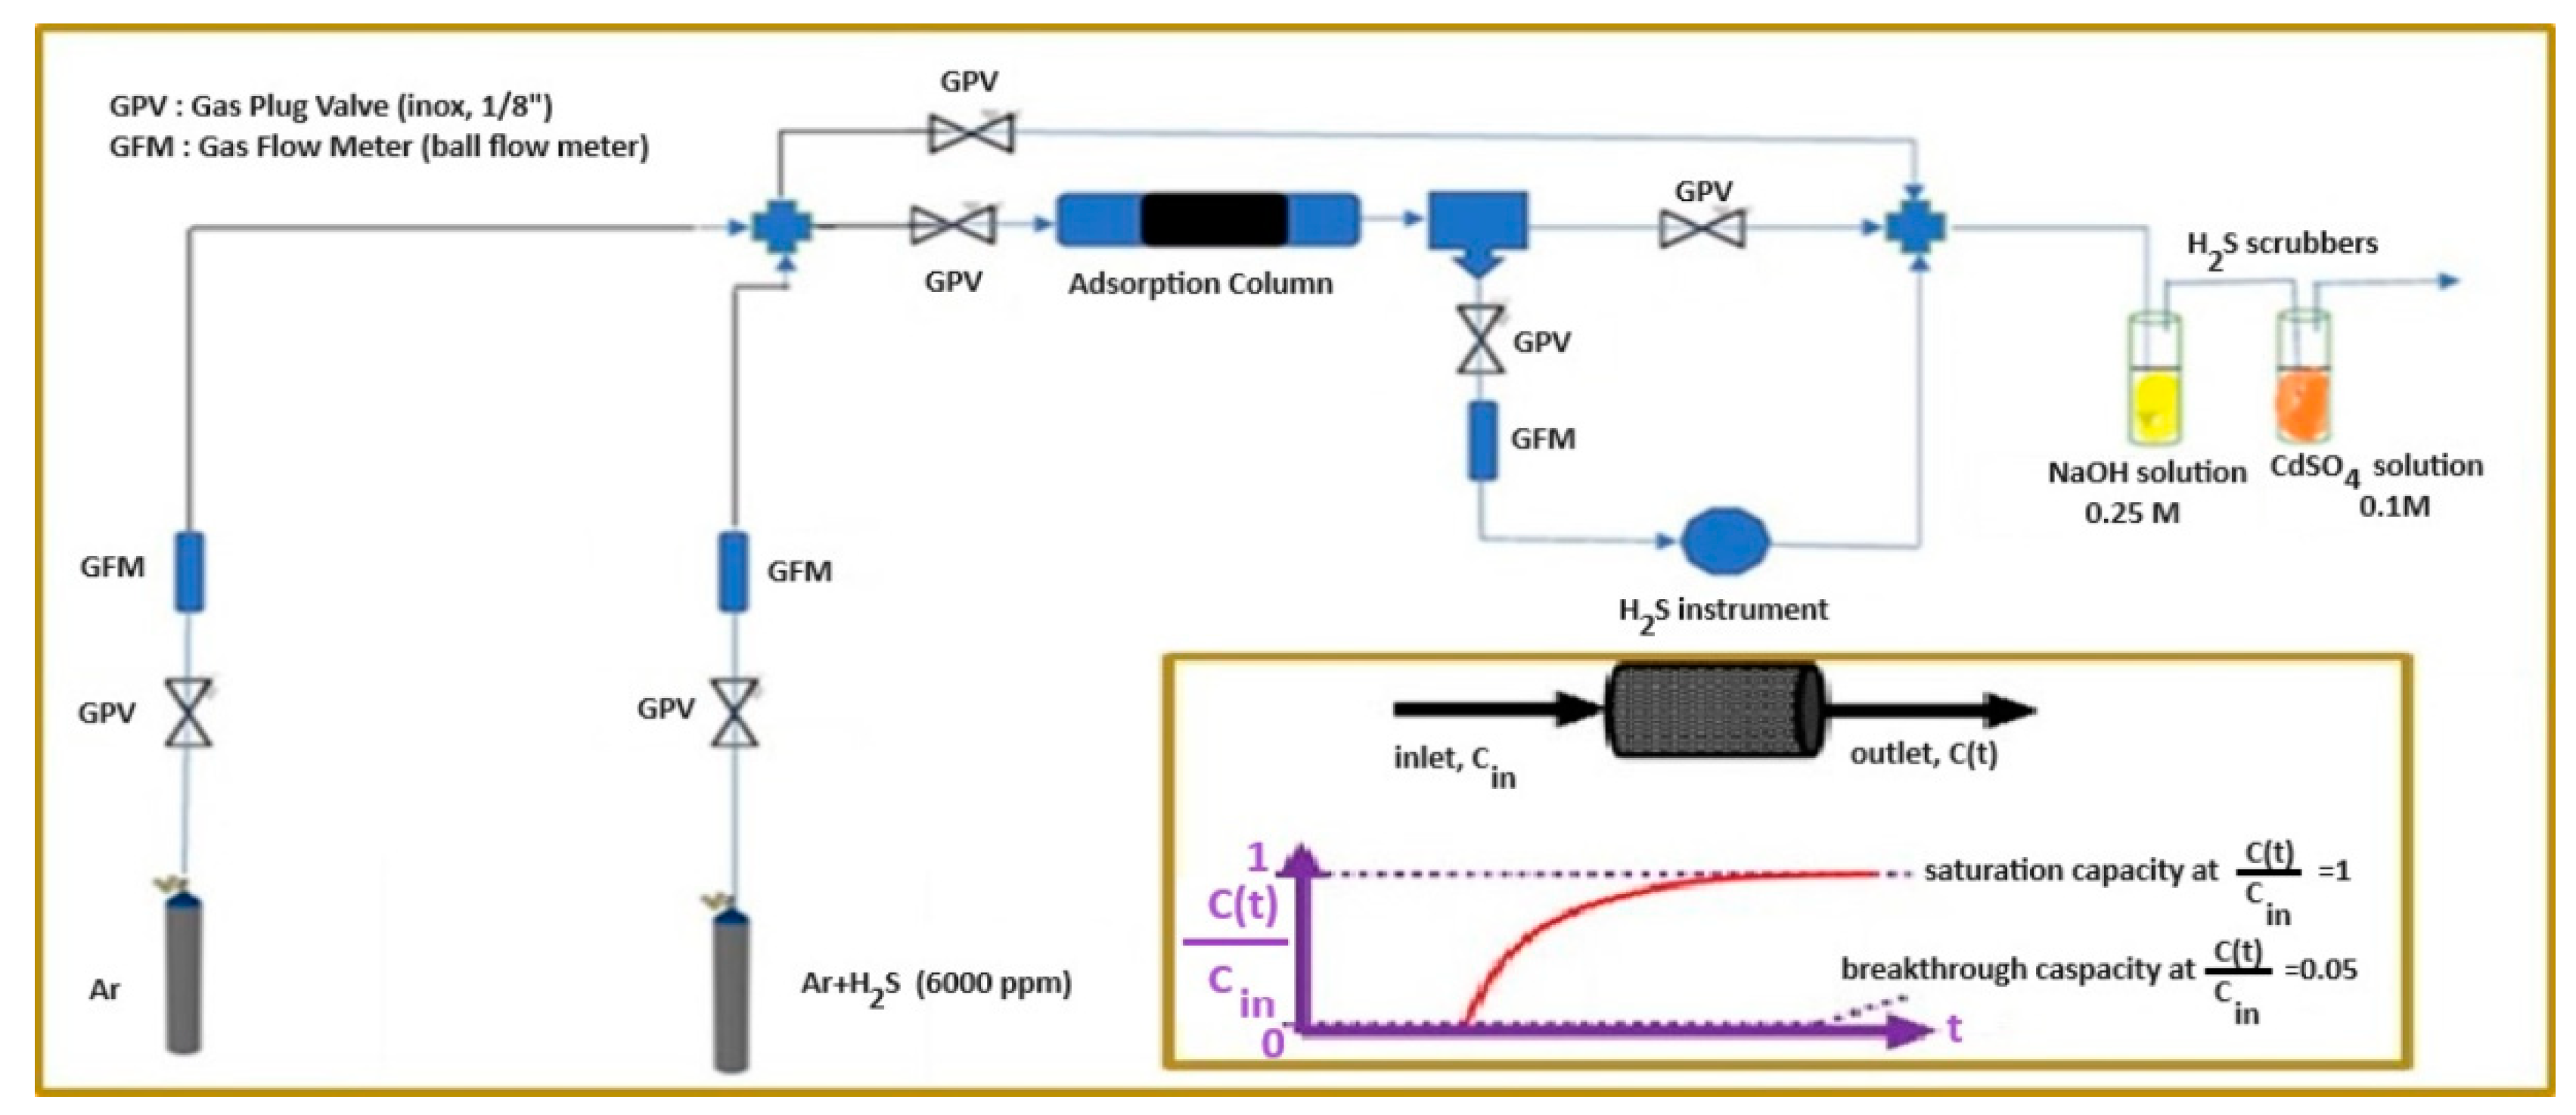
Figure 1. Handmade apparatus for H2S adsorption measurements using an artificial H2S+Ar gas mixture of 6000 ppm. Inset figure is a graphical representation of adsorption capacity results after mathematical treatment.
Preprints 87017 g001
Figure 2. XRD patterns of ZnO@AC composites in comparison with the corresponding patterns of raw activated carbon matrices (inset figure).
Preprints 87017 g002
Figure 3. Comparison of FT-IR spectra curves of pure AC and ZnO@AC composites.
Preprints 87017 g003
Figure 4. Comparison of TG% curves of pure AC and ZnO@AC composites.
Preprints 87017 g004
Figure 5. Nitrogen porosimetry experimental loops (points) of AC originated from different biomass sources i.e., spent coffee, aloe leaves, and corncob, and the relevant CPSM simulation (continuous line) (a) before melt impregnation with Zn salt (b) after melt impregnation with Zn salt.
Preprints 87017 g005
Figure 6. Pore volume distributions, according to CPSM and DFT models, for AC (left hand) and ZnO@AC composites (right hand), derived from different biomass sources. activated carbon composite materials (a), (b) micro- pore region (c), (d) meso pore region (e) DFT pore volume distribution for pure AC (d) DFT pore volume distribution for ZnO@AC composites.
Preprints 87017 g006
Figure 7. SEM-EDS mapping images for pure AC and ZnO@AC composites before and after H2S removal process. (a) spent coffee, (b) aloe leaves, (c) corncob. (1) pure AC before H2S removal process, (2) ZnO@AC composites before H2S removal process, (3) pure AC after H2S removal process, (4) ZnO@AC composites after H2S removal process.
Preprints 87017 g007
Figure 8. EDS quantitative analysis for pure AC and ZnO@AC composites before and after H2S removal process. (a) spent coffee, (b) aloe leaves, (c) corncob. (1) pure AC before H2S removal process, (2) pure AC after H2S removal process, (3) ZnO@AC composites before H2S removal process, (4) ZnO@AC composites after H2S removal process.
Preprints 87017 g008
Table 1. Specific surface areas of activated carbon matrices and ZnO@AC composite materials according to BET, Langmuir, and CPSM model.
Material code Sg(m2/g)
(BET)
CBET Sg(m2/g)
(Lang.)
CLang. Sg(m2/g)
(CPSM)
decreasing ratio
ACsc 1195 -65 1643 288 1653 1.5
ZnO@ACsc 818 -64 1121 241 1132
ACav 1148 -67 1577 256 1594 1.3
ZnO@ACav 846 -72 1156 210 1188
ACcc 953 -59 1300 506 1341 1.6
ZnO@ACcc 597 -65 816 250 832
Table 2. Pore structure properties of pure AC matrices and ZnO@AC composite materials.
Material code Total pore volume (cm3/g) Dmean (nm) CPSM low micro %microp.
(CPSM)
%microp.
(Dubinin)
ACsc 0.615 1.37 91 93
ZnO@ACsc 0.422 1.29 91 93
ACav 0.613 1.29 80 90
ZnO@ACav 0.474 1.24 72 84
ACcc 0.484 1.20 82 95
ZnO@ACcc 0.329 1.30 81 87
Table 3. Sulfur % wt. presence on the surface of materials as it was calculated by the EDS instrument analysis.
(SEM-EDS) S % wt.
Material code fresh used increasing ratio
ACsc 0.32 2.39 4.84
ZnO@ACsc 0.12 10.13
ACav 0.38 2.31 5.65
ZnO@ACav 0.23 11.13
ACcc 0 2.46 4.05
ZnO@ACcc 0 9.97
Table 4. Pure AC and ZnO@AC composites capacity on H2S removal process.
Material code % yield H2S flow
(ml/min)
GHSV
(min-1)
Ads. Cap.
(mgH2S/gads.)
Ads. Cap.
(mmolH2S/gads.)
times increase
ACsc 18.9 35.7 183 10.21 0.299 6.5
ZnO@ACsc 37.4 204 66.34 1.945
ACav 17.6 35.7 128 17.84 0.523 5.9
ZnO@ACav 35.7 136 106.03 3.109
ACcc 23.0 35.7 286 12.42 0.364 3.8
ZnO@ACcc 35.7 217 46.90 1.375
Table 5. H2S uptake capacities of ZnO-based adsorbents cited in the literature.
Adsorbent Ads. Cap.
(mgH2S/gads.)
Reference
AC 2.7 [24]
ZnO@AC 30.5 [24]
ZnO@N-AC 62.5 [24]
Commercial ZnO 37.7 [17]
AC 6.2 [13]
SBA-15@ZnO 18.5 [47]
SBA-15@ZnO 41.0 [25]
MCM-48@ZnO 53.2 [25]
MCM-41@ZnO 54.9 [25]
Disclaimer/Publisher’s Note: The statements, opinions and data contained in all publications are solely those of the individual author(s) and contributor(s) and not of MDPI and/or the editor(s). MDPI and/or the editor(s) disclaim responsibility for any injury to people or property resulting from any ideas, methods, instructions or products referred to in the content.
Copyright: This open access article is published under a Creative Commons CC BY 4.0 license, which permit the free download, distribution, and reuse, provided that the author and preprint are cited in any reuse.
Prerpints.org logo

Preprints.org is a free preprint server supported by MDPI in Basel, Switzerland.

Subscribe

© 2024 MDPI (Basel, Switzerland) unless otherwise stated