
Submitted:
07 October 2023
Posted:
07 October 2023
You are already at the latest version
Abstract
The optimized design of catalyst layer (CL) plays a vital role to improve the performance of polymer electrolyte membrane fuel cells (PEMFCs). The need to improve transport and catalyst activity is especially important at low Pt loading, where local oxygen and ionic transport resistances decrease the performance due to an inevitable reduction of active catalyst sites. In this work, local oxygen and ionic transport are analyzed using direct numerical simulation on virtually reconstructed microstructures. Four morphologies are examined: (i) heterogeneous, (ii) uniform, (iii) uniform vertically-aligned, and (iv) meso-porous ionomer distributions. The results show that the local oxygen transport resistance can be significantly reduced, while maintaining good ionic conductivity, through the design of high porosity CLs (ε≃0.6−0.7) with low agglomerated ionomer morphologies. Ionomer coalescence into thick films can be effectively mitigated by increasing the uniformity of thin films and reducing the tortuosity of ionomer distribution (e.g., good ionomer interconnection in supports with a vertical arrangement). The local oxygen resistance can be further decreased by the use of blended ionomers with enhanced oxygen permeability and meso-porous ionomers with oxygen transport routes in both water and ionomer. In summary, achieving high performance at low Pt loading in next-generation CLs must be accomplished through a combination of high porosity, uniform and low tortuosity ionomer distribution, and oxygen transport through activated water.
Keywords:
catalyst layer
; local resistance
; ionomer
; modeling
; PEMFC
1. Introduction
Polymer electrolyte membrane fuel cells (PEMFCs) are one of the most promising alternatives to internal combustion engines due to their high efficiency, high power density, low noise and low pollutant emission (only water and heat are generated by electrochemical reactions) [1,2,3]. However, the high cost caused by the use of elevated Pt loadings at the cathode still remains as a critical issue for the widespread commercialization of PEMFCs either in portable, transport or stationary applications [4,5]. As a result, a large body of current research is devoted to mitigate potential losses in low Pt loading electrodes (see, e.g., [6,7,8,9] and references therein).
Operation at low Pt loading is limited by the sharp increase of the so-called local oxygen transport resistance around Pt sites, which originates a high concentration overpotential at the cathode [10,11]. The origin of the resistance is inherently caused by the reduction of active Pt surface area at low Pt loading, so that the local flux toward each catalyst particle is amplified to maintain a targeted current density (per unit of geometric or platform area). In other words, the lower the active surface area, the higher the oxygen flux that each catalyst particle must support [12]. Therefore, electrochemical activity and transport in the neighbourhood of every catalyst particle must be optimized to mitigate the limitation (i.e., high flux demand) caused by a reduction of Pt loading [7].
Previous work dealing with the design of CLs with improved performance at low Pt loading is reviewed below. In 2006-2012, Debe et al. [13,14] presented nanostructured thin film (NSTF) catalysts produced by 3M. Ultra-thin CLs () were prepared with a Pt monolayer supported on crystalline organic whiskers without ionomer binder. Proton and electron conduction relayed on liquid water and Pt catalyst, respectively. Hih performance was reported a low Pt loading () with superior stability in cyclic durability test compared to conventional Pt/C catalyst. The better performance at low Pt loading was ascribed to the absence of ionomer and the agglomerated Pt/whisker structure, which reduced Pt growth and coalescence due to Ostwald ripening. Yu et al. [15] (2015) examined the feasibility of reactive spray deposition technique for the preparation of high-performance CLs. They reported a better distribution of ionomer on active Pt sites and ionomer penetration into nanopores with a pore size of . As a result, the optimal ionomer-to-carbon weight ratio was decreased from around 0.65 for a conventional CL down to 0.3. The improved ionomer distribution and lower ionomer content led to higher performance at low Pt loading. Talukdar et al. [16] (2019) studied the effect of drying on the preparation of conventional ink-based CLs. They found that solvent removal via sublimation by means of freeze drying led to a 3.5-fold increase of the effective porosity, thereby enhancing performance at low Pt loading (). Conde et al. [17] (2019) analyzed mass transport and water uptake properties of CLs prepared by electrospry. A significant decrease of the local oxygen transport resistance was reported compared to conventional CLs prepared by airbrushing ( vs. at , full humidification and ). Moreover, electrosprayed CLs showed a much higher water uptake than conventional CLs at micro-/meso-scale. Yoshino et al. [18] (2020) presented ionomer nanofiber scaffolding CL formed by the combination of electrospinning of Nafion nanofibers and electrospraying of a catalyst ink on nanofibers. The multiscale ionomer microstructure showed improved performance at low RH and reduced catalyst poisoning thanks to the decrease of the ionomer content in the catalyst ink. More recently, Cheng et al. [19] (2022) produced CLs with nanoporous ionomer using polyvinyl alcohol as a sacrificial pore-forming agent during CL preparation. Water-filled pores in ionomer allowed a dramatic reduction of the local oxygen transport resistance from down to . Zhang et al. [20] (2022) developed porous ionomers by incorporating ionic covalent organic framework nanosheets into Nafion. Meso-porosity significantly enhanced oxygen permeation and mass activity, increasing performance at low Pt loading by a factor of 1.6 compared to conventional CLs.
The above literature review shows the key role that volume composition, morphology and ionomer porosity can play on CL performance. The aim of this work is to examine numerically the impact of CL microstructure on the local oxygen and ionic transport resistances around Pt sites. Predictions are compared against previous experimental observations to shed light on the various factors that affect performance at low Pt loading. The organization of this paper is as follows. In Section 2, the generation algorithm used for the virtual reconstruction of CL morphologies and the numerical model used for the calculation of local oxygen and ionic transport resistances are presented. The results are discussed in Section 3, which includes a calibration of the numerical model and a parametric analysis of volume composition, carbon/ionomer interaction, oxygen diffusivity in ionomer, and meso-porous ionomer. Finally, the conclusions are presented in Section 4.
2. Methods
2.1. Virtual reconstruction
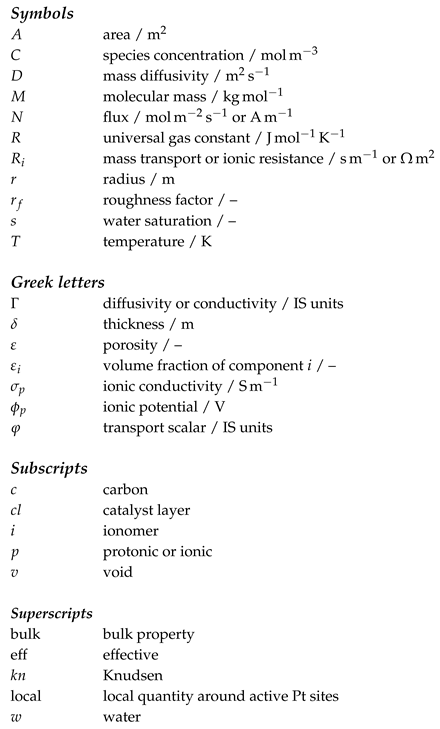
CL microstructure was virtually reconstructed to differentiate among three phases, carbon, ionomer and free water, considering four ionomer morphologies: (i) heterogeneous, () uniform, () idealized vertically-aligned, and () meso-porous ionomer distributions. The size of the representative domain was set to , significantly lower than average CL thickness, typically around . The voxel resolution was kept equal to throughout the work. Figure 1 shows examples of the steps followed for the generation of heterogeneous CL microstructures, along with final modifications added to create meso-porous ionomer. Uniform and idealized morphologies were omitted in Figure 1 for brevity since they involve small changes of the algorithm used for the heterogeneous case. The main steps followed in the generation process were as follows:
- Carbon agglomeration. As shown in Figure 1(a), spherical carbon particles were randomly located in the domain with an uniform radius of , allowing overlapping between them. Particles were incorporated one by one into the domain until a prescribed carbon volume fraction, , was reached. After each particle addition, only the largest connected component was maintained in the process, while isolated particles not connected to the main carbon structure were removed. At the end, the connectivity of the agglomerated carbon structure to the top and bottom surfaces of the domain was checked, and the generation process was repeated from the beginning if there was not a connected pathway across the domain (six-connected voxels criterion). Usually, no more than five iterations were needed to reach a connected structure at the lowest carbon volume fraction examined, . The generation of the idealized carbon support composed of vertically-aligned cylinders was accomplished using a simplified algorithm. Carbon cylinders were placed with a uniform spacing in the material plane and the radius increased until reaching a prescribed carbon volume fraction.
- Ionomer addition. As shown in Figure 1(b), heterogeneous ionomer was created by randomly selecting points from the carbon agglomerate and introducing semi-spherical films around the structure. Ionomer films were incorporated one at a time by identifying the void voxels enclosed in an sphere centered at the selected carbon point with a prescribed ionomer radius, . For each radius, ionomer films were sequentially added until no further variation of the ionomer volume fraction, , was detected (below a established threshold). The whole process was completed when a prescribed porosity, , was reached, gradually increasing by a factor of 1.2 from an exceedingly small value (). For uniform coating, the ionomer phase was simply identified using the Ecludiean distance transform, so that void voxels located at a distance below from the carbon pahse were identified as ionomer. As in the heterogeneous case, the ionomer radius was gradually increased by a factor of 1.2 from until reaching the prescribed porosity, . In all cases, connectivity was checked after every ionomer addition to remove isolated components not connected to the main carbon+ionomer structure.
- Free water addition. As shown in Figure 1(c), free water was added in a similar way to ionomer. However, random points were selected from either carbon, ionomer or water phases to identify void voxels to be converted into free water. The radius of water spheres, , was sequentially increased by a factor of 1.2 from the last ionomer radius used in Step 2 until reaching a prescribed water saturation, s. In structures with uniform morphology, water was placed uniformly around ionomer by gradually increasing by a factor of 1.2. Isolated water blobs which were not connected to carbon or ionomer were removed.
- Additional features. Modifications of the morphology were incorporated to include specific features in the carbon, ionomer and water distributions. As shown in Figure 1(d), meso-porous ionomer was created by introducing water-filled spherical pores in the ionomer phase with a prescribed radius equal to the last ionomer radius used in Step 2. A total of 120 random points were selected from the ionomer phase.
2.2. Numerical model
Oxygen diffusion and ionic conduction were examined by direct numerical simulation of Laplace equation at pore scale (see, e.g., [21,22])
where is the property of interest, either mass diffusivity or ionic conductivity, and is the variable of interest, either oxygen concentration or ionic potential.
The generated microstructures were imported into the CFD software ANSYS Fluent using a numerical mask to identify carbon, ionomer, free water and void regions in a hexahedral mesh created with the same voxel resolution of the image stacks. The various cell regions were then differentiated in the numerical mesh using the built-in capabilities of ANSYS fluent to separate cell regions and create the corresponding interfaces. Simulations were carried out on ionomer, water and void phases, considering a no-flux boundary condition at passive carbon interfaces were reaction does not take place. As shown in Figure 2, a Dirichlet boundary condition was set at the reactive carbon/ionomer interface, corresponding to limiting current density condition (). Additionally, the carbon/water interface was also assumed to be reactive () in simulations with meso-porous ionomer. The system was excited by introducing a concentration or potential difference at the upper and lower surfaces (). Symmetry boundary conditions were set at sidewalls to mimic the representative location of the domain within larger carbon agglomerates.
The diffusivity and the ionic conductivity of ionomer and water were set constant. As for the void phase, diffusivity was corrected for Knudsen diffusion based on the average pore radius (determined by applying the Euclidean distance transform on image stacks). Ionic conductivity of the void phase was set to a negligible value due to the absence of conductive routes for protons. According to previous work, the values adopted in each region were as follows
Comparatively, the effective oxygen diffusivity in ionomer () is around five and two orders of magnitude lower than that in void space () and liquid water (). So, bulk void space and liquid water lead to a negligible concentration drop compared to ionomer, which is where almost the entire oxygen transport resistance is originated. In contrast, the effective ionic conductivity of ionomer () is around one order of magnitude higher than that of liquid water (). The increase of the effective ionic conductivity in ionomer (one order of magnitude) is not as pronounced as the decrease of the effective oxygen diffusivity (two orders of magnitude).
In the above expressions, and are the bulk and Knudsen diffusivities of oxygen, given by [10,12]
where is the average pore radius of void space, T is the temperature (fixed to ), is the molecular mass of oxygen, and R is the universal gas constant.
The local mass and ionic transport resistances per unit of geometric (or platform area of the CL), and , are obtained from a flux balance [12]
where is the roughness factor, defined as the ratio between the active Pt surface area (ECSA) and the geometric area of the CL, and are the oxygen and proton flux at Pt surface, and and are the concentration and ionic potential drop from the bulk space toward Pt surface, respectively. was determined as the average concentration in the void space minus the oxygen concentration at reaction sites (), while was directly taken as the prescribed potential drop (). According to Eqs. (4a)–(4b), the local resistance per unit of geometric area is inversely proportional to the roughness factor (), dramatically increasing at low Pt loading when [11,12,34].
Pt was assumed to be well dispersed over Pt surface, so not explicit description of Pt nano-particle shape was made (). Consequently, the roughness factor is meaningless, and the variable of interest calculated in the simulations was the local resistance per unit of Pt (or carbon) surface area
controls the incremental slope of when the Pt loading (and ) are decreased, removing the expected effect of the increase of with respect to caused by area (i.e., ). The only concern is that the enlargement of transport pathways created by the discrete nature of Pt nano-particles at a given Pt loading is ignored [35]. Nevertheless, the aim of this work is to examine the overall effect of ionomer morphology, so the contribution of the discrete Pt shape prevails as a secondary factor.
3. Discussion of results
The discussion of results is divided into five sections. In Section 3.1, the model is calibrated in terms of local oxygen transport resistance and effective diffusivity of oxygen in ionomer. The results of a parametric analysis are then presented, which includes a study of volume composition (Section 3.2), carbon/ionomer interaction (Section 3.3), ionomer diffusivity (Section 3.4), and meso-porous ionomer (Section 3.5). The local oxygen and ionic transport resistances computed in the parametric analysis were averaged among five sample realizations for every condition examined. Water saturation was fixed to , while porosity and carbon volume fraction were varied depending on the case under study.
3.1. Calibration
Before proceeding further, the predictive capabilities of the model were compared against data reported in the literature. The variables considered for the model calibration were the local oxygen transport resistance, , and the effective diffusivity of oxygen in ionomer, , due to the uncertainty in mass transport results and the availability of previous experimental data. Figure 3(a) shows the experimental data of reported by different literature sources, along with the numerical results computed with the baseline used in the simulation campaign (). A partially saturated CL () with a conventional composition (, ) was used in the simulations. A large dispersion is found among previous data, with ranging between and (a factor of six). These variations can be mainly ascribed to microstructural differences that arise from volume compositions and manufacturing techniques. The numerical results computed in sixteen sample realizations vary stochastically around , which is close to the mean experimental value (). Hence, the numerical results can be considered representative of the behavior of a conventional CL when the oxygen diffusivity is fixed to . As shown in Figure 3(b), the assumed diffusivity is in line with previous data adopted in mesoscopic simulations by Mu et al. [23,24], who varied the oxygen diffusivity between and . This range agrees with previous experimental data reported for the oxygen diffusivity in bulk Nafion membranes, even though there is a large variability among authors (three orders of magnitude) [25]. The large fluctuation of the diffusivity in bulk Nafion can be ascribed to conditioning, substrate interaction and confinement of membranes [36,37,38]. The oxygen diffusivity considered here is a good approximation, which leads to realistic values of the local oxygen transport resistance.
3.2. Volume composition
Figure 4 shows the results of the analysis of the volume composition for conventional CLs with a heterogeneous ionomer distribution. The variation of the local oxygen and ionic transport resistances is examined as a function of porosity for three carbon volume fractions. As shown in Figure 4(a), there is a strong dependency of with porosity, which decreases by a factor of two when the porosity is increased from to . That is, the ionomer volume fraction is reduced from to since . For a given porosity, is also reduced with carbon volume fraction due to the decrease of ionomer volume fraction. These results agree with previous works, which showed that the use of moderate ionomer-to-carbon weight ratios () is beneficial to enhance oxygen transport at low Pt loading due to a decrease of average ionomer thickness [12,15,34,43,46]. Notice also the non-linear dependency of the local oxygen transport resistance with porosity. For high ionomer volume fractions (), remains large and rather constant around . In contrast, at lower ionomer volume fractions (), gradually decreases until it settles down around for CLs with low ionomer volume fractions and high porosities (, ). Such non-linear behavior highlights the need to design high porosity CLs to mitigate the detrimental effect of local oxygen transport resistance at low Pt loading [47]. Experimentally, a strong reduction of has been previously reported for high porosity electrosprayed CLs [17,48]. A low ionomer content minimizes the agglomeration of ionomer films, avoiding the formation of locally dense ionomer regions that prevent a proper distribution of oxygen throughout the ionomer surface. CL design with low ionomer fraction and high porosity must be accompanied of a moderate increase of the local ionic transport resistance. As shown in Figure 4(b), remains rather constant around for () but significantly increases beyond for () when ionomer interconnection approaches the percolation threshold [49]. Operation close to the ionic percolation threshold of ionomer must be ensured by the incorporation of supporting routes for proton transport, created, for example, by an enhanced water uptake at micro- and meso-scale, as it is the case of optimized electrosprayed CLs [17,48]. Alternatively, a delicate arrangement of ionomer might be necessary, as discussed in the next section.
3.3. Carbon/ionomer interaction
Figure 5 shows the results of the carbon/ionomer interaction for three ionomer morphologies, heterogeneous, uniform and idealized vertically-aligned distributions, as a function of porosity. A representative carbon volume fraction is considered, . As shown in Figure 5(a), the local oxygen transport resistance of the heterogeneous and uniform ionomer distributions are similar at low-to-middle porosities (). The low sensitivity of to ionomer heterogeneity is explained by the presence of both thick and thin ionomer regions in the heterogeneous samples, which lead on average to a similar oxygen resistance to that of uniform samples [50,51,52]. This situation is further illustrated in Figure 6(a), which shows the histograms of the local oxygen flux at active sites of the examined samples at . For heterogeneous ionomer, the local oxygen flux distribution varies roughly linear due to the presence of a continuous distribution of regions with high and low oxygen resistances. In contrast, for uniform ionomer, the local oxygen flux distribution is more concentrated toward intermediate values that are characteristic of the mean ionomer thickness (lower dispersion). The difference between heterogeneous and uniform ionomer distributions is enlarged at high porosity (), where the uniform samples reach a lower oxygen resistance than the heterogeneous samples (a factor of two, vs. ). The reduction of the oxygen resistance at high porosity in the uniform samples is caused by a strong suppression of ionomer agglomeration when the ionomer volume fraction is low () [43]. The optimal arrangement of uniform ionomer virtually removes coalescence of ionomer films, facilitating oxygen distribution between ionomer films. Similarly, the local ionic transport resistance of the uniform samples is especially reduced compared to that of the heterogeneous samples at high porosity (a factor of two, vs. ). The superior ionic conductivity of uniform samples arises from the better arrangement of ionomer and the suppression of ineffective agglomerated ionomer regions, i.e., a tortuosity decrease [53]. Overall, the use of high porosity CLs with a uniform as possible ionomer distribution can be an effective way to improve performance at low Pt loading due to facilitated oxygen transport and good proton conduction [46,54,55].
The importance of ionomer morphology is exacerbated in the samples with an idealized vertically-aligned distribution. As shown in Figure 5(a), the local oxygen transport resistance of the idealized samples is low in the full porosity range, slightly decreasing from to when the porosity is increased between and . Furthermore, as shown in Figure 5(b), the local ionic transport resistance is significantly reduced compared to the heterogeneous and uniform distributions, remaining between for . The extremely high performance of the idealized ionomer distribution arises from a minimization of ionomer agglomeration and an optimal arrangement of proton transport pathways (i.e., tortuosity minimization) [10]. Notice that the oxygen resistance of the idealized and the uniform distributions are similar at high porosity, reflecting the superior oxygen distribution in both cases. High performance at low Pt loading with vertically-aligned microstructures have been previously demonstrated in several experimental works [56,57,58], where current densities as high as were reached at with and air supply. As a final remark, it is worth noting that the results of the idealized morphology do not vary among sample realizations, unlike the results calculated with random carbon particles. This fact highlights the importance of using reproducible manufacturing techniques and homogenized catalyst supports to reduce maldistribution of transport resistances, which can affect local performance and degradation rates [59,60].
3.4. Ionomer diffusivity
The results of the analysis of the effective oxygen diffusivity in ionomer are shown in Figure 7. The local oxygen and ionic transport resistances are plotted as a function of porosity for the heterogeneous ionomer distribution (). As expected, the local oxygen transport resistance decreases almost linearly with an increase of the oxygen diffusivity (see Figure 7(a)). Indeed, small deviations from linearity are caused by stochastic fluctuations that arise from random microstructures. As shown in Figure 7(b), the local ionic transport resistance remains invariant with respect to oxygen diffusivity, reaching similar values to those presented in Figure 4(b) (except for stochastic variations among samples). The use of modified ionomers with enhanced permeability and good conductivity offers a viable route to improve performance at low Pt loading. Among available options, blended ionomers can be a satisfactory solution to produce tailored designs with balanced mass and ionic transport properties [61,62]. Nevertheless, it is worth noting that achieving a remarkable high performance may only be possible if enhanced diffusion is accompanied by a proper CL design in terms of high porosity and ionomer morphology. The increase of oxygen diffusivity shown in previous work is typically of order unity, so a disruptive increase of oxygen diffusivity may not be possible by solely altering the chemical ionomer structure [44,61,62,63,64]. Local oxygen transport can be more effectively increased by incorporating meso-porosity into ionomer, an aspect that is discussed in the next section.
3.5. Porous ionomer
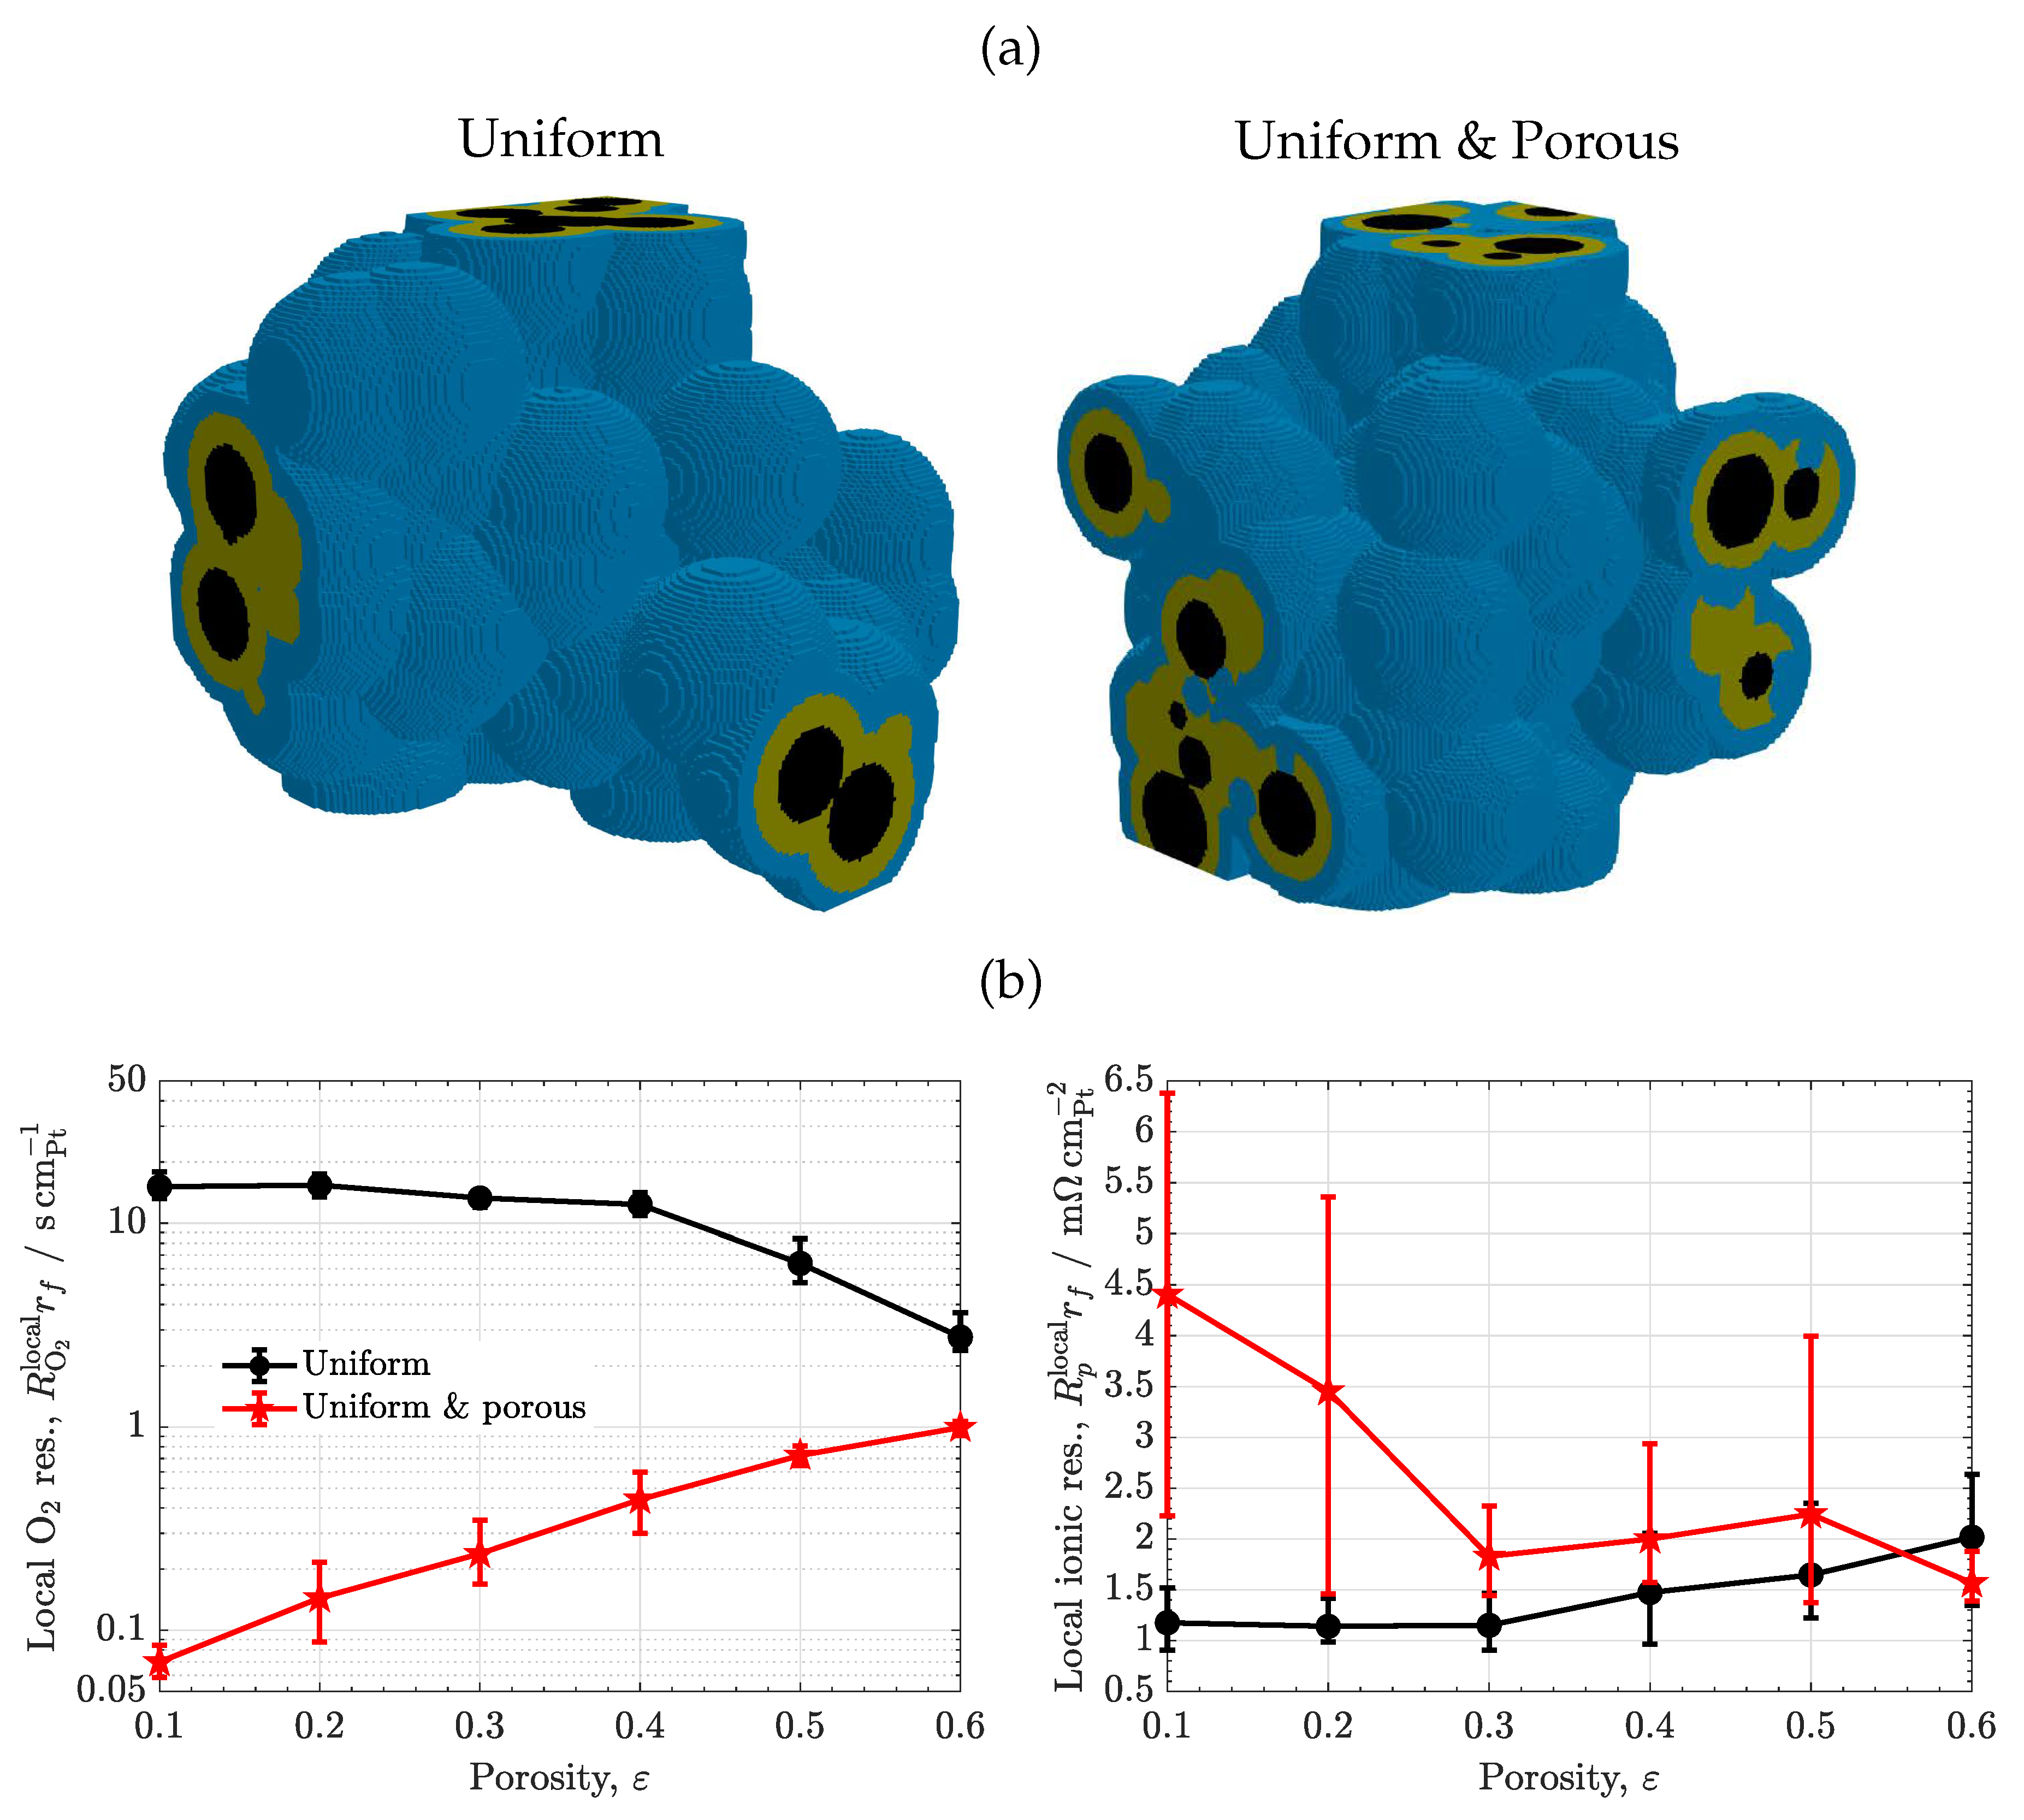
The results of the uniform meso-porous ionomer are compared to those of the uniform ionomer as a function of porosity in Figure 8 (). As shown in Figure 8(a), the local oxygen transport resistance of the meso-porous ionomer is sharply decreased, reaching values even one order of magnitude lower than the uniform ionomer ( vs. ). The strong enhancement of oxygen transport is caused by the much higher diffusivity of oxygen in liquid water () compared to ionomer (), two orders of magnitude higher –see histograms in Figure 6(b). This result clearly evidences that oxygen resistance can be greatly suppressed by enhancing water uptake within ionomer and allowing oxygen transport directly through liquid water (provided that water regions are electrochemically activated). For instance, the increase of the oxygen resistance of the meso-porous ionomer with CL porosity is explained by a reduction of the carbon/water interface since ionomer pore radius was varied according to the film thickness (a decreasing function of CL porosity). As shown in Figure 8(b), the local ionic transport resistance shows an opposite behaviour to that of the oxygen resistance, being higher in the meso-porous ionomer due to the worse transport of protons in liquid water (a factor around two to three, vs. ). The ionic resistance of the meso-porous ionomer decreases with porosity due to the presence of smaller water regions at high porosity (i.e., narrower ionomer film thickness). Comparatively, the increase of the ionic transport resistance of the meso-porous ionomer is significantly lower than the reduction of the oxygen transport resistance, so reaching high performance with meso-porous ionomer is certainly possible. Previous experimental works that have shown improved performance at low Pt loading by exploiting the use of liquid water include: (i) nano-structured thin film electrodes [13,14], and () engineered porous ionomers [19,20,65,66]. In the latter group, it may also be included some blended ionomers with a significant bulky structure [61]. In agreement with the present results, a reduction of the local oxygen transport resistance down to one order of magnitude ( vs. ) with a moderate ionic resistance in the polarization curve was recently reported by Cheng et al. [19] using a masked nanoporous ionomer. In addition, the low oxygen transport resistance of electrosprayed CLs at low Pt loading () can be explained by the combination of high porosity, more uniform ionomer distribution and enhanced water uptake at micro-/meso-scale [17,48].
4. Conclusions
The local and ionic transport resistances of catalyst layers (CLs) used in polymer electrolyte membrane fuel cells (PEMFCs) have been analyzed by direct numerical simulation on virtually reconstructed microstructures. The generated samples accounted for carbon, ionomer and liquid water, neglecting the discrete geometry of Pt nano-particles, to study the effect of volume composition, carbon/ionomer interaction, ionomer diffusivity and ionomer meso-porosity. To this end, four ionomer morphologies were considered: (i) heterogeneous, () uniform, () idealized vertically-aligned, and () meso-porous distributions. The numerical results have shown that the local oxygen transport resistance can be reduced through the design of high porosity CLs with low ionomer agglomeration. Increasing the uniformity and reducing the tortuosity of ionomer distribution avoids excessive coalescence of ionomer films, while enhancing proton transport. Oxygen transport can be further improved through the use of blended ionomers with high oxygen permeability and good ionic conductivity, as well as meso-porous ionomers. Allowing oxygen diffusion through liquid water near active Pt sites is crucial to strongly enhance oxygen transport toward Pt surface. Indeed, the high diffusivity of oxygen in liquid water compared to ionomer can decrease the oxygen resistance by one order of magnitude. The above guidelines, high porosity, uniform and low tortuosity ionomer and oxygen transport through activated liquid water, are key aspects to mitigate losses at low Pt loading in next-generation PEMFCs.
Several aspects warrant future work. The effect of the discrete geometry of Pt nano-particles and porous carbon support must be examined. In addition, a numerical analysis accounting for electrochemical reactions must be performed, with special emphasis on reaction kinetics in liquid water.
Acknowledgments
This work was supported by projects PID2019-106740RBI00, EIN 2020-112247 and TED2021-131620B-C21 European Union NextGenerationEU/PRTR of the Ministry of Science and Innovation of Spain, Spanish Research Council.
Nomenclature
 |
References
- Fan, L.; Tu, Z.; Chan, S.H. Recent development in design a state-of-art proton exchange membrane fuel cell from stack to system: Theory, integration and prospective. International Journal of Hydrogen Energy 2023, 48, 7828–7865. [Google Scholar] [CrossRef]
- Pollet, B.G.; Kocha, S.S.; Staffell, I. Current status of automotive fuel cells for sustainable transport. Current opinion in Electrochemistry 2019, 16, 90–95. [Google Scholar] [CrossRef]
- Agyekum, E.B.; Ampah, J.D.; Wilberforce, T.; Afrane, S.; Nutakor, C. Research Progress, Trends, and Current State of Development on PEMFC-New Insights from a Bibliometric Analysis and Characteristics of Two Decades of Research Output. Membranes 2022, 12, 1103. [Google Scholar] [CrossRef] [PubMed]
- Banham, D.; Ye, S. Current status and future development of catalyst materials and catalyst layers for proton exchange membrane fuel cells: an industrial perspective. ACS Energy Letters 2017, 2, 629–638. [Google Scholar] [CrossRef]
- Parekh, A. Recent developments of proton exchange membranes for PEMFC: A review. Frontiers in Energy Research 2022, 10, 956132. [Google Scholar] [CrossRef]
- Yarlagadda, V.; Carpenter, M.K.; Moylan, T.E.; Kukreja, R.S.; Koestner, R.; Gu, W.; Thompson, L.; Kongkanand, A. Boosting fuel cell performance with accessible carbon mesopores. ACS Energy Letters 2018, 3, 618–621. [Google Scholar] [CrossRef]
- Banham, D.; Zou, J.; Mukerjee, S.; Liu, Z.; Yang, D.; Zhang, Y.; Peng, Y.; Dong, A. Ultralow platinum loading proton exchange membrane fuel cells: Performance losses and solutions. Journal of Power Sources 2021, 490, 229515. [Google Scholar] [CrossRef]
- Liu, S.; Yuan, S.; Liang, Y.; Li, H.; Xu, Z.; Xu, Q.; Yin, J.; Shen, S.; Yan, X.; Zhang, J. Engineering the catalyst layers towards enhanced local oxygen transport of Low-Pt proton exchange membrane fuel cells: Materials, designs, and methods. International Journal of Hydrogen Energy 2023, 48, 4389–4417. [Google Scholar] [CrossRef]
- Cheng, X.; Shen, S.; Wei, G.; Wang, C.; Luo, L.; Zhang, J. Perspectives on challenges and achievements in local oxygen transport of low Pt proton exchange membrane fuel cells. Advanced Materials Technologies 2022, 7, 2200228. [Google Scholar] [CrossRef]
- García-Salaberri, P.A.; Sánchez-Ramos, A.; Das, P.K. On the optimal cathode catalyst layer for polymer electrolyte fuel cells: Bimodal pore size distributions with functionalized microstructures. Frontiers in Energy Research 2022, 10, 1058913. [Google Scholar] [CrossRef]
- Weber, A.Z.; Kusoglu, A. Unexplained transport resistances for low-loaded fuel-cell catalyst layers. Journal of Materials Chemistry A 2014, 2, 17207–17211. [Google Scholar] [CrossRef]
- Sánchez-Ramos, A.; Gostick, J.T.; García-Salaberri, P.A. Modeling the effect of low Pt loading cathode catalyst layer in polymer electrolyte fuel cells: Part I. Model formulation and validation. Journal of The Electrochemical Society 2021, 168, 124514. [Google Scholar] [CrossRef]
- Debe, M.K.; Schmoeckel, A.K.; Vernstrom, G.D.; Atanasoski, R. High voltage stability of nanostructured thin film catalysts for PEM fuel cells. Journal of Power Sources 2006, 161, 1002–1011. [Google Scholar] [CrossRef]
- Debe, M.K. Nanostructured thin film electrocatalysts for PEM fuel cells-a tutorial on the fundamental characteristics and practical properties of NSTF catalysts. Ecs Transactions 2012, 45, 47. [Google Scholar] [CrossRef]
- Yu, H.; Roller, J.M.; Mustain, W.E.; Maric, R. Influence of the ionomer/carbon ratio for low-Pt loading catalyst layer prepared by reactive spray deposition technology. Journal of Power Sources 2015, 283, 84–94. [Google Scholar] [CrossRef]
- Talukdar, K.; Delgado, S.; Lagarteira, T.; Gazdzicki, P.; Friedrich, K.A. Minimizing mass-transport loss in proton exchange membrane fuel cell by freeze-drying of cathode catalyst layers. Journal of Power Sources 2019, 427, 309–317. [Google Scholar] [CrossRef]
- Conde, J.J.; Folgado, M.A.; Ferreira-Aparicio, P.; Chaparro, A.M.; Chowdhury, A.; Kusoglu, A.; Cullen, D.; Weber, A.Z. Mass-transport properties of electrosprayed Pt/C catalyst layers for polymer-electrolyte fuel cells. Journal of Power Sources 2019, 427, 250–259. [Google Scholar] [CrossRef]
- Yoshino, S.; Shinohara, A.; Kodama, K.; Morimoto, Y. Fabrication of catalyst layer with ionomer nanofiber scaffolding for polymer electrolyte fuel cells. Journal of Power Sources 2020, 476, 228584. [Google Scholar] [CrossRef]
- Cheng, X.; You, J.; Shen, S.; Wei, G.; Yan, X.; Wang, C.; Zhang, J. An ingenious design of nanoporous nafion film for enhancing the local oxygen transport in cathode catalyst layers of PEMFCs. Chemical Engineering Journal 2022, 439, 135387. [Google Scholar] [CrossRef]
- Zhang, Q.; Dong, S.; Shao, P.; Zhu, Y.; Mu, Z.; Sheng, D.; Zhang, T.; Jiang, X.; Shao, R.; Ren, Z.; others. Covalent organic framework–based porous ionomers for high-performance fuel cells. Science 2022, 378, 181–186. [Google Scholar] [CrossRef]
- García-Salaberri, P.A.; Hwang, G.; Vera, M.; Weber, A.Z.; Gostick, J.T. Effective diffusivity in partially-saturated carbon-fiber gas diffusion layers: Effect of through-plane saturation distribution. International Journal of Heat and Mass Transfer 2015, 86, 319–333. [Google Scholar] [CrossRef]
- Hack, J.; García-Salaberri, P.A.; Kok, M.D.; Jervis, R.; Shearing, P.R.; Brandon, N.; Brett, D.J. X-ray micro-computed tomography of polymer electrolyte fuel cells: what is the representative elementary area? Journal of The Electrochemical Society 2020, 167, 013545. [Google Scholar] [CrossRef]
- Mu, Y.T.; Weber, A.Z.; Gu, Z.L.; Tao, W.Q. Mesoscopic modeling of transport resistances in a polymer-electrolyte fuel-cell catalyst layer: Analysis of hydrogen limiting currents. Applied Energy 2019, 255, 113895. [Google Scholar] [CrossRef]
- Mu, Y.T.; Yang, S.R.; He, P.; Tao, W.Q. Mesoscopic modeling impacts of liquid water saturation, and platinum distribution on gas transport resistances in a PEMFC catalyst layer. Electrochimica Acta 2021, 388, 138659. [Google Scholar] [CrossRef]
- Cheng, X.; Wei, G.; Wang, C.; Shen, S.; Zhang, J. Experimental probing of effects of carbon support on bulk and local oxygen transport resistance in ultra-low Pt PEMFCs. International Journal of Heat and Mass Transfer 2021, 164, 120549. [Google Scholar] [CrossRef]
- Kulikovsky, A. The effect of Nafion film on the cathode catalyst layer performance in a low–Pt PEM fuel cell. Electrochemistry communications 2019, 103, 61–65. [Google Scholar] [CrossRef]
- Xing, W.; Yin, M.; Lv, Q.; Hu, Y.; Liu, C.; Zhang, J. Oxygen solubility, diffusion coefficient, and solution viscosity. In Rotating electrode methods and oxygen reduction electrocatalysts; Elsevier, 2014; pp. 1–31.
- Gostick, J.T.; Weber, A.Z. Resistor-network modeling of ionic conduction in polymer electrolytes. Electrochimica Acta 2015, 179, 137–145. [Google Scholar] [CrossRef]
- Ohira, A.; Kuroda, S.; Mohamed, H.F.; Tavernier, B. Effect of interface on surface morphology and proton conduction of polymer electrolyte thin films. Physical Chemistry Chemical Physics 2013, 15, 11494–11500. [Google Scholar] [CrossRef] [PubMed]
- Chen, D.; Kongkanand, A.; Jorne, J. Proton conduction and oxygen diffusion in ultra-thin nafion films in PEM fuel cell: how thin? Journal of The Electrochemical Society 2019, 166, F24. [Google Scholar] [CrossRef]
- Paul, D.K.; McCreery, R.; Karan, K. Proton transport property in supported Nafion nanothin films by electrochemical impedance spectroscopy. Journal of the electrochemical society 2014, 161, F1395. [Google Scholar] [CrossRef]
- Zenyuk, I.V.; Litster, S. Modeling ion conduction and electrochemical reactions in water films on thin-film metal electrodes with application to low temperature fuel cells. Electrochimica Acta 2014, 146, 194–206. [Google Scholar] [CrossRef]
- Liu, J.; Zenyuk, I.V. Proton transport in ionomer-free regions of polymer electrolyte fuel cells and implications for oxygen reduction reaction. Current Opinion in Electrochemistry 2018, 12, 202–208. [Google Scholar] [CrossRef]
- Sánchez-Ramos, A.; Gostick, J.T.; García-Salaberri, P.A. Modeling the effect of low pt loading cathode catalyst layer in polymer electrolyte fuel cells. part ii: Parametric analysis. Journal of The Electrochemical Society 2022, 169, 074503. [Google Scholar] [CrossRef]
- Yoon, W.; Weber, A.Z. Modeling low-platinum-loading effects in fuel-cell catalyst layers. Journal of The Electrochemical Society 2011, 158, B1007. [Google Scholar] [CrossRef]
- Petrovick, J.G.; Radke, C.J.; Weber, A.Z. Gas Mass-Transport Coefficients in Ionomer Membranes Using a Microelectrode. ACS measurement science au 2022, 2, 208–218. [Google Scholar] [CrossRef] [PubMed]
- Kusoglu, A.; Weber, A.Z. New insights into perfluorinated sulfonic-acid ionomers. Chemical reviews 2017, 117, 987–1104. [Google Scholar] [CrossRef]
- Garcia-Salaberri, P.A. Proton Exchange Membranes for Polymer Electrolyte Fuel Cells: An Analysis of Perfluorosulfonic Acid and Aromatic Hydrocarbon Ionomers. Sustainable Materials and Technologies 2023. Accepted.
- Greszler, T.A.; Caulk, D.; Sinha, P. The impact of platinum loading on oxygen transport resistance. Journal of The Electrochemical Society 2012, 159, F831. [Google Scholar] [CrossRef]
- Schuler, T.; Chowdhury, A.; Freiberg, A.T.; Sneed, B.; Spingler, F.B.; Tucker, M.C.; More, K.L.; Radke, C.J.; Weber, A.Z. Fuel-cell catalyst-layer resistance via hydrogen limiting-current measurements. Journal of The Electrochemical Society 2019, 166, F3020–F3031. [Google Scholar] [CrossRef]
- Owejan, J.P.; Owejan, J.E.; Gu, W. Impact of platinum loading and catalyst layer structure on PEMFC performance. Journal of The Electrochemical Society 2013, 160, F824. [Google Scholar] [CrossRef]
- Sun, X.; Yu, H.; Zhou, L.; Gao, X.; Zeng, Y.; Yao, D.; He, L.; Shao, Z. Influence of platinum dispersity on oxygen transport resistance and performance in PEMFC. Electrochimica Acta 2020, 332, 135474. [Google Scholar] [CrossRef]
- Wang, C.; Cheng, X.; Yan, X.; Shen, S.; Ke, C.; Wei, G.; Zhang, J. Respective influence of ionomer content on local and bulk oxygen transport resistance in the catalyst layer of PEMFCs with low Pt loading. Journal of The Electrochemical Society 2019, 166, F239. [Google Scholar] [CrossRef]
- Ramaswamy, N.; Kumaraguru, S.; Koestner, R.; Fuller, T.; Gu, W.; Kariuki, N.; Myers, D.; Dudenas, P.J.; Kusoglu, A. Editors’ choice—ionomer side chain length and equivalent weight impact on high current density transport resistances in PEMFC cathodes. Journal of The Electrochemical Society 2021, 168, 024518. [Google Scholar] [CrossRef]
- Ramaswamy, N.; Gu, W.; Ziegelbauer, J.M.; Kumaraguru, S. Carbon support microstructure impact on high current density transport resistances in PEMFC cathode. Journal of The Electrochemical Society 2020, 167, 064515. [Google Scholar] [CrossRef]
- Orfanidi, A.; Madkikar, P.; El-Sayed, H.A.; Harzer, G.S.; Kratky, T.; Gasteiger, H. The key to high performance low Pt loaded electrodes. Journal of The Electrochemical Society 2017, 164, F418. [Google Scholar] [CrossRef]
- Ünsal, S.; Bozzetti, M.; Chen, Y.C.; Girod, R.; Berger, A.; Diercks, J.S.; Gialamoidou, S.; Lyu, J.; Medarde, M.; Gasteiger, H.A.; others. Catalyst Aggregate Size Effect on the Mass Transport Properties of Non-Noble Metal Catalyst Layers for PEMFC Cathodes. Journal of The Electrochemical Society 2023, 170, 074502. [Google Scholar] [CrossRef]
- Garcia-Salaberri, P.A.; Folgado, M.A.; Duque, L.; Chaparro, A.M. Mass-transport properties of electrosprayed Pt/C catalyst layers for polymer-electrolyte fuel cells. International Journal of Heat and Mass Transfer 2023. Submitted.
- Liu, Y.; Murphy, M.W.; Baker, D.R.; Gu, W.; Ji, C.; Jorne, J.; Gasteiger, H.A. Proton conduction and oxygen reduction kinetics in PEM fuel cell cathodes: effects of ionomer-to-carbon ratio and relative humidity. Journal of The Electrochemical Society 2009, 156, B970. [Google Scholar] [CrossRef]
- Morawietz, T.; Handl, M.; Oldani, C.; Friedrich, K.A.; Hiesgen, R. Quantitative in situ analysis of ionomer structure in fuel cell catalytic layers. ACS applied materials & interfaces 2016, 8, 27044–27054. [Google Scholar]
- Suzuki, T.; Okada, S.; Tsushima, S. Analysis of ionomer distribution and Pt/C agglomerate size in catalyst layers by two-stage ion-beam processing. Journal of The Electrochemical Society 2020, 167, 124513. [Google Scholar] [CrossRef]
- Normile, S.J.; Zenyuk, I.V. Imaging ionomer in fuel cell catalyst layers with synchrotron nano transmission x-ray microscopy. Solid State Ionics 2019, 335, 38–46. [Google Scholar] [CrossRef]
- Sabarirajan, D.C.; Liu, J.; Qi, Y.; Perego, A.; Haug, A.T.; Zenyuk, I.V. Determining proton transport in pseudo catalyst layers using hydrogen pump DC and AC techniques. Journal of The Electrochemical Society 2020, 167, 084521. [Google Scholar] [CrossRef]
- Harzer, G.S.; Orfanidi, A.; El-Sayed, H.; Madkikar, P.; Gasteiger, H.A. Tailoring catalyst morphology towards high performance for low Pt loaded PEMFC cathodes. Journal of The Electrochemical Society 2018, 165, F770. [Google Scholar] [CrossRef]
- Ott, S.; Orfanidi, A.; Schmies, H.; Anke, B.; Nong, H.N.; Hübner, J.; Gernert, U.; Gliech, M.; Lerch, M.; Strasser, P. Ionomer distribution control in porous carbon-supported catalyst layers for high-power and low Pt-loaded proton exchange membrane fuel cells. Nature materials 2020, 19, 77–85. [Google Scholar] [CrossRef]
- Murata, S.; Imanishi, M.; Hasegawa, S.; Namba, R. Vertically aligned carbon nanotube electrodes for high current density operating proton exchange membrane fuel cells. Journal of Power Sources 2014, 253, 104–113. [Google Scholar] [CrossRef]
- Xia, Z.; Wang, S.; Jiang, L.; Sun, H.; Liu, S.; Fu, X.; Zhang, B.; Sheng Su, D.; Wang, J.; Sun, G. Bio-inspired construction of advanced fuel cell cathode with Pt anchored in ordered hybrid polymer matrix. Scientific reports 2015, 5, 16100. [Google Scholar] [CrossRef] [PubMed]
- Meng, Q.H.; Hao, C.; Yan, B.; Yang, B.; Liu, J.; Shen, P.K.; Tian, Z.Q. High-performance proton exchange membrane fuel cell with ultra-low loading Pt on vertically aligned carbon nanotubes as integrated catalyst layer. Journal of Energy Chemistry 2022, 71, 497–506. [Google Scholar] [CrossRef]
- Yoshimune, W. Dependence of oxygen transport properties of catalyst layers for polymer electrolyte fuel cells on the fabrication process. Results in Chemistry 2023, 5, 100738. [Google Scholar] [CrossRef]
- Colombo, E.; Baricci, A.; Bisello, A.; Guetaz, L.; Casalegno, A. PEMFC performance decay during real-world automotive operation: Evincing degradation mechanisms and heterogeneity of ageing. Journal of Power Sources 2023, 553, 232246. [Google Scholar] [CrossRef]
- Kim, B.S.; Park, J.H.; Park, J.S. Effect of Blended Perfluorinated Sulfonic Acid Ionomer Binder on the Performance of Catalyst Layers in Polymer Electrolyte Membrane Fuel Cells 2023.
- Hutapea, Y.A.; Nishihara, M.; Gautama, Z.A.R.; Mufundirwa, A.; Lyth, S.M.; Sugiyama, T.; Nagayama, M.; Sasaki, K.; Hayashi, A. Reduction of oxygen transport resistance in PEFC cathode through blending a high oxygen permeable polymer. Journal of Power Sources 2023, 556, 232500. [Google Scholar] [CrossRef]
- Fang, S.; Liu, G.; Li, M.; Zhang, H.; Yu, J.; Zhang, F.; Pan, M.; Tang, H. Tailoring Ionomer Chemistry for Improved Oxygen Transport in the Cathode Catalyst Layer of Proton Exchange Membrane Fuel Cells. ACS Applied Energy Materials 2023, 6, 3590–3598. [Google Scholar] [CrossRef]
- Braaten, J.P.; Kariuki, N.N.; Myers, D.J.; Blackburn, S.; Brown, G.; Park, A.; Litster, S. Integration of a high oxygen permeability ionomer into polymer electrolyte membrane fuel cell cathodes for high efficiency and power density. Journal of Power Sources 2022, 522, 230821. [Google Scholar] [CrossRef]
- Doo, G.; Yuk, S.; Lee, J.H.; Choi, S.; Lee, D.H.; Lee, D.W.; Hyun, J.; Kwon, S.H.; Lee, S.G.; Kim, H.T. Nano-scale control of the ionomer distribution by molecular masking of the Pt surface in PEMFCs. Journal of Materials Chemistry A 2020, 8, 13004–13013. [Google Scholar] [CrossRef]
- Lee, J.H.; Doo, G.; Kwon, S.H.; Kang, H.; Choi, S.; Yim, S.D.; Kim, H.T.; Lee, S.G. Controlling ionomer film morphology through altering Pt catalyst surface properties for polymer electrolyte membrane fuel cells. ACS Applied Polymer Materials 2020, 2, 1807–1818. [Google Scholar] [CrossRef]
Figure 1.
3D representation of carbon (black), ionomer (orange) and water (blue) distributions in a virtually reconstructed heterogeneous CL, and steps followed in the generation algorithm: (a) spherical carbon particles (black) are added randomly to form an agglomerated structure that joins the bottom and top surfaces of the image, (b) ionomer (light grey) is randomly added in semi-spherical regions around carbon particles, and (c) water (white) is added in semi-spherical regions around ionomer films. (d) Mesoscopic spherical pores are additionally incorporated in ionomer to create porous ionomer.
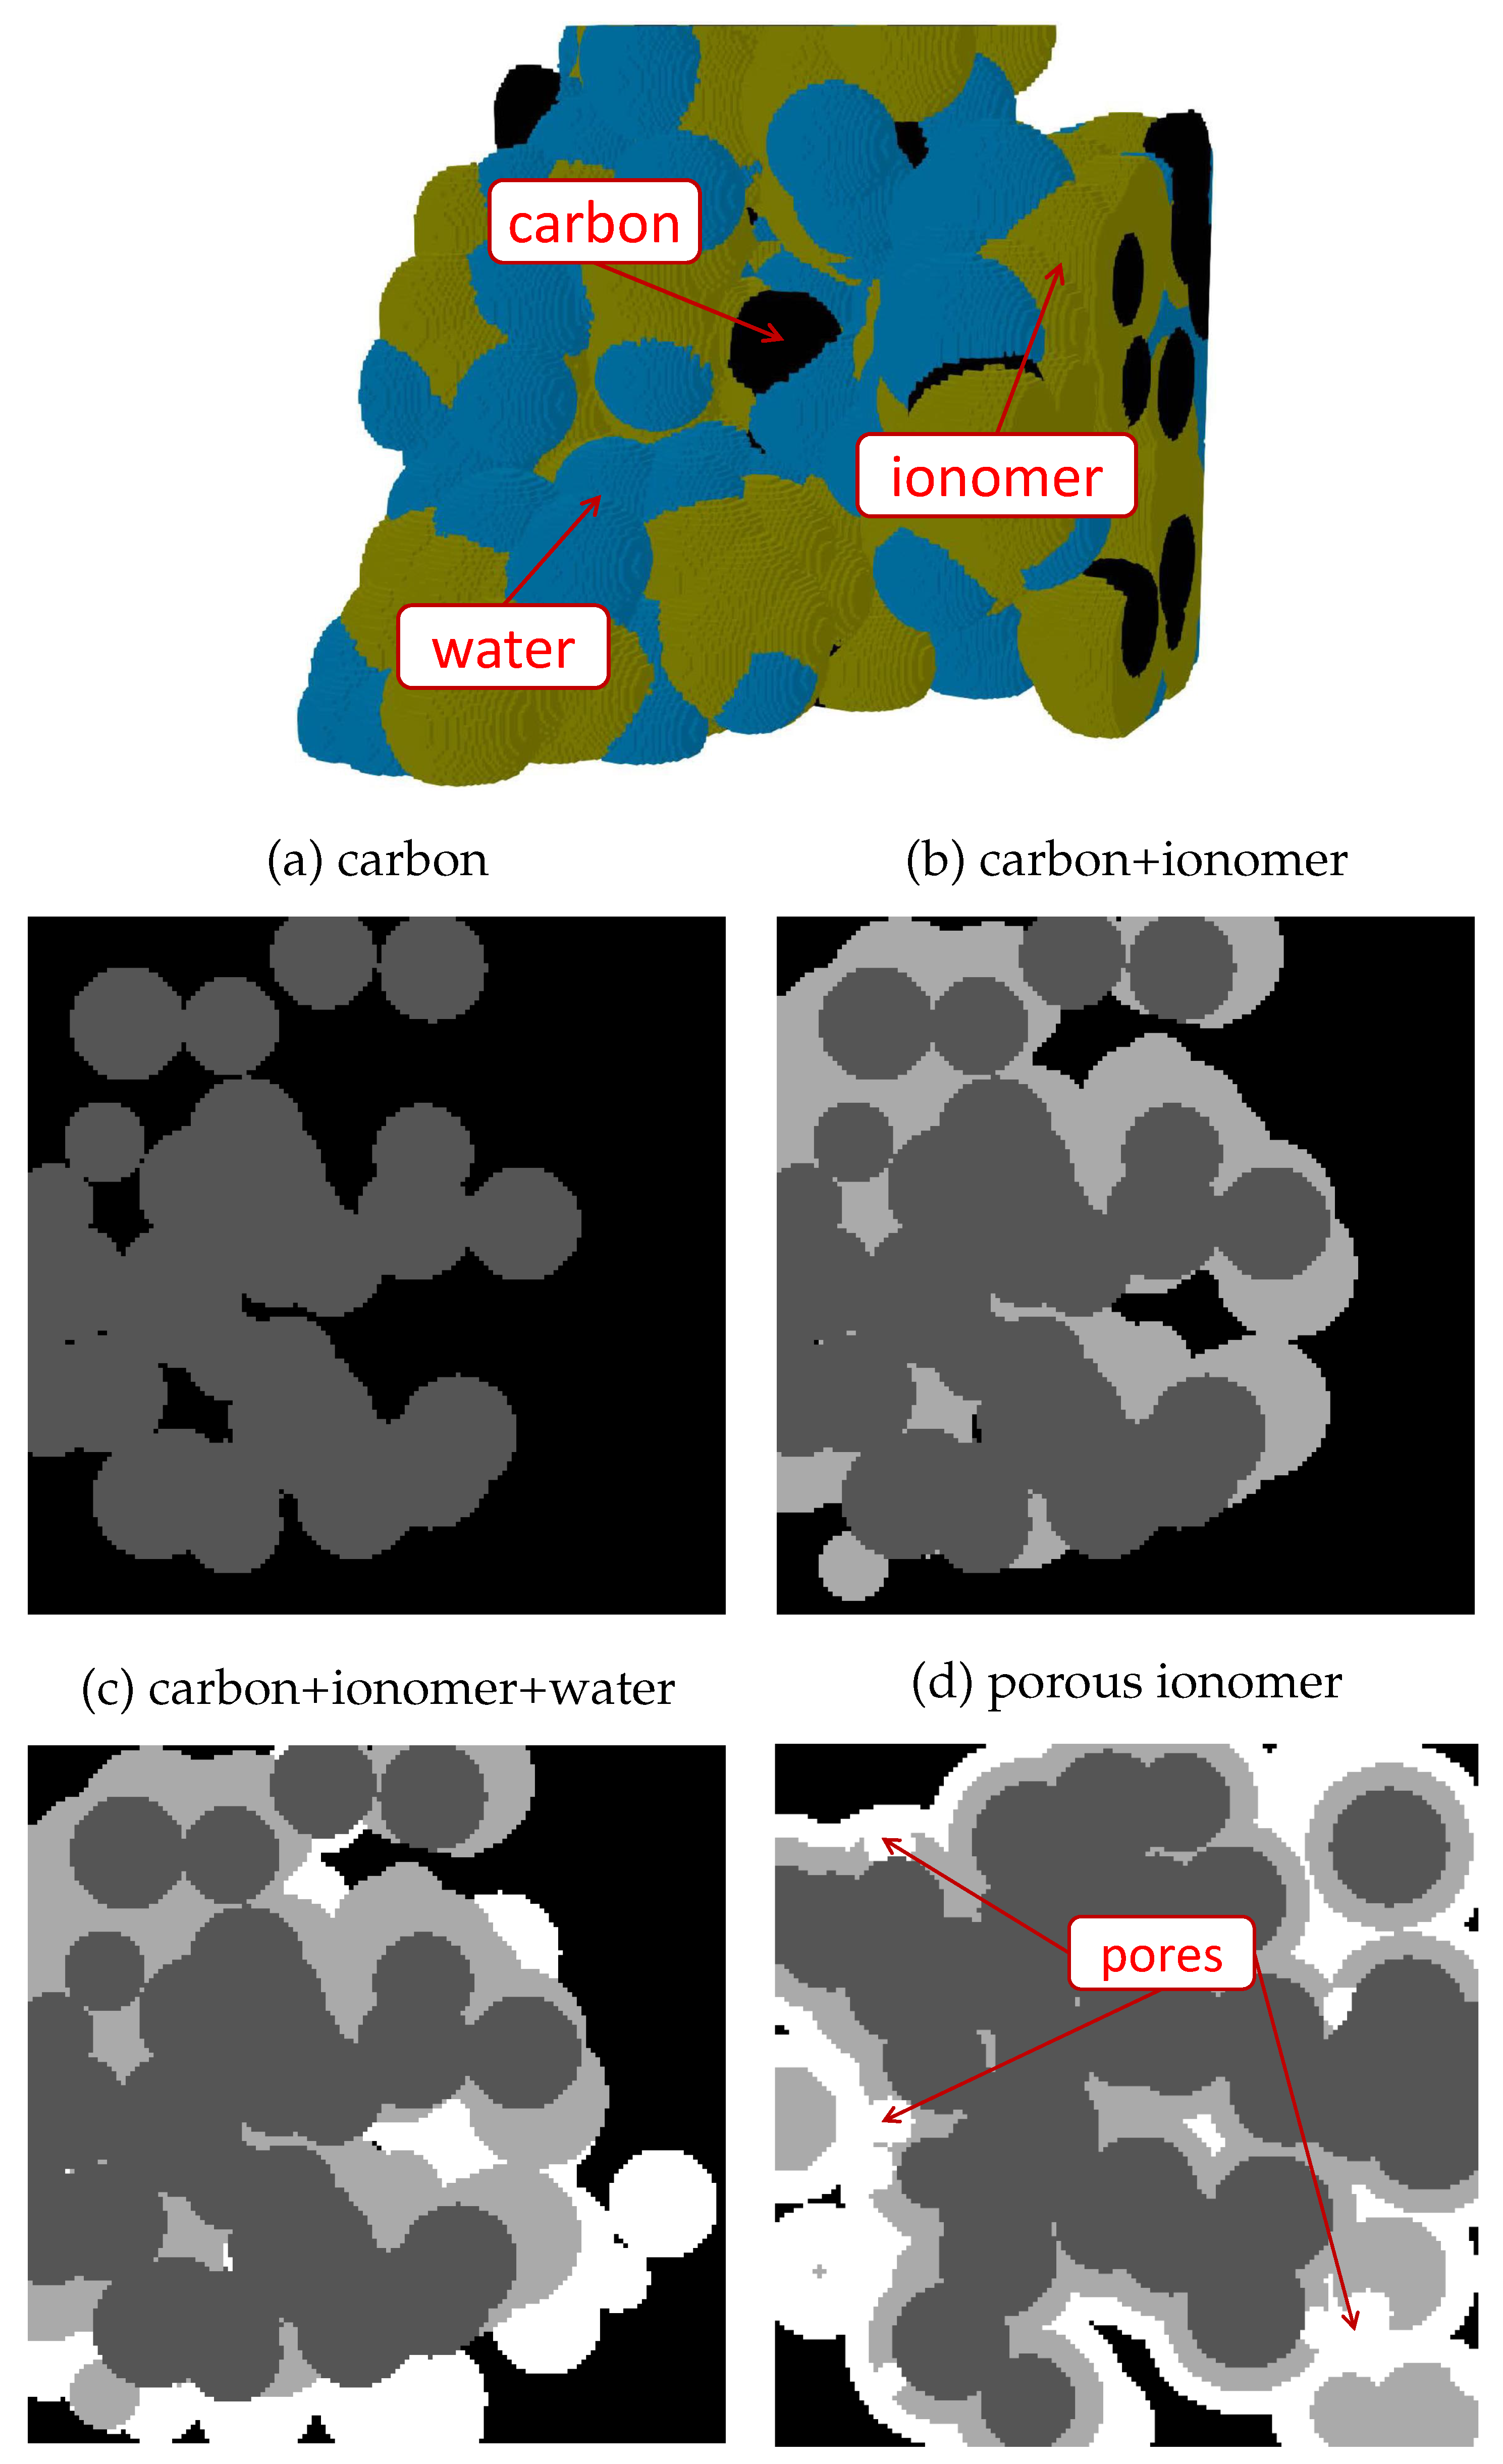
Figure 2.
Schematic of the boundary conditions used in the calculations of and ionic transport resistances. Dirichlet boundary conditions are prescribed in the upper and lower exterior surfaces of the domain () and the interior ionomer/carbon surface (magenta) where the reaction takes place () – water/carbon interface is also considered for meso-porous ionomer. Symmetry conditions are set at sidewalls of the representative domain. The void space was removed in the distribution corresponding to the ionic transport resistance since it is meaningless.
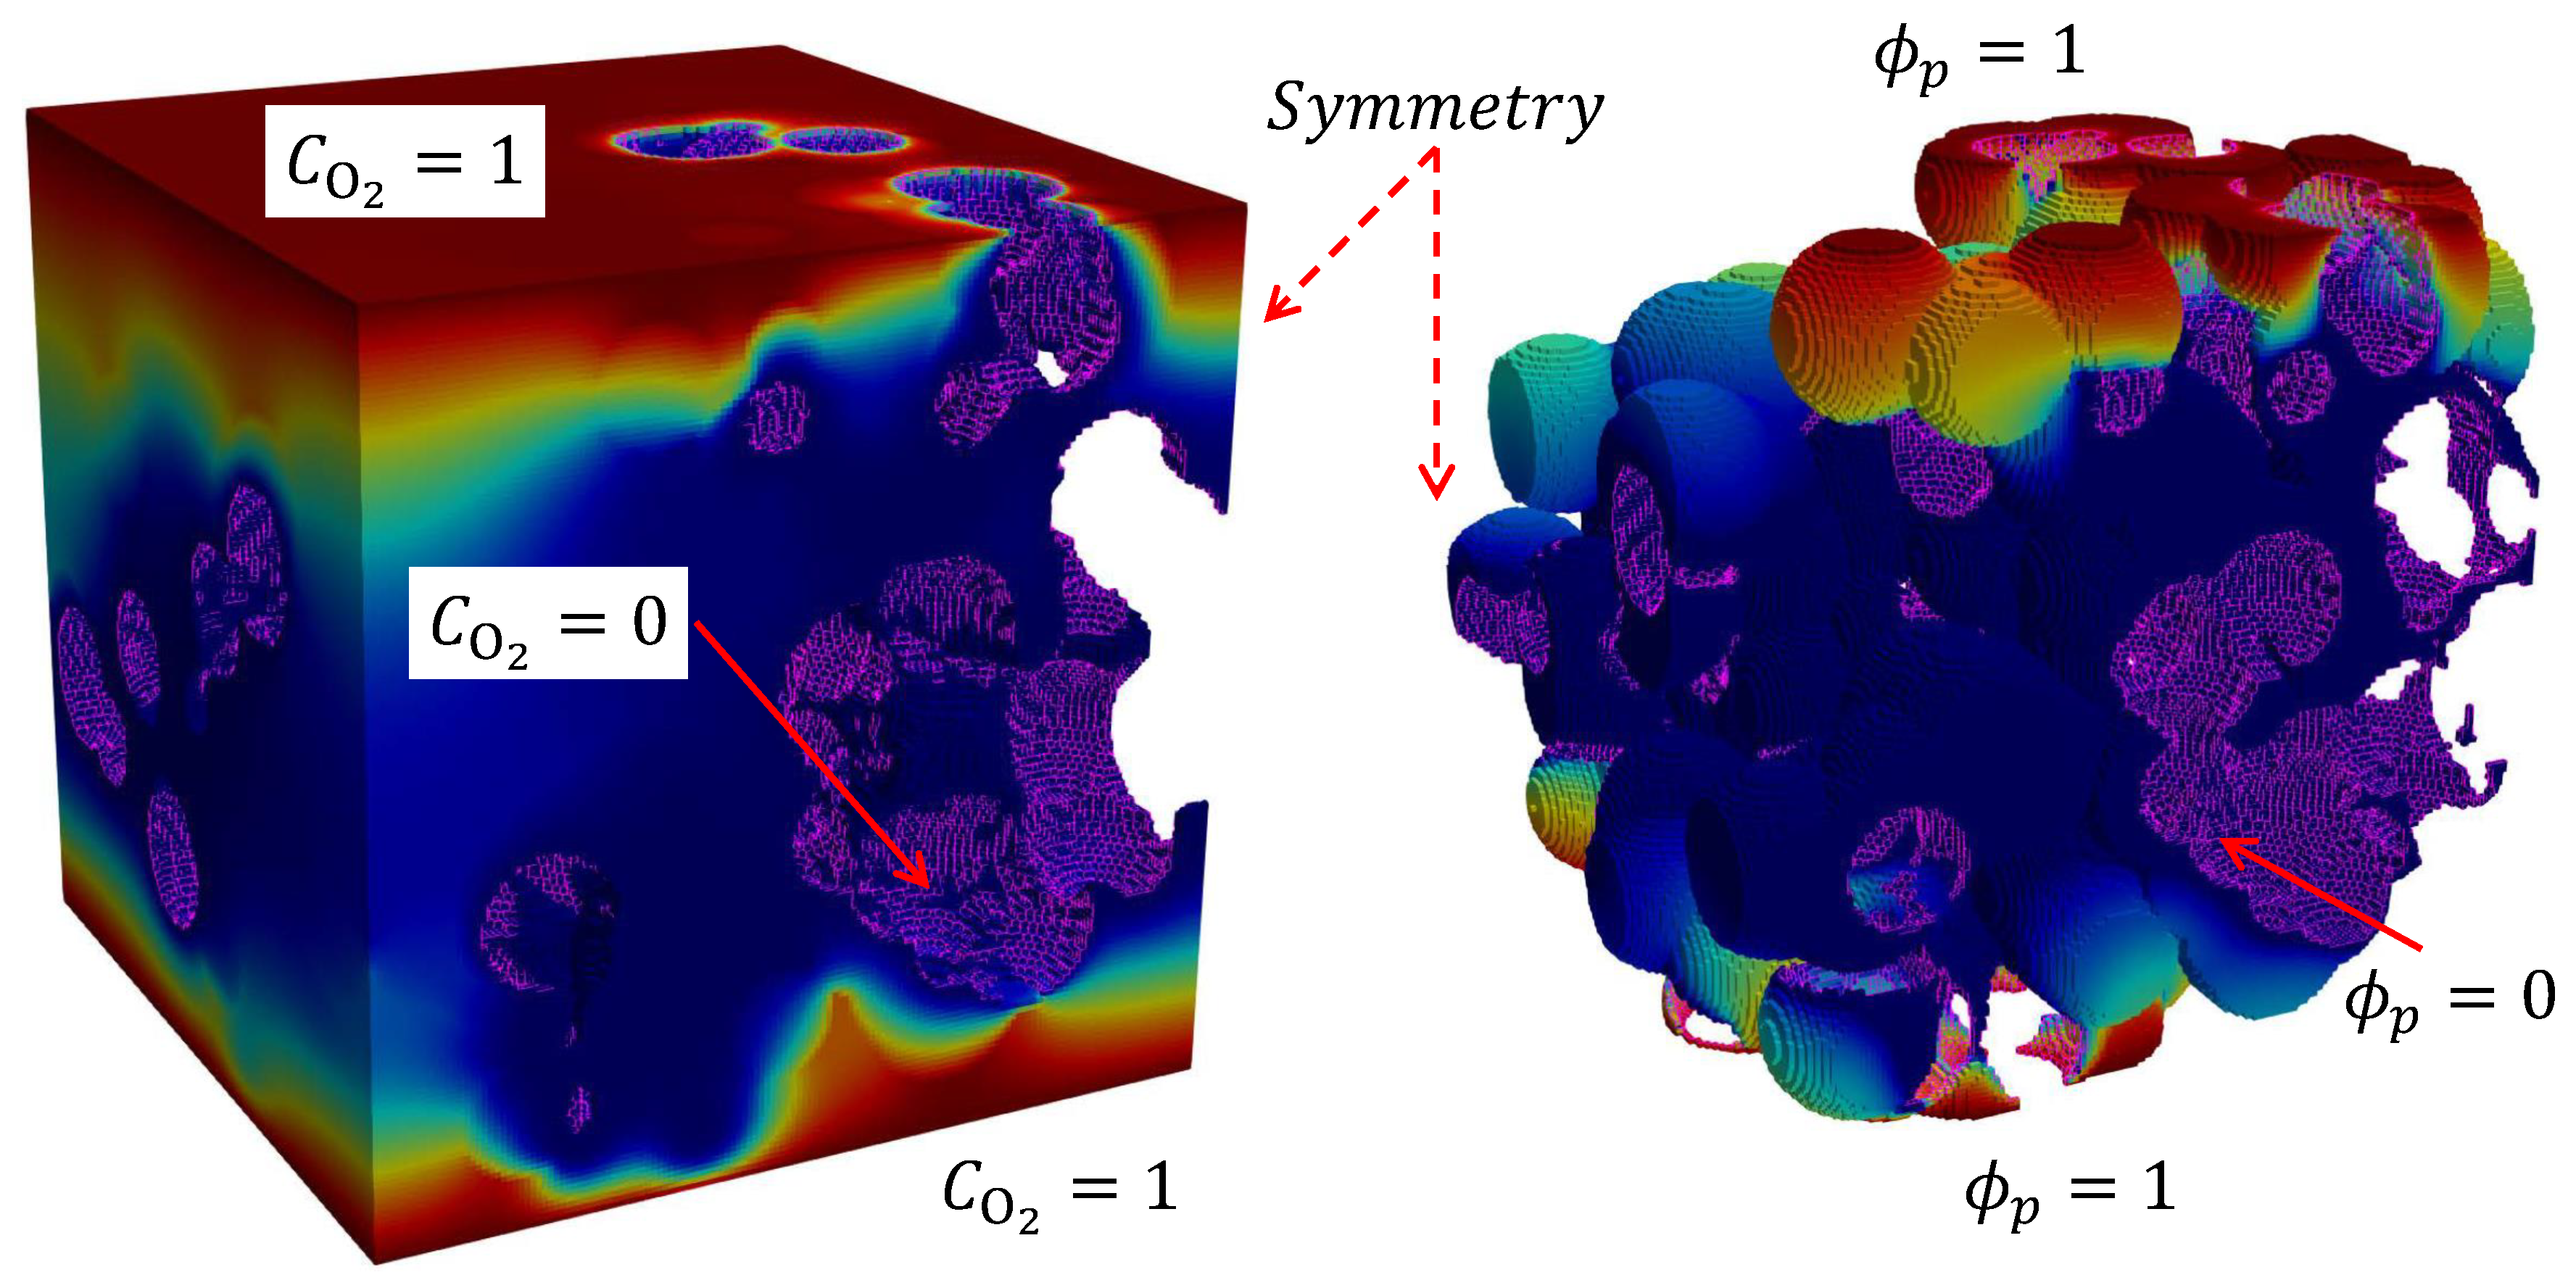
Figure 3.
(a) Local transport resistance normalized with respect to Pt surface area, , computed in simulations with a heterogeneous CL () compared to previous experimental data presented in the literature [39,40,41,42,43,44,45]. (b) Effective diffusivity coefficient of in ionomer, , used as a baseline value in the work compared to previous experimental data reported for Nafion [25] and numerical data considered in pore-scale simulations [23,24].
Figure 4.
(a) Heterogeneous CL microstructures corresponding to and various porosities, . (b) Variation of local and ionic transport resistances normalized with respect to Pt surface area, and , as a function of porosity, , corresponding to three carbon volume fractions, . The error bars indicate the range of variation of results among different sample realizations.
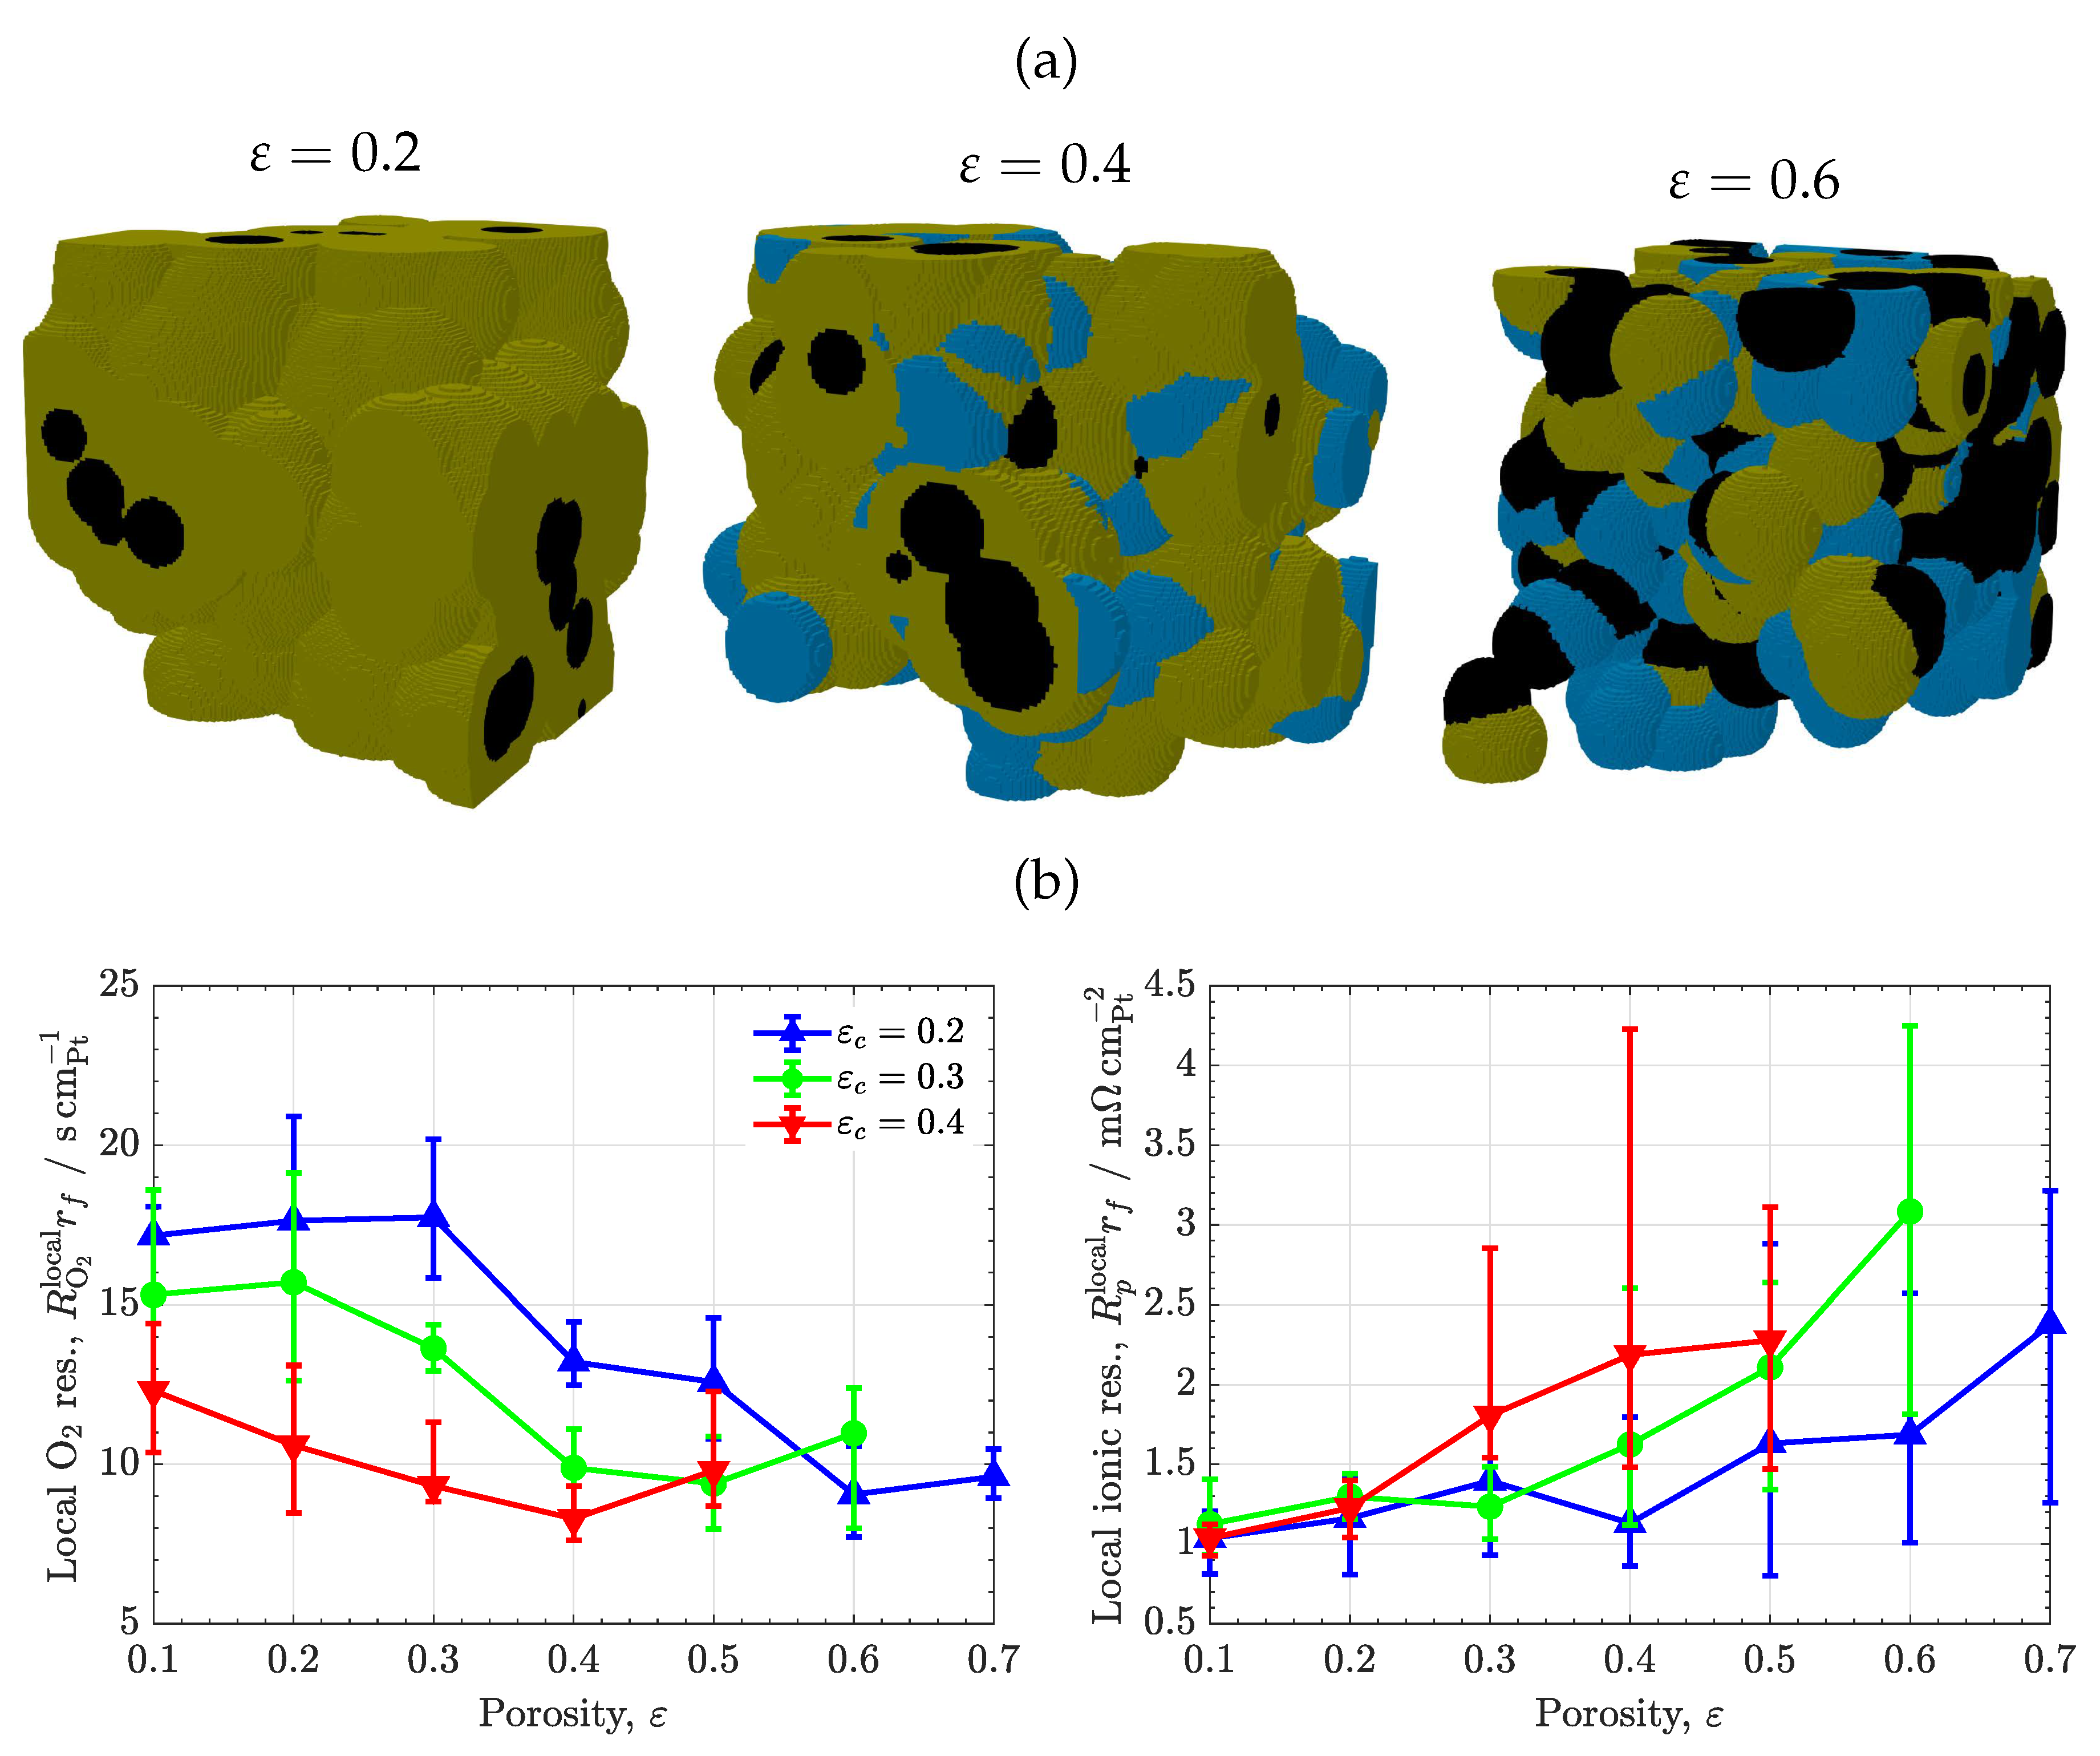
Figure 5.
(a) Microstructures of CLs with heterogeneous, uniform and idealized vertically-aligned ionomer morphologies (). (b) Variation of local and ionic transport resistances normalized with respect to Pt surface area, and , as a function of porosity, , corresponding to CLs with heterogeneous, uniform and idealized vertically-aligned ionomer morphologies (). The error bars indicate the range of variation of results among different sample realizations.
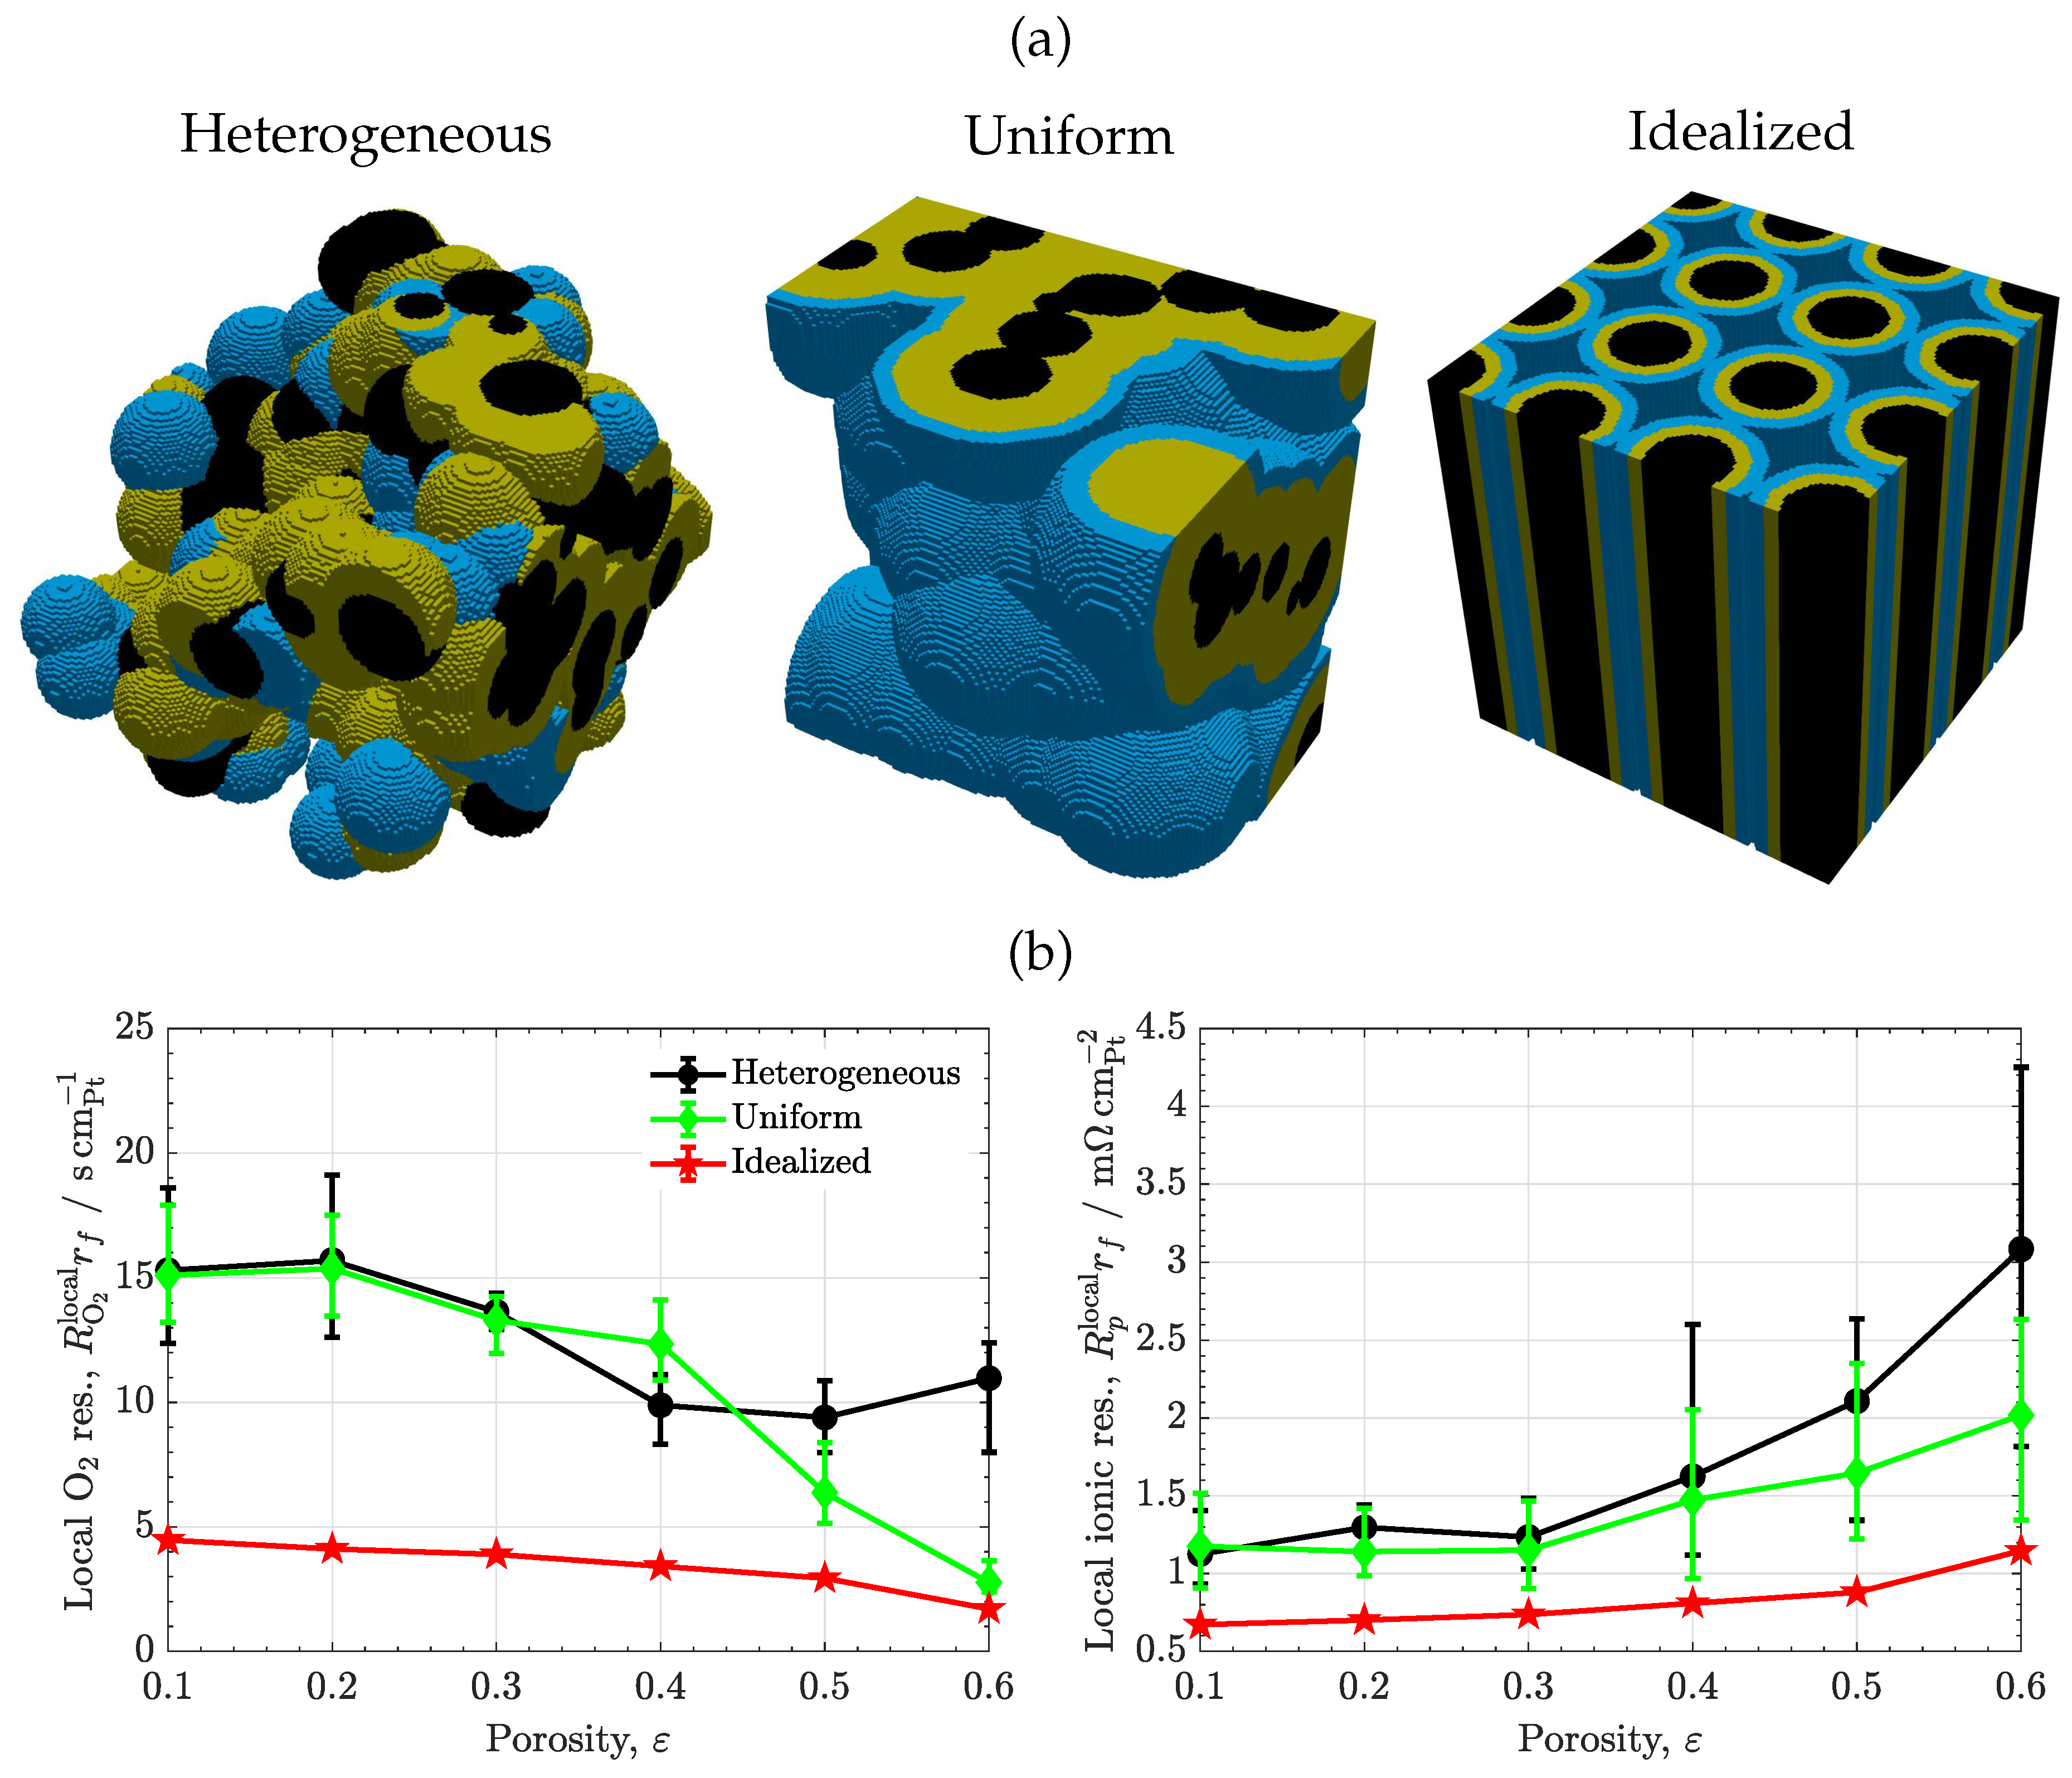
Figure 6.
(a) Histograms of local flux at ionomer/carbon interface corresponding to CL microstructures with heterogeneous and uniform ionomer morphologies. (b) Histograms of local flux at ionomer/carbon and water/carbon interfaces corresponding to a CL with meso-porous ionomer.
Figure 6.
(a) Histograms of local flux at ionomer/carbon interface corresponding to CL microstructures with heterogeneous and uniform ionomer morphologies. (b) Histograms of local flux at ionomer/carbon and water/carbon interfaces corresponding to a CL with meso-porous ionomer.
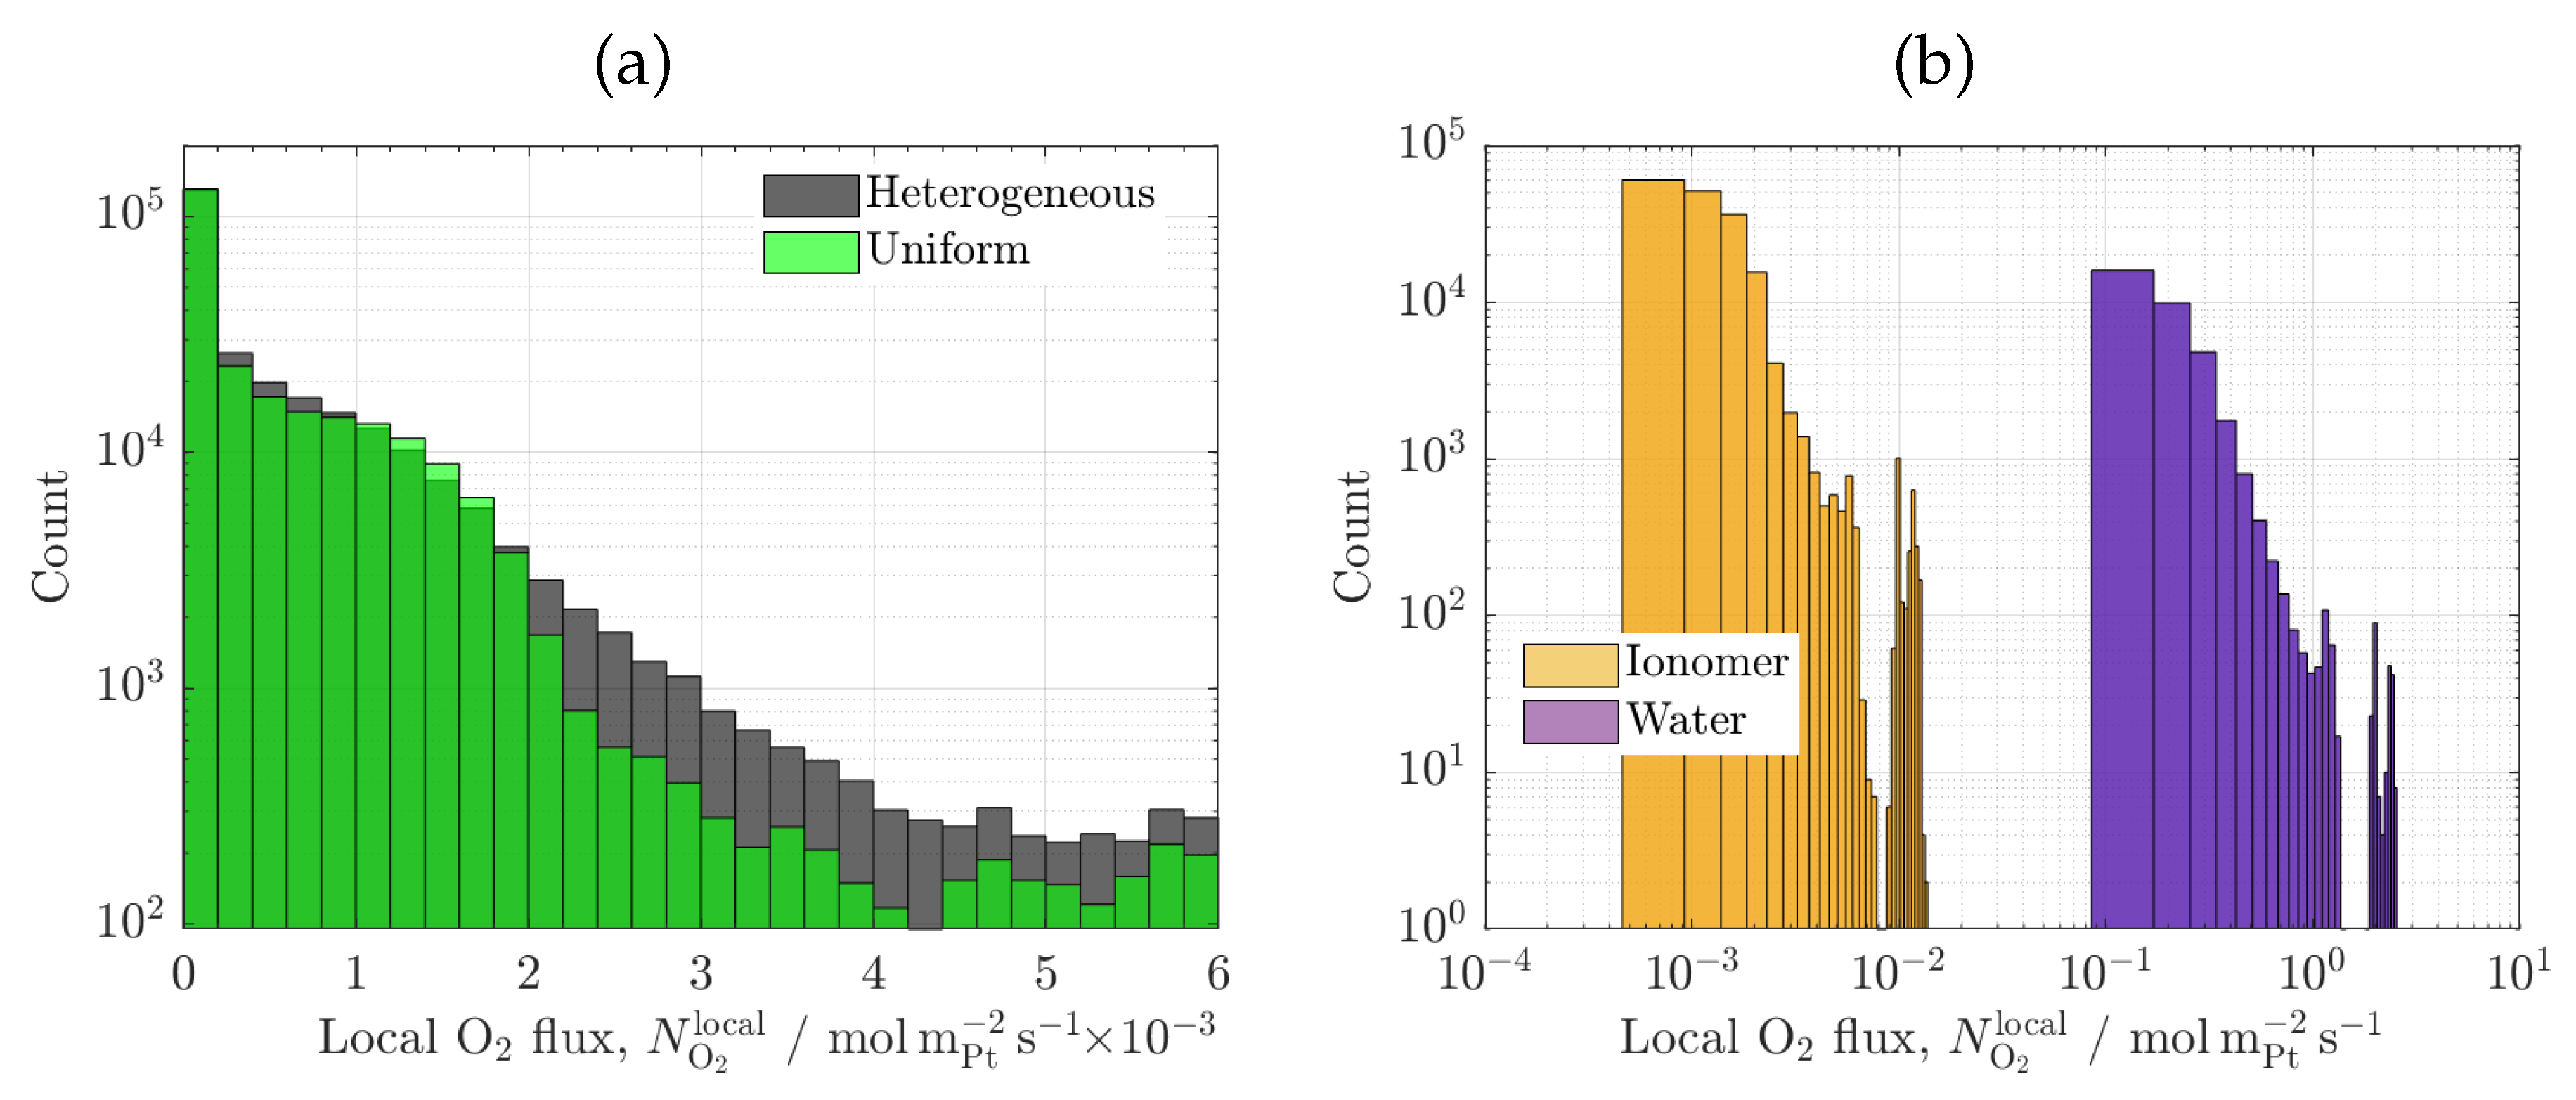
Figure 7.
Variation of (a) local , , and (b) ionic. , transport resistances as a function of porosity, , corresponding to three effective diffusivities of in ionomer, (). The error bars indicate the range of variation of results among different sample realizations.
Figure 7.
Variation of (a) local , , and (b) ionic. , transport resistances as a function of porosity, , corresponding to three effective diffusivities of in ionomer, (). The error bars indicate the range of variation of results among different sample realizations.
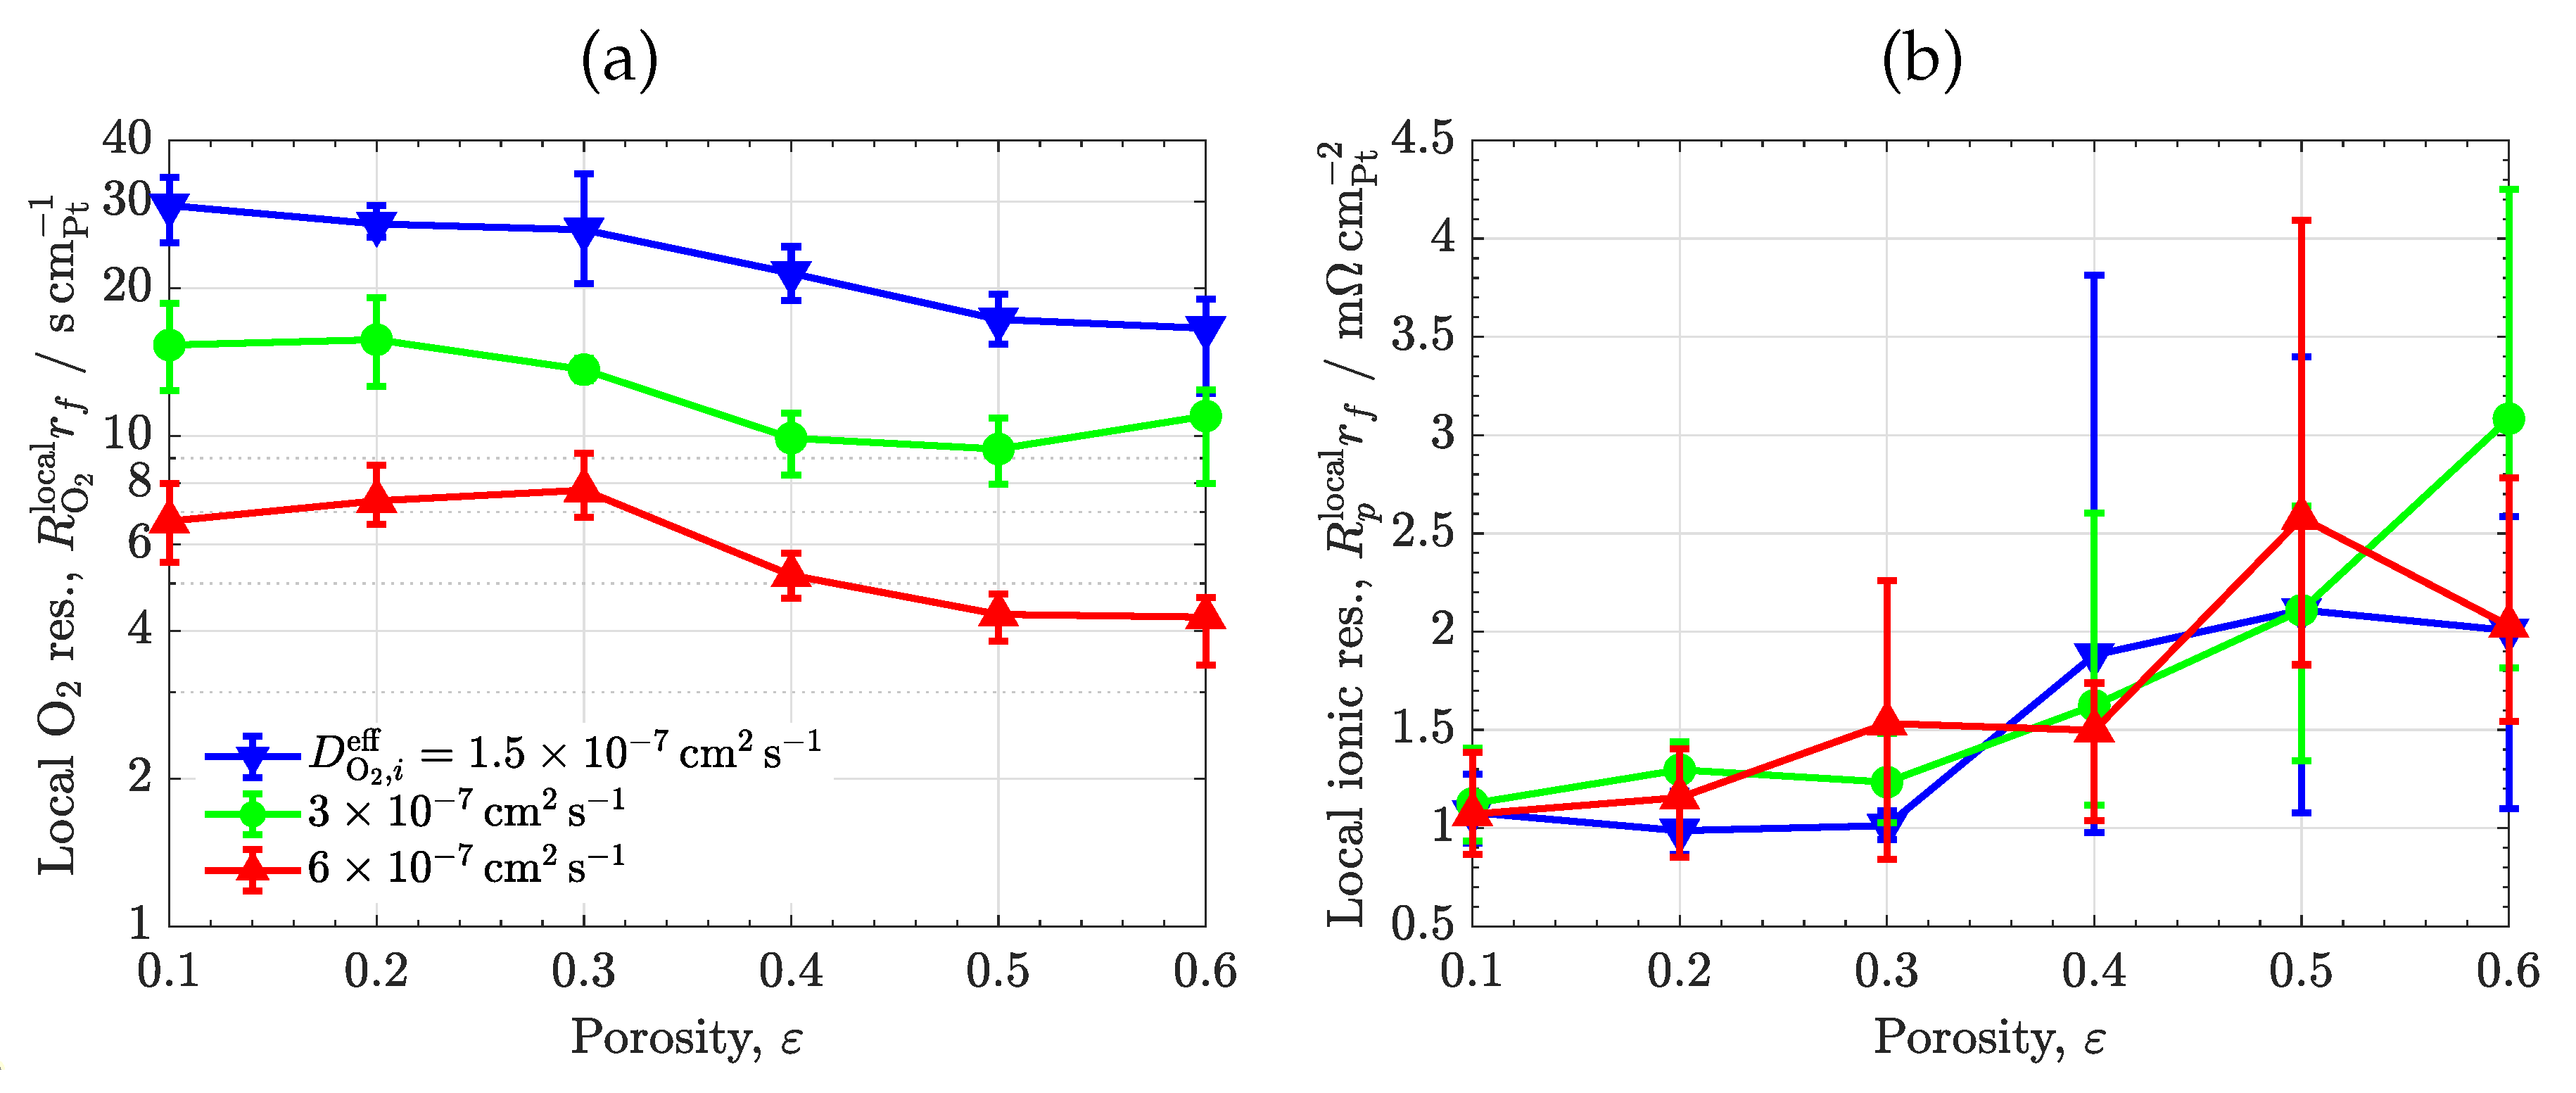
Figure 8.
a) Microstructures of CLs with uniform non-porous and uniform meso-porous ionomer morphologies (). (b) Variation of local and ionic transport resistances normalized with respect to Pt surface area, and , as a function of porosity, , corresponding to CLs with uniform non-porous and uniform meso-porous ionomer morphologies (). The error bars indicate the range of variation of results among different sample realizations.
Disclaimer/Publisher’s Note: The statements, opinions and data contained in all publications are solely those of the individual author(s) and contributor(s) and not of MDPI and/or the editor(s). MDPI and/or the editor(s) disclaim responsibility for any injury to people or property resulting from any ideas, methods, instructions or products referred to in the content. |
© 2023 by the authors. Licensee MDPI, Basel, Switzerland. This article is an open access article distributed under the terms and conditions of the Creative Commons Attribution (CC BY) license (http://creativecommons.org/licenses/by/4.0/).
Copyright: This open access article is published under a Creative Commons CC BY 4.0 license, which permit the free download, distribution, and reuse, provided that the author and preprint are cited in any reuse.


