1. Introduction
Automotive braking performance directly affects the safety of automobile operation. It is the main technical means to detect the technical status of automobile braking systems and ensure the safety of automobile operation that the automotive brake performance platform testing [
1]. The National Standard of the People’s Republic of China, GB 38900-2020 “Items and methods for safety technology inspection of motor vehicles” and GB 7258-2017 “Technical specifications for safety of power-driven vehicles operating on roads” stipulate that the anti-force rolling brake testing platform is the conventional equipment for automotive brake performance testing of motor vehicles [
2,
3,
4], which has the advantages of small size, simple operation, high repeatability of test data, and stable testing [
5,
6]. However, there are still differences between the platform testing process and the real road driving situation of motor vehicle braking performance. The braking performance test results are affected by a variety of factors, such as the braking force calibration process, reducer, surface adhesion coefficient of the roller, placement angle, tire pressure, vehicle load, etc., which seriously affects the accuracy of automotive brake performance testing [
1,
4,
5,
6,
7,
8,
9,
10].
In recent years, experts have conducted relevant studies on the factors affecting the testing results of the anti-force rolling brake testing platform. For example, Zhao Yingxun found that there is a misjudgment of the anti-force rolling brake testing platform in the detection of automotive braking force [
8]. Some corresponding improvable strategies of using high adhesion performance rollers and designing suitable placement angles were put forward. Li Shumin et al. [
9]. analyzed the factors affecting the detection of flat and roller test platform comprehensively, and pointed out the load and adhesion rate as the main influencing factors. Ge Zai et al. [
6]. proposed that the backward speed of the testing vehicle would lead to the detection of the maximum braking force smaller than the actual value; etc [
7,
10]. Although, the friction loss of the brake testing platform is one of the important factors affecting the detection of vehicle braking force, there are few researches considering this impact. It is great significance for evaluating the braking performance of vehicles correctly that investigating the influencing factors and laws of friction loss on brake testing platform and subtracting the friction loss from the braking force test results.
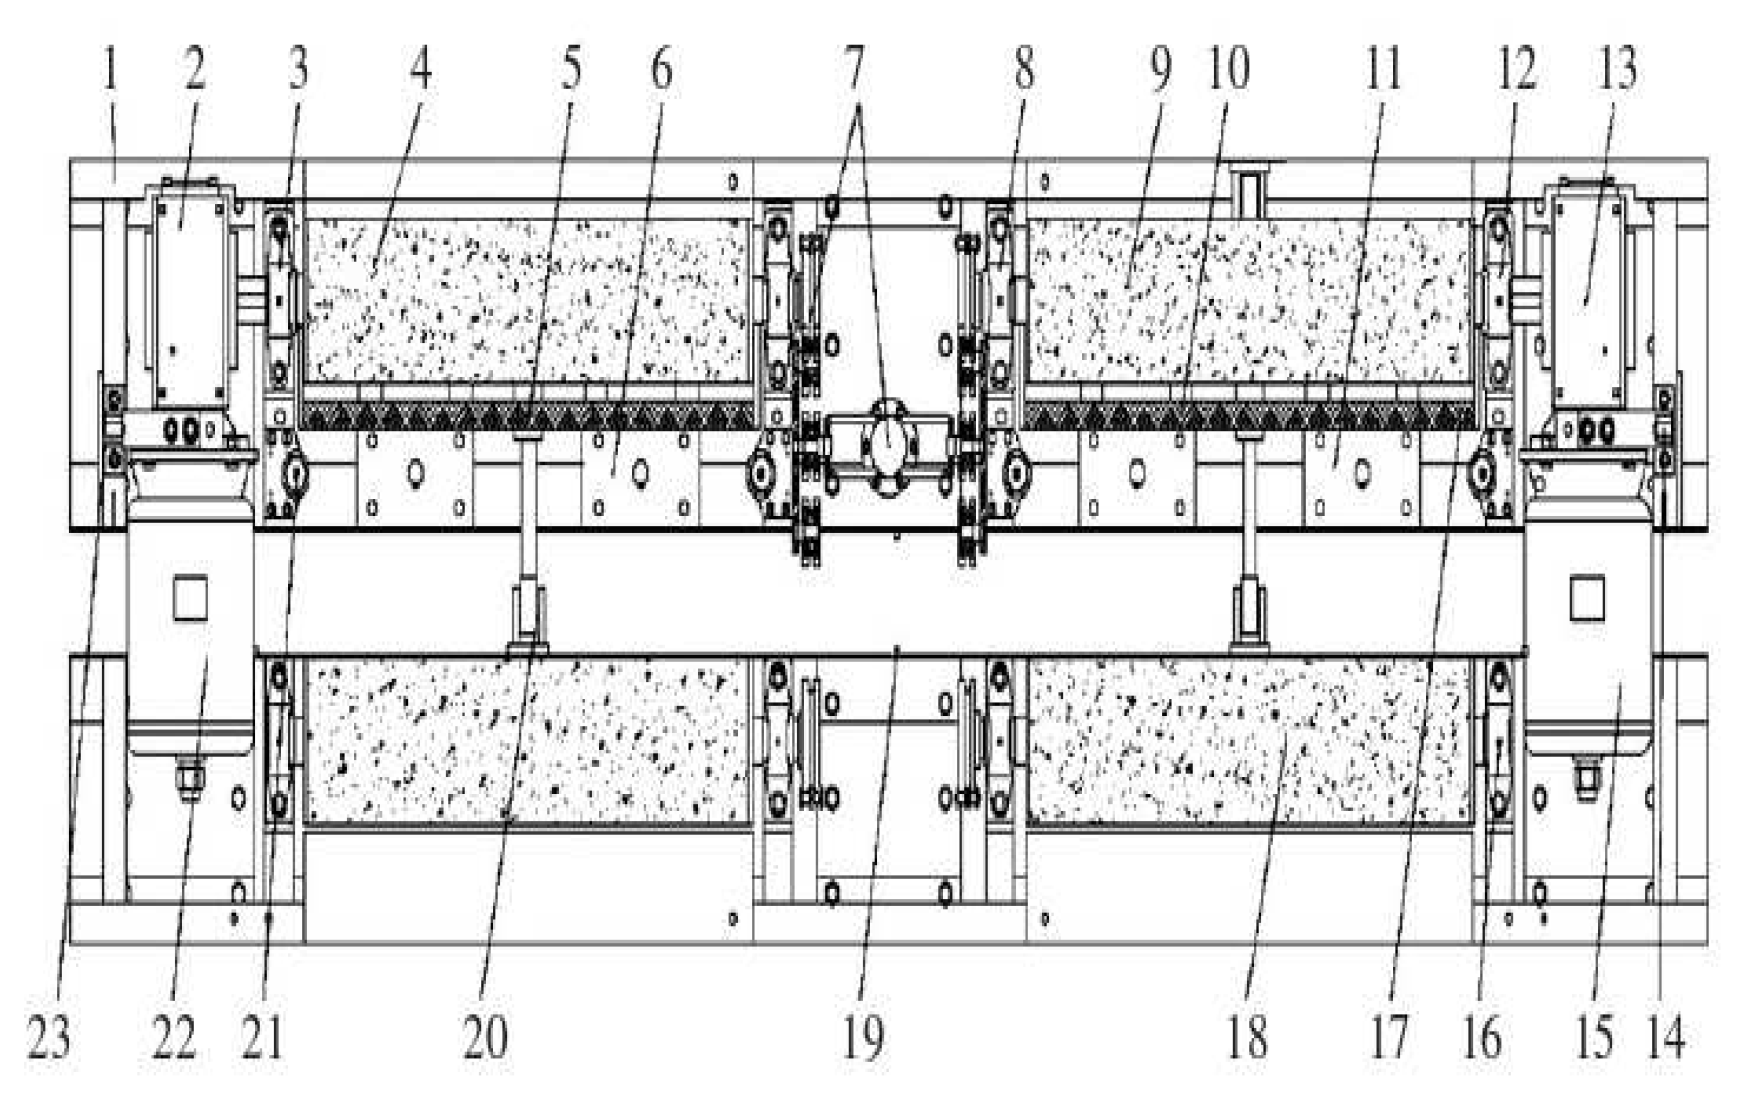
In the previous studies, an anti-force rolling brake testing platform with automatic adjustment of the roller axis distance was developed [
11]. The test platform consists of five parts: roller group, roller drive group, braking force measurement device, lifting device and control system, as shown in
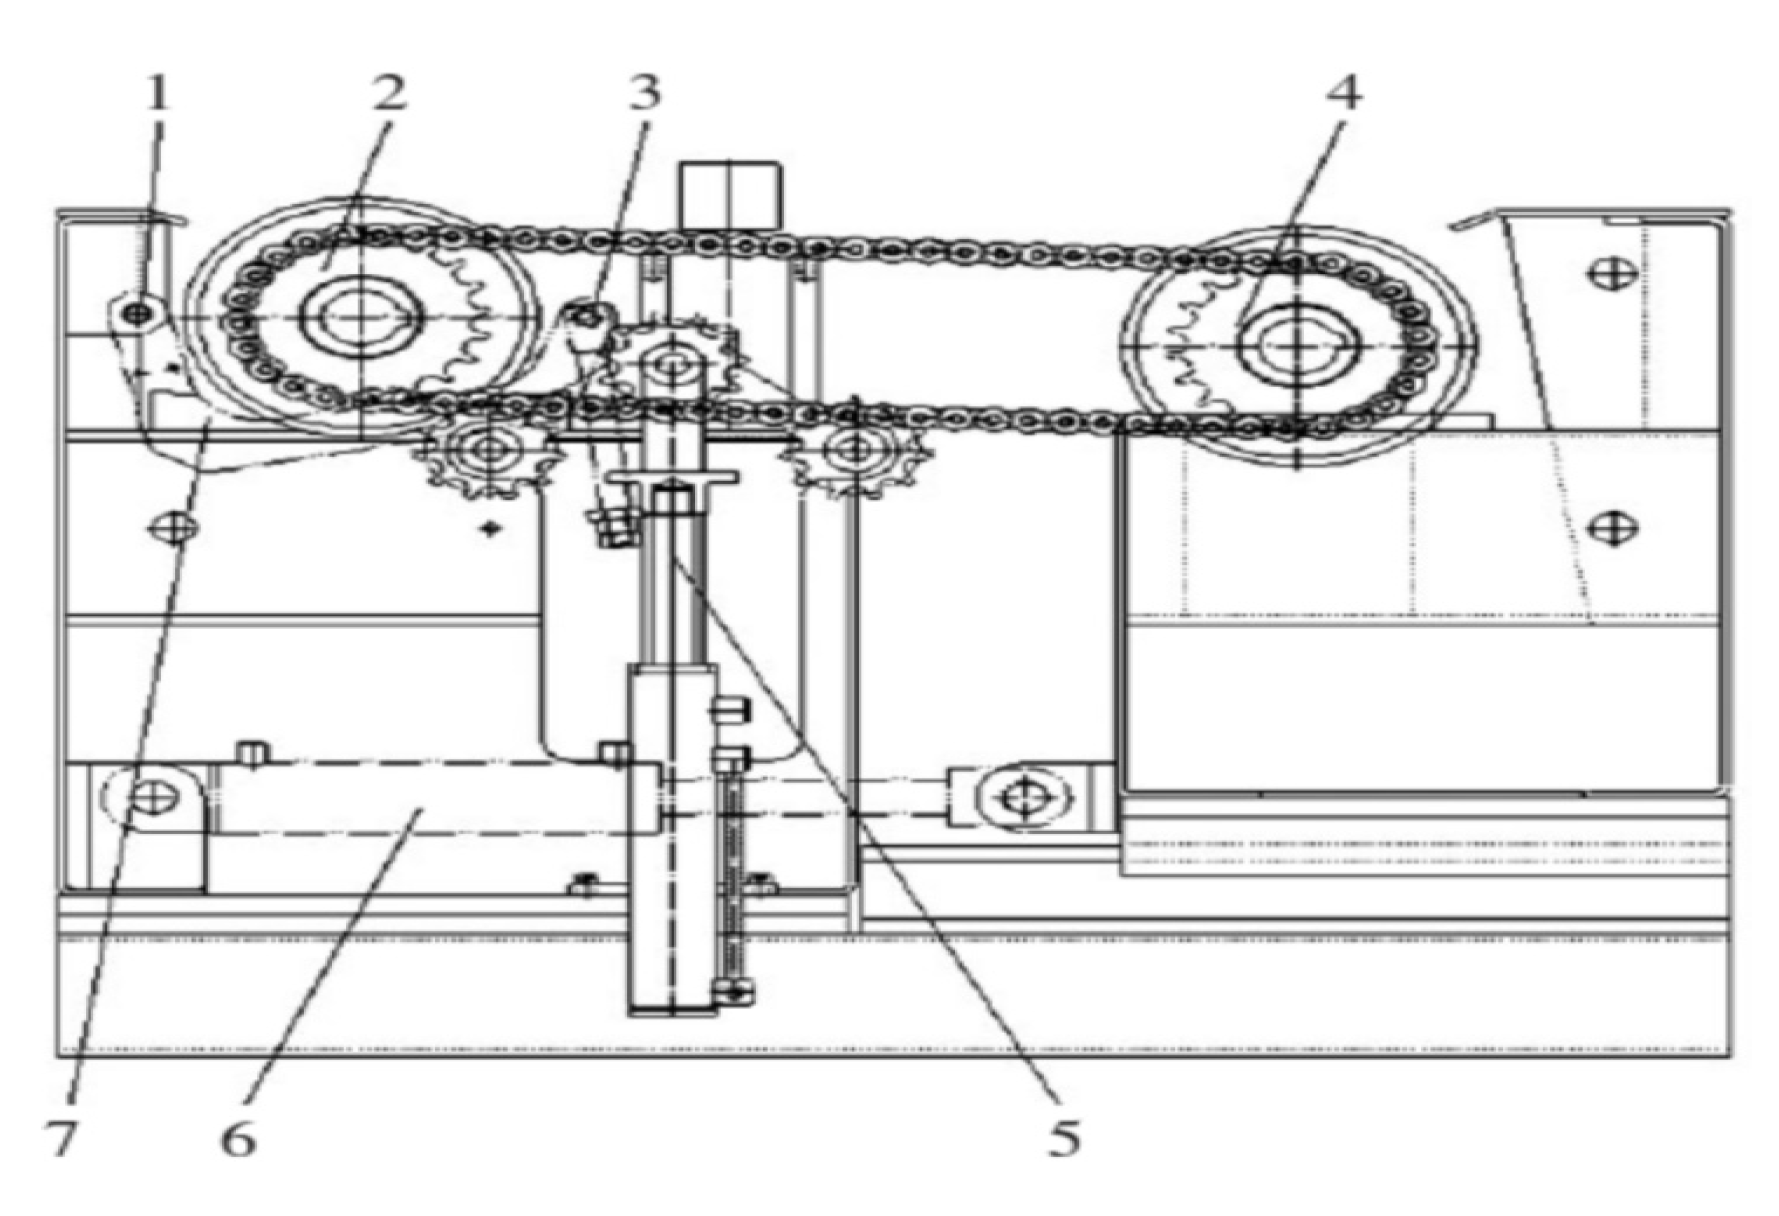
Figure 1. The main part of the roller group consists of the main roller, assistant roller and the third roller, as shown in the
Figure 2. According to the GB/T 13564-2022, the main and assistant roller diameter is set to 245 mm. The assistant roller is installed on the frame of the mobile rail, the horizontal position is adjusted through the hydraulic system, the adjustment spacing is 471~771 mm. The wheel stays on the main and assistant roller, and 1/2 of the angle between the center of the wheel and the line connecting the centers of the two rollers is the placement angle, the diameter of the third roller is 40 mm. When the vehicle drives into the test bench, the wheel presses the third roller down, the drive motor operates, and the test bench starts to work. In this paper, regarding the accuracy of automotive braking performance testing, the influence law of tire pressure, vehicle axle load, placement angle and vehicle speed on the friction loss of the anti-force rolling brake testing platform was tested and analyzed, and a corresponding friction loss model of the testing platform was constructed and its effectiveness was verified through actual vehicle tests. These examinations carried based on the anti-force rolling brake testing platform can further improve the accuracy of automotive brake performance testing, thereby increasing the reliability of automotive testing and driving safety.
2. Friction Loss
The friction loss of the anti-force rolling brake testing platform includes the one between the wheel and roller surface and another inside the brake testing platform. According to the National Standard of the People’s Republic of China GB 13564-2022 “Roller opposite forces type automobile brake tester”, the brake tester roller linear speed is 2.5±0.3 km/h [
12]. The brake tester internal friction loss of 17~19 N was measured at a speed of 2.66 km/h, the placement angle range of 37°~55°, on the brake tester without test vehicle, that is, the brake tester idling. It can be seen that the brake tester idle internal friction loss is very tiny. In this paper, the friction loss of the brake tester was studied on the anti-force rolling brake testing platform with automatic adjustment of the roller axis distance.
3. Main Influencing Factors of Friction Loss of Brake Testing Platform
The friction loss of the automotive anti-force rolling brake testing platform is mainly caused by the relative slip between the wheel and the roller during the vehicle test and the internal friction loss of the testing platform.
3.1. The Effect of Tire Pressure on Friction Loss
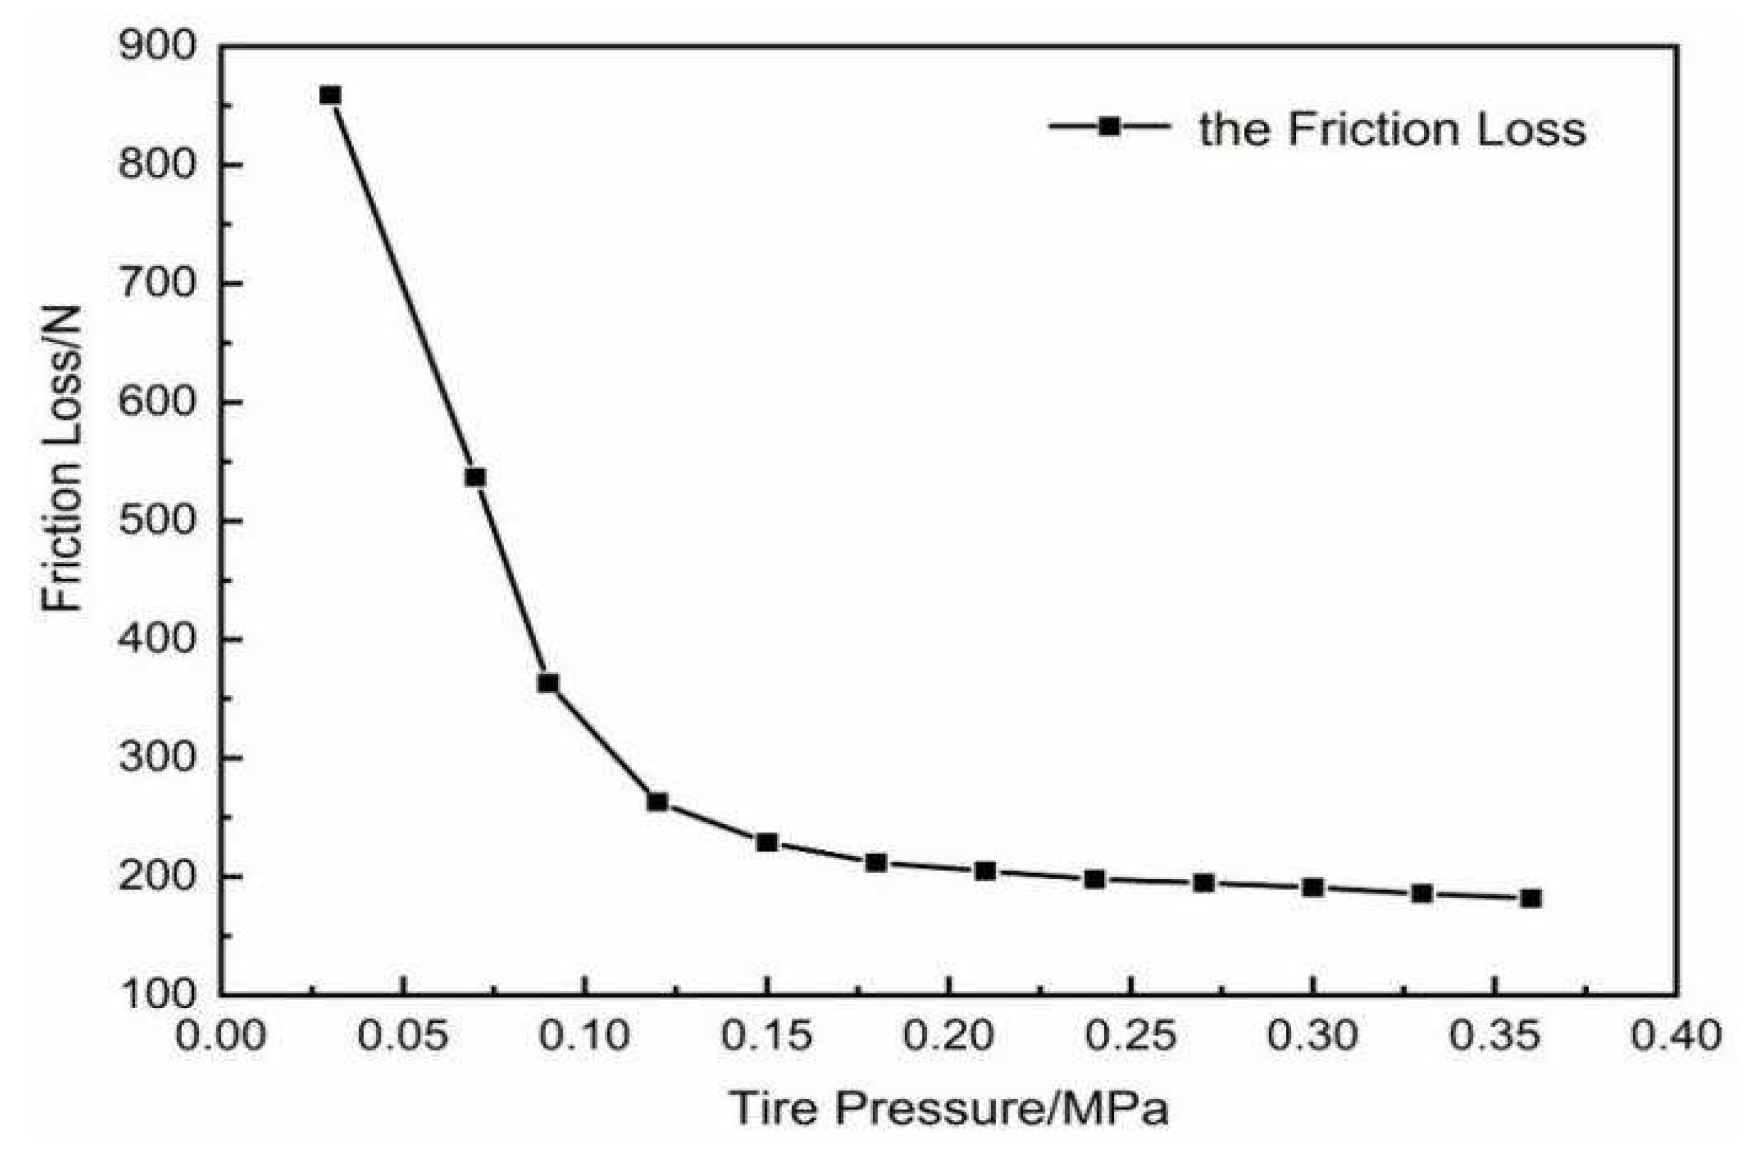
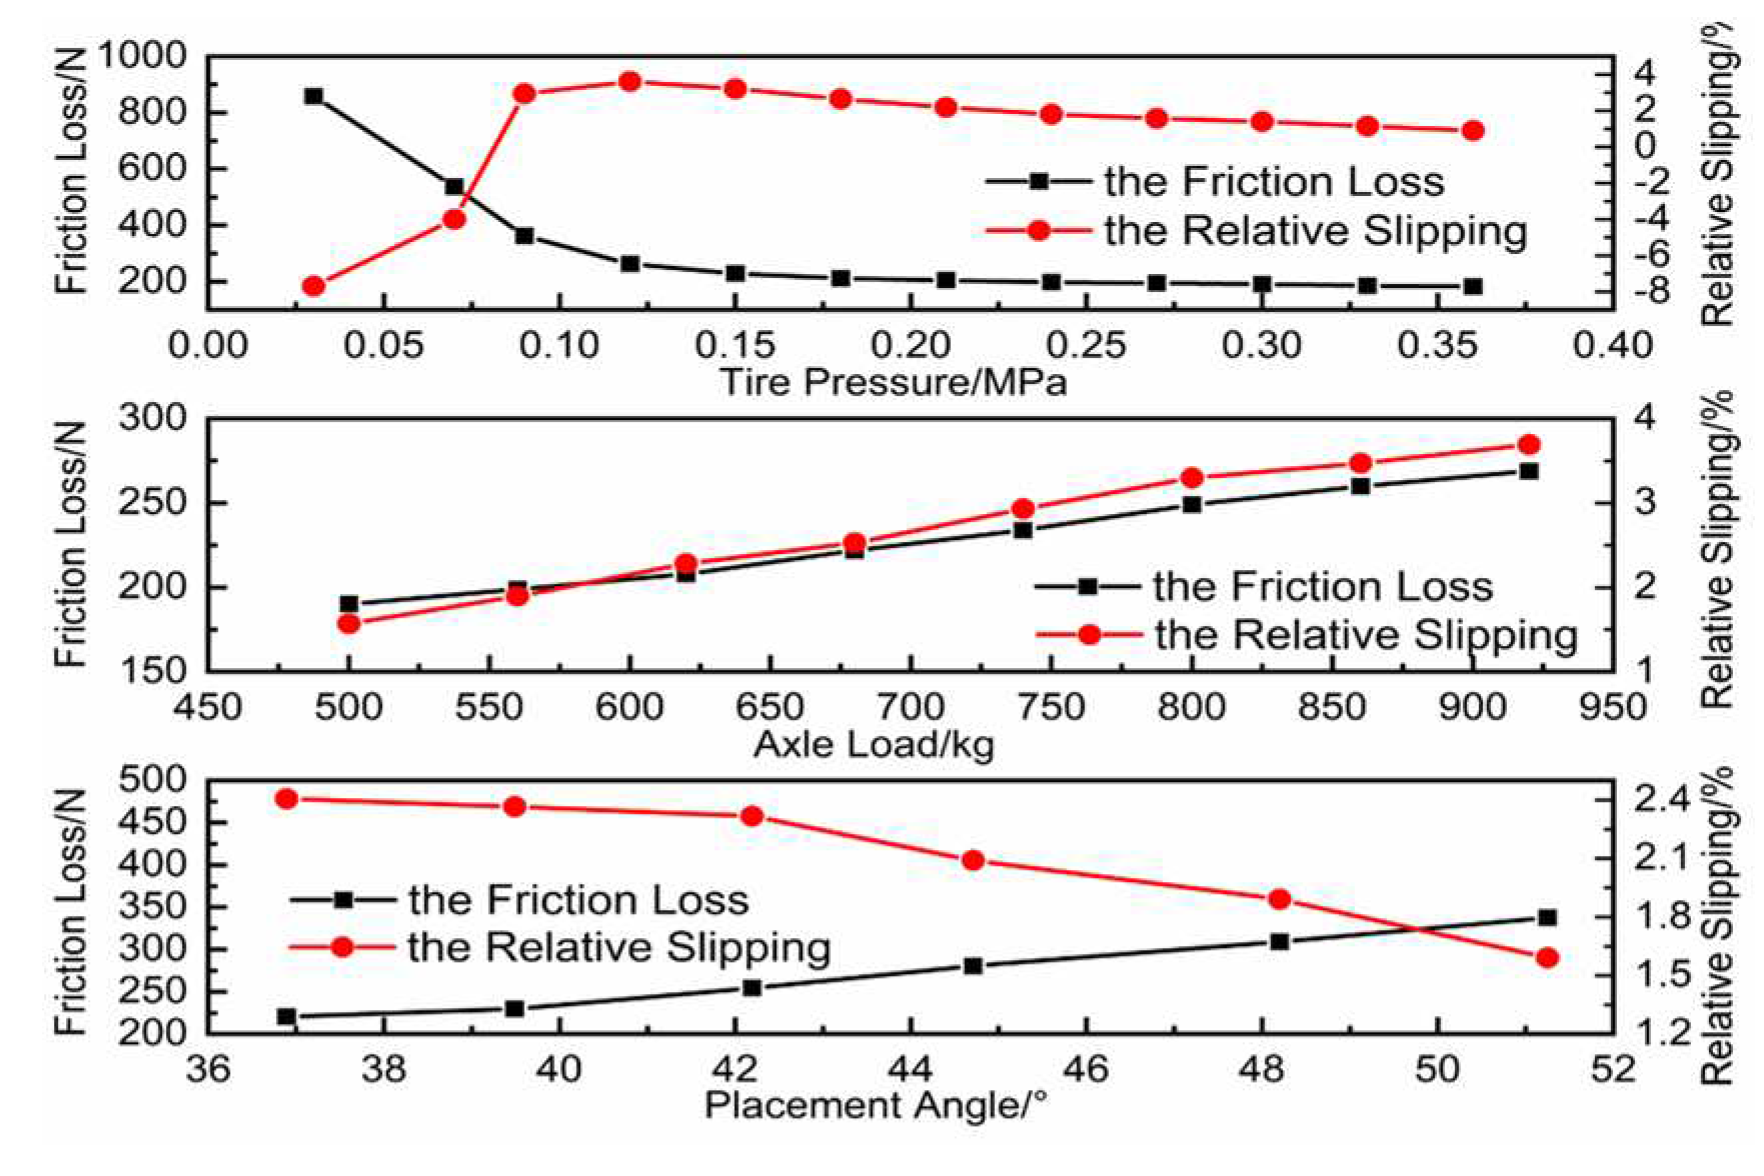
When the tire rotates with the rollers on the brake testing platform, the elastic hysteresis loss and friction loss were produced by internal friction of the tire and the relative slip between the tire and the drum. The change relationship of the measured front axle friction loss varies with tire air pressure for the Xiali A+ sedan is shown in
Figure 3.
It can be seen from
Figure 3, with the increase of tire pressure, the tire deformation decrease, resulting in a drop in the frictional resistance between the wheel and the roller surface, so as the friction loss descends. Compared to the tire pressure of 0.36 MPa, that of 0.03 MPa displays a 78.8% reduce in the friction loss. When the tire pressure is less than 0.15 MPa, the tire deformation is great, the tire elastic hysteresis loss become larger, and the frictional resistance increases significantly during rolling. On the contrary, as the tire inflation pressure increases, the tire contacted with the hard roller deforms smaller, the hysteresis loss fell down, the rolling resistance diminishes, and the friction loss decreases when the tire pressure is greater than 0.15 MPa.
3.2. Effect of Vehicle Axle Load on Friction Loss
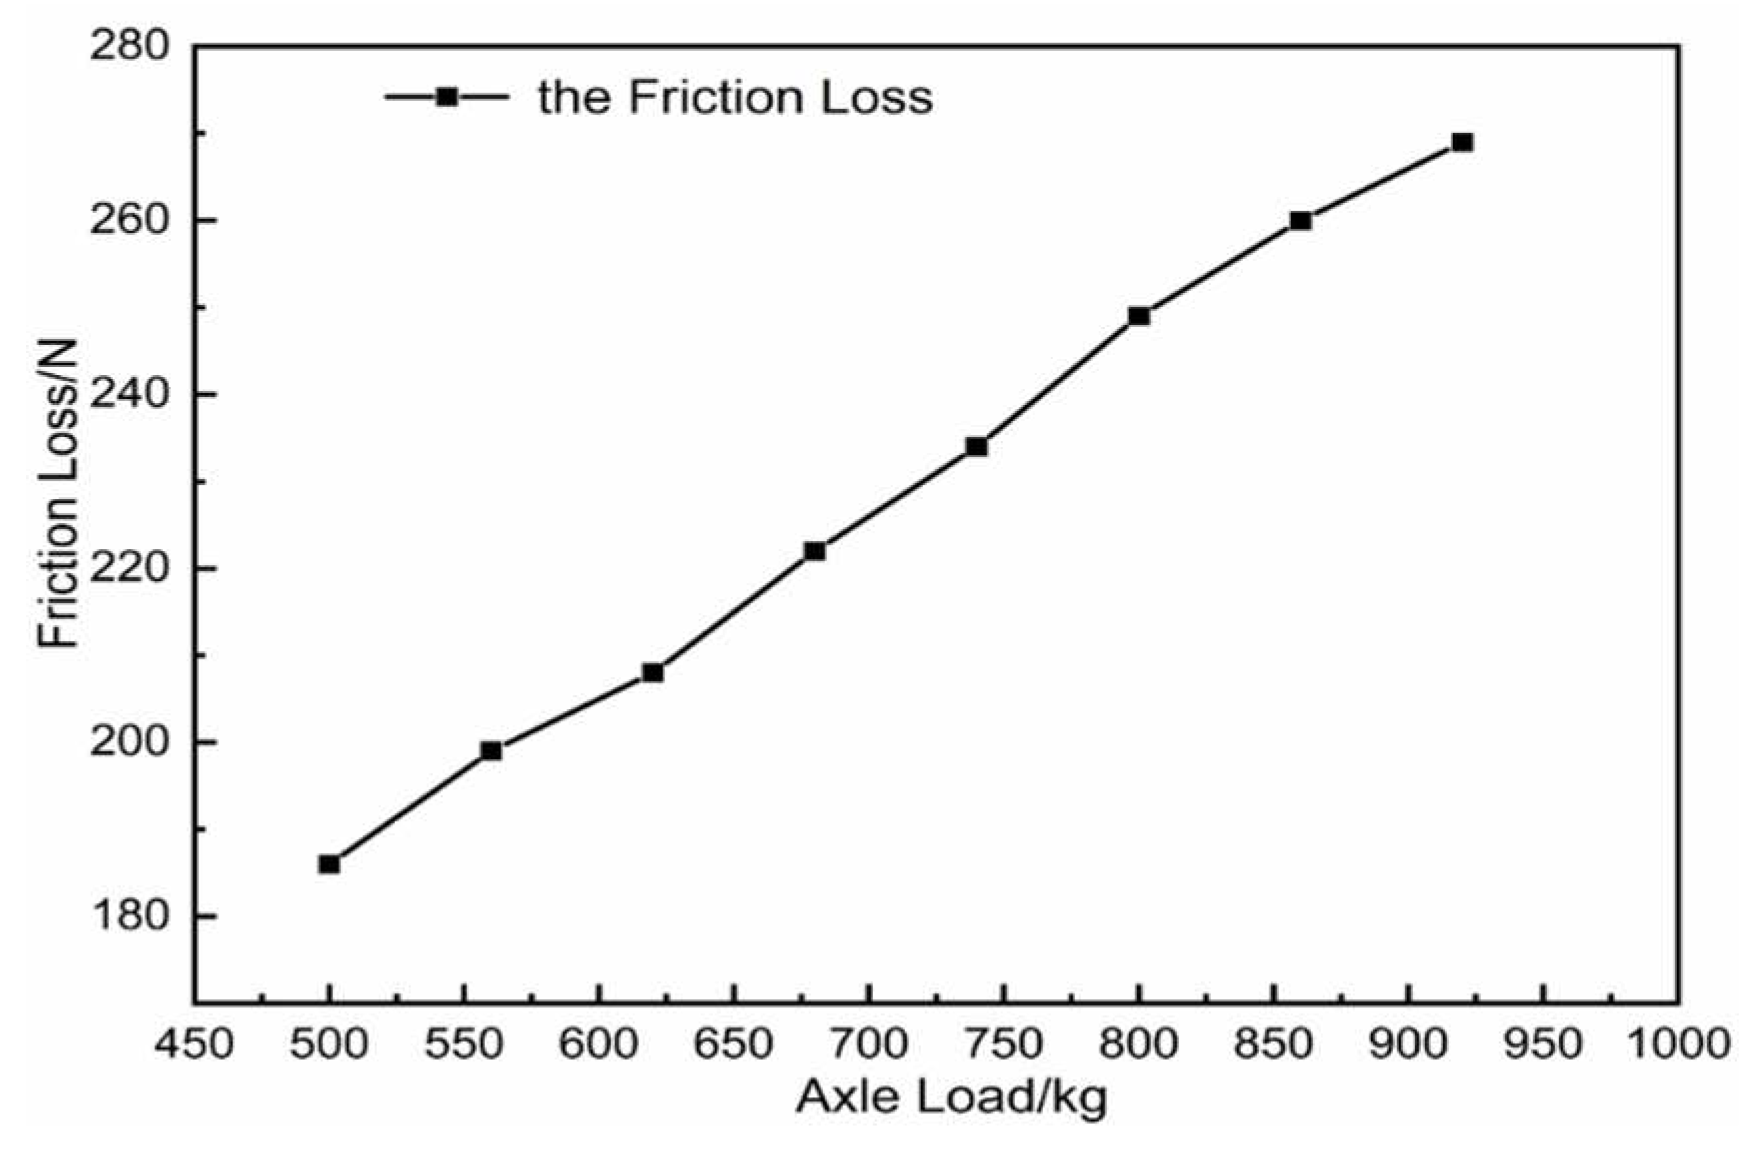
The change relationship of the measured friction loss of the front axle with the axle load of the Xiali A+ sedan is shown in
Figure 4. The test was conducted with a tire pressure of 0.25 MPa and a roller spacing of 471 mm, and the load of front axle was varied by additional mass.
As shown in
Figure 4, the relationship between the frictional resistance measured on the brake testing platform and the axle load is approximately linear. With the increase in axle load, the tire deformation and the friction loss both increases. As the 2.66 km/h roller speed of brake testing platform is very low, the rolling resistance coefficient f under different axle load conditions remains unchanged. According to the rolling resistance equation (1), it is known that the friction loss increases linearly with the increase in axle load, the slope is the rolling friction coefficient, which proves that the actual measured results are accurate and reliable.
Where
Ff is the friction loss,
G is the gravity of the tested vehicle,
f is the rolling friction coefficient.
3.3. Effect of Placement Angle on Friction Loss
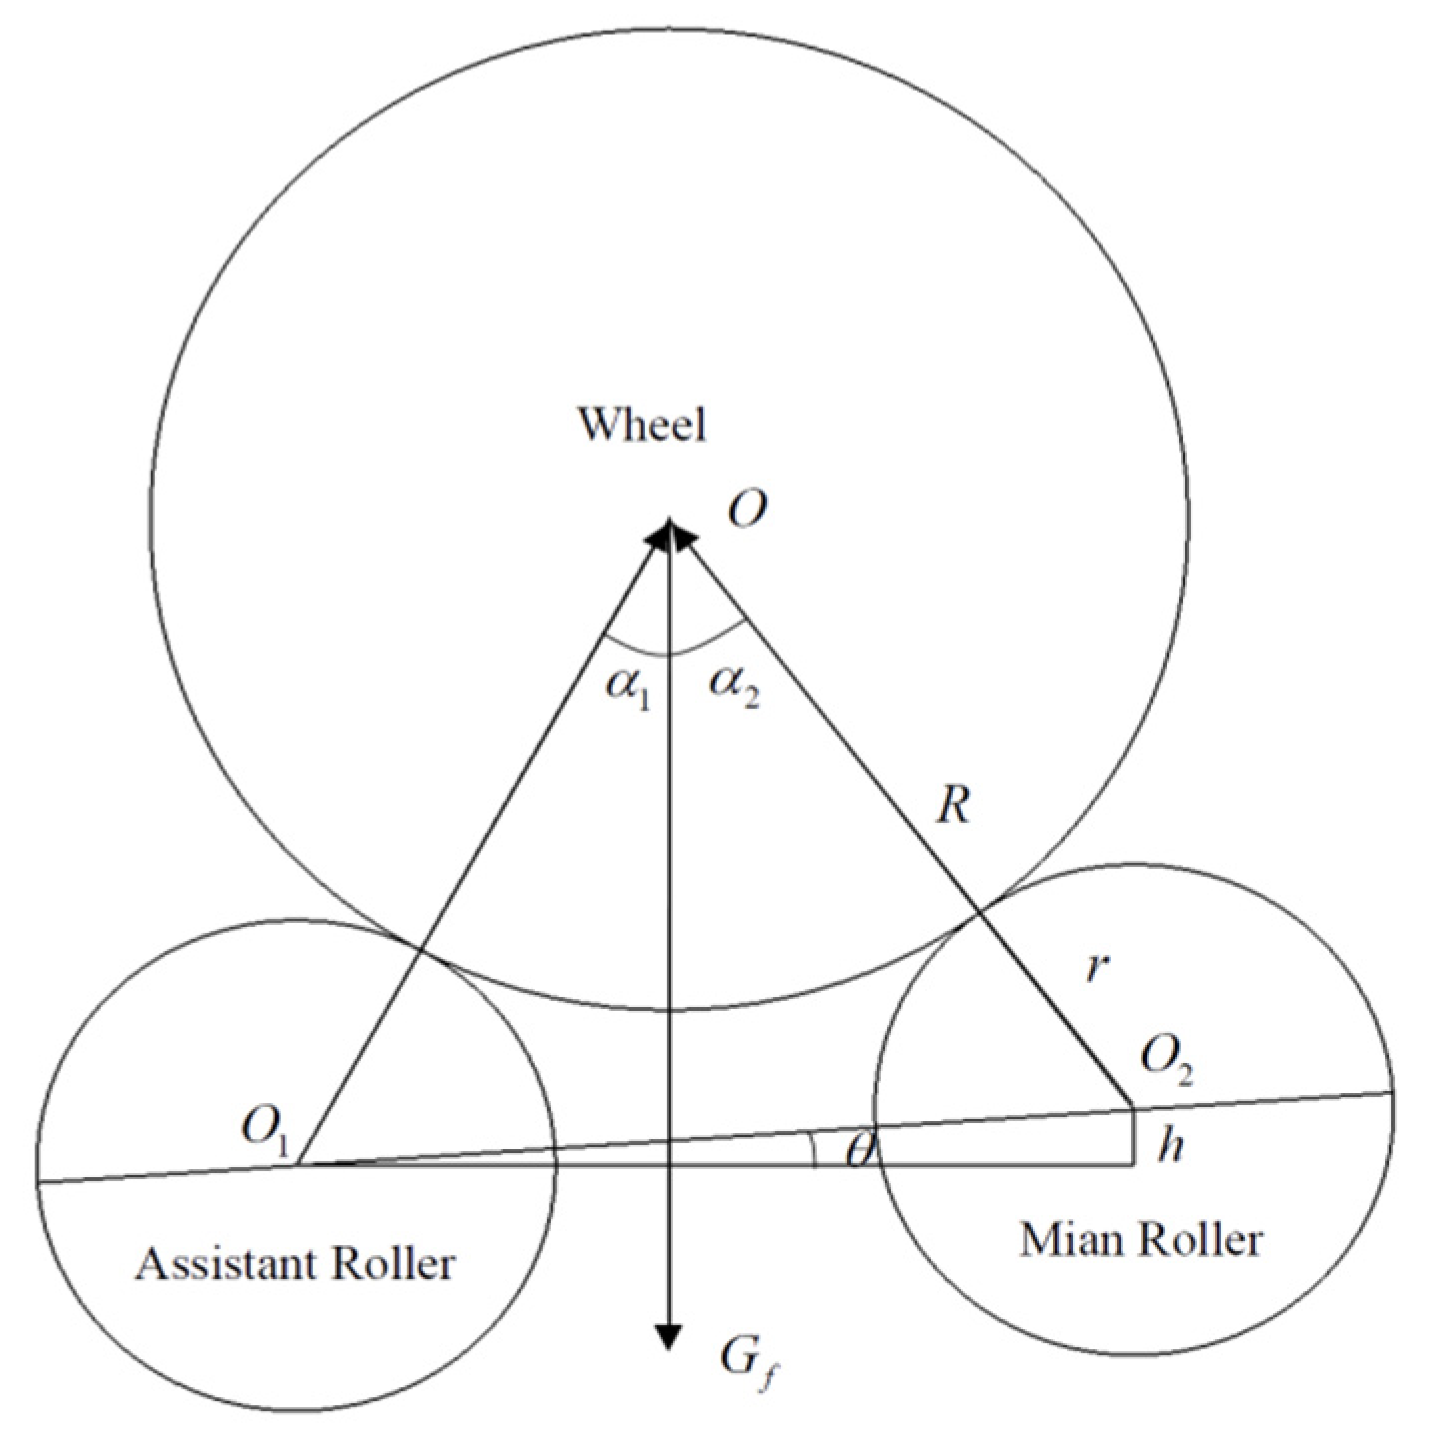
The force condition of the inspected vehicle wheel during testing is shown in
Figure 5. With
O1 and
O2 as the center of the circle is the main and assistant roller of the anti-force rolling brake test platform, and the rear roller is higher than the front roller arrangement form. With
O as the center of the circle is the vehicle wheel (Ignoring the rolling resistance and the influence of non-test wheels on the tested wheels.)
The placement angle
α is 1/2 of the angle between the center of the wheel and the line connecting the centers, the relationship of front placement angle
α1, rear placement angle
α2 and placement angle
α of the new brake test platform can be described in the equations (2), (3), (4) and (5).
Where
θ is the angle formed by the height difference between the front and rear rollers (inter-drum angle),
h is the height difference between the rollers,
L is the roller spacing,
R is the wheel radius and
r is the roller radius.
The wheel placement angle can be described by the equations (5). The wheel placement angle
α is determined by the roller radius
r, the wheel radius
R and the roller spacing
L. Ones the brake testing platform and the testing vehicle have been determined,
r of 122.5 mm and
R of 270 mm can be identified, thus the placement angle can be changed by altering
L.
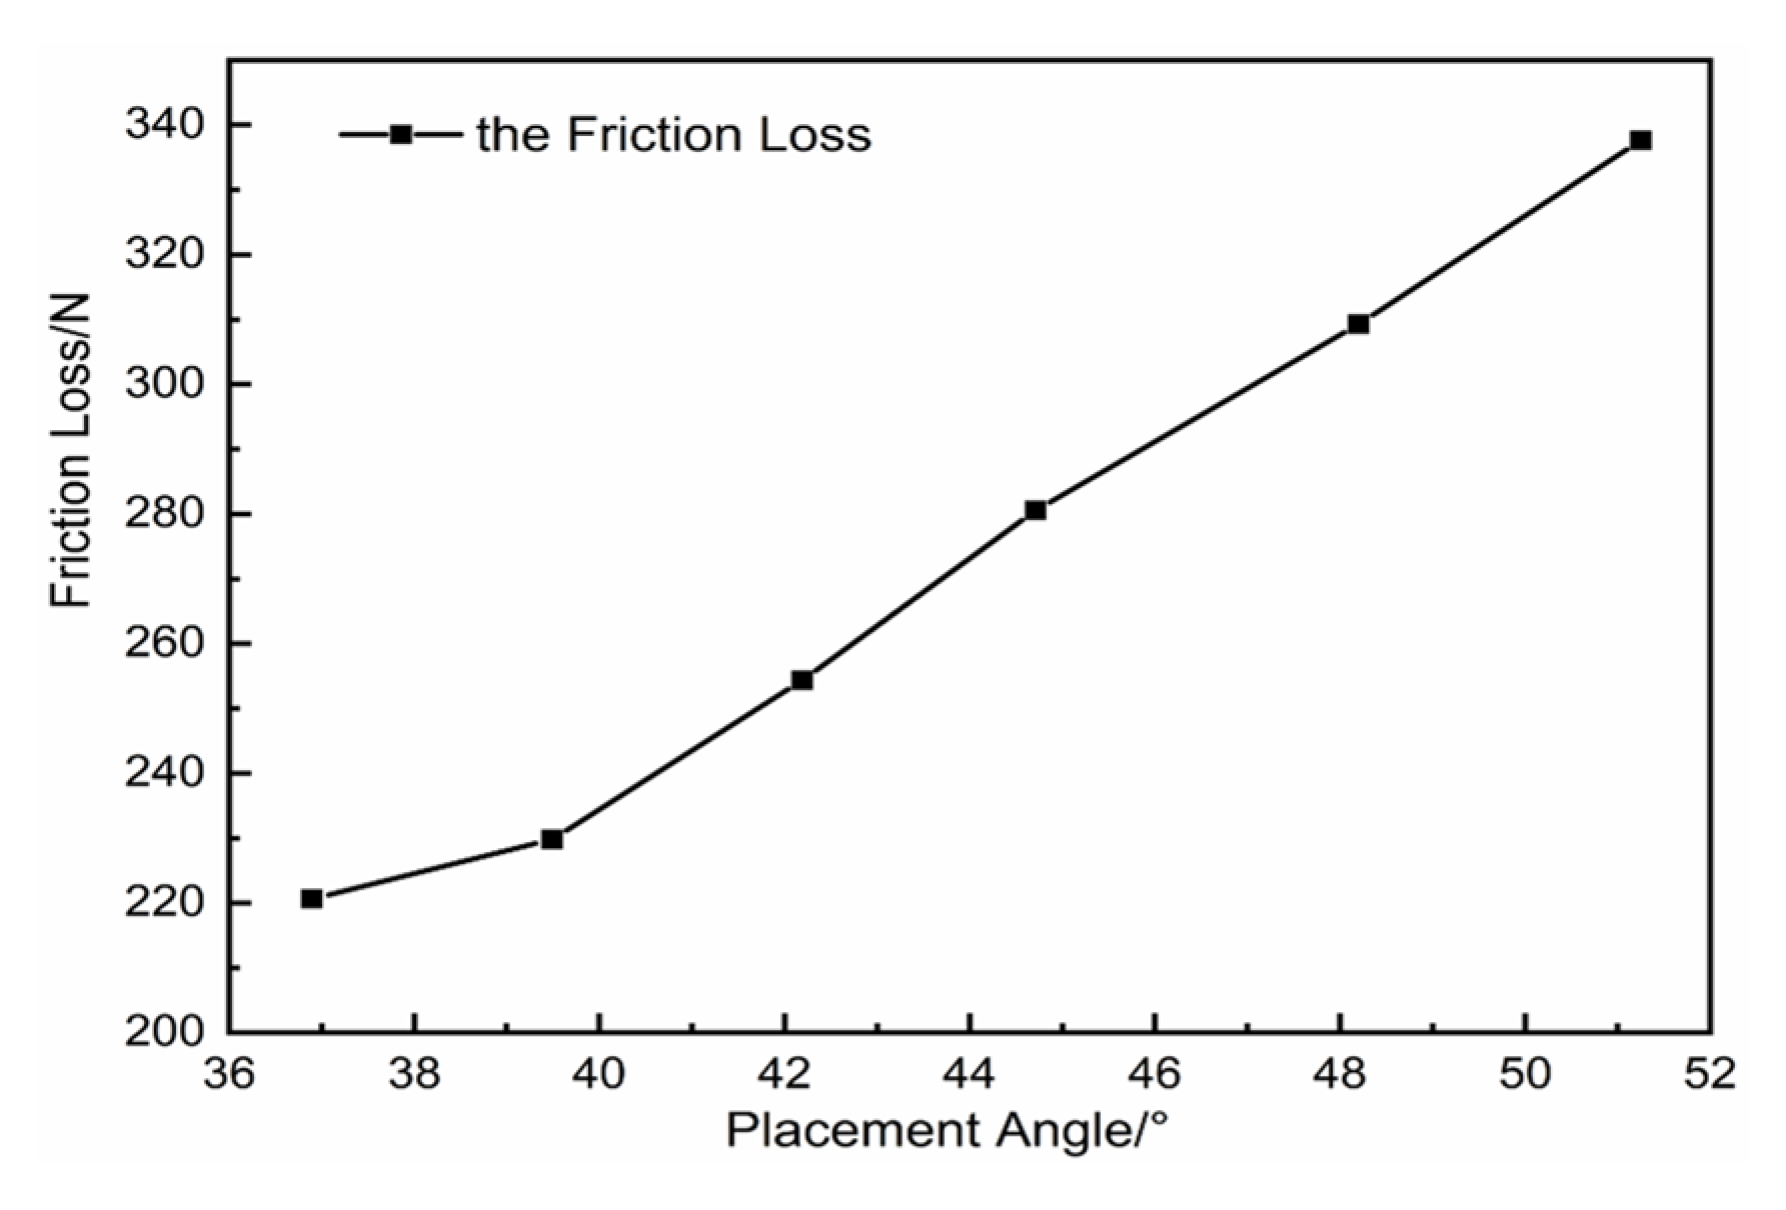
Figure 6 shows the change relationship of front axle friction loss with the placement angle changes of measured Xiali A+ sedan. During the test, the tire pressure was 0.25 MPa, the roller spacing was adjusted from 471 mm to 612 mm, corresponding to the placement angle adjustment range was 36.9°~51.3°.
As can be seen from
Figure 6, with the increase of the placement angle, the tire deformation becomes more pronounced, the frictional resistance between the wheel and the roller surface strengthens, and the friction loss gets larger. That’s due to the normal support force of the rigid roller on the tire enhances, which in turn enlarges the friction loss inside the brake testing platform, leading to the increase of the frictional resistance. At the placement angle of 51.3°, the frictional resistance is 338 N, reaching 6.9% of the front axle load, which shows that the placement angle has a great influence on the frictional resistance.
3.4. The Effect of Vehicle Speed on Friction Loss
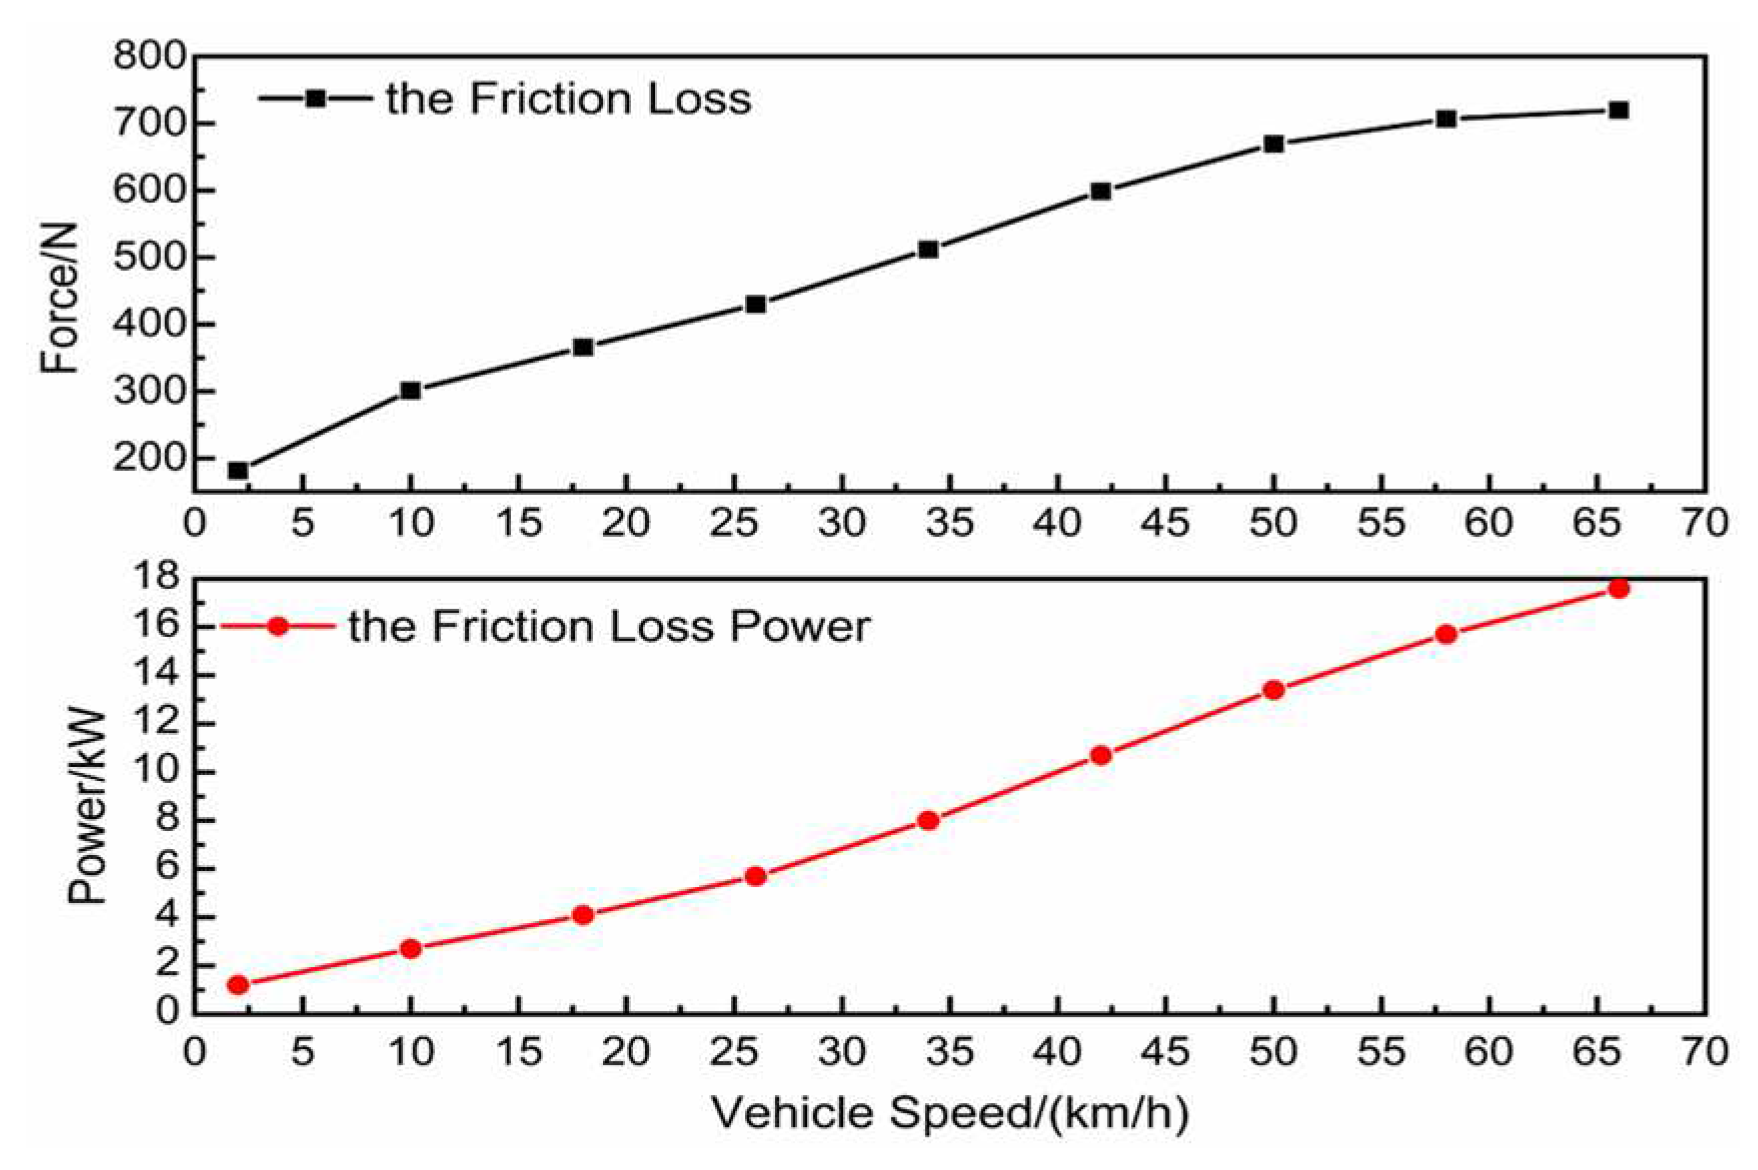
In this experiment, the tire pressure was 0.25 MPa and the roller spacing was 471 mm. In order to increase the speed of testing vehicle, the decelerator of brake testing platform was replaced so that the reduction ratio was 1:2. The motor speed was controlled by the frequency converter, and the change relationship of the friction loss with vehicle speed of the brake testing platform was tested as shown in
Figure 7.
It shows that the frictional resistance and friction loss power of the brake testing platform rises with the increase of vehicle speed. The friction loss power at the speed of 66 km/h is 132 times of that at the speed of 2 km/h. That can be explained as follows. One hand, with the improvement of vehicle speed, the rolling resistance coefficient gets larger, and the friction loss between the wheel and the roller surface swells. On the other hand, with the increase in roller speed of the brake testing platform, the bearing friction coefficient enlarges, taking the internal friction loss of the brake testing platform up. The combination of the above two aspects results in the higher vehicle speeds and greater friction losses on the brake testing platform. Normally, when the vehicle is tested for power on the dynamometer chassis, the speed point is higher, usually above 40 km/h. To ensure the accuracy of chassis dynamometer measurement, the output power of the chassis dynamometer should be revised. While, in the brake performance testing, due to the low and constant roller speed of the brake testing platform, about 2.5 km/h, the effect of vehicle speed on the friction loss of the brake testing platform can be neglected.
4. Friction Loss Model Construction
The construction of the friction loss model of the anti-force brake testing platform can provide a reference basis for revising the vehicle braking force, and then improve the accuracy of the automotive brake performance test results.
4.1. Friction Loss Analysis
As mentioned in section 3.4, the impact of vehicle speed on friction loss can be ignored because of its low and constant characteristics in the vehicle braking performance test on anti-force brake testing platform. Importantly, tire pressure, placement angle and vehicle axle load have a large impact on the friction loss, which in turn directly affects the braking force test results. However, on account of the diversity of testing vehicles, there are significant differences in tire pressure, placement angle and vehicle axle load. In order to effectively measure the braking performance of the vehicle brake, the braking force results need to be corrected during the vehicle braking performance test.
Here, the relative slipping
S was defined as equation (6), it integrally reflects the elastic hysteresis loss generated by the tire deformation and the friction loss generated by the relative slip between the wheel and the roller.
Where
S is the relative slip,
νm is the vehicle speed corresponding to the main and assistant roller speed,
νt is the vehicle speed corresponding to the third roller speed.
As can be seen in
Figure 8, in the effect of tire pressure and axle load on the friction loss, when the relative slipping
S>0, the friction loss increases along with the increase of the slip amount; when the relative slipping
S<0, the friction loss increases significantly with the decrease of the slip amount. Because, when the tire pressure <0.07 MPa, which was small, the third roller support spring stiffness was larger. With the tire pressure decreased, the third roller support spring compression increased, so do as the spring force. Besides, the tire and the third roller contact surface was small, while the deformation was greater, leading to the third roller corresponding vehicle speed lower than that of the main and assistant roller speed. Therefore, on the condition of
S<0, the friction loss is too large. However, according to the National Standard of the People’s Republic of China GB38900-2020, the braking performance test in the practical application needs to be carried out when the tire pressure is normal. In this case, the tire pressure bigger than 0.15 MPa and the relative slipping
S>0. When the placement angle is constant and the tire pressure is normal, the relative slipping
S>0, the friction loss increases with the rising of relative slipping. When the tire pressure or axle load changes, there is the same correspondence between the friction loss and the relative slipping. After adjusting the center distance of the main and assistant roller to enlarge the placement angle, when the relative slipping is the same, the friction loss increases greatly. As the placement angle gets larger, the relative slipping decreases slightly, and the friction loss caused by the slip between the wheel and the roller falling slightly too. But, after turning up the placement angle, the main and assistant roller normal support force increases, making the internal friction loss (including bearing friction loss, etc.) of the anti-force brake testing platform increases obviously. At the same time, the internal friction loss of the brake testing platform plays a dominant role, the combined effect of the two factors makes the friction loss of the testing platform increases with the increase of the placement angle. Consequently, the effects of relative slipping and placement angle need to be taken into account when considering friction loss corrections for new brake testing platform.
4.2. Friction Loss Model Construction
Considering the fitting accuracy and practical needs, the data were fitted using the measured friction loss with the variation of tire pressure and axle load at tire pressure >0.15 MPa to obtain the model of the variation of friction loss with relative slipping, which is ascribed as equation (7).
Where,
Ff1(N) is the friction loss caused by the change of relative slipping,
S(%) is the relative slipping.
According to equation (7), after subtracting the data of the relationship between the measured friction loss and the variation of the relative slipping from the data of the relationship between the friction loss and the variation of the placement angle, data fitting is performed to obtain the model of the variation of the friction loss with the placement angle, that is described as the following equation (8).
Where
Ff2(N) is the friction loss caused by the change in placement angle, and
α is the placement angle.
When the experimental vehicle is actually tested, the friction loss needs to be calculated according to the equation (7) and (8), and the vehicle braking force should be revised after summing of them.
As mentioned above, different axial loads could lead to different friction losses. To eliminate the influence of axial loads on friction losses, equations (7) and (8) are divided by the axial loads respectively, the friction coefficients
ϕf1 varied with the relative slipping and
ϕf2 varied with the placement angle are put forward, as shown in equations (9) and (10).
4.3. Friction Loss Model Validation
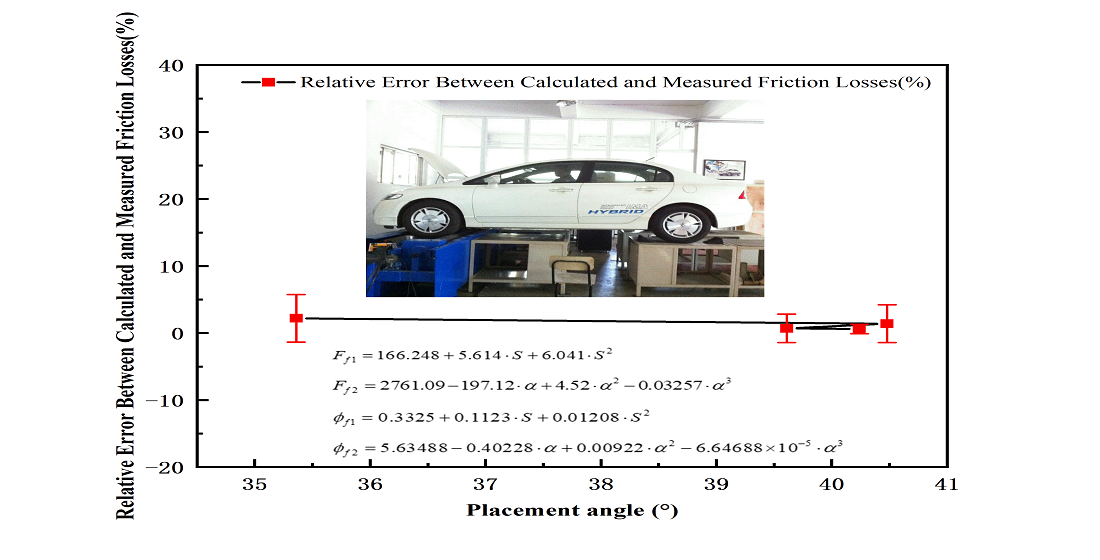
In order to verify the constructed friction loss model, a total of four types of vehicles, namely Changan microbus, Dongfeng light general truck, Isuzu light van and Jiefang heavy warehouse truck, were selected for the test. The test vehicle tire pressure was normal. Due to the greater impact of the placement angle on the vehicle braking force test results, a brake test platform applied has the function of automatically detecting the wheel diameter and setting the placement angle by adjusting the axle distance of the roller. During the test, the placement angle of the operating vehicle was set as the optimum placement angle. The relevant studies showed that the optimum placement angle can be calculated by equation (11) [
8].
Where
ϕ is the roller surface adhesion coefficient.
Here,
ϕ was taken to be 0.85 and the corresponding placement angle
α can be calculated to be 40.4°. In view of the hydraulic cylinder stroke limit for adjusting the axis distance of the main and assistant roller by pushing the assistant roller group to move by the hydraulic station was 250 mm, under the condition of the maximum main and assistant roller axis distance, the placement angle a was 35.36° for the Jiefang heavy warehouse truck, and that of the rest three types of vehicles were close to the optimal placement angle of 40.4°. The front axle load, placement angle, relative slipping and friction loss of the four types of vehicles were tested and calculated. Among them, the calculated and measured values of friction loss were received according to equations (9) and (10), and all data are showed in
Table 1. The comparison results show that the maximum relative error between the calculated and measured friction losses of the brake testing platform is 2.2%, indicating that the constructed friction loss model is effective and reliable, and can accurately predict the friction losses of the experimental brake testing platform.
5. Actual Vehicle Test Results
The braking performance of the Xiali A+ sedan was conducted on the brake testing platform by adjusting the main and assistant roller wheelbase to change the placement angle. It was tested by pressing the brake pedal slowly and gradually to the floor.
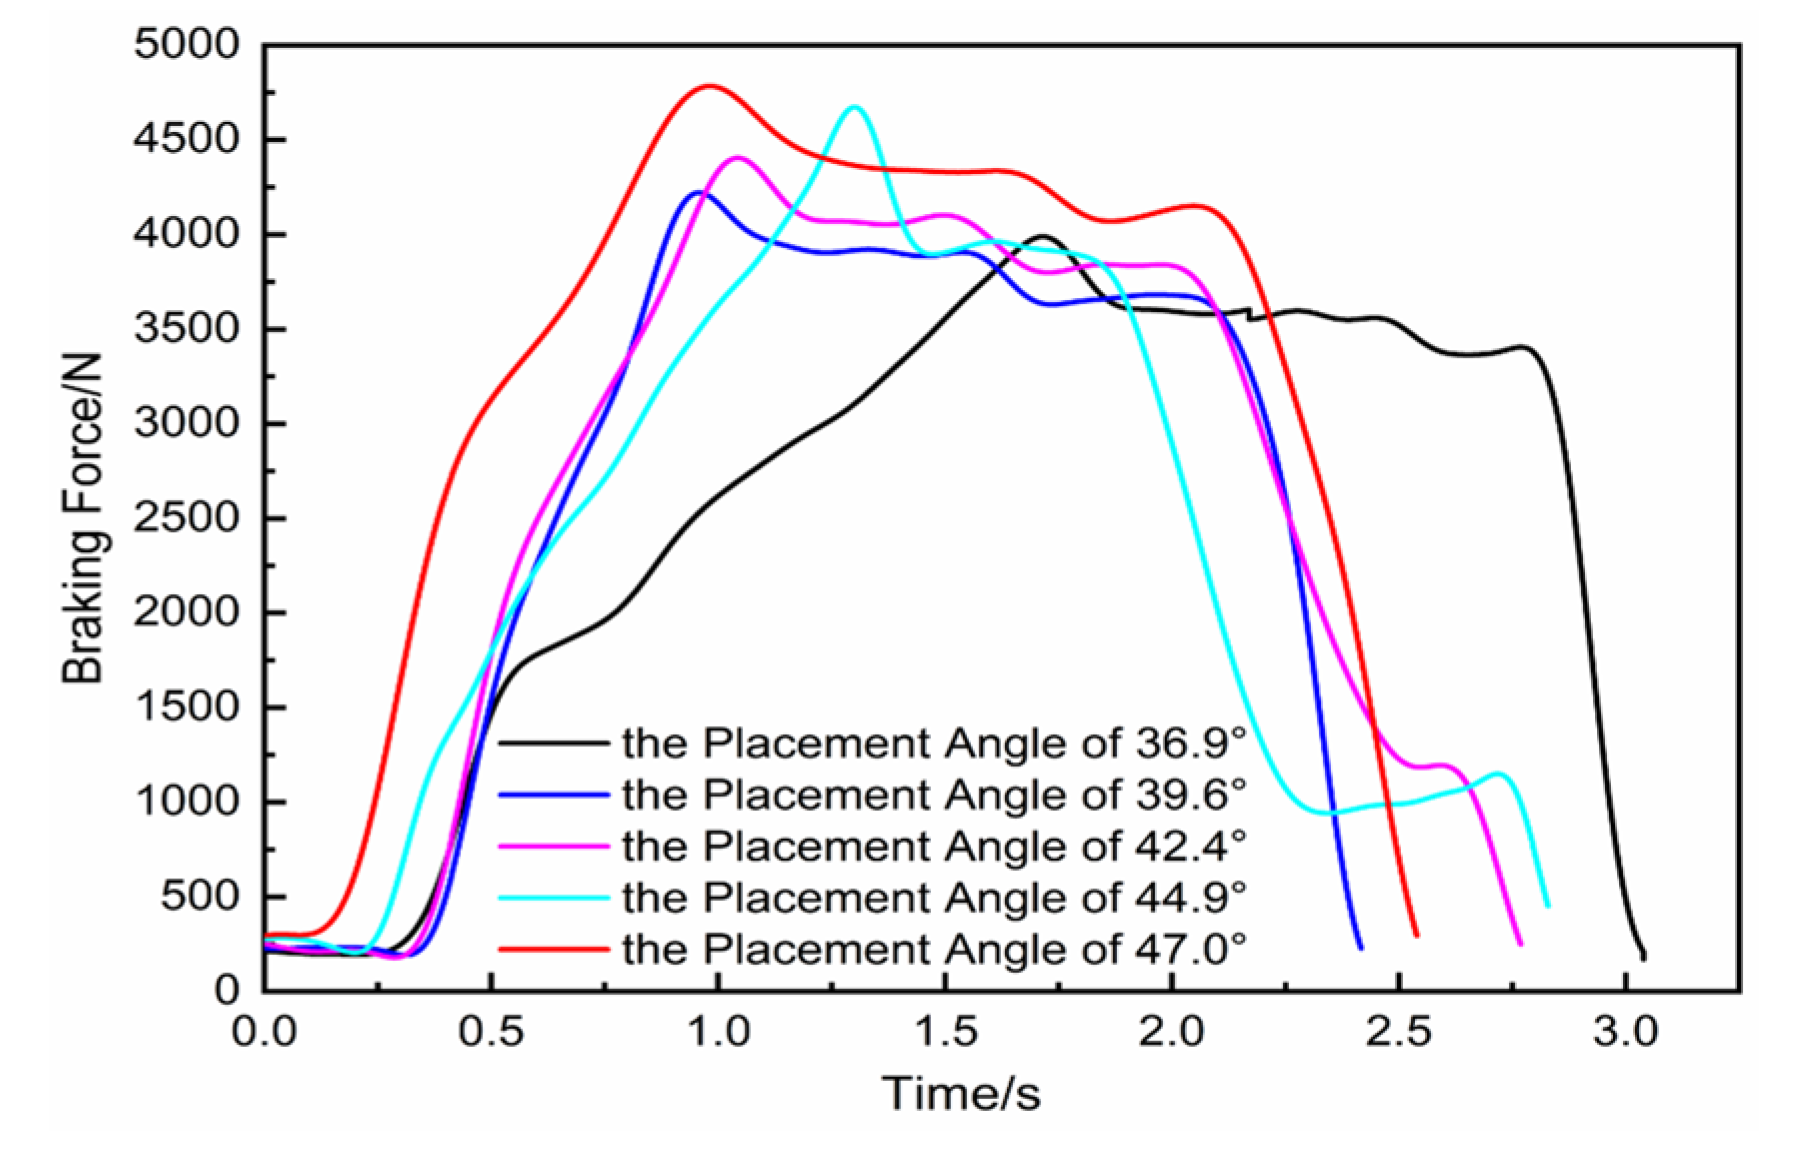
Figure 9 shows the measured data of the entire process of braking force growth on the front axle of the vehicle and the maximum braking force on the wheels. As can be seen, the maximum braking force of the front axle of the tested vehicle increased with the increase of the placement angle, and the maximum braking force varied from 3982 N to 4772 N when the placement angle changed from 36.9° to 47.0°, and the braking force improved by 19.8%. The relative slipping was calculated based on the main roller speed and the third roller speed data from 2 s to 3 s after motor stabilization; the placement angle was calculated by combining the information of main and assistant roller center distance, wheel radius and roller diameter. The friction loss coefficient of the test vehicle was calculated according to equations (9) and (10), which combined the front axle load to get the friction loss. The corresponding placement angles were 36.9°, 39.6°, 42.4°, 44.9° and 47.0°, the friction losses were 221 N, 231 N, 256 N, 283 N and 302 N, respectively. The maximum braking forces in
Figure 6 were corrected to 3770 N, 3992 N, 4149 N, 4388 N and 4470 N. The front axle braking rates were 71.2%, 75.4%, 78.4%, 82.9% and 84.5%, respectively. That decreased by 4.22%, 4.40%, 4.84%, 5.37%, and 5.67%, compared with the braking rate under each placement angle before the revisions. The corrected test results are more accurate and more truly reflect the vehicle brake performance.
The National Standard of the People’s Republic of China GB 7258-2017 stipulates that passenger cars and other vehicles with a total mass of not more than 3500 kg should have a no-load front axle braking rate ≥60%. It shows that the test vehicle meets the requirements under all placement angles [
3].
6. Conclusion
In summary, a corresponding friction loss model of the testing platform was constructed and its effectiveness was verified through actual vehicle tests based on the previous self assembled anti-force rolling brake testing platform, the concrete contents and results can be summarized as follows:
(1) The effect of tire pressure, vehicle axle load, placement angle and vehicle speed on the friction loss of the anti-force rolling brake testing platform was tested and analyzed, providing a basis for correcting the friction loss and effectively testing the braking performance of vehicles.
(2) The relative slip amount was defined. Based on the relative slip amount and placement angle, the friction loss model of the anti-force rolling brake testing platform was constructed, furnishing a basis for revising the braking force test results of the vehicle brake.
(3) The results of the actual vehicle test and data analysis showed that changing the placement angle has a significant effect on the braking force test results. In order to enhance the accuracy of the anti-force rolling brake testing platform test results, the friction loss caused by changes in the placement angle and relative slip should be corrected, and then the vehicle braking rate should be discriminated according to GB7258-2017.
Author Contributions
Investigation, W.H. and F.Q.; Writing–Original Draft, W.H. and R.C.; Validation, W.H., S.T., R.C., D.L. and X.J.; Data Curation, W.H., S.T. and R.C.; Funding acquisition, W.H.; model construction, W.H. and R.C.; Editing, S.T. and R.C.; Writing–Review, R.C.; Experimental, S.T., P.Z. Z.L and X.J.; Methodology, S.T., P.Z., D.L. and F.Q.; Conceptualization, R.C. and F.Q.; All authors have read and agreed to the published version of the manuscript.
Funding
This work was supported by fundings from the Natural Science Foundation of Shandong Province (ZR2022ME096), the Transportation Department Foundation of Shandong Province (2020B94) and the Team Project by Excellent Youth Innovation Team Foundation of Shandong Higher School (2021KJ039).
Conflicts of Interest
The authors declare no conflict of interest.
References
- Huang, W.Y.; Yu, M. J.; Fu, W.J.; Fan, Y.Y.; Wang, Q.; Sun, P. Analysis of influencing factors on testing results of vehicle roller anti-force brake testing platform. Journal of Jiangsu University(Natural Science Edition). 2016, 37, 497–502. [Google Scholar]
-
GB 38900-2020; Items and methods for safety technology inspection of motor vehicles.
-
GB 7258-2017; Technical specifications for safety of power-driven vehicles operating on roads.
- Lin, X.T.; Zhang, H.B.; Zheng, X.X. Research on static and dynamic braking force verification method of roller opposite force type brake testers. Shanghai measurement and testing. 2019, 46, 24–26. [Google Scholar]
- Xie, J.T. Analysis of the Factors Affecting the Braking Forceof Anti-Force Drum Brake Test Rig. Metrology & Measurement Technique. 2016, 43, 65–66. [Google Scholar]
- Ge, Z.; Zhao, Y.Q. Design Defects of Roller Type Brake Test Bench and Introduction of Reciprocating Plate Brake Test Bench. Automobile applied technology. 2021, 46, 106–108. [Google Scholar]
- Guan, W.G.; Wang, G.C. Factors affecting the detection results of the reaction drum brake inspection bench. China Metrology. 2013, 99–100. [Google Scholar]
- Zhao, Y.X. Detection and analysis of brake force based on roller opposite-force brake tester. China Measurement & test. 2015, 41, 10–13. [Google Scholar]
- Li, S.M.; Zhang, J. S.; Chen, C.F.; Wang, L.; Zhang, Y. Comparative analysis of impact factors on flat plate and anti-force rolling brake testing platform tests. China Measurement & test. 2015, 41, 125–128. [Google Scholar]
- Zhu, X.W.; Zuo, F.S.; Xu, Y.; Shi, X.K. The Analysis of the Testing Accuracy of the Anti-Force Rolling Brake Testing Platform. Applied Mechanics and Materials. 2015, 742, 140–146. [Google Scholar] [CrossRef]
- Huang, W.Y.; Fu, W.J.; Yu, M.J.; Fan, Y.Y.; Wang, Q. Development and Research on Anti-force Adjustable Distance Roller Brake Testing Platform. Automobile Technology. 2016, 19–24. [Google Scholar]
-
GB/T 13564-2022; Roller opposite forces type automobile brake tester.
Figure 1.
Schematic diagram of anti-force rolling brake testing platform. 1. Framework, 2. Left reducer assembly, 3. Left main roller bearing, 4. Left main roller, 5. Left brake 3rd roller, 6. Hydraulic lifting mechanism, 7. Chain drives and tensioners, 8. Right main roller left bearing, 9. Right main roller, 10. Right brake 3rd roller, 11. Right hydraulic lifting device, 12. Right main roller right bearing, 13. Right gearbox assembly, 14. Right brake force measuring device, 15. Right drive motor, 16. Right secondary roller bearing, 17. The speed sensor of 3rd roller, 18. Right assistant-roller, 19. Wheelbase sensor, 20. Roller pitch adjustment device, 21. Tire stopper wheel, 22. Left drive motor, 23. Left brake force measuring device.
Figure 2.
Side view of the anti-force rolling brake testing platform. 1. Crank angle sensor of the 3rd roller, 2. Main roller, 3. The 3rd roller, 4. The assistant roller, 5. Tensioning device, 6. Wheelbase adjustment device, 7. The 3rd rolling simple swing arm.
Figure 2.
Side view of the anti-force rolling brake testing platform. 1. Crank angle sensor of the 3rd roller, 2. Main roller, 3. The 3rd roller, 4. The assistant roller, 5. Tensioning device, 6. Wheelbase adjustment device, 7. The 3rd rolling simple swing arm.
Figure 3.
The change relationship between friction loss and tire pressure.
Figure 3.
The change relationship between friction loss and tire pressure.
Figure 4.
The change relationship between friction loss and axle load.
Figure 4.
The change relationship between friction loss and axle load.
Figure 5.
The force condition of rolling brake resistance test platform during testing.
Figure 5.
The force condition of rolling brake resistance test platform during testing.
Figure 6.
The change relationship between friction loss and placement angle.
Figure 6.
The change relationship between friction loss and placement angle.
Figure 7.
The change relationship between friction loss and vehicle speed.
Figure 7.
The change relationship between friction loss and vehicle speed.
Figure 8.
The change relationship between friction loss and the relative slipping.
Figure 8.
The change relationship between friction loss and the relative slipping.
Figure 9.
The change relationship between the front axle braking force and the change of placement angle.
Figure 9.
The change relationship between the front axle braking force and the change of placement angle.
Table 1.
The data of the calculated and measured values of friction loss for the braking test platform.
Table 1.
The data of the calculated and measured values of friction loss for the braking test platform.
| Testing vehicle |
Front axle load/kg |
Placement angle/° |
Relative
slipping/% |
The calculated values of friction loss/N |
The measured values of friction loss/N |
Relative error/% |
| Changan microbus |
507 |
40.24 |
0.96 |
203 |
204 |
0.6 |
Dongfeng light
general truck |
1100 |
39.61 |
1.37 |
447 |
444 |
0.7 |
Isuzu light van
Jiefang heavy |
1472 |
40.48 |
1.26 |
612 |
608 |
1.4 |
| warehouse truck |
2313 |
35.36 |
1.11 |
839 |
844 |
2.2 |
|
Disclaimer/Publisher’s Note: The statements, opinions and data contained in all publications are solely those of the individual author(s) and contributor(s) and not of MDPI and/or the editor(s). MDPI and/or the editor(s) disclaim responsibility for any injury to people or property resulting from any ideas, methods, instructions or products referred to in the content. |
© 2023 by the authors. Licensee MDPI, Basel, Switzerland. This article is an open access article distributed under the terms and conditions of the Creative Commons Attribution (CC BY) license (http://creativecommons.org/licenses/by/4.0/).
