Preprint
Communication

Comparison of Ceria-Supported Catalysts for Attaining NO - NO2 Equilibrium at Industrial Nitric Acid Plant Conditions

Altmetrics

Downloads

266

Views

88

Comments

0

Submitted:

09 October 2023

Posted:

10 October 2023

You are already at the latest version

Alerts
Abstract
Nitric acid is a key component in the production of nitrate fertilisers and is industrially produced using the Ostwald process. The Ostwald process can be further intensified by oxidising nitric oxide to nitrogen dioxide using heterogeneous catalysts. We have explored various monometallic and bimetallic catalysts for NO to NO2 oxidation and found ruthenium supported on ceria, containing 10 wt.% manganese to be a promising catalyst for oxidising NO to NO2 at low temperatures at industrially relevant conditions. For a feed comprising 10% NO, 6% O2, 15% H2O and rest Ar, and 8% NO, 2% NO2 5% O2, 15% H2O and rest Ar, the ruthenium-manganese catalysts attained NO-NO2 equilibrium below 400∘C. For the 5wt.% ruthenium and 10 wt.% manganese on ceria catalyst, an apparent activation energy of 39.4 kJ/mol and 85.4 kJ/mol were observed in the absence and presence of NO2, respectively. These findings demonstrate the potential of supported bimetallic ruthenium-manganese catalysts for efficient oxidation of NO to NO2 at low temperatures which can lead to significant process intensification of nitric acid plants.
Keywords: 
Subject: Engineering  -   Chemical Engineering

1. Introduction

Industrial nitric acid (HNO 3 ) production utilises the Ostwald process, where ammonia is mainly oxidised by air over a Pt-Rh gauze catalyst into NO and H 2 O (Equation 1), followed by homogeneous gas phase oxidation of NO to NO 2 (Equation 2) and further absorption of NO 2 by water to produce nitric acid (Equation 3).
4 N H 3 + 5 O 2 4 N O + 6 H 2 O Δ H r 298 = 907 k J / m o l
2 N O + O 2 2 N O 2 Δ H r 298 = 113.8 k J / m o l
3 N O 2 + H 2 O 2 H N O 3 + N O Δ H r 298 = 37 k J / m o l
The Ostwald process is a mature, extensively studied and highly optimised process for commercial nitric acid production. A typical gas composition after the ammonia combustor (Equation 1) contains 10% of NO, along with 6% O 2 and 15% H 2 O at 800 C [1,2,3]. The gas further travels through heat exchangers with short residence times to attain a temperature range of 350-400 C. From this point onwards to the NO 2 absorption column, the NO 2 concentration in the gas stream increases due to the gas phase conversion of NO. Nitric oxide (NO) is a free radical with an unpaired electron and its oxidation can also be assumed to take place in two steps as follows [1]:
2 N O ( N O ) 2
( N O ) 2 + O 2 2 N O 2
According to Honti [1], the first dimerization reaction of NO is instantaneous with an equilibrium constant (K N O D i m e r ) that increases with temperature like any other exothermic reaction. If the overall rate of the NO oxidation reaction is r, then it depends on the rate of reaction of Eq. 5 and K N O D i m e r as follows:
r = r K N O D i m e r , where r corresponds to the rate of reaction of Eq .   5
Hence, as K N O D i m e r increases with temperature, the overall rate of the NO oxidation reaction r is decreasing, giving rise to an inverse Arrhenius behaviour. Homogeneous NO to NO 2 conversion (%) is calculated as follows:
N O Conversion = Concentration of N O 2 in the outlet Concentration of N O in the inlet · 100
Figure 1 presents NO to NO 2 equilibrium conversion (%) variation with temperature and pressure. That is, NO oxidation to NO 2 follows an inverse Arrhenius behaviour, but is proportional to pressure which is in line with Le Chatelier’s principle.
Heterogeneously catalysing this bulky homogeneous gas phase oxidation of NO to NO 2 has several advantages: (1) it decreases capital expenditure (CAPEX) of new nitric acid plants, (2) thus reducing industrial footprint, and (3) significant heat recovery [4]. Grande et al.[4] evaluated the kinetics of catalytic oxidation of NO to NO 2 using a Pt/alumina catalyst at 4-5 bar pressure and found that with a stable heterogeneous catalyst that can oxidise NO to NO 2 in the range of 250-350 C, the process can be intensified by 10% in terms of energy consumed. A catalyst for NO oxidation faces two main challenges, (i) gas-phase conversion of NO to NO 2 (presented in Figure 1) and (ii) presence of strong oxidisers in the feed (NO, O 2 , NO 2 , HNO 2 and HNO 3 ). A direct result of the gas-phase conversion of NO to NO 2 is that the oxygen available for catalytic reaction becomes limited in the feed. There have been numerous studies on the oxygen storage capacities of ceria (CeO 2 ) and ceria-supported catalysts which enhance the activity for CO and hydrocarbon oxidation of three-way converters[5,6,7]. Cerium being one of the most versatile rare earth elements does not really fall into the "critical rare earth" category and has been a popular catalyst and support material since 1994 [8]. In literature, several base metal oxides such as Co oxides, Mn oxides and various perovskites have been investigated for NO oxidation at low concentrations of NO [9,10,11,12,13]. More than base metals, noble metals and particularly Pt have been studied for their NO oxidation capacity at low concentrations of NO[14,15,16,17,18]. Apart from the earlier publications from our group at high NO concentrations (with and without water in the feed) [12,19,20,21] and Grande et al.[4], only a few other early patents talk about catalytic oxidation of NO to NO 2 at conditions relevant to industrial nitric acid production [22,23,24]. Unlike base metals, noble metals can resist oxidation in moist air and from certain acids [25]. However, the cost of noble metals is 10-50 times higher than base metals [25,26] and almost all of the platinum group metals (PGM) are at supply risk globally [27]. Hence, designing a suitable catalyst for NO oxidation at industrial nitric acid conditions should account for not just catalytic activity but also cost, availability and global supply. However, insufficient data exist regarding the catalytic NO to NO 2 oxidation activity of various metals under industrially relevant conditions.
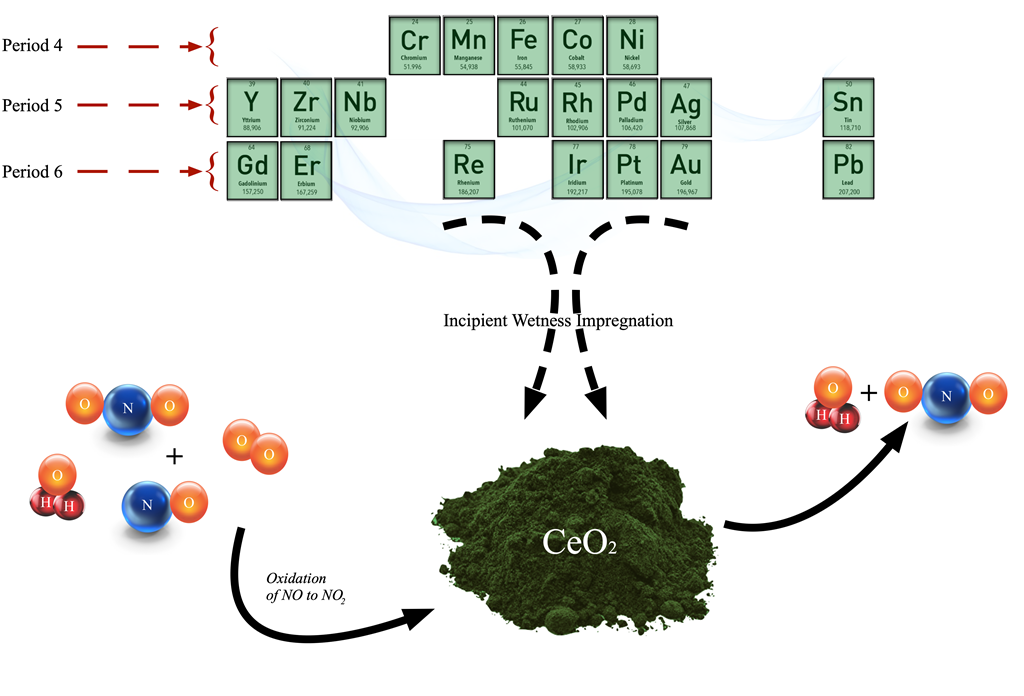
In this work we report the low-temperature activity of a series of ceria (CeO 2 ) based catalysts to attain NO-NO 2 equilibrium at industrial nitric acid production conditions. This research can assist in the optimisation and better design of a catalyst to oxidise NO at high concentrations and also serve as a starting point for catalytic activity-related research on NO oxidation at industrial nitric acid production conditions. We mainly compare transition metals, two post-transition metals and three rare earth metals. Except for osmium, all other noble metals are tested for their NO oxidation activity for comparison.

2. Materials and Methods

2.1. Catalyst Preparation

All catalysts were loaded with 5wt.% of active metal (M) on ceria (Solvay Actalys HSA10, 53-90 μ m) using incipient wetness impregnation. A calculated amount of metal precursor was first dissolved in de-ionised water and stirred at 40 C for 1hr before impregnating the precursor solution onto the support. As-prepared catalysts were dried in an oven at 120 C for 15hrs followed by calcination in air (50 Ncm 3 /min) for 6hrs at 500 C. The calcined catalysts were crushed and sieved to 53-90 μ m sieve fraction for activity testing. For preparing Ru-Mn bimetallic catalysts, after the Ru C e O 2 was prepared, it was further tested for a new incipient wetness point. A calculated amount of Mn(NO 3 ) 2 .4H 2 O was first dissolved in de-ionised water and dry impregnated onto the Ru C e O 2 catalyst, followed by drying at 120 C for 15hrs and calcination in air (50 Ncm 3 /min) for 6hrs at 500 C. The details of the metal precursors and commercial suppliers are given in Table 1. The monometallic catalysts are designated M C e O 2 and bimetallic catalysts as M X y , C e O 2 , where M corresponds to 5wt.% loaded active metal, X and y present promoter metal and its loading respectively.

2.2. Characterization

N 2 adsorption was used to measure the specific surface area of the ceria support and catalyst samples. The samples were degassed at 200 C for 12 hours in a VacPrep 061 Degasser before transferring to a Micromeritics TriStar II 3020 Analyser. Specific surface areas were calculated using the BET method at liquid nitrogen temperature (-196 C).
Ex-situ X-ray diffractograms for the support and catalyst samples were obtained using a Bruker D8 Advance X-ray Diffractometer (D8 Davinci) at 40kV and 40mA, using the wavelength of Cu K α radiation (1.54060Å). The diffractograms were recorded in the 2 θ range of 5-75 with a 0.1 slit opening.
The total metal dispersion was calculated by performing chemisorption measurements using a Micromeritics ASAP 2010S unit at 30-50 C for all fresh catalyst samples. A sample of known weight (≈80-100mg) was loaded into a U-shaped quartz reactor and the bed temperature was controlled using a thermocouple. Before chemisorption, the sample was dried at 120 C for 1hr. The isotherm was measured in the pressure range of 150-500mmHg. The chemisorption probe species and conditions were different for the different monometallic catalysts. However, the chemisorption programme for bimetallic catalysts and the Ru C e O 2 catalyst were the same assuming CO chemisorbing only on ruthenium metal. Table 2 details probe gas and metal to adsorbed species ratio used for chemisorption with respect to the different catalysts.

2.3. Activity Testing

Catalyst performances were evaluated as a function of temperature (150-400 C) and NO to NO 2 conversion in two different feeds; Feed (i) 10% NO, 6% O 2 , 15% H 2 O and rest Ar and Feed (ii) 8% NO, 2% NO 2 , 5% O 2 , 15% H 2 O and rest Ar, with a space velocity of 24,000 Ncm 3 /g g c a t h in a tubular reactor of 9.7mm inner diameter. Conversion of NO to NO 2 (%) is calculated as:
N O Conversion = x N O = λ · [ N O 2 ] o u t l e t [ N O ] i n l e t · 100
where [NO] i n l e t and [NO 2 ] o u t l e t are inlet and outlet concentration of NO and NO 2 of the reactor. λ = 0.99, accounts for the volume changes that arise from the reaction [28].
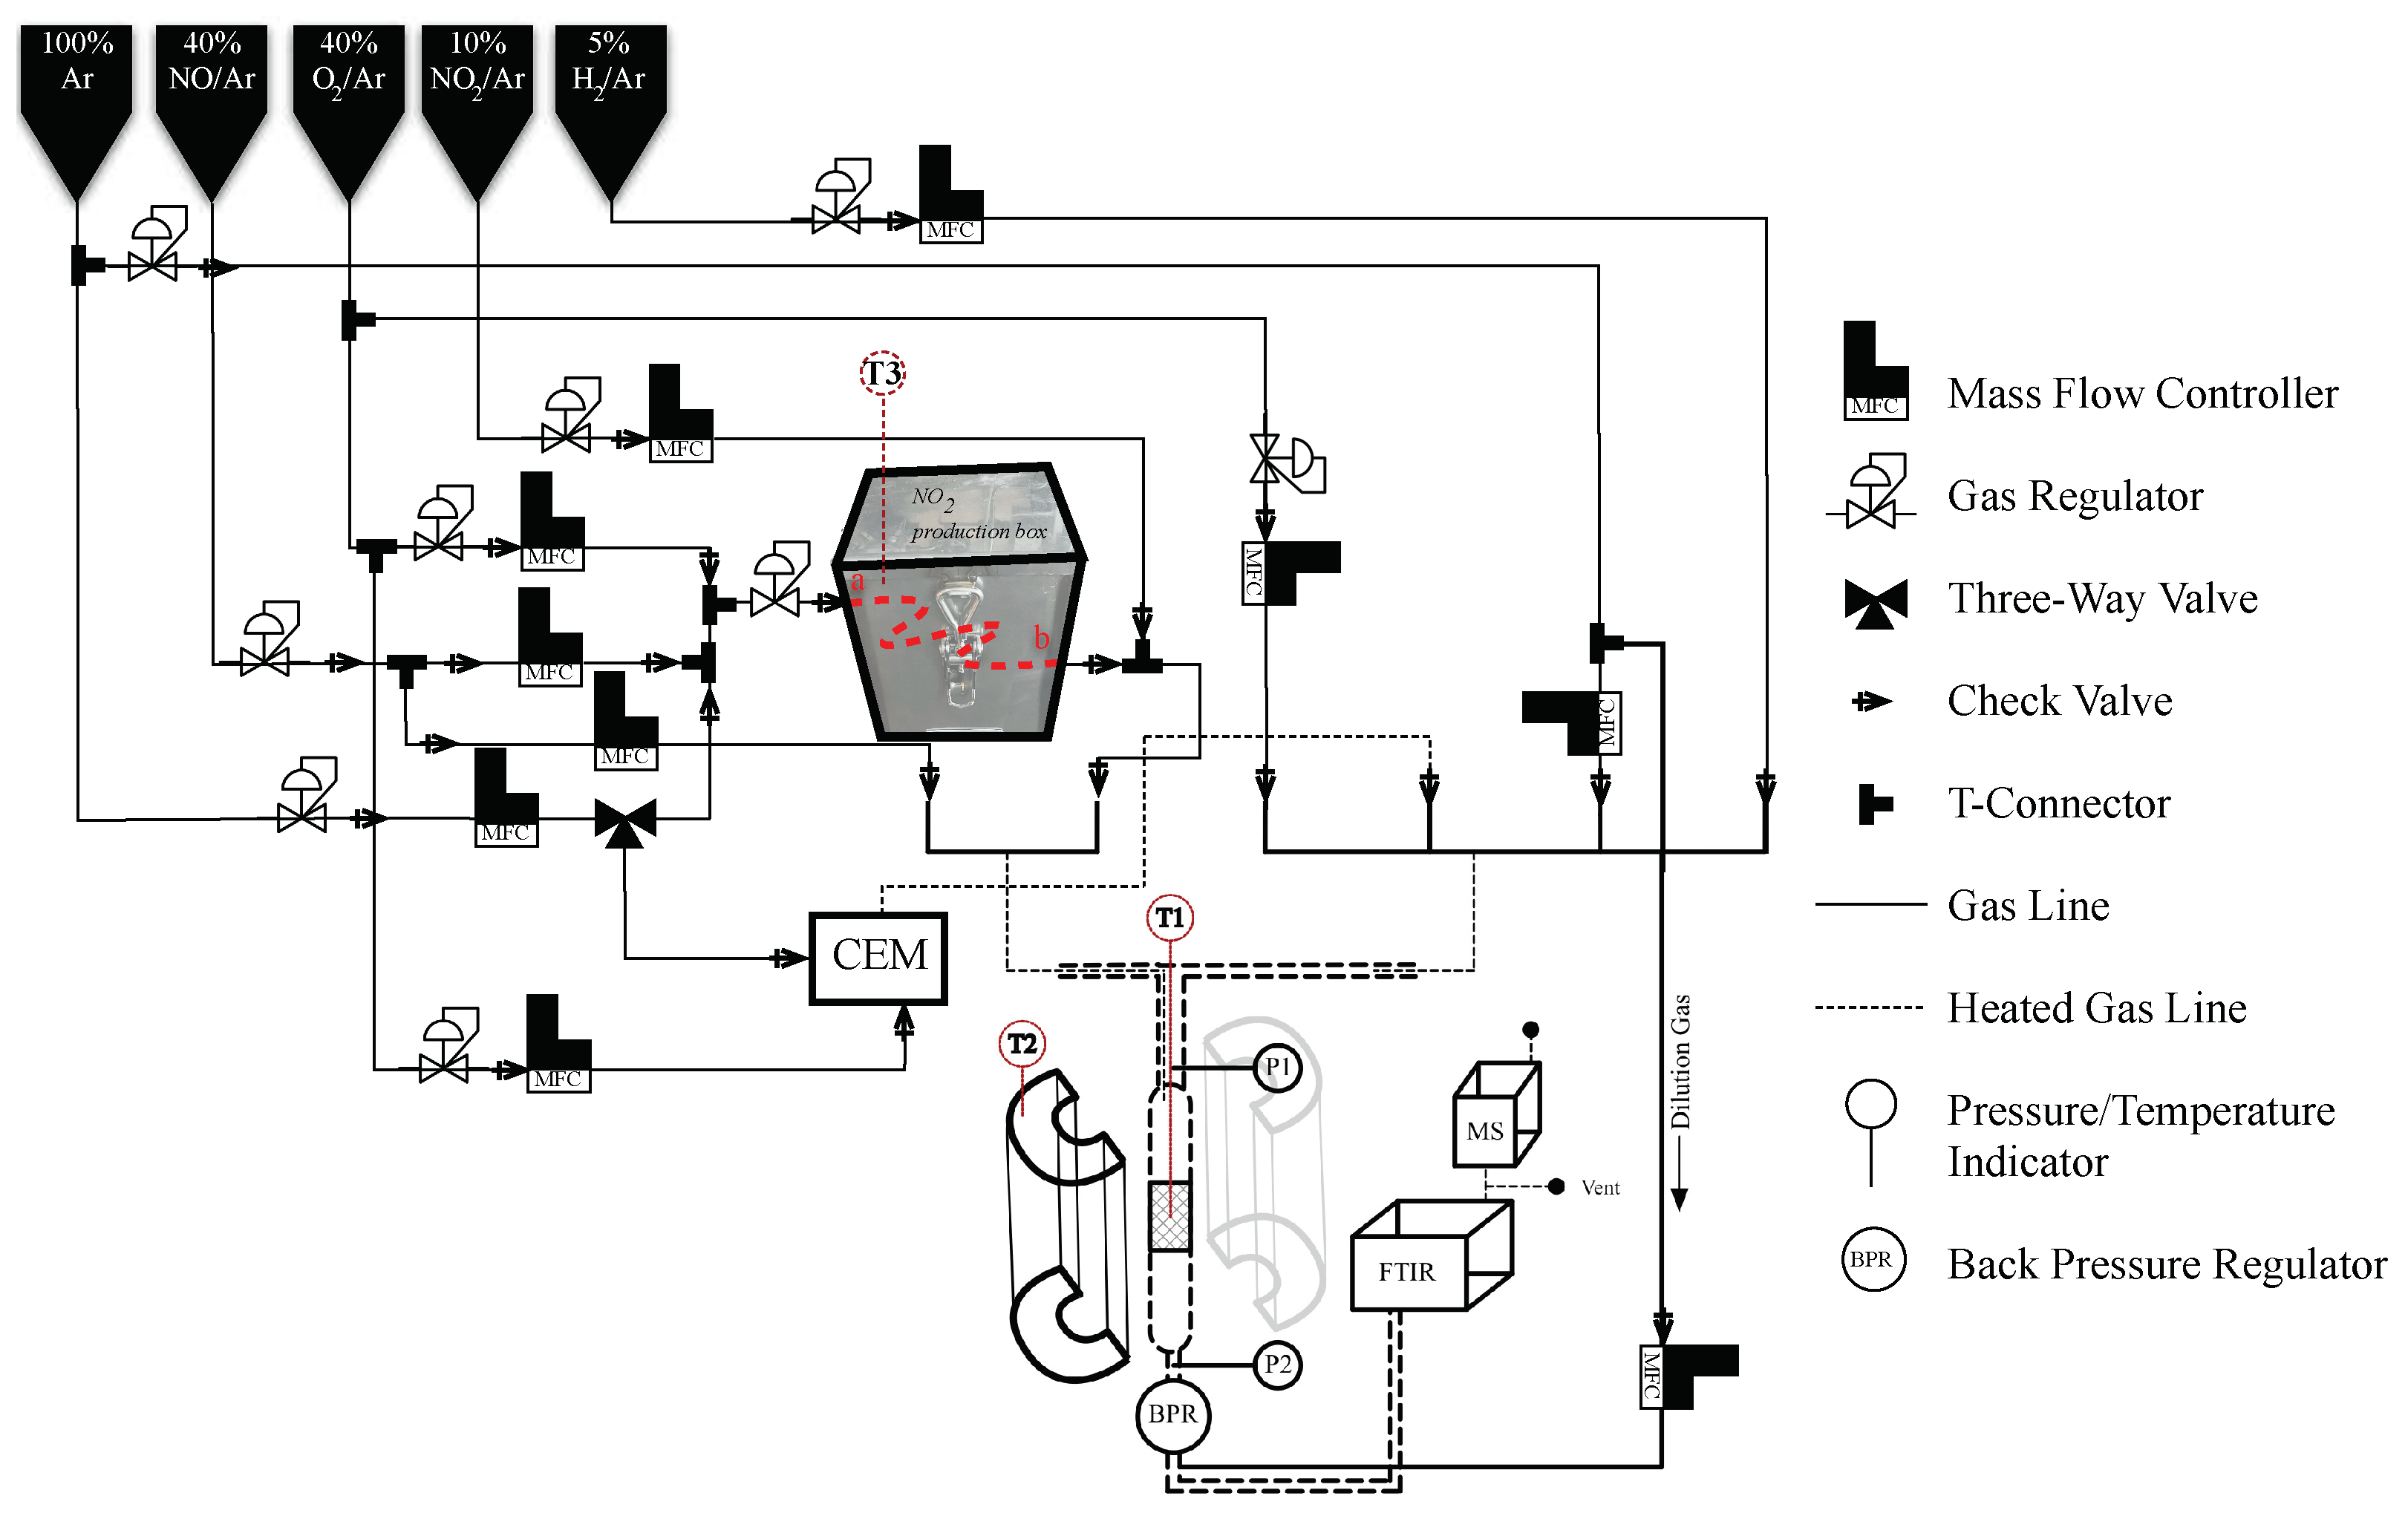
Further details of the experimental set-up presented in Figure 2 are given in our previous publications [12,19,20,21]. A dedicated set of mass flow controllers from Bronkhorst was used to feed the reactant gases. To feed 15% of water, a controlled evaporator mixer (CEM) from Bronkhorst was used. All gas lines before and after the reactor were preheated to 200 C, to ensure no cold spots for water condensation. All reactant gases (40%NO/Ar, 40%O 2 /Ar, 100%H 2 and 100%Ar) were obtained from Linde-Gass AS. NO 2 during activity testing was produced in-situ, and for calibration of the in-situ produced NO 2 a new 10%NO 2 /Ar (Total pressure: 8.85 bar) gas bottle was purchased from Linde-Gass AS.
Boyle’s law is commonly used to predict the volume of gas when the pressure changes and vice versa. The law only holds true for gases that follow the ideal gas law. However, since NO 2 is highly reactive and unstable, it does not obey the ideal-gas law and also does not follow Boyle’s law. Nitric oxide (NO) oxidation to nitrogen dioxide (NO 2 ) can be summarised as [1]:
2 N O + O 2 2 N O 2 N 2 O 4 Δ H r 298 = 113.8 kJ / mol
Changing pressure and temperature has an effect on the equilibrium between NO 2 and N 2 O 4 (Equation 9). As temperature increases, the proportion of NO 2 increases and as pressure increases the proportion of N 2 O 4 increases. This property of NO 2 makes it challenging to pressurise and produce pressurised gas bottles with higher concentrations. As the concentration of NO 2 in the gas bottle increases, the total pressure obtained on the gas bottle for supply decreases. As a result, the purchased 10%NO 2 /Ar bottle has only 8.85 bar pressure for process operations. To overcome this challenge for catalyst activity testing, higher concentrations of NO 2 in feed(ii) were produced in-situ using a method that utilises homogeneous oxidation capacity of nitric oxide when mixed with oxygen at room temperature and ambient pressure (described briefly in Section S1).
The product stream was analysed using an infrared gas analyser (MKS MultiGas 2030-HS FTIR Gas Analyser, 5.11m path length) that gives direct composition for NO, NO 2 , N 2 O, H 2 O, NH 3 , HNO 2 and HNO 3 using pre-calibrated data obtained from MKS. To monitor inert Ar, N 2 and O 2 , a mass spectrometer (Pfeiffer Vacuum ThermoStar GSD 301 T3 Benchtop Mass Spectrometer) was used to ensure the absence of excess O 2 while producing NO 2 in-situ. The apparent activation energy was calculated far from equilibrium in both feed compositions (i) and (ii), at WHSV= 24,000 Ncm 3 /g g c a t h at 1bar in the temperature range of 340-350 C using Arrhenius plot. Prior to activity testing, the catalyst samples were activated in 5%H 2 /Ar as a function of temperature (30-500 C) with a heating rate of 5 C/min in a space velocity of 24,000 Ncm 3 /g g c a t h and subsequently cooled down to 150 C inside the reactor.

3. Results and Discussion

20 monometallic and 4 bimetallic catalysts were successfully prepared and tested for their capacity to oxidise NO in the presence and absence of NO 2 as a function of temperature (150-400 C). Table 2 presents catalyst surface areas, metal dispersion for the different catalysts, and apparent activation energies in the presence and absence of NO 2 . The catalyst surface area decreased slightly with metal impregnation. The major drop in surface area was seen when bimetallic ruthenium-manganese catalysts were prepared with manganese loading larger than 10wt.%.
Table S1 details metal dispersion programme and Table 2 presents dispersion results. The dispersion analysis programme and probe specie were adjusted for different metal catalysts, and it was not possible to calculate dispersion for the Cr C e O 2 , Mn C e O 2 , Y C e O 2 , Zr C e O 2 , Nb C e O 2 , Pd C e O 2 , Sn C e O 2 , Re C e O 2 , Pb C e O 2 , Gd C e O 2 and Er C e O 2 catalysts. Among monometallic catalysts, the decreasing order of catalyst metal dispersion was Pt C e O 2 > Rh C e O 2 > Ir C e O 2 > Ru C e O 2 > Ag C e O 2 > Fe C e O 2 ≈ Co C e O 2 > Ni C e O 2 ≈ Au C e O 2 . The bimetallic catalyst dispersion analysis was also challenging due to the presence of Mn, however, CO chemisorption was performed on these bimetallic catalysts, assuming exclusive adsorption of CO on Ru. Similar to the surface area of bimetallic catalysts, the dispersion was also reduced with increased manganese loading.
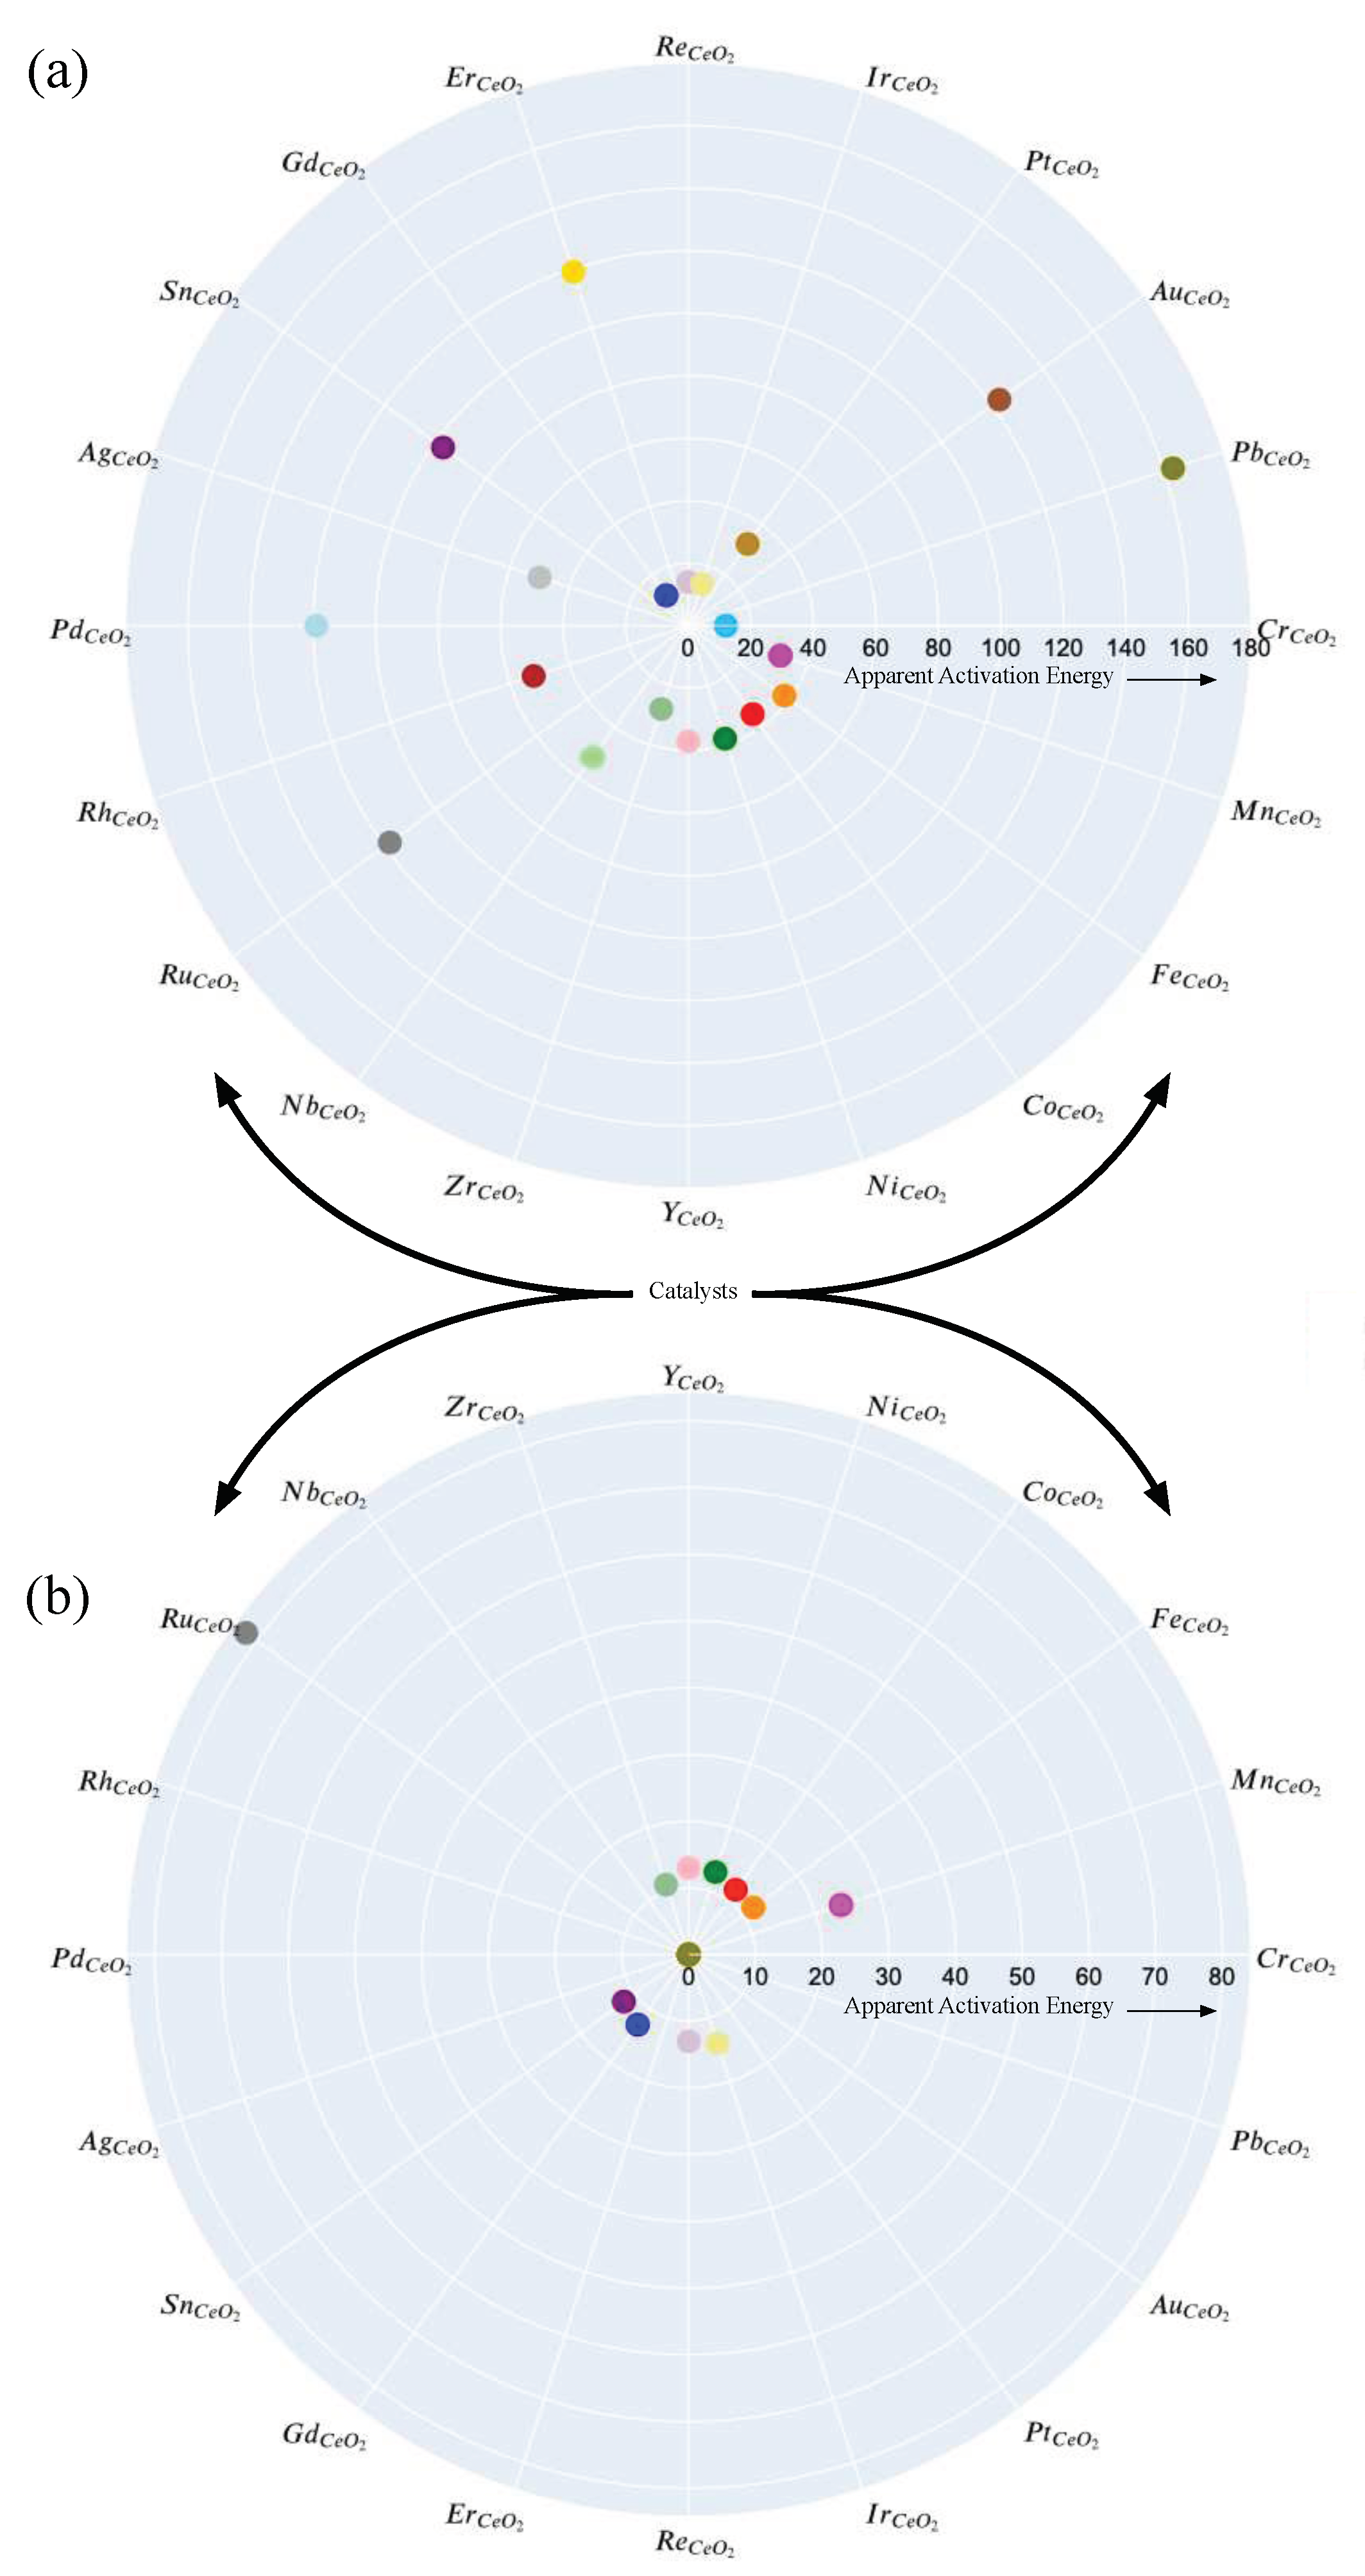
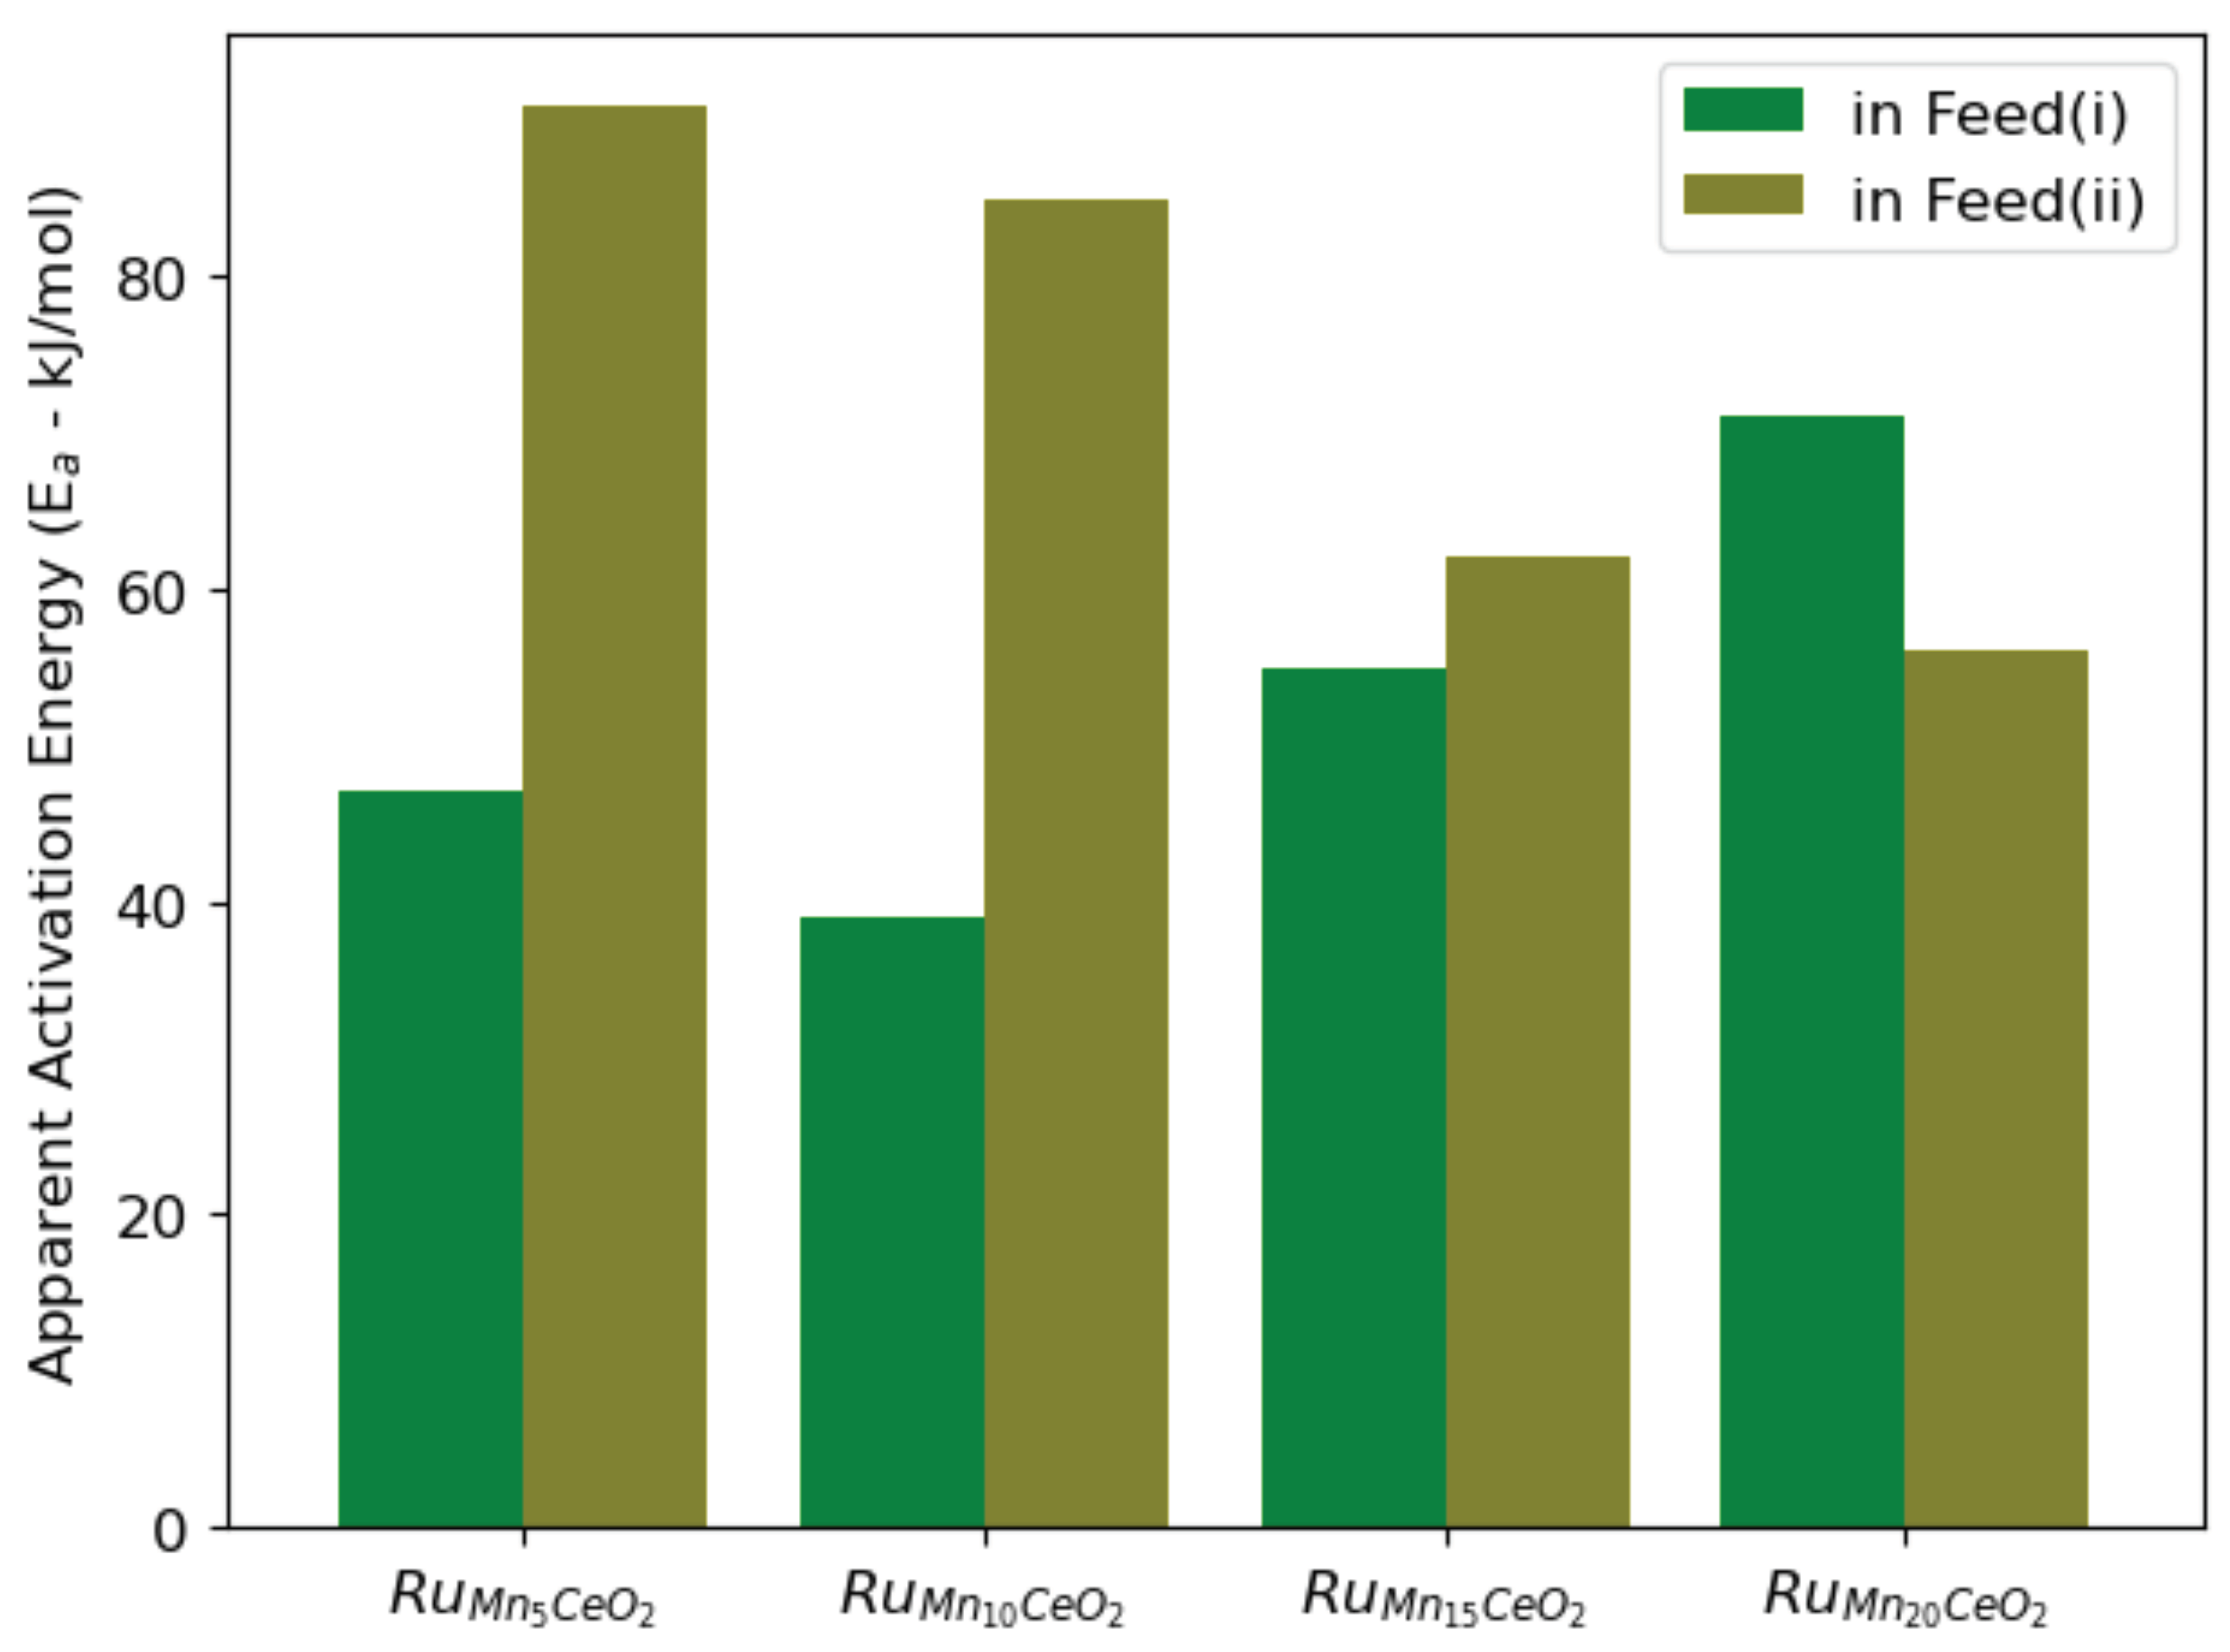
Comparison plots for apparent activation energy for all monometallic and bimetallic catalysts are presented in Figure 3 and Figure 4 respectively. The apparent activation energy calculations proved to be difficult for Sn C e O 2 , Gd C e O 2 , Er C e O 2 and Re C e O 2 in feed(i) and few of the monometallic catalysts have been omitted for apparent activation energy calculations due to low catalytic activity in the actual temperature range (presented in (d)-(f) of Figure S3). Figures S5 and S6 present the Arrhenius plot fit for all monometallic catalysts in feed (i) and (ii), respectively. Table S2 presents goodness-of-fit R 2 parameter for the Arrhenius plots and respective activation energies. From Figure 3 and Table S2, in feed(i) apparent activation energy of Period 4 metal-containing catalysts and Pt C e O 2 catalyst were the lowest with good Arrhenius plot fit. The bimetallic catalysts had reasonable activation energies when compared to monometallic Ru and Mn catalysts in feed (i) (see Figure 3 and Figure 4). The activation energy for bimetallic RuMn first decreased to 39.4kJ/mol with 10wt.% manganese loading and then increased two-fold for the Ru M n 20 , C e O 2 catalyst in feed (i) (see Figure 4 and Table S2).
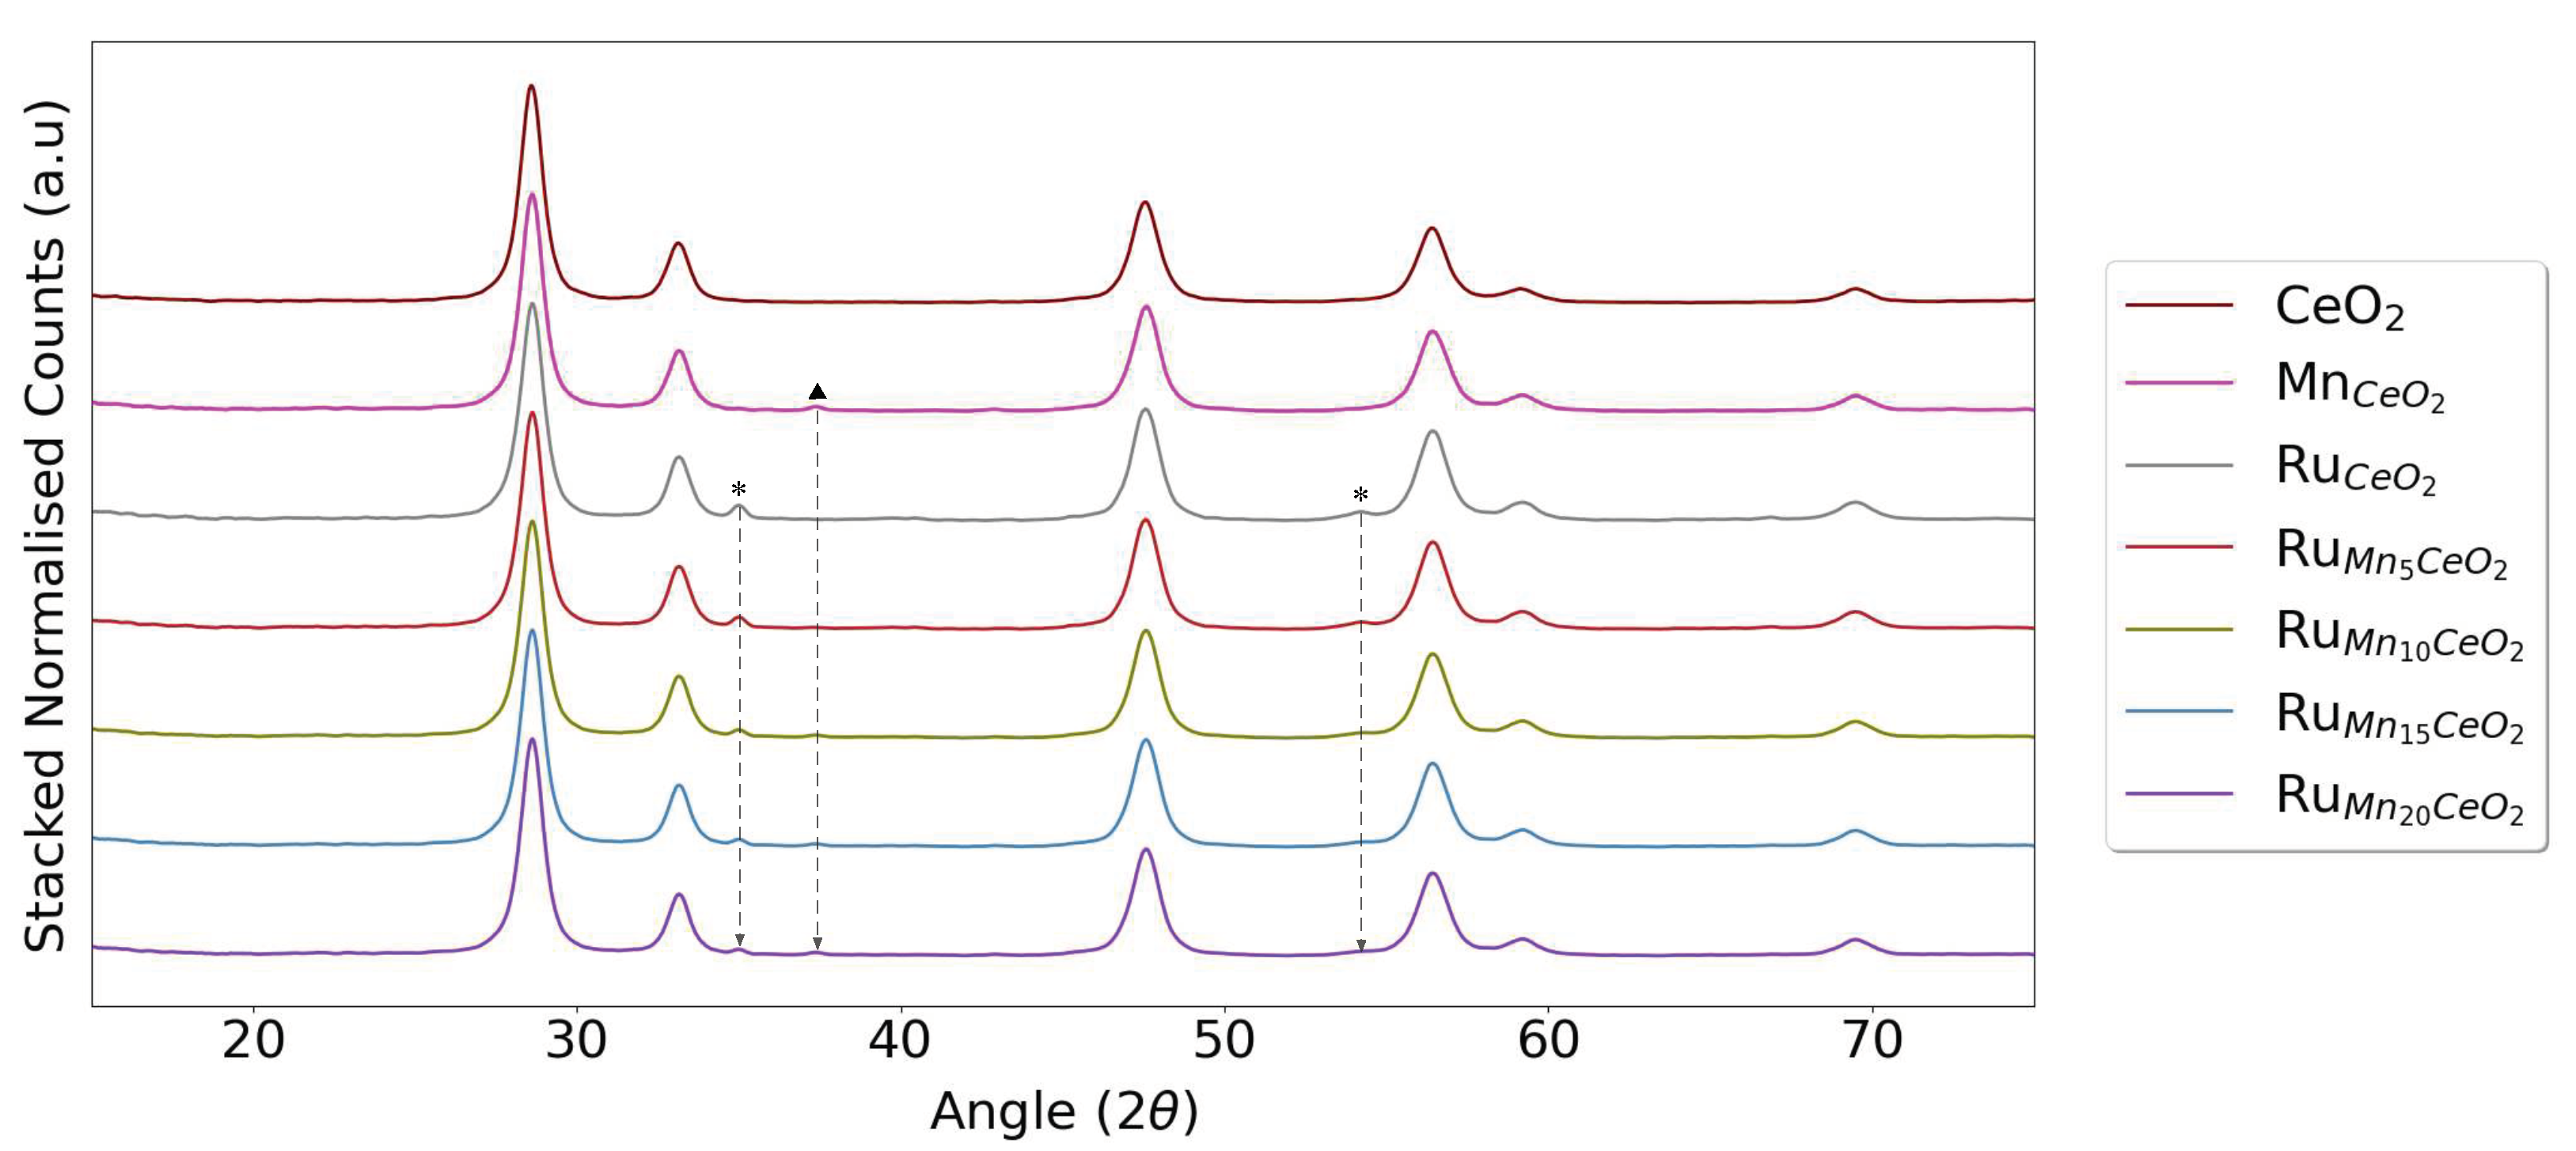
Figure 5 presents X-ray diffractograms for all as-prepared bimetallic catalysts, Mn C e O 2 and Ru C e O 2 catalysts, diffractograms for all other monometallic catalysts are presented in Figure S4. From diffractograms of all monometallic catalysts (presented in Figure S4), the fluorite cubic structure of CeO 2 is maintained upon doping with different elements. Only Ru C e O 2 and Mn C e O 2 catalysts had other distinct diffraction peaks than from that of CeO 2 , which corresponds to RuO 2 (presented as * in Figure S4) and MnO 2 (presented as in Figure S4) respectively, indicating larger RuO 2 particles for these catalysts. The bimetallic Ru-Mn catalysts (Ru M n 5 , C e O 2 , Ru M n 10 , C e O 2 , Ru M n 15 , C e O 2 and Ru M n 20 , C e O 2 ), had RuO 2 peaks in their respective diffractograms ( presented in Figure 5). However, the presence of MnO 2 peaks was more evident when the Mn loading was 10wt.% and above. As for the monometallic catalysts, the fluorite structure of ceria was maintained also in the bimetallic catalysts.
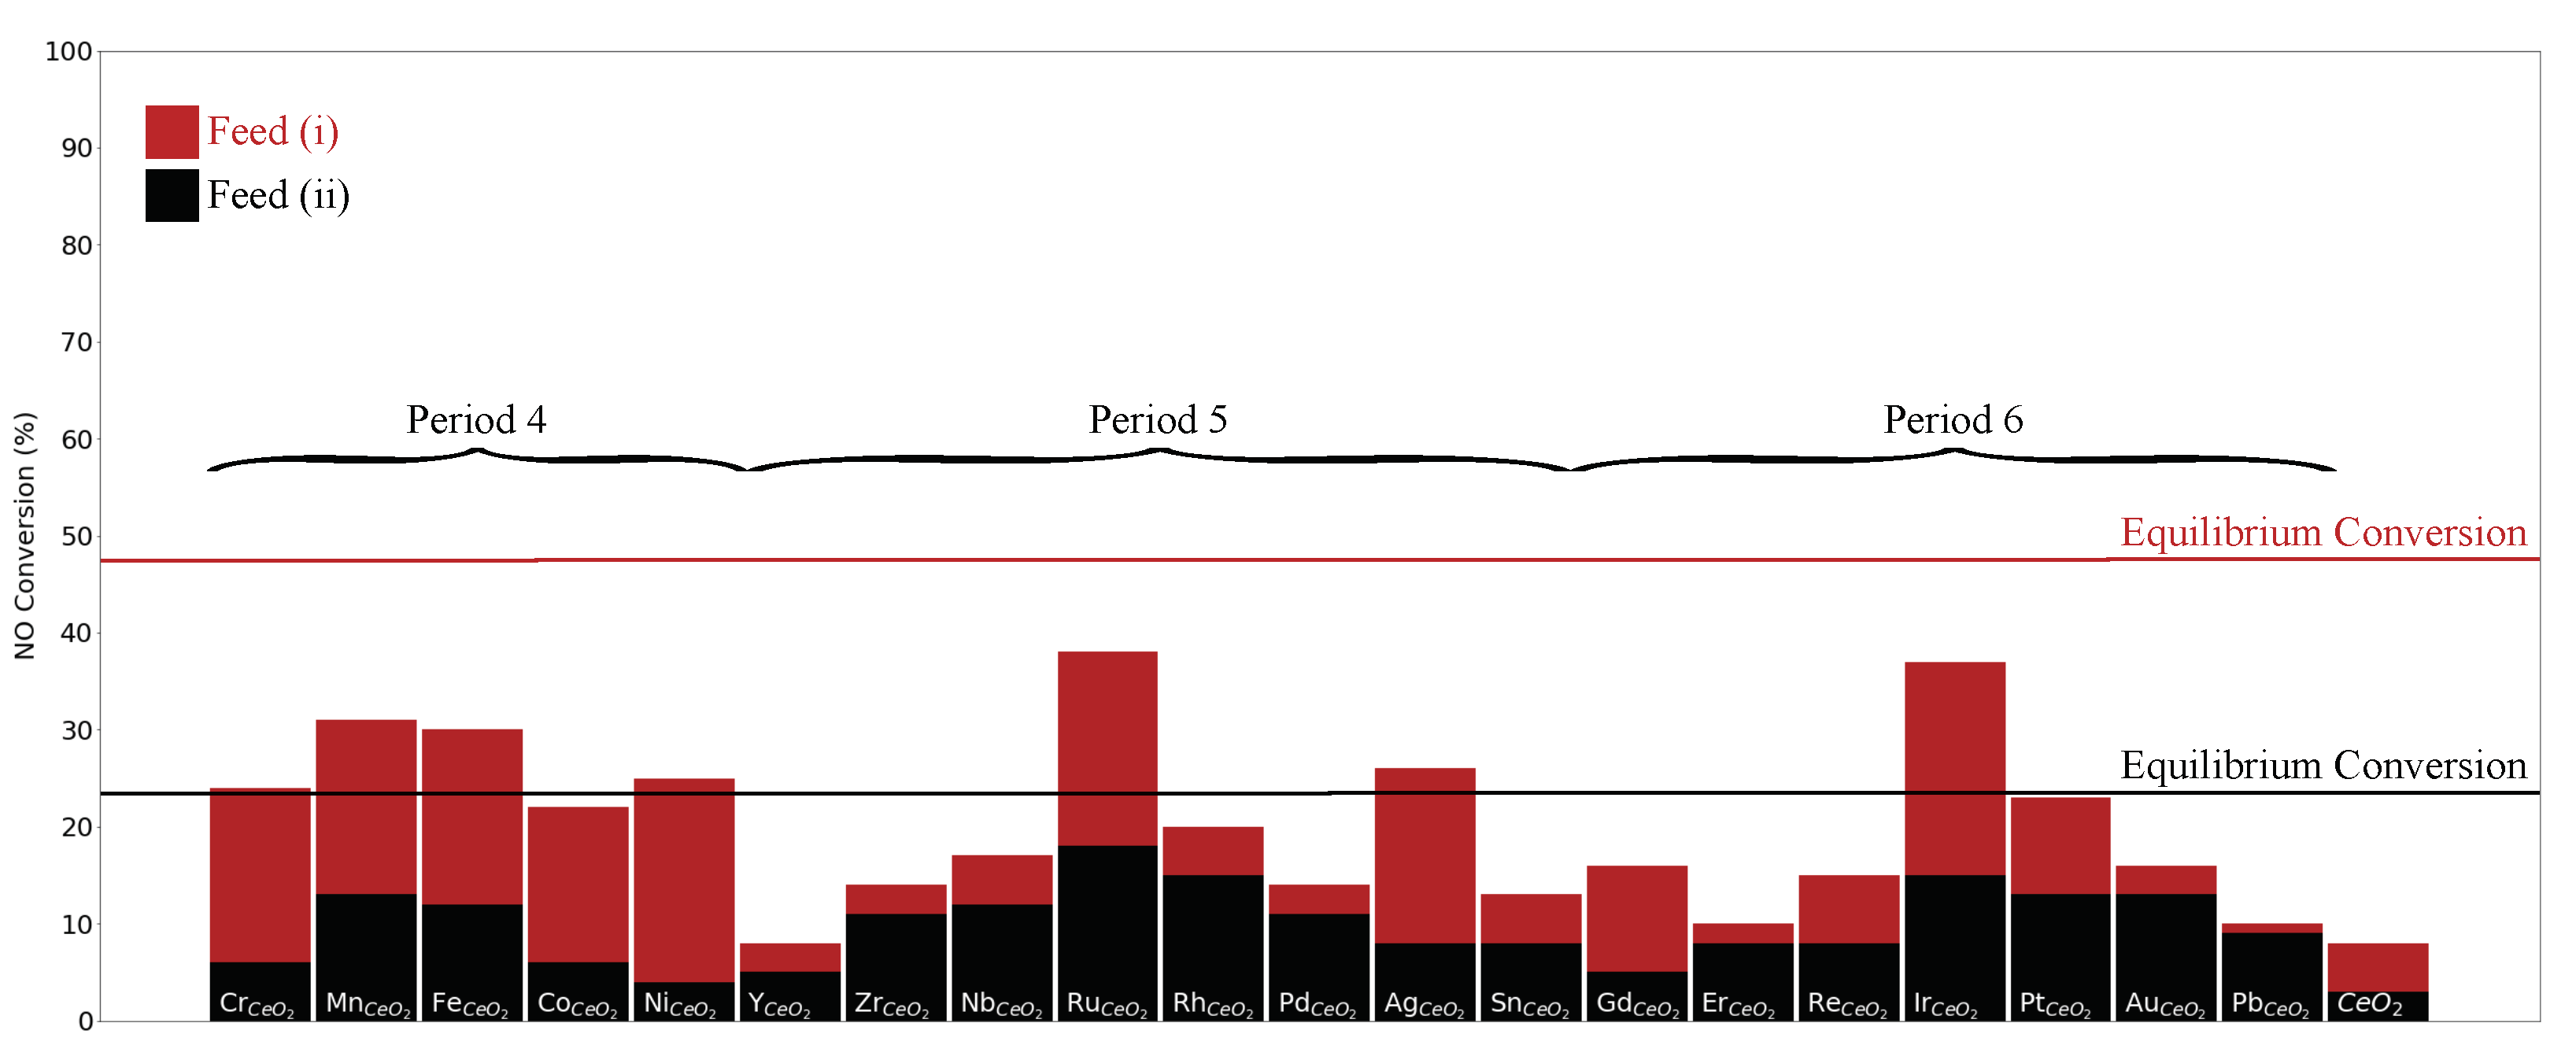
Figures S3, S5 and S6 presents catalytic NO conversions with respect to temperature and activation energy (in the temperature range of 340-350 C) of different monometallic ceria-supported catalysts in feed (i) and (ii) grouped and presented by periods in the periodic table for comparison. Among the monometallic catalysts, Period 4 metal-containing catalysts were more active than the rest of the monometallic catalysts at temperatures below 320 C. Out of all monometallic catalysts, only Ru C e O 2 and Ir C e O 2 attained NO-NO 2 equilibrium in the measured temperature range for feed (i) and only Ru C e O 2 for feed (ii). The majority of monometallic catalysts had activity in feed (ii) similar to that of gas-phase conversion with only CeO 2 , indicating NO 2 as an activity inhibitor as discussed by Mulla et al. [15] for platinum catalysts. Figure 6 presents average catalytic conversion at 380 C for all monometallic catalysts and the CeO 2 support in feed (i) and (ii) during temperature scan (150-400 C) at WHSV= 24,000 Ncm 3 /g g c a t h at ambient pressure. The addition of NO 2 in feed(ii) reduced the catalytic activity of all monometallic catalysts (presented in (d)-(f) Figures S3 and Figure 6). Mn C e O 2 , Fe C e O 2 , Ru C e O 2 and Ir C e O 2 catalysts were the most promising monometallic catalysts in terms of catalytic activity in both feed compositions (i) and (ii).
Catalyst selection rules dictate for active, cost-effective, versatile, selective, and stable catalysts [39,40]. Ru C e O 2 and Ir C e O 2 are the most active catalysts, but lower cost efficiency in comparison with Mn C e O 2 and Fe C e O 2 catalysts [27]. Ruthenium is more known for its versatility in catalysis compared to iridium due to its lower ionisation energy and more accessible range of oxidation states (-2 to +8)[41]. Manganese-based catalysts are used for low-temperature NO oxidation reactions at lower concentrations of NO [42,43,44] and our previous research portrayed that the 72hr isothermal activity of manganese on zirconia catalysts for NO oxidation at industrial nitric acid conditions can be improved by doping with Ag [20]. The highest achievable oxidation state in the first row of d-block elements increases up to manganese and decreases towards zinc. Manganese has multiple stable oxidation states (+2 to +7) and thus higher redox potential than the neighbouring element iron [45].
From the above literature and results presented in Figures S3 and Figure 6 and Table 2, manganese-based catalysts can participate in oxygen activation and transfer processes, whereas the presence of ruthenium can contribute to catalytic activity and stability [42,43,44,46,47]. A combination of Ru-Mn bimetallic catalysts suggests a pathway for producing catalysts for NO to NO 2 oxidation with significant low-temperature activity and lower activation energy. The Ru M n 5 , C e O 2 , Ru M n 10 , C e O 2 , Ru M n 15 , C e O 2 and Ru M n 20 , C e O 2 catalysts are four Ru-Mn bimetallic catalysts on ceria support with increasing loading of manganese.
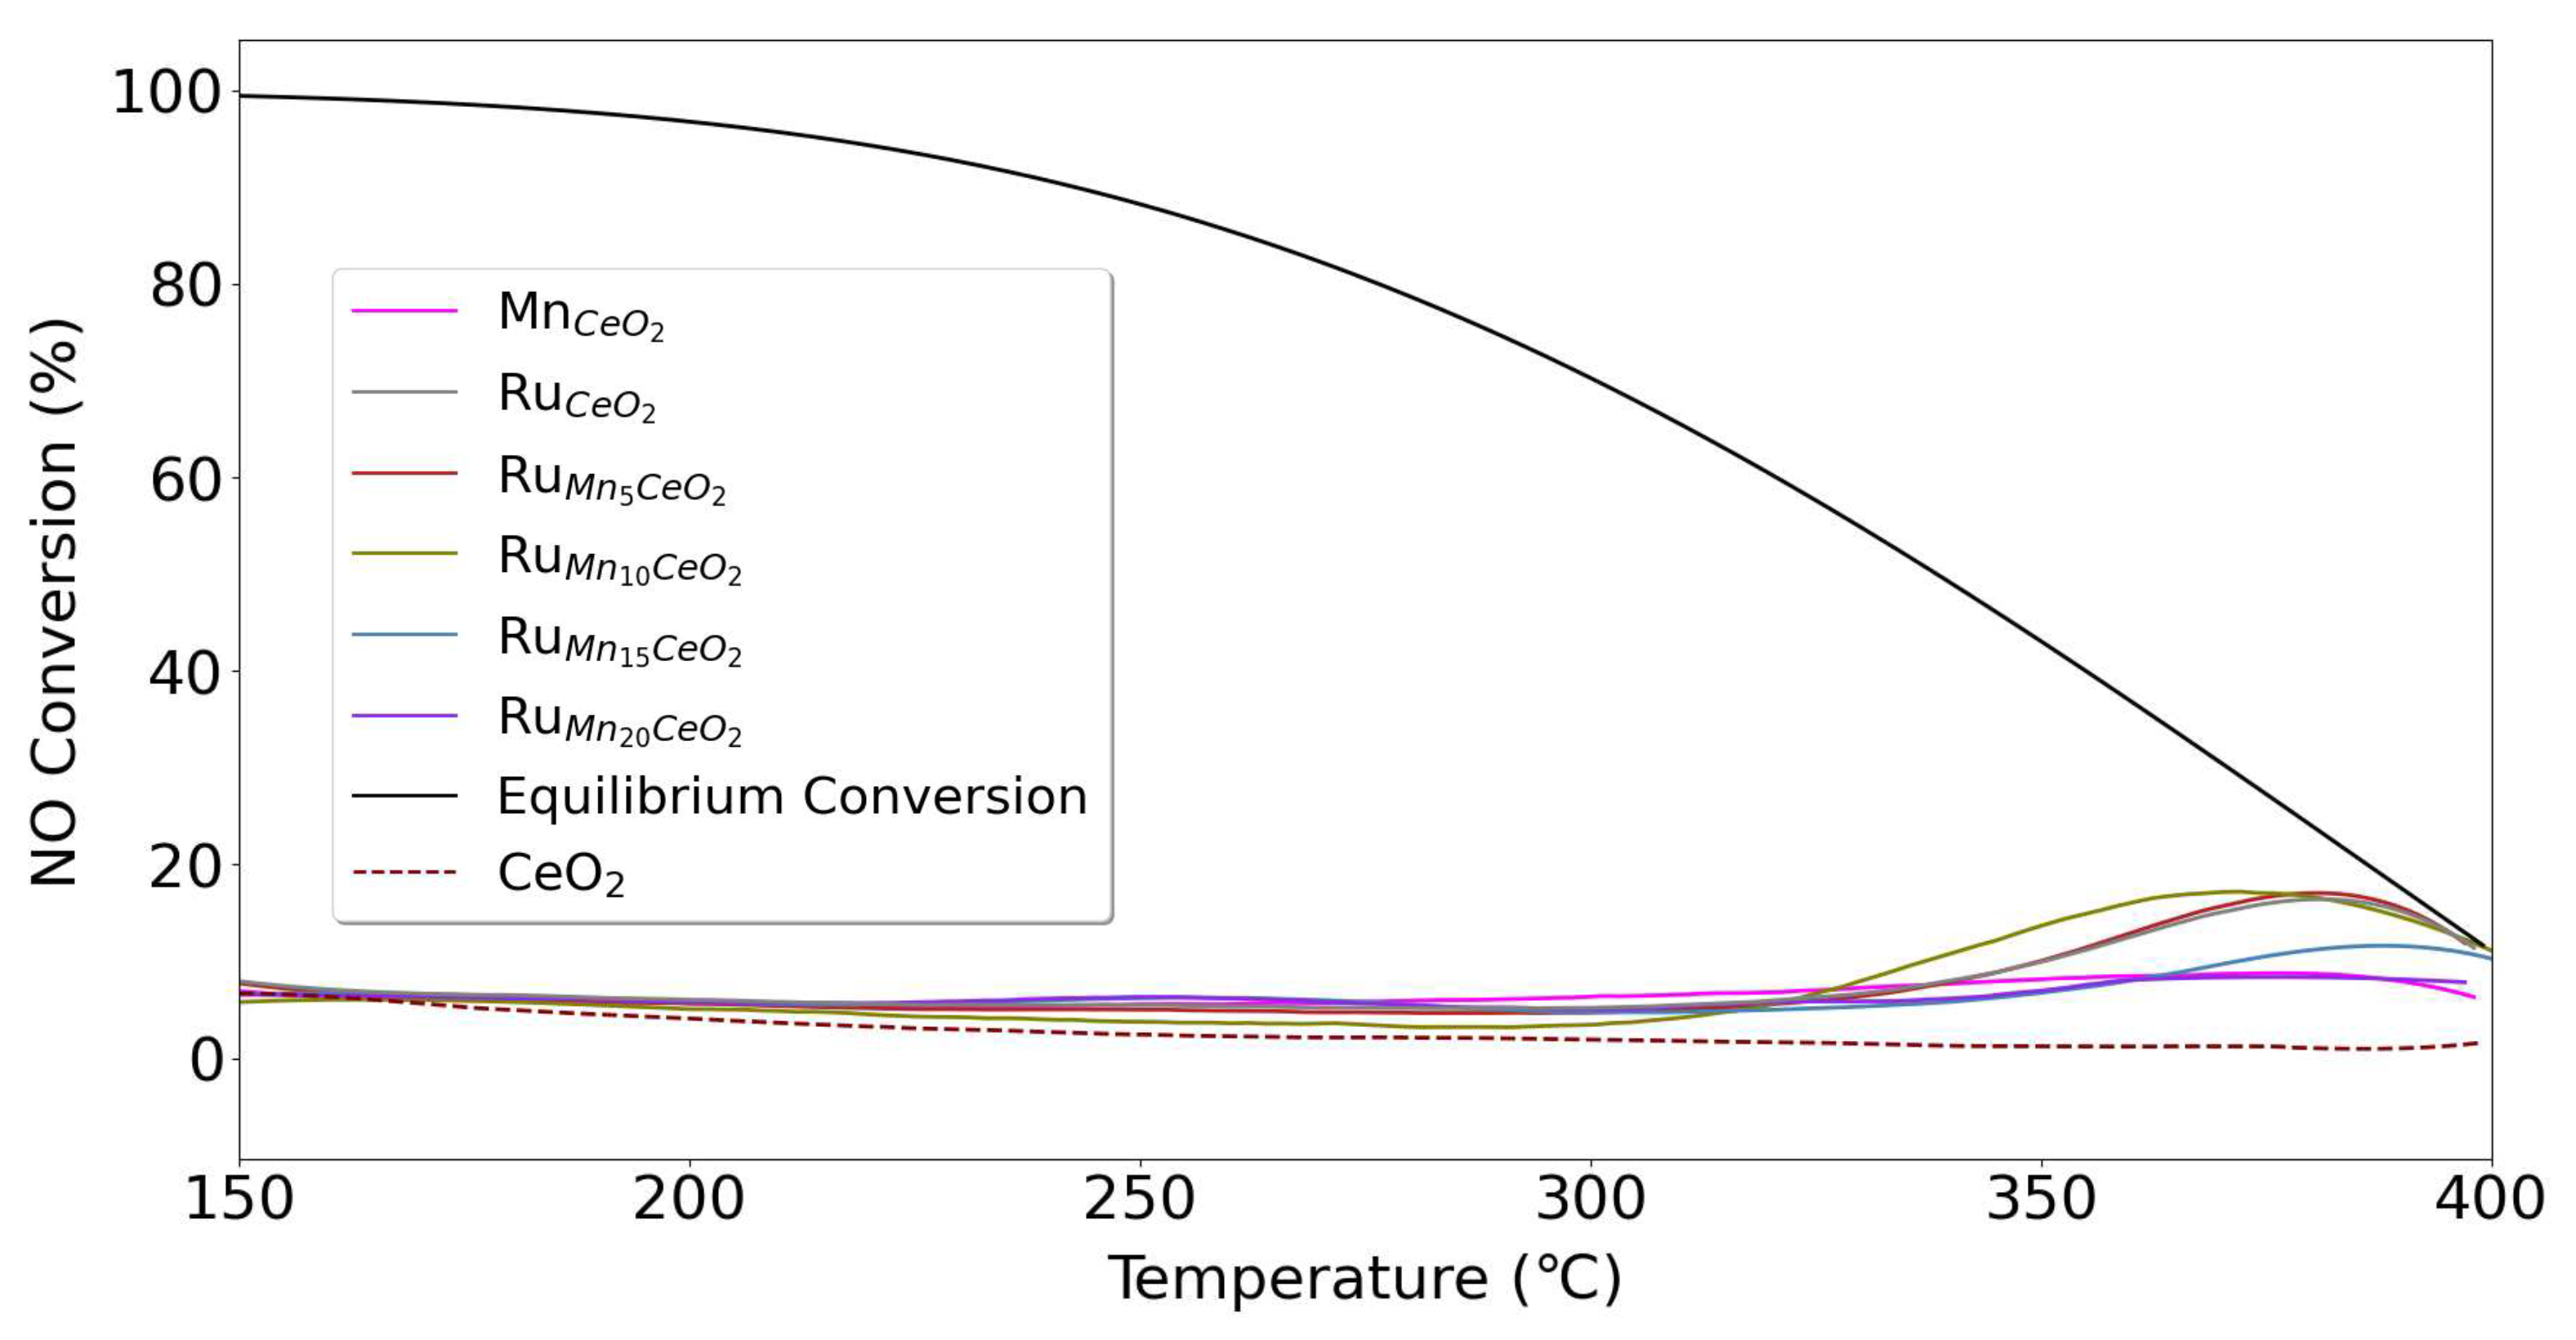
Figure 7 and Figure 8 presents NO to NO 2 conversion for Mn C e O 2 , Ru C e O 2 , Ru M n 5 , C e O 2 , Ru M n 10 , C e O 2 , Ru M n 15 , C e O 2 and Ru M n 20 , C e O 2 catalysts in feed (i) and (ii). Similar to conversions of monometallic catalysts, the NO conversion of bimetallic catalysts were severely inhibited by the presence of NO 2 in the feed due to competitive adsorption of NO 2 on the catalyst surface. The addition of 5wt.% manganese to the Ru C e O 2 catalyst improved low-temperature catalytic activity in feed(i), whereas catalytic activity in feed (ii) remained similar to that of the Ru C e O 2 catalyst. Increasing manganese loading higher than 10wt.% resulted in a decrease in catalytic activity for Ru M n 15 , C e O 2 and Ru M n 20 , C e O 2 catalysts in both feed (i) and (ii). The apparent activation energy in feed (i) and (ii) for the bimetallic catalysts are presented in Table 2 and respective Arrhenius plots are presented in Figures S7 and S8. The Ru M n 10 , C e O 2 catalyst proved to be the most active catalyst with an apparent activation energy of 39.4 kJ/mol and 85.4 kJ/mol in feed (i) and (ii) respectively.
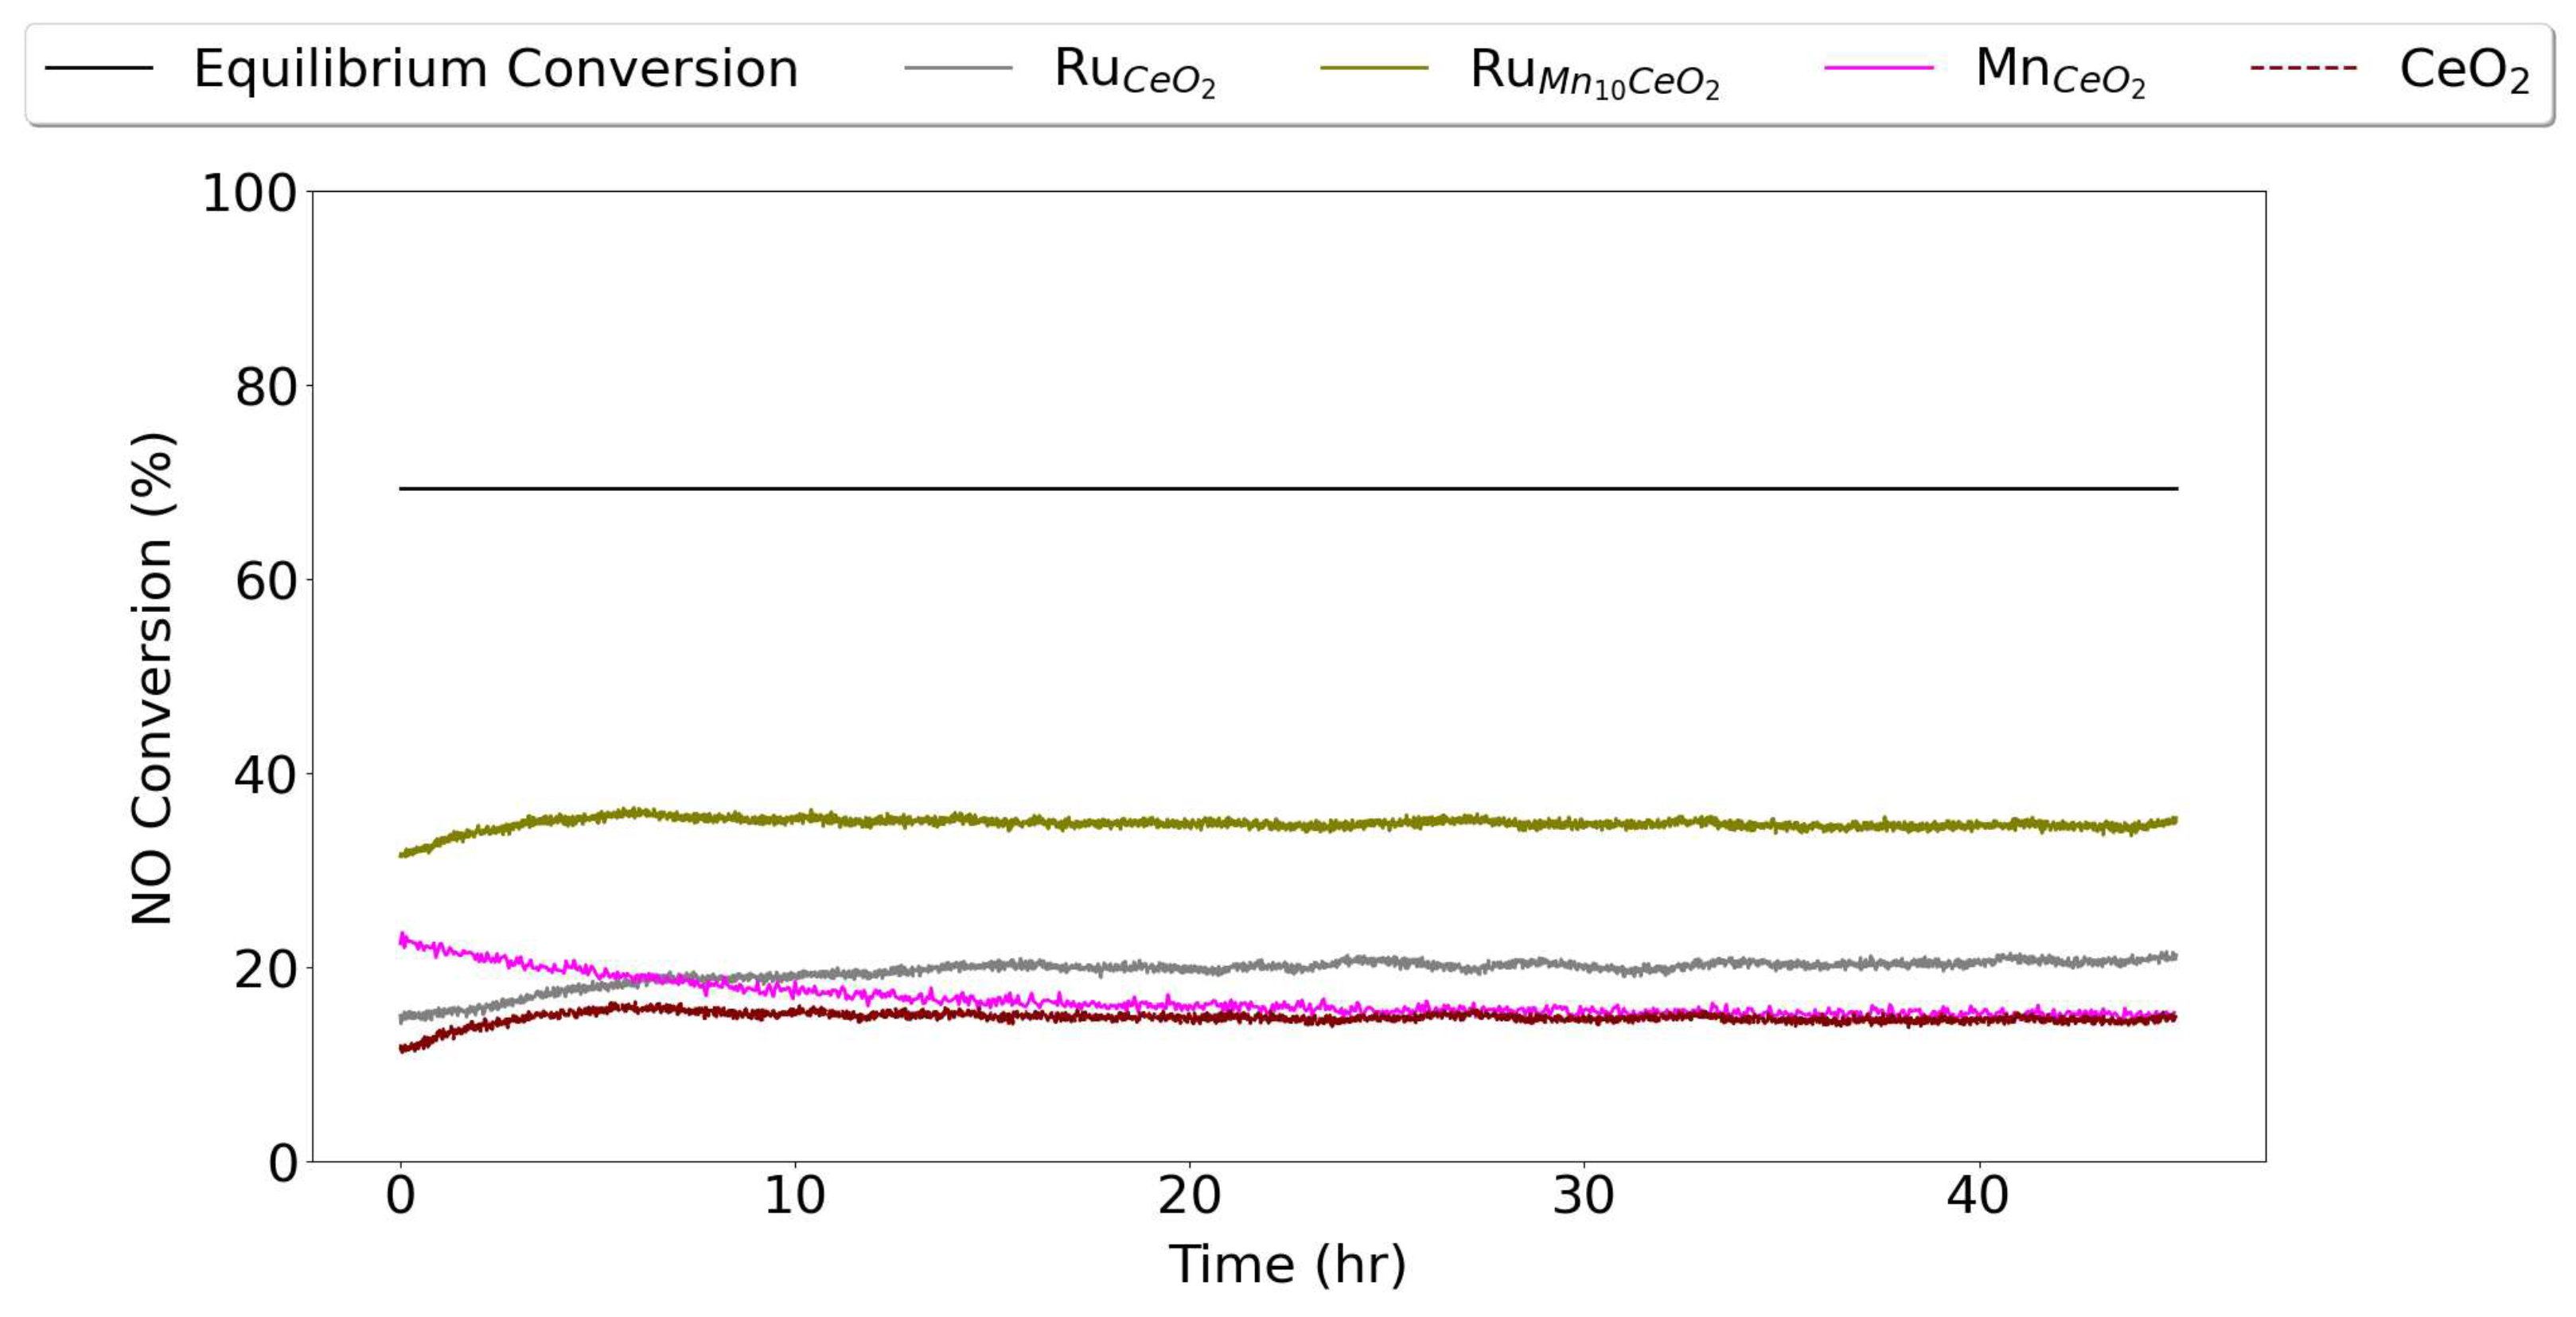
Figure 9 presents 45hrs isothermal runs for Mn C e O 2 , Ru C e O 2 , Ru M n 10 , C e O 2 and the CeO 2 support at 320 C in 10% NO, 6% O 2 , 15% H 2 O and rest Ar at WHSV= 24,000 Ncm 3 /g g c a t h at ambient pressure. The isothermal activity of the Ru C e O 2 and Ru M n 10 , C e O 2 catalyst stabilised after 10hrs of the experimental run. However, NO conversion for Mn C e O 2 decreased over time and eventually resembling the NO conversion obtained over the CeO 2 support, thus indicating deactivation. This deactivation of manganese can be due to MnO 2 reducing to Mn 2 O 3 as previously seen for Mn/ZrO 2 catalysts [20]. The addition of 10wt.% manganese clearly enhanced the low-temperature activity of the Ru C e O 2 catalyst and the catalyst was stable throughout 45hrs of an isothermal run at 320 C at ambient pressure.

4. Conclusions

This work has explored various monometallic and bimetallic catalysts for NO to NO 2 oxidation at industrial nitric acid production conditions. The effect of temperature was investigated, along with the inhibition effect of the product NO 2 in the feed. Among all monometallic catalysts, Period 4 metal-containing catalysts had the highest low-temperature NO oxidation activity. However, the Ru C e O 2 and Ir C e O 2 catalysts were the only two catalysts that could reach NO-NO 2 equilibrium in the measured temperature range (150-400 C) in the absence of NO 2 in the feed. In the presence of NO 2 , only the Ru C e O 2 catalyst reached equilibrium conversion at 400 C with an apparent activation energy of 81.7 kJ/mol. In comparison to most monometallic catalysts, bimetallic catalysts with 5 and 10wt.% manganese loading attained NO-NO 2 equilibrium in presence and absence of NO 2 at lower temperatures (ca. 400 C). The Ru M n 10 , C e O 2 catalyst proved to be the most active catalyst with an apparent activation energy of 39.4 kJ/mol and 85.4 kJ/mol in the absence and presence of NO 2 , respectively. These results illustrate that the CeO 2 -supported bimetallic ruthenium-manganese catalysts are promising for oxidising NO to NO 2 at low temperatures in industrial nitric acid production conditions.

Author Contributions

Jithin Gopakumar: Conceptualization, Methodology, Validation, Formal analysis, Investigation, Writing – Original Draft, Writing – Review & Editing, Visualization Albert Miro i Rovira: Investigation, Formal analysis, Validation Bjørn Christian Enger: Conceptualization, Validation, Writing – Review & Editing, Supervision, Funding acquisition David Waller: Conceptualization, Validation, Writing – Review & Editing, Supervision, Funding acquisition Magnus Rønning: Conceptualization, Validation, Writing – Review & Editing, Supervision, Project Administration, Funding acquisition.

Funding

This project is funded by iCSI (industrial Catalysis Science and Innovation) Centre for research-based innovation from the Research Council of Norway (grant 237922).

Data Availability Statement

Research data will be made available upon request.

Acknowledgments

This work was carried out at Norges teknisk-naturvitenskapelige universitet (NTNU) and is gratefully acknowledged for its support.

Conflicts of Interest

The authors declare no competing interest.

Abbreviations

The following abbreviations are used in this manuscript:
CAPEX Capital Expenditure
PGM Platinum Group Metals
WHSV Weight Hourly Space Velocity

References

  1. Honti, G.D. The Nitrogen Industry, 1976 ed.; Vol. 48, Akadémiai Kiadó, 1976. [CrossRef]
  2. Travis, A.S. Nitrogen Capture; Springer International Publishing: Cham, 2018. [Google Scholar] [CrossRef]
  3. Moulijn, J.A. Chemical process technology. Choice Reviews Online 2013, 51, 51–2107. [Google Scholar] [CrossRef]
  4. Grande, C.A.; Andreassen, K.A.; Cavka, J.H.; Waller, D.; Lorentsen, O.A.; Øien, H.; Zander, H.J.; Poulston, S.; García, S.; Modeshia, D. Process Intensification in Nitric Acid Plants by Catalytic Oxidation of Nitric Oxide. Industrial and Engineering Chemistry Research 2018, 57, 10180–10186. [Google Scholar] [CrossRef]
  5. YAO, H. Ceria in automotive exhaust catalysts I. Oxygen storage. Journal of Catalysis 1984, 86, 254–265. [Google Scholar] [CrossRef]
  6. Su, E.; Montreuil, C.; Rothschild, W. Oxygen storage capacity of monolith three-way catalysts. Applied Catalysis 1985, 17, 75–86. [Google Scholar] [CrossRef]
  7. Courtois, X.; Bion, N.; Marécot, P.; Duprez, D. Chapter 8 The role of cerium-based oxides used as oxygen storage materials in DeNOx catalysis; 2007; pp. 235–259. [CrossRef]
  8. Montini, T.; Melchionna, M.; Monai, M.; Fornasiero, P. Fundamentals and Catalytic Applications of CeO 2 -Based Materials. Chemical Reviews 2016, 116, 5987–6041. [Google Scholar] [CrossRef] [PubMed]
  9. Inger, M.; Rajewski, J.; Ruszak, M.; Wilk, M. The influence of NOx presence on the catalytic N2O decomposition over the supported double-promoted cobalt spinel catalyst. Chemical Papers 2019, 73, 1979–1986. [Google Scholar] [CrossRef]
  10. Yung, M.M.; Holmgreen, E.M.; Ozkan, U.S. Cobalt-based catalysts supported on titania and zirconia for the oxidation of nitric oxide to nitrogen dioxide. Journal of Catalysis 2007, 247, 356–367. [Google Scholar] [CrossRef]
  11. Chen, H.; Wang, Y.; Lv, Y.K. Catalytic oxidation of NO over MnO2 with different crystal structures. RSC Advances 2016, 6, 54032–54040. [Google Scholar] [CrossRef]
  12. Salman, A.U.R.; Hyrve, S.M.; Regli, S.K.; Zubair, M.; Enger, B.C.; Lødeng, R.; Waller, D.; Rønning, M. Catalytic Oxidation of NO over LaCo1-xBxO3 (B = Mn, Ni) Perovskites for Nitric Acid Production. Catalysts 2019, 9, 429. [Google Scholar] [CrossRef]
  13. Chen, J.; Shen, M.; Wang, X.; Qi, G.; Wang, J.; Li, W. The influence of nonstoichiometry on LaMnO3 perovskite for catalytic NO oxidation. Applied Catalysis B: Environmental 2013, 134-135, 251–257. [Google Scholar] [CrossRef]
  14. Olsson, L.; Persson, H.; Fridell, E.; Skoglundh, M.; Andersson, B. A Kinetic Study of NO Oxidation and NO x Storage on Pt/Al2O3 and Pt/BaO/Al2O3. The Journal of Physical Chemistry B 2001, 105, 6895–6906. [Google Scholar] [CrossRef]
  15. Mulla, S.S.; Chen, N.; Delgass, W.N.; Epling, W.S.; Ribeiro, F.H. NO 2 inhibits the catalytic reaction of NO and O 2 over Pt. Catalysis Letters 2005, 100, 267–270. [Google Scholar] [CrossRef]
  16. Smeltz, A.; Getman, R.; Schneider, W.; Ribeiro, F. Coupled theoretical and experimental analysis of surface coverage effects in Pt-catalyzed NO and O2 reaction to NO2 on Pt(111). Catalysis Today 2008, 136, 84–92. [Google Scholar] [CrossRef]
  17. Xue, E.; Seshan, K.; Ross, J.R.H. Roles of supports , Pt loading and Pt dispersion in the oxidation of NO to NO , and of SO , to SO , Applied Catalysis B: Environmental 1996, 11, 65–79. [Google Scholar] [CrossRef]
  18. Hong, Z.; Wang, Z.; Li, X. Catalytic oxidation of nitric oxide (NO) over different catalysts: an overview. Catalysis Science & Technology 2017, 7, 3440–3452. [Google Scholar] [CrossRef]
  19. Gopakumar, J.; Benum, P.M.; Svenum, I.H.; Enger, B.C.; Waller, D.; Rønning, M. Redox transformations of Ru catalyst during NO oxidation at industrial nitric acid production conditions. Chemical Engineering Journal 2023, 146406. [Google Scholar] [CrossRef]
  20. Gopakumar, J.; Vold, S.; Enger, B.C.; Waller, D.; Vullum, P.E.; Rønning, M. Catalytic oxidation of NO to NO 2 for industrial nitric acid production using Ag-promoted MnO2/ZrO2 catalysts. Catalysis Science & Technology 2023, 13, 2783–2793. [Google Scholar] [CrossRef]
  21. Salman, A.u.R.; Enger, B.C.; Auvray, X.; Lødeng, R.; Menon, M.; Waller, D.; Rønning, M. Catalytic oxidation of NO to NO2 for nitric acid production over a Pt/Al2O3 catalyst. Applied Catalysis A: General 2018, 564, 142–146. [Google Scholar] [CrossRef]
  22. William, C. Klingelhoefer, S. Nitric Oxide Oxidation, 1938.
  23. Heilig, M.L. Process of Oxidizing Gases, 1994. [CrossRef]
  24. Andersen, H.C.; Haley, A.J. Process for the oxidation of nitric oxide, 1963.
  25. Robertus J. M. Klein Gebbink.; Marc-Etienne Moret. Non-Noble Metal Catalysis; Wiley-VCH Verlag GmbH & Co. KGaA: Weinheim, Germany, 2019. [CrossRef]
  26. Védrine, J.C. Metal Oxides in Heterogeneous Oxidation Catalysis: State of the Art and Challenges for a More Sustainable World. ChemSusChem 2019, 12, 577–588. [Google Scholar] [CrossRef] [PubMed]
  27. European Commission. Critical Raw Materials Factsheets ( 2020). Technical report, 2020. [CrossRef]
  28. Fogler, H.S. Elements of Chemical Reaction Engineering; 2006.
  29. Mosallanejad, S.; Dlugogorski, B.Z.; Kennedy, E.M.; Stockenhuber, M. On the Chemistry of Iron Oxide Supported on γ-Alumina and Silica Catalysts. ACS Omega 2018, 3, 5362–5374. [Google Scholar] [CrossRef] [PubMed]
  30. Taher, N.M.; Mahmoudi, M.; Sajjadivand, S.S. Cobalt Catalysts Preparation and Characterization over Alumina Support for Fischer Tropsch Synthesis. Biofuels Engineering 2017, 2, 51–61. [Google Scholar] [CrossRef]
  31. Robert, C. Reuel.; Calvin H. Bartholomew. The stoichiometries of H2 and CO adsorptions on cobalt: Effects of support and preparation. Journal of Catalysis 1984, 85, 63–77. [Google Scholar] [CrossRef]
  32. Niu, J.; Liland, S.E.; Yang, J.; Rout, K.R.; Ran, J.; Chen, D. Effect of oxide additives on the hydrotalcite derived Ni catalysts for CO2 reforming of methane. Chemical Engineering Journal 2019, 377, 119763. [Google Scholar] [CrossRef]
  33. Kim, H.B.; Park, E.D. Ammonia decomposition over Ru catalysts supported on alumina with different crystalline phases. Catalysis Today 2023, 411-412, 113817. [Google Scholar] [CrossRef]
  34. Zhang, Y.; Yang, X.; Yang, X.; Duan, H.; Qi, H.; Su, Y.; Liang, B.; Tao, H.; Liu, B.; Chen, D.; Su, X.; Huang, Y.; Zhang, T. Tuning reactivity of Fischer–Tropsch synthesis by regulating TiOx overlayer over Ru/TiO2 nanocatalysts. Nature Communications 2020, 11, 3185. [Google Scholar] [CrossRef] [PubMed]
  35. Choong, C.K.S.; Chen, L.; Du, Y.; Schreyer, M.; Daniel Ong, S.W.; Poh, C.K.; Hong, L.; Borgna, A. The role of metal–support interaction for CO-free hydrogen from low temperature ethanol steam reforming on Rh–Fe catalysts. Physical Chemistry Chemical Physics 2017, 19, 4199–4207. [Google Scholar] [CrossRef]
  36. Guerra-Que, Z.; Torres-Torres, G.; Pérez-Vidal, H.; Cuauhtémoc-López, I.; Espinosa de los Monteros, A.; Beltramini, J.N.; Frías-Márquez, D.M. Silver nanoparticles supported on zirconia–ceria for the catalytic wet air oxidation of methyl tert-butyl ether. RSC Advances 2017, 7, 3599–3610. [Google Scholar] [CrossRef]
  37. MCVICKER, G. Chemisorption properties of iridium on alumina catalysts. Journal of Catalysis 1980, 65, 207–220. [Google Scholar] [CrossRef]
  38. Bus, E.; Miller, J.T.; van Bokhoven, J.A. Hydrogen Chemisorption on Al2O3-Supported Gold Catalysts. The Journal of Physical Chemistry B 2005, 109, 14581–14587. [Google Scholar] [CrossRef]
  39. Kühn, F.E. Catalysis. From Principles to Applications. By Matthias Beller, Albert Renken and Rutger A. van Santen. Angewandte Chemie International Edition 2013, 52, 2650–2650. [Google Scholar] [CrossRef]
  40. Larsen, G. Principles and Practice of Heterogeneous Catalysis By J. M. Thomas (University of Cambridge) and W. J. Thomas (University of Bath). VCH: Weinheim, 1997. xxiii + 669 pp. DM88.00. ISBN 3-527-29239-X. Journal of the American Chemical Society 1997, 119, 11560–11560. [Google Scholar] [CrossRef]
  41. Bruneau, C.; Dixneuf, P.H. Ruthenium in catalysis; Vol. 48, 2014. [CrossRef]
  42. LI, H.; TANG, X.; YI, H.; YU, L. Low-temperature catalytic oxidation of NO over Mn-Ce-Ox catalyst. Journal of Rare Earths 2010, 28, 64–68. [Google Scholar] [CrossRef]
  43. Li, K.; Tang, X.; Yi, H.; Ning, P.; Kang, D.; Wang, C. Low-temperature catalytic oxidation of NO over Mn-Co-Ce-Ox catalyst. Chemical Engineering Journal 2012, 192, 99–104. [Google Scholar] [CrossRef]
  44. Chen, H.; Wang, Y.; Lyu, Y.K. High catalytic activity of Mn-based catalyst in NO oxidation at low temperature and over a wide temperature span. Molecular Catalysis 2018, 454, 21–29. [Google Scholar] [CrossRef]
  45. Johnstone, A.H. CRC Handbook of Chemistry and Physics-69th Edition Editor in Chief R. C. Weast, CRC Press Inc., Boca Raton, Florida, 1988, pp. 2400, price £57.50. ISBN 0-8493-0369-5. Journal of Chemical Technology & Biotechnology 2007, 50, 294–295. [Google Scholar] [CrossRef]
  46. Takashima, T.; Hashimoto, K.; Nakamura, R. Mechanisms of pH-dependent activity for water oxidation to molecular oxygen by MnO2 electrocatalysts. Journal of the American Chemical Society 2012, 134, 1519–1527. [Google Scholar] [CrossRef]
  47. Cao, L.; Luo, Q.; Chen, J.; Wang, L.; Lin, Y.; Wang, H.; Liu, X.; Shen, X.; Zhang, W.; Liu, W.; Qi, Z.; Jiang, Z.; Yang, J.; Yao, T. Dynamic oxygen adsorption on single-atomic Ruthenium catalyst with high performance for acidic oxygen evolution reaction. Nature Communications 2019, 10. [Google Scholar] [CrossRef]
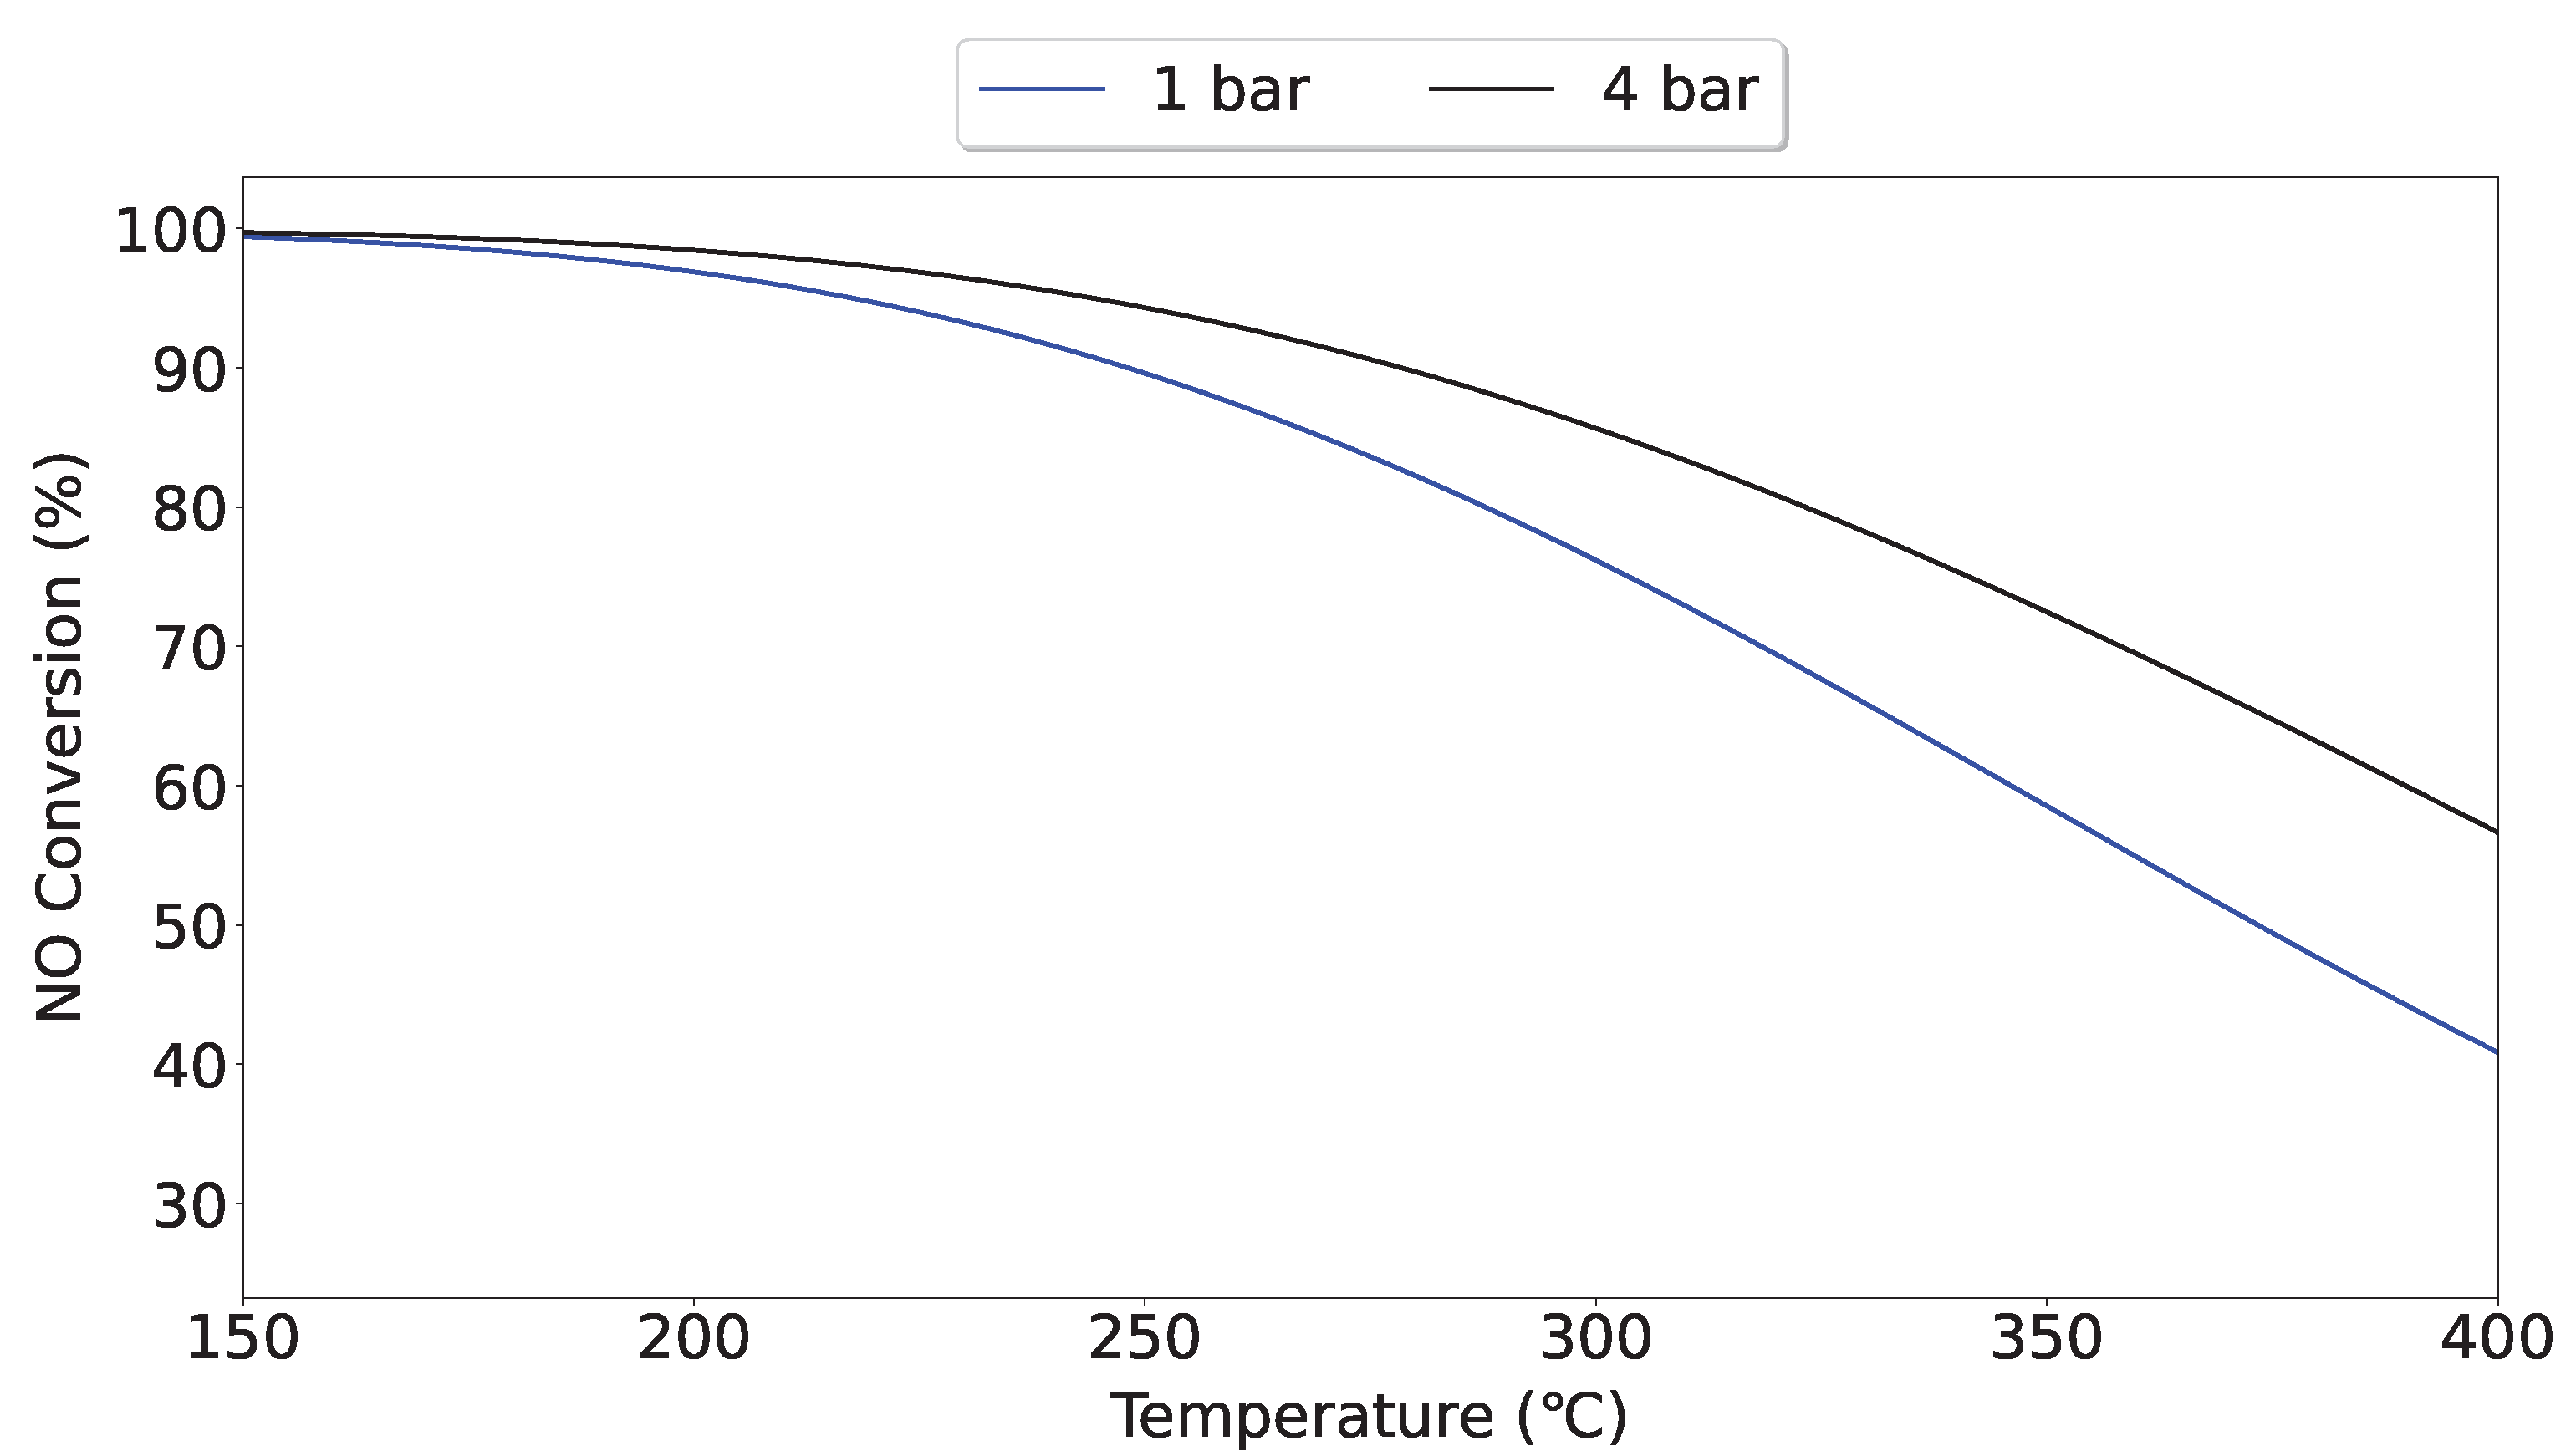
Figure 1. Homogeneous equilibrium conversion of NO to NO 2 as a function of temperature at 1 and 4 barg pressures.
Preprints 87317 g001
Figure 2. Experimental setup used of catalytic testing and in-situ production of NO 2 . All (- - -) dashed lines are heated to 200 C to avoid cold spots and acid condensation. The dashed lines a-b (- - -) represent a coiled line section immersed in cooling water for in-situ conversion of NO to NO 2 .
Preprints 87317 g002
Figure 3. Apparent activation energy (E a kJ/mol) in two different feeds; (a) Feed (i) 10% NO, 6% O 2 , 15% H 2 O and rest Ar and (b) Feed (ii) 8% NO, 2% NO 2 5% O 2 , 15% H 2 O and rest Ar, with a space velocity of 24,000 Ncm 3 /g g c a t h for different monometallic catalysts.
Preprints 87317 g003
Figure 4. Apparent activation energy (E a kJ/mol) in two different feeds; (a) Feed (i) 10% NO, 6% O 2 , 15% H 2 O and rest Ar and (b) Feed (ii) 8% NO, 2% NO 2 5% O 2 , 15% H 2 O and rest Ar, with a space velocity of 24,000 Ncm 3 /g g c a t h for different bimetallic catalysts.
Preprints 87317 g004
Figure 5. X-ray diffraction (XRD) patterns recorded for the CeO 2 support (PDF-00-034-0394), with Mn C e O 2 , Ru C e O 2 , Ru M n 5 , C e O 2 , Ru M n 10 , C e O 2 , Ru M n 15 , C e O 2 and Ru M n 20 , C e O 2 catalyst samples in the 2 θ range 5-75 with Cu K α radiation (1.54060Å). Diffraction peaks of RuO 2 (PDF-04-003-2008) are represented as * and MnO 2 (PDF-04-007-3893) are presented as Δ
Preprints 87317 g005
Figure 6. NO conversion (%) over various monometallic catalysts at 380 C during temperature scan (150-400 C) at WHSV= 24,000 Ncm 3 /g g c a t h at ambient pressure in Feed (i): 10% NO, 6% O 2 , 15% H 2 O and rest Ar and Feed (ii) 8% NO, 2% NO 2 5% O 2 , 15% H 2 O and rest Ar. Period 4 (from the Periodic table) metal catalysts are: Cr C e O 2 , Mn C e O 2 , Fe C e O 2 , Co C e O 2 and Ni C e O 2 , Period 5 metal catalysts are: Y C e O 2 , Zr C e O 2 , Nb C e O 2 , Ru C e O 2 , Rh C e O 2 , Pd C e O 2 , Ag C e O 2 and Sn C e O 2 , and Period 6 metal catalysts are Gd C e O 2 , Er C e O 2 , Re C e O 2 , Ir C e O 2 , Pt C e O 2 , Au C e O 2 and Pb C e O 2 . NO conversion (%) at 380 C presented above for all catalysts are average conversions of three parallel temperature scans (150-400 C) in feed (i) and (ii).
Preprints 87317 g006
Figure 7. NO conversion (%) of Mn C e O 2 , Ru C e O 2 , Ru M n 5 , C e O 2 , Ru M n 10 , C e O 2 , Ru M n 15 , C e O 2 and Ru M n 20 , C e O 2 catalysts as a function of temperature with Feed (i): 10% NO, 6% O 2 , 15% H 2 O and rest Ar, heated at a rate of 5 C/min at WHSV= 24,000 Ncm 3 /g g c a t h at ambient pressure.
Preprints 87317 g007
Figure 8. NO conversion (%) of Mn C e O 2 , Ru C e O 2 , Ru M n 5 , C e O 2 , Ru M n 10 , C e O 2 , Ru M n 15 , C e O 2 and Ru M n 20 , C e O 2 catalysts as a function of temperature with Feed (ii): 8% NO, 2% NO 2 , 5% O 2 , 15% H 2 O and rest Ar, heated at a rate of 5 C/min at WHSV= 24,000 Ncm 3 /g g c a t h at ambient pressure.
Preprints 87317 g008
Figure 9. NO conversion (%) of Mn C e O 2 , Ru C e O 2 , Ru M n 10 , C e O 2 and the CeO 2 support at 320 C in 10% NO, 6% O 2 , 15% H 2 O and rest Ar at WHSV= 24,000 Ncm 3 /g g c a t h at ambient pressure for 45hrs.
Preprints 87317 g009
Table 1. Designations of all ceria-based catalysts and impregnated metal precursor details.
Catalyst Name Metal Precursor Commercial Supplier
Cr C e O 2 Cr(NO 3 ) 3 .9H 2 O Sigma Aldrich
Mn C e O 2 Mn(NO 3 ) 2 .4H 2 O Sigma Aldrich
Fe C e O 2 FeCl 3 Sigma Aldrich
Co C e O 2 Co(NO 3 ) 2 .6H 2 O Sigma Aldrich
Ni C e O 2 Ni(NO 3 ) 2 .6H 2 O Sigma Aldrich
Y C e O 2 Y(NO 3 ) 3 .6H 2 O Sigma Aldrich
Zr C e O 2 ZrO(NO 3 ) 2 .xH 2 O Sigma Aldrich
Nb C e O 2 NbCl 5 Sigma Aldrich
Ru C e O 2 RuCl 3 .xH 2 O Sigma Aldrich
Ru M n 5 , C e O 2 RuCl 3 .xH 2 O,Mn(NO 3 ) 2 .4H 2 O Sigma Aldrich
Ru M n 10 , C e O 2 RuCl 3 .xH 2 O,Mn(NO 3 ) 2 .4H 2 O Sigma Aldrich
Ru M n 15 , C e O 2 RuCl 3 .xH 2 O,Mn(NO 3 ) 2 .4H 2 O Sigma Aldrich
Ru M n 20 , C e O 2 RuCl 3 .xH 2 O,Mn(NO 3 ) 2 .4H 2 O Sigma Aldrich
Rh C e O 2 RhCl 3 Sigma Aldrich
Pd C e O 2 PdCl 2 Sigma Aldrich
Ag C e O 2 AgNO 3 Alfa Aesar
Sn C e O 2 SnCl 4 Sigma Aldrich
Re C e O 2 ReCl 3 Sigma Aldrich
Ir C e O 2 IrCl 3 Merck
Pt C e O 2 (Pt(NO 3 ) 4 ) a q Alfa Aesar
Au C e O 2 (HAuCl 4 ) a q Sigma Aldrich
Pb C e O 2 PbCl 2 Sigma Aldrich
Gd C e O 2 Gd(NO 3 ) 3 .6H 2 O Alfa Aesar
Er C e O 2 Cl 3 Er.6H 2 O Sigma Aldrich
Table 2. BET surface areas (N 2 physisorption) and respective total metal dispersion (%) from chemisorption measurements for the different catalysts.
Catalyst Surface a Dispersion Metal:Probe Probe Gas
Area [m 2 /g] [%] b Specie Uptake [mol g 1 ]
CeO 2 92
Cr C e O 2 78
Mn C e O 2 82
Fe C e O 2 82 3% 1:1 - Fe:H [29] 2
Co C e O 2 80 10% 1:1 - Co:H [30,31] 27
Ni C e O 2 79 11% 1:1 - Ni:H [32] 33
Y C e O 2 85
Zr C e O 2 86
Nb C e O 2 79
Ru C e O 2 72 41% 1:1 - Ru:CO [33,34] 39
Ru M n 5 , C e O 2 71 39% 1:1 - Ru:CO [33,34] 35
Ru M n 10 , C e O 2 65 32% 1:1 - Ru:CO [33,34] 31
Ru M n 15 , C e O 2 55 19% 1:1 - Ru:CO [33,34] 18
Ru M n 20 , C e O 2 48 13% 1:1 - Ru:CO [33,34] 12
Rh C e O 2 74 38% 1:1 - Rh:H [35] 39
Pd C e O 2 72
Ag C e O 2 70 29% 1:1 - Ag:H 2 [36] 24
Sn C e O 2 80
Re C e O 2 75
Ir C e O 2 76 37% 1:1 - Ir:CO [37] 35
Pt C e O 2 75 43% 1:1 - Pt:CO [21] 42
Au C e O 2 72 2% 1:1 - Au:H [38] 2
Pb C e O 2 70
Gd C e O 2 81
Er C e O 2 77
14.1cm a. Average of two parallel experiments with the same material. b. Dispersion measurement programme details are presented in Table S1.
Disclaimer/Publisher’s Note: The statements, opinions and data contained in all publications are solely those of the individual author(s) and contributor(s) and not of MDPI and/or the editor(s). MDPI and/or the editor(s) disclaim responsibility for any injury to people or property resulting from any ideas, methods, instructions or products referred to in the content.
Copyright: This open access article is published under a Creative Commons CC BY 4.0 license, which permit the free download, distribution, and reuse, provided that the author and preprint are cited in any reuse.
Prerpints.org logo

Preprints.org is a free preprint server supported by MDPI in Basel, Switzerland.

Subscribe

© 2024 MDPI (Basel, Switzerland) unless otherwise stated