Preprint
Article

Urbanization Characteristics of Central Asian Since the New Century

Altmetrics

Downloads

148

Views

48

Comments

0

This version is not peer-reviewed

Submitted:

28 September 2023

Posted:

10 October 2023

You are already at the latest version

Alerts
Abstract
Central Asian countries are the core area of the Belt and Road Initiative (BRI). However, as part of the former Soviet Union, we know very little about the urbanization processes in these countries after the collapse of the Soviet Union. Here, were used land-cover type data, vegetation index data, and grided population data to quantify the urban expansion, urban population changes, and urban environment changes across cities in Central Asia from 2000 to 2020, and took Xinjiang, China as a reference. We found that the urbanization in the study area was uneven. Specifically, the urban expansion in Xinjiang, China and Kazakhstan was faster than in the other countries in the study area. Due to rapid urban expansion, the urban population density in Xinjiang, China decreased from 2000 to 2020, but rapid urban population growth was maintained. Consequently, the pressure of the urban population growth in Xinjiang, China was less than that in the other countries of Central Asia. On average, more than 35% of the urban built-up areas underwent significant greening in Xinjiang, China and more than 3.63 million residents directly benefited from the increase in urban greenness. Although the urban greenness in Xinjiang increased significantly, the overall greenness was still lower than in most cities in Central Asia. In the future, the cities in Xinjiang, China should continue to promote the construction of urban ecological civilization and strengthen their role as a link in the Belt and Road Initiative.
Keywords: 
Subject: Environmental and Earth Sciences  -   Geography

1. Introduction

As a heart of the “world island” [1], Central Asia links Asia and Europe. After the collapse of the Soviet Union, the five Central Asian countries, i.e., Kazakhstan, Kyrgyzstan, Tajikistan, Turkmenistan and Uzbekistan, have experienced different degrees of economic recession and have been actively exploring a path suitable for their own economic development for the last 30 years [2]. In 2013, China proposed the Belt and Road Initiative (BRI), which provides a historic opportunity for the development of the region [3]. BRI is the largest infrastructure investment in history, it is expected to boost the economic development of participating countries [4] and provide important funds for infrastructure construction [5]. In addition, Xinjiang, China, as the core area of the Silk Road Economic Belt, connects the northwestern provinces of China and the five countries in Central Asia, making it an important link in the BRI [6].
In the BRI, cities are the main carriers of transportation and logistics, social and economic development, and they are the most important natural complexes [7]. Understanding the urbanization characteristics of BRI and quantifying the urbanization process will provide scientific data to support the implementation of the BRI. At present, a large number of studies have used land use data [4] and nighttime light data [8] to analyze the urban expansion and morphological changes in Xinjiang and Central Asia. Several previous studies have also examined the water resources [9] and sustainable development of cities in this region [10]. According to the World Bank’s income classification [11], Xinjiang, China, Kazakhstan, and Turkmenistan are countries/regions with upper-middle-income and Uzbekistan, Kyrgyzstan, and Tajikistan are countries with lower-middle-income. Although they are located in the same arid climate zone, but their levels of urban development are uneven [12]. Nevertheless, as developing countries, the data for the cities in the five Central Asian countries are always insufficient [13], and the current quantitative research on the cities in Central Asia is still not sufficient [12, 14].
This study was designed to address the questions that follow. (1) As a part of the former Soviet Union, how have the cities in Central Asia developed in recent decades? (2) What are the differences in the urbanization characteristics among countries or regions? To address both of these questions, we took Xinjiang, China as a reference, and use the five Central Asian countries as our study area and used remote sensing data and demographic data from 2000 to 2020 to quantify the population changes of 168 cities in the study area. This comprehensive and systematic study provides scientific data in data limited region, and supports sustainable development of the cites in our study area [14].

2. Data and methods

2.1. Data

At present, several sets of land cover type datasets with spatial resolutions ranging from 10 m [15] to 500 m [16] are available for free use by the public worldwide. Since land use data with a 10 m resolution is usually only available for one period, it is not possible to monitor land use changes using these data. In contrast, the 500 m resolution land use data are too coarse to monitor urban details. In this study, we used the GlobeLand30 data with a 30 m resolution to extract the distribution of the built-up urban areas (BUAs). The GlobeLand30 dataset currently contains three periods of data for 2000, 2010, and 2020 with 10 land-cover types [17]. The GlobeLand30 data are mainly generated from 30-meter multispectral images. The dataset is available for free globally and can be downloaded from http://www.globallandcover.com/. The urban areas were extracted using the artificial surfaces classification (Code 80) in the GlobeLand30 dataset.
The vegetation index were extracted from the MOD13Q1 version 6 product (~250 m) [18]. The datasets were generated with 16 days temporal resolution with a 250 m spatial resolution, including two primary vegetation layers and quality layers. Due to the greater sensitivity of the Enhanced vegetation index (EVI) relative to the Normalized Difference Vegetation Index (NDVI) in the high-biomass regions [19], we used the EVI datasets to monitor the greenness changes in the urban BUA. These datasets are available from website (https://e4ftl01.cr.usgs.gov).
The population data used in this study were grided population data with a spatial resolution of 100 meters obtained from the WorldPop website [20]. The population data of WorldPop has been used in research investigation and policy making in countries worldwide (https://www.worldpop.org/). The 100 m resolution grided population datasets were downloaded separately for each country and were merged for further analysis.

2.2. Methods

2.2.1. Built-up area expansion

By using the Globeland30 datasets, the distributions of the urban built-up areas in study area in 2000, 2010, and 2020 were extracted. Since the 30-meter resolution was too fine to describe the urban boundaries, the urban built-up area data were resampled to a 300-meter resolution. Finally, the pixels with more than 50% of the urban BUA were identified as urban pixels. According to the urban pixels at a 300-meter resolution in 2020, the BUA pixels adjacent to each other were merged into a single patch. Finally, we detected 272 urban patches larger than 10 km2 in our study area.

2.2.2. Urban population growth

The total population of each urban patch was calculated using overlay analysis of the BUA and gridded population data with a 100-meter resolution from WorldPop[20]. According to the gridded 2020 population data, there were a total of 168 urban patches with populations of more than 10,000 and an urban built-up area greater than 10 km2 in our study area. In this study, we took these 168 cities and towns with relatively large populations and relatively large urban built-up areas as the research objects (hereinafter referred to as cities).
In general, the process of urbanization is inevitably accompanied by population growth and expansion of the BUA. If the urban population growth rate (Rpop) and the BUA expansion rate (Rbua) are coordinated, the urban population growth pressure during the urbanization will be relatively small. In this study, we calculated the ratio (RPB) of Rpop to Rbua for the 168 cities [21]:
R p o p = P 2020 P 2000 P 2020
R b u a = B 2020 B 2000 B 2020
R pb = R p o p R b u a
where P2020 and P2000 are the populations of the urban BUA in 2020 and 2000, respectively. B2020 and B2000 are the urban BUA in 2020 and 2000, respectively. If Rpb is greater than 1, the Rpop is higher than Rbua , and the population growth faster than the urban expansion since the advent of the new century.

2.2.3. Urban greening in built-up areas

Urban greening is an important part of a city [22, 23]. Specifically, in arid and semi-arid regions, urban greening plays a very important role in maintaining the sustainable development of cities [24, 25]. Here, we used the EVI from the MOD13Q1 dataset as the greenness indicator. Then, the maximum greenness of each urban BUA pixel was generated from maximum EVI value (Emax) in 23 phases. By using Emax, it was possible to avoid interference from the vegetation phenology and represent the best state of urban greening. Finally, the Mann–Kendall method [12, 26] was used to calculate the trend of Emax for each urban pixel from 2001 to 2020.
We have a hypothesis that if the Emax of an urban pixel increased significantly from 2001 to 2020 (P < 0.05), some green spaces [27], new parks, and/or green roof spaces [28] may have been constructed in that pixel, or, the street trees experienced growth. By taking the BUA in 2020 as the latest urban boundary and the BUA in 2000 as the old urban boundary, we calculated the ratios (REVI) of the greening of the BUAs in the old and new urban boundaries. The calculation formula is as follows [12]:
R E V I = B U A g r e e n _ y e a r B U A y e a r
For 2000, BUAgreen_2000 is the total area of the greening pixels in the old urban boundary; BUA2000 is the total BUA within the old urban boundary, and REVI is the ratio of the significantly greened BUAs in the old city. For 2020, BUAgreen_2020 is the total area of greening pixels in the new urban boundary; BUA2020 is the total BUA within the new urban boundary, and REVI is the ratio of the significantly greened BUAs in the new city.

3. Research results

3.1. Urban expansion

Five of the 168 cities experienced a BUA expansion of over 50 km2 from 2000 to 2020 during the study period (purple points in Figure 1a): Urumqi (134 km2), Nur-Sultan (82 km2), Almaty (55.4 km2), Atyrau (54.5 km2), and Yining (52.5 km2). According to the statistical results for the 168 cities, Kazakhstan (2,403 km2) and Uzbekistan (2,187 km2) had the large total BUA in 2020 (Figure 1b). The total BUA in Xinjiang, China was only 1,118 km2, which was less than half those of the above two countries. In addition, the total BUAs in Kyrgyzstan, Turkmenistan, and Tajikistan were 378 km2, 326 km2, and 252 km2, respectively. In Central Asia, Kazakhstan, which contained 37 cities, had a total BUA expansion of 609 km2 (Figure 1b). Followed by Xinjiang, China, with a total BUA expansion of its 29 cities reaching 578 km2. In Uzbekistan, there were 74 cities located along the Amu Darya and Syr Darya. However, the total BUA expansion area was only 372 km2 in Uzbekistan. In addition, the total BUA expansions in Turkmenistan, Kyrgyzstan, and Tajikistan were only 70 km2, 57 km2, and 36 km2, respectively (Figure 1b).
In 2020, the average urban BUA in the 37 cities in Kazakhstan was the largest (65 km2), followed by Kyrgyzstan (47 km2), Xinjiang, China (39 km2), Turkmenistan (33 km2), Uzbekistan (30 km2), and Tajikistan (25 km2) (Figure 1c). However, it was found that the BUA expansion rate of Xinjiang, China was the fastest in the region, reaching nearly 20 km2 per city, followed by Kazakhstan, with an average BUA expansion rate of 16.5 km2 per city. It should be noted that the average BUA expansions of the other four Central Asian countries did not exceed 10 km2 per city (Figure 1c). In particular, Uzbekistan had the largest number of cities in the region (74 cities), but only 6 of these cities had BUA expansions of > 10 km2.

3.2. Urban population change

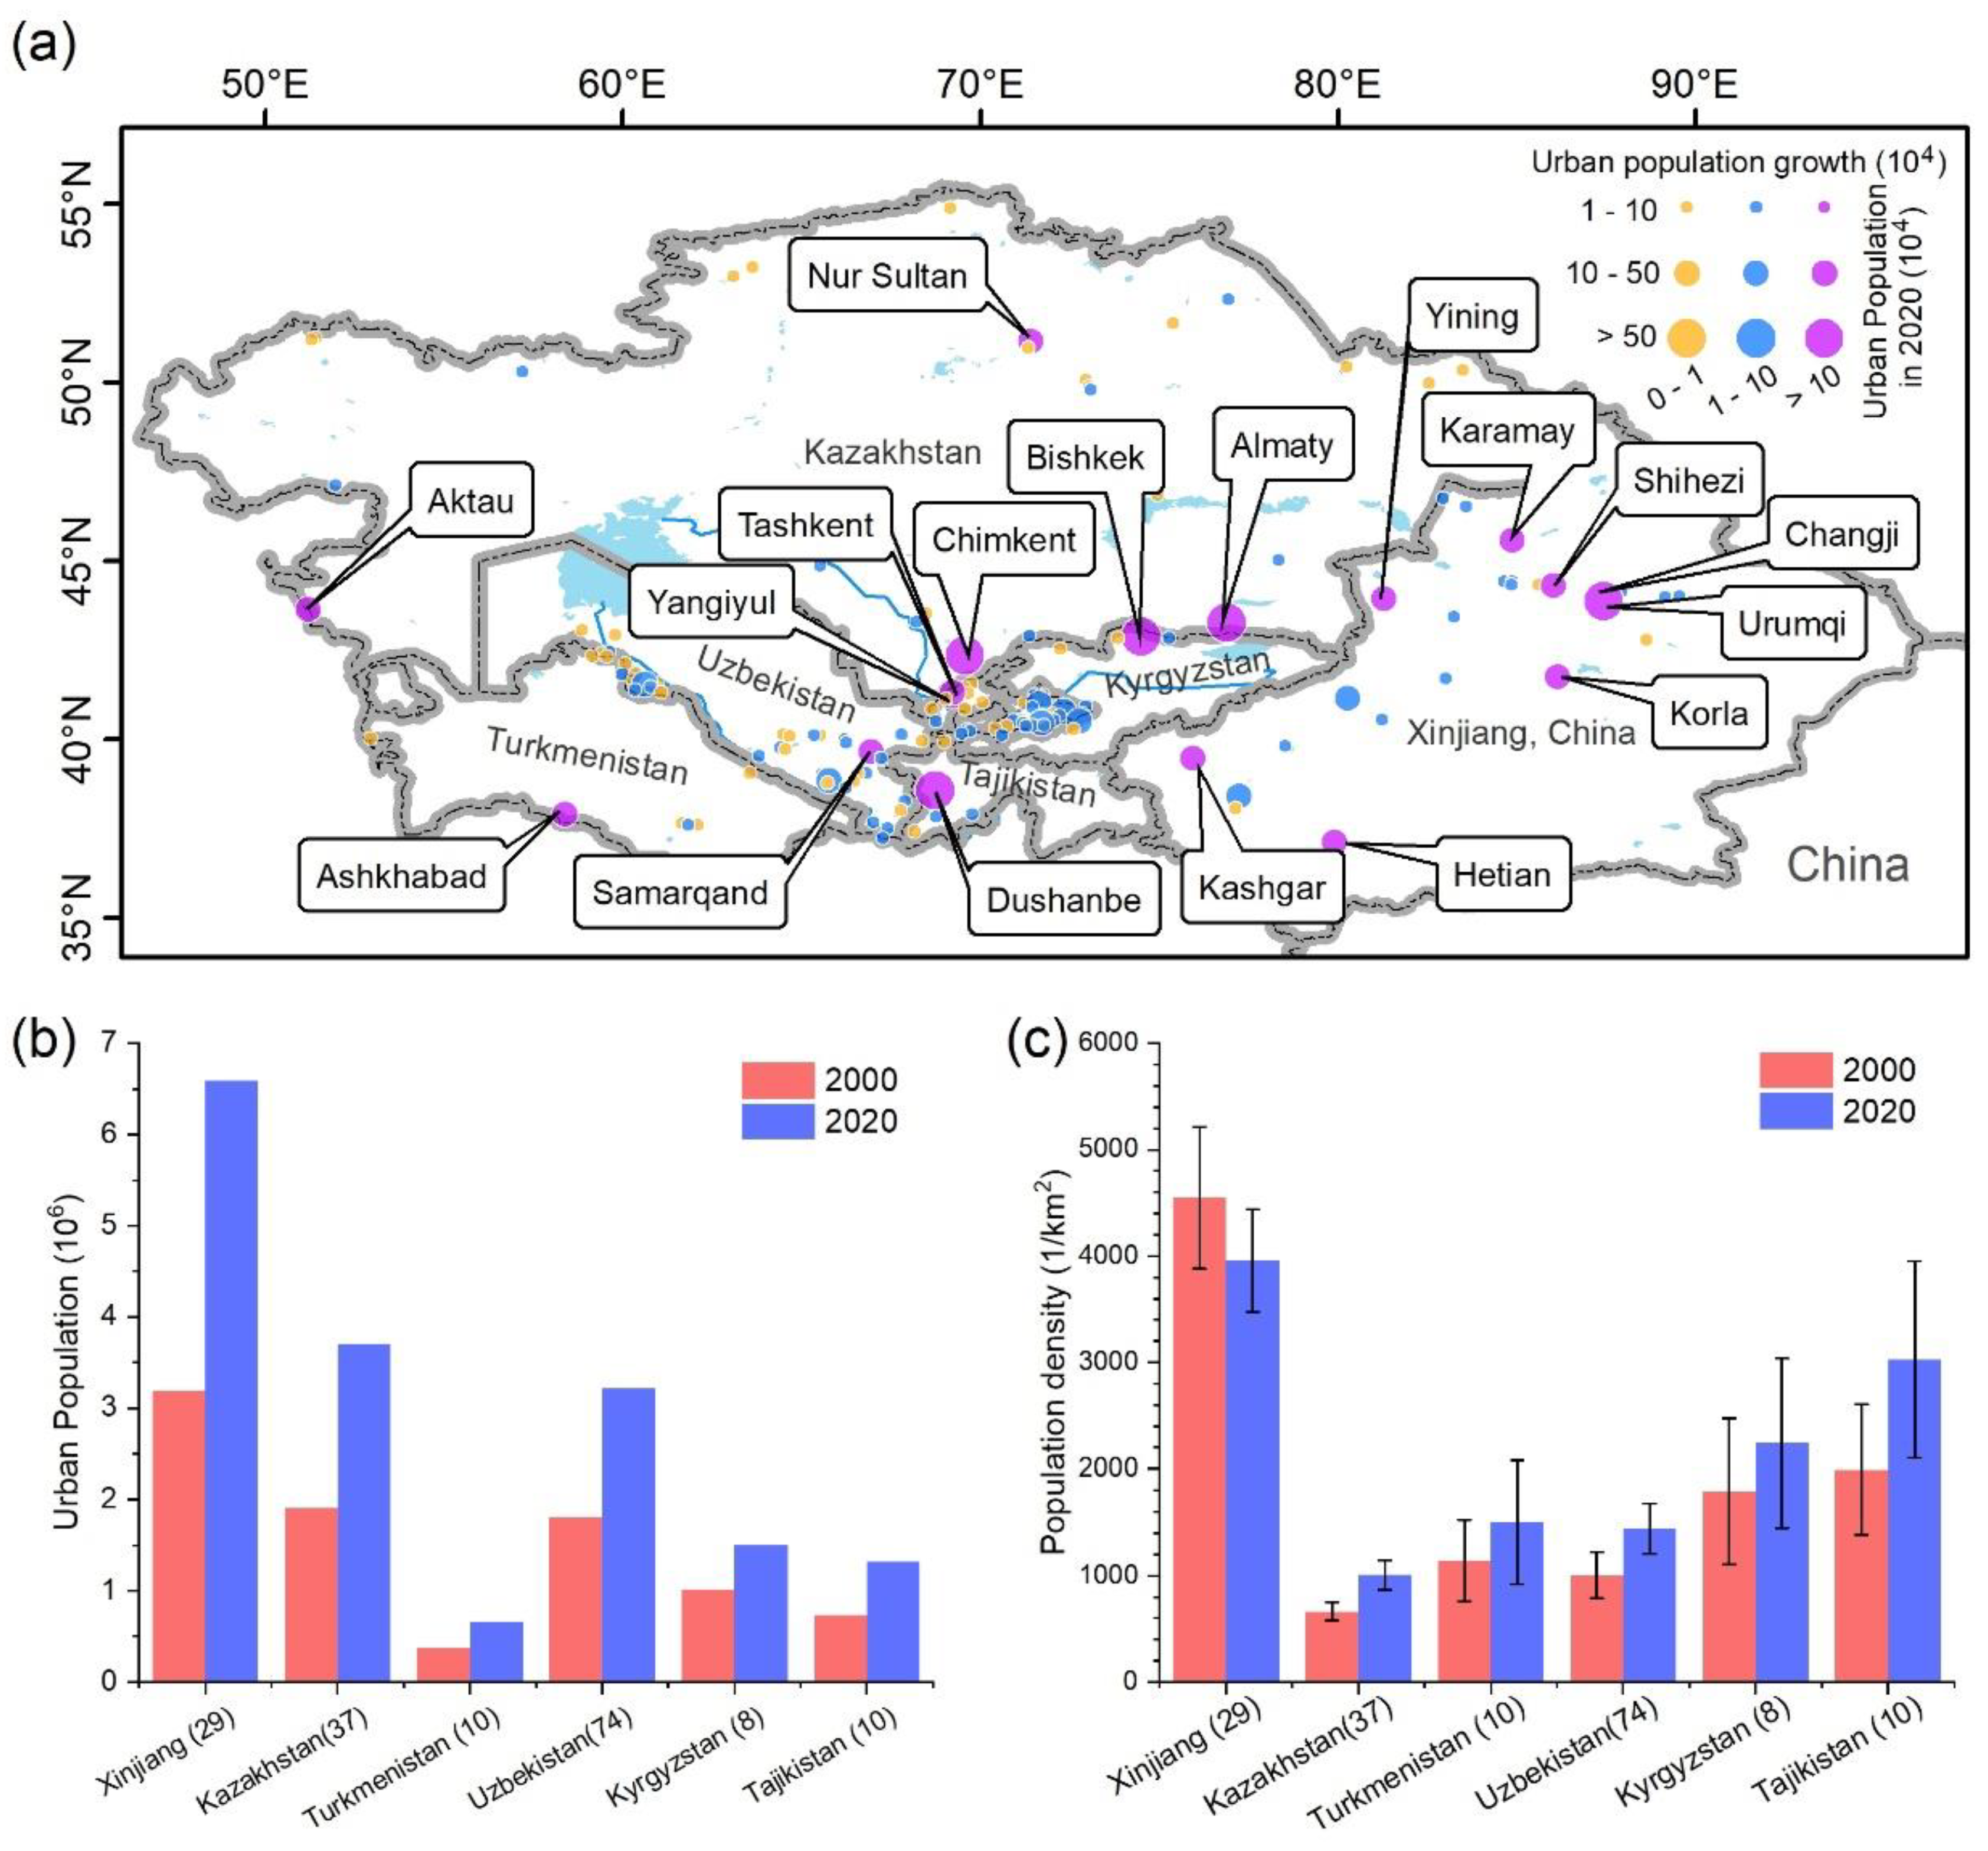
Using the grided population data from WorldPop [20], we calculated the population changes for each city in our study area from 2000 to 2020. In 2020, there were five cities in in our study area with populations of greater than 500,000 (Figure 2a): Urumqi (3.17 million), Almaty (1.35 million), Bishkek (1.07 million), Dushanbe (980,000), and Chimkent (580,000). From 2000 to 2020, the populations of all of the 168 cities increased. In particular, 18 cities experienced population growths of greater than 100,000 people (purple points labeled with names in Figure 2a). Table 1 shows the cities with population growths of > 100,000 people and their corresponding BUA expansions. From 2000 to 2020, the three cities with the largest urban population growths were Urumqi (1.654 million), the capital of Xinjiang, China; Almaty (1.348 million), the former capital of Kazakhstan; and Dushanbe (0.435 million), the capital of Tajikistan. Eight cities in Xinjiang, China experienced a population growth of > 100,000 people (Table 1), which was comparable to the population growths of the capitals and core cities of the five Central Asian countries. It should be noted that according to the official statistics, Tashkent, the capital of Uzbekistan, was a large city with a population of 2.13 million. However, according to the dataset from WorldPop, the population of Tashkent in 2020 was only 447,000 people, which is quite different from the official number.
Although Xinjiang, China only contained 29 cities in this study, the total urban population of Xinjiang increased from 3.19 million in 2000 to 6.59 million in 2020, which far exceeded those of the Central Asian countries. Among the five Central Asian countries, the total urban population of the 37 cities in Kazakhstan increased from 1.9 million in 2000 to 3.7 million in 2020. In Uzbekistan, the urban population of the 74 cities increased from 1.81 million to 3.22 million from 2000 to 2020. In contrast, the urban population increments of the other three countries did not exceed one million. In particular, Turkmenistan had the smallest urban population growth among the five Central Asian countries.
We also calculated the population densities of each city in 2000 and 2020. It was found that the average population density in Xinjiang, China decreased from 4,548/km2 to 3,957/km2 (Figure 2c). In contrast, the average urban population densities of the cities in Central Asian countries increased. In Tajikistan, the average urban population density increased from 1,996/km2 to 3,029/km2, which was the fastest among the countries in Central Asia. Based on the huge urban population increase in Xinjiang, China (Figure 2b) and the considerable BUA expansion (Figure 1c), it can be concluded that the decrease in the urban population density in Xinjiang was mainly due to the rapid urban expansion. This result indicates that even though the urban population in Xinjiang, China has grown rapidly in the past 20 years, the urban population pressure per unit area has decreased, which has created conditions favorable to improving the living environment. These results are basically consistent with the results of previous studies [12, 29].
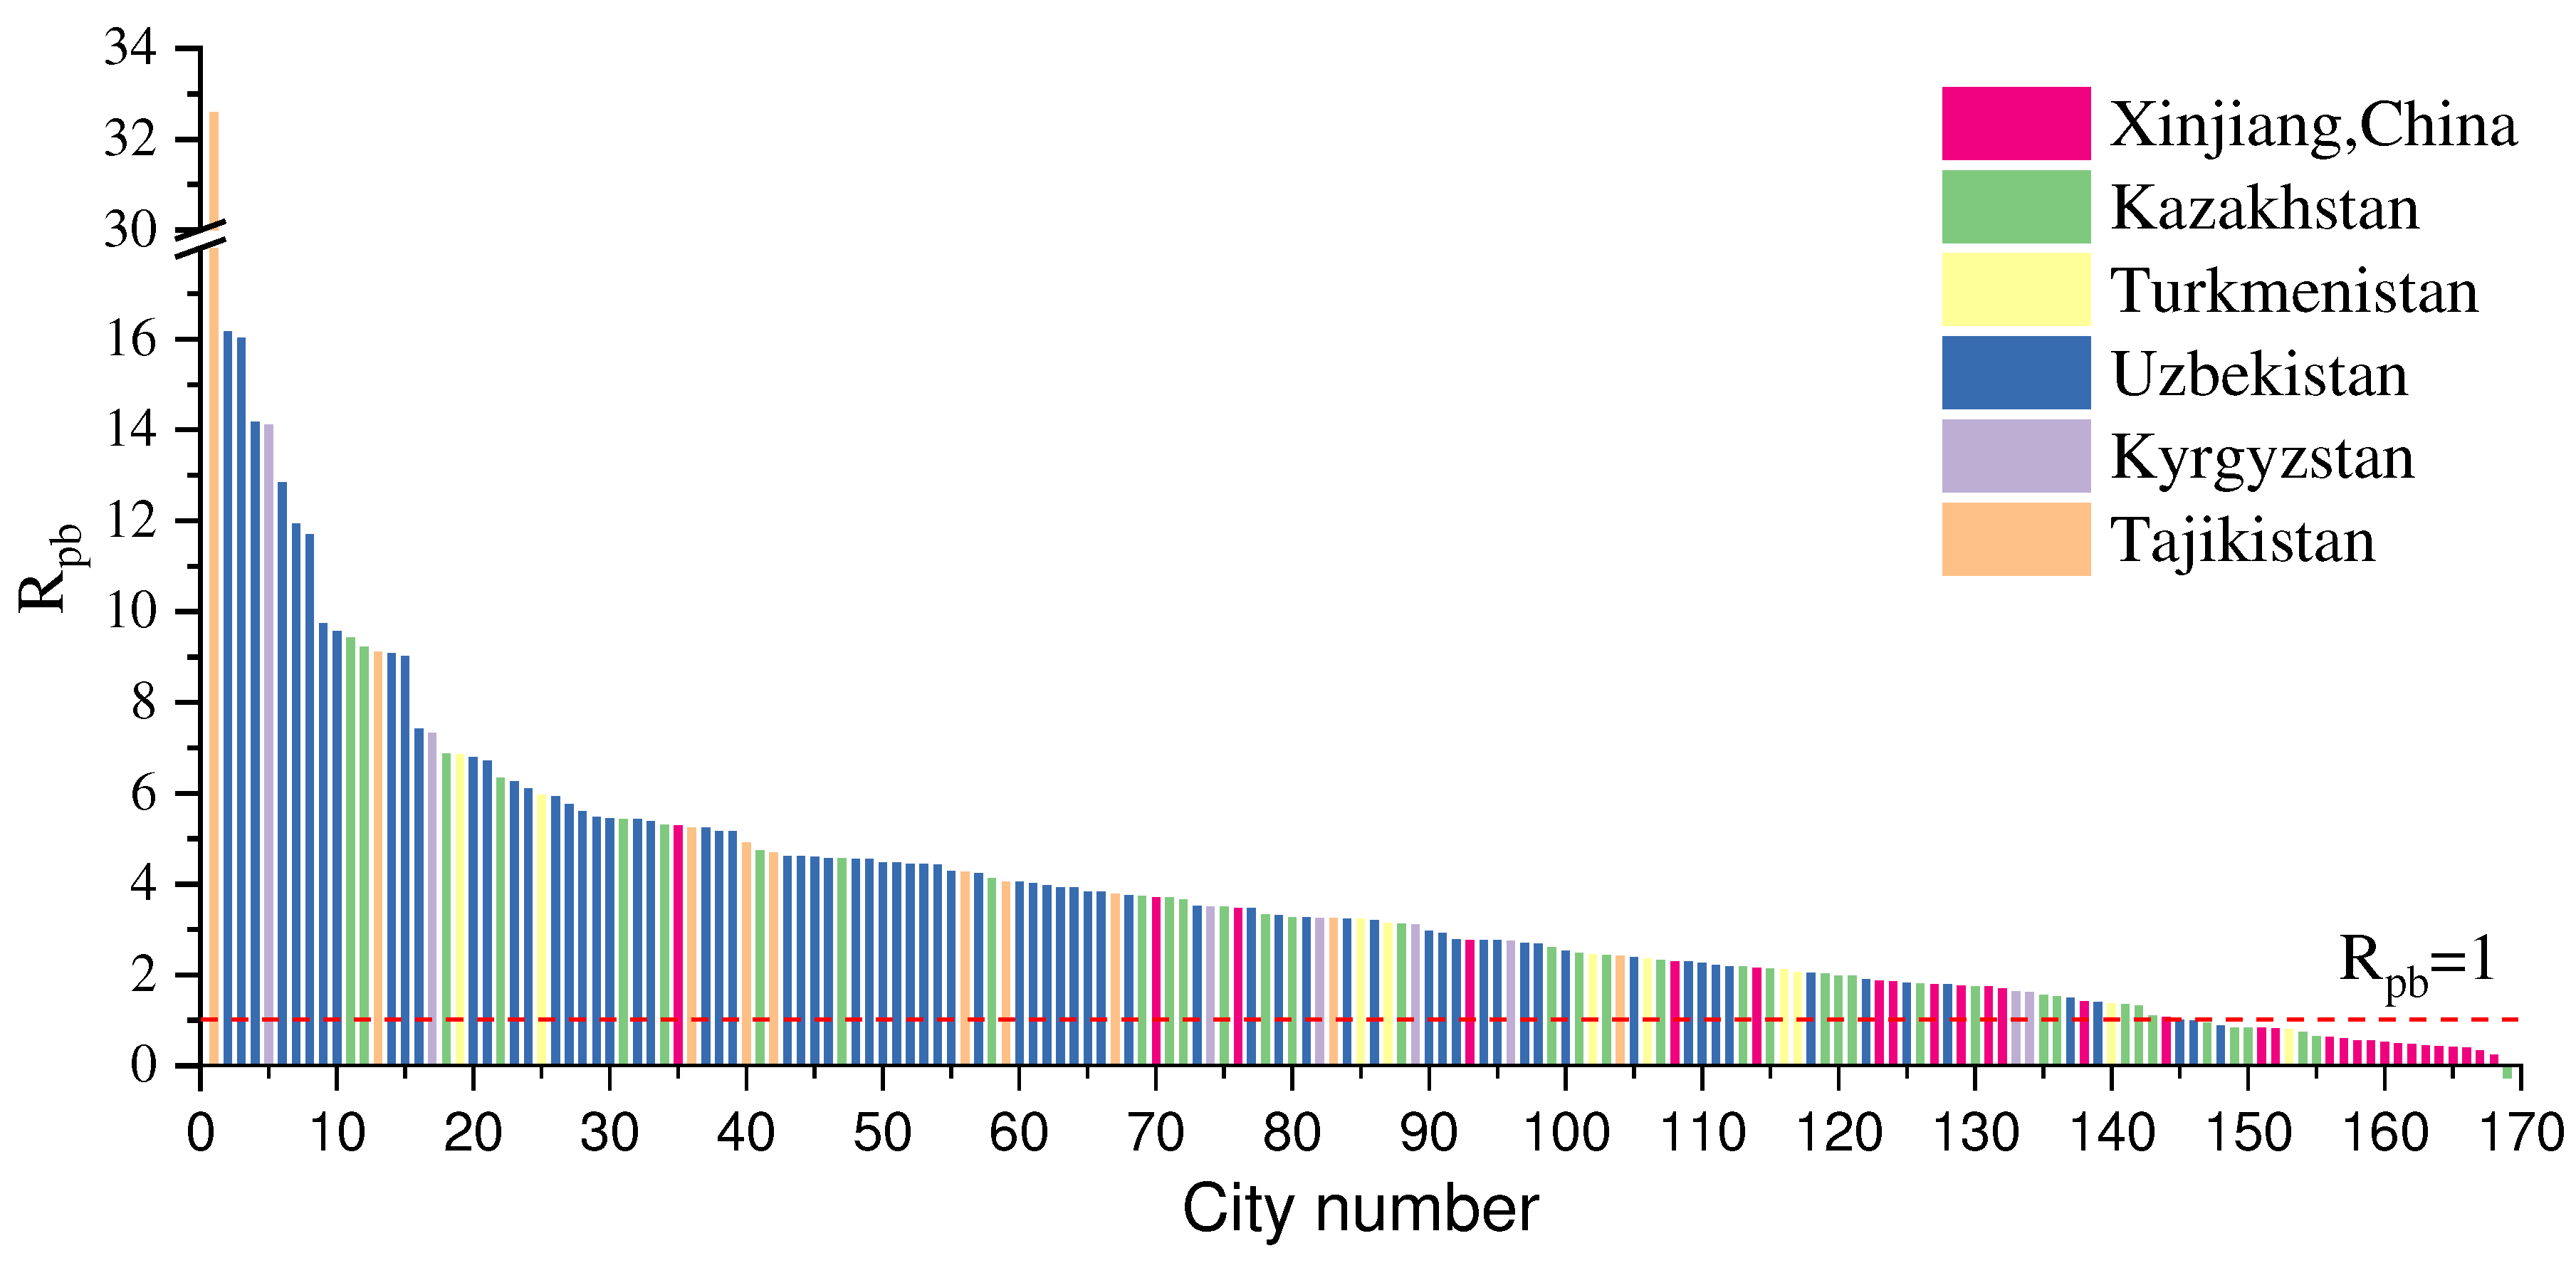
Urban population growth is a key driving force in urbanization. In the study area, the 168 cities were ranked based on the ratio (Rpb) of the urban population growth rate to the BUA expansion rate. The results for the countries are illustrated as different colors in Figure 3. Overall, it was found that the Rpb values of 145 cities (86%) were greater than 1. This means that the urban expansion in these cities lagged behind the population growth from 2000 to 2020. In particular, the Rpb values of 72 cities in Uzbekistan were > 1, accounting for 97% (72 out of 74) of the cities analyzed in this country. In contrast, in Xinjiang, China, the Rpb values of 23 cities were < 1, indicating that the BUA expansion of the majority of the cities in Xinjiang met the needs of the urban population growth.

3.3. Urban greening changes

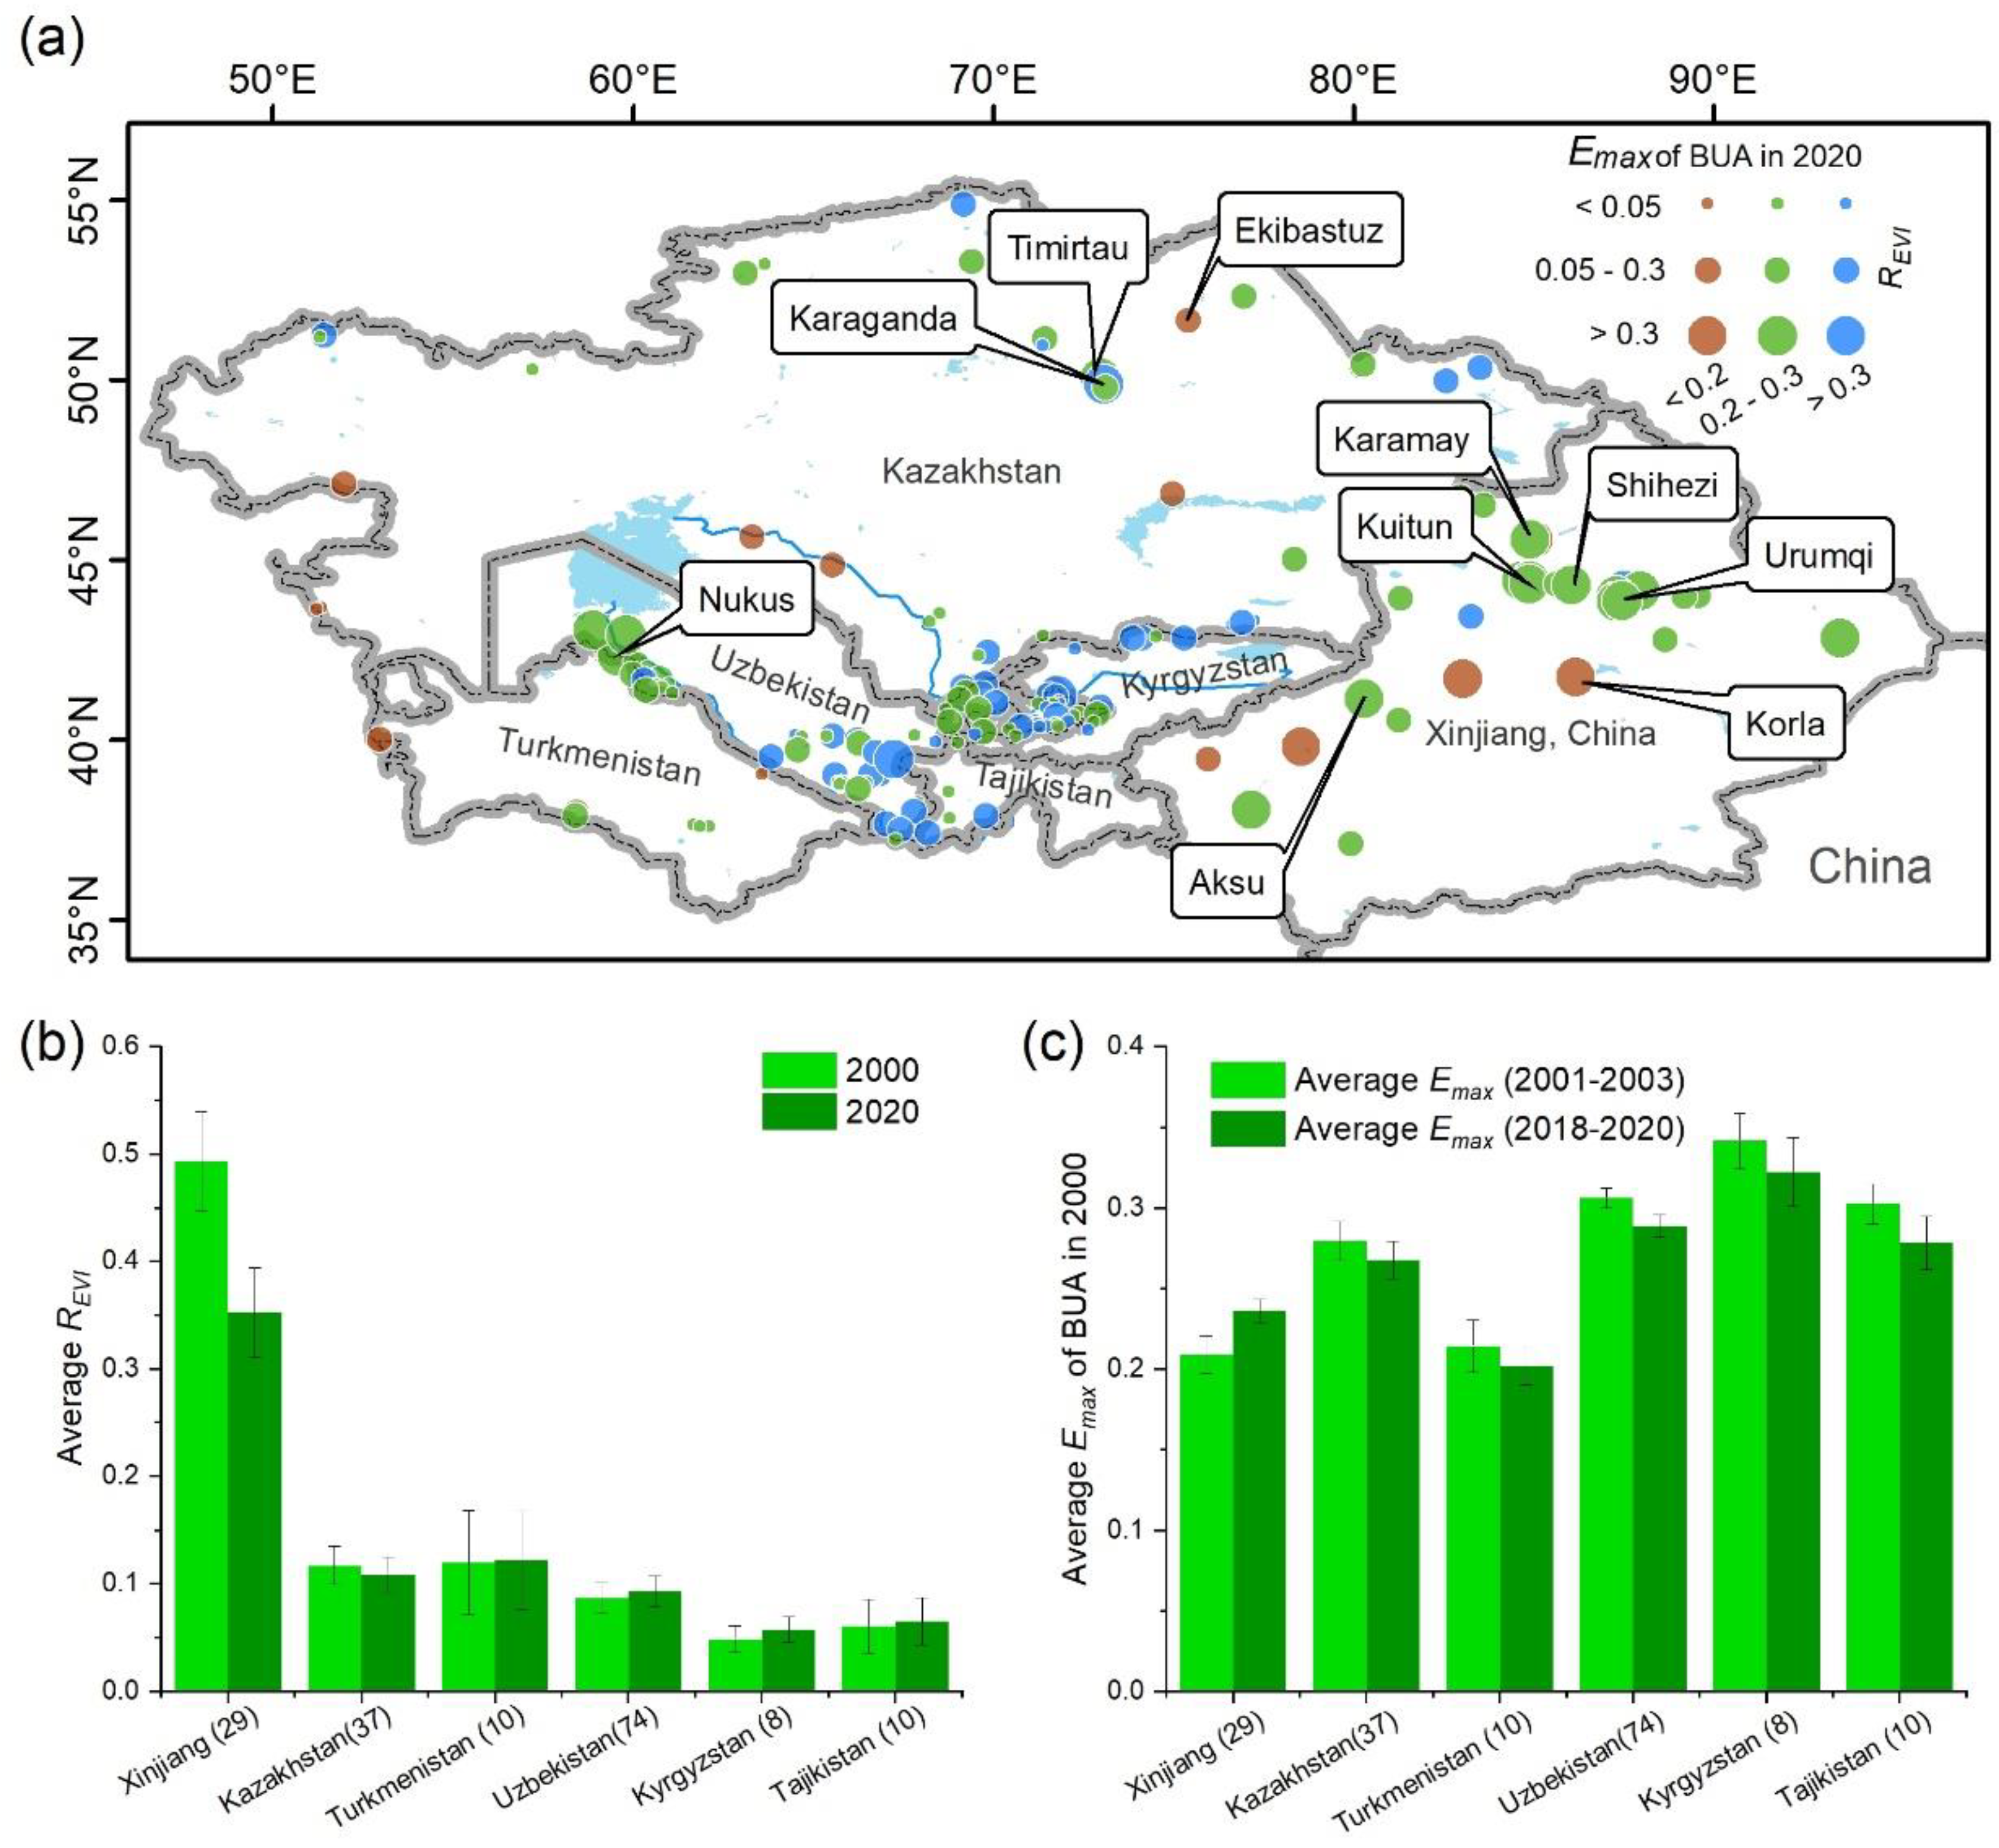
Among the 168 cities, 25 cities contained more than 30% of the urban pixels in the new urban boundaries, indicating significant greening (i.e., REVI > 0.3). Among the 168 cities, we screened 10 cities with BUA values of greater than 40 km2 (hereinafter referred to as large cities) in 2020 and ranked them by their REVI values (Table 2). The top six cities, i.e., Karamay (0.75), Korla (0.55), Aksu (0.51), Urumqi (0.5), Kuitun (0.44), and Shihezi (0.31), were all located in Xinjiang, China. This means that in Karmay, the urban greening increased significantly within 93% of the old urban boundary and 75% within the new urban boundary. In addition, the REVI values of Temirtau, Karaganda, and Ekibastuz in Kazakhstan and Nukus in Uzbekistan were greater than 0.2. It should be noted that Karmay, Temirtau, and Ekibastuz are important oil and mining industrial cities in China and Kazakhstan. It is a proud achievement that they have improved their urban environment while developing their economies.
The urban boundaries in 2020 and 2000 were taken as the new urban boundaries and old urban boundaries, respectively. Then, we compared the average REVI values within the new and old urban boundaries of the cities in our study area (Figure 4b). The results show that within both the new or old boundaries, the average REVI values of the cities in Xinjiang were significantly higher than those in the cities in the five Central Asian countries. In particular, within the new urban boundaries, the average REVI value of the cities in Xinjiang, China was remarkable larger than that of the other five Central Asian countries (Figure 4b), reaching an average of 0.35±0.04, followed by Turkmenistan (0.12±0.04) and Kazakhstan (0.11±0.016). This means that in the past 20 years, the investment in the green infrastructure in these cities was remarkable, and the improvements of the urban ecological environment were also significant.
It should be noted that in Xinjiang, China, the average REVI value within the new urban boundaries was significantly lower than that in the old urban boundaries (Figure 4b). In contrast, the average REVI values within the new and old urban boundaries in the five Central Asian countries did not change significantly. Except for Kazakhstan, the REVI values within the new boundaries of the cities in the other four Central Asian countries were only slightly higher than those within the old boundaries of these cities. The main reason for this is that the average urban expansion in Xinjiang and Kazakhstan in the past 20 years was higher than in the other four countries. Under normal circumstances, the newly expanded urban areas were created by conversion of the surrounding farmland, grassland, and/or forests, resulting in less plant coverage in the new BUA expansion areas. Therefore, in the cities with rapid BUA expansion, the REVI values within the new urban boundaries tended to be lower than those within the old urban boundaries.
Although the above analysis shows that the urban ecological environment in Xinjiang, China has improved significantly in the past 20 years, this progress does not mean that the overall ecological environment in the cities in Xinjiang has surpassed those of the cities in the other Central Asian countries. By comparing the average Emax values in the first three years (2001–2003) and the last three years (2018–2020), it was found that the average Emax value of the last three years in the old urban boundaries in Xinjiang was still lower than those in the Central Asian countries, except for Turkmenistan (Figure 4c). It should be noted that Xinjiang, China was the only region that experienced significant greening of the BUAs in the old urban boundaries in the past 20 years, while the 3-year average Emax values within the old urban boundaries of the other Central Asian countries decreased. (Figure 4c). This may be due to two reasons. First, the urban green infrastructure in Xinjiang, China increased. Second, the type of urban expansion was predominantly infilling expansion in the Central Asian countries [30].
Figure 4. Distribution of cities with greening urban area. (a) Spatial distribution of the 168 cities with BUAs in different levels of greening (REVI). The top 10 cities with greened BUAs are marked with city names. (b) The bars are the average REVI values of the cities in 2000 and 2020. (c) The bars are the 3-year average Emax values of the BUAs in 2000 in two periods (2001–2003 and 2018–2020). In (c), the error bars denote the standard error of the mean (SEM) for Xinjiang and countries in Central Asia.
Preprints 86439 g004

3.4. People living in greening BUAs

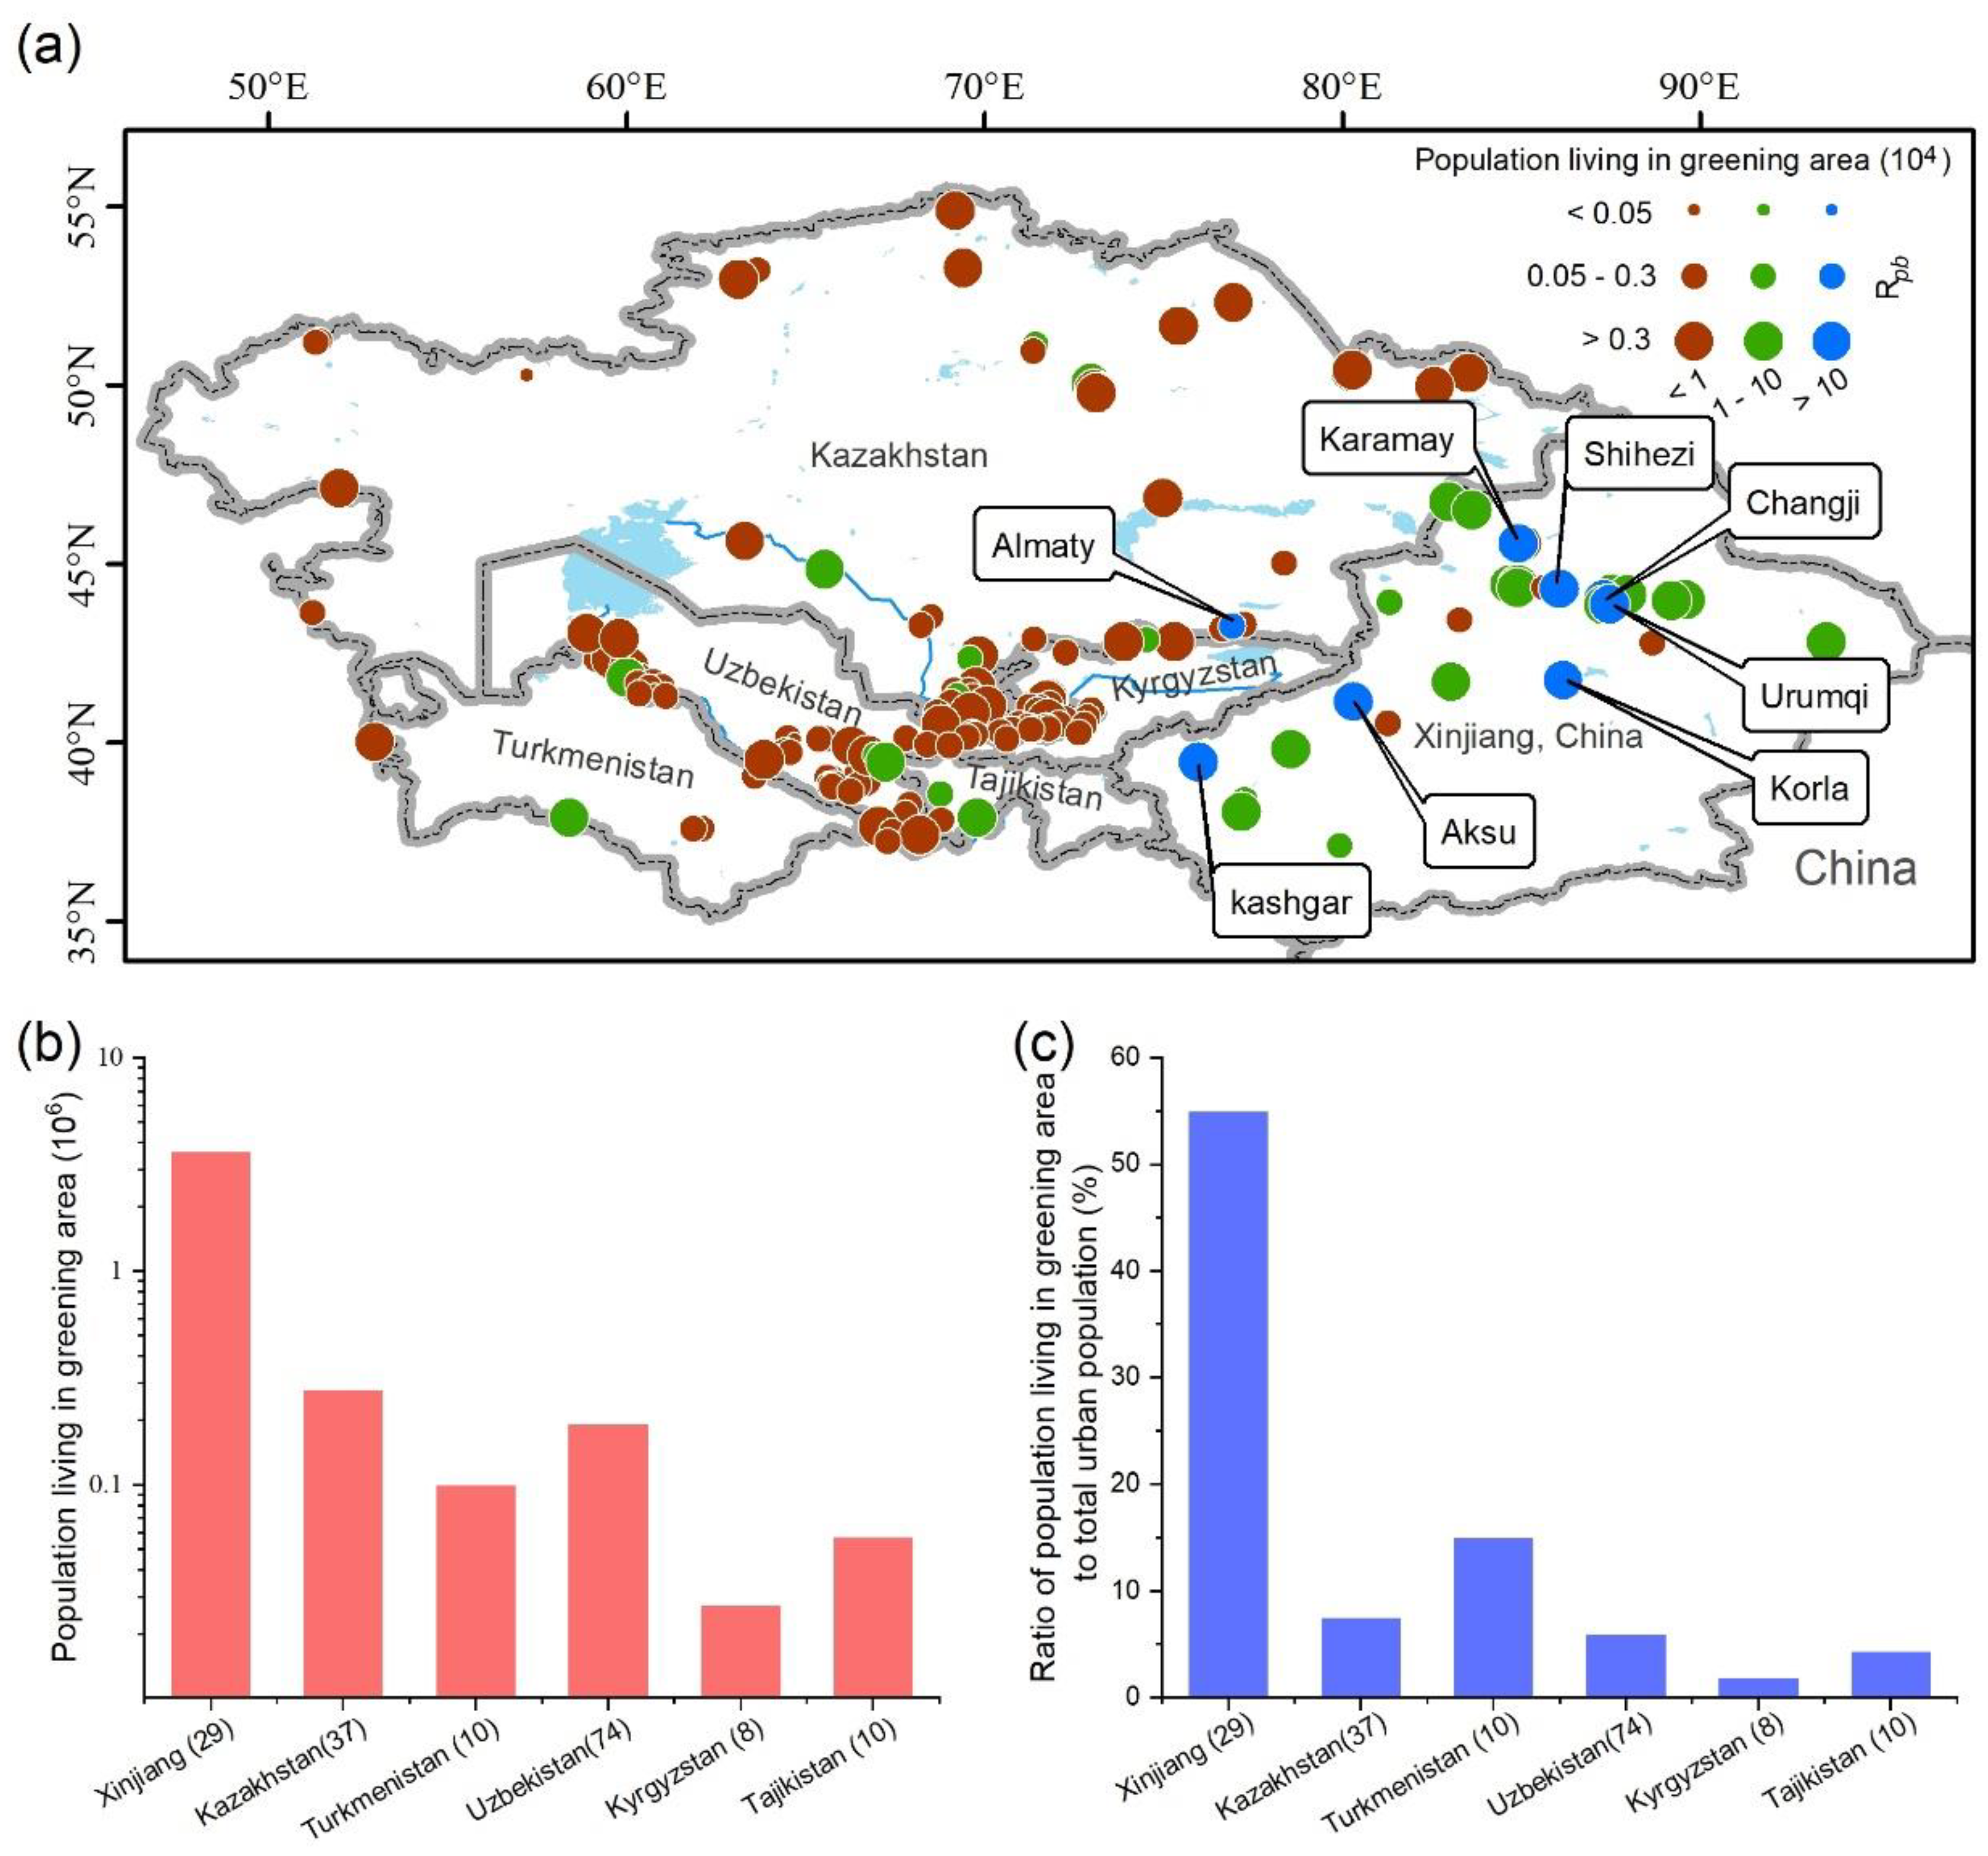
The increase in urban parks and green spaces can regulate rainwater [31] and alleviate the urban heat island effect [32, 33], and several studies have reported that urban greening is beneficial to human health, including improving mental health [34] and cardiovascular conditions [35], and reduces violence and crime [36]. Therefore, in this study, it was assumed that the residents living in significant greening BUA were likely to benefit from the improvement in the surrounding urban environment. We overlapped the greening BUAs of the 168 cities with the grided population data for 2020 and calculated the population that directly benefited from the greening of the BUAs in each city. As is shown in Figure 5a, among the 168 cities, in 39 cities (green and blue points), more than 10,000 people directly benefited from the greening of the BUAs. These cities were mainly (24 cities) distributed in Xinjiang, China and were sparsely (15 cities) distributed in the five Central Asian countries. Of the eight cities in which a population of more than 100,000 directly benefited (blue points), seven were in Xinjiang, China. Among the Central Asian countries, only Almaty had a population of more than 100,000 that benefited from the greening of the BUAs.
There were 3.63 million urban residents living in greening BUAs in Xinjiang, China. In Kazakhstan, Uzbekistan, and Turkmenistan, the populations living in greening BUAs reached 280,000, 190,000, and 100,000, respectively. In Tajikistan and Kyrgyzstan, the populations living in greening BUAs were less than 100,000. The beneficiaries in Xinjiang accounted for 85% of the total beneficiaries in the 168 cities. In particular, more than half (55%) of the urban population in Xinjiang was directly benefited from the significant increase in urban greenness (Figure 5c). In contrast, among the five Central Asian countries, nearly 15% of the urban population in Turkmenistan benefited from the significant increase in urban greenness, while less than 10% of the urban population in the four Central Asian countries benefited from a significant increase in the level of urban greening.
Among the 168 cities, we screened the top 20 cities with the largest beneficiaries (Table 3). It was found that 17 of these cities were in the Xinjiang, China. Urumqi, Korla, Changji, and Aksu were the top four cities with the largest populations living in greening BUAs, accounting for 2.08 million, 204,000, 195,000, and 167,000 people, respectively. In these four cities, the urban greenness of more than 50% of the urban BUAs significantly increased. Compared with Xinjiang, China, the cities in the five Central Asian countries had smaller BUA greening rates (Figure 4b) and lower urban population densities (Figure 2c). According to Table 3, there were only three cities in the Central Asian countries: Almaty, Ashgabat, and Dushanbe. However, the average 3-year Emax in 2018–2020 in Almaty was as high as 0.34, which is the highest among the 20 cities. Similarly, Ashgabat and Dushanbe had average Emax of 0.21 and 0.28 in 2018–2020, respectively. In general, the overall ecological environments of these cities were relatively good.

4. Discussion and conclusions

In the BRI, Xinjiang and the five Central Asian countries play an important role as a link and the main carrying areas, respectively. However, the current quantitative research on the urban development in this region is insufficient. It is necessary to quantify and compare the urbanization processes of cities in our study area. In this study, high spatial resolution land cover type data, remote sensing vegetation index data, and grided population data were used to analyze the characteristics of the urban expansion, the population changes, and the urban environmental changes in Xinjiang and the five Central Asian countries from 2000 to 2020. In this section, we discuss the four urbanization features analyzed in this study.
(1) From 2000 to 2020, the urbanization in study area was extremely uneven. Xinjiang and Kazakhstan experienced the most rapid urbanization expansion in the study area, and Urumqi and Nur-Sultan were the two cities with the fastest BUA expansion rates (Figure 1). Although Xinjiang, China has experienced rapid urban expansion in the past 20 years, its average urban BUA was still at a moderate level in 2020.
(2) From 2000 to 2020, the urban population in Xinjiang increased by 3.4 million (56%), making it the most rapid growing population in the study area. Among the Central Asian countries, Kazakhstan and Uzbekistan had the largest urban population increases, i.e., over 1 million. The average urban population densities of all of the Central Asian countries increased. In addition, in Xinjiang, the urban population density decreased from 2000 to 2020 while maintaining rapid urban population growth (Figure 2). Thus, the pressure of the urban population growth in Xinjiang, China was still smaller than other countries (Figure 3).
(3) In our study area, the proportion of greening BUAs was the highest in Xinjiang, China. On average, the level of greenness significantly increased in more than 35% of the urban BUAs in Xinjiang, which was much higher than in the other countries (Figure 4). Although the urban ecological environment in Xinjiang has improved significantly in the past 20 years, the overall average maximum greenness (Emax) of the city is still lower than those of most Central Asian countries (Figure 4c). In Xinjiang, China, 3.63 million (55%) urban residents directly benefited from the increase in the urban greenness, which was much higher than in the other countries (Figure 5).
The above conclusions are based on a quantitative and comparative study of the urbanization in 168 cities in Xinjiang, China and the five Central Asian countries, which were data limited region. Our study may be a comprehensive study of Central Asian cities to date. However, in this study, there were still some limitations regarding the existing data and methods.
First, in this study, the urbanization was quantified using WorldPop 100 m high-resolution population data, which in most cases reflects the true population distribution. However, for some specific cities, the dataset needs to be used with extra caution. For example, in Tashkent, the capital of Uzbekistan, according to the WorldPop data, the urban population was less than 450,000 in 2020. However, many data sources indicate that the urban population of this city exceeded 2 million[2].
In addition, we used the Rpb value, that is, the ratio of the population growth rate to the urban expansion rate, to measure the population pressure during urbanization [37]. However, there is an obvious disadvantage to using the Rpb value. If the urban expansion is small and the urban population increase is not obvious, the Rpb value will increase abnormally. In future, a more reasonable index to represent the population pressure during urbanization need to be developed.
The BRI is hailed as the largest infrastructure investment in history, and it will result in huge historical opportunities for economic development and infrastructure construction in Central Asia. Future research should use satellite data to analyze and study the cities in Central Asia and other countries from multiple perspectives, which would provide reliable and scientific data for the BRI, thereby promoting the sustainable development and common prosperity of Central Asian cities.

References

  1. Mackinder, H.J. The geographical pivot of history. 1904. Royal Geographical Society.
  2. Baskaran, A., UNESCO science report: Towards 2030. Institutions and Economies, 2017: p. 125-127.
  3. Song, C., et al., Undertaking research on belt and road initiative from the geo-relation perspective. Geographical Research, 2018. 1: p. 3-19.
  4. Williams, J., C. Robinson, and S. Bouzarovski, China’s Belt and Road Initiative and the emerging geographies of global urbanisation. The Geographical Journal, 2020. 186(1): p. 128-140. [CrossRef]
  5. Liu, W., Scientific understanding of the Belt and Road Initiative of China and related research themes. Progress in Geography, 2015. 34(5): p. 538-544.
  6. Chen, M., et al., The impact of the Belt and Road Initiative on the pattern of the development of urbanization in China. Mountain Research, 2016. 34(5): p. 637-44.
  7. Liu, H., W. Yeerken, and C. Wang, Impacts of the Belt and Road Initiative on the spatial pattern of territory development in China. Progress in Geography, 2015. 34(5): p. 545-553.
  8. Jiang, W., et al., Application potentiality and prospects of nighttime light remote sensing in “the Belt and Road” initiative. J. Univ. Chin. Acad. Sci, 2017. 3: p. 296-303.
  9. Jia, L., et al., Monitoring water resources and water use from earth observation in the belt and road countries. Bulletin of Chinese Academy of Sciences, 2017. 32(Z1): p. 62-73.
  10. Yin, W., Integrating Sustainable Development Goals into the Belt and Road Initiative: Would It Be a New Model for Green and Sustainable Investment? Sustainability, 2019. 11(24): p. 6991. [CrossRef]
  11. World Bank. (2021). Global Economic Prospects. Washington, DC: World Bank.
  12. Sun, L., et al., Dramatic uneven urbanization of large cities throughout the world in recent decades. Nature Communications, 2020. 11(1): p. 5366. [CrossRef]
  13. Liu, H., et al., Spatio-temporal evolution of population and urbanization in the countries along the Belt and Road 1950–2050. Journal of Geographical Sciences, 2018. 28(7): p. 919-936. [CrossRef]
  14. Bird, J., M. Lebrand, and A.J. Venables, The Belt and Road Initiative: Reshaping economic geography in Central Asia? Journal of Development Economics, 2020. 144: p. 102441.
  15. Gong, P., et al., Annual maps of global artificial impervious area (GAIA) between 1985 and 2018. Remote Sensing of Environment, 2020. 236: p. 111510. [CrossRef]
  16. NASA LP DAAC, MOD12Q1. V006. NASA EOSDIS Land Processes DAAC, USGS Earth Resources Observation and Science (EROS) Center, Sioux Falls, South Dakota (https://lpdaac.usgs.gov), accessed June 19, 2018. [CrossRef]
  17. Jun, C., Y. Ban, and S. Li, Open access to Earth land-cover map. Nature, 2014. 514(7523): p. 434-434. [CrossRef]
  18. Didan, K., MOD13Q1 MODIS/Terra Vegetation Indices 16-Day L3 Global 250m SIN Grid V006 [Data set]. NASA EOSDIS Land Processes DAAC. Accessed 2021-12-20 from . [CrossRef]
  19. Alexandridis, T.K., G. Ovakoglou, and J.G. Clevers, Relationship between MODIS EVI and LAI across time and space. Geocarto International, 2020. 35(13): p. 1385-1399. [CrossRef]
  20. Tatem, A.J., WorldPop, open data for spatial demography. Scientific data, 2017. 4(1): p. 1-4. [CrossRef]
  21. Seto, K.C., R. Sánchez-Rodríguez, and M. Fragkias, The New Geography of Contemporary Urbanization and the Environment. Annual Review of Environment and Resources, 2010. 35(1): p. 167-194. [CrossRef]
  22. Manoli, G., et al., Magnitude of urban heat islands largely explained by climate and population. Nature, 2019. 573(7772): p. 55-60. [CrossRef]
  23. Vearey, J., et al., Urban health in Africa: a critical global public health priority. BMC Public Health, 2019. 19: p. NA. [CrossRef]
  24. Li, D., et al., Urban heat island: Aerodynamics or imperviousness? Science Advances, 2019. 5(4): p. eaau4299.
  25. Turner-Skoff, J.B. and N. Cavender, The benefits of trees for livable and sustainable communities. PLANTS, PEOPLE, PLANET, 2019. 1(4): p. 323-335. [CrossRef]
  26. Garrett, H.E. and R.S. Woodworth, Statistics in Psychology and Education, David McKay, New York, 1971. 1971.
  27. Liu, B., et al., Evaluating the disparity between supply and demand of park green space using a multi-dimensional spatial equity evaluation framework. Cities, 2022. 121: p. 103484. [CrossRef]
  28. Hong, W., R. Guo, and H. Tang, Potential assessment and implementation strategy for roof greening in highly urbanized areas: A case study in Shenzhen, China. Cities, 2019. 95: p. 102468. [CrossRef]
  29. WANG, C., et al., Quantitative analysis of the dynamic relationship between urbanization and ecological environment in Urumqi, Xinjiang. Arid Land Geography, 2014. 37(3): p. 609-619.
  30. Qian, G. and A. Kasimu, Research on the Urban Expansion of Xinjiang in China, Central Asia and West Asia along the Belt and Road. ECONOMIC GEOGRAPHY, 2017. 37(5): p. 51-57.
  31. Tellman, B., et al., Satellite imaging reveals increased proportion of population exposed to floods. Nature, 2021. 596(7870): p. 80-86. [CrossRef]
  32. Zhou, D., et al., Remote sensing of the urban heat island effect in a highly populated urban agglomeration area in East China. Sci Total Environ, 2018. 628-629: p. 415-429. [CrossRef]
  33. Zhou, D., L. Zhang, and R. Wang, Administrative-Hierarchical Urban Land Expansion in China: Urban Agglomeration in the Yangtze River Delta. Journal of Urban Planning and Development, 2018. 144(4): p. 05018018. [CrossRef]
  34. Engemann, K., et al., Residential green space in childhood is associated with lower risk of psychiatric disorders from adolescence into adulthood. Proceedings of the National Academy of Sciences, 2019. 116(11): p. 5188-5193. [CrossRef]
  35. Seo, S., et al., Association between urban green space and the risk of cardiovascular disease: A longitudinal study in seven Korean metropolitan areas. Environment International, 2019. 125: p. 51-57. [CrossRef]
  36. Shepley, M., et al., The Impact of Green Space on Violent Crime in Urban Environments: An Evidence Synthesis. International Journal of Environmental Research and Public Health, 2019. 16(24): p. 5119. [CrossRef]
  37. Seto, K.C. and M. Fragkias, Quantifying Spatiotemporal Patterns of Urban Land-use Change in Four Cities of China with Time Series Landscape Metrics. Landscape Ecology, 2005. 20(7): p. 871-888. [CrossRef]
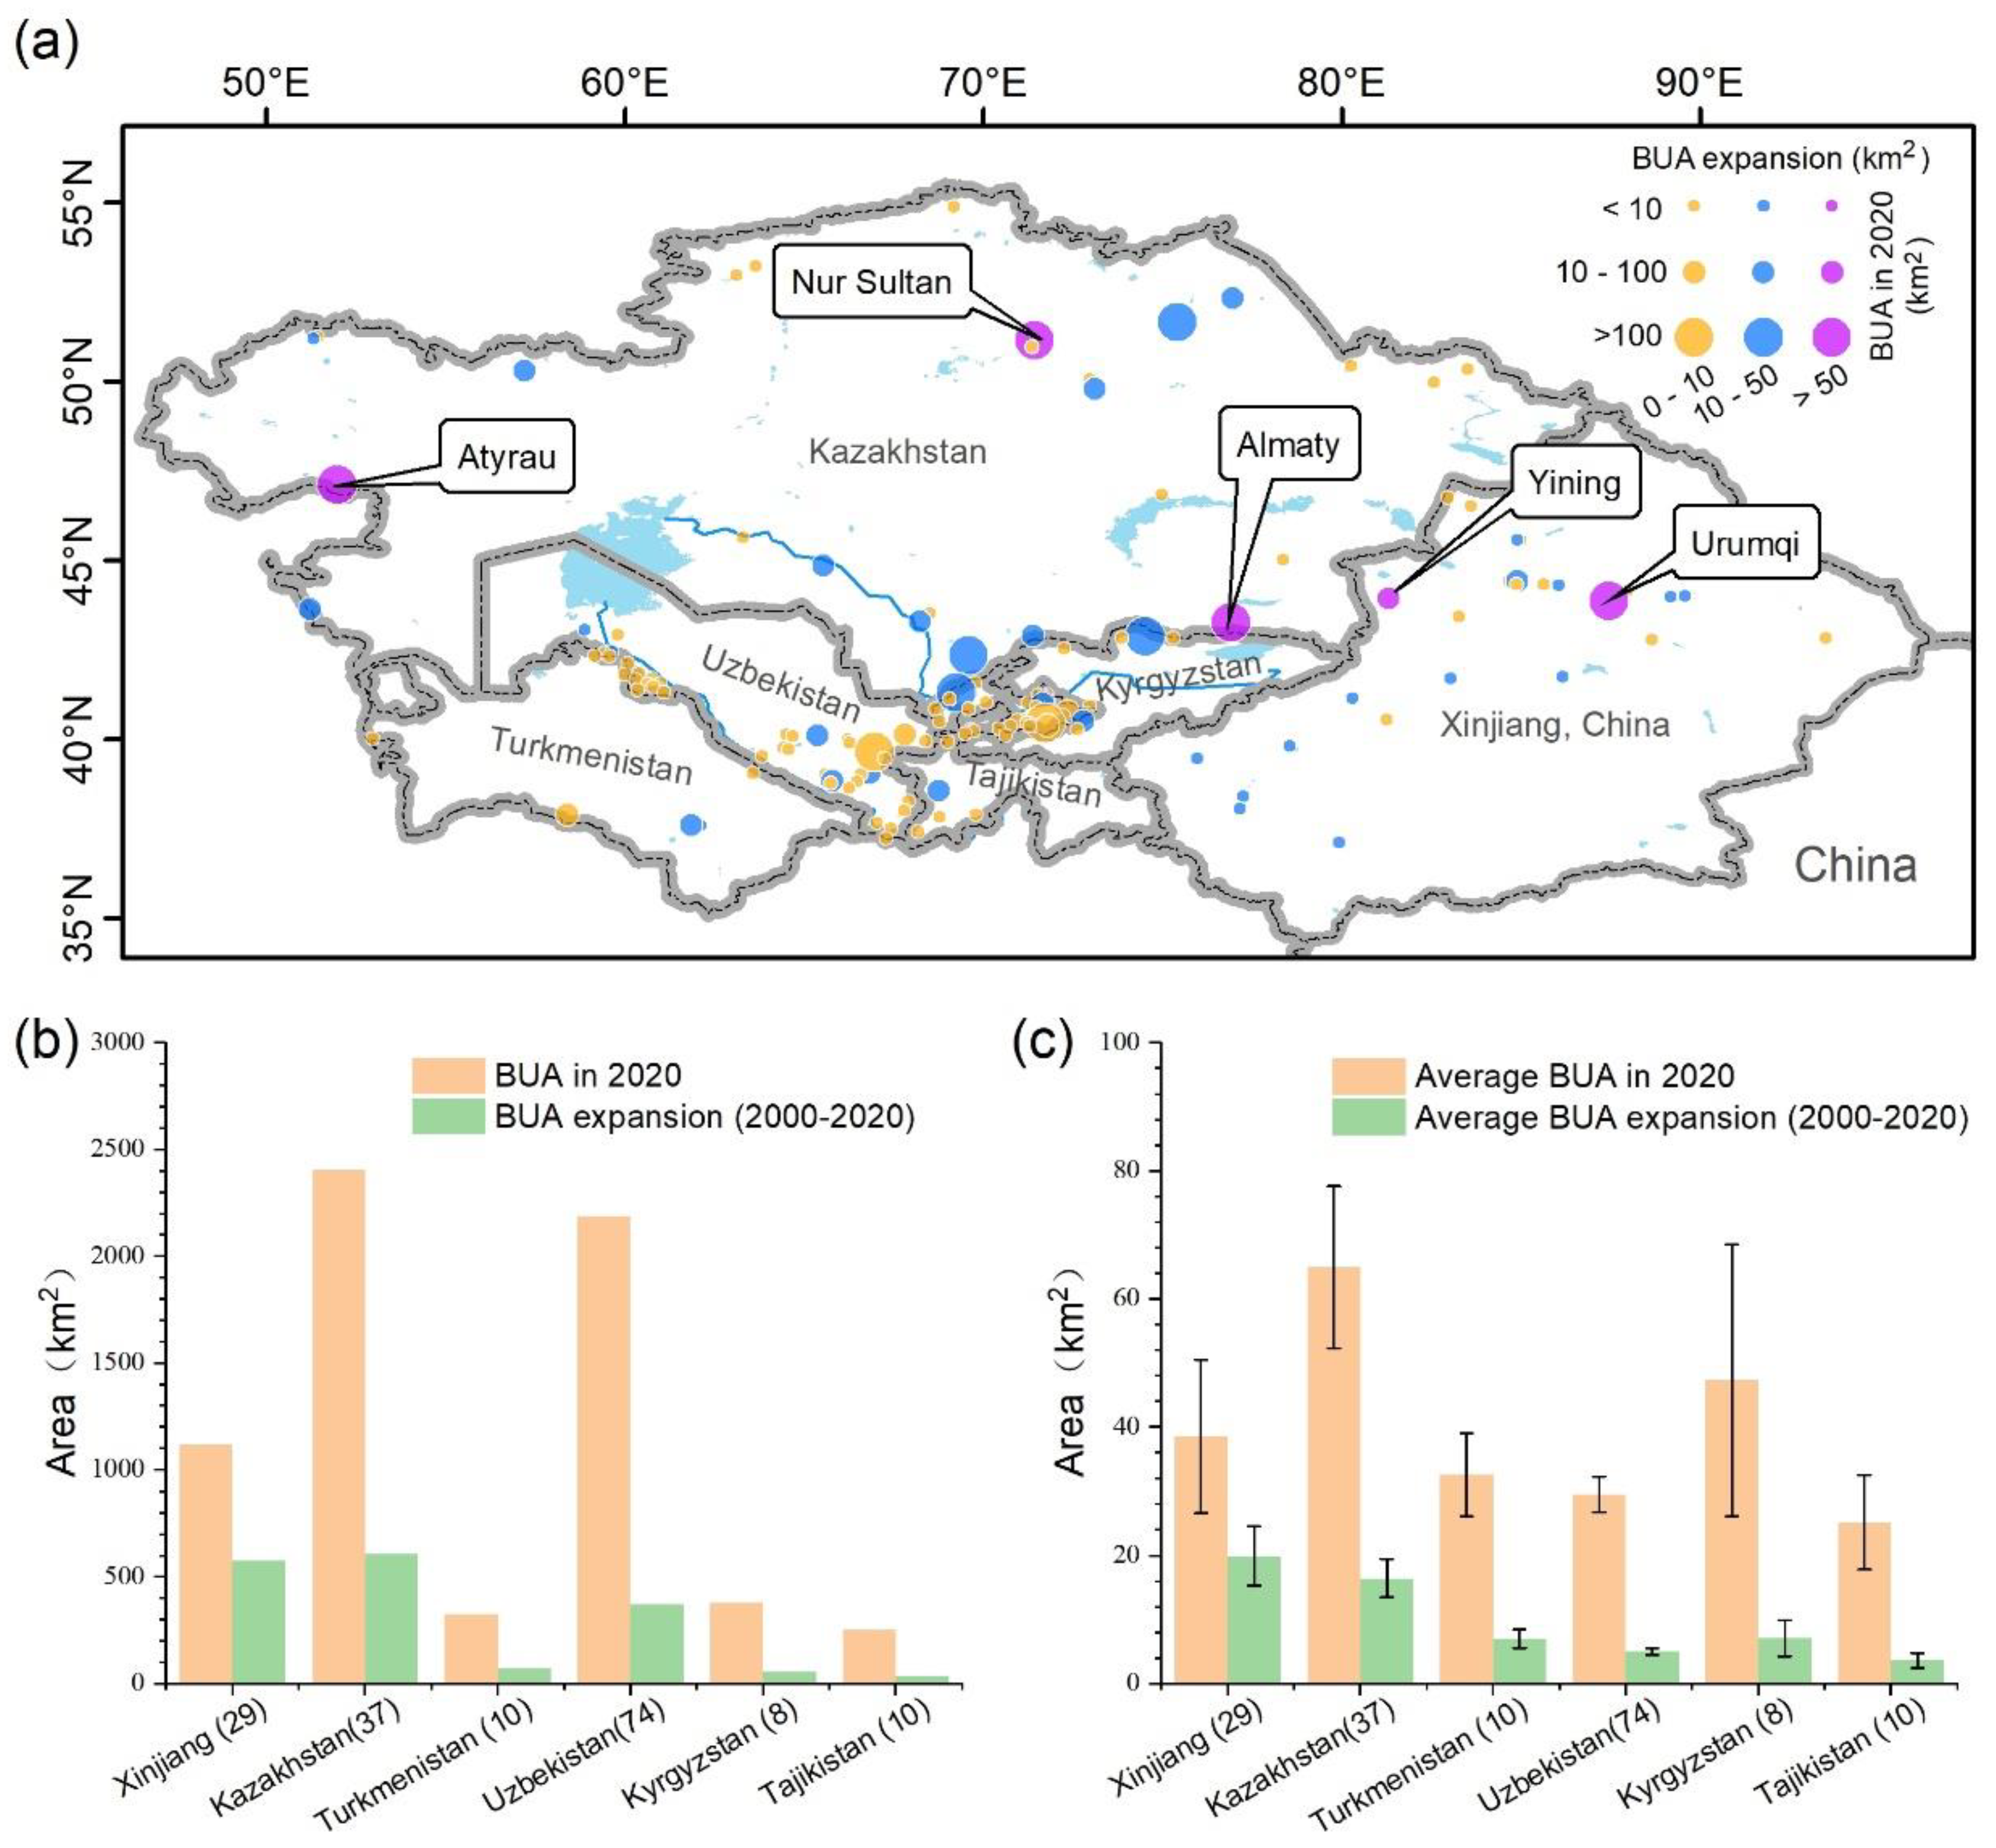
Figure 1. Distribution of cities with urban expansion in Xinjiang and the five Central Asian countries. (a) Spatial distribution of the 168 cities with BUA expansion (BUAE) in different levels from 2000 to 2020. The top five cities with BUAE are marked (purple points). (b) The bars are the total BUA in 2020 and the total BUAE from 2000 to 2020. (c) The bars are the average BUA in 2020 and the average BUAE from 2000 to 2020 for each city. In (c), the error bars denote the standard error of the mean (SEM) for Xinjiang and each country in Central Asia.
Preprints 86439 g001
Figure 2. Distribution of cities with urban populations growth. (a) Spatial distribution of the 168 cities with urban population growth (UPG) in different levels from 2000 to 2020. The top 18 cities with UPGs of more than 100,000 are labeled with their names (purple points). (b) The bars are the total urban populations in 2000 and 2020. (c) The bars are the average urban population densities in 2000 and 2020 in each city. In (c), the error bars denote the standard error of the mean (SEM) for Xinjiang and each country in Central Asia.
Preprints 86439 g002
Figure 3. The RPB values refer the ratio of the urban population growth rate to the urban expansion rate, for the 168 cities from 2000 to 2020.
Preprints 86439 g003
Figure 5. Distribution of the cities with urban populations living in greened built-up areas (BUAs). (a) Distribution of the 168 cities with different size populations living in significant greening BUAs (noted as PLGB) from 2000 to 2020. The top 8 cities with PLGBs of greater than 100,000) are labeled with their names (blue points). (b) The bars are the total PLGB in Xinjiang, China and other countries. (c) The bars are the ratio of the total urban population living in greened BUAs to the total urban population in study area.
Preprints 86439 g005
Table 1. Ranking of the top 18 cities with the largest population growth from 2000 to 2020.
Rank City Name Region BUA in 2020 (km2) BUAE (km2) Urban population in 2000 (x104) Urban population in 2020 (x104) Urban population growth
1 Urumqi Xinjiang, China 362 134 151.3 316.7 165.4
2 Almaty Kazakhstan 286 55 75.5 134.8 59.3
3 Dushanbe Tajikistan 89 13 54.6 98.1 43.5
4 Bishkek Kyrgyzstan 191 24 73.3 106.9 33.6
5 Chimkent Kazakhstan 158 26 24.3 57.5 33.2
6 Kashgar Xinjiang, China 50 36 16.5 41.2 24.7
7 Ashkhabad Turkmenistan 69 7 24.5 44.8 20.4
8 Nur Sultan Kazakhstan 159 82 4.4 24.0 19.6
9 Korla Xinjiang, China 49 35 14.0 32.8 18.9
10 Yining Xinjiang, China 46 20 20.9 39.4 18.5
11 Shihezi Xinjiang, China 142 9 13.0 31.0 18.0
12 Samarqand Uzbekistan 384 16 14.2 29.1 14.9
13 Tashkent* Uzbekistan 38 31 32.0 44.7 12.7
14 Hetian Xinjiang, China 49 28 6.8 18.5 11.7
15 Karamay Xinjiang, China 21 5 5.0 16.7 11.7
16 Yangiyul Uzbekistan 29 11 26.7 38.3 11.5
17 Changji Xinjiang, China 63 47 20.8 31.4 10.5
18 Aktau Kazakhstan 76 52 1.1 11.1 10.0
* The demographic data for Tashkent City are quite different from the official statistics (https://worldpopulationreview.com/countries/uzbekistan-population).
Table 2. Ranking of the top 10 large cities* with the largest REVI values.
Rank City Region BUA in 2020 (km2) BUAE (km2) REVI of BUAs in 2020 REVI of BUAs in 2000
1 Karamay Xinjiang, China 49.1 28.4 0.75 0.93
2 Korla Xinjiang, China 48.9 35.1 0.55 0.72
3 Aksu Xinjiang, China 41.1 19.0 0.51 0.57
4 Urumqi Xinjiang, China 361.8 133.9 0.50 0.61
5 Kuitun Xinjiang, China 51.8 27.0 0.44 0.57
6 Timirtau Kazakhstan 44.5 5.3 0.40 0.43
7 Karaganda Kazakhstan 45.5 12.5 0.38 0.39
8 Shihezi Xinjiang, China 45.6 20.1 0.31 0.45
9 Ekibastuz Kazakhstan 134.9 14.9 0.28 0.28
10 Nukus Uzbekistan 46.5 11.3 0.22 0.20
*The term large cities refers to cities with urban built-up areas of greater than 40 km2 in 2020.
Table 3. Ranking of the 20 large cities by the population living in greened BUAs.
Rank City Region BUA (km2) Greened BUA (km2) REVI of BUAs in 2020 Urban Population (x104) Emax (2018–2020) population living in greened BUAs (x104) Ratio of PLGB (%)
1 Urumqi Xinjiang 362 179 0.50 317 0.21 208.5 66
2 Korla Xinjiang 49 27 0.55 33 0.19 20.4 62
3 Changji Xinjiang 29 15 0.53 31 0.27 19.5 62
4 Aksu Xinjiang 41 21 0.51 27 0.21 16.7 61
5 Kashgar Xinjiang 50 8 0.15 41 0.20 14.4 35
6 Karamay Xinjiang 49 37 0.75 17 0.24 13.8 83
7 Almaty Kazakhstan 286 21 0.07 135 0.34 12.6 9
8 Shihezi Xinjiang 46 14 0.31 31 0.29 11.1 36
9 Hami Xinjiang 30 10 0.34 19 0.21 9.1 47
10 Ashkhabad Turkmenistan 69 12 0.17 45 0.21 7.8 17
11 Yining Xinjiang 76 6 0.07 39 0.25 7.3 18
12 Kuitun Xinjiang 52 23 0.44 9 0.24 5.6 63
13 Fukang Xinjiang 14 5 0.37 5 0.28 4.0 76
14 Wusu Xinjiang 19 10 0.49 6 0.22 3.8 67
15 Dushanbe Tajikistan 89 4 0.05 98 0.28 3.8 4
16 Dushanzi Xinjiang 20 14 0.68 5 0.25 3.7 70
17 Hetian Xinjiang 38 2 0.06 18 0.23 3.6 19
18 Kuche Xinjiang 23 16 0.71 6 0.19 3.6 64
19 Qitai Xinjiang 16 5 0.29 5 0.27 2.7 54
20 Bachu Xinjiang 22 8 0.37 6 0.19 2.3 42
Disclaimer/Publisher’s Note: The statements, opinions and data contained in all publications are solely those of the individual author(s) and contributor(s) and not of MDPI and/or the editor(s). MDPI and/or the editor(s) disclaim responsibility for any injury to people or property resulting from any ideas, methods, instructions or products referred to in the content.
Copyright: This open access article is published under a Creative Commons CC BY 4.0 license, which permit the free download, distribution, and reuse, provided that the author and preprint are cited in any reuse.
Prerpints.org logo

Preprints.org is a free preprint server supported by MDPI in Basel, Switzerland.

Subscribe

© 2024 MDPI (Basel, Switzerland) unless otherwise stated