1. Introduction
Albedo is the ratio of incoming to reflected radiation by a surface [
1]. In the case of the Earth, the ground albedo is the ratio of the incident solar radiation on its surface to the reflected by it. Albedo is a dimensional number expressed either in the form of percentage or a fraction of 1. An albedo equal to 0% or just 0 denotes a completely absorbing surface; on the contrary, an albedo of 100% or just 1 implies a surface that fully reflects incoming solar radiation. The albedo values of the various surface types on Earth differ significantly from as high as 85% for snow to as little as 6% for open ocean [
2]. Using satellite observations from late 1970s, scientists have estimated an average albedo value for the Earth of about 0.30 [
3].
The albedo affects climate by determining how much radiation is absorbed by the surface of the Earth [
4]. Uneven heating of the Earth’s surface because of albedo variations between land, sea, and ice can drive weather [
5]. The surface of the Earth absorbs the incoming radiation and emits infrared radiation; this mechanism warms the atmosphere and keeps the global temperature at 15 degrees Celsius on average [
1,
6]. Because of the importance of the Earth’s albedo in the changing climate, continuous monitoring of it is now being carried out by various satellites that contribute to an energy-budget (or radiation-budget) programme [
7].
Another significant application of the albedo notion is for the energy received by a tilted flat-plate surface [
8]; the higher the ground reflectivity is, the higher the reflected radiation and consequently the received total solar energy on the sloped plane is. This is important in solar energy applications, e.g., PV installations. The effect of the ground reflectance on the total solar energy received on tilted surfaces has been investigated by several researchers in various ways. They all show that the ground-albedo value at a location depends on the following parameters: solar altitude (intra-day variation), surrounding geomorphology (terrain characteristics), and atmospheric composition at a certain time (atmospheric constituents that may also reflect radiation back to Earth, i.e., atmospheric albedo). Therefore, all studies investigating surface-albedo changes and effects refer to a certain site or a cluster of sites with known all the mentioned parameters above. The authors of [
9] did not find any notable dependence of the albedo values at 2 locations in France, 1 in the Netherlands, 2 in Switzerland, and 1 in the USA. As for the effect of the albedo on solar radiation on tilted planes, they concluded that best results are obtained when using a constant (isotropic) value. A simulation was applied in a work [
5]; its was found that an increase in the albedo value from a grassland to a desert environment resulted in a significant increase in the annual global radiation. Other researchers [
10] have analysed the albedo effects on the performance of 7 PV materials and shown that there exists an effective albedo value for each material type of ground surface and PV module. The albedo of various surfaces in an urban environment in Spain was investigated [
11]; it was found that the optimal tilt of solar systems installed on roof tops depends on the geographical latitude and the altitude of the site, as well as the albedo of the reflecting (roof-top) surface. A similar study [
12] obtained the annual optimum tilt angle as a function of geographical latitude, diffuse fraction (ratio of diffuse solar radiation to global solar one), and albedo. The authors used data from 14468 sites across the globe; though their model included albedo as a variable, it did not take into account any albedo variations (e.g., monthly or seasonal ones). Other researchers [
13] have compared various ground-albedo models and concluded that the most appropriate period for their calibration is early summer. The ground albedo in the Athens area was evaluated in a study [
14], which found it to be about 0.15 as an average annual value; moreover, the authors of that study showed that the ground-albedo value varies throughout the day.
Especially for Saudi Arabia, most recent studies by [
15,
16] have estimated the solar energy received on optimum-tilt-angle solar systems facing constantly local south (mode-I or fixed-tilt-angle solar systems) or rotating around a vertical axis (mode-II, or one-, or single-axis solar systems). Other study [
17] found the solar energy potential of Saudi Arabia received on flat-plate solar systems always normal to the direction of the Sun (mode-III or two-, or dual-axis solar systems). All the above studies used data for 82 sites in Saudi Arabia obtained from the PV—Geographical Information System (PV-GIS) platform [
18]; the analyses in the above papers were solely based upon (simulated) solar radiation data that included a constant albedo value for each site over the year retrieved from the Giovanni portal [
19]. A step forward was made in a study for the solar potential with mode-III solar systems in Greece [
20], where the authors used the same technique as that in the above-mentioned studies for Saudi Arabia, but here a constant monthly albedo value was used instead of an annual one.
From the above deployed literature, it is seen that no study has been conducted to show the effect of the ground albedo on mode-I, -II, or -III solar systems. This effect can be thought as extra radiation added on the inclined surface from the reflecting ground depending on the type of the surface (reflectance of the surface). Therefore, two major questions arise: (i) how large or small this ground-reflected radiation is for all 3 types of solar systems, and (ii) whether it should be neglected or not in the calculations of solar potential on the 3 types of solar systems. These are the main challenges to be tackled in the present study. The main hypothesis of this work is that the adoption of a ground-albedo value of 0.2 gives satisfactory results in solar energy applications.
Section 2 describes the data used in this study and its processing as well as any calculations needed for the sake of the analysis.
Section 3 gives the results of the work.
Section 4 is devoted to a relative discussion, and section 5 deploys the main conclusions of the study. Acknowledgements and references follow.
2. Materials and Methods
2.1. Data Collection
Hourly values of H
b (direct horizontal solar irradiance in Wm
−2), and H
d (diffuse horizontal solar irradiance in Wm
−2) were obtained from the PV-GIS platform [
18]; use of the Surface Solar Radiation Data Set—Heliostat (SARAH) 2005–2016 data base (span of 12 years) was made [
21,
22]. This website (access at
https://joint-research-centre.ec.europa.eu/photovoltaic-geographical-information-system-pvgis_en) provides solar radiation (hourly or monthly) values for any site in Europe, Africa, Middle East (including Saudi Arabia), central and south-east Asia and most parts of the American continent. The methodology followed for the estimation of solar radiation from satellites by the PV-GIS tool uses satellite observations and follows own methodology to estimate solar radiation described in various works [
23,
24,
25].
The solar radiation data were downloaded for the same 82 sites used in previous publications [
15,
16,
17,
26,
27] by some of the authors in the present work. The selected locations cover the whole territory of Saudi Arabia.
Table 1 provides the list of the sites (names and geographical coordinates), while
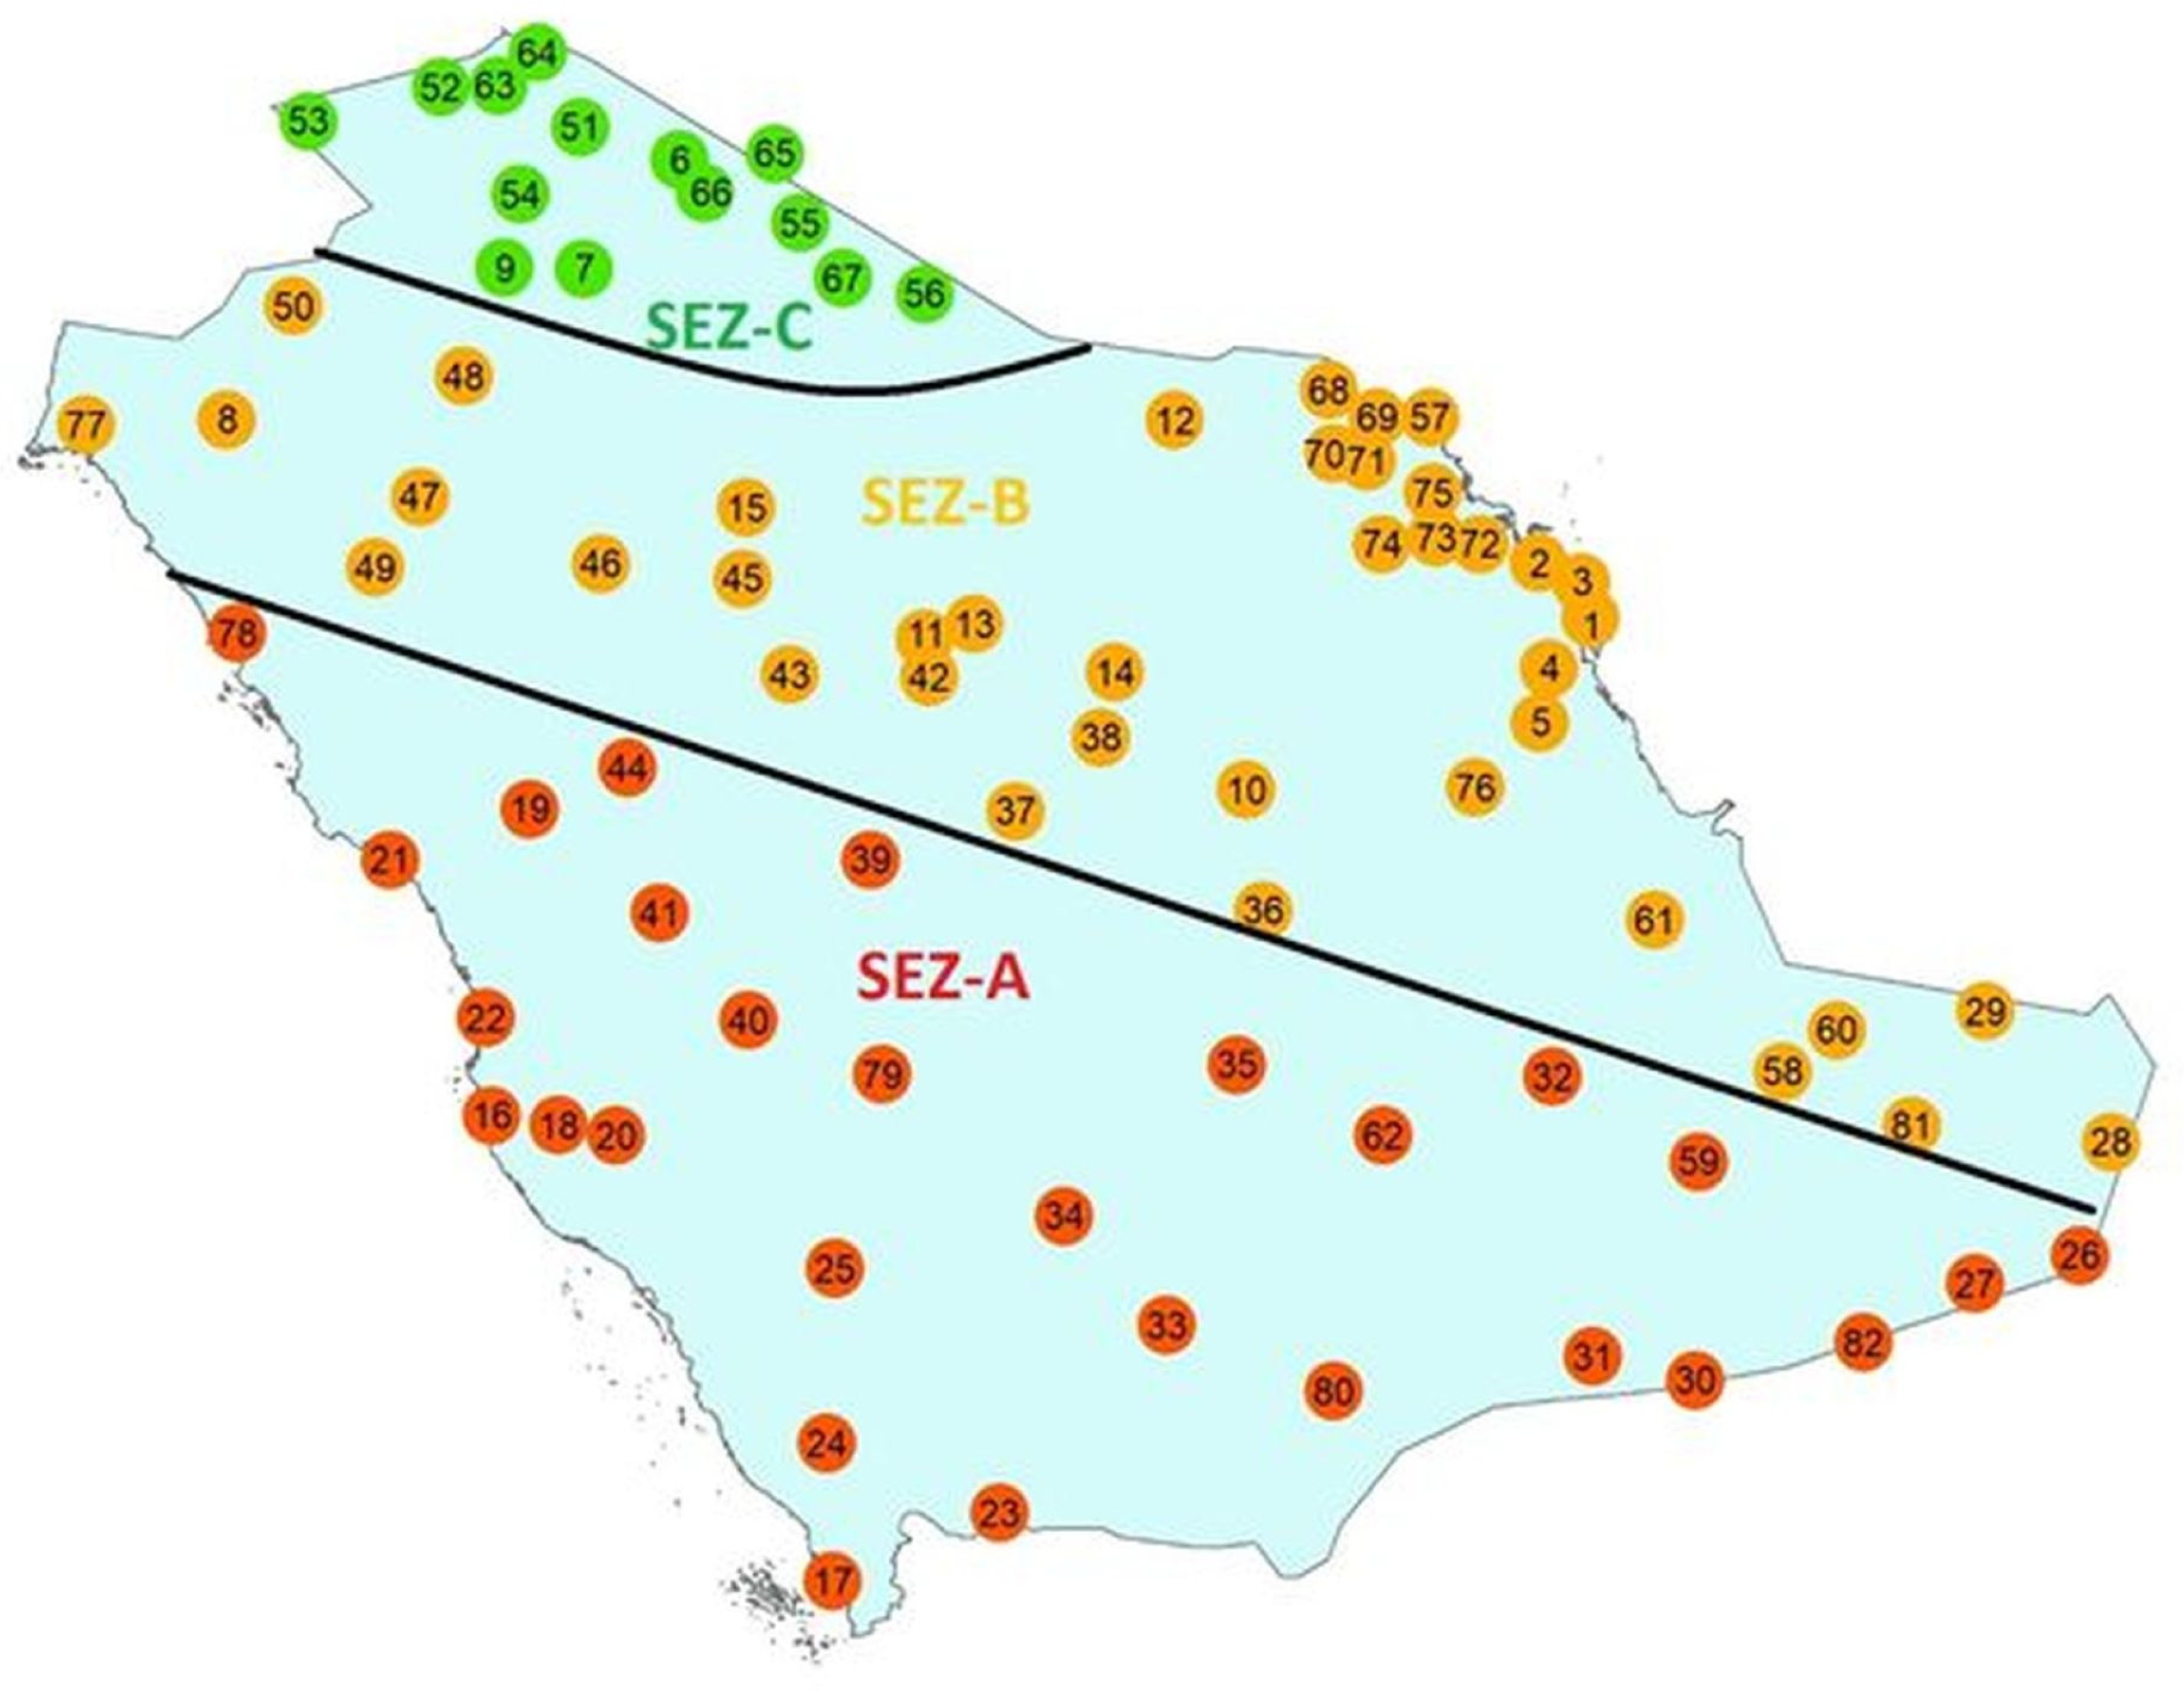
Figure 1 shows their location in the map of the country. For more information about the selection criteria of the 82 sites, the reader is addressed to the mentioned publications.
2.2. Data Processing and Analysis
The process of the solar radiation data at the 82 sites was exactly that followed in the study about the solar potential of Saudi Arabia on flat-plate surfaces with constant inclination tracking the Sun [
16]. In summary, the preparation of the data consisted of the following five-step process: (i) transfer of the data from the universal time coordinate (UTC) of the PV-GIS website into Saudi Arabia’s local standard time (LST = UTC + 3 h); (ii) calculation of the hourly global horizontal solar radiation, H
g, values as H
g = H
b + H
d; (iii) use of the routine XRONOS [
28,
29] to derive the solar azimuths, ψ, and solar elevations, γ, for all 82 sites and the LST times in the period of the study (2005-2016); (iv) assignment of all solar radiation and solar geometry values to the nearest LST hour because of data appearing at various UTC hours in the PV-GIS data base; (v) exclusion of all hourly values if H
g or H
d ≤ 0 Wm
−2, or
γ ≥ 5°, or H
d ≤ H
g.
For estimating the global solar irradiance by a mode-I, H
g,βS, a mode-II, H
g,βt, and a mode-III, H
g,t, tracking system, calculation of the diffuse tilted solar irradiance should be made first. For this reason, use of the Liu-Jordan (L-J, isotropic) transposition model [
30] was made for the mode-I systems and the Hay (anisotropic) model [
31] for the mode-II and mode-III cases. In all calculations the monthly mean near-real ground-albedo, ρ
g, values from the Giovanni portal (GLDAS NOAH025 v2.0 and v2.1 data sets) [
19] were downloaded and used for the 82 sites. The notation βS indicates a fixed-tilt-angle (β degrees) receiving system facing local south, βt implies a fixed-tilt-angle receiving system rotating around a vertical axis (t = tracking the Sun), and t refers to a solar receiving system that constantly follows the Sun. To indicate the use of ρ
g in all calculations, the above symbols of H
g were modified to H
g,βS,ρg,, H
g,βt,ρg, and H
g,t,
ρg, respectively.
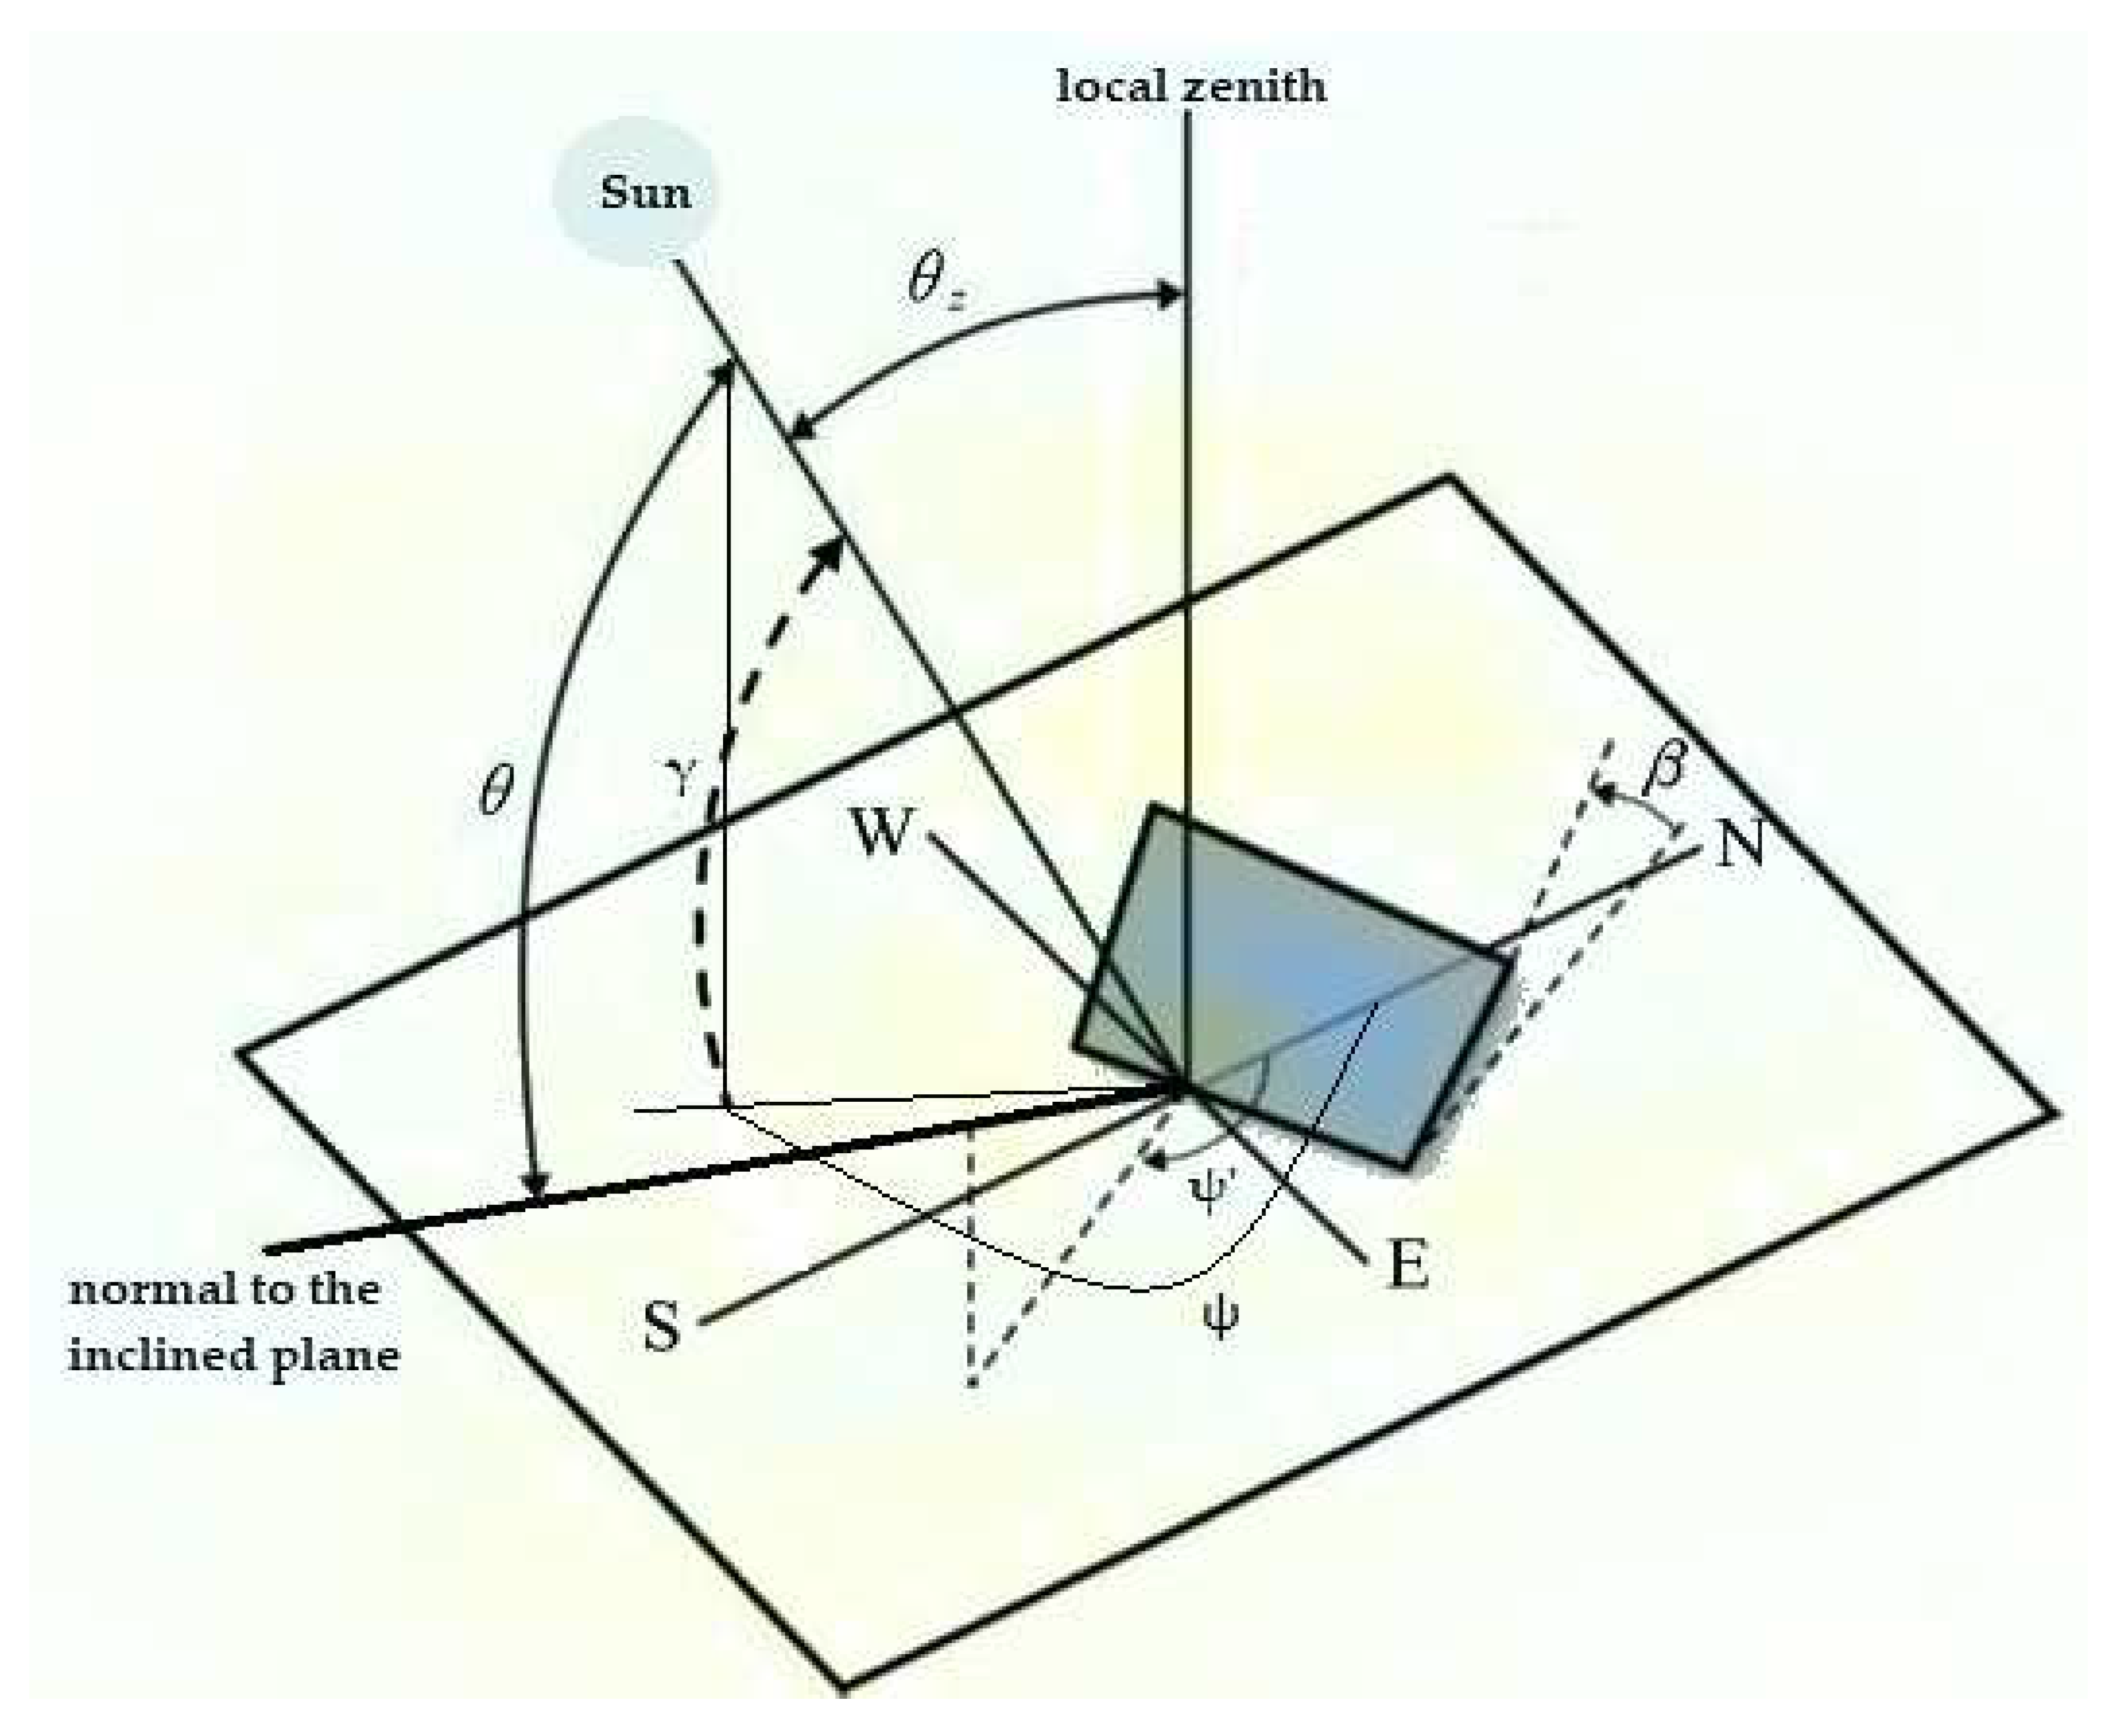
Figure 2 shows the general case of a flat-plate receiving surface inclined at β degrees in respect to the horizontal plane at any of the 82 sites. For a mode-I system, β = fixed and its orientation is towards local south (direction S in
Figure 2); for a mode-II system, β = fixed, but the system rotates around a vertical axis (direction local zenith in
Figure 2); for a mode-III system, β = variable and the system rotates around a vertical and a horizontal axis.
The calculations for estimating the total solar energy on the inclined surface are given below.
In the above expressions, the subscript i implies any of the 3 operating modes (βS, βt, or t); θ is the incidence angle (in degrees), β is the tilt angle of the inclined surface (in degrees), ψ and ψ’ are the azimuths of the Sun and of the inclined plane (in degrees), respectively, and γ is the solar elevation (in degrees). These angles are shown in
Figure 2. The subscript MODEL in equation (2) denotes the L-J or the HAY model. S is the Sun-Earth distance-correction factor [
32], H
0 is the recent solar constant = 1361.1 Wm
-2 [
33], and N is the day-of-the-year (N = 1 for 1 January, N = 365 for 31 December for a non-leap year and 366 in a leap year). The following specifications exist.
For a mode-I system, β = optimum tilt angle, ψ’ = 180o, θ ≠ 0ο.
For a mode-ΙI system, β = optimum tilt angle, ψ = ψ’, θ ≠ 0ο.
For a mode-ΙΙI system, β = 90ο − γ, ψ = ψ’, θ = 0ο.
To answer the two main questions posed in the Introduction section, the following logical methodology was implemented. The solar energies on annual, seasonal and monthly bases were computed for all 82 sites by using the above equations (1)-(7) for the 3 modes of solar systems in Saudi Arabia. These computations were performed twice; first, with near-real albedo, ρg, and a second time with ρg = 0. The latter calculations estimate the solar energy received under the hypothesis of a completely absorbing ground (no ground reflections). In this way, the difference in the solar energy between a reflecting and a completely absorbing ground can be used to show the importance or not of the ground albedo in all estimations of solar energy potential at a location.
3. Results
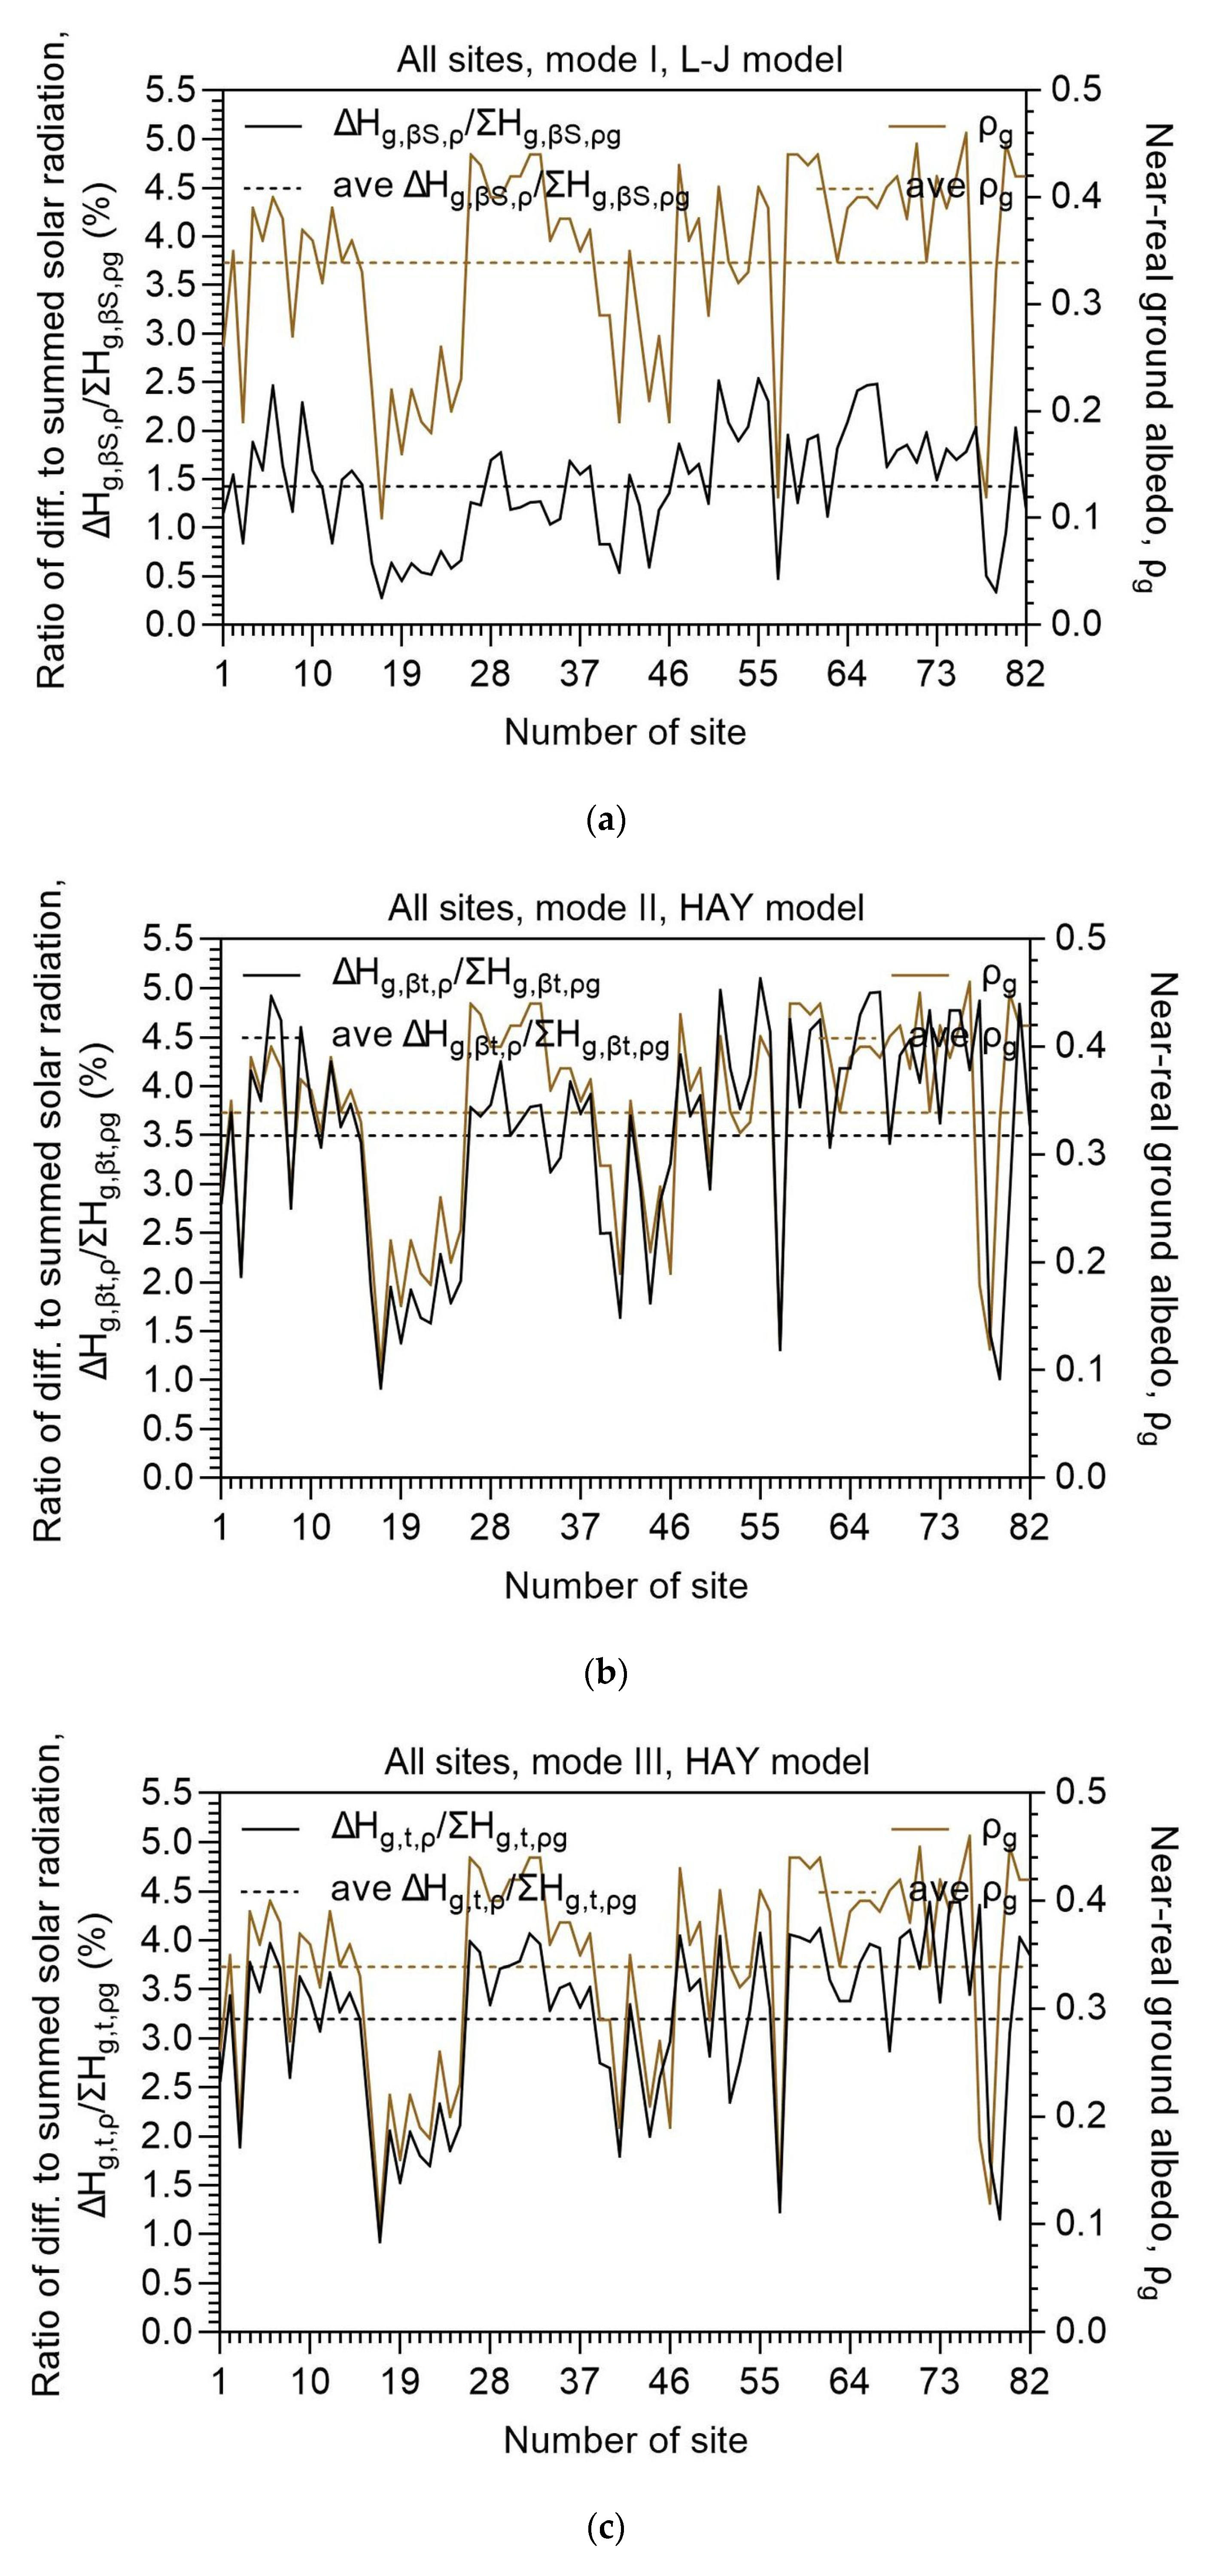
Before deploying any further analysis, some initial results are presented in
Figure 3. Here is seen the percentage contribution of the difference in the annual solar irradiation between the calculations with ρ
g and 0 to the total solar irradiation, ΔH
g,i,ρ/ΣH
g,i,
ρg, at each site for all 3 modes of operation; the subscript i has the same meaning as that in the equations (1)-(7); the subscript ρ implies either ρ
g or 0 in the differences, because ΔH
g,i,ρ = H
g,i,ρg − H
g,i,0, and the sums mean the solar energies estimated with ρ
g. The average contributions of ΔH
g,i,ρ to ΣH
g,i,
ρg amount to ≅1.43%, ≅3.50%, and ≅3.20% for the mode-I, mode-II, and mode-III systems, respectively. For ΣH
g,βS,
ρg = 2420.45 Whm
-2, ΣH
g,βt,
ρg = 3165.19 Whm
-2, and ΣH
g,t,
ρg = 3313.83 Whm
-2 (averages of ΣH
g,i,
ρg across all 82 sites for mode-I, -II, -III systems, respectively), the above percentages correspond to 34.36 Whm
-2, 110.61 Whm
-2, and 106.14 Whm
-2 on annual basis. On average, the greater contribution comes from mode-II systems, followed closely by that from mode-III ones, and last comes the contribution from mode-I solar systems. Another observation in all three Figures is the (visually) high correlation coefficient, r, between ΔH
g,i,ρ/ΣH
g,i,
ρg and ρ
g in the graphs; r = 0.65 for mode-I, r = 0.78 for mode-II, and r = 0.83 for mode-III systems. This result shows a first-glance discrepancy in the performance between single- and dual-axis systems; though the contribution of the ground-reflected radiation to the total solar irradiation is higher for mode-II systems than mode-III (3.50% > 3.20%), the correlation coefficient between reflected irradiance and near-real ground albedo is a bit lower in mode-II than that in mode-III solar systems (0.78 < 0.83). The explanation for this obsolete result lies in the way that the ground reflections affect the tilted surface during the course of the Sun in the sky at each site. This issue is discussed in the below-associated sections.
Figure 3.
Variation of the ratio ΔHg,i,ρ/ΣHg,i,ρg (left vertical axis) and ρg (right vertical axis) across all 82 sites in Saudi Arabia in the period 2005-2016 for (a) mode-I, (b) mode-II, and (c) mode-III solar systems. The subscript ρ in the differences is either ρg or 0. ΔHg,i,ρ = Hg,i,ρg − Hg,i,0; ΣHg,i,ρ is the summation at each site over the examined period; i = βS or βt or t.
3.1. Results on Annual Basis
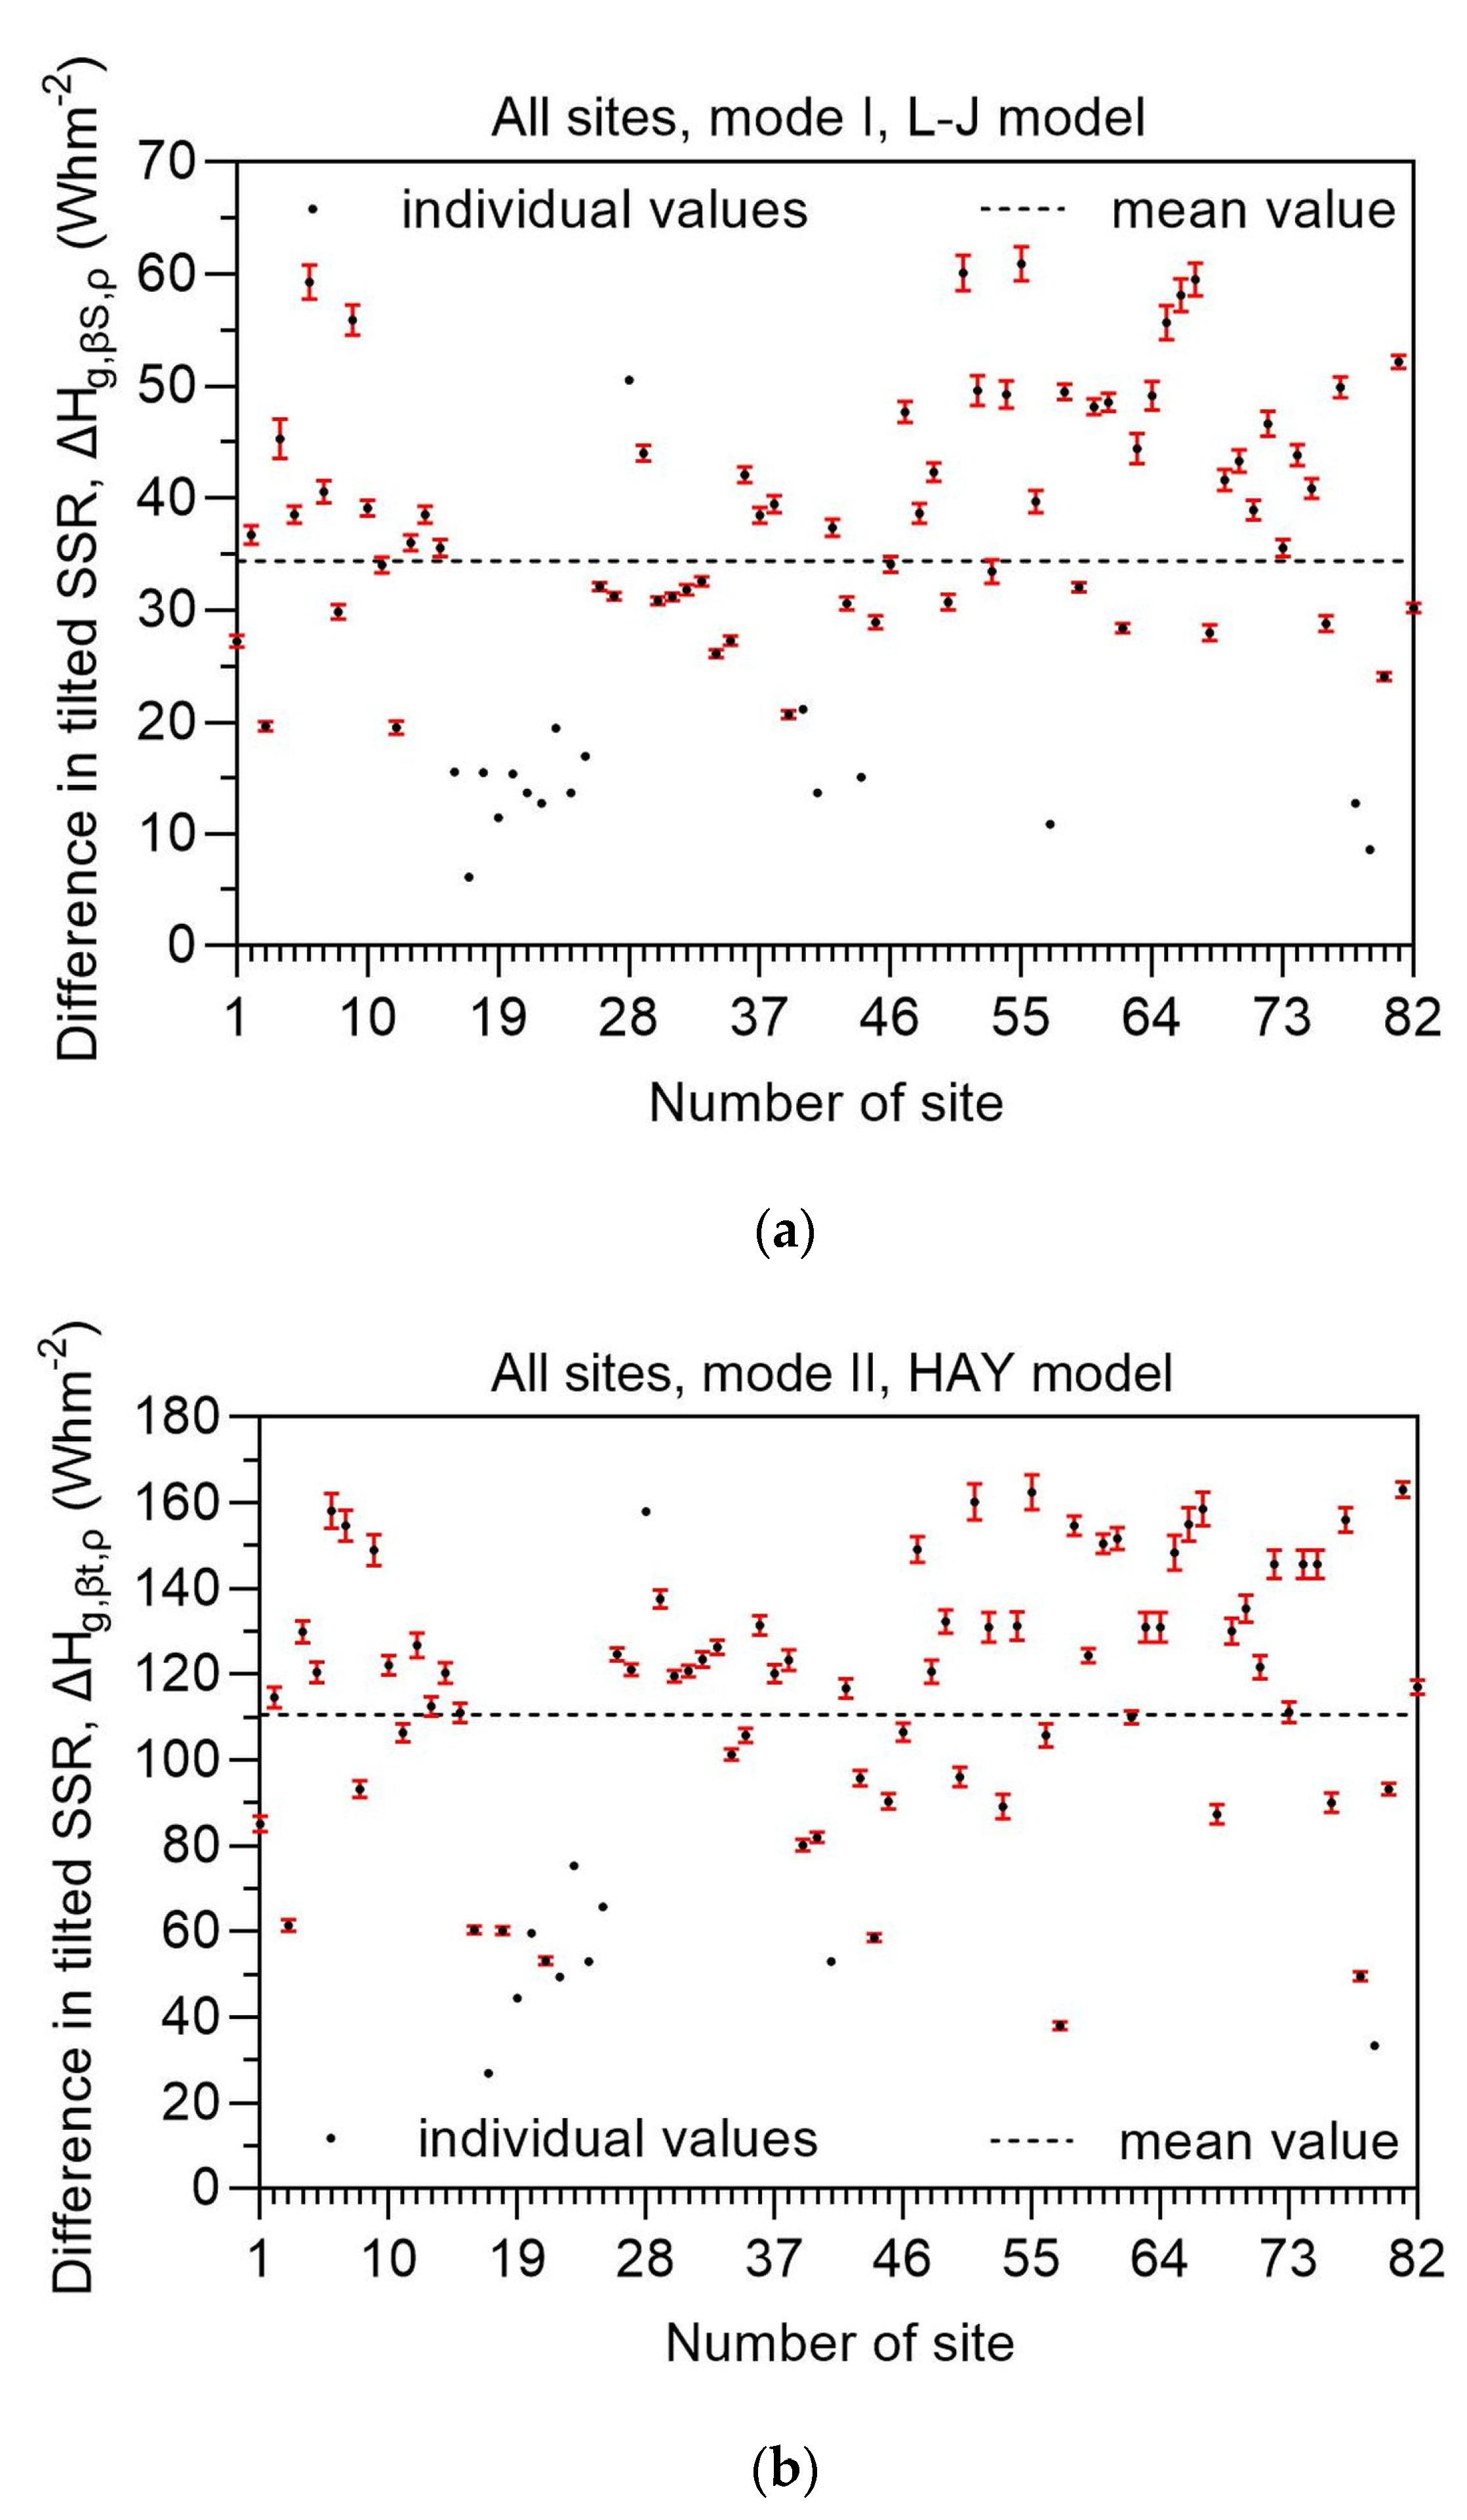
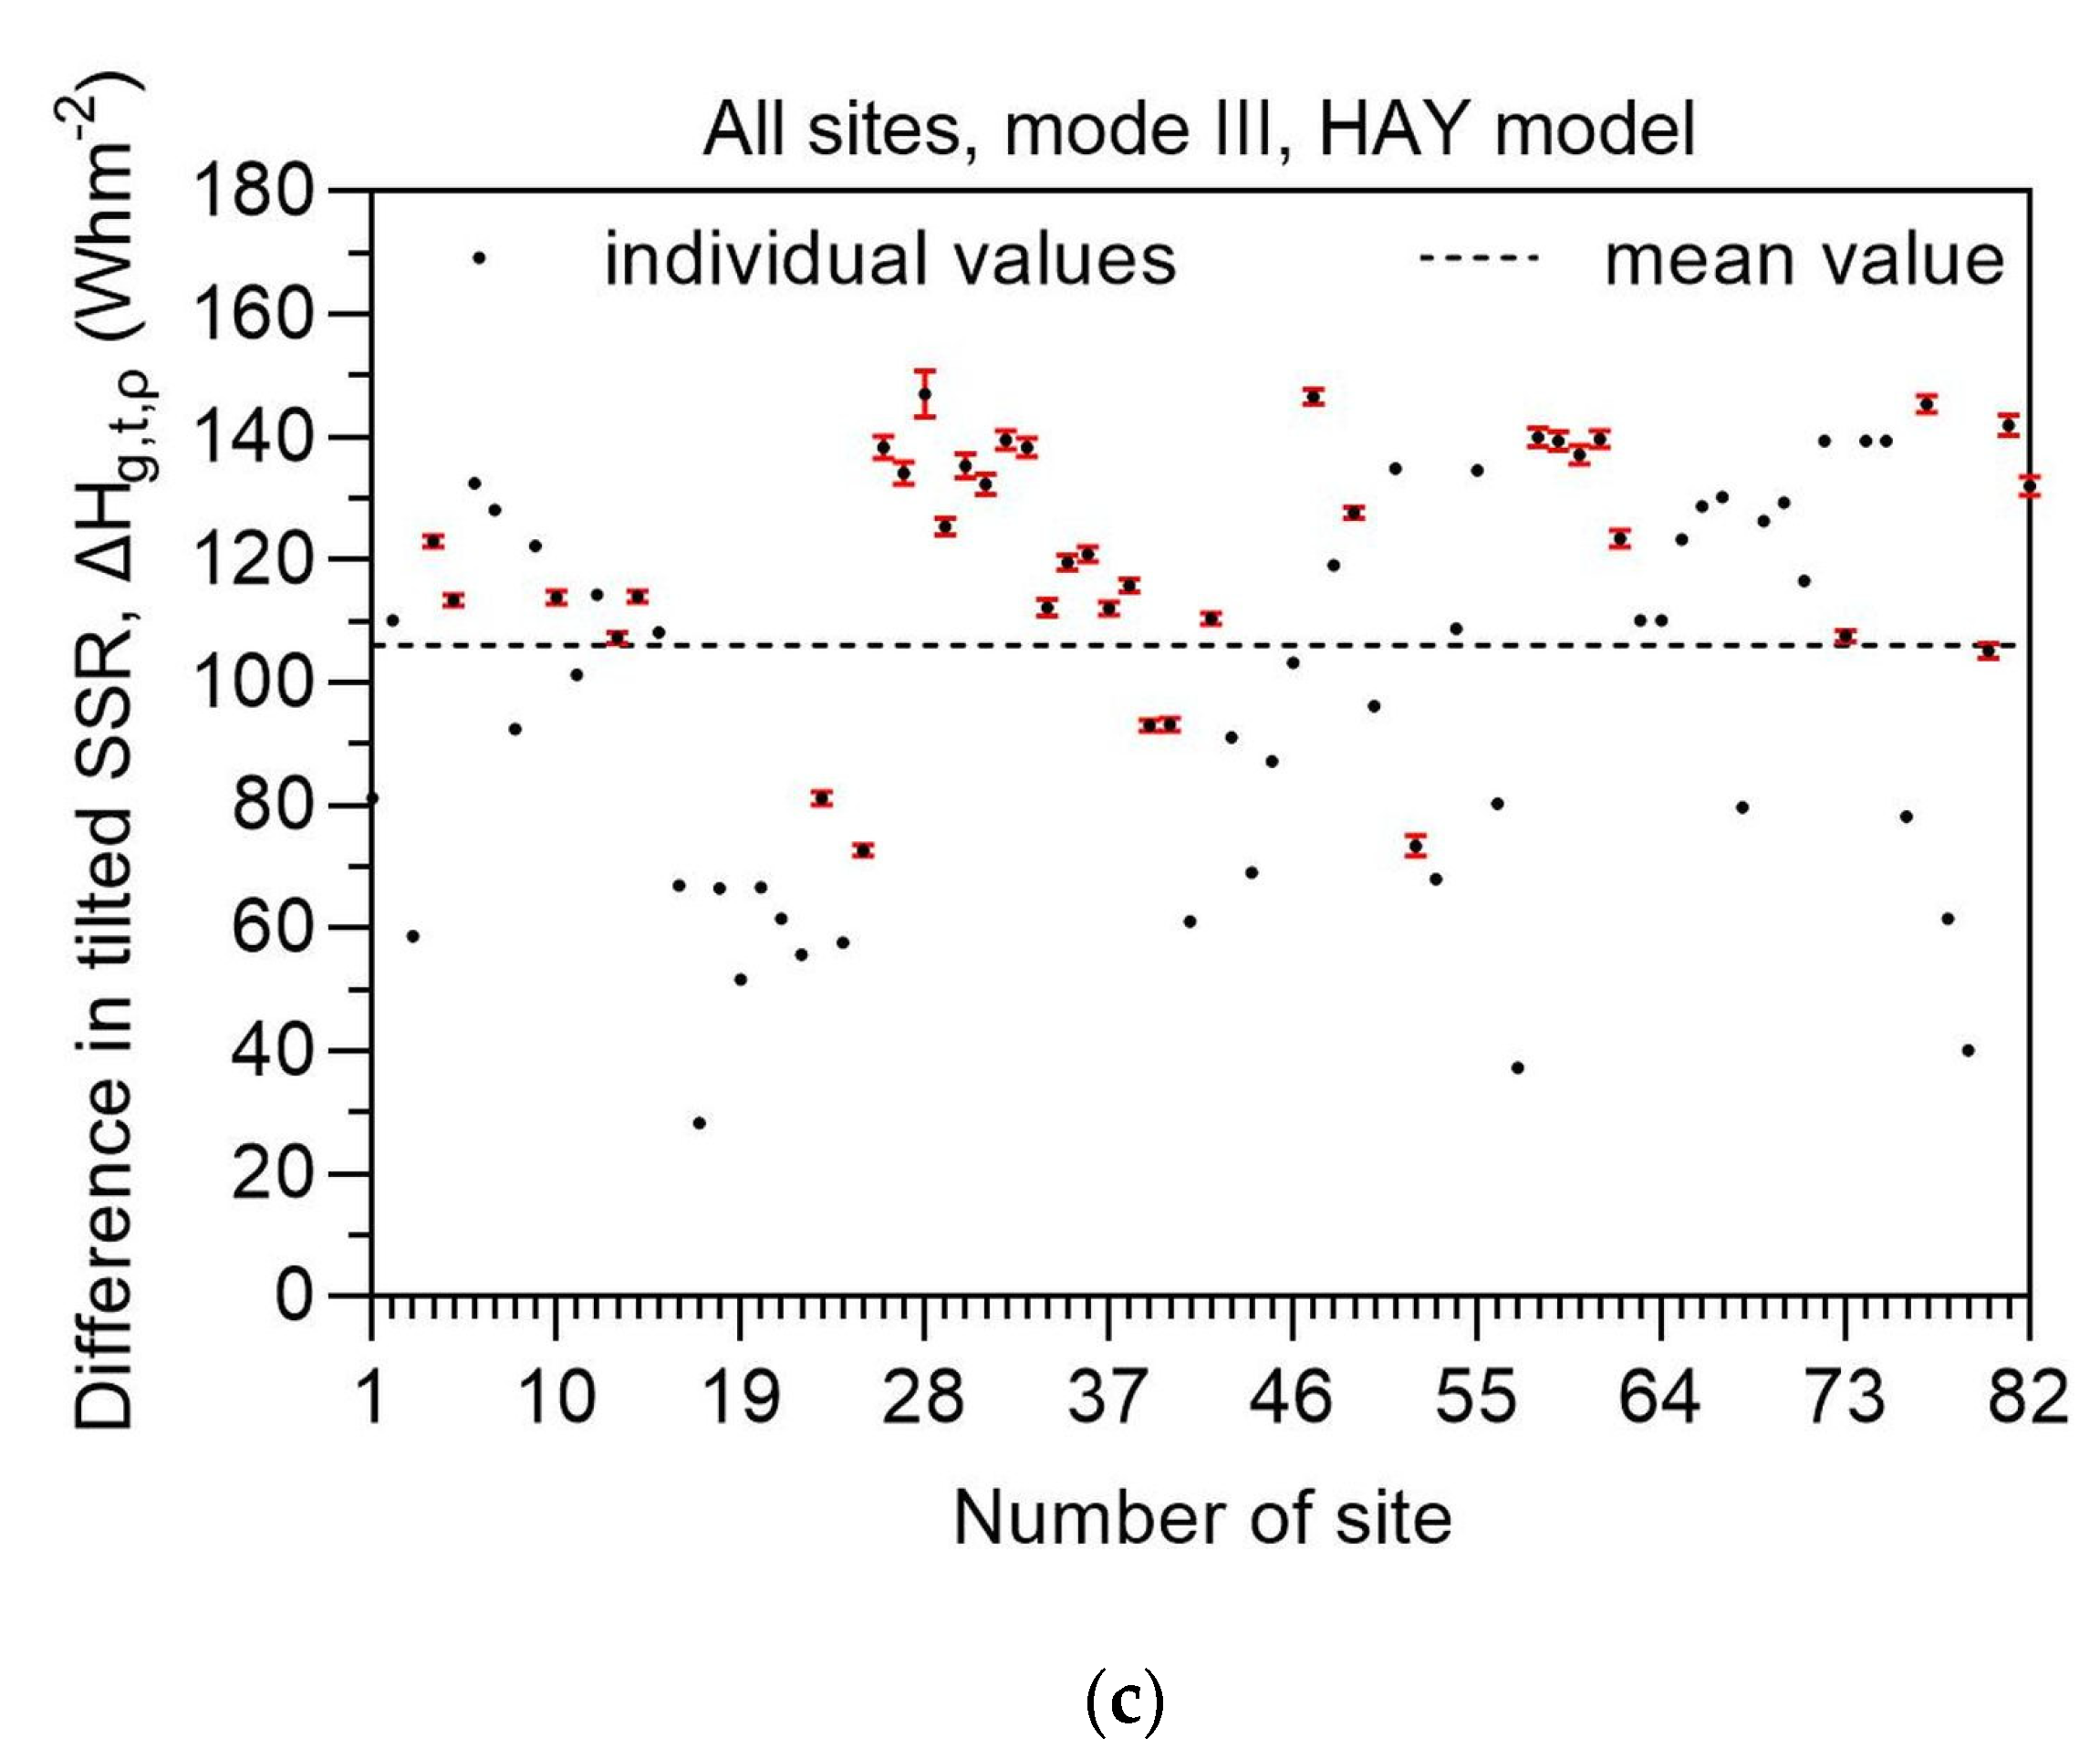
Figure 4 presents the annual solar energy differences for all 82 sites and all 3 modes of operation. The error bars represent the ±1σ (standard deviation) from the annual values. It is amazing how small the error bars are; for many sites they are not discernible at all. This shows that there is no significant effect of the surrounding terrain on the receiving solar energy by the inclined surface at every site throughout the year; or, in other words, the effect of the reflecting terrain is uniform throughout the year at the same site. On the other hand, if there were a non-uniform effect, that would have an impact on the solar energy received by the tilted surface, and, therefore, this uniformity would be reflected by higher standard deviation values. Another intuitive conclusion may be the suitability of the selected diffuse transposition models (L-J for mode-I, and HAY for mode-II, and -III systems). Indeed, Farahat et al. [
27] have suggested the suitability of these specific models for Saudi Arabia according to the configuration of the solar system.
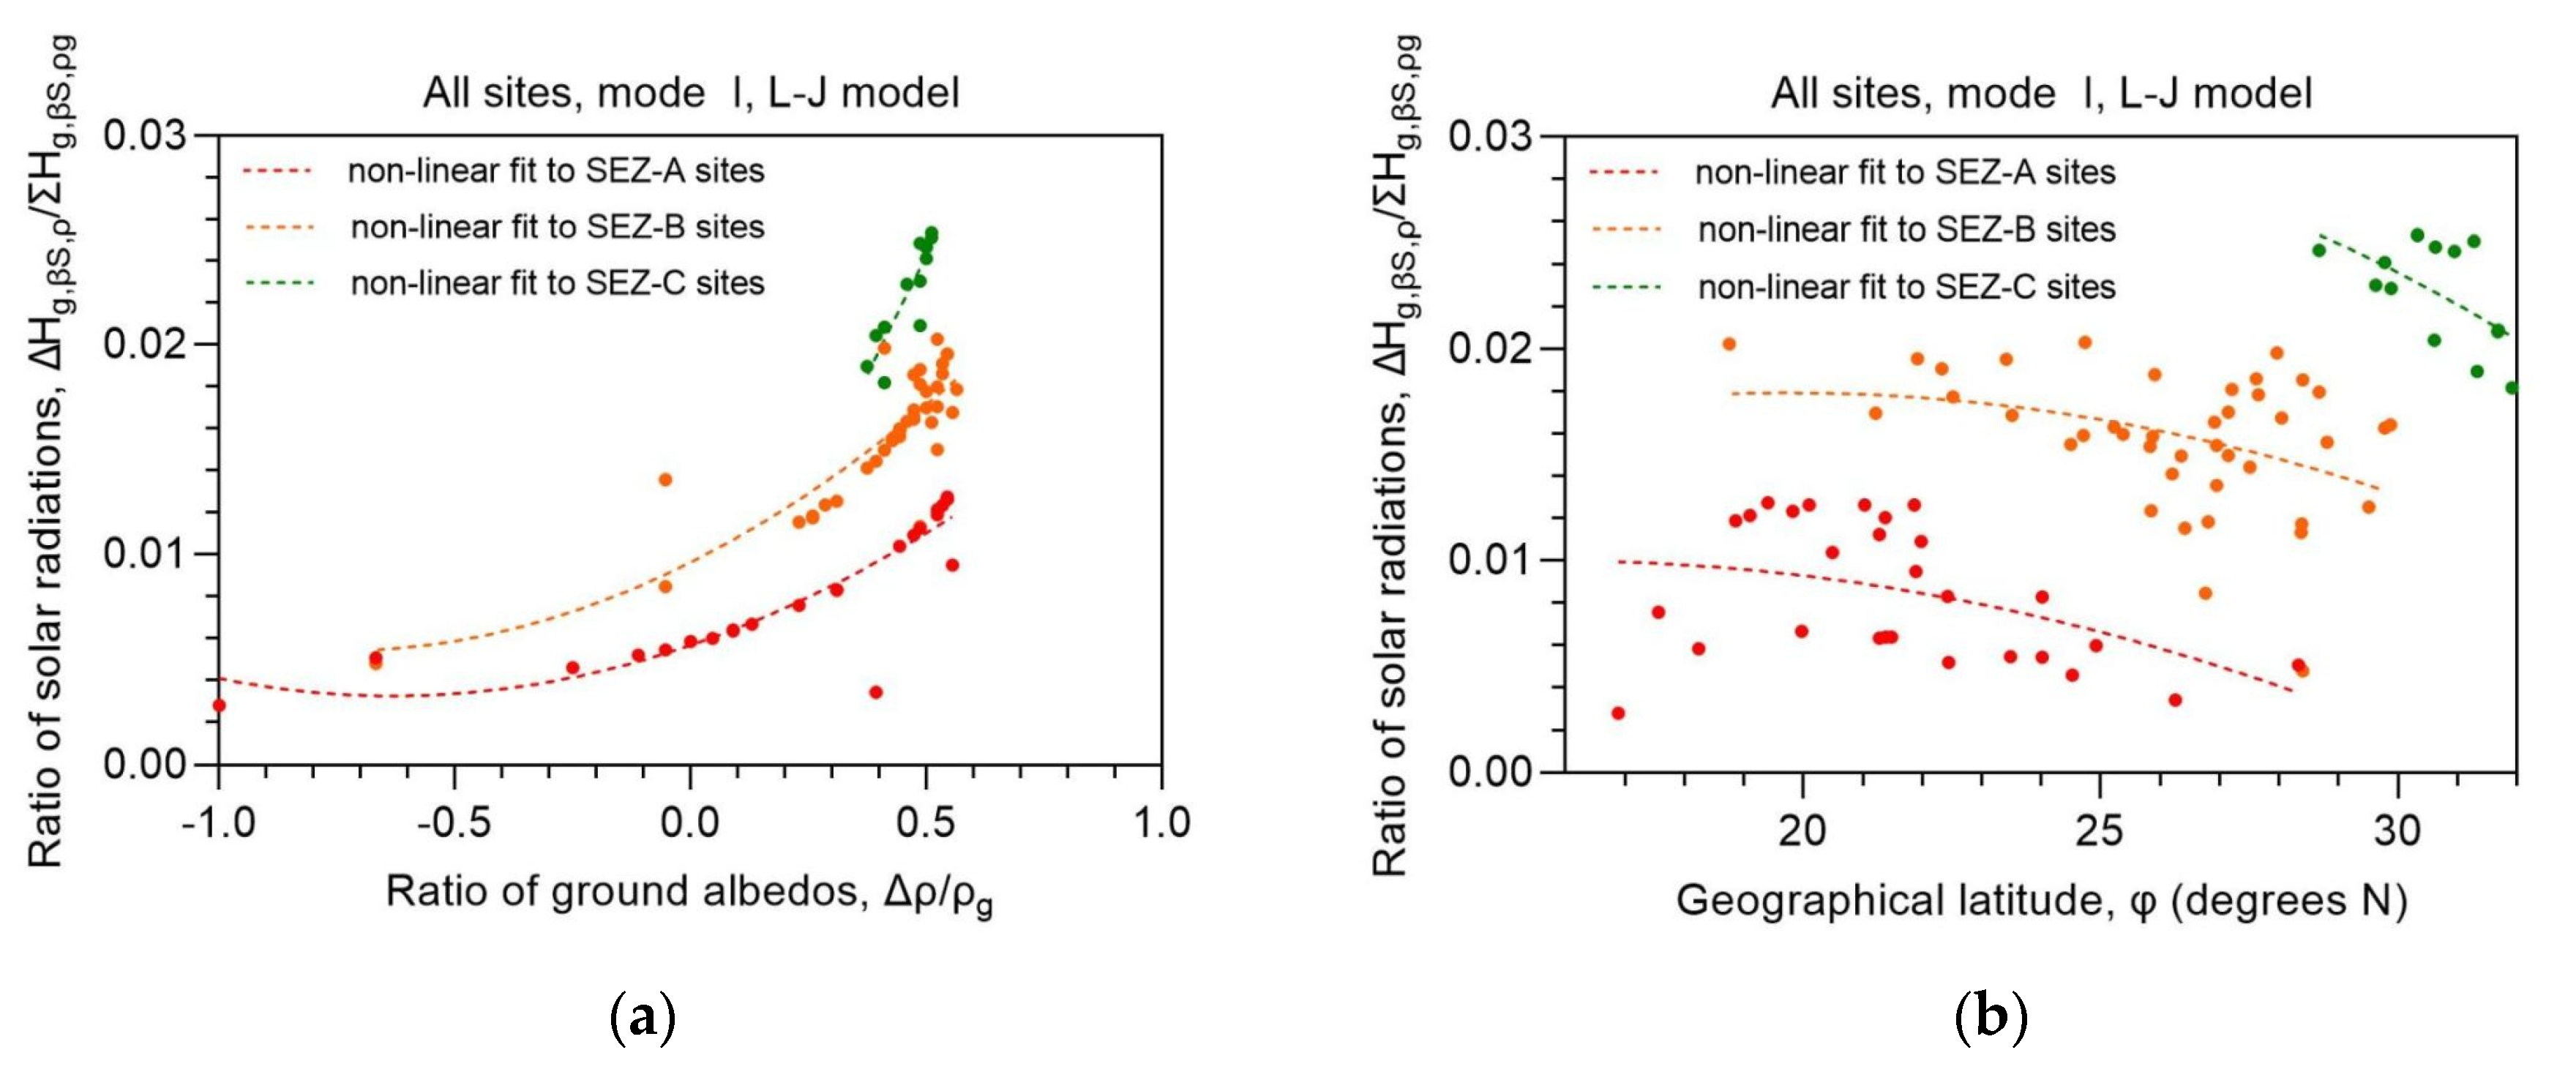
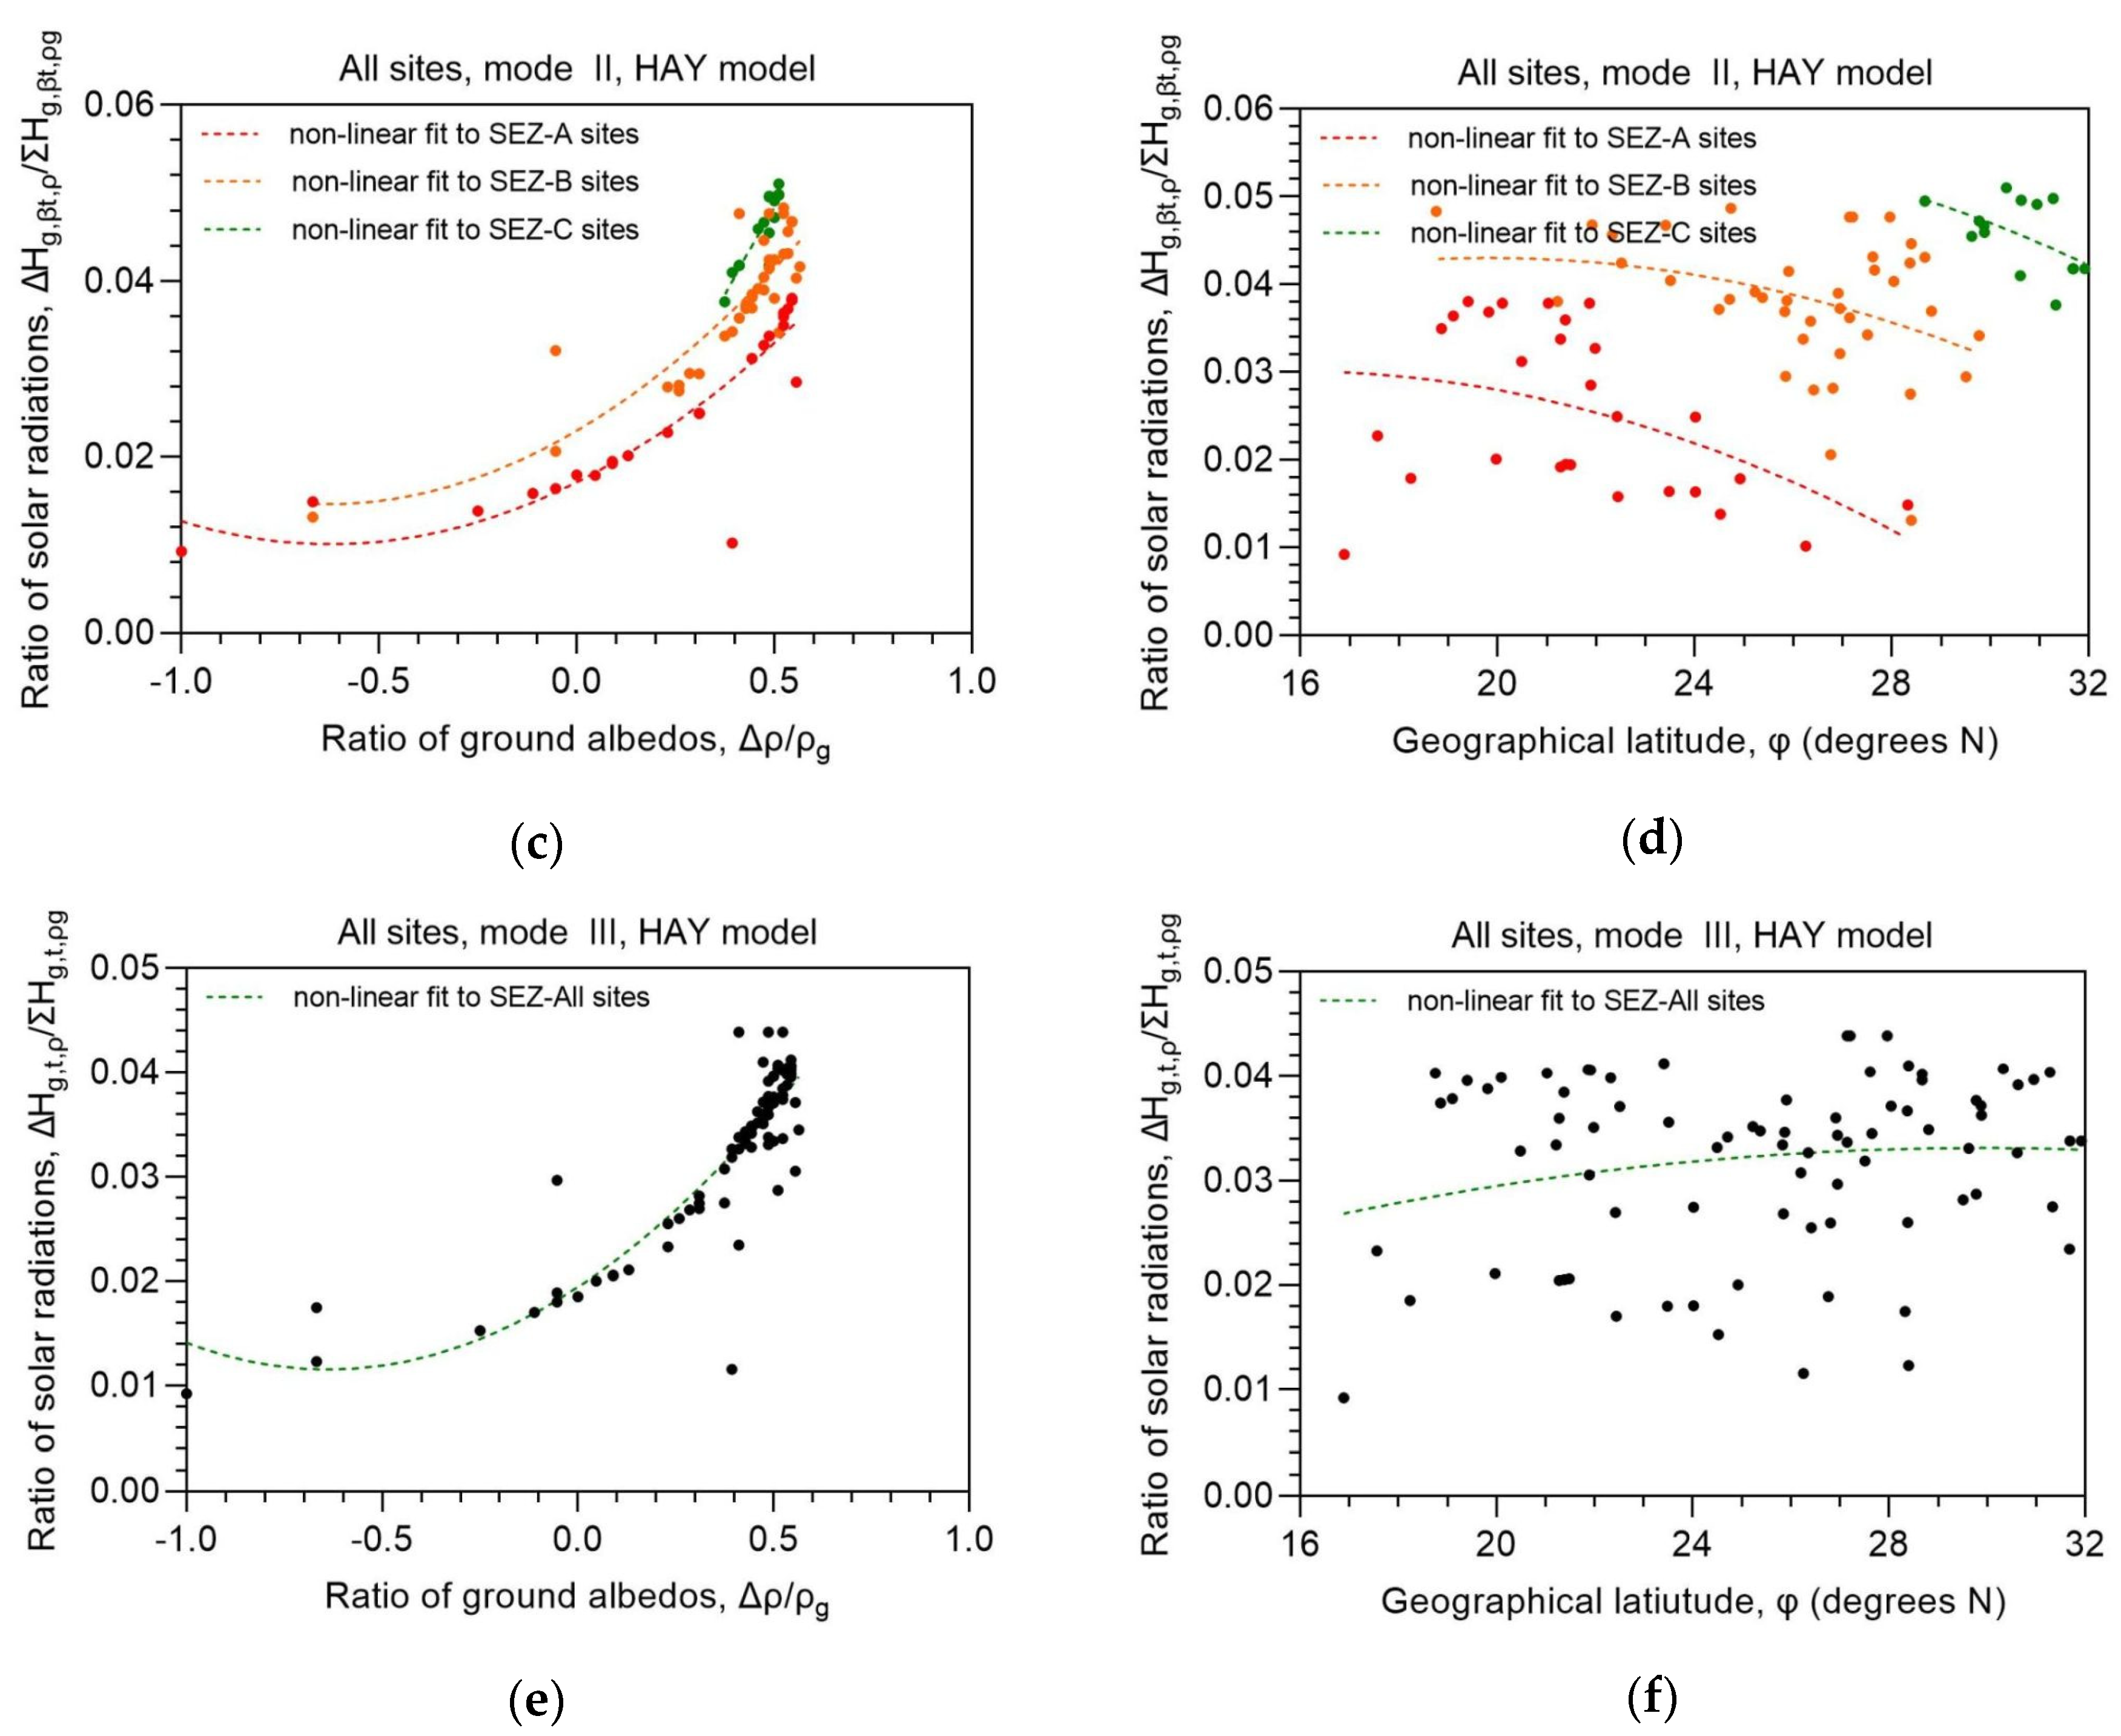
Figure 5 shows something different; taking into account the 3 solar energy zones (SEZ) introduced in [
15] for Saudi Arabia, especially for fixed-tilt and single-axis solar systems,
Figure 5a,c,e show the dependence of the ratio ΔH
g,i,ρ/ΣH
g,i,ρg on the ground-albedo ratio, Δρ
g/ρ
g = (ρ
g − ρ
g0)/ρ
g = (ρ
g − 0.2)/ρ
g. The meaning of these ratios is the following. The first indicates the contribution of the ground-reflected irradiation to the total tilted surface solar irradiation (SSR) at each site, as already said. The second implies something similar, i.e., it shows the contribution of a change in the ground albedo to the near-real one; ideally, this ratio should reflect the change from a fully absorbing surface to a near-real one, but in this case ρ
g0 = 0, and, therefore, Δρ
g/ρ
g = 1, which would not make sense in the plots. The ground-albedo value of 0.2 was utilised instead of ρ
g0, because this value has been used by many workers as reference. In the right panels of
Figure 5 the dependence of the ratio ΔH
g,i,ρ/ΣH
g,i,ρg on the geographical latitude of each site, φ, is shown; these plots were embedded in order to show the variation of the solar radiation ratios across all latitudes within Saudi Arabia.
Figure 5e,f do not make use of the SEZs because the receiving solar energy by a dual-axis solar system is independent from the location of the site [
17].
Another observation from
Figure 5 (left panels) is the quadratic growth of the ΔH
g,i,ρ/ΣH
g,i,ρg ratio with increasing Δρ/ρ
g in all 3 modes of operation. This outcome was anticipated; i.e., a greater change in the ground albedo causes a larger contribution of the ground-reflected radiation to the SSR on the tilted surface. Also, at the same Δρ/ρ
g ratio, progressively greater ΔH
g,i,ρ/ΣH
g,i,ρg ratios occur from sites in SEZ-A to sites within SEZ-C (applied to mode-I and -II solar systems, Figs. 5a, 5d). On the contrary, the variation of the ΔH
g,i,ρ/ΣH
g,i,ρg ratios in respect to the geographical latitude of the sites does not obey any strict formation (plots in the right panels of
Figure 5). This is so because the Δρ/ρ
g ratios are distributed all over Saudi Arabia without any preference to latitude. Consequently, when φ is used in the x-axis of the plots, the ground-albedo information is lost. Moreover, the percentage contribution of the ground-reflected radiation to the totally received SSR on the tilted plane varies between 0.015 (or 1.5%) and 0.045 (or 4.5%) for the various types of ground reflectance as seen from the best-fit curves in the left panels of
Figure 5. These values are considered small in the estimation of the tilted SSR on any type of operation, a result that is supported by the percentages mentioned in
Figure 3 (≈1.5%–≈3.5%). These results may conclude that if an average albedo value of 0.2 (the reference one) is used in such calculations, the associated error will be even smaller; in other words, the worker may not care about choosing the right albedo value for the calculations provided that he/she is aware that the ground albedo is not at extreme values (especially close to 1).
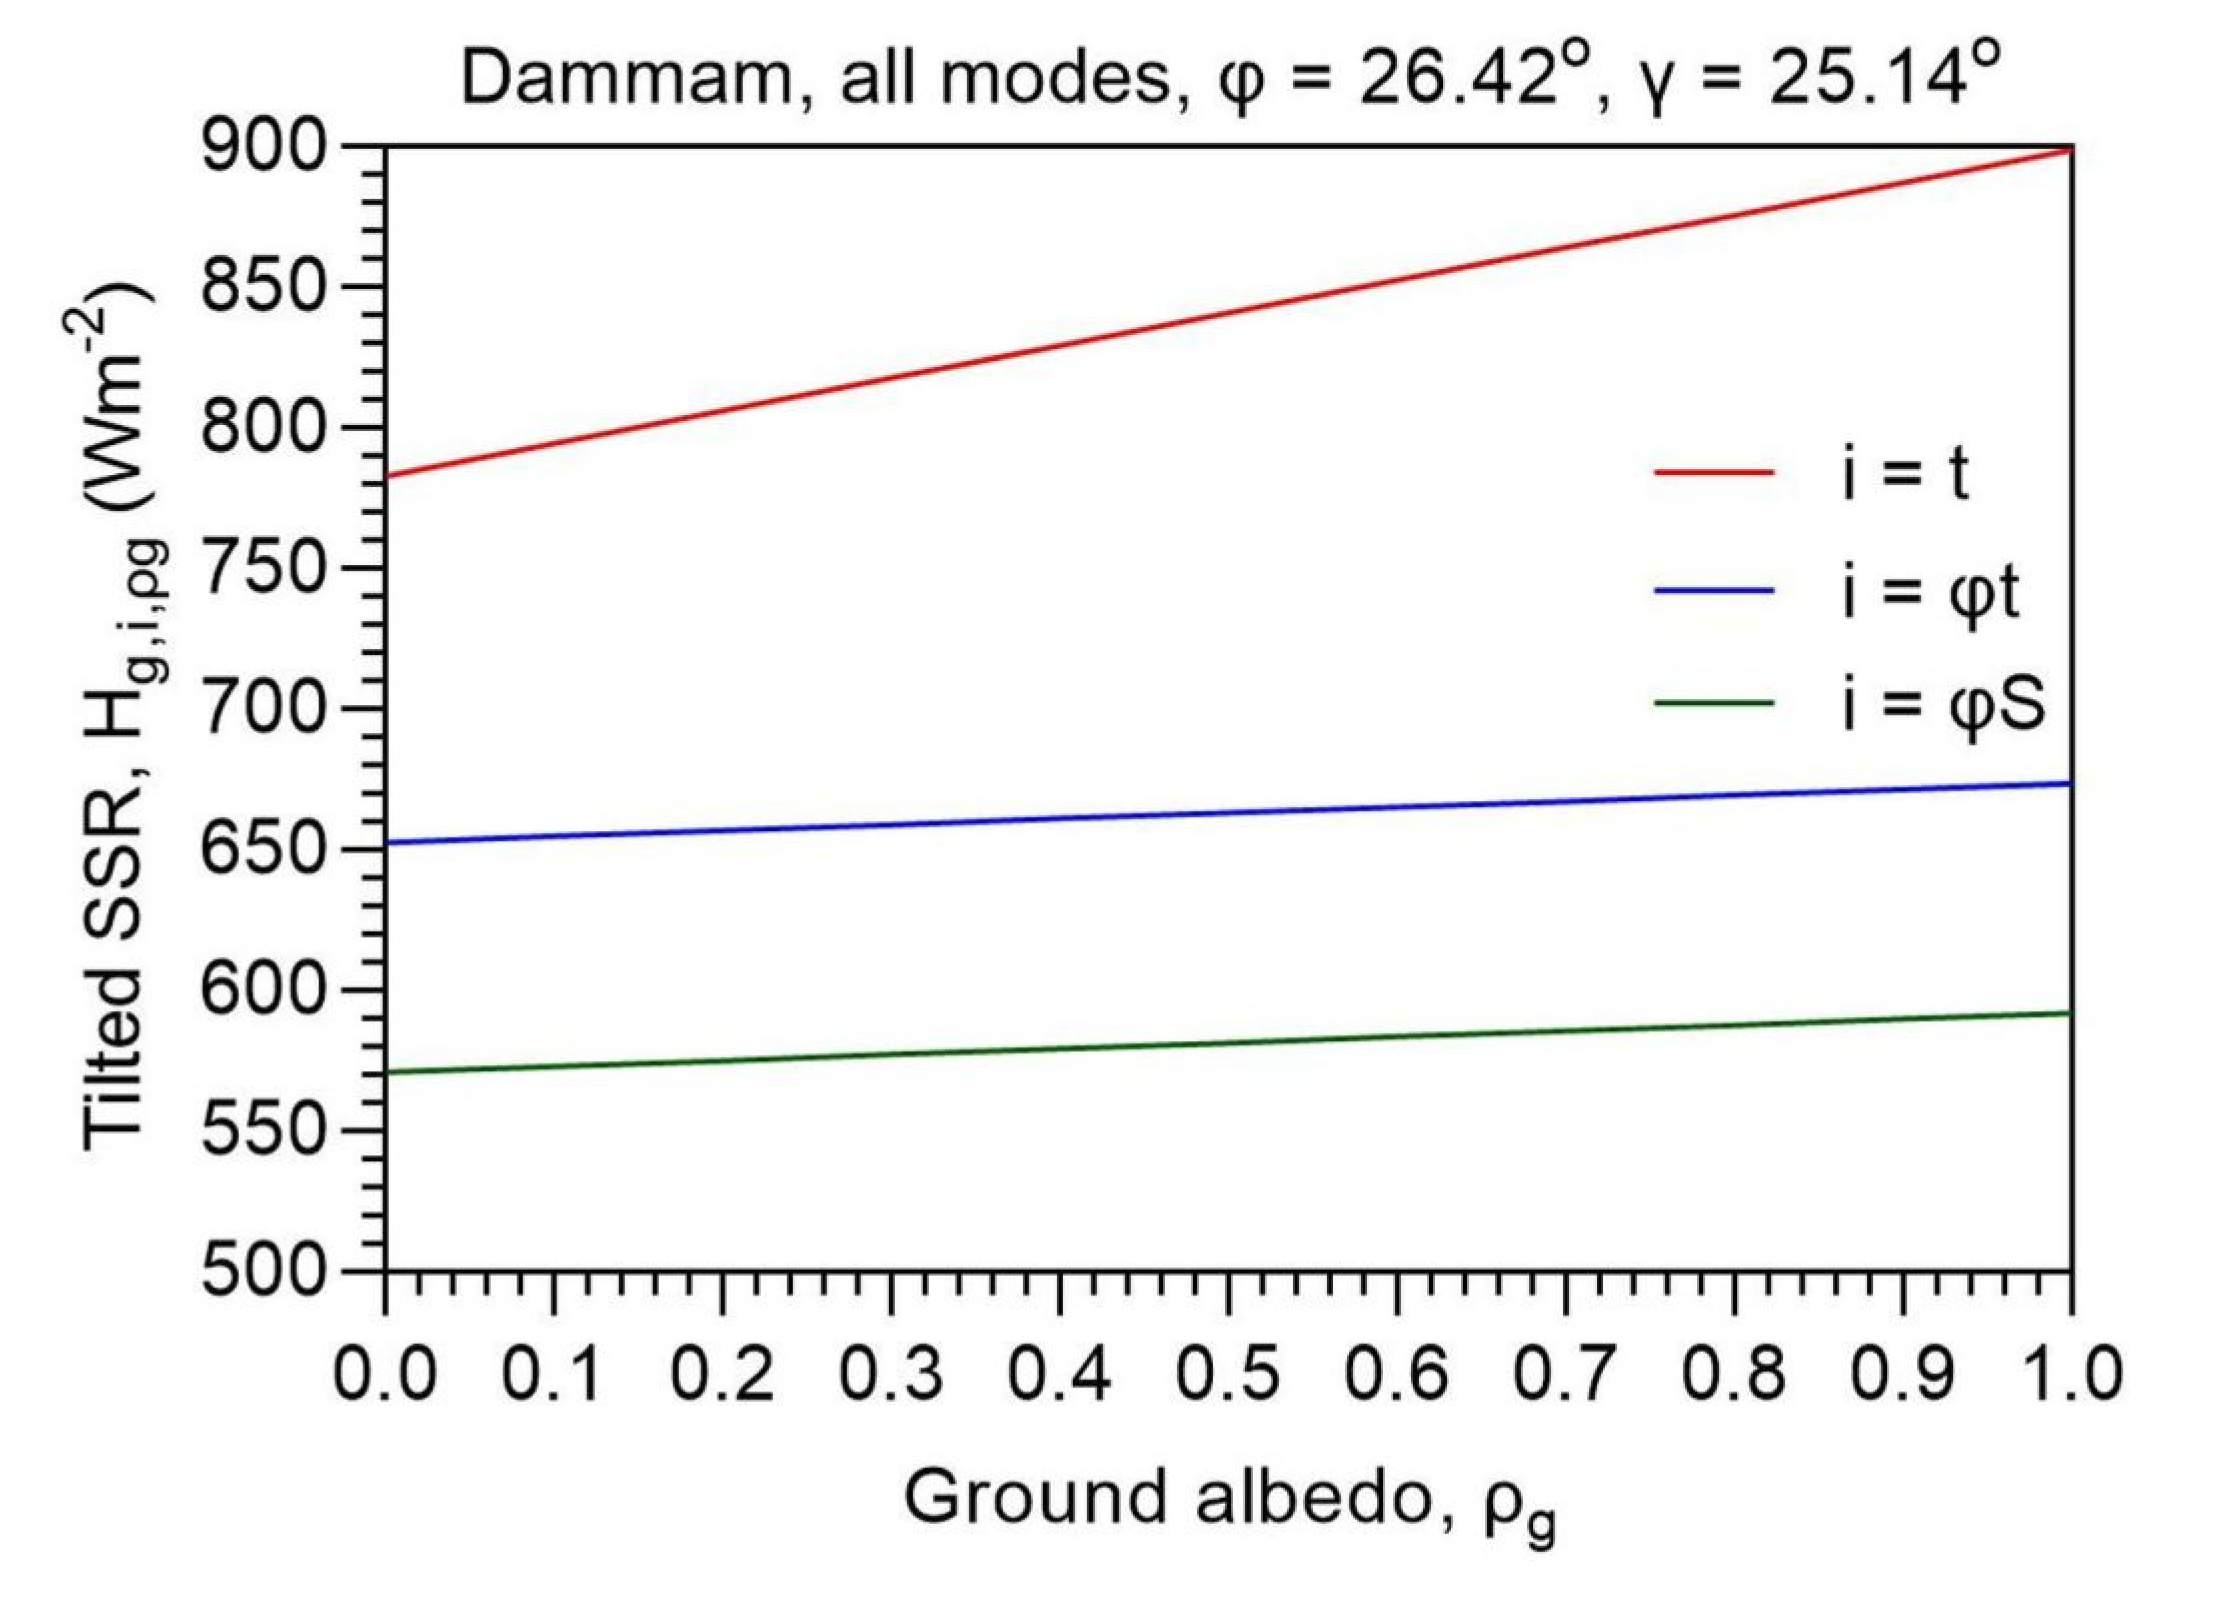
Appendix A deploys the instant variation of H
g,i,ρg vs. the geographical latitude of Dammam, φ, for a certain solar elevation, γ; i = φS, or φt, or t (the 3 modes of operation).
3.2. Results on Seasonal Basis
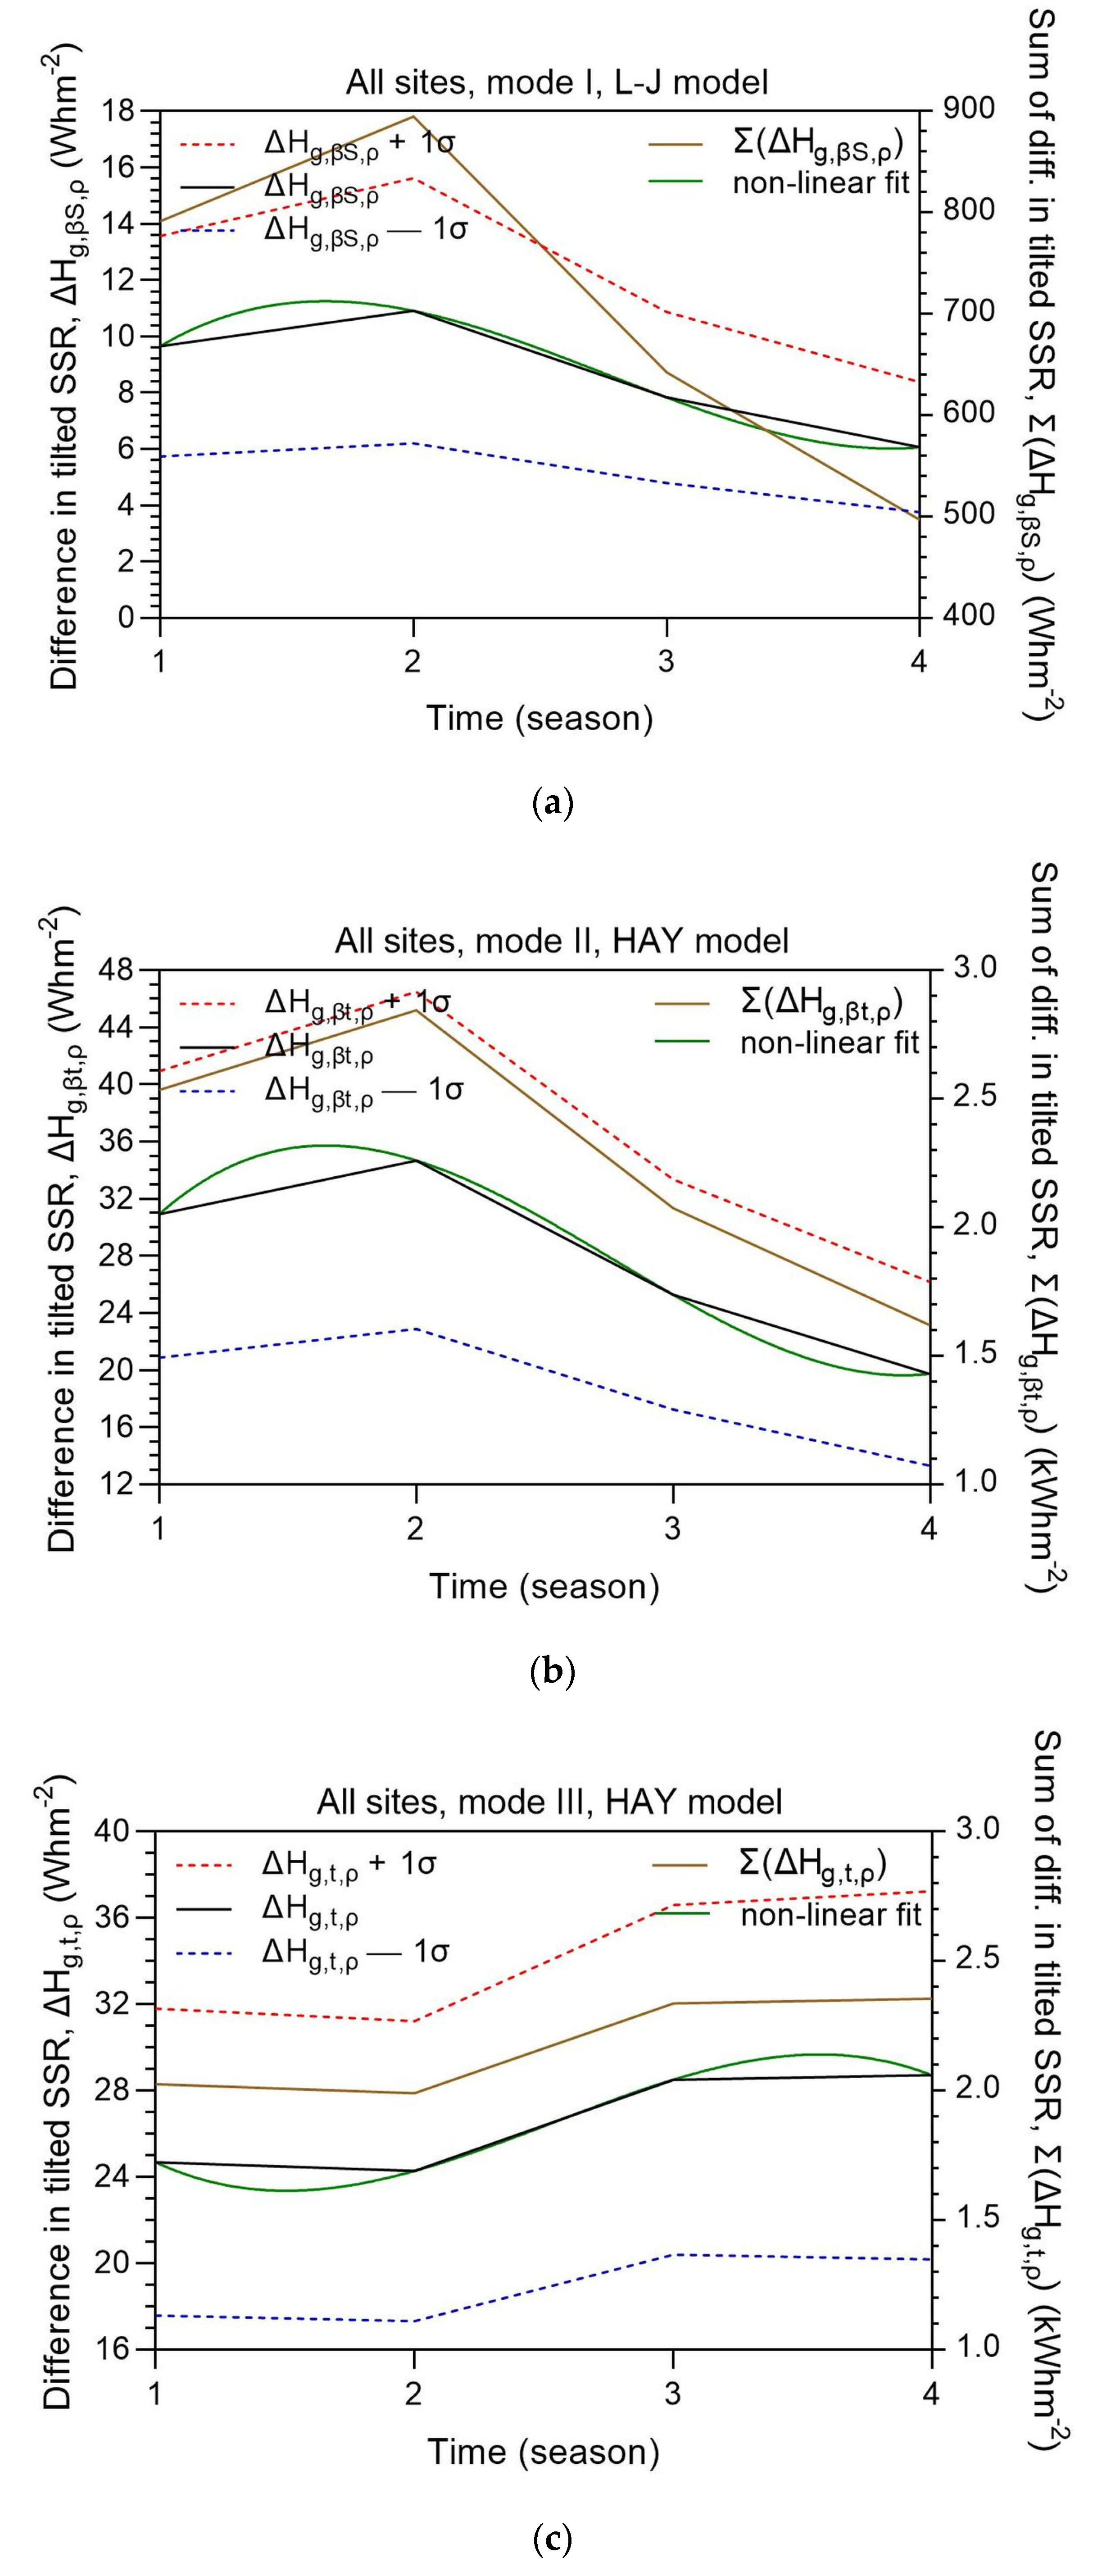
Figure 6 shows the seasonal mean variation of ΔH
g,i,ρ = H
g,i,ρg − H
g,i,0 for the 3 types of solar systems. Also indicated are the ±1σ bands and the non-linear best-fit curves. On the right y-axis the summation of the differences in the seasonal tilted solar energy received at all 82 sites, Σ(ΔH
g,i,ρ) = Σ(H
g,i,ρg − H
g,i,0), is also shown as additional information. All best-fit curves are well within the ±1σ band. Maximum ΔH
g,i values are found in the summer, except for a dual-axis solar system, which presents maximum values in the fall and winter. This is attributed to changes in the ground-albedo characteristics in these two seasons, i.e., by decreasing the albedo due to rainy periods, and lower solar altitudes. It is of particular attention the fact that this seasonal albedo variation affects only the performance of the double-axis solar systems; the only physical explanation is that a dual-axis solar system takes greater tilt angles in the fall and winter because of lower solar altitudes, an it, therefore, receives greater ground reflections. Fixed-tilt and single-axis solar systems seem not to be affected by changes in the ground-albedo value as they possess a constant tilt throughout the year. The regression equations for the best-fit curves to ΔH
g,i,ρ are given in
Table 3.
3.3. Results on Monthly Basis
This section is similar to 3.2, but it deals with the presentation of the monthly values. In this context,
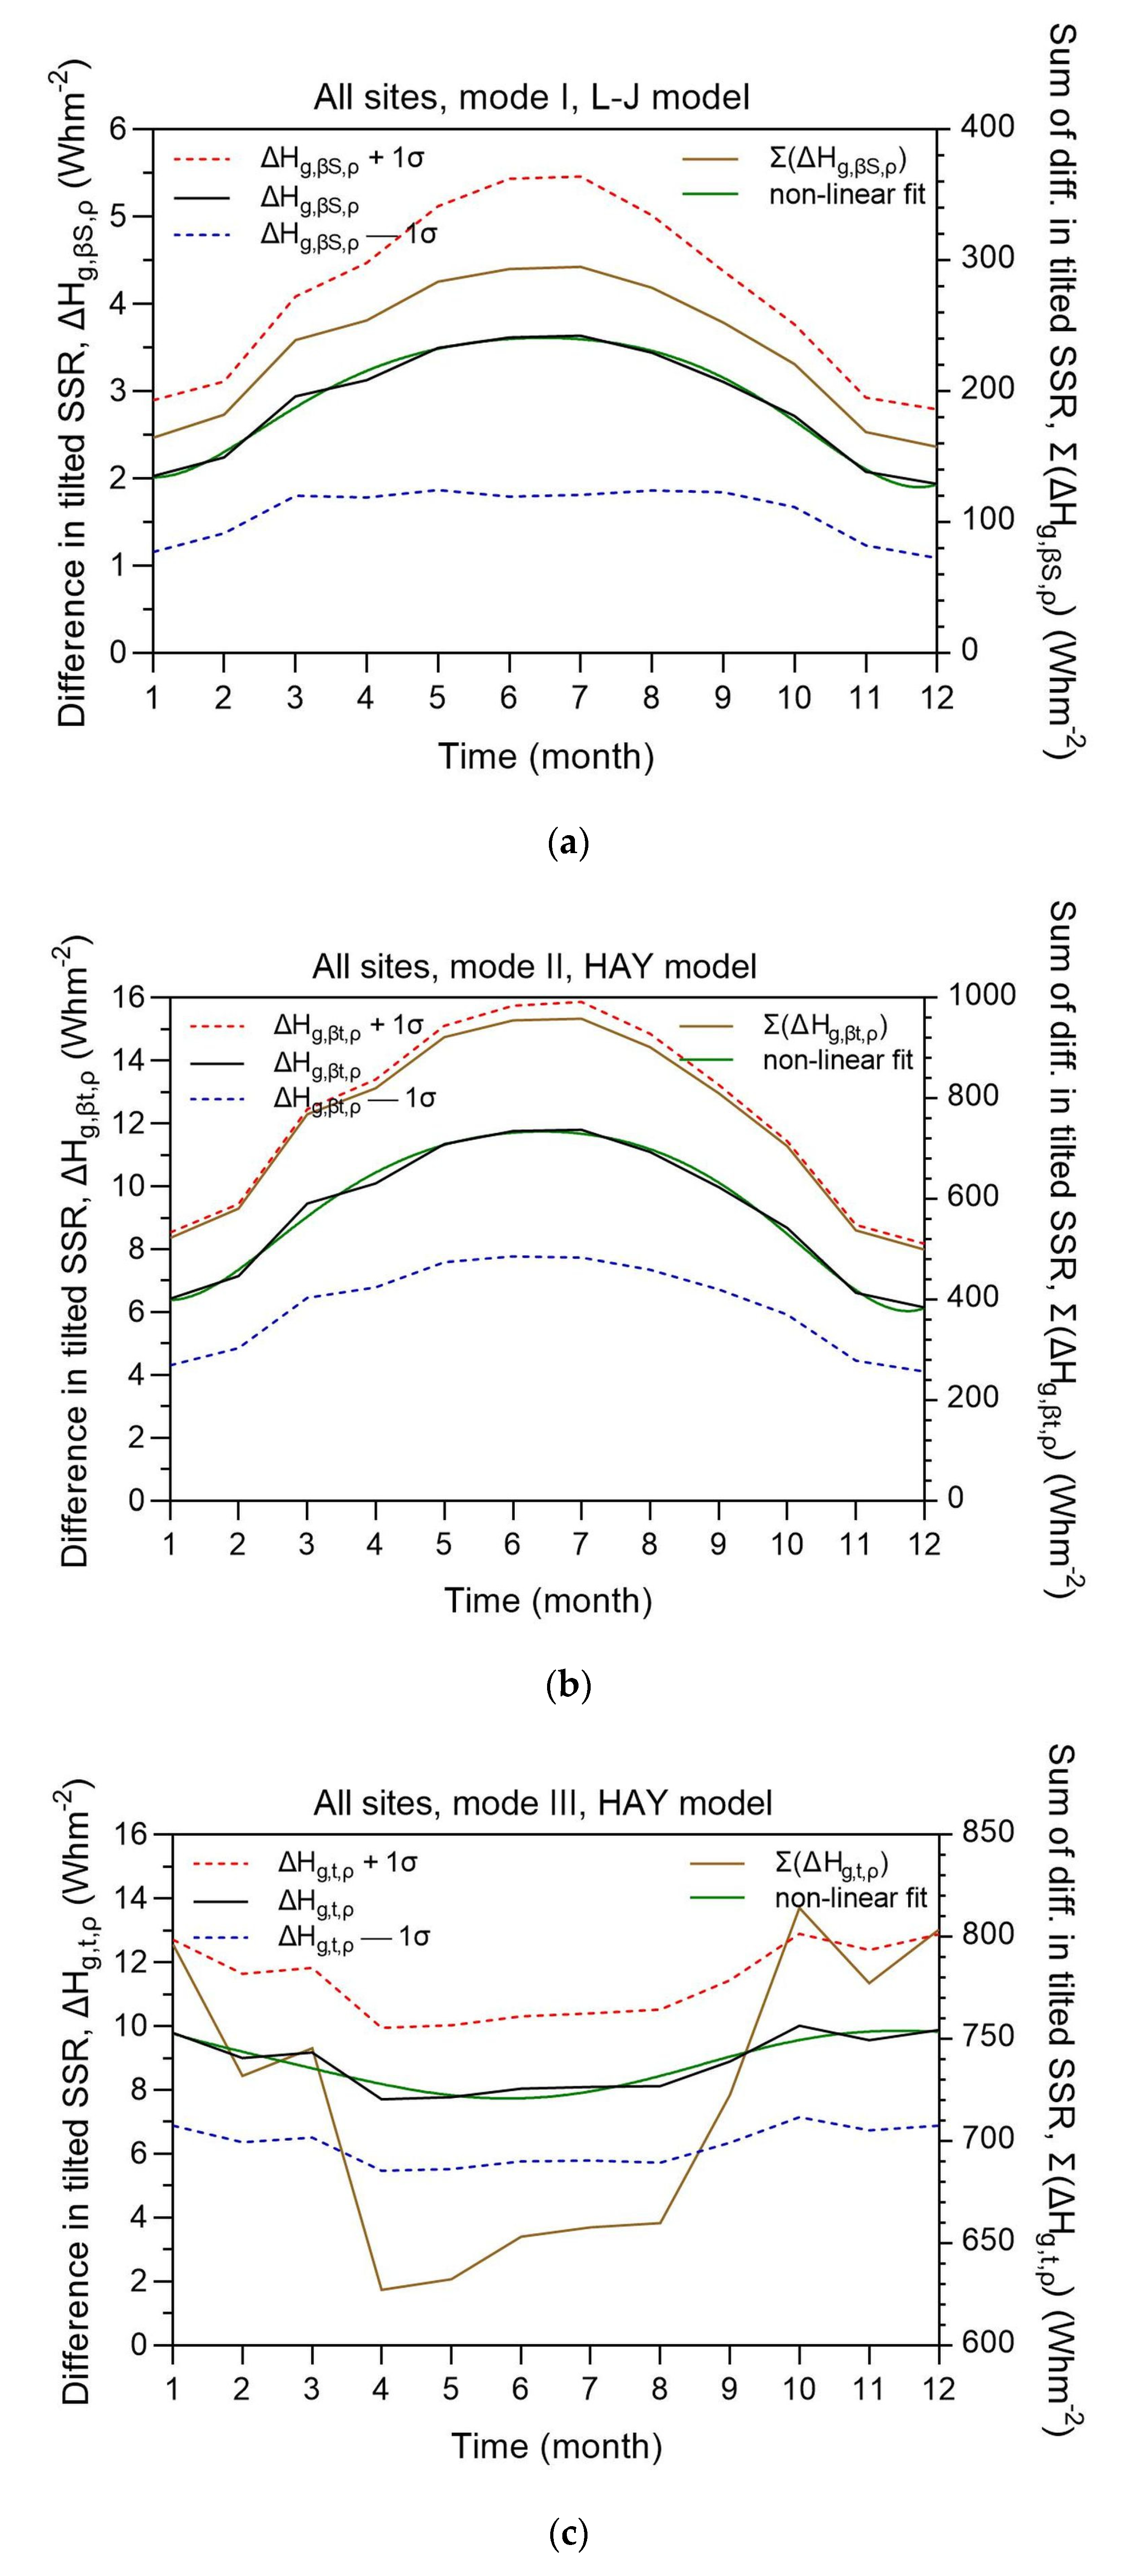
Figure 7 presents the intra-annual variation of ΔH
g,i,ρ = H
g,i,ρg − H
g,i,0 for the 3 types of solar systems. The ±1σ bands and the non-linear best-fit curves have also been added. On the right y-axis the summation of the differences in the monthly tilted solar energy received at all 82 sites, Σ(ΔH
g,i,ρ) = Σ(H
g,i,ρg − H
g,i,0), is also shown as additional information. All best-fit curves lie well within the ±1σ band. Maximum ΔH
g,i,ρ values occur in June-July, except for a dual-axis solar system, which presents minimum values in these months, i.e., a completely opposite intra-annual variation to that for mode-I and -II solar systems. The explanation for this behaviour is the same with that given for the seasonal variation of ΔH
g,i,ρ. However, more detailed information is provided here. The Σ(ΔH
g,t,ρ) curve shows lower values in the period of April-August, a period where air temperature rises and the ground is becoming drier and drier, thus potentially increasing its reflectance and yielding higher Σ(ΔH
g,t,ρ) values. It seems that this not the case; frequent thunderstorms may give torrential rainfalls during the summer monsoons in the south-western and central parts of Saudi Arabia [
34], thus decreasing the ground albedo dramatically. These rainfalls leave their imprint in the overall ground albedo behaviour, which affects the performance of mode-III solar installations. Please, recall that the albedo of a wet ground is smaller than when it is dry [
35]. Moreover, a double-axis solar system operates at greater tilt angles in the fall and winter because of lower solar altitudes, and it, therefore, receives higher ground reflections. On the contrary, fixed-tilt and one-axis solar systems seem not to be affected by changes in the local ground-albedo value as they possess a constant tilt throughout the year. (
Figure A1 in
Appendix A demonstrates this result in a rather theoretical way). The regression equations for the best-fit curves to ΔH
g,i,ρ are given in
Table 4.
3.4. Additional Results
This section includes plots that were not presented in earlier sections.
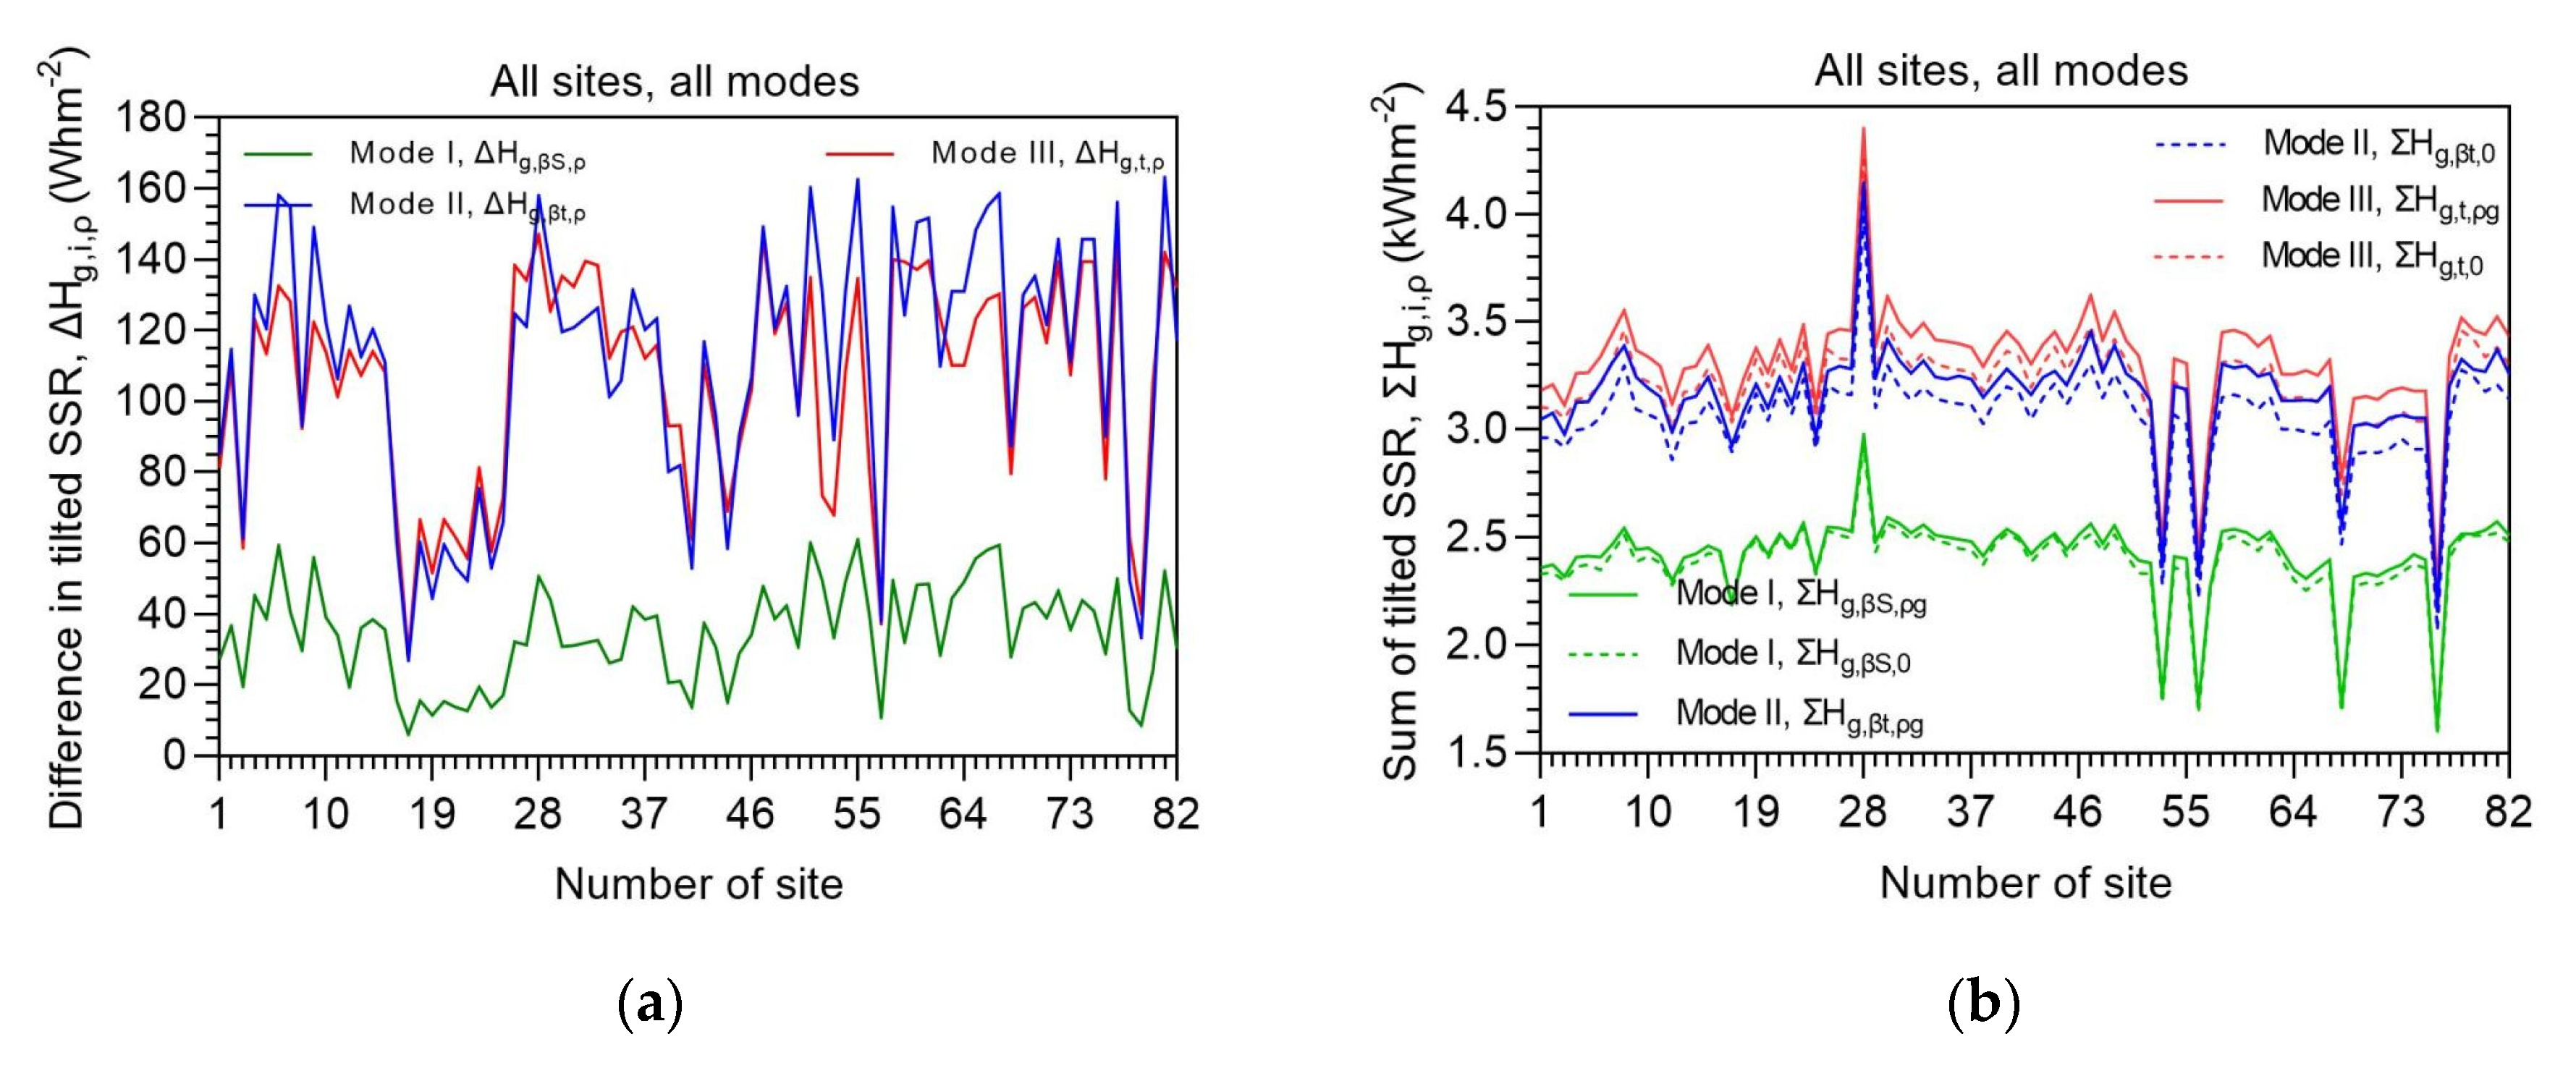
Figure 8a refers to the annual values of ΔH
g,i,ρ along all 82 sites and 3 modes with an aim to show how the difference H
g,i,ρg − H
g,i,0 varies across Saudi Arabia. The actual annual solar energy received on the tilted surfaces at the 82 sites is shown in
Figure 8b. From
Figure 8a it is seen that the differences ΔH
g,i,ρ become greater from mode-I to mode-III solar systems used for solar harvesting. As explained earlier in
Figure 3, and it is confirmed here too, the contribution of the ground-reflected radiation to the solar radiation on a fixed-tilt solar system is little, at least for mid-latitudes sites. On the contrary, these reflections become more important and are of comparable magnitude in the case of a single- or a double-axis solar system. This outcome is also confirmed by the comparable amount of the total received solar energy on a one- or a two-axis solar system (cf.
Figure 8b).
Since all analyses in this work have to do with the ground-albedo variation and its influence on the solar energy received by a tilted solar system installed in Saudi Arabia, it is self-explanatory that graphs showing this variation should be expected to be presented.
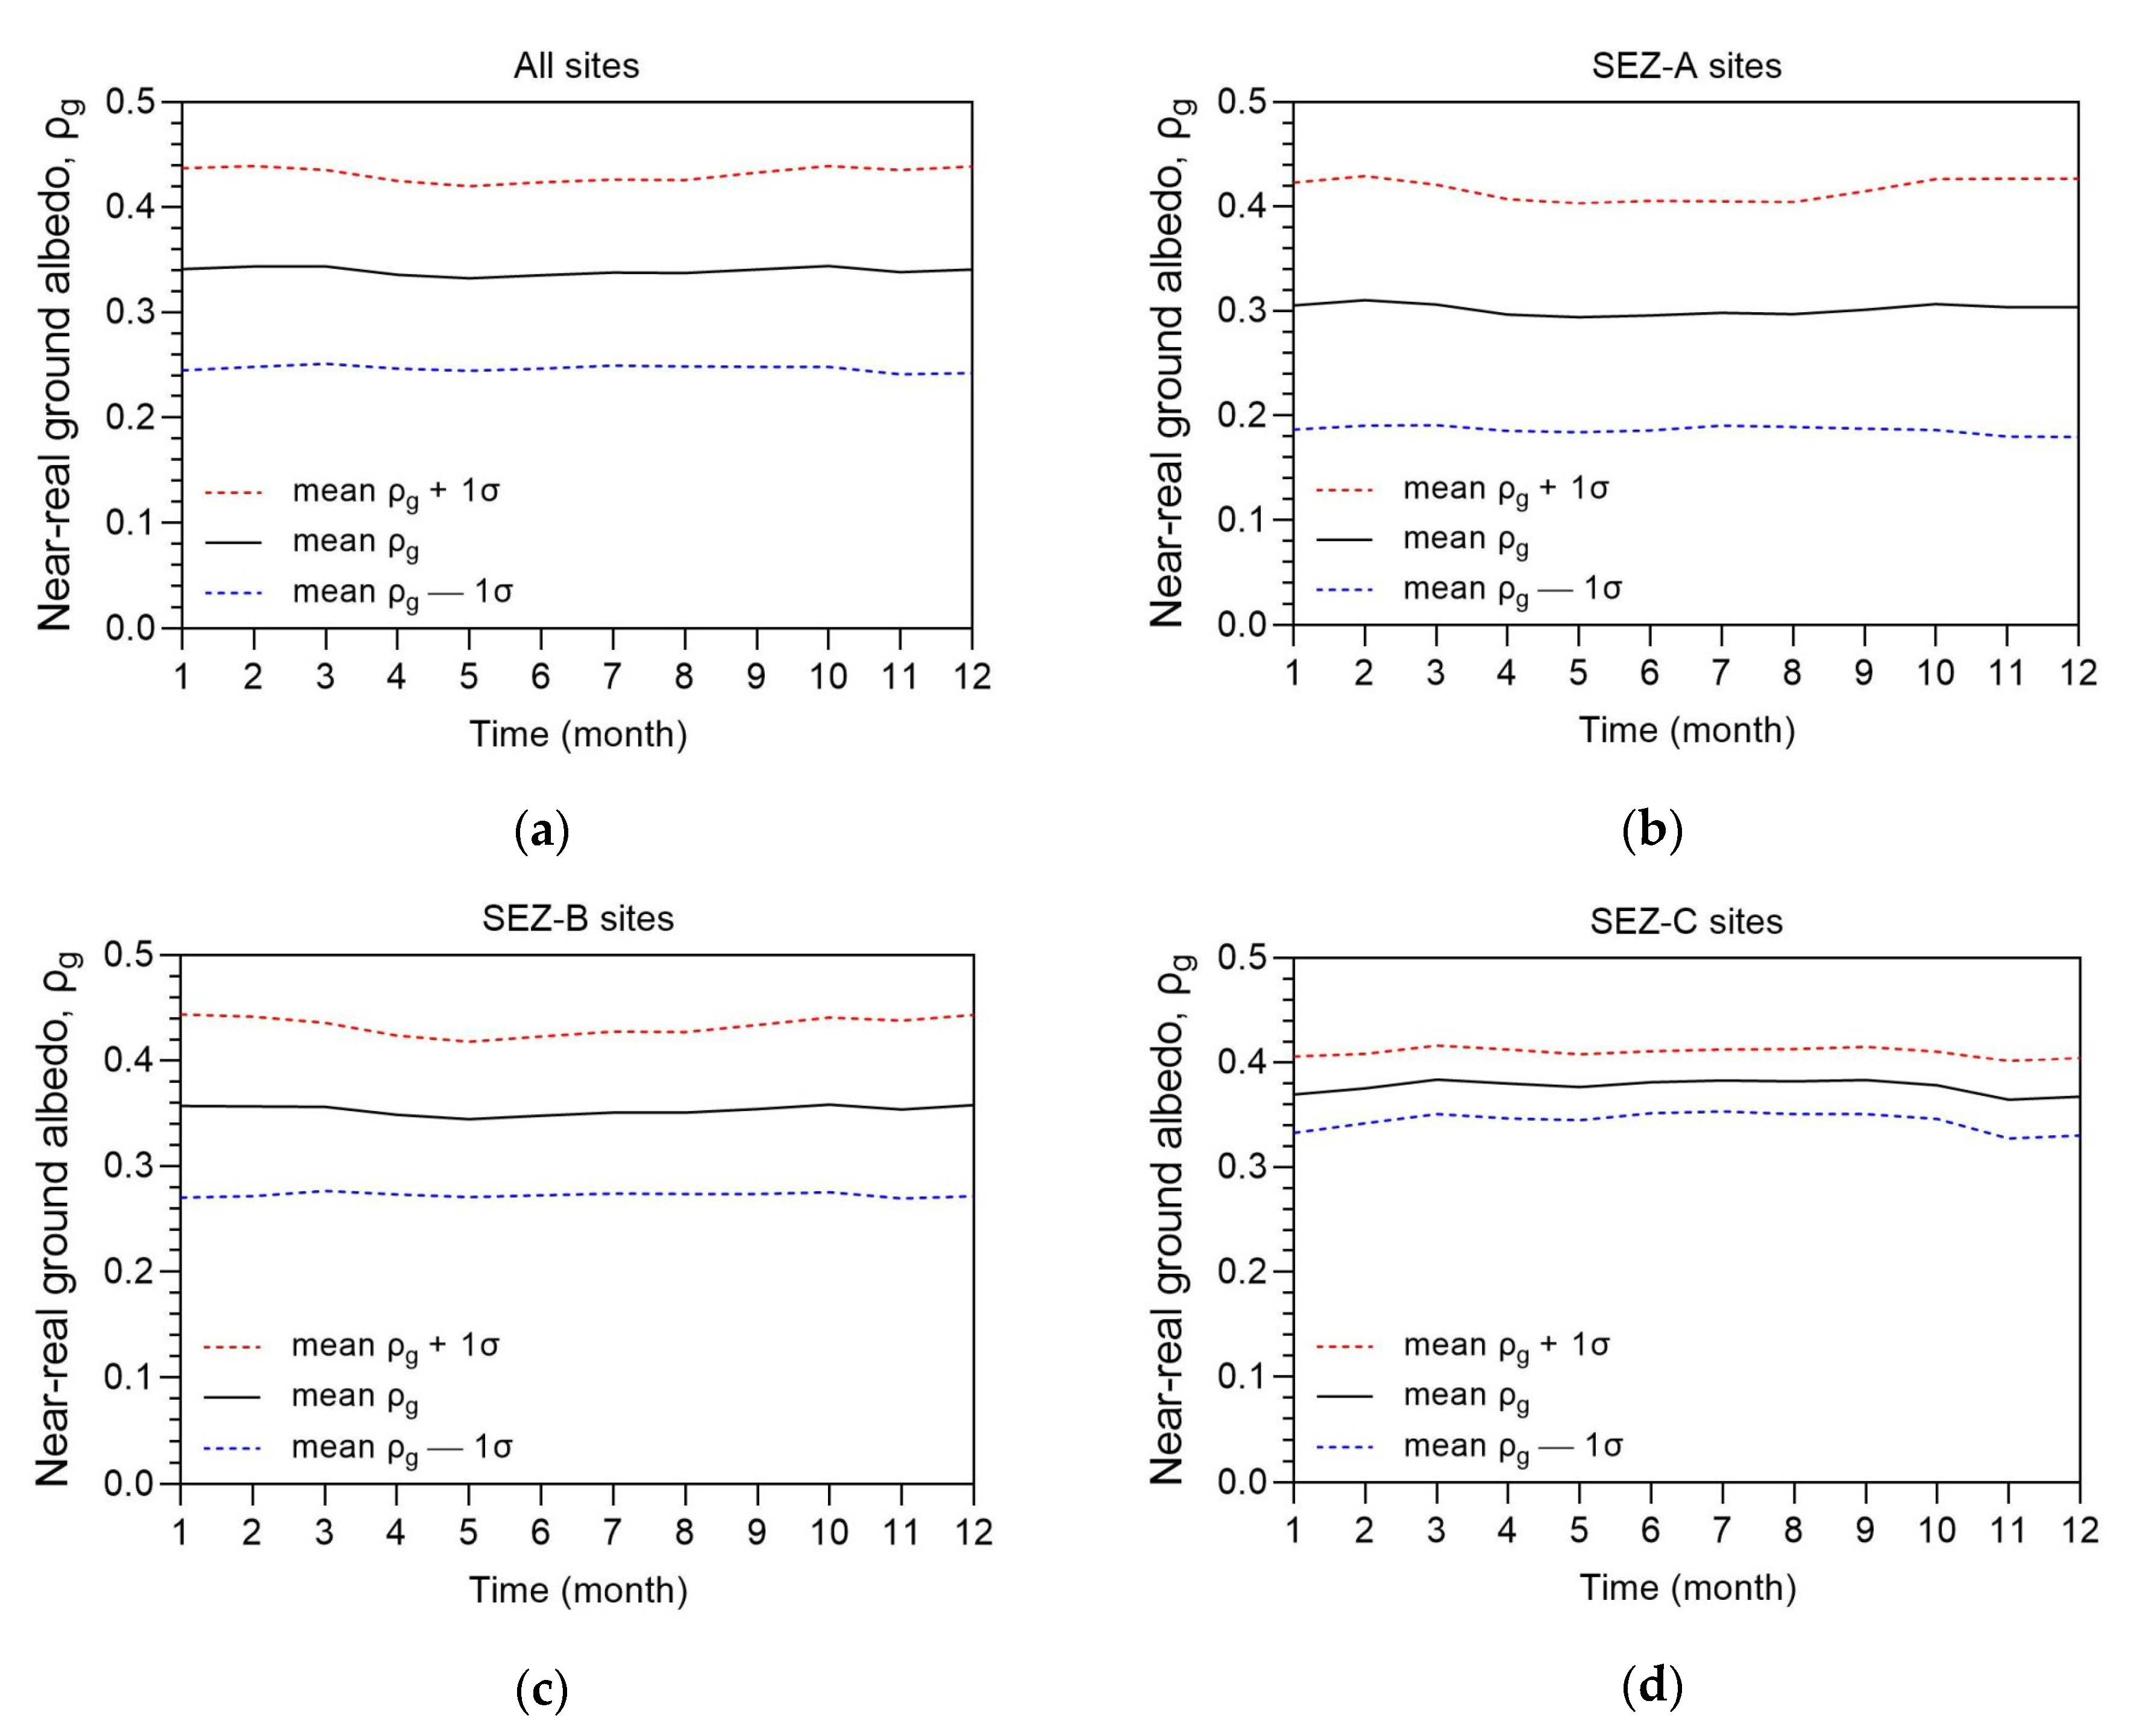
Figure 9, therefore, presents the intra-annual variation of ρ
g by taking into account the sites that belong to the individual SEZs, too. It is seen that the mean ground albedo does not change drastically over the year in any SEZ region (Figs. 9b-9c) or the country as a whole (
Figure 9a). Nevertheless, the wide ±1σ bands imply great variability in ρ
g, as can be confirmed by
Figure 3. The smaller standard-deviation band in
Figure 9d may be due to fewer sites belonging to the SEZ C and/or different patterns in the north-eastern region of Saudi Arabia [
34]. On the other hand, the behaviour of ρ
g in the SEZ-C region is a bit different than that in the other three; a little bit higher ρ
g values occur from March to October in contrast to a little bit lower ρ
g ones in the SEZ-A and SEZ-B cases.
In relation to the above observations about the intra-annual variation of ρ
g, one might be interested to see the dependence of ΔH
g,i,ρ on ρ
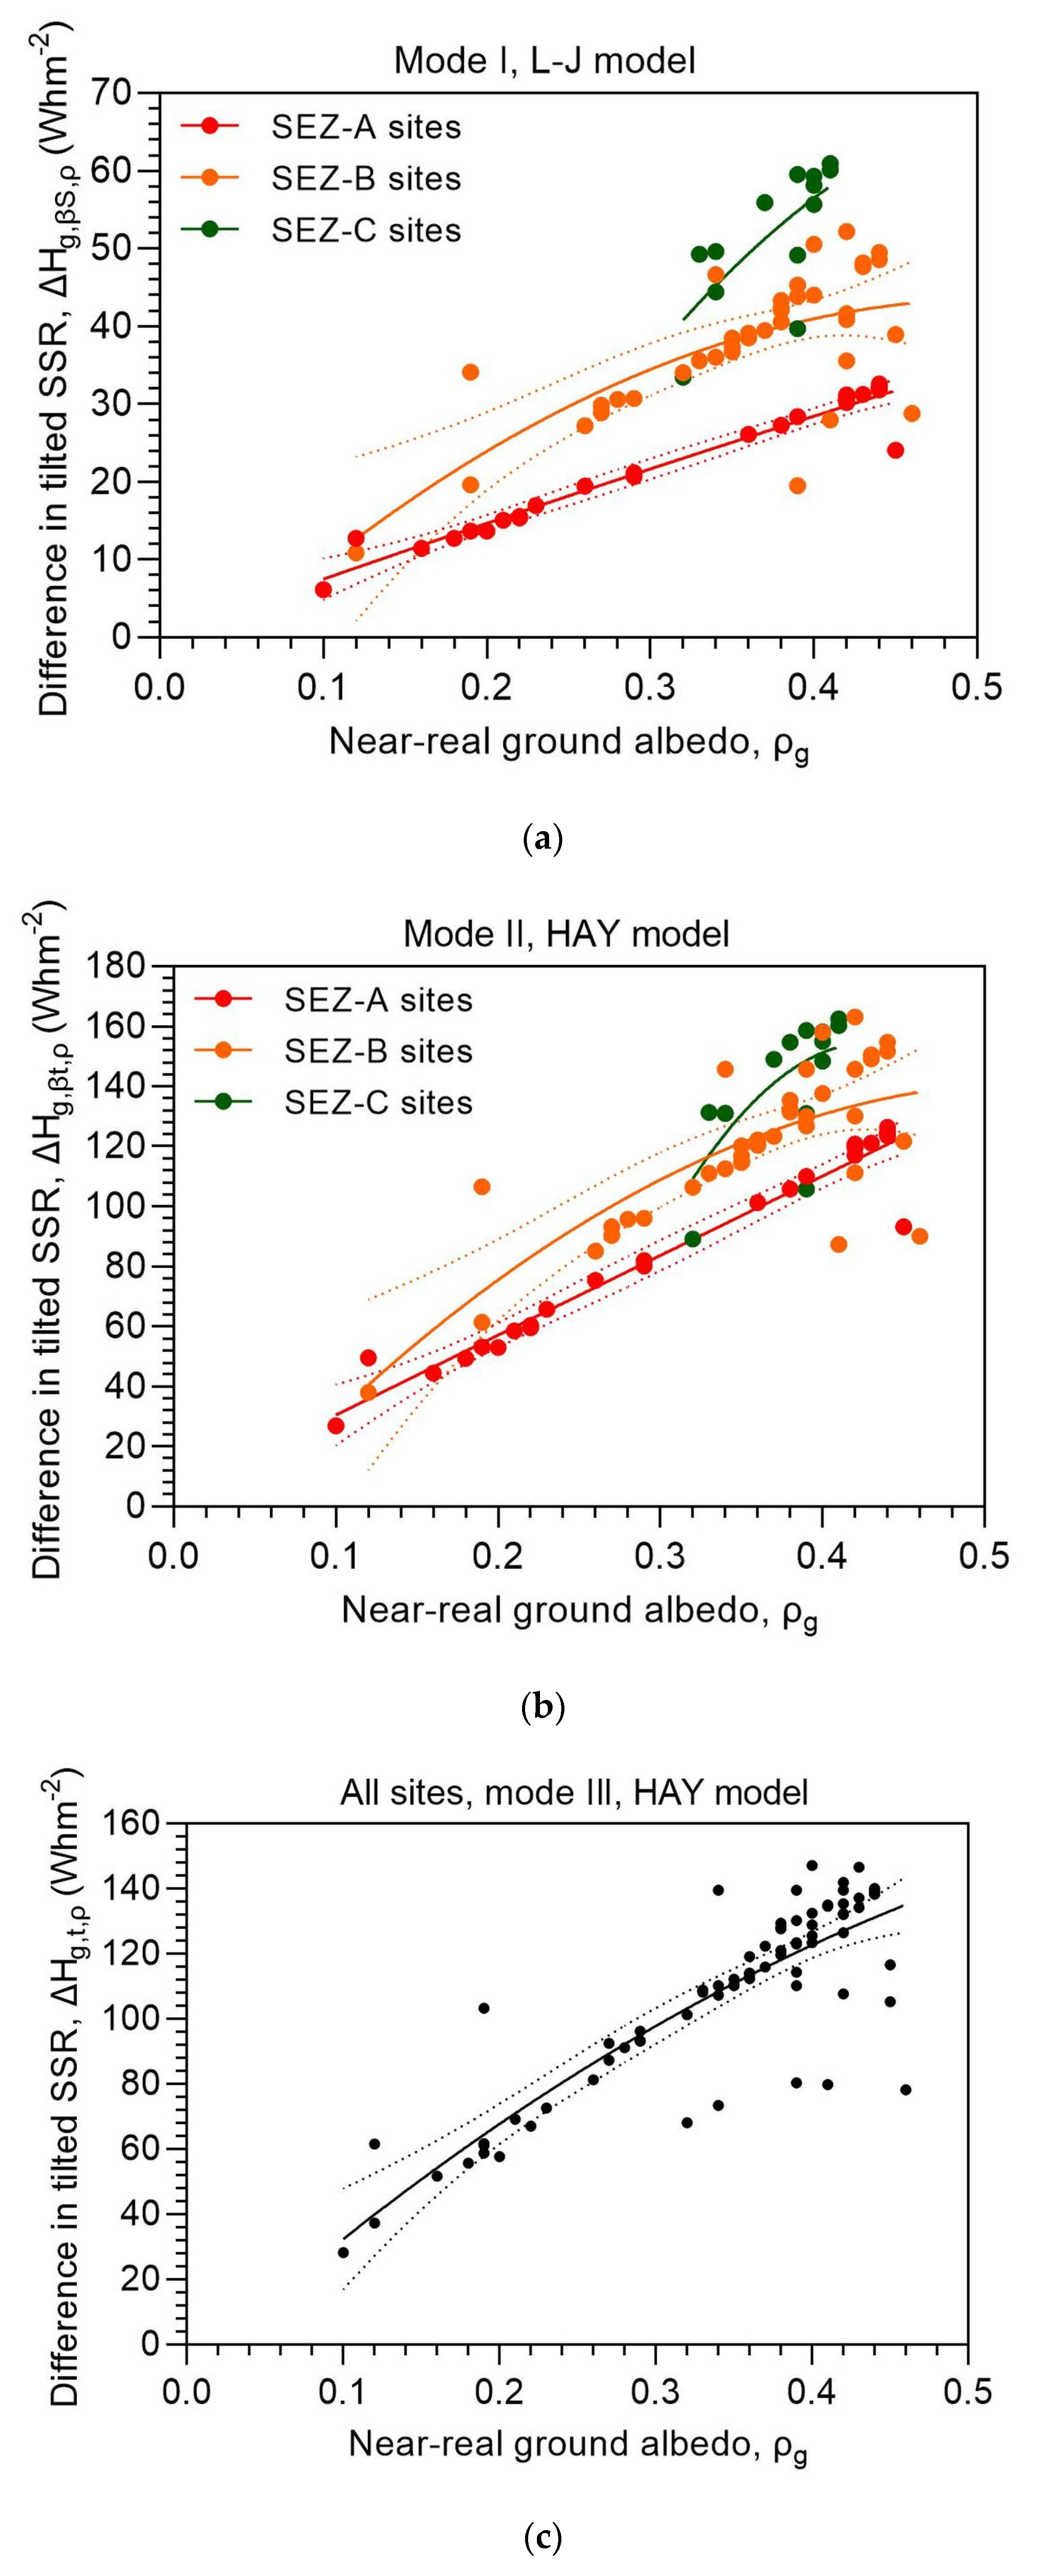
g.
Figure 10 shows this dependence, which has a quadratic behaviour for the best-fit curves to the data pairs (ΔH
g,i,ρ, ρ
g). The 95% confidence interval is also shown; it is seen that most (ΔH
g,i,ρ, ρ
g) data pairs fall in this interval, a fact that implies a high accuracy of the model. The only exception is for the SEZ-C sites, which all lie within this band, as the 95% confidence interval is very wide, and for this reason it is not shown in the plots.
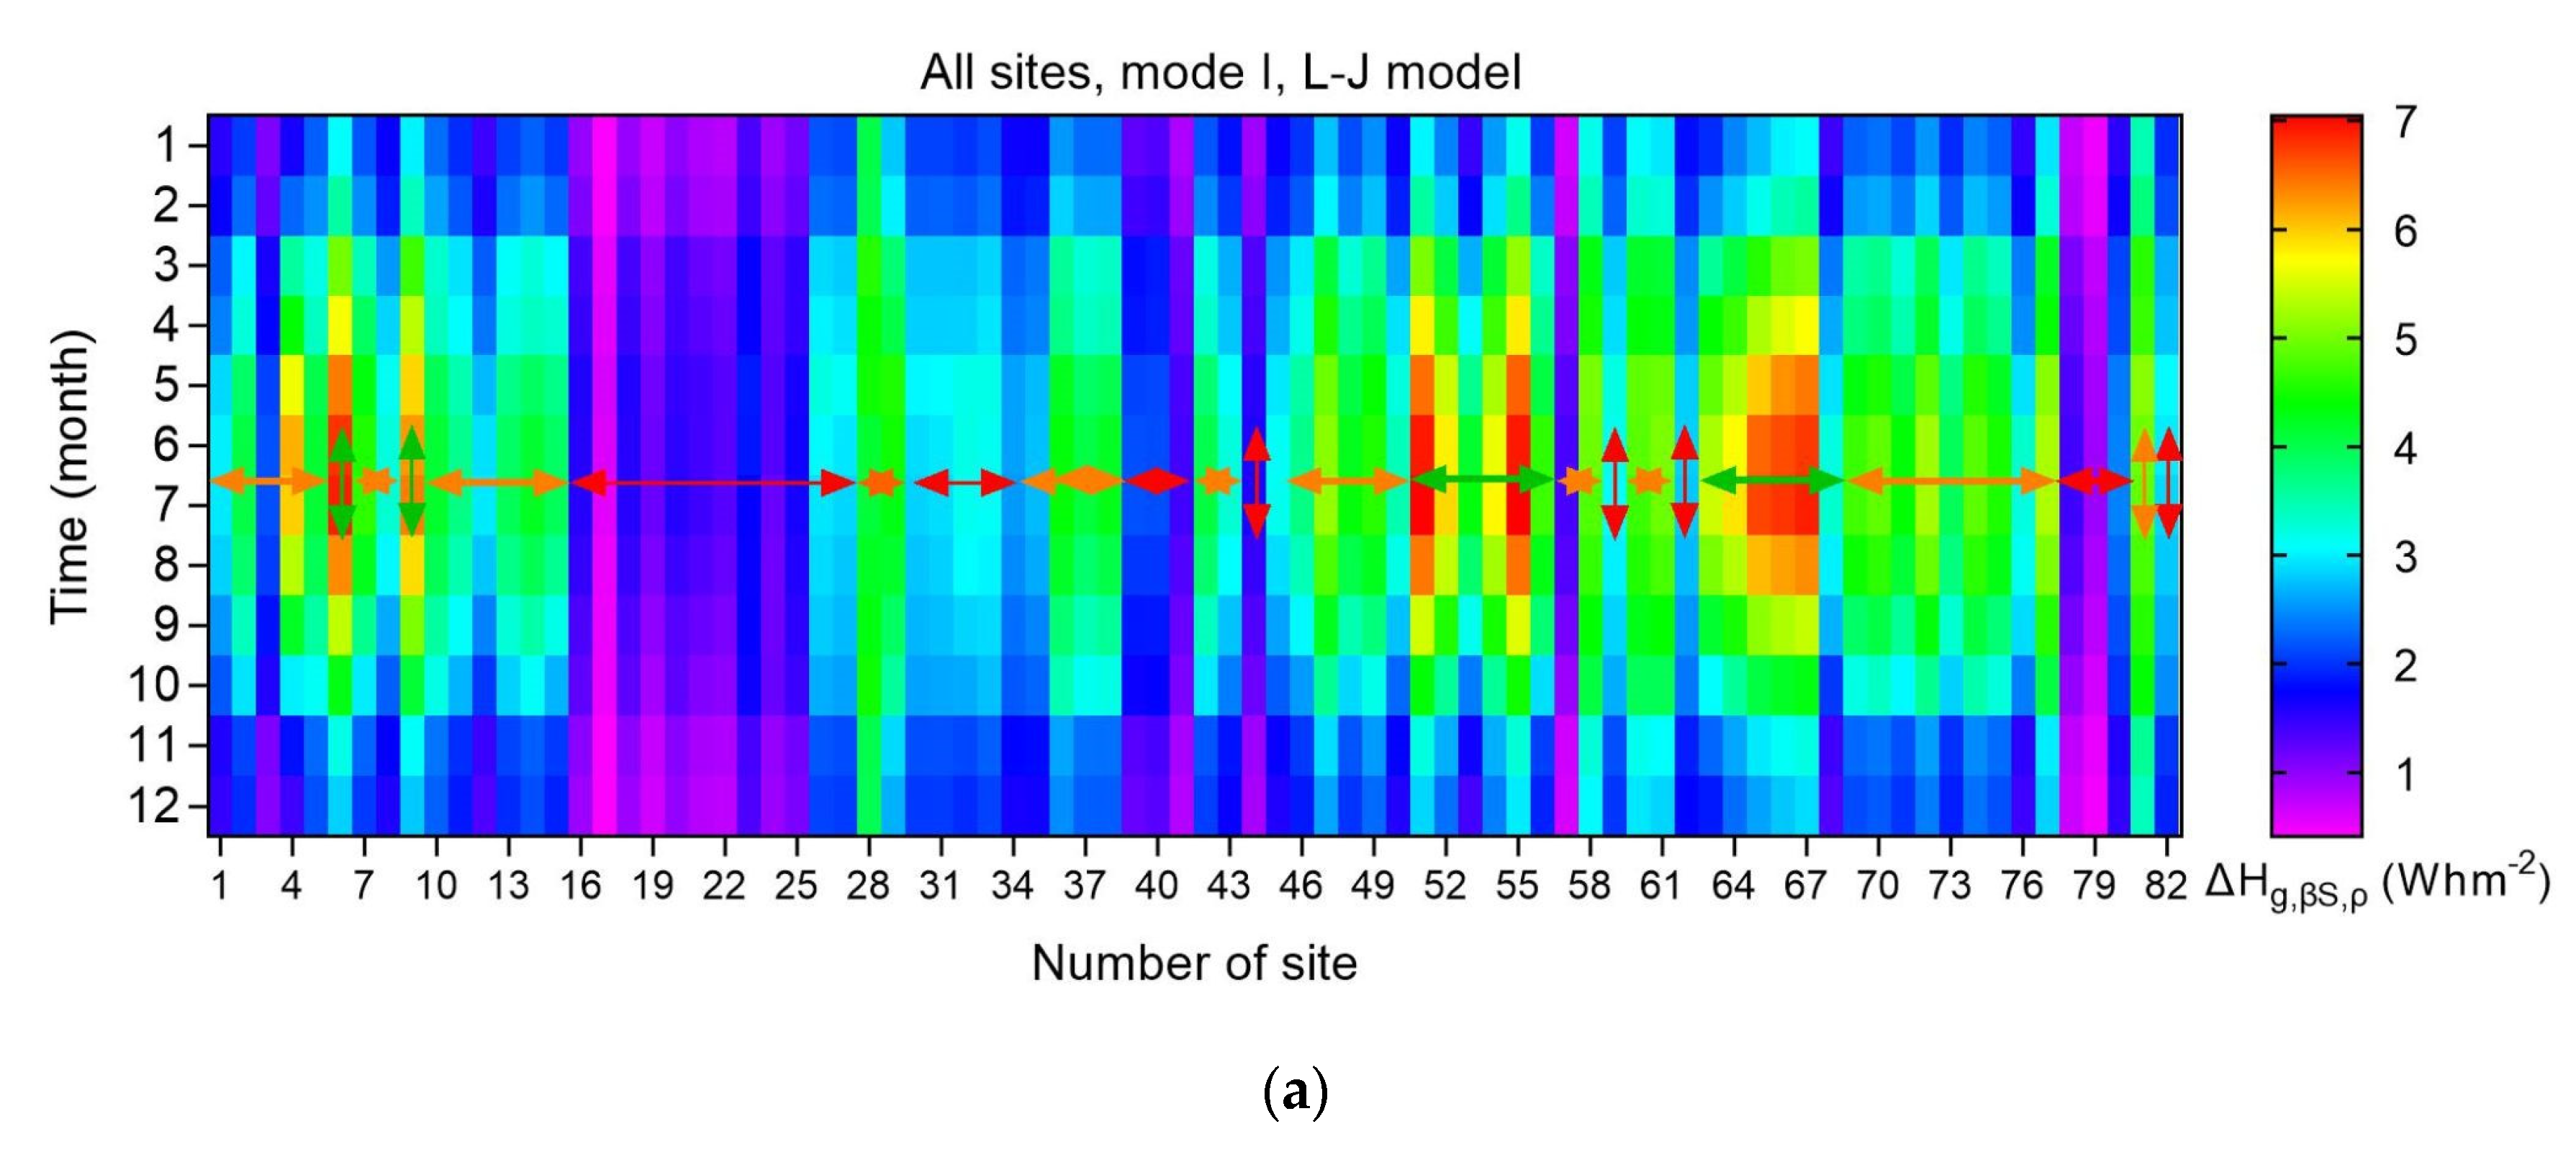
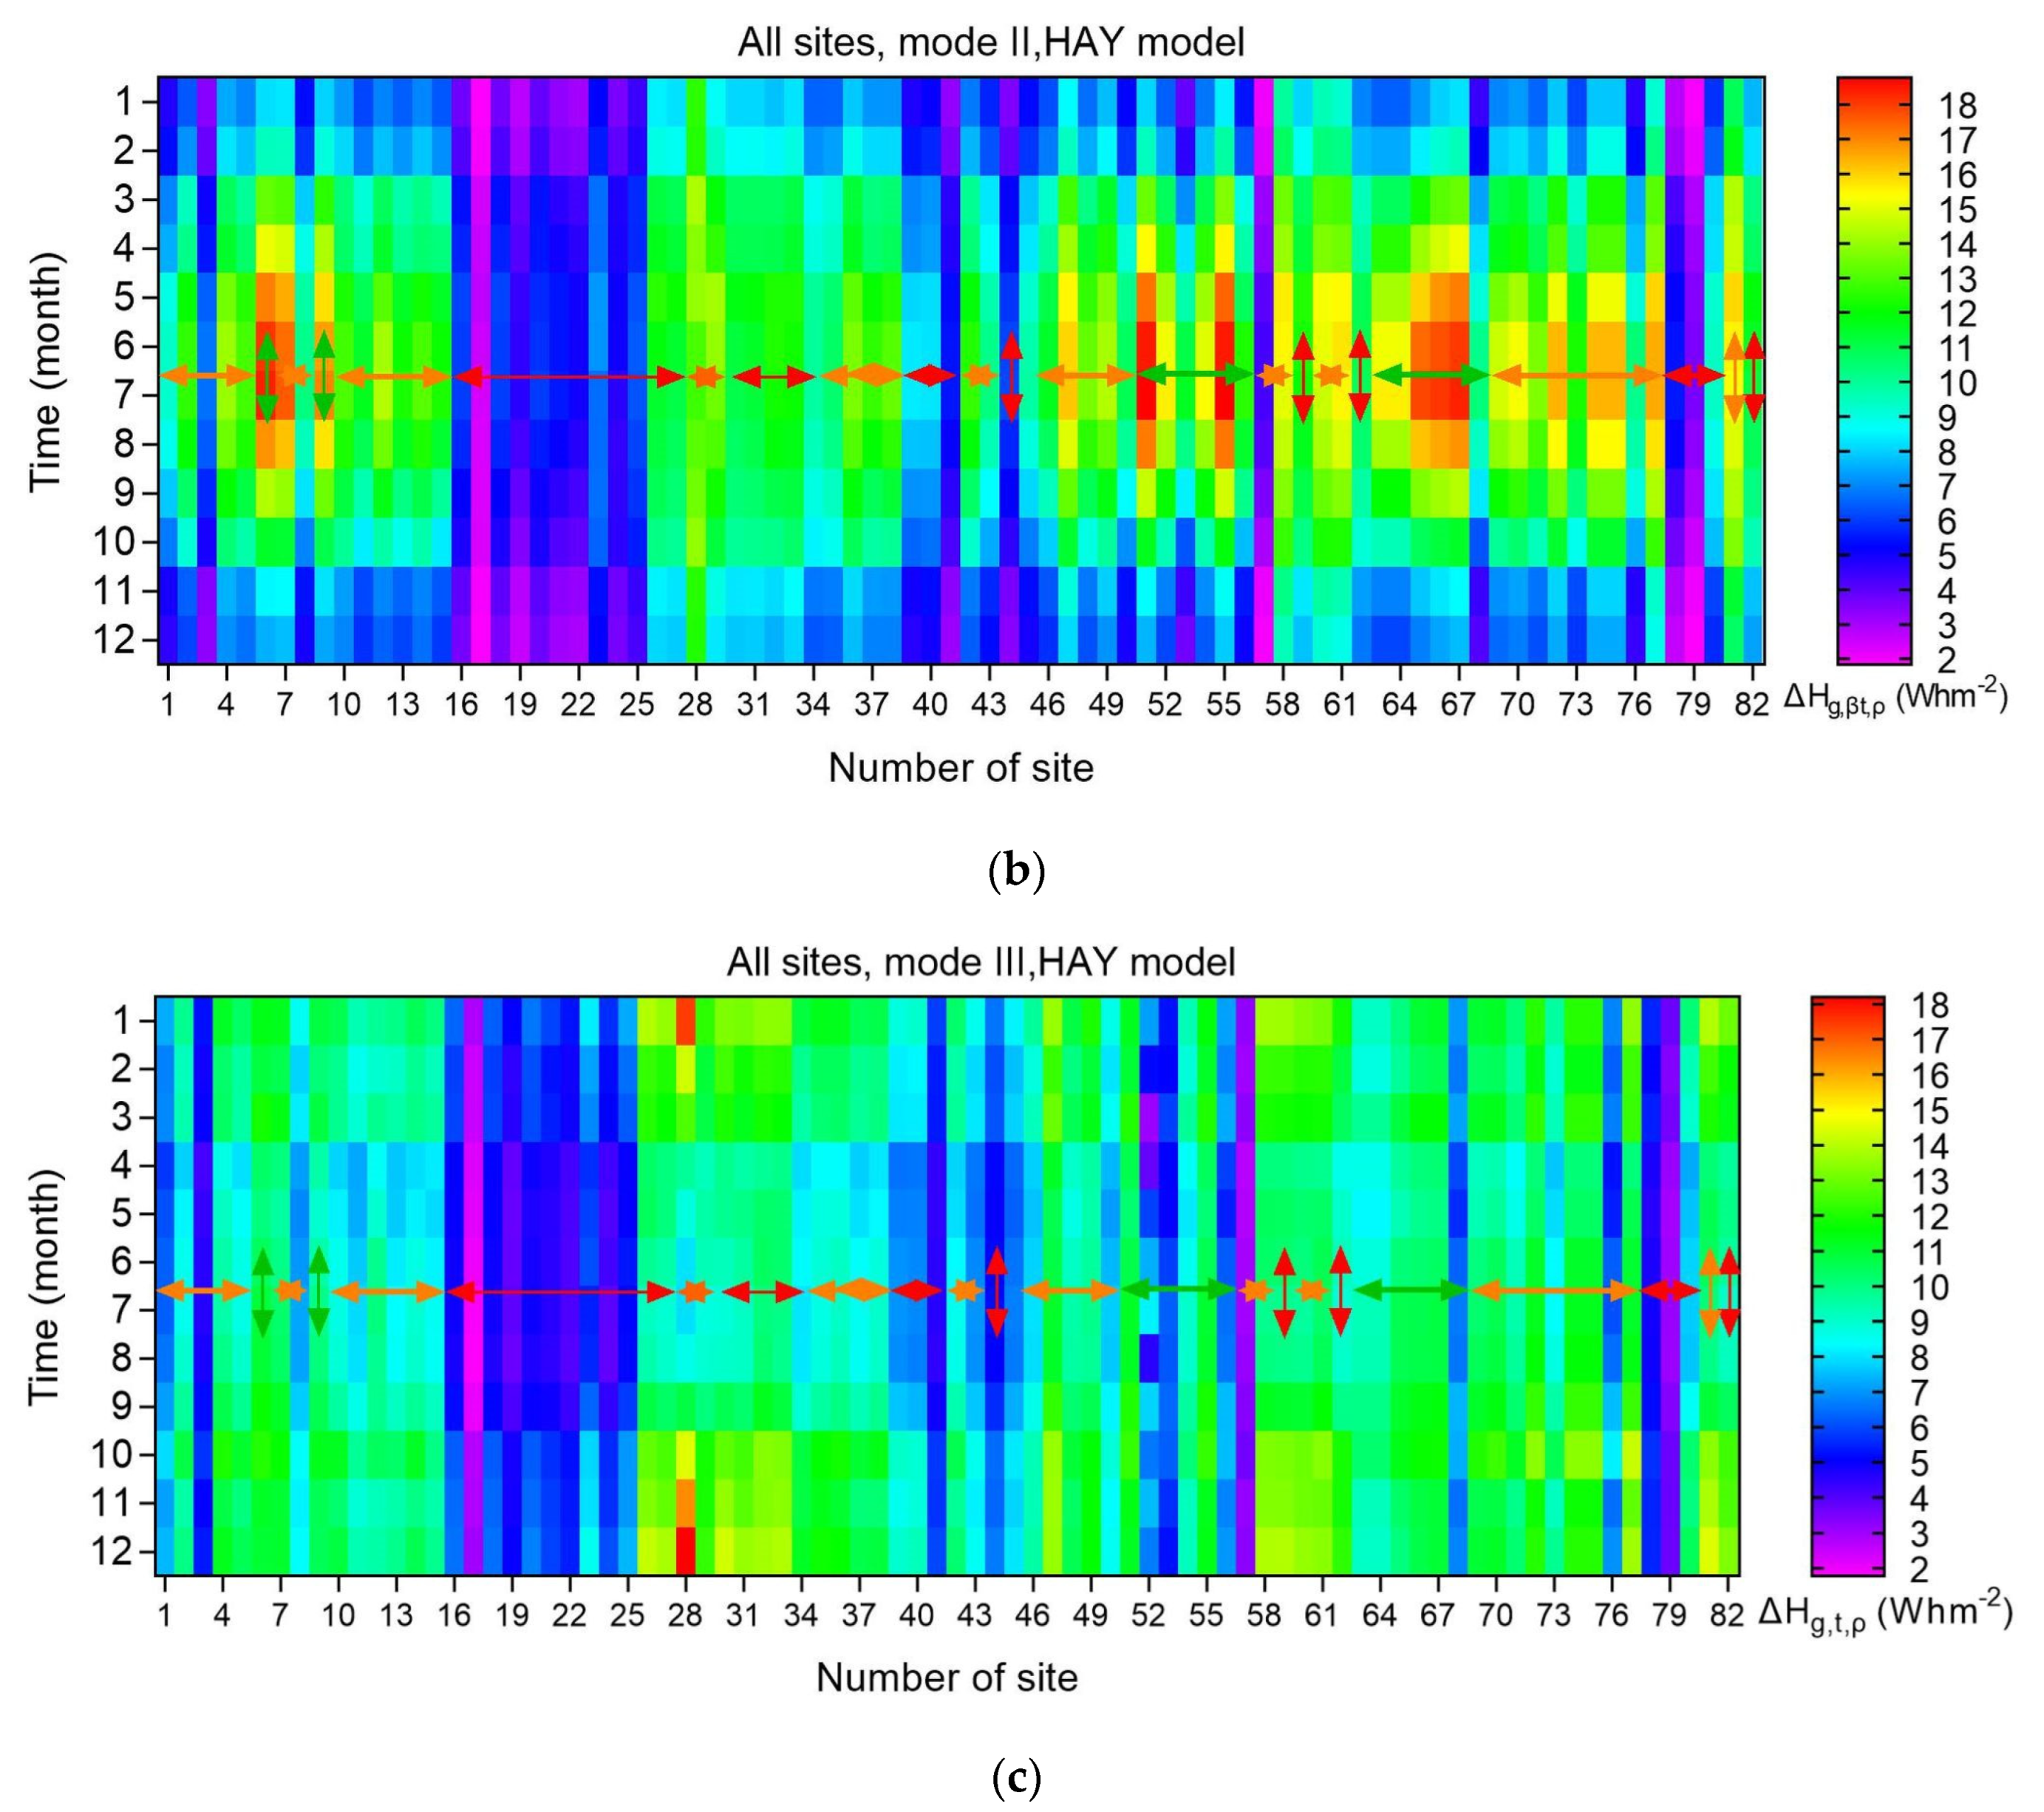
A last analysis in this section refers to the presentation of heat maps for ΔH
g,i,ρ as function the month of the year. This is shown in
Figure 11, where all ΔH
g,i,ρ values are monthly averages in the period 2005-2016 at each site. To distinguish between the 3 SEZs, each heat map includes arrows that are red for the SEZ-A sites, orange for the SEZ-B ones, and green for the SEZ-C locations. A non-uniformity is observed in the intra-annual variation of ΔH
g,i,ρ along the 82 sites, which cover the whole of Saudi Arabia. There are sites which exhibit higher solar energy differences in the summer months than others (for mode-I and -II systems); on the contrary, lower summer ΔH
g,i,ρ values occur at almost all sites (doe mode-III systems), as already mentioned in
Figure 7. This non-uniformity of the effect of the ground albedo on the solar energy received by a tilted surface is due not only to the terrain characteristics, but also to the weather prevailing at each site (i.e., the climate of the area), the solar radiation intensity, and the operational mode of the solar system.
4. Discussion
The present study aimed at showing directly the effect of the ground albedo on the solar energy received by flat-plate surfaces fixed on three types of tracking facilities (mode-I, -II, and -III). To do this, a logical hypothesis of comparing the levels of the solar energy obtained by the 3 types of solar installations in Saudi Arabia and estimated via a near-real ground albedo to the levels computed by a zero-reflection ground albedo was made. In the international literature, no such an approach has ever been presented, because other researchers in this field have confronted this issue by invoking albedo modelling, statistics or theoretical calculations. Therefore, the present work icludes some innovation in this respect.
The main conclusion from the analysis of the solar radiation data at the 82 sites was that in an environment like Saudi Arabia’s the error in estimating the solar energy potential for any of the 3 types of operation is small if a (reference) ground-albedo value of 0.2 is initially chosen. This result is in agreement with the conclusion drwan by Ineichen et al. [
9]. This means that the absolute error in Whm
-2 is not significant. Indeed, on monthly basis this error (ΔH
g,i,ρ = ΔH
g,i,ρg − ΔH
g,i,0) is in the order of few Whm
-2 on average per site (i.e., 1.9–3.7 Whm
-2 for mode-I, 6.1–11.8 Whm
-2 for mode-II, and 7.7–10.1 Whm
-2 for mode-II systems); these errors may become half when using ρ
g0 = 0.2 (i.e., ΔH
g,i,ρ = ΔH
g,i,ρg − ΔH
g,i,ρg0). Therefore, engineering-oriented calculations can easily make use of this outcome in Saudi Arabia. Accordingly, such an approach can be applied to places with similar environmental characteristics with those in Saudi Arabia.
The adoption of a reference ground albedo in solar energy calculations has, however, been used by many authors in the international literature without constraints to the geomorphological characteristics of the area. Though such an adoption has been rather arbitrary, the present work confirms its validity, at least within Saudi Arabia. This result can facilitate all solar engineering applications at locations worldwide, the places with snow cover excluded at least for the period this weather phenomenon occurs.
To prove the above statement, new future research is needed at other locations on Earth, by following the present methodology. This way the above conclusion of minimal error with the use of a ground-albedo value of 0.2 can be established as worldwide tactics. The benefits are multiple and obvious. One of those may be the minimisation of the CO
2 imprint from buildings that make use of renewable energy sources (especially solar energy) for heating/cooling [
36].
5. Conclusions
This work used hourly values of direct and diffuse horizontal solar irradiance obtained from the PV-GIS platform in the period 2005–2016 data base for 82 sites in Saudi Arabia. Pre-processing (including quality test) was performed for all data. Final calculations of the solar irradiance on tilted flat-plane surfaces fixed on mode-I, -II, or -III schemes of operation took place. Analysis of the derived values was conducted to give the results deployed in
Section 3.
The results of the present work can, therefore, be summarised in the following.
The percentage contribution of ΔHg,i,ρ to the total energy received ΣHg,i,ρg at all 82 sites of Saudi Arabia is: 1.43% for mode-I, 3.50% for mode-II, and 3.20% for mode-III solar systems on annual basis.
The ratio ΔHg,i,ρ/ΣHg,i,ρg is well correlated to the ground-albedo value at the location of each site; this is 0.65 (mode-I), 0.78 (mode-II), and 0.83 (mode-III).
The annual ΔHg,i,ρ value at every site is associated with a very small standard deviation for all 3 types of solar systems operation; this shows a non-significant effect of ρg on the estimated solar energy at each site.
The ratios in point 2 above are expressed by quadratic equations as function of Δρ/ρg (0.74 ≤ R2 ≤ 0.80) or as function of φ (0.02 ≤ R2 ≤ 0.35).
The seasonal mean ΔHg,i,ρ values present maximum in the summer (modes-I and -II), and in the fall (mode-III systems).
Cubic equations express the seasonal mean values in point 5 above with R2 = 1 independent of the mode.
The ΔHg,i,ρ values have a peak in July (modes-I, and -II), but low values in the period April-September (mode-III systems).
The monthly mean ΔHg,i,ρ values are expressed by 6th-order polynomials in respect to month with 0.88 ≤ R2 ≤ 0.99 irrespective of the operation mode.
Almost same levels of annual mean ΔHg,i,ρ values were found for mode-II and -III solar systems, but substantially smaller for mode-I tracking systems in Saudi Arabia.
Small intra-annual variation in ρg was found with large standard deviation for each site for the SEZ-A and SEZ-B sites; on the contrary, smaller standard deviation was found to be associated with the SEZ-C sites.
Quadratic regression equations were derived to express the annual mean ΔHg,i,ρ values vs. ρg in all SEZs.
Heat maps for the monthly mean ΔH
g,i,ρ values for all sites were produced (also indicating the SEZ in which each site belongs to). This finding confirms the outcome from
Figure 8.
In the above notations the subscript i means the mode of operation (i.e., βS, βt, and t, for mode-I, -II, and -III, respectively); also, the subscript ρ has been replaced with either ρg or 0 in the calculations.
Author Contributions
Resources, data curation, formal analysis, writing—review and editing, funding acquisition, A.F; conceptualisation, data curation, methodology, writing—original draft preparation, H.D.K; software, visualisation, methodology, writing—review and editing, S.I.K.
Funding
A.F. would like to acknowledge the support provided by the Deanship of Scientific Research (DSR) at the King Fahd University of Petroleum and Minerals (KFUPM) for funding this work through the project No. INRE2205.
Data Availability Statement
Acknowledgments
The authors are thankful to the Giovanni-platform staff and the MODIS-mission scientists and associated NASA personnel for the production of the ground-albedo data used in this research. They also thank the personnel of the PV-GIS platform for providing the necessary solar horizontal irradiances over Saudi Arabia. The author A.F. is thankful for the support of the Centre of Research Excellence in Renewable Energy (CORERE), KFUPM.
Conflicts of Interest
The authors declare no conflict of interest.
This section shows the theoretically-calculated variation of the total solar irradiance incident on a flat-plate surface mounted on a mode-I, -II, or -III tracking system vs. a changing ground albedo, ρ
g. In this exercise, the paradigm of the Dammam site (φ = 26.42
o) has been considered; the calculations were made for a solar altitude γ = 25.14
o.
Figure A1 shows this variation for the 3 modes of operation.
Figure A1.
Variation of the tilted solar irradiance, H
g,i,ρg, across all (theoretical) ground-albedo values, ρ
g, at the site of Dammam (#1 in
Table 1) for the 3 modes of operation (I, II, III). the inclination of the tilted surfaces has deliberately chosen to be equal to the geographical latitude of the site, φ. The calculations have been made at a specific solar altitude, γ; i = φS or φt or t.
A linear dependence exists in all 3 cases with equations Hg,φS,ρg = 21.05·ρg + 570.80 (mode-I), Hg,φt,ρg = 21.05·ρg + 652.60 (mode-II), and Hg,t,ρg = 115.90·ρg + 782.90 (mode-III), all with R2 = 1. The first 2 modes present a rather invariant behaviour as ρg increases. Indeed, the increase in Hg is just 3.69% and 3.22% for the mode-I, and -II tracking systems, respectively, in the whole ρg region, which is considered quite small. In the case of a mode-III system, the increase in the solar irradiance is higher, i.e., 14.90%.
Therefore, for more accurate calculations (even in engineering applications) the ground-albedo value should be taken into account in any case; use of ρg = 0.2 suffices.
References
- Iqbal, M. An Introduction to Solar Radiation; Academic Press, 1983.
- McEvoy, A.; Markvart, T.; Castañer, L. Practical Handbook of Photovoltaics; Elsevier BV: Amsterdam, NX, Netherlands, 2012; ISBN 9780123859341. [Google Scholar]
- Haar, T.; Raschke, E.; Bandeen, W.; Pasternak, M. Measurements of solar energy reflected by the Earth and atmosphere from meteorological satellites. Sol. Energy 1973, 14, 175–184. [Google Scholar] [CrossRef]
-
Encyclopedia of Climate and Weather; Oxford University Press (OUP): Oxford, Oxfordshire, United Kingdom, 2011; ISBN 9780199765324.
- Calabrò, E.; Magazù, S. Correlation between Increases of the Annual Global Solar Radiation and the Ground Albedo Solar Radiation due to Desertification—A Possible Factor Contributing to Climatic Change. Climate 2016, 4, 64. [Google Scholar] [CrossRef]
- Stephens, G.L.; O'Brien, D.; Webster, P.J.; Pilewski, P.; Kato, S.; Li, J. The albedo of Earth. Rev. Geophys. 2015, 53, 141–163. [Google Scholar] [CrossRef]
- Chrysoulakis, N.; Mitraka, Z.; Gorelick, N. Exploiting satellite observations for global surface albedo trends monitoring. Theor. Appl. Clim. 2018, 137, 1171–1179. [Google Scholar] [CrossRef]
- Alam, M.; Gul, M.S.; Muneer, T. Performance analysis and comparison between bifacial and monofacial solar photovoltaic at various ground albedo conditions. Renew. Energy Focus 2023, 44, 295–316. [Google Scholar] [CrossRef]
- Ineichen, P.; Guisan, O.; Perez, R. Ground-reflected radiation and albedo. Sol. Energy 1990, 44, 207–214. [Google Scholar] [CrossRef]
- Brennan, M.; Abramase, A.; Andrews, R.; Pearce, J. Effects of spectral albedo on solar photovoltaic devices. Sol. Energy Mater. Sol. Cells 2014, 124, 111–116. [Google Scholar] [CrossRef]
- Barbón, A.; Bayón, L.; Díaz, G.; Silva, C.A. Investigation of the Effect of Albedo in Photovoltaic Systems for Urban Applications: Case Study for Spain. Energies 2022, 15, 7905. [Google Scholar] [CrossRef]
- Nicolás-Martín, C.; Santos-Martín, D.; Chinchilla-Sánchez, M.; Lemon, S. A global annual optimum tilt angle model for photovoltaic generation to use in the absence of local meteorological data. Renew. Energy 2020, 161, 722–735. [Google Scholar] [CrossRef]
- Tuomiranta, A.; Alet, P.-J.; Ballif, C.; Ghedira, H. Calibration of ground surface albedo models. Sol. Energy 2022, 237, 239–252. [Google Scholar] [CrossRef]
- Psiloglou, B.; Kambezidis, H. Estimation of the ground albedo for the Athens area, Greece. J. Atmospheric Solar-Terrestrial Phys. 2009, 71, 943–954. [Google Scholar] [CrossRef]
- Farahat, A.; Kambezidis, H.D.; Almazroui, M.; Ramadan, E. Solar Potential in Saudi Arabia for Southward-Inclined Flat-Plate Surfaces. Appl. Sci. 2021, 11, 4101. [Google Scholar] [CrossRef]
- Farahat, A.; Kambezidis, H.D.; Almazroui, M.; Al Otaibi, M. Solar Potential in Saudi Arabia for Inclined Flat-Plate Surfaces of Constant Tilt Tracking the Sun. Appl. Sci. 2021, 11, 7105. [Google Scholar] [CrossRef]
- Kambezidis, H.D.; Farahat, A.; Almazroui, M.; Ramadan, E. Solar Potential in Saudi Arabia for Flat-Plate Surfaces of Varying Tilt Tracking the Sun. Appl. Sci. 2021, 11, 11564. [Google Scholar] [CrossRef]
- Huld, T.; Müller, R.; Gambardella, A. A new solar radiation database for estimating PV performance in Europe and Africa. Sol. Energy 2012, 86, 1803–1815. [Google Scholar] [CrossRef]
- Acker, J.G.; Leptoukh, G. Online analysis enhances use of NASA Earth science data. Eos 2007, 88, 14–17. [Google Scholar] [CrossRef]
- Kambezidis, H.D.; Mimidis, K.; Kavadias, K.A. The Solar Energy Potential of Greece for Flat-Plate Solar Panels Mounted on Double-Axis Systems. Energies 2023, 16, 5067. [Google Scholar] [CrossRef]
- Urraca, R.; Gracia-Amillo, A.M.; Koubli, E.; Huld, T.; Trentmann, J.; Riihelä, A.; Lindfors, A.V.; Palmer, D.; Gottschalg, R.; Antonanzas-Torres, F. Extensive validation of CM SAF surface radiation products over Europe. Remote. Sens. Environ. 2017, 199, 171–186. [Google Scholar] [CrossRef]
- Urraca, R.; Huld, T.; Gracia-Amillo, A.; Martinez-De-Pison, F.J.; Kaspar, F.; Sanz-Garcia, A. Evaluation of global horizontal irradiance estimates from ERA5 and COSMO-REA6 reanalyses using ground and satellite-based data. Sol. Energy 2018, 164, 339–354. [Google Scholar] [CrossRef]
- Mueller, R.; Matsoukas, C.; Gratzki, A.; Behr, H.; Hollmann, R. The CM-SAF operational scheme for the satellite based retrieval of solar surface irradiance — A LUT based eigenvector hybrid approach. Remote. Sens. Environ. 2009, 113, 1012–1024. [Google Scholar] [CrossRef]
- Mueller, R.; Behrendt, T.; Hammer, A.; Kemper, A. A New Algorithm for the Satellite-Based Retrieval of Solar Surface Irradiance in Spectral Bands. Remote. Sens. 2012, 4, 622–647. [Google Scholar] [CrossRef]
- Amillo, A.G.; Huld, T.; Müller, R. A New Database of Global and Direct Solar Radiation Using the Eastern Meteosat Satellite, Models and Validation. Remote. Sens. 2014, 6, 8165–8189. [Google Scholar] [CrossRef]
- Farahat, A.; Kambezidis, H.D.; Labban, A. The Solar Radiation Climate of Saudi Arabia. Climate 2023, 11, 75. [Google Scholar] [CrossRef]
- Farahat, A.; Kambezidis, H.D.; Almazroui, M.; Ramadan, E. Solar Energy Potential on Surfaces with Various Inclination Modes in Saudi Arabia: Performance of an Isotropic and an Anisotropic Model. Appl. Sci. 2022, 12, 5356. [Google Scholar] [CrossRef]
- Kambezidis, H.; Papanikolaou, N. Solar position and atmospheric refraction. Sol. Energy 1990, 44, 143–144. [Google Scholar] [CrossRef]
- Kambezidis, H.; Tsangrassoulis, A. Solar position and right ascension. Sol. Energy 1993, 50, 415–416. [Google Scholar] [CrossRef]
- Liu, B.Y.; Jordan, R.C. The long-term average performance of flat-plate solar-energy collectors: With design data for the U.S., its outlying possessions and Canada. Sol. Energy 1963, 7, 53–74. [Google Scholar] [CrossRef]
- Hay, J.E. Calculating solar radiation for inclined surfaces: Practical approaches. Renew. Energy 1993, 3, 373–380. [Google Scholar] [CrossRef]
- Spencer, J. W. Fourier Series Representation of the Position of the Sun. Search 1971, 2(5), 172. [Google Scholar]
- Gueymard, C.A. A reevaluation of the solar constant based on a 42-year total solar irradiance time series and a reconciliation of spaceborne observations. Sol. Energy 2018, 168, 2–9. [Google Scholar] [CrossRef]
- Tarawneh, Q.Y.; Chowdhury, S. Trends of Climate Change in Saudi Arabia: Implications on Water Resources. Climate 2018, 6, 8. [Google Scholar] [CrossRef]
- Bogrekci, I.; Lee, W. S. The Effects of Soil Moisture Content on Reflectance Spectra of Soils Using UV-VIS-NIR Spectroscopy. In 7th In. Conf. Precision Agric.; 2004; pp 1–11.
- Kampezidou, S.I.; Ray, A.T.; Duncan, S.; Balchanos, M.G.; Mavris, D.N. Real-time occupancy detection with physics-informed pattern-recognition machines based on limited CO2 and temperature sensors. Energy Build. 2021, 242. [Google Scholar] [CrossRef]
Figure 1.
Distribution of the 82 selected sites in Saudi Arabia. The numbers in the circles refer to those in column 1 of
Table 1. The country is divided into 3 solar energy zones (SEZ) for mode-I and mode-II solar systems according to [
15,
16]. This Figure is reproduction of
Figure 3 in [
16].
Figure 1.
Distribution of the 82 selected sites in Saudi Arabia. The numbers in the circles refer to those in column 1 of
Table 1. The country is divided into 3 solar energy zones (SEZ) for mode-I and mode-II solar systems according to [
15,
16]. This Figure is reproduction of
Figure 3 in [
16].
Figure 2.
Inclined surface at a tilt angle β with arbitrary orientation. E, W, N, S denote East, West, North, and South, respectively. Also, the solar altitude, γ, the solar azimuth, ψ, the tilted surface’s azimuth, ψ’, and the incidence angle, θ, are shown. θ
z = 90
o − γ is the solar zenith angle. The scheme is reproduction from [
17].
Figure 4.
Difference in the annual tilted surface solar irradiation (SSR) across all 82 sites in Saudi Arabia in the period 2005-2016 for (a) mode-I, (b) mode-II, and (c) mode-III solar systems. The vertical bars represent the ±1σ around the annual ΔHg,i,ρ values. The horizontal dashed lines are the averages of ΔSSR across all sites. ΔHg,i,ρ = Hg,i,ρg − Hg,i,0, i = βS or βt or t.
Figure 5.
Variation of the annual mean ratios ΔH
g,i,ρ/ΣH
g,i,
ρg as function of the ratio Δρ/ρ
g (plots 5a, 5c, 5e in the left panels), or as function of φ (plots 5b, 5d, 5f in the right panels), averaged across Saudi Arabia in the period 2005-2016. Plots in the first row refer to a fixed-tilt system (5a, 5b), in the second row to a single-axis system, (5c, 5d), and in the third row to a dual-axis one, (5e, 5f). Non-linear best-fit regression lines are also shown in the graphs as dashed lines. The equations of the regression curves are given in
Table 2. The colour for the SEZ-A sites has been chosen to be red, for the SEZ-B ones orange, and for the SEZ-C sites green; SEZ-All is shown in black. Δρ = ρ
g − 0.2; ΔH
g,i,ρ = H
g,i,ρg − H
g,i,0; ΣH
g,i,ρ is the summation at each site over the examined period; i = βS or βt or t.
Figure 6.
Seasonal variation of the differences ΔHg,i,ρ (black solid lines, left vertical axis) and Σ(ΔHg,i,ρ) (brown solid lines, right vertical axis) across all 82 sites in Saudi Arabia in the period 2005-2016 for (a) mode-I, (b) mode-II, and (c) mode-III solar systems. The green solid lines represent the non-linear best-fit curves to ΔHg,i,ρ. The red and blue dashed lines indicate the ±1σ band. ΔHg,i,ρ = Hg,i,ρg − Hg,i,0; Σ(ΔHg,i,ρ) = Σ(Hg,i,ρg − Hg,i,0), the summation being all over 82 sites at each season; i = βS or βt or t.; the seasons in the x-axis are from 1 = spring to 4 = winter.
Figure 7.
Intra-annual variation of the differences ΔHg,i,ρ (black solid lines, left vertical axis) and Σ(ΔHg,i,ρ) (brown solid lines, right vertical axis) across all 82 sites in Saudi Arabia in the period 2005-2016 for (a) mode-I, (b) mode-II, and (c) mode-III solar systems. The green solid lines represent the non-linear best-fit curves to ΔHg,i. The red and blue dashed lines indicate the ±1σ band. ΔHg,i,ρ = Hg,i,ρg − Hg,i,0; Σ(ΔHg,i,ρ) = Σ(Hg,i,ρg − Hg,i,0), the summation being all over 82 sites at each month; i = βS or βt or t; the numbers in the x-axis indicate the month (1 = January…, 12 = December).
Figure 8.
Variation of the annual differences ΔHg,i,ρ (a) and ΣHg,i,ρ (b) across all 82 sites in Saudi Arabia in the period 2005-2016 for all 3 operation modes of solar systems. ΔHg,i,ρ = Hg,i,ρg − Hg,i,0; the summation ΣHg,i,ρ is done at each site over the examined period; i = βS or βt or t; ρ = ρg or 0.
Figure 9.
Intra-annual variation of the ground albedo in Saudi Arabia in the period 2005-2016; the values are averages (a) over all sites, (b) over the SEZ-A sites, (c) over the SEZ-B sites, and (d) over the SEZ-C ones. For comparison, the y-axis has kept at the same scale throughout all 4 graphs. The black solid lines are the ρg averages, while the red and blue dashed ones represent the +1σ and −1σ, respectively; the numbers in the x-axis indicate the month (1 = January…, 12 = December).
Figure 10.
Variation of the annual mean differences ΔH
g,i,ρ as function of the near-real ground albedo, ρ
g, across all 82 sites in Saudi Arabia in the period 2005-2016 for (
a) mode-I, (
b) mode-II, and (
c) mode-III solar systems. The solid lines represent the non-linear best-fit curves to ΔH
g,i,ρ. The dotted lines indicate the ±95% confidence band. ΔH
g,i,ρ = H
g,i,ρg − H
g,i,0; i = βS or βt or t; ρ = ρ
g or 0. The regression equations for the best-fit curves are shown in
Table 5.
Figure 11.
Heat maps for the monthly mean ΔHg,i,ρ values along all 82 sites in Saudi Arabia in the period 2005-2016 for (a) mode-I, (b) mode-II, and (c) mode-III solar systems. The coloured arrows indicate the SEZ sites; red for SEZ A, orange for SEZ B, and green for SEZ C. ΔHg,i,ρ = Hg,i,ρg − Hg,i,0; i = βS or βt or t; ρ = ρg or 0.
Table 1.
The 82 sites within Saudi Arabia to cover the whole area of the country; φ and λ are expressed in the WGS84 geodetic system and rounded to the second decimal digit. The “unnamed” sites refer to those away from known locations. This Table is reproduction of
Table 1 in [
17]. N = North, E = East.
| Number of site |
Name of site |
Geographical latitude of site, φ (degrees N) |
Geographical longitude of site, λ (degrees E) |
| 1 |
Dammam |
26.42 |
50.09 |
| 2 |
Al Jubail |
26.96 |
49.57 |
| 3 |
Ras Tanura |
26.77 |
50.00 |
| 4 |
Abqaiq |
25.92 |
49.67 |
| 5 |
Al Hofuf |
25.38 |
49.59 |
| 6 |
Arar |
30.96 |
41.06 |
| 7 |
Sakaka |
29.88 |
40.10 |
| 8 |
Tabuk |
28.38 |
36.57 |
| 9 |
Al Jawf |
29.89 |
39.32 |
| 10 |
Riyadh |
24.71 |
46.68 |
| 11 |
Al Qassim |
26.21 |
43.48 |
| 12 |
Hafar Al Batin |
28.38 |
45.96 |
| 13 |
Buraydah |
26.36 |
43.98 |
| 14 |
Al Majma’ah |
25.88 |
45.37 |
| 15 |
Hail |
27.51 |
41.72 |
| 16 |
Jeddah |
21.49 |
39.19 |
| 17 |
Jazan |
16.89 |
42.57 |
| 18 |
Mecca |
21.39 |
39.86 |
| 19 |
Medina |
24.52 |
39.57 |
| 20 |
Taif |
21.28 |
40.42 |
| 21 |
Yanbu |
24.02 |
38.19 |
| 22 |
King Abdullah Economic City |
22.45 |
39.13 |
| 23 |
Najran |
17.57 |
44.23 |
| 24 |
Abha |
18.25 |
42.51 |
| 25 |
Bisha |
19.98 |
42.59 |
| 26 |
Al Sahmah |
20.10 |
54.94 |
| 27 |
Thabhloten |
19.83 |
53.90 |
| 28 |
Ardah |
21.22 |
55.24 |
| 29 |
Shaybah |
22.52 |
54.00 |
| 30 |
Al Kharkhir |
18.87 |
51.13 |
| 31 |
Umm Al Melh |
19.11 |
50.11 |
| 32 |
Ash Shalfa |
21.87 |
49.71 |
| 33 |
Oroug Bani Maradh Wildlife |
19.41 |
45.88 |
| 34 |
Wadi ad Dawasir |
20.49 |
44.86 |
| 35 |
Al Badie Al Shamali |
21.99 |
46.58 |
| 36 |
Howtat Bani Tamim |
23.52 |
46.84 |
| 37 |
Al Duwadimi |
24.50 |
44.39 |
| 38 |
Shaqra |
25.23 |
45.24 |
| 39 |
Afif |
24.02 |
42.95 |
| 40 |
New Muwayh |
22.43 |
41.74 |
| 41 |
Mahd Al Thahab |
23.49 |
40.85 |
| 42 |
Ar Rass |
25.84 |
43.54 |
| 43 |
Uglat Asugour |
25.85 |
42.15 |
| 44 |
Al Henakiyah |
24.93 |
40.54 |
| 45 |
Ar Rawdah |
26.81 |
41.68 |
| 46 |
Asbtar |
26.96 |
40.28 |
| 47 |
Tayma |
27.62 |
38.48 |
| 48 |
Al Khanafah Wildlife Sanctuary |
28.81 |
38.92 |
| 49 |
Madain Saleh |
26.92 |
38.04 |
| 50 |
Altubaiq Natural Reserve |
29.51 |
37.23 |
| 51 |
Hazem Aljalamid |
31.28 |
40.07 |
| 52 |
Turaif |
31.68 |
38.69 |
| 53 |
Al Qurayyat |
31.34 |
37.37 |
| 54 |
Harrat al Harrah Conservation |
30.62 |
39.48 |
| 55 |
Al Uwayqilah |
30.33 |
42.25 |
| 56 |
Rafha |
29.63 |
43.49 |
| 57 |
Khafji |
28.41 |
48.50 |
| 58 |
Unnamed 1 |
21.92 |
51.99 |
| 59 |
Unnamed 2 |
21.03 |
51.16 |
| 60 |
Unnamed 3 |
22.33 |
52.53 |
| 61 |
Unnamed 4 |
23.42 |
50.73 |
| 62 |
Unnamed 5 |
21.28 |
48.03 |
| 63 |
Unnamed 6 |
31.92 |
39.26 |
| 64 |
Unnamed 7 |
31.69 |
39.65 |
| 65 |
Unnamed 8 |
29.78 |
42.00 |
| 66 |
Unnamed 9 |
28.68 |
41.31 |
| 67 |
Unnamed 10 |
30.63 |
42.68 |
| 68 |
Unnamed 11 |
29.78 |
47.49 |
| 69 |
Unnamed 12 |
28.68 |
47.97 |
| 70 |
Unnamed 13 |
28.41 |
47.53 |
| 71 |
Unnamed 14 |
28.05 |
47.88 |
| 72 |
Unnamed 15 |
27.97 |
48.98 |
| 73 |
Unnamed 16 |
27.15 |
48.56 |
| 74 |
Unnamed 19 |
27.21 |
48.02 |
| 75 |
Unnamed 18 |
27.15 |
48.52 |
| 76 |
Unnamed 19 |
27.66 |
48.95 |
| 77 |
Unnamed 20 |
24.74 |
35.17 |
| 78 |
Unnamed 21 |
28.34 |
36.67 |
| 79 |
Unnamed 22 |
26.27 |
43.06 |
| 80 |
Unnamed 23 |
21.89 |
47.54 |
| 81 |
Unnamed 24 |
18.76 |
53.28 |
| 82 |
Unnamed 25 |
21.38 |
52.79 |
Table 2.
Regression equations and relative statistics for the best-fit curves appearing in
Figure 5. The colouring of each SEZ follows the notation in the legend of
Figure 5. The analysis took into account the data in the period 2005-2016.
Table 2.
Regression equations and relative statistics for the best-fit curves appearing in
Figure 5. The colouring of each SEZ follows the notation in the legend of
Figure 5. The analysis took into account the data in the period 2005-2016.
| Parameter |
Regression equation 1
|
Statistics 2
|
ΔHg,βS,ρ/ΣHg,βS,ρg
(mode I) |
RHg = 0.006084·Rρ2 + 0.007667·Rρ + 0.005656 (SEZ A)
RHg = 0.007475·Rρ2 + 0.001126·Rρ + 0.009616 (SEZ B)
RHg = −0.007801·Rρ2 + 0.052360·Rρ (SEZ C) |
R2 = 0.80, P < 0.0001
R2 = 0.80, P < 0.0001
R2 = 0.78, P = 0.3404 |
ΔHg,βt,ρ/ΣHg,βt,ρg
(mode II) |
RHg = 0.018210·Rρ2 + 0.022650·Rρ + 0.017100 (SEZ A)
RHg = 0.021000·Rρ2 + 0.026470·Rρ + 0.022960 (SEZ B)
RHg = −0.046220·Rρ2 + 0.119800·Rρ (SEZ C) |
R2 = 0.80, P < 0.0001
R2 = 0.74, P < 0.0001
R2 = 0.79, P = 0.7004 |
ΔHg,t,ρ/ΣHg,t,ρg
(mode III) |
RHg = 0.019380·Rρ2 + 0.024770·Rρ + 0.019440 (SEZ All) |
R2 = 0.77, P < 0.0001 |
ΔHg,βS,ρ/ΣHg,βS,ρg
(mode I) |
RHg = −0.00003989·φ2 + 0.001263·φ (SEZ A)
RHg = −0.00004601·φ2 + 0.001818·φ (SEZ B)
RHg = −0.00007419·φ2 + 0.003014·φ (SEZ C) |
R2 = 0.21, P = 0.1222
R2 = 0.12, P = 0.1308
R2 = 0.35, P = 0.2676 |
ΔHg,βt,ρ/ΣHg,βt,ρg
(mode II) |
RHg = −0.0001211·φ2 + 0.003820·φ (SEZ A)
RHg = −0.0001097·φ2 + 0.004346·φ (SEZ B)
RHg = −0.0001243·φ2 + 0.005898·φ (SEZ C) |
R2 = 0.22, P = 0.1162
R2 = 0.11, P = 0.2775
R2 = 0.28, P = 0.5407 |
ΔHg,t,ρ/ΣHg,t,ρg
(mode III) |
RHg = −0.00003711·φ2 + 0.002218·φ (SEZ All) |
R2 = 0.02, P = 0.6111 |
Table 3.
Regression equations and R
2 for the best-fit curves appearing in
Figure 6. The analysis took into account the data of all 82 sites in the period 2005-2016. The independent variable t indicates the season (t = 1 for spring…, t = 4 for winter). ΔH
g,i,ρ = H
g,i,ρg − H
g,i,0; i = βS or βt or t.
| Parameter |
Regression equation |
R2
|
ΔHg,βS,ρ
(mode I) |
ΔHg,βS,ρ = 0.9397·t3 − 7.8060·t2 + 18.1000·t − 1.5820 |
1 |
ΔHg,βt,ρ
(mode II) |
ΔHg,βt,ρ = 2.8360·t3 − 23.6000·t2 + 54.7300·t − 3.0570 |
1 |
ΔHg,t,ρ
(mode III) |
ΔHg,t,ρ = −1.4430·t3 + 10.9800·t2 − 23.2500·t + 38.3900 |
1 |
Table 4.
Regression equations and R
2 for the best-fit curves appearing in
Figure 7. The analysis took into account the data of all 82 sites in the period 2005-2016. The independent variable t indicates the month (t = 1 for January…, t = 12 for December).
Table 4.
Regression equations and R
2 for the best-fit curves appearing in
Figure 7. The analysis took into account the data of all 82 sites in the period 2005-2016. The independent variable t indicates the month (t = 1 for January…, t = 12 for December).
| Parameter |
Regression equation |
R2
|
ΔHg,βS
(mode I) |
ΔHg,βS = 0.00007192·t6 − 0.002724·t5 + 0.04085·t4 − 0.3089·t3 + 1.167·t2 − 1.58·t + 2.699 |
0.99 |
ΔHg,βt
(mode II) |
ΔHg,βt = 0.0002122·t6 − 0.008049·t5 + 0.1215·t4 − 0.9311·t3 + 3.567·t2 − 4.806·t + 8.45 |
0.99 |
ΔHg,t
(mode III) |
ΔHg,t = 0.00005617·t6 − 0.002156·t5 + 0.02977·t4 − 0.18·t3 + 0.5347·t2 − 1.293·t + 10.68 |
0.88 |
Table 5.
Regression equations and R
2 for the best-fit curves appearing in
Figure 10. The analysis took into account the annually-averaged data along the 82 sites in the period 2005-2016. ΔH
g,i,ρ = H
g,i,ρg − H
g,i,0; i = βS or βt or t; ρ = ρ
g or 0.
Table 5.
Regression equations and R
2 for the best-fit curves appearing in
Figure 10. The analysis took into account the annually-averaged data along the 82 sites in the period 2005-2016. ΔH
g,i,ρ = H
g,i,ρg − H
g,i,0; i = βS or βt or t; ρ = ρ
g or 0.
| Parameter |
Regression equation |
R2
|
ΔHg,βS,ρ
(mode I, SEZ-A sites) |
ΔHg,βS,ρ = −10.36·ρg2 + 74.96·ρg + 0.09844 |
0.95 |
ΔHg,βS,ρ
(mode I, SEZ-B sites) |
ΔHg,βS,ρ = −199.5·ρg2 + 204.9·ρg + 9.092 |
0.50 |
ΔHg,βS,ρ
(mode I, SEZ-C sites) |
ΔHg,βS,ρ = −442·ρg2 + 514.5·ρg − 78.63 |
0.51 |
ΔHg,βt,ρ
(mode II, SEZ-A sites) |
ΔHg,βt,ρ = −4.459·ρg2 + 267.7·ρg + 3.735 |
0.95 |
ΔHg,βt,ρ
(mode II, SEZ-B sites) |
ΔHg,βt,ρ = −578.9·ρg2 + 623·ρg − 25.95 |
0.59 |
ΔHg, βt,ρ
(mode II, SEZ-C sites) |
ΔHg,βt,ρ = −3744·ρg2 + 3222·ρg − 538.5 |
0.47 |
ΔHg,t,ρ
(mode III, SEZ-All sites) |
ΔHg,t,ρ = −261.5·ρg2 + 431.8·ρg − 8.228 |
0.74 |
|
Disclaimer/Publisher’s Note: The statements, opinions and data contained in all publications are solely those of the individual author(s) and contributor(s) and not of MDPI and/or the editor(s). MDPI and/or the editor(s) disclaim responsibility for any injury to people or property resulting from any ideas, methods, instructions or products referred to in the content. |
© 2023 by the authors. Licensee MDPI, Basel, Switzerland. This article is an open access article distributed under the terms and conditions of the Creative Commons Attribution (CC BY) license (http://creativecommons.org/licenses/by/4.0/).
