Preprint
Article

Quantitative Galactose Colorimetric Competitive Assay Based on Galactose Dehydrogenase and Plasmonic Gold Nanostars

Altmetrics

Downloads

86

Views

13

Comments

0

A peer-reviewed article of this preprint also exists.

Submitted:

09 October 2023

Posted:

10 October 2023

You are already at the latest version

Alerts
Abstract
We describe a competitive colorimetric assay that enables rapid and sensitive detection of galactose and reduced nicotinamide adenine dinucleotide (NADH) via colorimetric readouts and demon-strates its usefulness for monitoring NAD+-driven enzymatic reactions. We present a sensitive plasmonic sensing approach for assessing galactose concentration and the presence of NADH using galactose dehydrogenase immobilized gold nanostars (AuNS-PVP-GalDH). The AuNS-PVP-GalDH assay remains turquoise blue in the absence of galactose and NADH; however, as galactose and NADH concentrations grow, the reaction well color changes to a characteristic red color in the presence of an alkaline environment and metal ions catalyst (detection solution). As a result, when galactose is sensed in the presence of H2O2, the colored response of the AuNS-PVP-GalDH assay transforms from turquoise blue to light pink, then to wine red in a con-centration-dependent manner discernible to the human eye. This competitive AuNS-PVP-GalDH assay could be a viable analytical tool for rapid and convenient galactose quantification in re-source-limited areas.
Keywords: 
Subject: Chemistry and Materials Science  -   Biomaterials

1. Introduction

Gold nanoparticles (AuNPs), particularly gold nanostars (AuNS), have gained considerable attention in diagnostics due to their unique, size-dependent characteristics, biocompatibility, and simplicity of chemical manipulation [1,2,3,4,5]. AuNS display polarization-dependent scattering and absorption with dual spectral peaks (transverse and longitudinal) highly sensitive to protruding tip eccentricity changes [6,7,8,9,10]. Plasmonic AuNS have extraordinarily high extinction coefficients since their surface plasmon resonance is strongly impacted by their size, shape, and morphology [11,12]. These optical properties may pave the way for the development of nanosensors with simple absorbance-based readouts [13].
Nicotinamide adenine dinucleotide (NAD+) is a redox coenzyme essential for energy metabolism [14]. As a redox carrier, NAD+ accepts a hydride ion and shuttles electrons from metabolic activities to generate its reduced form, NADH [15]. NADH can donate one or two electrons depending on the substrate’s Gibbs free energy [16]. Several NAD+/NADH redox couple sensing approaches have been developed, with the majority requiring sophisticated processes and specialist personnel to interpret the results [17,18,19,20,21]. Because of its low cost and straightforward result interpretation, NAD+/NADH redox pair plasmonic colorimetric sensing has proven a viable alternative to other approaches [22,23]. Liang et al.(2015) recently disclosed a paper-based system for quick and sensitive room-temperature measurement of NADH using a colorimetric readout [22]. In their work, NADH was found to limit AuNPs dissolution by reducing Au3+ to Au+, resulting in a red color that became deeper with increasing NADH concentrations.
NAD/NADH are widely employed to quantify substrate-to-product conversion indirectly [24,25]. Furthermore, rather than measuring NAD/NADH, we examined its effect on the AuNS, all of which are related to the colorimetric quantification of different galactose concentrations. Using galactose dehydrogenase (GalDH)-NAD+ co-immobilized AuNS, we designed a nanoplasmonic sensor for quantitatively detecting NADH and galactose in different matrices. This study describes H2O2-induced rapid and sensitive surface etching of AuNS and NADH-driven biocatalytic growth of AuNPs in the presence of an alkaline environment and a metal ions catalyst to generate a colorimetric signal. We show that reshaping these tips with H2O2-NADH can produce a blue shift of the surface plasmon resonance (SPR) spectrum in a target-dependent manner suited for bioassays. This non-aggregation-based detection system takes advantage of NADH inhibiting AuNS dissolution while H2O2 induces AuNS dissolution, cyclic oxidation of NADH, and biocatalytic growth of AuNPs [22,26]. As a result, this assay may allow users to develop optical biosensors for NAD+-dependent biocatalyzed reactions and to screen analytes and inhibitors with the naked eye, a mechanism most likely transferable to other dehydrogenase enzymes.

2. Materials and Methods

All materials were bought from Sigma-Aldrich unless stated otherwise. The chemicals used were; sodium hydroxide, 4-(2-hydroxyethyl)-1-piperazineethanesulfonic acid (HEPES, C8H18N2O4S), gold (III) chloride trihydrate (HAuCl4•xH2O), silver nitrate (AgNO3), sodium hydroxide (NaOH),3’30–dithiobis sulfosuccinimidyl propionate (DTSSP, C14H14N2O14S4Na2), galactose (C6H12O6), hydrogen peroxide (H2O2), galactose dehydrogenase (GalDH), nicotinamide adenine dinucleotide hydrate (NAD, C21H27N7O14P2·xH2O), Tris buffer (NH2C(CH2OH)3, and polyvinylpyrrolidone (PVP) 10 000. The materials used were; sterile 5 mL screw cap tubes (Ascendis Medical), carbon mesh copper grids (Agar Scientific, UK), and clear, flat-bottomed 96-well plates (Corning).

2.1. Instrumentation and Characterization

Scanning electron microscopy and energy-dispersive x-ray spectroscopy (SEM-EDS, Bruker, Billerica, MA, USA) were used to assess the chemical compositions of the samples qualitatively. Inductively coupled plasma mass spectrometry (ICP-MS, Spectro AMETEK, Inc, Germany) was used to determine the elemental contents in the samples. SEM-EDS and ICP-MS were utilized to precisely quantify and confirm the chemical composition of the samples.
The gold nanostar and bioconjugates spectrum scanning (400-900 nm) was carried out utilizing 96 well plates and the HT Synergy (BioTEK) microplate reader (Agilent Technologies, Santa Clara, CA, USA).
High-resolution transmission electron microscopy (HR-TEM) was investigated using a Tecnai F20 transmission electron microscope (JEOL, Freising, Germany). The capped gold nanostar samples were imaged after being spotted onto copper grids (Agar Scientific) and air-dried. In contrast, the gold nanostar bioconjugates required a 1% silver nitrate solution staining prior to copper grid spotting, air drying, and imaging for protein visualization [27].
ImageJ software (bundled with 64-bit Java 1.8.0_172, University of Wisconsin at Madison, Madison, WI, USA) was used to estimate particle core diameters and arm dimensions by averaging a total count of one hundred capped gold nanostars and one hundred gold nanostar bioconjugates in different HR-TEM images.
All nuclear magnetic resonance (NMR) work at 500 MHz was performed with a Bruker Avance III HD (NMR) spectrometer equipped with a triple resonance inverse (TXI) 1H (15N, 13C) probe head (Bruker, Billerica, MA, USA). This was used to confirm the gold nanostars’ successful capping and protein immobilization.
The capped gold nanostars and gold nanostar bioconjugates were electrophoresed in agarose gel using a Baygene BG-power Vacutec electrophoresis gel apparatus (Vacutec, Johannesburg, South Africa). To confirm the molecules based on their size and electrical charge, the electrophoresis was performed at pH 8 with 0.5% agarose and 0.5 × Tris borate EDTA buffer (TBE buffer). The samples were made by combining 32 µL of nanostars with 4 µL of 80% glycerol and running them at 40 V for 45 minutes. The gold nanostar bioconjugate gels were stained for 4 hours with 25 mL 0.25% (w/v) Coomassie blue, then rinsed with a destaining solution (90% w/v isopropanol and 10% w/v glacial acetic acid), revealing the protein bands. Gels were stored in ddH2O until photos were recorded and uploaded to a computer.

2.2. Methods

2.2.1. Preparation of gold nanostars

The gold nanostars (AuNS) were synthesized using the modified HEPES buffer method described and characterized by our laboratory [28,29]. Succinctly, 2 mL 100 mM HEPES buffer (pH 7.4) was added to 3 mL deionized water (Millipore, 18.2 ΩM.cm-1), followed by 20 µL 50 mM gold (III) chloride trihydrate (HAuCl4·xH2O) and 4 µL 1 mM silver nitrate (AgNO3). The 5 mL screw cap was mixed by end-to-end tube inversion and incubated for 25 min at room temperature until the solution turned turquoise blue. The nanostars were then capped with 600 µL 2.5 mM PVP. After inverting the tube several times, it was left to stand at room temperature for 1 h. The capped AuNS sample suspension was cleaned twice by centrifugation for 35 min at 2170 × g and resuspended in 500 μL of ddH2O.

2.2.2. Preparation of gold nanostar-galactose dehydrogenase bioconjugate

The capped AuNS sample suspension was cleaned twice by centrifugation for 35 min at 2170 × g and resuspended in 500 μL of 100 mM HEPES (pH 6.9). Four batches of 500 μL each were then combined, making a total volume of 2 mL, and 100 μL 5 mM DTSSP was then added to the solution, followed by 100 μL of 8 mM NAD+ and 150 μL of GalDH 2 mg/mL. The solution was incubated at 4 ºC for 2 h to allow enzyme and coenzyme conjugation and immobilization. This co-immobilization was carried out to improve enzyme stability, activity, and selectivity or specificity [30,31,32]. Finally, the co-immobilized AuNS (AuNS-PVP-GalDH) was cleaned twice by centrifugation at 2170 ×g for 35 min, then resuspended in 500 μL ddH2O (Millipore, 18.2 ΩM. cm-1), and stored at 4 ºC.

2.2.3. Gold nanostar-galactose dehydrogenase biosensor colorimetric assay

The AuNS-PVP-GalDH plasmonic colorimetric tests were performed using galactose as an analyte and different H2O2 concentrations (0 mM, 0.05 mM, 0.10 mM, 0.15 mM, and 0.20 mM). Five distinct experiments were performed (as summarized in Table 1), with everything held constant and H2O2 concentrations varied. The reagents were pipette mixed in water to a final volume of 200 μL in the following order: Following the addition of 15 μL of 10 mM Tris buffer (pH 8.4) and 20 μL of AuNS-PVP-GalDH to each of the five experiments, different volumes (0 μL, 5 μL, 10 μL, 15 μL and 20 μL respectively per experiment) of 2 mM galactose were added and pipette mixed into the assays. The experiments were incubated for 10 minutes at 37 °C before adding (0 μL, 5 μL, 10 μL, 15 μL, and 20 μL, respectively) of each H2O2 concentration employed. The assays were then incubated for 5 minutes at 37 °C before adding the detection solution (2 μL 10 mM AgNO3 + 15 μL 150 mM NaOH). Finally, the assays in each experiment were incubated for 2 minutes at 37 °C before obtaining UV-Vis spectral readings and colorimetric signals.
The specificity and efficacy of the AuNS-PVP-GalDH assay were determined using spiked synthetic whole blood with various amounts of galactose. After spiking the synthetic blood matrix with 2 mM galactose, the sample was serially diluted 1000 times [33]. The detection of galactose was tested spectrophotometrically and visually by detecting color changes in the solutions after substituting galactose with synthetic blood-spiked galactose, as stated above. All experiments were done in triplicate.
2.2.3.1. The influence of the detection solution on the AuNS-PVP-GalDH biosensor
The alkaline environment and metal ion catalysts’ effects on the AuNS-PVP-GalDH biosensor in the aqueous matrix were examined. Furthermore, employing gold nanoparticle sizes, an assessment of gold nanoparticle nucleation or growth or colorimetric signal generation induced by pH fluctuations over time and metal ion catalysts was investigated [34].

3. Results

Figure 1 depicts the UV-vis spectral scans, 1H-NMR spectra, HR-TEM images, and electrophoretic migration of the AuNS-PVP-GalDH bioconjugate. The AuNS-PVP-GalDH bioconjugate exhibited a minor reduction in spectral resolution when compared to the AuNS and AuNS-PVP spectral profiles (Figure 1A). The HR-TEM images in Figure 1B demonstrate that the AuNS-PVP-GalDH complex was fairly monodispersed, with an estimated average size ranging from 28 to 30 nm and an average of 8 protuberant spikes on well-developed AuNS. Subsequently, the electrophoretic migration patterns indicate effective capping and protein bioconjugation to the AuNS rather than just being present in the sample (Figure 1C). The elemental composition and mapping images of the AuNS-PVP-GalDH bioconjugate are shown in Figure 1E,F. Furthermore, quantitative ICP-MS (result not given) and EDS data showed the presence of gold and other trace metals in the AuNS-PVP-GalDH bioconjugate.
These findings reveal that AuNS-PVP-GalDH bioconjugates were monodispersed, and heterogeneous and that the majority of nanostars had a spiky morphology primarily made up of gold (78%), sulphur (10%), and other trace elements, a result consistent with prior research [29].
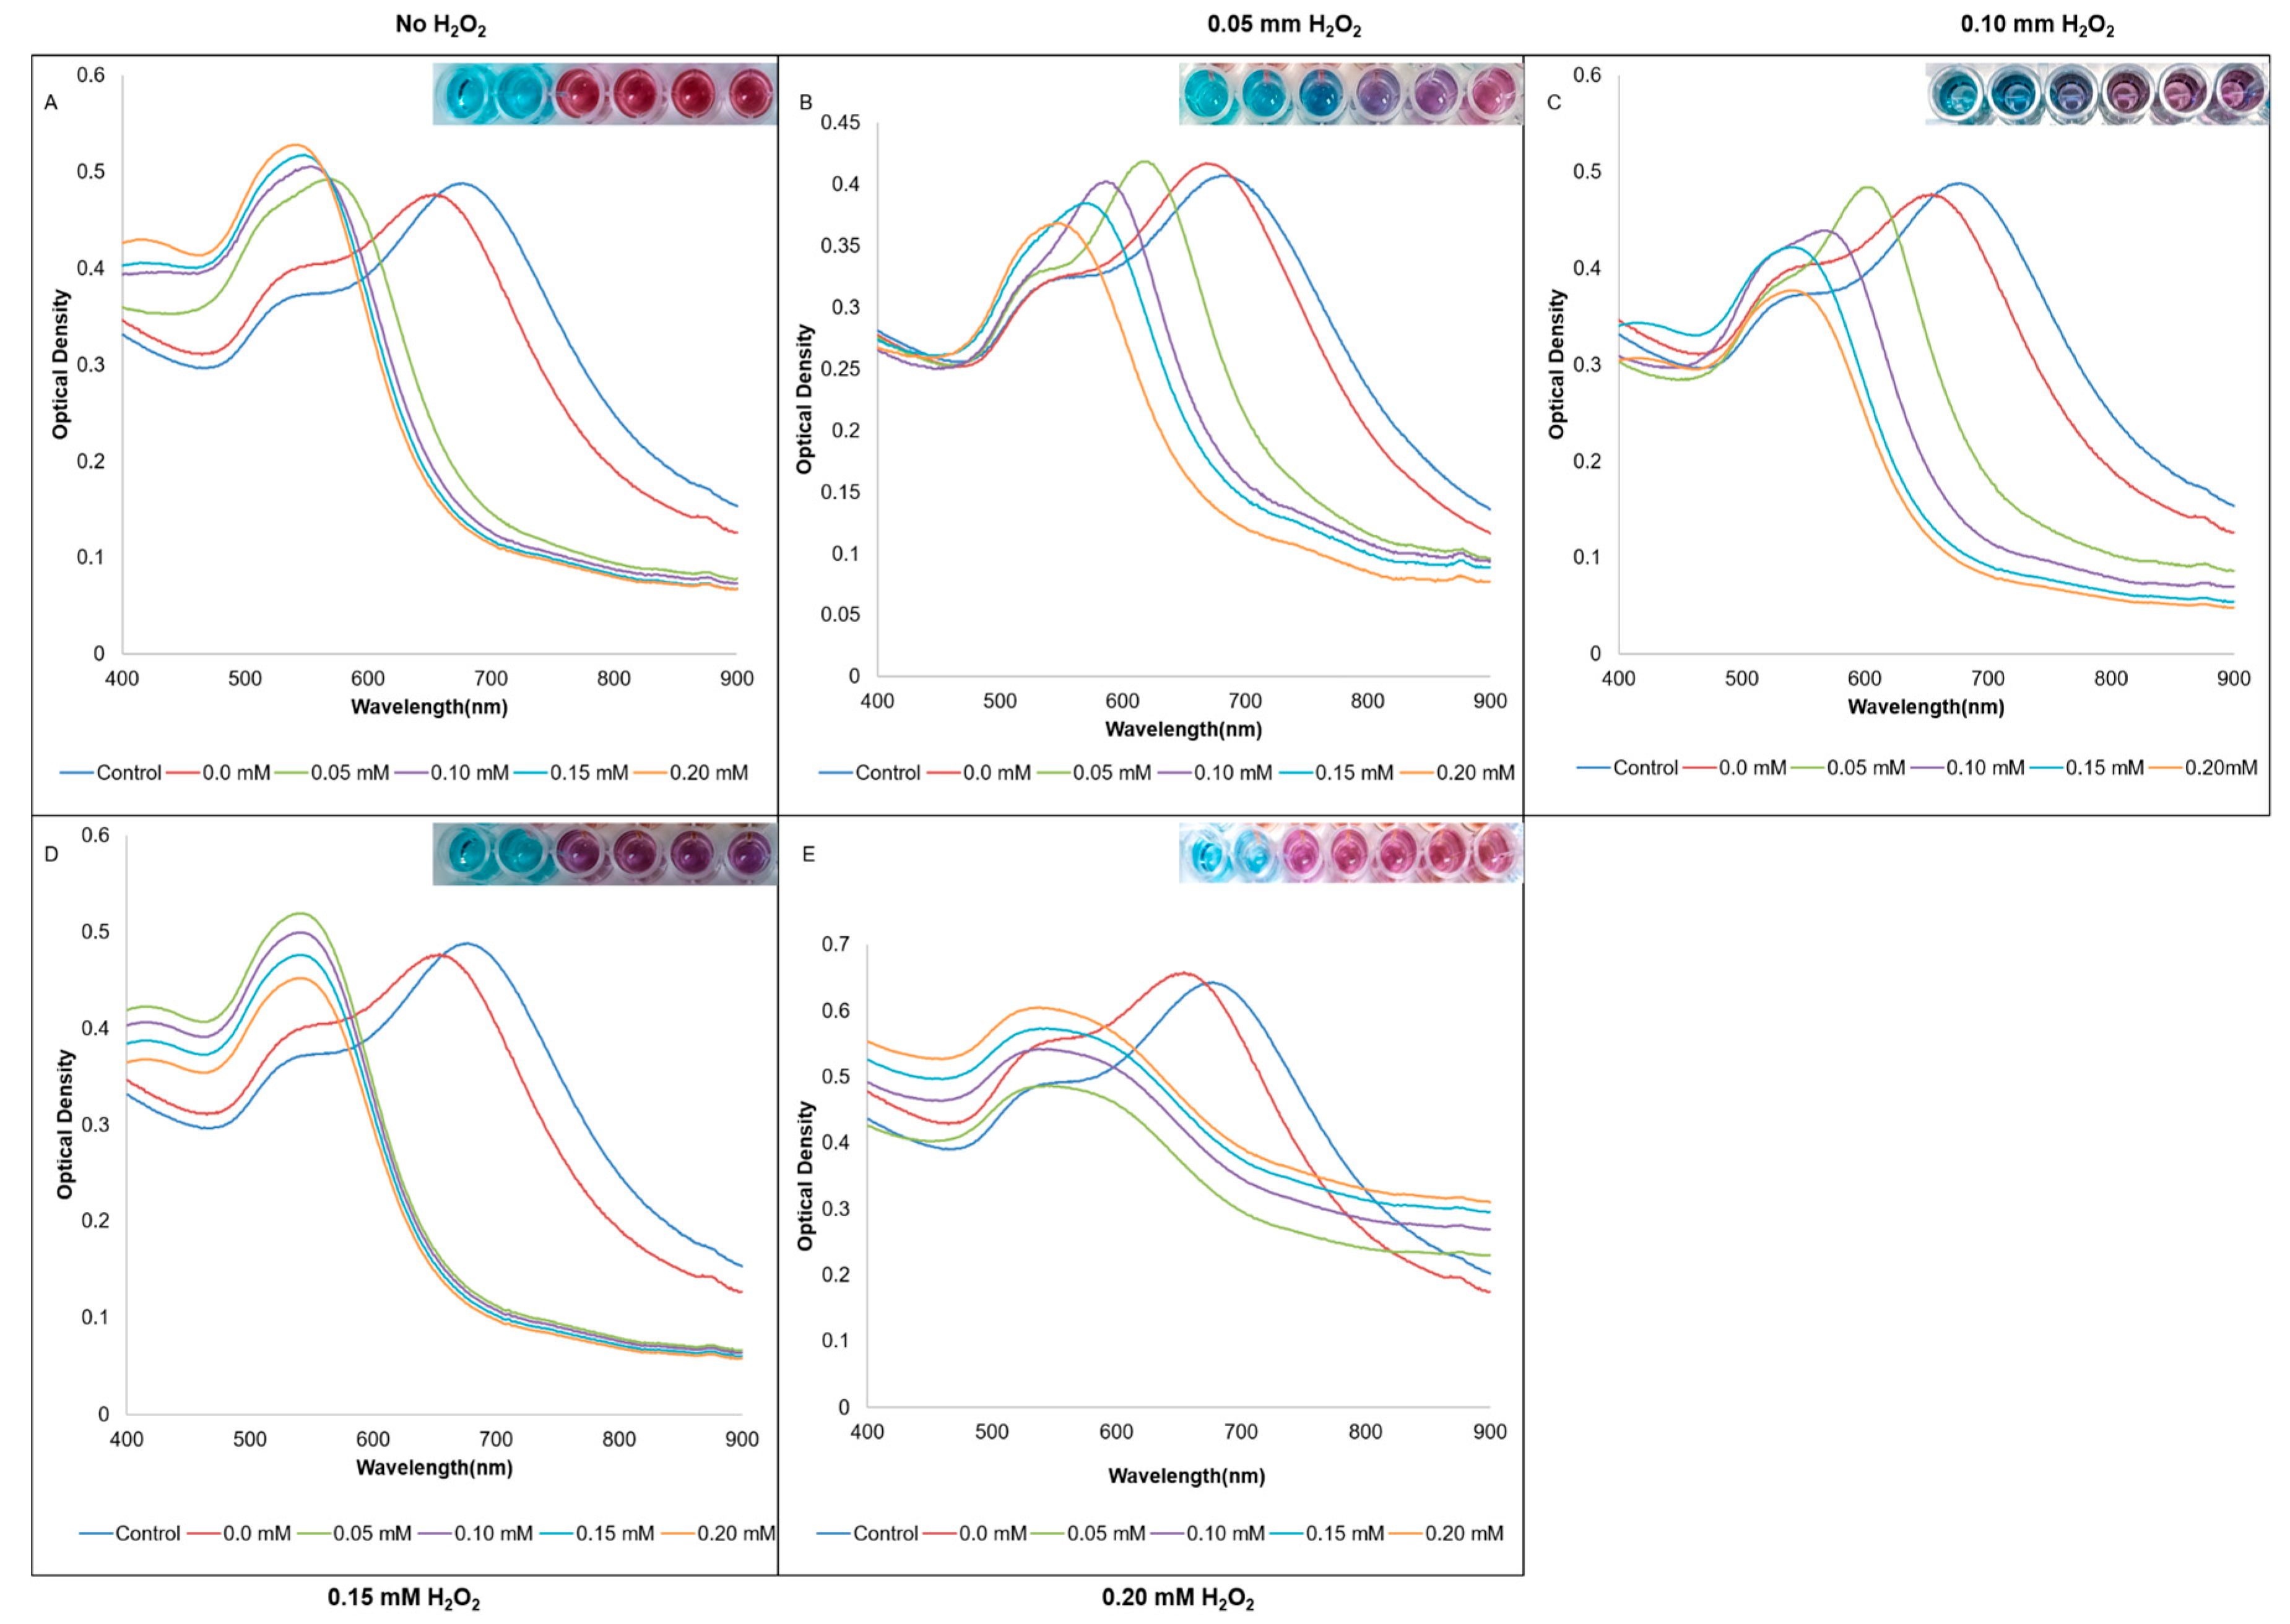
Figure 2 depicts the spectrometric and colorimetric results of the AuNS-PVP-GalDH assay in various galactose and H2O2 concentrations. Utilizing the H2O2-free assay, the biocatalytic reaction occurs instantaneously, generating a distinct red color, as shown in Figure 2A. Nonetheless, the biocatalytic reaction occurs slowly in the 0.05–0.10 mM H2O2 concentration range, producing multicolorimetric readings and improved UV-Vis spectral profiles within 2 minutes of incubation. As shown in Figure 2D-E, H2O2 rapidly induced AuNS UV-Vis spectral profiles transformation into spherical AuNP profiles, and the biocatalytic reaction proceeds instantaneously in the 0.15–0.20 mM H2O2 concentration range.
The results showed that concentration-dependent etching of the AuNS-PVP-GalDH assay was most visible when the H2O2 concentration was 0.05 mM, indicating that 0.05 mM was the optimal H2O2 concentration. Furthermore, the results demonstrated that H2O2 concentration affects the rate of colorimetric signal generation and the degree of longitudinal plasmon band (LPB) etching and transverse plasmon mode (TPB) growth.
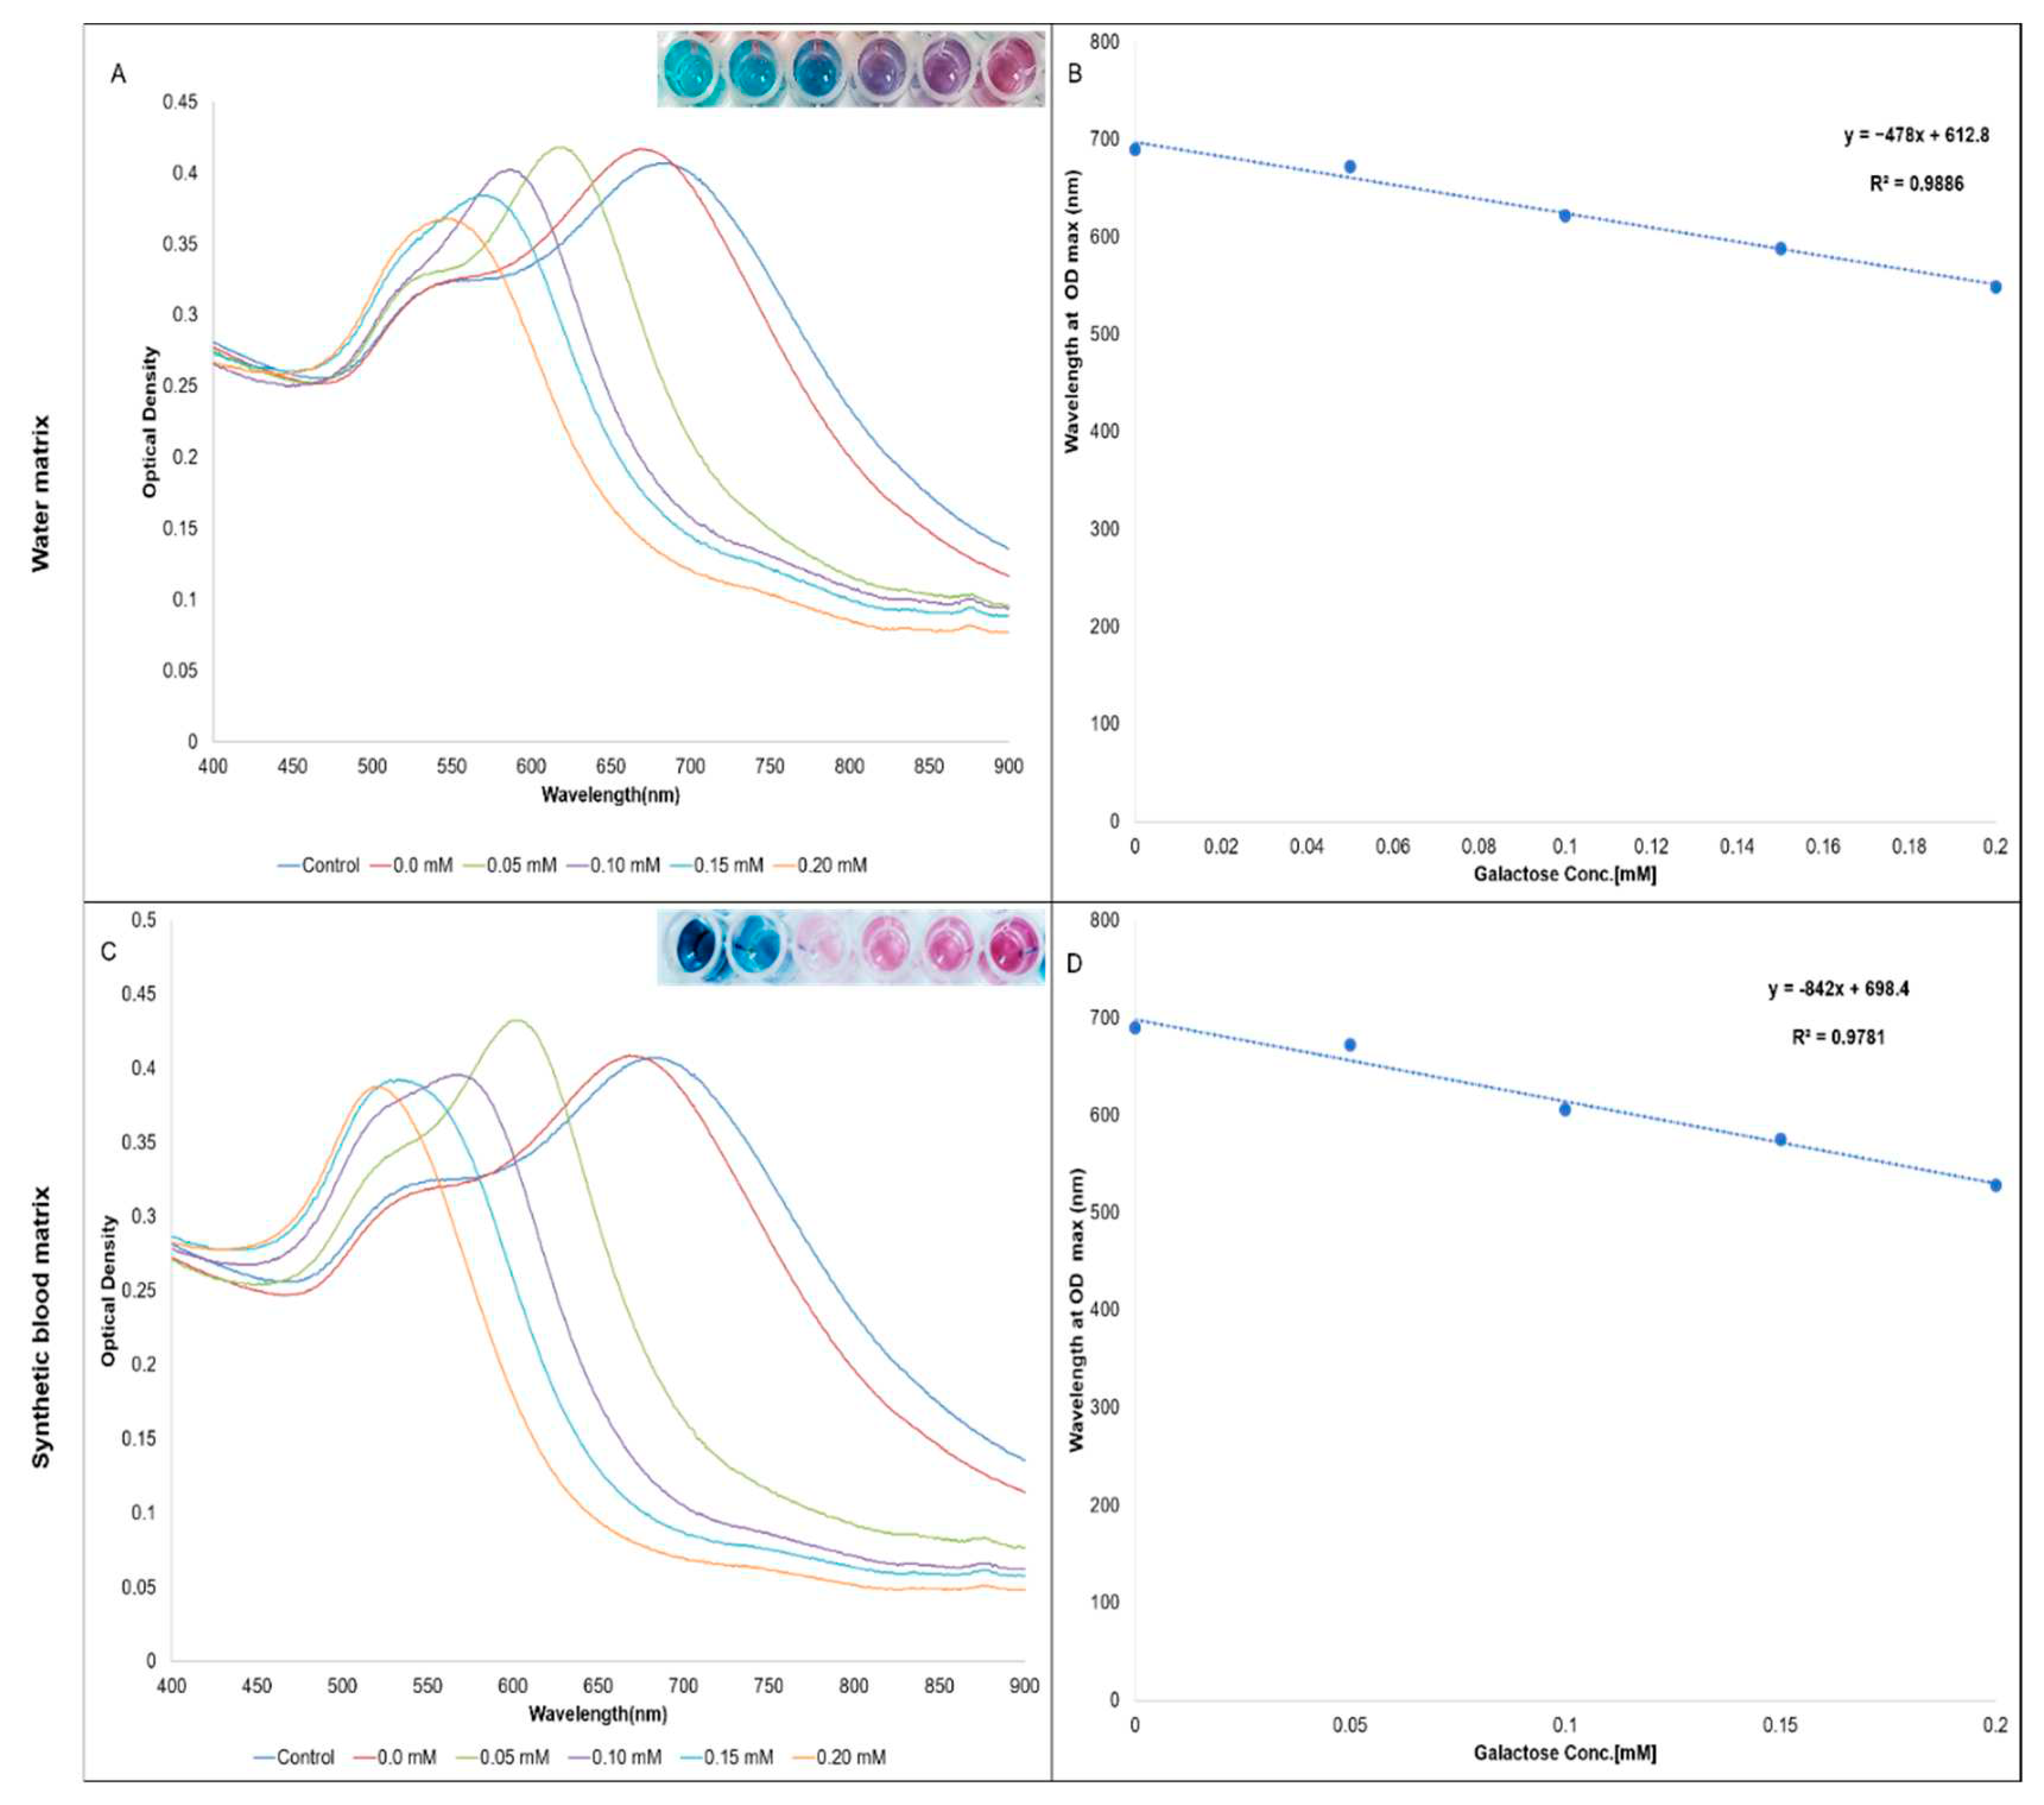
As a proof of concept, the optimized NADH-H2O2-driven assay measured various galactose concentrations in synthetic blood, yielding multicolorimetric and concentration-dependent spectrum signals (Figure 3).
The AuNS-PVP-GalDH spectrum before the colorimetric biocatalytic reaction exhibits two well-resolved bands centered at about 550 and 700 nm, respectively. In contrast, the LLSPR spectra (700 nm) showed a significant drop in absorbance and a strong blue shift as galactose concentration increased, and the intensity of the TLSPR spectra (550 nm) increased. At 0.2 mM galactose concentration, single TLSPR spectra at 550 nm were detected, demonstrating the full transition of AuNS to quasi-spherical nanostructures. Furthermore, the subsequent changes in the AuNS may be visualized as a progressive change in the solution color from turquoise blue to purplish-blue to red-pink to wine-red in the water matrix and from turquoise blue to red-pink to wine-red in the synthetic blood matrix with good mathematical correlations (Figure 3).
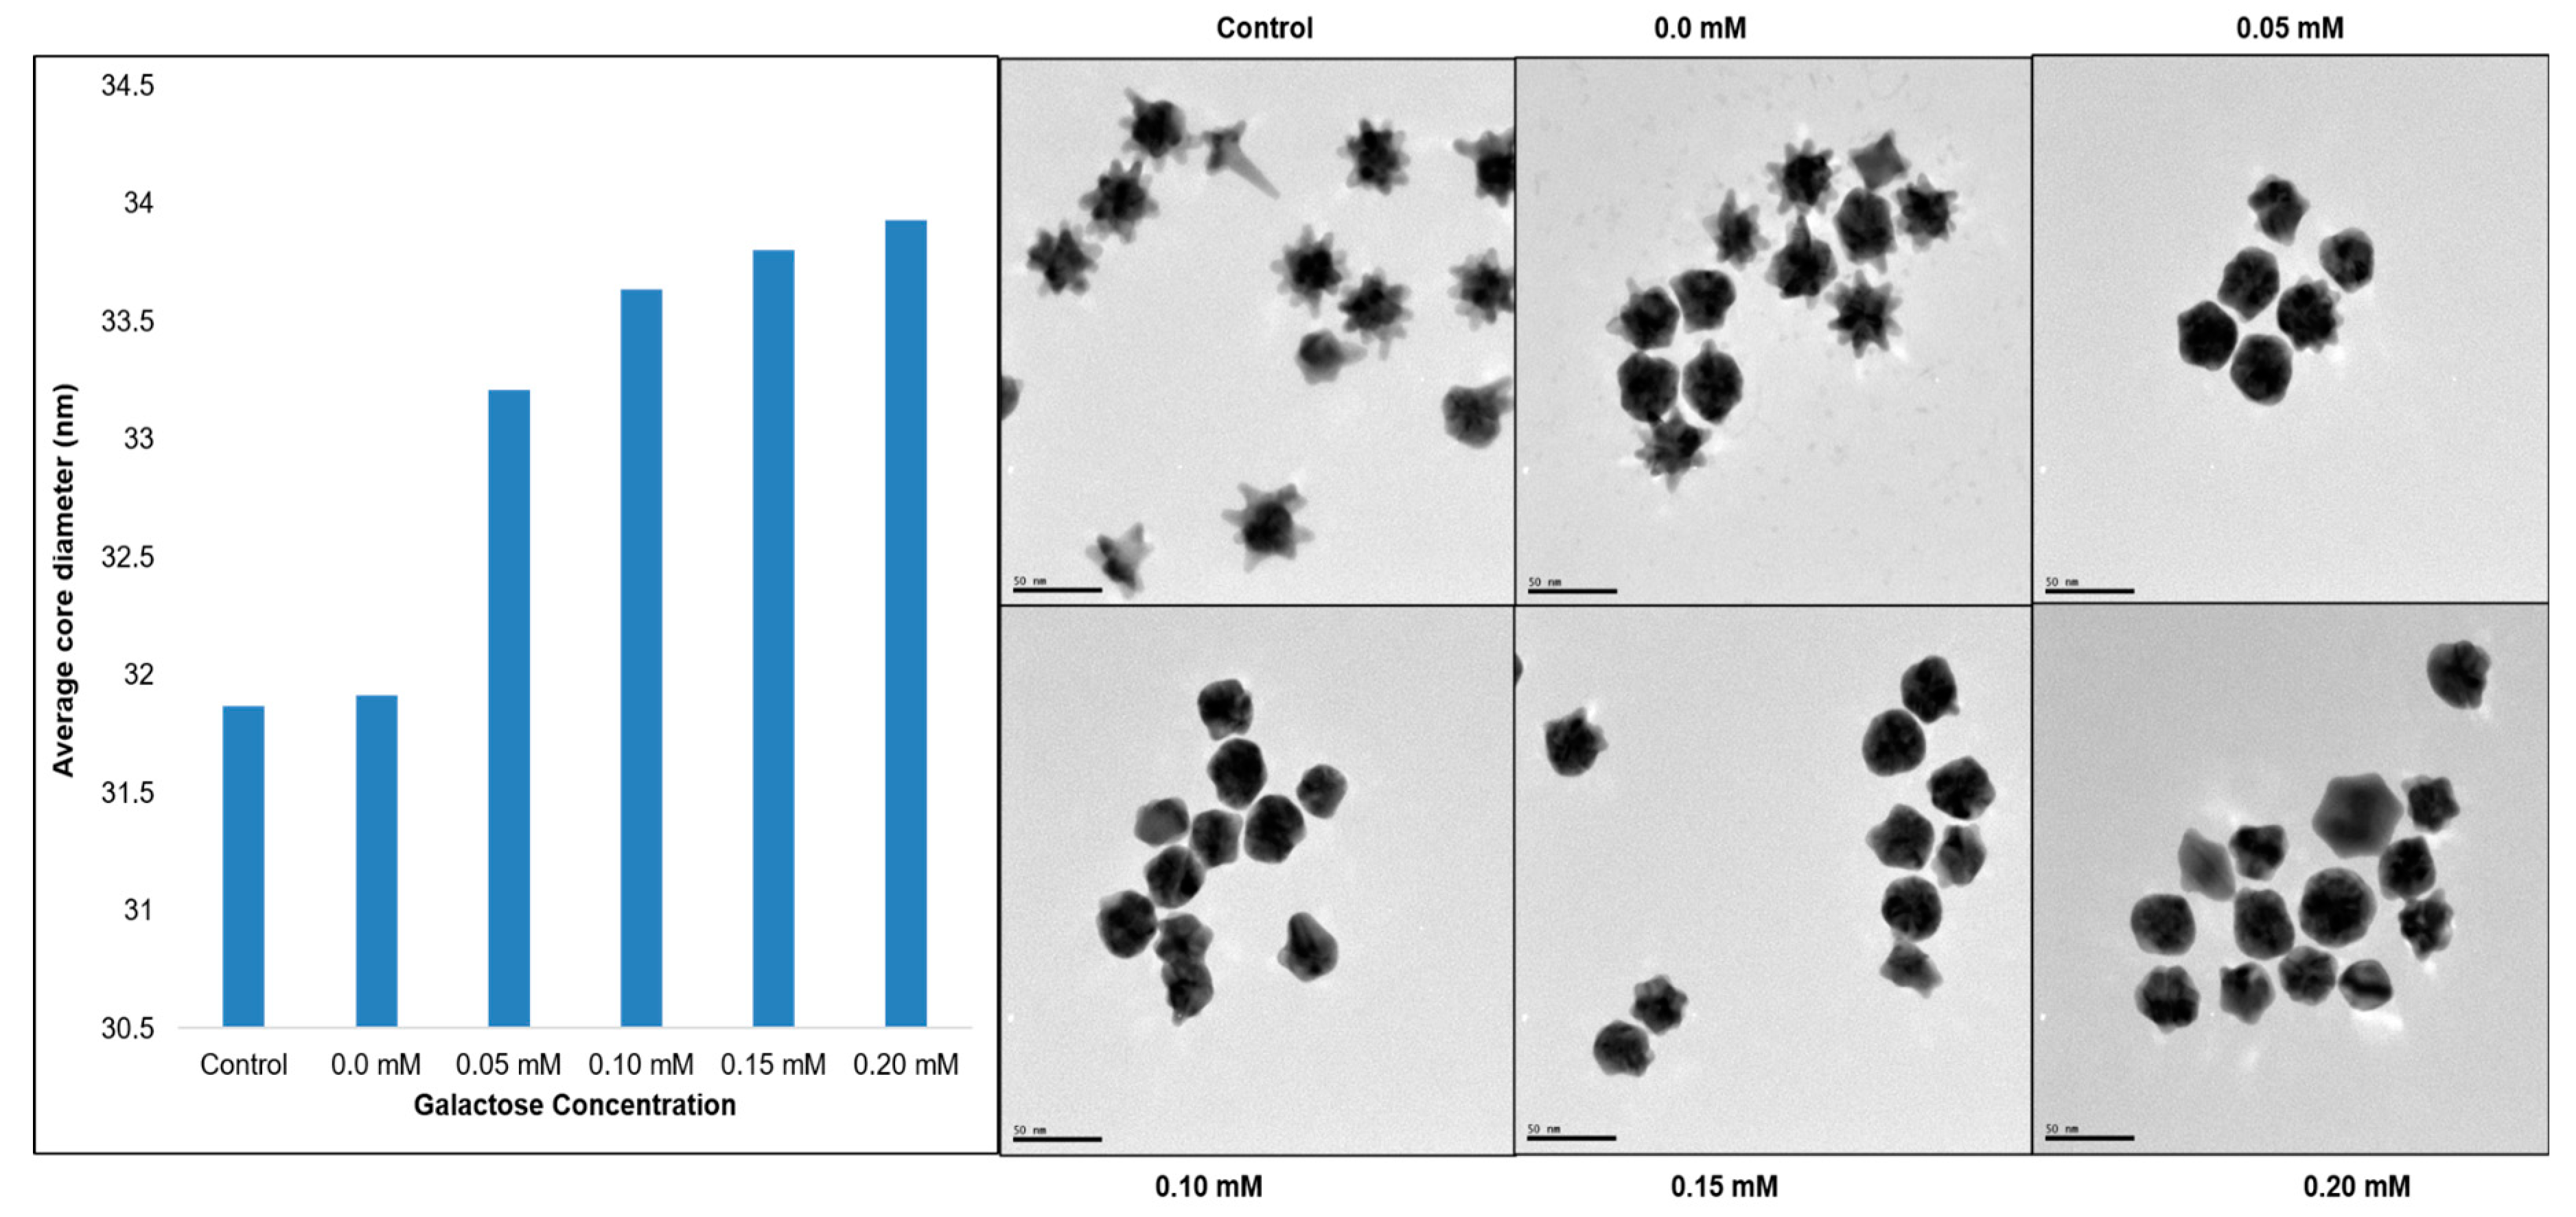
The HR-TEM images of the morphological alterations that occurred during the biorecognition reaction are shown in Figure 4. The nanostructures remained star-shaped in the absence of galactose. When galactose concentrations were increased, the AuNS progressively became more quasi-spherical, with evident core diameter enlargement from approximately 30-34 nm.
Overall, the colorimetric biorecognition reaction’s representative TEM images revealed a transition from a high yield of branching particles to the existence of high quasi-spherical morphologies.
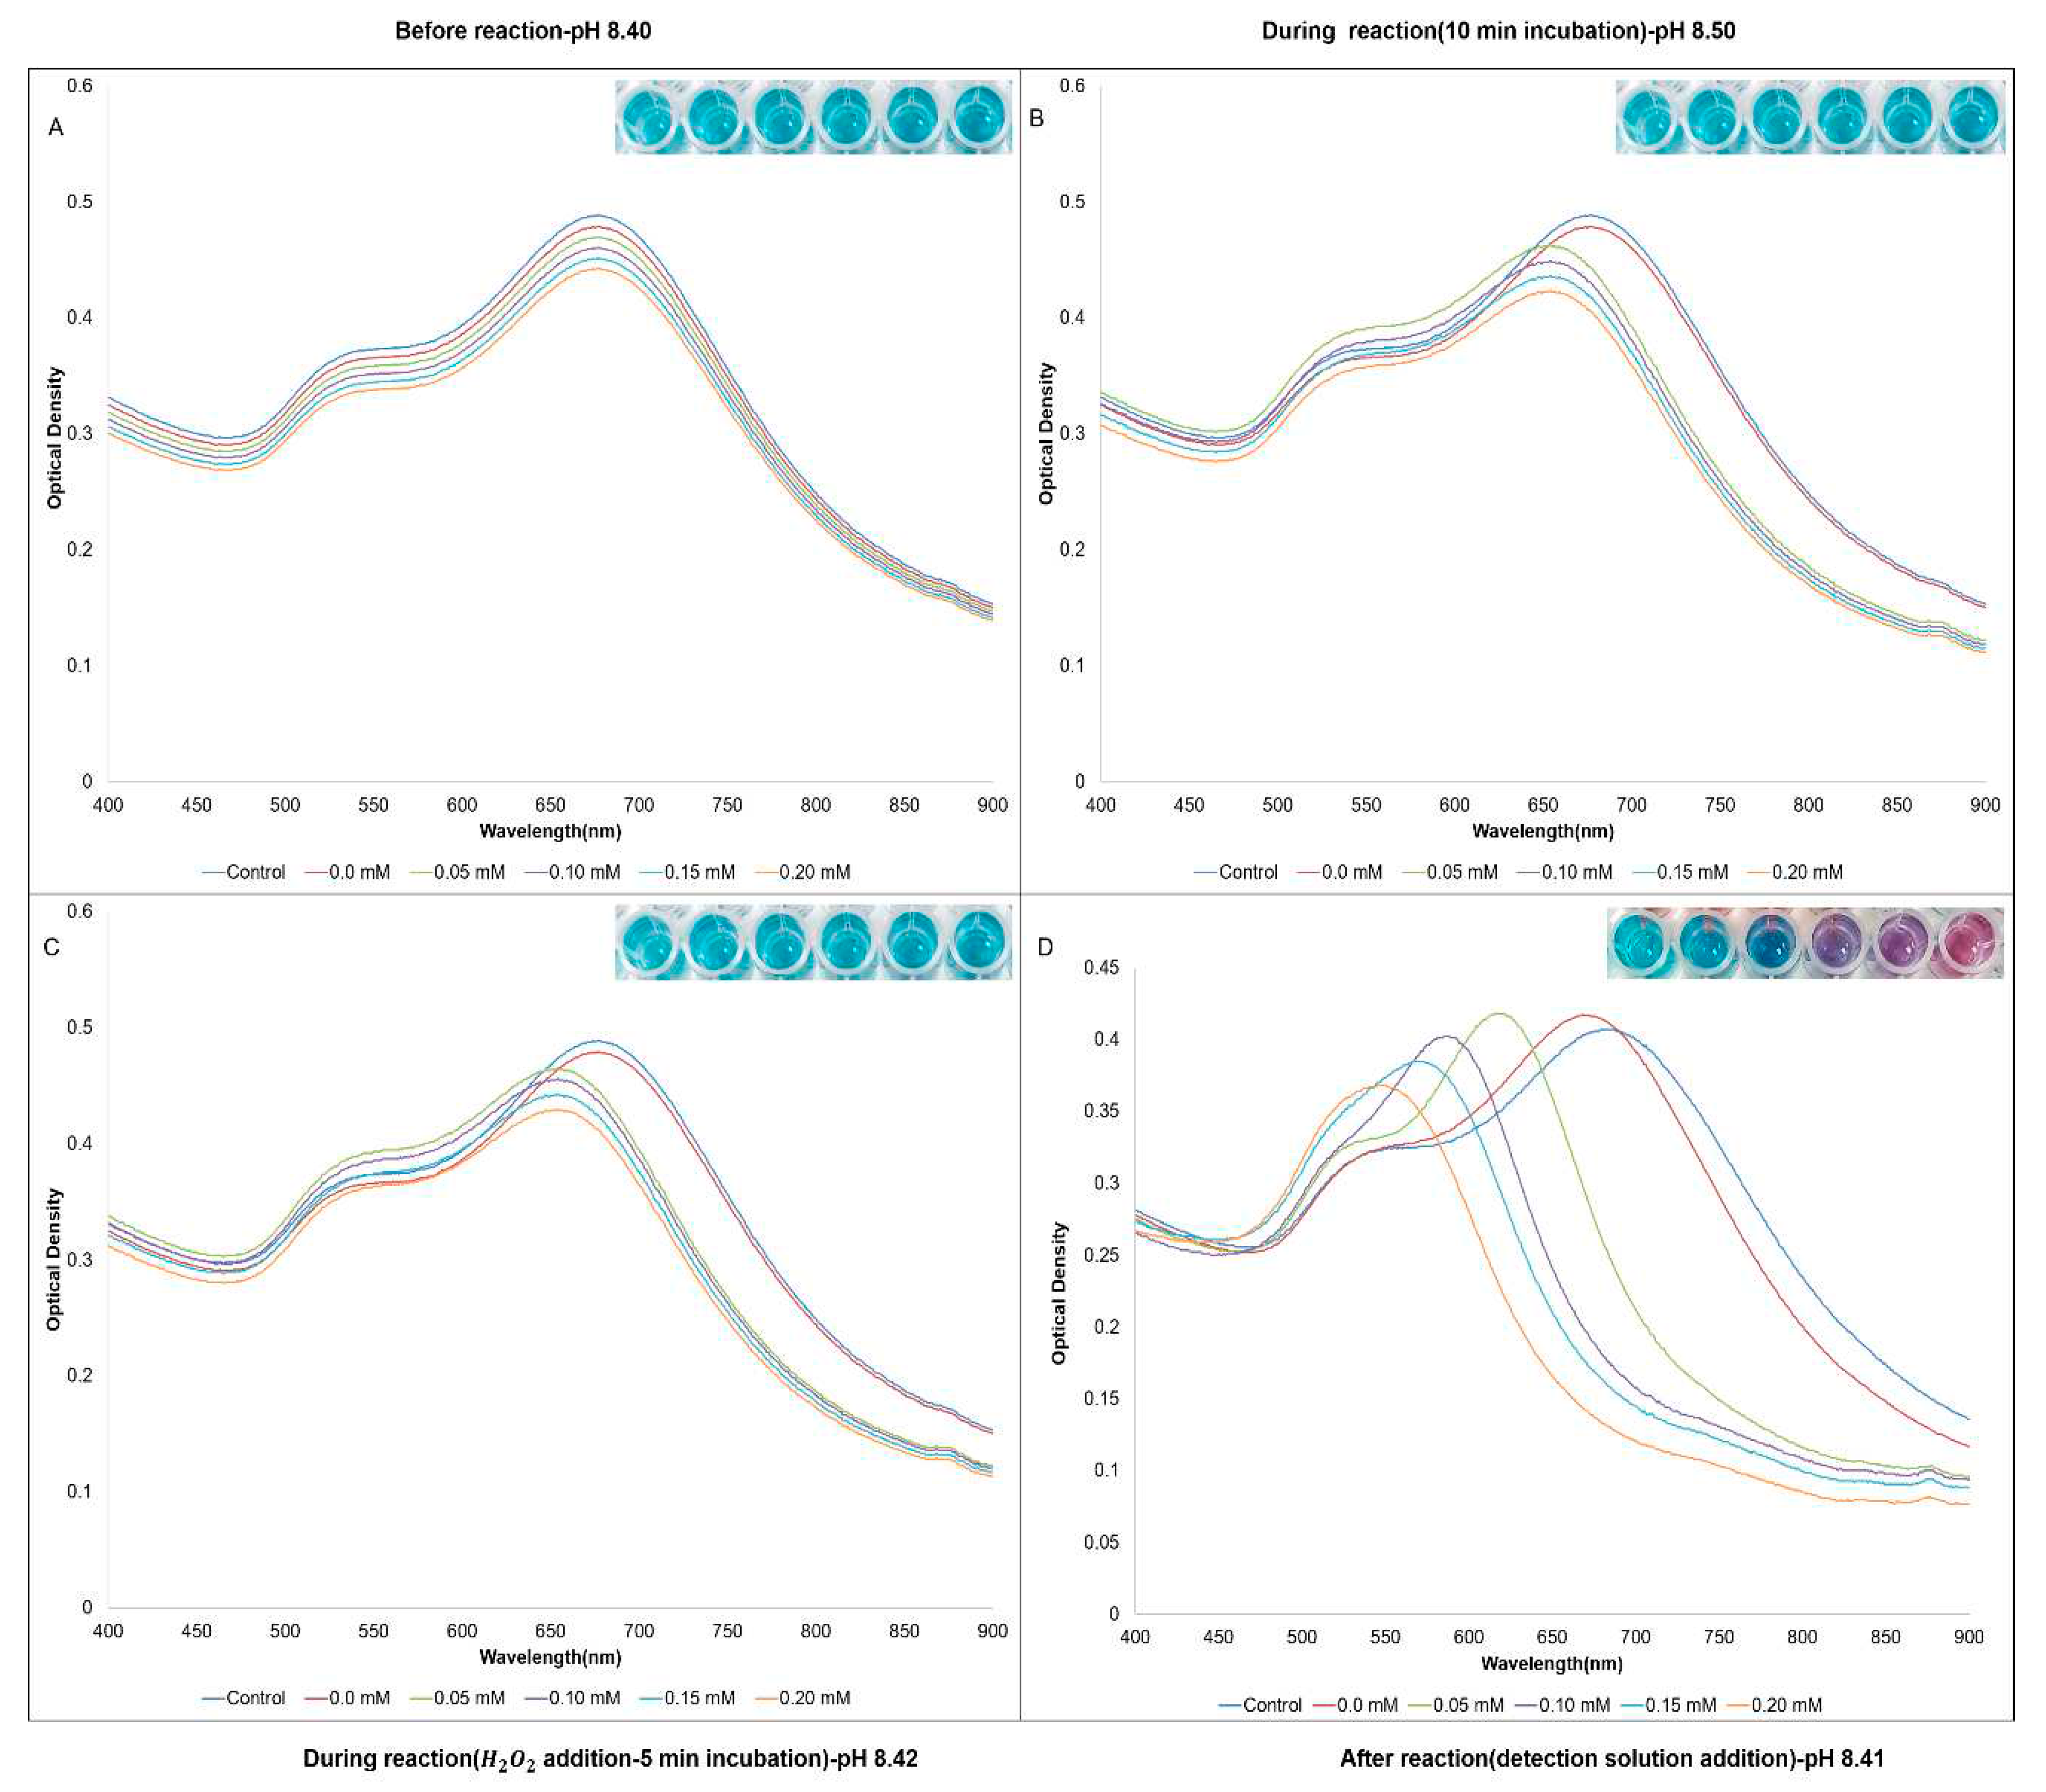
The UV-Vis spectrum changes and colorimetric signals, as well as the accompanying pH fluctuations, are depicted in Figure 5. Even in the presence of varying galactose/NADH and H2O2 concentrations, the bioassays maintained their turquoise blue color with essentially identical spectrum changes as the reaction progressed (Figure 5 B-C). The bioassays only produced convincing colorimetric and spectral signals when the detection solution was added (Figure 5D), which is consistent with earlier research [35,36].
The pH increased from 8.4 to 8.5 during the 10-minute incubation at 37 ⁰C as the biosensor worked on the analyte producing NADH, and when H2O2 was added to the reaction mixture, the pH dropped to 8.42 after the 5-minute incubation at 37 ⁰C, and finally the pH dropped to 8.41 after the addition of the detection solution and 2-minute incubation at 37 ⁰C. Overall, even in the presence of the redox agents NADH and H2O2, there was no colorimetric signal generation in the absence of an alkaline environment and metal ions catalyst in the AuNS-PVP-GalDH biosensor.

4. Discussion

The HEPES-mediated seedless one-pot synthesis protocol was utilized to synthesize anisotropic AuNS. In this approach, HEPES worked as a mild reducing, stabilizing, and shape-directing agent, resulting in heteromorphic nanostars of varying diameters (Fig 1. B) [37]. Numerous studies have demonstrated that HEPES has a high affinity for gold, which could be attributed to the sulfonate groups that constitute its chemical structure [38,39]. This could account for its existence in the AuNS lattice post-synthesis, as demonstrated by elemental results (Fig 1. E-F) and 1H-NMR analyses (Fig 1.C), which are consistent with previous research [29,39,40].
The anisotropic AuNS were characterized by a hybrid of two distinct UV-Vis absorbance peaks, corresponding to the plasmonic solid core (TLSPR spectra) and the plasmonic protuberant spikes (LLSPR spectra) [6,9,41]. The AuNS core acts as a nanoscale antenna, greatly enhancing the excitation cross section and electromagnetic field enhancements of the AuNS spike plasmons [6,9,42]. As a result of its hybrid shape, anisotropic AuNS have a variety of energy states, with AuNS spikes having a higher energy level than the AuNS core [6,42,43]. The spikes have a higher energy state due to increased surface area and localization of electron flux from the core, which creates a strong electric field (lightning rod effect) [6,9,42].
During the AuNS bioassay synthesis, the relevance of NAD+ on the structure and activity of GalDH prompted us to co-immobilize GalDH (apoenzyme) and NAD+ (coenzyme) to the AuNS. GalDH is a dimer dominated by a (β/α)8 barrel that permits NAD+ to bind and create an apoenzyme-coenzyme complex [31,44,45]. NAD+ acts as a conformation primer, stabilizing the oligomeric catalytically active structure of the apoenzyme-coenzyme complex [46,47]. The apoenzyme-coenzyme complex, working on the C1 position of the sugar substrate, catalyzes the dehydrogenation of b-D-galactose pyranose to galactonate and NADH [48,49].
The colorimetric technique was divided into two phases: the generation of redox agents from the apoenzyme-coenzyme complex and the activation of morphological change in the AuNS structure by adding the detection solution [22]. The generation of redox agents on its own is insufficient to induce morphological changes, as was shown in Figure 3 and previous studies [28,29,33]. In the presence of neo-formed NADH, the bioassay produced instantaneous monocolorimetric results (Figure 2A). Furthermore, in the H2O2-free assay, the rate of colorimetric signal generation was instantaneous; this phenomenon might be attributed to pH, temperature, or AuNPs catalysis for the oxidative recycling of NADH to NAD [24,50,51]. In some instances, the addition of H2O2 to the bioassay resulted in better-localized surface plasmonic resonance (LSPR) band shifts and modest colorimetric signal generation rates (Figure 2B-C) [4,52,53]. As a result, the colorimetric signal generation rates increased as peroxide concentration increased (Figure 1D-E).
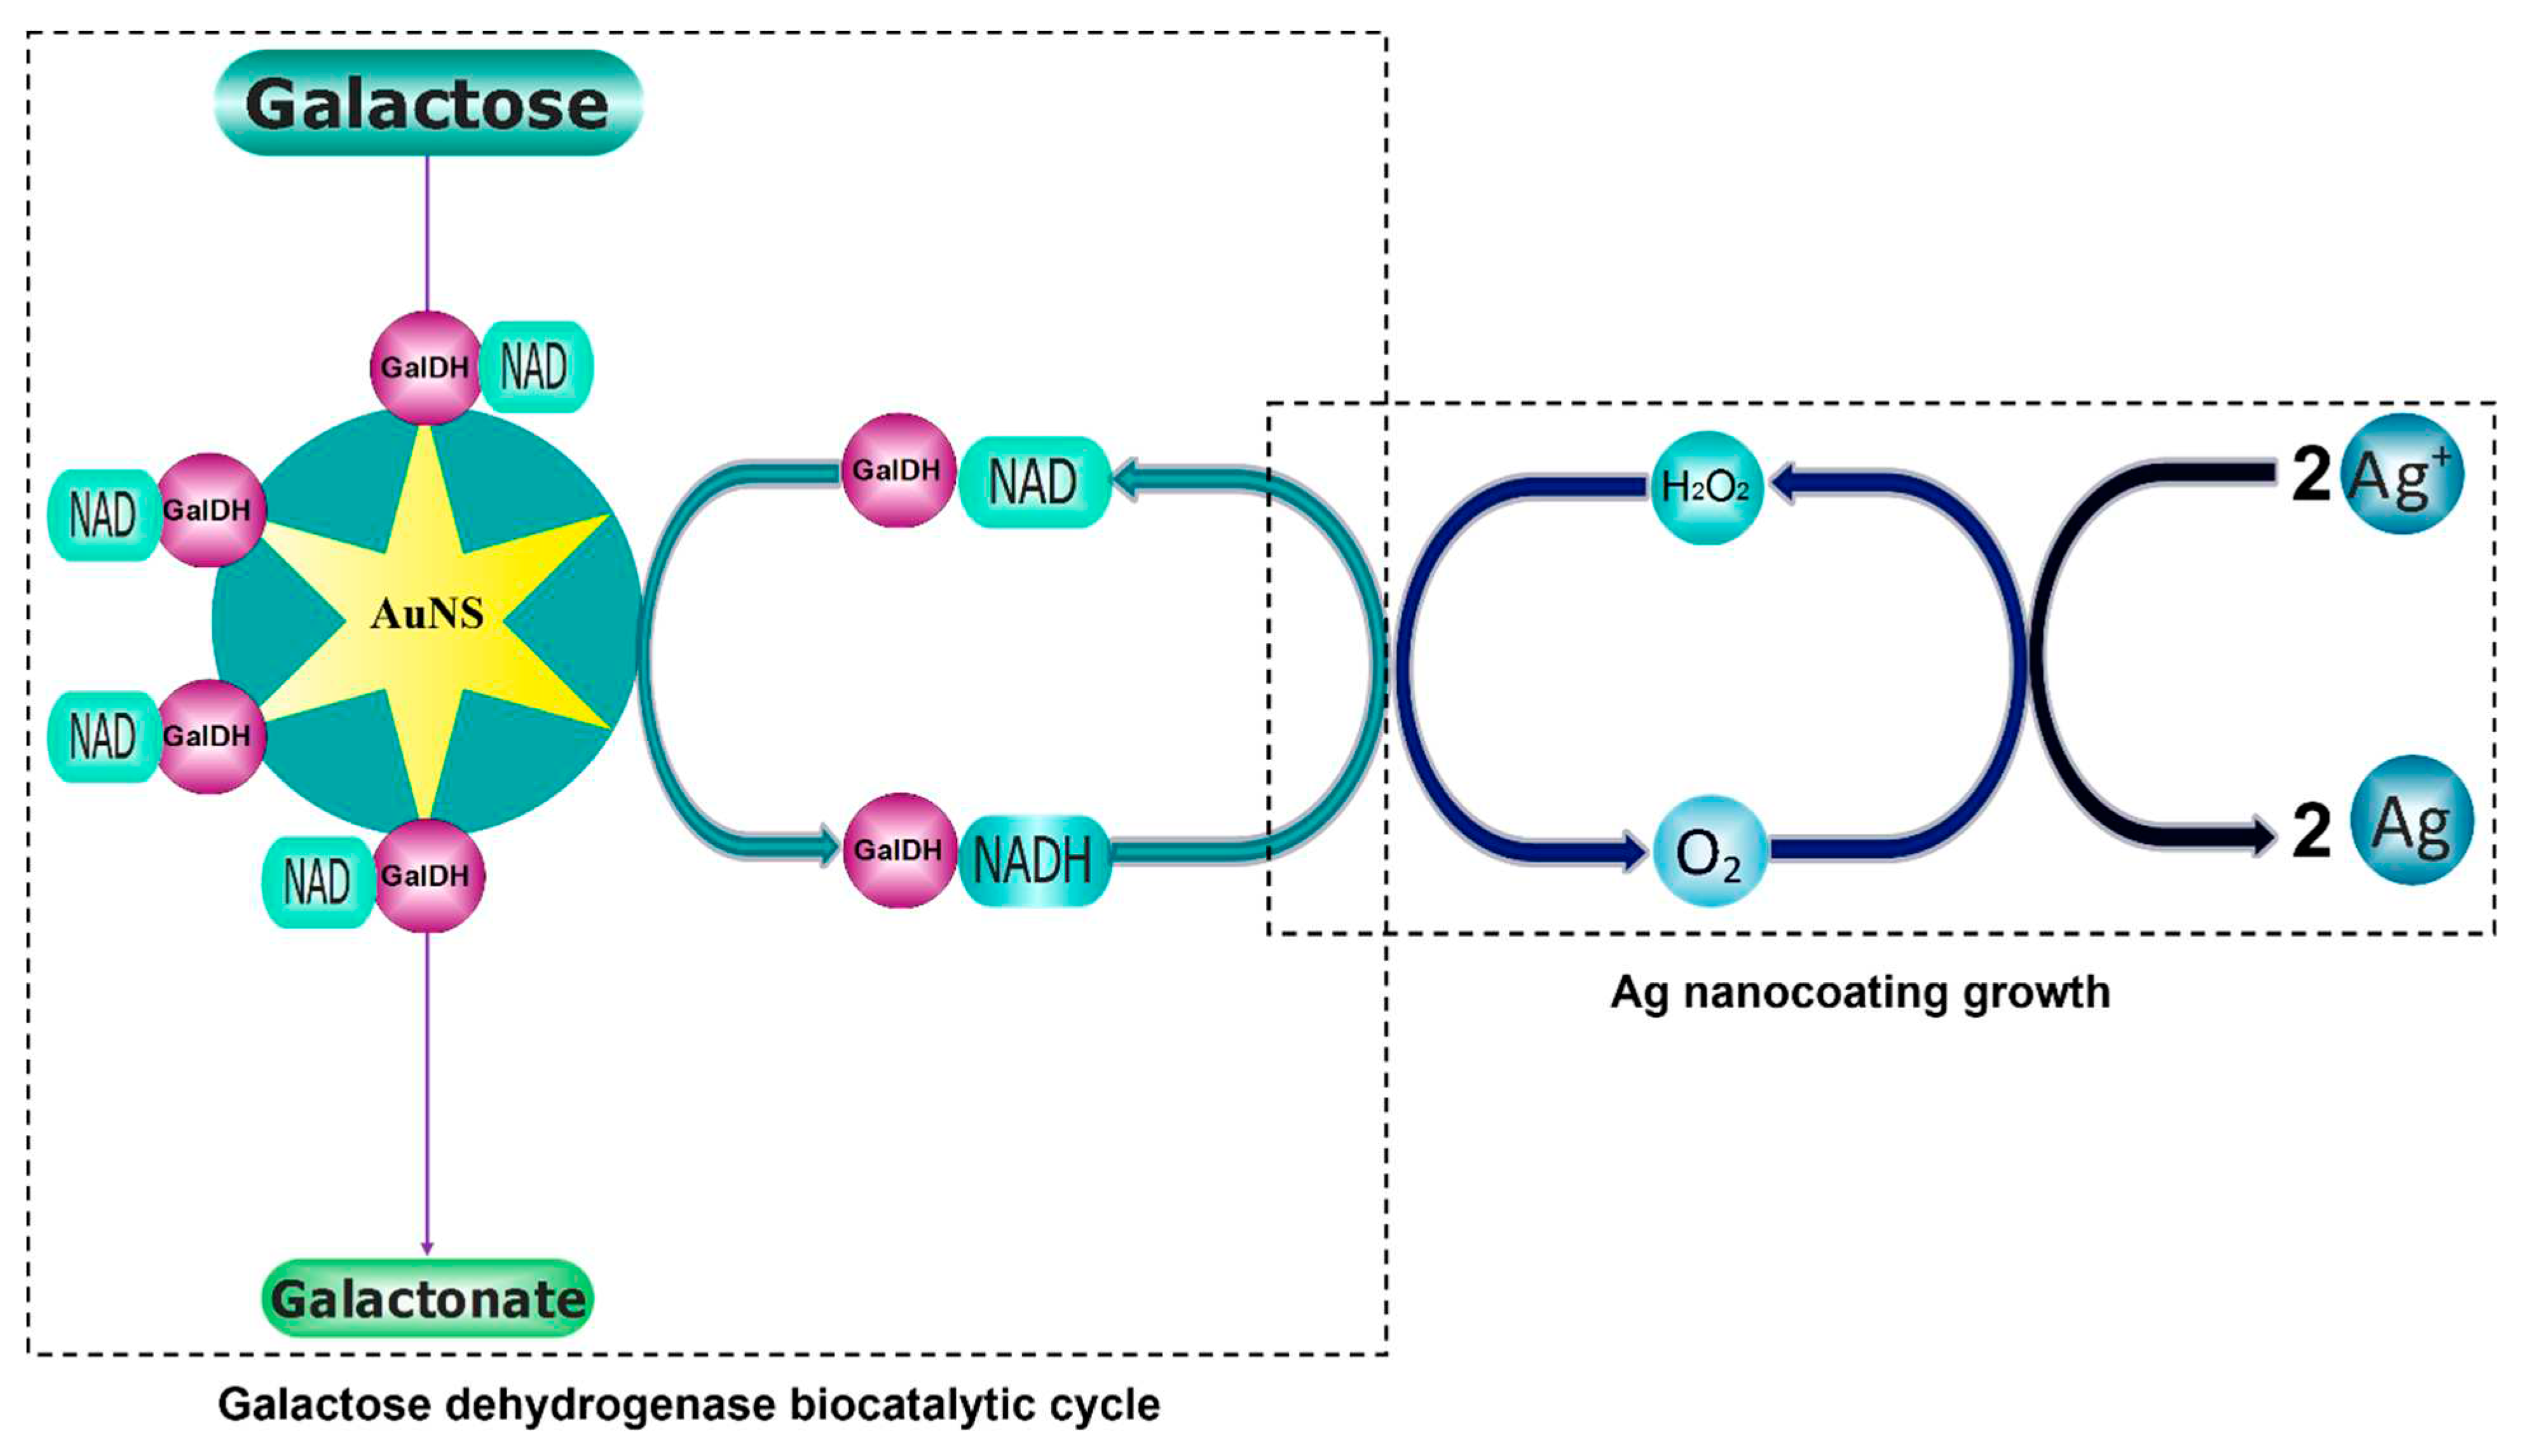
The assay generates an excess of NADH (reducing agent), and NADH is a probable primary reducing agent for Ag+ ions during the formation of the colorimetric signal [54]. Scheme 1 depicts our proposed signal-generation technique, with NADH triggering Ag + ions reduction on AuNS and low H2O2 concentration causing AuNS remodeling into quasi-spherical AuNPs with enlarged core diameters, as supported by TEM images (Figure 3) [36].
In the presence of the detection solution, however, H2O2 has the ability to oxidize both the AuNS and the neo-formed NADH, resulting in plausible morphological and colorimetric changes to AuNS [36,55].In simple terms, GalDH generates NADH, which reduces Ag+ ions to grow an Ag coating around the AuNS; (i) at low concentrations of NADH and H2O2, the nucleation rate is slow, favouring the growth of a surface conformal Ag coating that induces a concentration-dependent blueshift in the AuNS’s LSPR; (ii) at high concentrations of NADH and H2O2, the fast crystal growth conditions favour Ag nanocrystal nucleation and less Ag is deposited on the AuNS, resulting in monocolorimetric signals (Figure 2). The plasmonic AuNS biosensor’s signal amplitude is determined by the rate of crystallization, which favours Ag0 coating growth on existing nanocrystals [36]. To validate this theory, the presence of growth in AuNPs diameter in solutions containing AuNS-PVP-GalDH biosensor after the biocatalytic reactions were observed using TEM images and Image-J software (Figure 4). These findings support the suggested mechanism whereby low H2O2 concentrations cause a slow rate of crystallization, which favours the growth of a Ag coating on Au seeds, and NADH is the primary Ag+ reducing agent.
Overall, these findings demonstrate that the signal registered by the AuNS biosensor (transducer) together with the physico-chemical properties of the nanosensor, pH, temperature, detection solution concentration, H2O2 concentration, presence of capping agents, and presence of contaminants may all impact the generation of the AuNS biosensor colorimetric signals. As a result, the findings suggest that, with appropriate assay tailoring, the AuNS-PVP-GalDH biosensor can be employed as both a qualitative (Figure 2.A) and quantitative (Figure 2.B) biosensor.
However, the AuNS-PVP-GalDH biosensor relied on the blue-shifted absorption band of nanostar (690 nm) to quasi-spherical nanoparticles (540 nm) during NADH and H2O2 biocatalytic reactions (Figure 2). The bioassay had a potential downside when using a synthetic blood matrix because most synthetic blood components have significant absorption in the same range as the AuNPs [56,57,58]. In addition to AuNS having a higher extinction coefficient when compared to components, matrix dilution, and blank subtraction approaches were also used to improve result interpretation and analysis [59,60].
Weng et al. (2019), on the other hand, described a NADH-mediated suppression of H2O2-induced gold nanorods etching [23]. The bromine intermediates (Br3- and Br2) from cetyltrimethylammonium bromide (CTAB) and 5-bromosalicylic acid (5-BrSA) used to etch gold nanorods were reduced and consumed in the presence of NADH, inhibiting the etching rate and resulting in a slight blue shift of the LPB. Maugeri et al. (2023) recently developed a unique photothermal-contrast method for detecting phenylalanine (Phe) in human blood using phenylalanine dehydrogenase (PDH), resulting in the formation of in-situ AuNPs in the presence of neo-formed NADH and AuCl4[61]. Jafari et al. (2021) proposed a colorimetric paper-based biosensor based on the PDH enzyme for highly sensitive and selective quantification of Phe, using neo-formed NADH, cationic dyes, and AuNPs as colorimetric mediators [62].
Our findings indicate that the NADH-H2O2-driven competitive assay biocatalytically drives AuNP growth, resulting in concentration-dependent morphological, spectrophotometric, and colorimetric changes. H2O2-mediated surface etching can adjust the surface plasmon resonance of AuNS by swiftly and sensitively etching the high-energy facets of the AuNS protrusions [6,42,43,63]. The NADH-catalyzed oxidation of Au3+ ions allow for in-situ AuNP development is consistent with the findings of Maugeri et al. (2023). The etched AuNS serve as seeds for Au0 deposition, eventually leading to the biocatalytic development of larger diameter quasi-spherical AuNPs [64]. Furthermore, AuNS served as signal amplifiers and immobilization scaffold in our biosensor design, eliminating the necessity for cationic dyes, as suggested by Jafari et al. (2021) [65,66,67].

5. Conclusions

In this study, AuNS were employed to develop a multicolorimetric NADH biosensor based on simple and sensitive surface etching and growth of AuNPs. In the presence of NADH, H2O2, and the detection solution, the AuNS-PVP-GalDH biosensor was etched into quasi-spherical nanostructures with increased core diameters. The etching and growth processes resulted in NADH concentration-dependent colorimetric signals that were visible to the naked eye. Finally, the AuNS-PVP-GalDH assay offers a novel galactose plasmonic colorimetric detection method with remarkable sensitivity in simple and complex matrices. In addition, the NADH-H2O2-driven gold nanostar etching system provides a promising practical analytical target detection technique in resource-limited settings.

Author Contributions

Tozivepi Aaron Munyayi conceived the study, designed the study, carried out the laboratory work, participated in data analysis, and drafted the manuscript. Barend Christiaan Vorster, Engela Helena Conradie, and Danielle Wingrove Mulder participated in the design of the study, data analysis, and integrity of the manuscript. All authors gave their approval for publication.

Funding

This research was funded by North West University Potchefstroom, Centre for Human Metabolomics.

Data Availability Statement

The supporting data is accessible on the Figshare repository; https://doi.org/10.6084/m9.figshare.23798394.v2.

Acknowledgments

We would like to acknowledge Dr. Innocent Shuro from the Laboratory for Electron Microscopy, North-West University, Potchefstroom, South Africa, for assistance with obtaining the nanoparticle images. We would also like to thank the North West University’s Centre of Human Metabolomics (CHM) and the South African Technology Innovation Agency (TIA) for the funding given in order to carry out this work.

Conflicts of Interest

The authors declare no conflict of interest.

References

  1. Chirico, G.; Borzenkov, M.; Pallavicini, P. Gold Nanostars: Synthesis, Properties and Biomedical Application. Gold Nanostars 2015. [Google Scholar] [CrossRef]
  2. Wen, X.; Ou, L.; Cutshaw, G.; Uthaman, S.; Ou, Y.C.; Zhu, T.; Szakas, S.; Carney, B.; Houghton, J.; Gundlach-Graham, A.; et al. Physicochemical Properties and Route of Systemic Delivery Control the In Vivo Dynamics and Breakdown of Radiolabeled Gold Nanostars. Small 2023, 19, e2204293. [Google Scholar] [CrossRef] [PubMed]
  3. Liu, X.-L.; Wang, J.-H.; Liang, S.; Yang, D.-J.; Nan, F.; Ding, S.-J.; Zhou, L.; Hao, Z.-H.; Wang, Q.-Q. Tuning Plasmon Resonance of Gold Nanostars for Enhancements of Nonlinear Optical Response and Raman Scattering. The Journal of Physical Chemistry C 2014, 118, 9659–9664. [Google Scholar] [CrossRef]
  4. Li, Y.; Ma, J.; Ma, Z. Synthesis of gold nanostars with tunable morphology and their electrochemical application for hydrogen peroxide sensing. Electrochimica Acta 2013, 108, 435–440. [Google Scholar] [CrossRef]
  5. Liu, Y.; Yuan, H.; Fales, A.M.; Register, J.K.; Vo-Dinh, T. Multifunctional gold nanostars for molecular imaging and cancer therapy. Front Chem 2015, 3, 51. [Google Scholar] [CrossRef] [PubMed]
  6. Hao, F.; Nehl, C.L.; Hafner, J.H.; Nordlander, P. Plasmon Resonances of a Gold Nanostar. Nano Letters 2007, 7, 729–732. [Google Scholar] [CrossRef]
  7. Hrelescu, C.; Sau, T.K.; Rogach, A.L.; Jäckel, F.; Feldmann, J. Single gold nanostars enhance Raman scattering. Applied Physics Letters 2009, 94, 153113. [Google Scholar] [CrossRef]
  8. Atta, S.; Tsoulos, T.V.; Fabris, L. Shaping Gold Nanostar Electric Fields for Surface-Enhanced Raman Spectroscopy Enhancement via Silica Coating and Selective Etching. The Journal of Physical Chemistry C 2016, 120, 20749–20758. [Google Scholar] [CrossRef]
  9. Nehl, C.L.; Liao, H.; Hafner, J.H. Optical properties of star-shaped gold nanoparticles. Nano Lett 2006, 6, 683–688. [Google Scholar] [CrossRef] [PubMed]
  10. Tsoulos, T.V.; Atta, S.; Lagos, M.J.; Beetz, M.; Batson, P.E.; Tsilomelekis, G.; Fabris, L. Colloidal plasmonic nanostar antennas with wide range resonance tunability. Nanoscale 2019, 11, 18662–18671. [Google Scholar] [CrossRef]
  11. Xianyu, Y.; Lin, Y.; Chen, Q.; Belessiotis-Richards, A.; Stevens, M.M.; Thomas, M.R. Iodide-Mediated Rapid and Sensitive Surface Etching of Gold Nanostars for Biosensing. Angewandte Chemie International Edition 2021, 60, 9891–9896. [Google Scholar] [CrossRef] [PubMed]
  12. Eustis, S.; El-Sayed, M.A. Why gold nanoparticles are more precious than pretty gold: Noble metal surface plasmon resonance and its enhancement of the radiative and nonradiative properties of nanocrystals of different shapes. Chemical Society Reviews 2006, 35, 209–217. [Google Scholar] [CrossRef] [PubMed]
  13. Zhou, W.; Gao, X.; Liu, D.; Chen, X. Gold nanoparticles for in vitro diagnostics. Chem Rev 2015, 115, 10575–10636. [Google Scholar] [CrossRef] [PubMed]
  14. Covarrubias, A.J.; Perrone, R.; Grozio, A.; Verdin, E. NAD(+) metabolism and its roles in cellular processes during ageing. Nat Rev Mol Cell Biol 2021, 22, 119–141. [Google Scholar] [CrossRef] [PubMed]
  15. Xie, N.; Zhang, L.; Gao, W.; Huang, C.; Huber, P.E.; Zhou, X.; Li, C.; Shen, G.; Zou, B. NAD+ metabolism: pathophysiologic mechanisms and therapeutic potential. Signal Transduction and Targeted Therapy 2020, 5, 227. [Google Scholar] [CrossRef] [PubMed]
  16. Anderson, R.F. Energetics of the one-electron steps in the NAD+/NADH redox couple. Biochimica et Biophysica Acta (BBA) - Bioenergetics 1980, 590, 277–281. [Google Scholar] [CrossRef]
  17. Lee, J.K.; Suh, H.N.; Yoon, S.H.; Lee, K.H.; Ahn, S.Y.; Kim, H.J.; Kim, S.H. Non-Destructive Monitoring via Electrochemical NADH Detection in Murine Cells. Biosensors (Basel) 2022, 12, 107. [Google Scholar] [CrossRef] [PubMed]
  18. Mongeon, R.; Venkatachalam, V.; Yellen, G. Cytosolic NADH-NAD(+) Redox Visualized in Brain Slices by Two-Photon Fluorescence Lifetime Biosensor Imaging. Antioxid Redox Signal 2016, 25, 553–563. [Google Scholar] [CrossRef]
  19. Chen, H.; Yu, J.; Men, X.; Zhang, J.; Ding, Z.; Jiang, Y.; Wu, C.; Chiu, D.T. Reversible Ratiometric NADH Sensing Using Semiconducting Polymer Dots. Angew Chem Int Ed Engl 2021, 60, 12007–12012. [Google Scholar] [CrossRef]
  20. Brekasis, D.; Paget, M.S. A novel sensor of NADH/NAD+ redox poise in Streptomyces coelicolor A3(2). Embo j 2003, 22, 4856–4865. [Google Scholar] [CrossRef]
  21. Micheli, V.; Simmonds, H.A.; Bari, M.; Pompucci, G. HPLC determination of oxidized and reduced pyridine coenzymes in human erythrocytes. Clin Chim Acta 1993, 220, 1–17. [Google Scholar] [CrossRef] [PubMed]
  22. Liang, P.; Yu, H.; Guntupalli, B.; Xiao, Y. Paper-Based Device for Rapid Visualization of NADH Based on Dissolution of Gold Nanoparticles. ACS Applied Materials & Interfaces 2015, 7, 15023–15030. [Google Scholar] [CrossRef]
  23. Weng, G.; Zhao, X.; Zhao, J.; Li, J.; Zhu, J.; Zhao, J. Nanoplasmonic sensing of NADH by inhibiting the oxidative etching of gold nanorods. Sensors and Actuators B: Chemical 2019, 299, 126982. [Google Scholar] [CrossRef]
  24. Maenaka, Y.; Suenobu, T.; Fukuzumi, S. Efficient catalytic interconversion between NADH and NAD+ accompanied by generation and consumption of hydrogen with a water-soluble iridium complex at ambient pressure and temperature. J Am Chem Soc 2012, 134, 367–374. [Google Scholar] [CrossRef] [PubMed]
  25. Li, L.; Lu, H.; Deng, L. A sensitive NADH and ethanol biosensor based on graphene–Au nanorods nanocomposites. Talanta 2013, 113, 1–6. [Google Scholar] [CrossRef] [PubMed]
  26. de la Rica, R.; Stevens, M.M. Plasmonic ELISA for the ultrasensitive detection of disease biomarkers with the naked eye. Nature Nanotechnology 2012, 7, 821–824. [Google Scholar] [CrossRef] [PubMed]
  27. Atta, S.; Beetz, M.; Fabris, L. Understanding the role of AgNO3 concentration and seed morphology in the achievement of tunable shape control in gold nanostars. Nanoscale 2019, 11, 2946–2958. [Google Scholar] [CrossRef]
  28. Munyayi, T.A.; Vorster, B.C.; Mulder, D.W. The Effect of Capping Agents on Gold Nanostar Stability, Functionalization, and Colorimetric Biosensing Capability. Nanomaterials (Basel) 2022, 12. [Google Scholar] [CrossRef]
  29. Mulder, D.W.P., M. M; Jordaan, A; Vorster, B. C. Modified HEPES one-pot synthetic strategy for gold nanostars. R Soc Open Sci 2019, 6, 190160. [Google Scholar] [CrossRef]
  30. Rodrigues, R.C.; Berenguer-Murcia, Á.; Carballares, D.; Morellon-Sterling, R.; Fernandez-Lafuente, R. Stabilization of enzymes via immobilization: Multipoint covalent attachment and other stabilization strategies. Biotechnology Advances 2021, 52, 107821. [Google Scholar] [CrossRef]
  31. Vargas, J.A.; Leonardo, D.A.; D’Muniz Pereira, H.; Lopes, A.R.; Rodriguez, H.N.; Cobos, M.; Marapara, J.L.; Castro, J.C.; Garratt, R.C. Structural Characterization of L-Galactose Dehydrogenase: An Essential Enzyme for Vitamin C Biosynthesis. Plant Cell Physiol 2022, 63, 1140–1155. [Google Scholar] [CrossRef] [PubMed]
  32. Kondrat, S.; Krauss, U.; von Lieres, E. Enzyme co-localisation: Mechanisms and benefits. Current Research in Chemical Biology 2022, 2, 100031. [Google Scholar] [CrossRef]
  33. Phiri, M.M.; Mulder, D.W.; Vorster, B.C. Plasmonic Detection of Glucose in Serum Based on Biocatalytic Shape-Altering of Gold Nanostars. Biosensors (Basel) 2019, 9. [Google Scholar] [CrossRef] [PubMed]
  34. Yazdani, S.; Daneshkhah, A.; Diwate, A.; Patel, H.; Smith, J.; Reul, O.; Cheng, R.; Izadian, A.; Hajrasouliha, A.R. Model for Gold Nanoparticle Synthesis: Effect of pH and Reaction Time. ACS Omega 2021, 6, 16847–16853. [Google Scholar] [CrossRef]
  35. Mulder, D.; Phiri, M.; Vorster, C. Tailor-made gold nanostar colorimetric detection determined by morphology change and used as an indirect approach by using hydrogen peroxide to determine glucose concentration. Sensing and Bio-Sensing Research 2019, 25, 100296. [Google Scholar] [CrossRef]
  36. Rodríguez-Lorenzo, L.; de la Rica, R.; Álvarez-Puebla, R.A.; Liz-Marzán, L.M.; Stevens, M.M. Plasmonic nanosensors with inverse sensitivity by means of enzyme-guided crystal growth. Nature Materials 2012, 11, 604–607. [Google Scholar] [CrossRef] [PubMed]
  37. Xie, J.; Lee, J.; Wang, D. Seedless, Surfactantless, High-Yield Synthesis of Branched Gold Nanocrystals in HEPES Buffer Solution. Chemistry of Materials - CHEM MATER 2007, 19. [Google Scholar] [CrossRef]
  38. Xie, J.; Lee, J.Y.; Wang, D.I.C. Seedless, surfactantless, high-yield synthesis of branched gold nanocrystals in HEPES buffer solution. 2007.
  39. Xi, W.; Haes, A.J. Elucidation of HEPES Affinity to and Structure on Gold Nanostars. Journal of the American Chemical Society 2019, 141, 4034–4042. [Google Scholar] [CrossRef]
  40. Chen, R.; Wu, J.; Li, H.; Cheng, G.; Lu, Z.; Che, C.-M. Fabrication of gold nanoparticles with different morphologies in HEPES buffer. Rare Metals 2010, 29, 180–186. [Google Scholar] [CrossRef]
  41. Khlebtsov, N. Anisotropic properties of plasmonic nanoparticles: depolarized light scattering, dichroism, and birefringence. Journal of Nanophotonics 2010, 4, 041587. [Google Scholar] [CrossRef]
  42. Rahman, D.S.; Chatterjee, H.; Ghosh, S.K. Excess Surface Energy at the Tips of Gold Nanospikes: From Experiment to Modeling. The Journal of Physical Chemistry C 2015, 119, 14326–14337. [Google Scholar] [CrossRef]
  43. Pazos-Perez, N.; Guerrini, L.; Alvarez-Puebla, R.A. Plasmon Tunability of Gold Nanostars at the Tip Apexes. ACS Omega 2018, 3, 17173–17179. [Google Scholar] [CrossRef] [PubMed]
  44. BLACHNITZKY, E.-O.; WENGENMAYER, F.; KURZ, G. d-Galactose Dehydrogenase from Pseudomonas fluorescens. European Journal of Biochemistry 1974, 47, 235–250. [Google Scholar] [CrossRef] [PubMed]
  45. Ikeda, S.; Sumi, Y.; Fukui, S. Kinetic studies on coenzyme binding and coenzyme dissociation in tryptophanase immobilized on sepharose. Biochemistry 1975, 14, 1464–1470. [Google Scholar] [CrossRef] [PubMed]
  46. De Flora, A.; Morelli, A.; Giuliano, F. Human erythrocyte glucose 6-phosphate dehydrogenase. Content of bound coenzyme. Biochem Biophys Res Commun 1974, 59, 406–413. [Google Scholar] [CrossRef] [PubMed]
  47. Yagi, K.; Ozawa, T.; Ooi, T. COMPLEX FORMATION OF APOENZYME, COENZYME AND SUBSTRATE OF D-AMINO ACID OXIDASE. V. CHANGE IN CONFORMATION OF THE PROTEIN BY FORMING A MODEL OF ENZYME-SUBSTRATE COMPLEX. Biochim Biophys Acta 1963, 77, 20–26. [Google Scholar] [CrossRef] [PubMed]
  48. UEBERSCHÄR, K.-H.; BLACHNITZKY, E.-O.; KURZ, G. Reaction Mechanism of d-Galactose Dehydrogenases from Pseudomonas saccharophila and Pseudomonas fluorescens. European Journal of Biochemistry 1974, 48, 389–405. [Google Scholar] [CrossRef]
  49. Robinson, P.K. Enzymes: principles and biotechnological applications. Essays Biochem 2015, 59, 1–41. [Google Scholar] [CrossRef]
  50. Huang, X.; El-Sayed, I.H.; Yi, X.; El-Sayed, M.A. Gold nanoparticles: Catalyst for the oxidation of NADH to NAD+. Journal of Photochemistry and Photobiology B: Biology 2005, 81, 76–83. [Google Scholar] [CrossRef]
  51. Xing, X.; Shao, M.; Liu, C.-C. Electrochemical oxidation of dihydronicotinadmide adenine dinucleotide (NADH) on single crystal gold electrodes. Journal of Electroanalytical Chemistry 1996, 406, 83–90. [Google Scholar] [CrossRef]
  52. Plapp, B.V. Conformational changes and catalysis by alcohol dehydrogenase. Arch Biochem Biophys 2010, 493, 3–12. [Google Scholar] [CrossRef] [PubMed]
  53. Lai, Y.; Yu, B.; Lin, T.; Hou, L. Iodide-Mediated Etching of Gold Nanostar for the Multicolor Visual Detection of Hydrogen Peroxide. Biosensors (Basel) 2023, 13, 585. [Google Scholar] [CrossRef] [PubMed]
  54. Dong, F.; Wu, C.; Miao, A.-J.; Pan, K. Reduction of silver ions to form silver nanoparticles by redox-active organic molecules: coupled impact of the redox state and environmental factors. Environmental Science: Nano 2021, 8, 269–281. [Google Scholar] [CrossRef]
  55. Brumaghim, J.L.; Li, Y.; Henle, E.; Linn, S. Effects of hydrogen peroxide upon nicotinamide nucleotide metabolism in Escherichia coli: changes in enzyme levels and nicotinamide nucleotide pools and studies of the oxidation of NAD(P)H by Fe(III). J Biol Chem 2003, 278, 42495–42504. [Google Scholar] [CrossRef] [PubMed]
  56. Li, W.; Lin, L.; Li, G. Wavelength selection method based on test analysis of variance: application to oximetry. Analytical Methods 2014, 6, 1082–1089. [Google Scholar] [CrossRef]
  57. Shao, D.; Liu, C.; Tsow, F.; Yang, Y.; Du, Z.; Iriya, R.; Yu, H.; Tao, N. Noncontact Monitoring of Blood Oxygen Saturation Using Camera and Dual-Wavelength Imaging System. IEEE Trans Biomed Eng 2016, 63, 1091–1098. [Google Scholar] [CrossRef] [PubMed]
  58. Bansal, S.A.; Kumar, V.; Karimi, J.; Singh, A.P.; Kumar, S. Role of gold nanoparticles in advanced biomedical applications. Nanoscale Advances 2020, 2, 3764–3787. [Google Scholar] [CrossRef] [PubMed]
  59. de Puig, H.; Tam, J.O.; Yen, C.-W.; Gehrke, L.; Hamad-Schifferli, K. Extinction Coefficient of Gold Nanostars. The Journal of Physical Chemistry C 2015, 119, 17408–17415. [Google Scholar] [CrossRef]
  60. Zhao, Y.; Qiu, L.; Sun, Y.; Huang, C.; Li, T. Optimal hemoglobin extinction coefficient data set for near-infrared spectroscopy. Biomed Opt Express 2017, 8, 5151–5159. [Google Scholar] [CrossRef]
  61. Maugeri, L.; Messina, M.A.; Ruggieri, M.; Petralia, S. Photothermal-Contrast Method Based on In Situ Gold Nanostructure Formation for Phenylalanine Detection in Human Blood. ACS Applied Nano Materials 2023, 6, 12673–12678. [Google Scholar] [CrossRef]
  62. Jafari, P.; Beigi, S.M.; Yousefi, F.; Aghabalazadeh, S.; Mousavizadegan, M.; Hosseini, M.; Hosseinkhani, S.; Ganjali, M.R. Colorimetric biosensor for phenylalanine detection based on a paper using gold nanoparticles for phenylketonuria diagnosis. Microchemical Journal 2021, 163, 105909. [Google Scholar] [CrossRef]
  63. Tsoulos, T.V.; Han, L.; Weir, J.; Xin, H.L.; Fabris, L. A closer look at the physical and optical properties of gold nanostars: an experimental and computational study. Nanoscale 2017, 9, 3766–3773. [Google Scholar] [CrossRef] [PubMed]
  64. Zayats, M.; Baron, R.; Popov, I.; Willner, I. Biocatalytic Growth of Au Nanoparticles:  From Mechanistic Aspects to Biosensors Design. Nano Letters 2005, 5, 21–25. [Google Scholar] [CrossRef] [PubMed]
  65. Bezuneh, T.T.; Fereja, T.H.; Kitte, S.A.; Li, H.; Jin, Y. Gold nanoparticle-based signal amplified electrochemiluminescence for biosensing applications. Talanta 2022, 248, 123611. [Google Scholar] [CrossRef]
  66. Cao, X.; Ye, Y.; Liu, S. Gold nanoparticle-based signal amplification for biosensing. Analytical Biochemistry 2011, 417, 1–16. [Google Scholar] [CrossRef]
  67. Ellis, G.A.; Dean, S.N.; Walper, S.A.; Medintz, I.L. Quantum Dots and Gold Nanoparticles as Scaffolds for Enzymatic Enhancement: Recent Advances and the Influence of Nanoparticle Size. Catalysts 2020, 10, 83. [Google Scholar] [CrossRef]
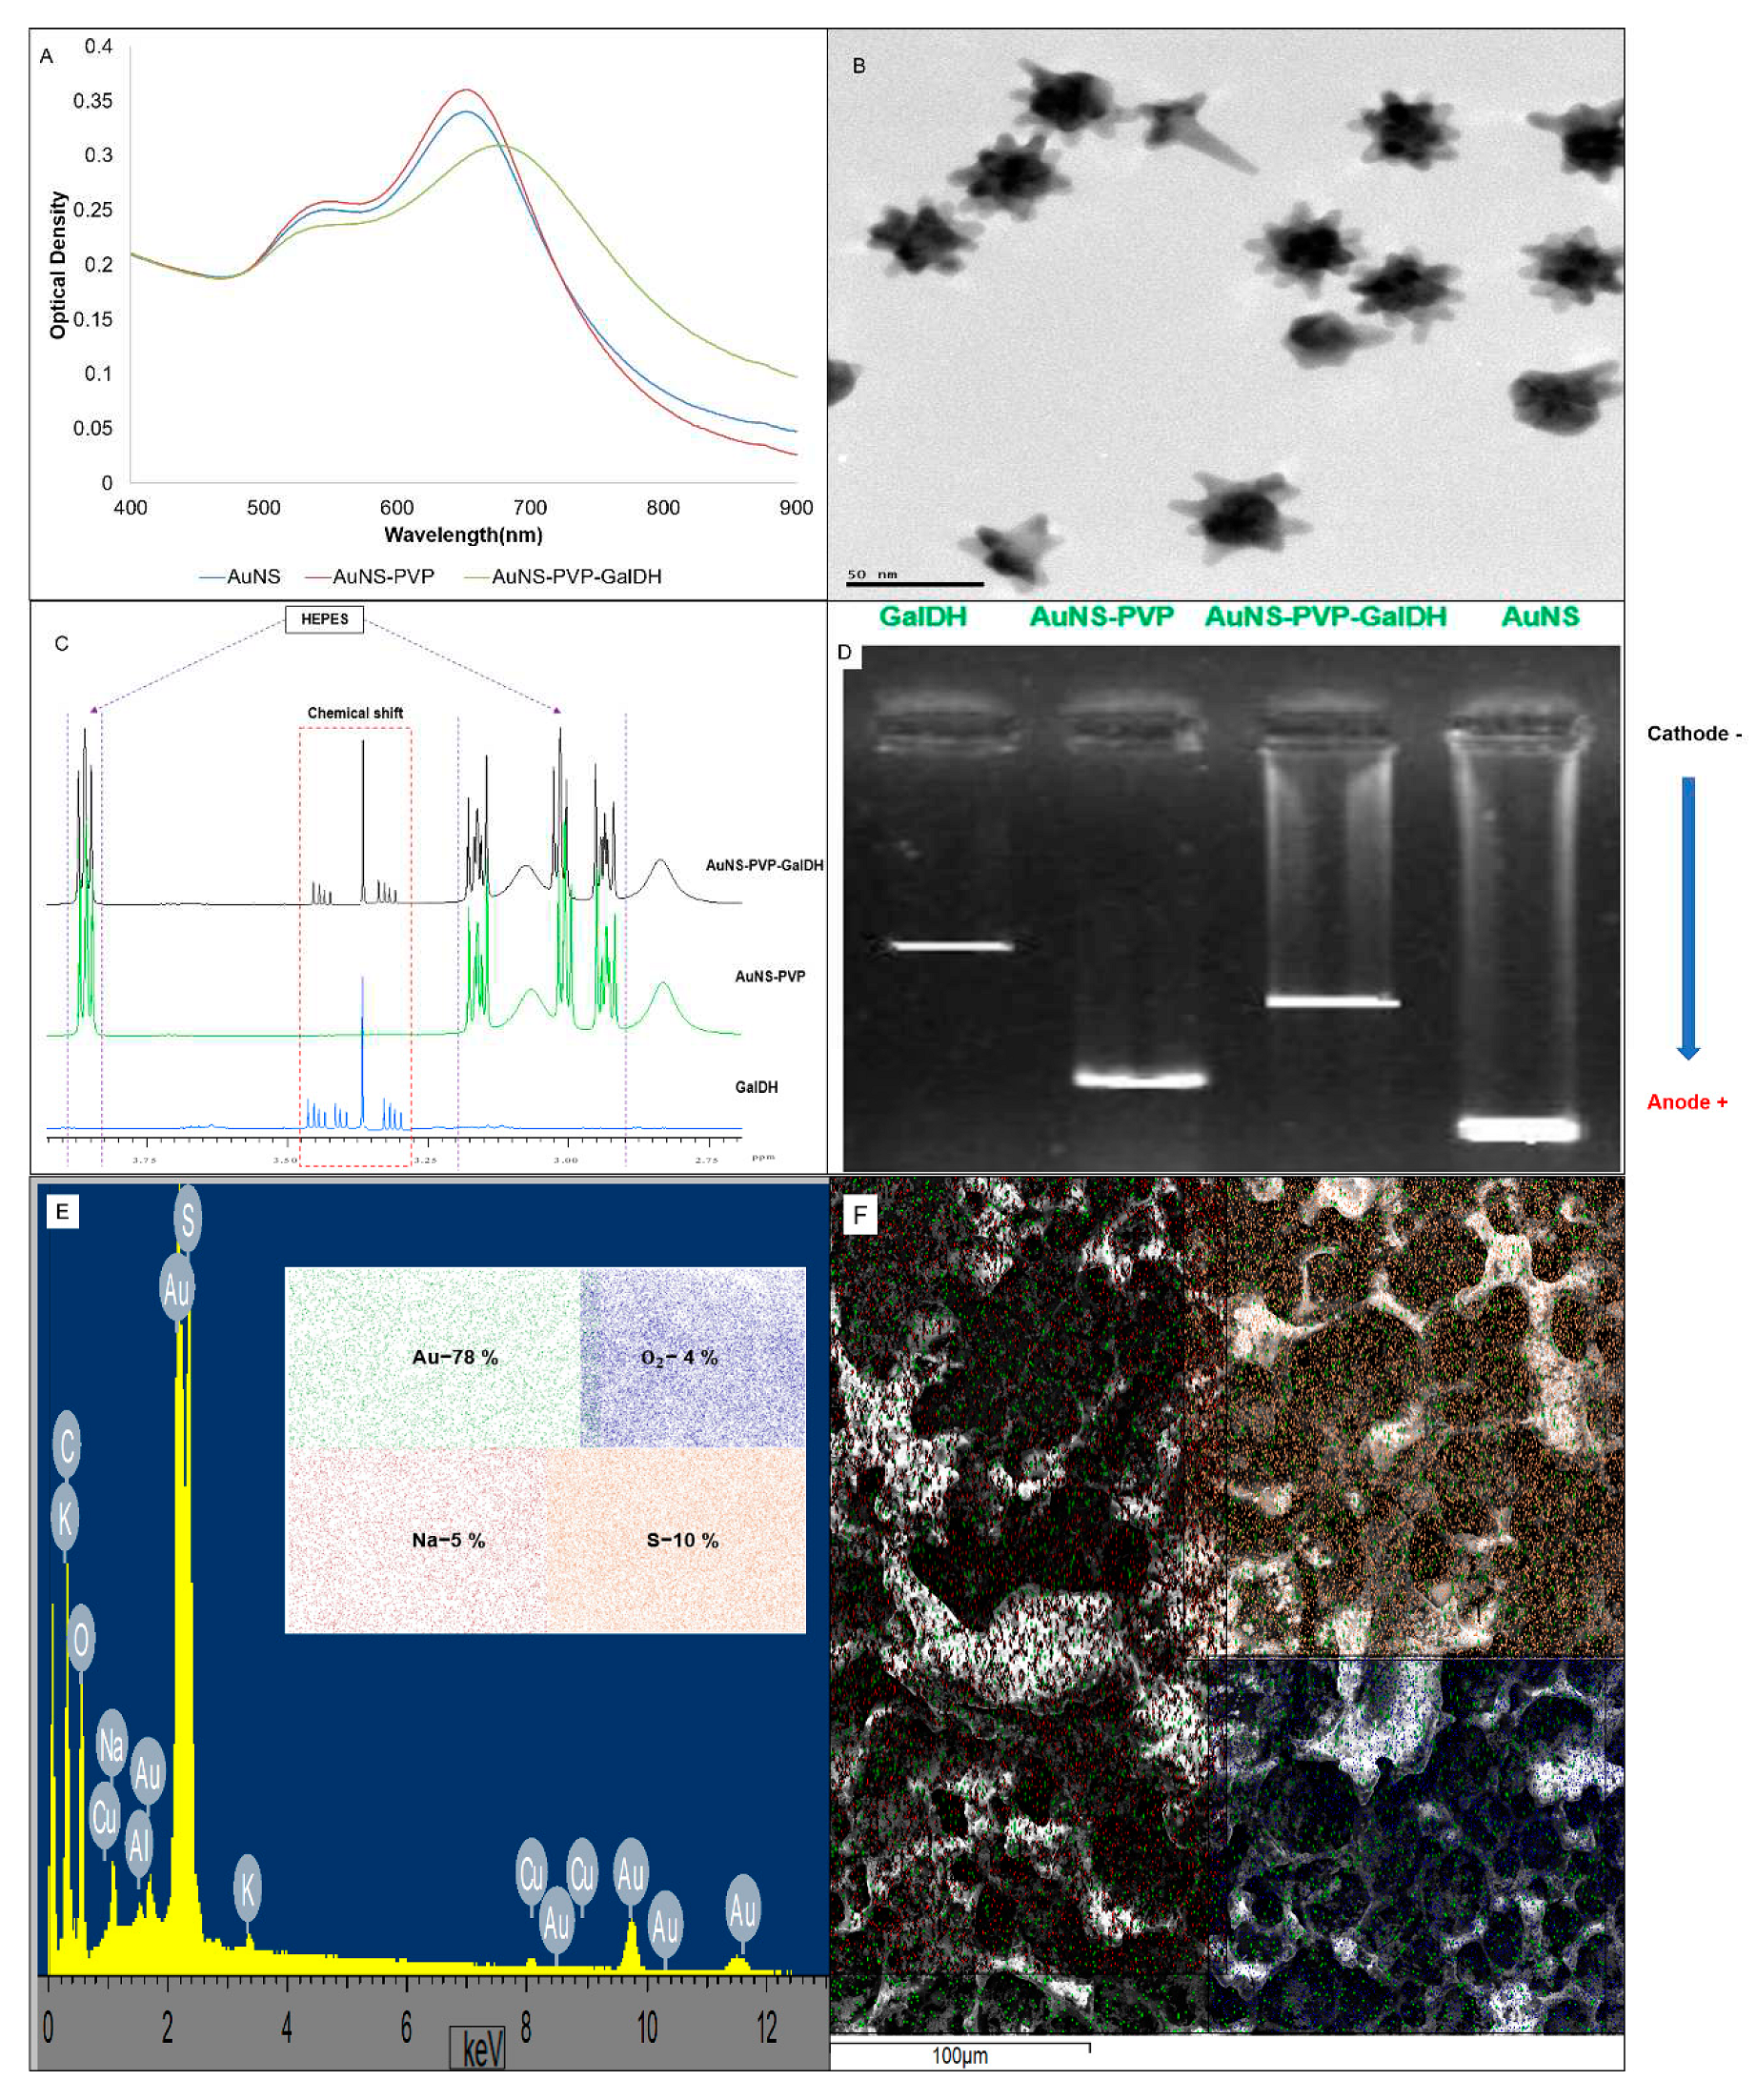
Figure 1. AuNS-PVP-GalDH bioconjugate’s (A) UV-Vis spectra profiles; (B) HR-TEM profiles; (C) 1H-NMR spectra profiles; (D) electrophoretic profiles; (E) EDS spectra; and (F) SEM-EDS elemental mapping profiles.
Preprints 87351 g001
Figure 2. UV-Vis spectra and colorimetric profiles of the feasibility of H2O2 in inducing concentration-dependent colorimetric signals for galactose detection in the AuNS-PVP-GalDH assay in the water matrix.
Preprints 87351 g002
Figure 3. Galactose sensing with AuNS-PVP-GalDH nanosensor UV-Vis spectra, colorimetric profiles, and mathematical correlation profiles. (A-B) Water matrix; (C-D) Synthetic blood matrix.
Preprints 87351 g003
Figure 4. Galactose sensing with AuNS-PVP-GalDH biosensor HR-TEM images after the biorecognition reaction in the water matrix.
Preprints 87351 g004
Figure 5. UV-Vis spectra and colorimetric profiles for pH variations during galactose detection in the water matrix using the AuNS-PVP-GalDH biosensor.
Preprints 87351 g005
Scheme 1. Proposed signal-generation mechanism based on enzyme-H2O2 mediated crystal growth.
Preprints 87351 sch001
Table 1. Experimental Procedure for the galactose plasmonic colorimetric detection using AuNS-PVP-GalDH biosensor.
Sample Control 1 2 3 4 5
Water 165 µL 148 138 µL 128 µL 118 µL 108 µL
10 mM Tris (pH 8.4) 15 µL 15 µL 15 µL 15 µL 15 µL 15 µL
AuNS-PVP-GalDH 20 µL 20 µL 20 µL 20 µL 20 µL 20 µL
2 mM galactose 0 µL 0 µL 5 µL 10 µL 15 µL 20 µL
10 min Incubation
H2O2 0 µL 0 µL 5 µL 10 µL 15 µL 20 µL
5 min Incubation
10 mM AgNO3 0 µL 2 µL 2 µL 2 µL 2 µL 2 µL
150 mM NaOH 0 µL 15 µL 15 µL 15 µL 15 µL 15 µL
2 min Incubation
Colorimetric signal generation
Disclaimer/Publisher’s Note: The statements, opinions and data contained in all publications are solely those of the individual author(s) and contributor(s) and not of MDPI and/or the editor(s). MDPI and/or the editor(s) disclaim responsibility for any injury to people or property resulting from any ideas, methods, instructions or products referred to in the content.
Copyright: This open access article is published under a Creative Commons CC BY 4.0 license, which permit the free download, distribution, and reuse, provided that the author and preprint are cited in any reuse.
Prerpints.org logo

Preprints.org is a free preprint server supported by MDPI in Basel, Switzerland.

Subscribe

© 2024 MDPI (Basel, Switzerland) unless otherwise stated