
Submitted:
09 October 2023
Posted:
11 October 2023
You are already at the latest version
Abstract
Taste disorders are common among cancer patients undergoing chemotherapy, with a prevalence ranging from 20% to 86%, persisting throughout treatment. This condition leads to reduced food consumption, increasing the risk of malnutrition. Malnutrition is associated not only with worse treatment efficacy and poor disease prognosis but also with reduced functional status and quality of life. The fruit of Synsepalum dulcificum (Daniell), commonly known as miracle berry or miracle fruit, contains miraculin, a taste-modifying protein with profound effects on taste perception. The CLINMIR Protocol is a triple-blind, randomized, placebo-controlled clinical trial designed to evaluate the regular consumption of a food supplement containing a miraculin-based novel food, dried miracle berry (DMB), on the taste perception (measured through electrogustometry) and nutritional status (evaluated through the GLIM Criteria) of malnourished cancer patients under active antineoplastic treatment. To this end, a pilot study was designed with 30 randomized patients divided into three study arms (150 mg DMB + 150 mg freeze-dried strawberries, 300 mg DMB or placebo) for three months. Throughout the five main visits, an exhaustive assessment of different affected parameters susceptible to improvement through regular consumption of the miraculin-based food supplement will be conducted, including electrical and chemical taste perception, smell perception, nutritional and morphofunctional assessment, diet, quality of life, fatty acid profile of erythrocytes, levels of inflammatory and cancer-associated cytokines, oxidative stress, antioxidant defense system, plasma metabolomics, and saliva and stool microbiota.
The primary anticipated result is that malnourished cancer patients with taste distortion who consume the miraculin-based food supplement will report an improvement in food taste perception. This improvement translates into increased food intake, thereby ameliorating their nutritional status and mitigating associated risks. Additionally, the study aims to pinpoint the optimal dosage that provides maximal benefits. The protocol adheres to the SPIRIT 2013 Statement, which provides evidence-based recommendations and is widely endorsed as an international standard for trial protocols (https://www.spirit-statement.org/spirit-statement/). The clinical trial protocol has been registered at http://clinicaltrials.gov (NCT05486260).
Keywords:
taste disorders
; dysgeusia
; neoplasm
; chemotherapy
; Synsepalum ducificum
; miracle fruit
; malnutrition
1. Introduction
Dysgeusia, a taste disorder typically characterized by an unpleasant and persistent taste, is often described as metallic, and other taste disorders are common among cancer patients [1]. While dysgeusia can have multiple origins, it is a common side effect for cancer patients who undergo chemotherapy and/or radiotherapy. The recovery from this disorder is a slow and gradual process and can take up to a year after treatment [2]. The incidence of dysgeusia depends on the type of treatment [3], with 45-84% of cancer patients receiving treatment experiencing this side effect [4]. Unpleasant flavors during meals can lead to changes in eating habits, poor nutrition, weight loss, and ultimately, a decrease in morale, affecting the quality of life [5,6].
To date, the pharmaceutical and supplement industry has been unable to provide effective treatment or strategy for patients suffering from dysgeusia. Zinc supplementation [7,8,9], amifostine [10,11,12], selenium, lactoferrin, and cannabinoids are among the treatments used today, with limited clinically beneficial effects on taste disorders [13,14]. This scenario necessitates new clinical trials to identify effective strategies for controlling dysgeusia and improving the health and quality of life of patients [13,15].
Synsepalum dulcificum (Daniell), commonly known as “miracle fruit,” is a plant native to West Africa that contains miraculin, a glycoprotein that can transform sour flavors into sweet ones, making meals more palatable [16]. In December 2021, the European Commission authorized to dried miracle berry (DMB) as a novel food in the European Union [17]. DMB, officially cataloged as “dried fruits of Synsepalum dulcificum” in the EU, is the freeze-dried extract of the miracle berry pulp juice, rich in miraculin.
Previous studies have shown the potential of miracle fruit for treating taste disorders. A pilot clinical trial involving 23 patients with dysgeusia derived from chemotherapy treatment demonstrated that the consumption of this berry was safe, and 30% of patients showed an improvement in taste after two weeks of treatment [18]. Another pilot trial conducted two years later on eight patients who experienced taste disturbances after chemotherapy treatment showed that all patients demonstrated improvements in taste, with five patients reporting the disappearance of metallic taste after supplementation with the fruit [19].
Despite the absence of substantial clinical evidence, prior uncontrolled pilot studies have hinted at the potential of using miracle fruit as a natural dietary supplement, presenting a promising nutritional strategy for managing dysgeusia. The current pilot study aimed to generate clinical evidence on the beneficial effect of the miraculin-based food supplement, containing the miracle fruit extract DMB, on taste disorders. Furthermore, the study sought to explore the interplay between this impact and the enhancement of patients’ nutritional status, employing a rigorous design and methodology. A comprehensive outline of the study’s protocol is provided in this article, adhering to the SPIRIT 2013 Statement. This statement, recognized as an international standard for trial protocols (https://www.spirit-statement.org/spirit-statement/), offers evidence-based recommendations for the structure of clinical trial protocols.
2. Experimental Design
The CLINMIR study is a pilot randomized, parallel, triple-blind, and placebo-controlled clinical trial. The present protocol clinical trial was registered at http://clinicaltrials.gov with the number NCT05486260.
2.1. Participants and Selection Criteria
A total of thirty malnourished cancer patients and taste disorders will be recruited by the Clinical and Dietary Nutrition Unit and Oncology Service of the Hospital University La Paz (HULP), Madrid (Spain).
Inclusion criteria: Patients over 18 years of age with cancer and antineoplastic treatment (chemotherapy and any other treatment such as radiotherapy, immunotherapy, etc., for at least three months) who have a weight loss ≥ 5%, malnutrition assessed by GLIM Criteria [20] and taste disturbances measured by electrogustometry. Additionally, these patients have to be starting or be in the first three months of antineoplastic treatment, have a life expectancy greater than 3 months and have an oral intake of food and drinks. Patients also have to be at an appropriate cultural level and understand the clinical study, voluntary participation, and sign the informed consent form.
Exclusion criteria: Patients participating in another clinical trial, enteral or parenteral nutrition, poorly controlled diabetes mellitus (HbA1c >8%), uncontrolled hypertension or hyper/hypothyroidism, severe digestive toxicity due to treatment with chemo-radiotherapy, severe kidney or liver disease (chronic renal failure, nephrotic syndrome, cirrhosis, etc.), severe dementia, brain metastases, eating disorders, history of severe neurological or psychiatric pathology that may interfere with treatment, alcoholism or substance abuse, severe gastrointestinal diseases, and unwillingness to consume the miraculin-based food supplement .
Withdrawal Criteria: Inability to tolerate the ingestion of the miraculin-based tablets at any dosage or placebo.
2.2. Ethics and dissemination
The final protocol was approved by the Scientific Research and Ethics Committee of the University Hospital La Paz. The research protocol in version 1 was approved in June 2022 (HULP Code 6164) in compliance with The Ethical Standards of the Declaration of Helsinki about the recommendations guiding physicians in biomedical research involving human subjects. All researchers know and follow the ICH Harmonized Tripartite Guidelines for Good Clinical Practice.
Before signing the informed consent form, all subjects will be informed by a study researcher about the study characteristics (verbally and in writing) and what their inclusion in the clinical trial means (Appendix I). Patients will be informed that they can decide at any time to abandon their participation in the study, notifying their doctor without having to give any reason and without detriment to their usual medical treatment. In this case, they will be asked if their decision is related to any adverse event due to the consumption of the miraculin-based tablets.
All study data will be processed by members of the research team in a database specifically created for this study and dissociated from any data that could identify the patient. The processing of personal data will follow the Spanish Organic Law (Ley Orgánica) 3/2018, of December 5, and the General Data Protection Regulation of the European Union (EU) 2016/679 of April 27, 2016.
Only the study investigators will have access to the patient’s data with prior authorization from the principal investigator. Once the study is completed, all the data collected in paper format will be archived in the external archive store of HULP and will be kept for the period established by local legislation.
Once the clinical trial has finished, following the provisions of the Spanish Legislation (Real Decreto 1090/2015), the researchers and the promoter will publish the results obtained (positives or negatives). This publication will take place in a publicly accessible scientific journal.
2.3. Interventions
Malnourished cancer patients in active treatment and with taste disorders will be randomized to one of three arms of the clinical trial. Over 3 months, each patient will dissolve a tablet of the miraculin-based food supplement five minutes before each main meal (breakfast, lunch, and dinner). Each tablet will contain DMB in one of its two doses or a placebo (Figure 1).
Alongside the standard dietary guidelines for cancer patients, participants will be motivated to incorporate acidic foods such as yogurt, vinegar, and lemon drops into their main meals. This approach aims to enhance compliance with the intervention. Each subject will be provided with the precise quantity of the miraculin-based food supplement bottles containing orally dissolving tablets with DMB or placebo necessary until their subsequent visit. Participants will be requested to return all packaging, whether empty or partially used, enabling compliance assessment through a comparison of provided and returned tablet quantities. Compliance will be established if a subject ingests ≥ 90% of the tablets supplied. In instances where the prescribed dose is not adhered to, the principal investigator will terminate the patient’s involvement in the study. Additionally, a dual product consumption monitoring mechanism is incorporated, involving a daily record where patients document the quantity and count of tablets consumed each day throughout the study.
Any pharmacological treatment undertaken during the follow-up period will be registered in an electronic Clinical Research Data Capture (eCRD) platform. Patients will maintain their regular treatment regimen. The use of any medication that does not interfere with the study formulation will be allowed. However, if there is any extraordinary medication, the principal investigator of the study will judge the suitability of the participant’s continued involvement.
2.4. Treatments
Each intervention group will be integrated by 10 randomly assigned patients to one of two DMB dosages or placebo. A first arm will have 150 mg of DMB equivalent to 2.8 mg of miraculin + 150 mg of freeze-dried strawberries per orodispersible tablet; a second arm will have 300 mg of DMB equivalent to 5.5 mg of miraculin; and a third arm will contain 300 mg of freeze-dried strawberries per orodispersible tablet as placebo. The three treatments are isocaloric (Table 1). The subjects will be provided with as many tablets as necessary to complete the 3-month intervention period during recurring scheduled visits to the HULP.
2.5. Primary Outcome
2.5.1. Electrical taste perception
Electrical taste perception is evaluated by electrogustometry. Electrical taste testing provides a very accurate means for quantitatively assessing the human taste system [21]. Moreover, functional imaging studies have found that lingual electrical stimulation activates the same brain regions as chemical stimulation [22]. Malnourished cancer patients with taste distortion and consuming the miraculin-based food supplement are expected to improve their taste perception by reducing the taste perception threshold (dB) by electrical stimulation from baseline (v0) to a month after the intervention (v3). The mean of the difference between the scores found between these visits is statistically compared with those found in the rest of the treatments. The evolution of taste perception is also evaluated through the different intervention visits where it is measured (v1, v3, v4, and v5).
The primary sensory system is negatively impacted by a range of diseases and disorders, including early-stage cancers [23]. Cancer patients with taste disorders increase the risk of malnutrition [24] by 3.36 times [25]. Malnutrition is related not only to poor prognosis but also to reduced functional status and quality of life [26]. Thus, better food taste perception could enhance food intake and improve malnutrition and associated risks.
2.6. Secondary Outcomes
Clinical trial variables are evaluated from the baseline (v0) to the end of the intervention (v5). The mean of the difference between these visits is compared with those calculated in the other two treatment groups. The evolution of all clinical trial variables is also evaluated through the different intervention visits where they will be measured (v1, v2, v3, v4, or v5).
2.6.1. Chemical taste perception
Chemical taste perception is evaluated by the Taste Strips test. Taste sensitivity evaluation is necessary for a proper diagnosis and subsequent treatment of taste disorders [27]. Through the taste strips test, it is possible to obtain a total score and identify those patients with taste alterations such as parageusia (incorrect taste identification) and hypogeusia or ageusia (decreased taste sensitivity or lack of taste, respectively) from those with normogeusia (normal perception of taste). Once patients have been diagnosed, the changes that have arisen from the beginning to the end of the intervention and the differences observed with the different treatment groups are evaluated.
The taste disturbance prevalence ranges from approximately 20–86% [28], which occurs approximately 2–3 weeks after the start of cancer therapy and persists throughout the treatment [29]. These distortions often contribute to difficulties maintaining food intake during treatment [30], thus increasing the risk of malnutrition [25]. As the chemical test perception is complementary to the electrical taste perception, the consumption of the miraculin-based food supplement might enhance food intake and improve nutrition status due to better food taste perception.
2.6.2. Smell perception
Taste and smell disorders (TSD) can occur during the course of cancer, and they are associated with anorexia, early satiety, weight loss, malnutrition, and reduced quality of life [31]. Odor food perception is possible through two pathways: the orthonasal pathway, which occurs when odors are perceived directly through the nose, and the retronasal pathway, which occurs when odors are released from food during mastication and reach the olfactory receptor cells in the nose [32]. It has been estimated that 80% of the smell information of a meal is transmitted through retronasal olfaction [33], and it is commonly associated with the sense of taste due to its contribution to the flavor of foods or drinks. However, the orthonasal odor perception pathway is usually more affected than the retronasal pathway in different clinical conditions, with intact retronasal perception in the absence of orthonasal olfactory function [34]. This could be due to the difference in vulnerability between the anterior and posterior olfactory epithelium.
Approximately 60% of patients with disorders in smelling also complain about disorders of taste [35]. These two processes are tightly related; however, they are often described as separate entities due to patients having difficulty identifying them [36]. Since the prevalence of dysosmia is approximately 5–60% in cancer patients undergoing chemotherapy [4], its assessment is essential to complete the taste and smell perception evaluation. In this sense, an improvement in TSD may ameliorate the general food intake and, therefore, the quality of life and nutritional status of patients undergoing active cancer treatment. Orthonasal olfactory function is measured by Sniffin’ Sticks test identifying patients with normosmia and hyposmia depending on their age and are measured in the same visits as the taste tests (v1, v3, v4, v5).
2.6.3. Nutritional status
Malnutrition is the state resulting from a lack of intake or uptake of nutrition that leads to changes in body composition, reduced fat-free mass and body cell mass, decreased functional capacity and impaired clinical outcome from disease [37]. This can result from starvation, disease or aging combined or as separate entities [38]. However, when malnutrition is caused by a concomitant disease, it is referred to as disease-related malnutrition (DRM), where inflammation is usually present [39].
Malnutrition is a condition that is highly prevalent in cancer patients. It is estimated that up to 10–20% of cancer patients die due to malnutrition rather than the tumor [40]. This appears as a consequence of both the tumor and the antineoplastic treatments and negatively affects the quality of life and the effectiveness of treatments. Thus, the assessment of nutritional status in cancer patients is crucial to improve disease prognosis.
Nutritional status is evaluated by GLIM criteria at the beginning and the end of the intervention (3 months), a period where it is possible to assess the nutritional intervention effect. From the assessment of the nutritional status, a diagnosis of the type of malnutrition presented (moderate or severe) is obtained. Additionally, the nutritional status of the patients will be evaluated at visits 3 and 4 to evaluate the evolution of the patient throughout the clinical trial. For the rest of the variables, the average change occurring from the beginning to the end of the intervention between the different treatments is evaluated.
According to the practical guidelines for clinical nutrition in cancer, nutritional intervention has to lead to increasing oral intake in cancer patients who are malnourished or at risk of malnutrition [40]. In addition to dietary advice, the nutritional intervention is intended to treat symptoms and derangements impairing food intake (e.g., dysgeusia) and offering oral nutritional supplements (ONS) when necessary. In this regard, it is possible that improvement of taste distortions has a positive effect on food intake and, therefore, on the nutritional status of cancer patients.
2.6.4. Morphofunctional Assessment
Morphofunctional assessment consists of a series of evaluations that determine body composition and functionality. These evaluations include classic parameters (anthropometric parameters, biochemical parameters, food intake) and emerging parameters (bioelectrical impedance, nutritional ultrasound, dynamometry, functional tests and biochemical parameters) [41]. The realization of these measurement techniques certainly allows phenotypic categorization and etiologic criteria for malnutrition diagnosis by GLIM criteria.
Assessment for DRM diagnosis and severity is based on five criteria: three phenotypic criteria (unintentional weight loss, low body mass index, and reduced muscle mass) and two etiologic criteria (reduced food intake or assimilation and inflammation or disease burden) [20]. In addition, each of its evaluations provides information that allows a predictive analysis of nutritional status evolution and prognosis. Therefore, morphofunctional evaluation provides vital information to assess the evolution of nutritional status based on the assigned treatment. Morphofunctional assessment will be measured in the main visits to support monitoring of nutritional status. However, each of these tests individually also provides information on the adequacy of nutritional treatment.
2.6.4.1. Anthropometric parameters
Even though body weight is not sensitive enough for the early detection of DRM, unintentional weight loss is basic to estimate nutritional requirements, and it is an important screening tool for DRM risk as well as the simplest phenotypic criteria for the diagnosis of malnutrition [42].
Weight losses of 5-10% in the last 6 months or 10-12% in more than 6 months point to moderate malnutrition, while losses >10% in the last 6 months or >20% in more than 6 months point to severe malnutrition [20]. Thus, body weight (kg) and percentage weight loss (%) were measured at the main visits (v1, v3, v4 & v5). Changes that occurred month by month are evaluated using the mean of the change and compared between treatments to evaluate its evolution throughout the clinical trial.
Because weight loss can be modified by alterations in hydration status (edemas) [43], body mass index (BMI) was calculated. BMI is an anthropometric measure widely accepted for body composition measurement that, even with its limitations (does not measure fat, muscle, or skeletal compartments), is used as a phenotypic criterion for malnutrition diagnoses. BMI values < 20 kg/m² for patients under 70 years and < 22 kg/m² for patients over 70 years old point to moderate malnutrition, while severe malnutrition corresponds to BMI values < 18.5 kg/m² in patients under 70 and < 20 kg/m² in patients over 70 years old [20]. In cancer patients, weight change and BMI, as well as nutritional intake, are recommended to detect nutritional disturbances at an early stage [40]; therefore, they were evaluated throughout the entire study. BMI was measured at the main visits as well (v1, v3, v4 & v5).
Waist circumference (WC), another anthropometric parameter, together with waist-to-height ratio has been suggested as a stronger predictor for several cancers [44]; they are central adiposity, visceral fat and chronic disease risk factor indicators and are used as cardiometabolic morbidity and mortality predictors [45]. Recommended waist circumference cutoffs are used to monitor the health risk (>102 cm for men and >88 cm for women) [46] in cancer patients. WC and waist-to-height ratio were measured at the main visits (v1, v3, v4 & v5). Changes occurring in anthropometric parameters are evaluated using the mean of the change and compared between treatments to evaluate its evolution throughout the clinical trial.
2.6.4.2. Electrical bioimpedance
The presence of diseases can produce an increase in body water and/or fat mass without weight loss. Indeed, patients can lose > 10% of body weight over three-six months and have a BMI above or in a normal range [47]. Therefore, body composition measurements are essential for adequate nutritional status assessment. Body composition is valued by electrical bioimpedance (BIA). This technique estimates the indirect body composition by running a small electrical current through the body and measuring the resistance to body tissues [48]. BIA provides objective information about body compartments (fat-free mass and fat mass) and hydration status (total body water [TBW], extracellular [ECW], and intracellular water [ICW]). Indirect muscle data such as the Appendicular Skeletal Muscle Index (ASMI), Fat-Free Mass Index (FFMI), and Appendicular Lean Mass (ALM) were also measured. From these parameters, it is possible to obtain the body composition of the cancer patient and complete their nutritional assessment. In this sense, low ASMI (<6 in females, <7 kg/m2 in males) is used as an indicator of muscle mass loss, one of the phenotypic criteria for malnutrition diagnosis [20].
On the other hand, the raw bioelectric parameters from BIA are obtained by direct measurement, without interference of anthropometric factors (weight or age). Through resistance [R] and reactance [Xc], it is possible to obtain the phase angle (PhA). This BIA parameter is an important indicator of cell membrane health and integrity and has been considered a marker of clinical conditions such as cancer [49,50]. A low PhA indicates a poorer nutritional status, impaired cell membranes and muscle function and may be an important prognostic factor of survival in cancer patients [51]. Indeed, high PhA was significantly associated with lower mortality in cancer patients. A cutoff point was identified using the ROC curves for PhA in cancer patients (≤ 5.6°) [52]. After adjusting for sex and age, it is possible to obtain the standardized PhA, which is an independent prognostic indicator in cancer patients receiving chemotherapy [53]. Even though the standard cutoff value for standardized PhA has not yet been established [54], changes in the patient himself over time can be considered changes in nutritional status.
BIA performance is carried out at scheduled visits v1, v3, v4, and v5. Changes that occurred in BIA parameters month by month were evaluated using the mean of the change and compared between treatments to evaluate its evolution.
2.6.4.3. Dynamometry
Dynamometry is a functional method to assess muscle strength through handgrip strength [41]. Hand dynamometry is a general marker for nutritional status and is considered a support measure for the assessment of muscle mass, a phenotypic criterion for the diagnosis of malnutrition [20]. Malnutrition implies a reduction in muscle mass, which is reflected in lower performance on functional tests and alterations in body composition [55]. Dynamometry assessment is of special interest because the decrease in muscle strength appears before changes in anthropometric measurements and laboratory parameters are observed. Muscle strength measurement is a useful tool in screening and assessing malnutrition [56] and sarcopenia [57]. Low grip strength is a predictor of longer hospital stays, poor health-related quality of life and increased functional limitations [58].
Reference values for dominant hand muscle strength to assess DRM have been obtained for the Jamar® dynamometer in a Spanish population [59], and they are used in the present clinical trial to identify those patients with low grip strength as a support measure in the malnutrition diagnosis and sarcopenia risk. Based on age and sex, patients are classified as normal or with low grip strength (<27 kg in males, <16 kg in women) [60]. Hand dynamometry is carried out at scheduled visits v1, v3, v4, and v5. Changes occurring in grip strength are evaluated using the mean of the change and compared between treatments to evaluate its evolution.
2.6.4.4. Nutritional Ultrasound
Nutritional ultrasound is an emerging technique that uses ultrasound to assess body composition. It is composed of two techniques, muscle ultrasound (FFM assessment) and adipose ultrasound (FM evaluation). The muscle ultrasound method quantifies muscle modifications in malnutrition and provides information on functional changes [61]. In this sense, the anterior rectum area of the quadriceps can be used as a criterion for malnutrition, and it has been observed that a high rectus femoris cross-sectional area is associated with a decrease in mortality risk in cancer patients. A cutoff rectus femoris cross-sectional area (≤ 4.47 cm2/m2) and rectus femoris-Y-axis (≤ 1.3 cm) are identified in cancer patients [52] and used to evaluate changes in muscle composition. The measurement of the rectus femoris muscle of the quadriceps also correlates with force and functional execution or performance tests [62].
Malnourished cancer patients with taste distortion and consuming the miraculin-based food supplement are expected to improve their body composition from baseline (v0) to the end of the intervention (v5). The mean of the difference between the scores found between these visits will be statistically compared with those found in the rest of the treatments.
2.6.4.5. Functionality test
Timed-up-and-go (TUG) is a functional test that evaluates physical function through the time a patient takes to rise from a chair, walk three meters away, turn, walk back, and sit down again [63]. This functional test can predict fall risks and mortality [64]. A functional assessment of patients is important for nutritional status evaluation and sarcopenia diagnosis. The final purpose is the functional recovery of the patient, with positive changes in weight, FM, FFM, and functionality [41]. To evaluate the activity and monitor any clinical changes over time, the TUG test is assessed at 1, 3, 4 and 5 visits. It used sarcopenia cutoff points for low performance (≥ 20 s) [57,65]. Malnourished cancer patients with taste distortion and consuming the miraculin-based food supplement are expected to improve functionality from baseline (v0) to the end of the intervention (v5). The mean of the difference between the scores found between these visits will be statistically compared with those found in the rest of the treatments.
2.6.5. Diet
Inadequate dietary intake is an important factor involved in the weight loss and progressive functional decline associated with advanced cancer [66]. Reduced food intake is a well-established indicator of malnutrition that has strong validity. In this sense, less than or equal to 50% of energy requirements for more than one week, any reduction for more than 2 weeks, or any chronic gastrointestinal condition that adversely impacts food assimilation or absorption is considered reduced food intake or reduced assimilation, an etiologic criterion for malnutrition diagnosis [20].
Diet is collected in the 72-h food daily record at 1, 3, 4 and 5 visits, allowing the transformation of food consumption into energy intake, water, macronutrient intake (proteins, fats (total fat, saturated (SFAs), monounsaturated (MUFAs) and polyunsaturated fatty acids (PUFAs), carbohydrates, fiber, and micronutrient intake (vitamins and minerals)). From this information, it is possible to calculate the caloric and lipid profile as well as the coverage of the recommended intakes of the population. Data obtained are evaluated using the European Food Safety Authority dietary reference values [67] and the Nutritional Objectives of the Consensus Document of the Spanish Community Nutrition Society [68]. When food intake does not meet energy requirements, a high-calorie, high-protein oral nutrition supplement with fiber, EPA and DHA, beta-glucans, and enriched in L-leucine (no added sugars) is prescribed.
Dietary habits, diversity and variety are measured using a quantitative FFQ. To evaluate the overall dietary habits, the consumption frequency of all food items is categorized as meeting or not meeting the criteria of the dietary guidelines for the Spanish population [69], the food pyramid for the Spanish population [70], and the nutrition goals for the Spanish population [68].
Malnourished cancer patients with taste distortion and consuming the miraculin-based food supplement are expected to improve their dietary intake from baseline (v0) to the end of the intervention (v5). The mean of the difference between intake and food frequency found between these visits will be statistically compared with those found in the rest of the treatments. The evolution of diet is also evaluated through the different intervention visits where it will be measured (v1, v3, v4, and v5).
2.6.6. Physical Activity
Resting energy expenditure is increased in many cancer patients; however, total energy expenditure appears to be lower because of a reduction in daily physical activity [71]. In cancer patients, total energy expenditure may be estimated from standard formulas for resting energy expenditure and standard values for physical activity level [72]. To calculate the total energy expenditure and energy requirements, physical activity is evaluated. Maintenance or increase of the physical activity level to maintain physical function, muscle mass, and metabolic pattern is a clinical practical recommendation in cancer patients [40]. Increased physical activity reduced risk and improved survival for several cancers [73].
To calculate the energy balance, the energy intake obtained in the 72-h daily food record is compared with the total energy expenditure calculated from the Institute of Medicine, Food and Nutrition Board [74] plus the energy derived from physical activity obtained through the International Physical Activity Questionnaire [75]. Physical activity is evaluated at the beginning (v0) and at the end of the intervention (v5). The mean of the difference between intake and food frequency found between these visits is statistically compared with those found in the rest of the treatments. The evolution of diet is also evaluated through the different intervention visits where it will be measured (v1, v3, v4, and v5).
2.6.7. Quality of life
Malnutrition negatively impacts quality of life and oncologic treatment. Thus, nutrition plays a crucial role in heterogeneous cancer care. In patients undergoing (adjuvant) radiotherapy, nutritional support improves nutritional status but also some aspects of quality of life [76]. In patients with advanced cancer, where life expectancy is several months or years, deficits in nutritional status may impair performance status, tolerance treatments, quality of life, and survival [40]. The European Organization for Research and Treatment of Cancer Quality of Life Questionnaire-Core30 (EORTC QLQ-C30) used in the present clinical trial has a strong prognostic value for the overall survival of cancer patients [77]. In cancer patients, taste alterations are present for a long time [78], suggesting that the risk of malnutrition and low quality of life could continue once the treatment is finished.
Quality of life was evaluated at the beginning (v1) and at the end of the intervention (v5). The mean difference between these visits is compared with the rest of the treatments. The evolution of quality of life is also measured in v1, v3, v4, and v5.
2.6.8. Tolerance and adverse events
Nausea, diarrhea, dysphagia, vomiting, constipation, or abdominal pain are gastrointestinal symptoms that are used to measure product consumption tolerance. However, they are also considered supportive indicators that can impair food intake or absorption, an etiological criterion used for malnutrition diagnosis [20]. Symptoms of intensity, frequency, and duration will be collected in a diary sheet throughout the study and evaluated at every visit, and the percentage change between visits will be compared between treatments. Gastrointestinal disorders will be judged using Common Terminology Criteria for Adverse Events (CTCAE) from the National Cancer Institute [79]. These adverse events will be used to discern the severity of food intake or absorption impairment and evaluate tolerance to the nutritional intervention. CTCAE will be evaluated at the beginning (v1) and end of the intervention (v5), and the percentage change between these two visits will be compared between treatments. Evolution is also measured in v1, v3, v4, and v5.
2.6.9. General biochemical parameters
Biochemical parameters such as cholesterol, albumin, or lymphocytes are general health biomarkers that provide indirect information about nutritional status. They have shown a correlation with body protein, nutrient balance or energy status [41]. Plasma proteins, mainly albumin and prealbumin, are biomarkers of global protein status. Albumin, a visceral protein, shows a high correlation with mortality and morbidity [80]. Prealbumin, which is more sensitive to protein status changes because it has a short half-life (2-3 days) and hydration status does not affect its concentration [81], was also measured. Albumin and prealbumin concentrations are considered inflammatory biomarkers associated with nutritional risk [82]. Plasma C-reactive protein (CRP) is an acute-phase protein related to inflammation. The CRP/prealbumin ratio has been proposed as a predictor of mortality and hospital stay extension [83]. A CRP/prealbumin ratio > 0.24 was used as a cutoff point [84].
In addition, some vitamins, such as vitamin D, B9 and B12, and minerals, such as iron, zinc and selenium, are evaluated because they are good biomarkers of nutritional status. Complete blood count and leukocyte differential are evaluated, as well as parameters related to glucose metabolism (glucose, HbA1c, insulin), lipid profile (total cholesterol, HDL, LDL, No-HDL, triglycerides), renal metabolism parameters (creatinine, glomerular filtration rate, urate), biochemistry of anemias (ferritin, vitamin B12, serum folate), proteins (albumin, prealbumin, retinol-binding protein, total proteins), parameters related to hepatic metabolism (bilirubin, alanine aminotransferase-ALAT-) and trace minerals and elements (sodium, potassium, chlorine, calcium) at 1, 3, 4 and 5 visits to monitor the evolution throughout the study. Changes from the beginning (v1) and end of the intervention (v5) between these two visits are compared between treatments.
2.6.10. Specialized biochemical parameters
2.6.10.1. Essential fatty acids and polyunsaturated fatty acid status
Malnutrition appears frequently in cancer patients due to their oncological process and the treatments received, such as surgery, radiotherapy, or chemotherapy. The status of essential fatty acids (EFAs), linoleic acid (LA) (18:2 n-6) and α-linolenic acid (LNA) (18:3 n-3), as well as their long-chain polyunsaturated derivatives (LC-PUFAs), especially arachidonic acid (AA) (20:4 n-6, eicosapentaenoic acid (EPA) (20:5 n-3), docosapentaenoic acid (DPA) (22:5 n-3) and docosahexaenoic acid (22:6 n-3) (DHA), is essential for cellular homeostasis and, in particular, for the maintenance of immune and anti-inflammatory capacity [85,86,87]. It is well known that the EFA and LC-PUFA profile in erythrocyte membranes provides an accurate estimate of body fatty acid status in both healthy subjects [88] and cancer patients [89,90]. In the latter, EFA and LC-PUFA status is altered, usually due to low EFA intake [91]. The improvement of dysgeusia by the miraculin-based food supplement should potentially lead to increased food intake and, therefore, to a substantial improvement in EFA and LC-PUFA status.
2.6.10.2. Biomarkers of inflammation (plasma cytokines)
Cachectic syndrome, characterized by marked weight loss, anorexia, asthenia, and anemia, is inextricably linked to the presence and growth of the tumor and leads to systemic inflammation and undernutrition due to the induction of anorexia or decreased food intake and increased energy expenditure [92]. Systemic inflammation is a physiopathological characteristic of cancer patients. There are multiple origins of inflammation: tumor cells and activated immune cells release cytokines, chemokines, and other inflammatory mediators. In particular, cytokines play a key role as the main humoral factors involved in cancer cachexia, and a large number of them may be responsible for the metabolic changes associated with cancer wasting [93]. Cytokines, namely, interleukin (IL)-1 and tumor necrosis factor (TNF)-α, have been suggested to be involved in cancer-related anorexia, possibly by increasing the levels of corticotropin-releasing hormone (CRH), a central nervous system neurotransmitter that suppresses food intake, and the firing of glucose-sensitive neurons, which would also decrease food intake. IL-1, in particular, has been associated with the induction of anorexia [9] in that it blocks neuropeptide Y (NPY)-a well-known hypothalamic feeding inductor. In addition, IL-6 increases protein degradation in muscle by activating both the nonlysosomal (proteasome) and lysosomal (cathepsin) proteolytic pathways [94]. Tumor-derived factors, other than cytokines, have been proposed as triggers of the wasting process associated with cancer cachexia. Two of these molecules, lipid mobilizing factor (LMF) and proteolysis-inducing factor (PIF), have been found in tumor-bearing animals and cancer patients [95]. In addition, alterations in the gut barrier in cancer patients and translocation of bacterial lipopolysaccharide (LPS) can contribute to increased inflammation and production of cytokines and chemokines [96].
2.6.10.3. Oxidative stress and antioxidant defense system (ADS)
Oxidative stress occurs because of an imbalance between the production of free radicals and reactive metabolites and the capacity of the antioxidant defense system (ADS) to scavenge them [97]. Reactive oxygen species (ROS) play important roles in the biology of tumorigenesis. Indeed, ROS represent one of the most relevant carcinogenic entities, contributing to the different stages of tumor evolution, acting as inducers of both genomic instability and mediators of signaling pathways related to survival, proliferation, resistance to apoptosis, angiogenesis, and metastasis in preneoplastic and neoplastic cells [98]. ROS are produced mainly in five compartments: mitochondria, cytosol, and single membrane-bound organelles (peroxisomes, endosomes, and phagosomes) [99], but their major activity lies in the mitochondrion, an organelle responsible for cellular aging and ROS production as a natural byproduct of the electron transport chain (ETC) [98,100]. Under the influence of oncogenes, carcinogenic transformation processes are activated, which results in increased ROS and cellular oxidative stress, culminating in the oxidation of proteins, lipids, and DNA [101]. The role of ROS in the pathological process of cancer transcends all its stages and is relevant in the development of metastasis by increasing the invasion and migration capacity of tumor cells. This is a complex process involving the participation of several proteins and transcription factors [102].
When the hydroxyl free radical (●OH) interacts at the level of the puric bases, a modification occurs at the C8 position of the guanine ring, generating a radical that can be oxidized to 8-hydroxy-2’-deoxyguanosine (8-OHdG) or reduced to 2,6-diamino-4-hydroxy-5-formamidopyrimidine (Fapy G) [103]. These resulting products are highly mutagenic and capable of inducing a G:C to T:A transversion, with 8-OHdG being recognized as an important marker of oxidative DNA damage due to its easy detection [104]. ROS have been described to stimulate the production of R-loops of both DNA and RNA that appear during cell replication conflicts and are important inducers of genomic instability; 8-OHdG has been linked to the production of these fragments [105].
Cells can defend themselves against ROS damage due to the existence of several mitochondrial antioxidant defense mechanisms capable of inhibiting free radical synthesis. Among these mechanisms are enzymatic components such as glutathione peroxidase (GPx), superoxide dismutases (SOD), catalases (CAT) and thioredoxins (Trxs) and nonenzymatic components that are produced endogenously such as glutathione (GSH), lipoic acid, coenzyme Q and some proteins (ferritin, transferrin, and albumin) [106]. Likewise, the role of exogenous antioxidants present in the diet, such as ascorbic acid, tocopherol (vitamin E), carotenes, and phenolic compounds, stands out [97]. Some of these enzymatic components fulfill their antioxidant functions through actions such as catalysis of the dismutation of O2-- into H2O2 and O2, converting the effects exerted by SOD into essential processes for all cells exposed to O2 [107]. GPx catalyzes the reduction of H2O2 and organic hydroperoxides in the presence of GSH, acting as a hydrogen donor. During this process, GSH is oxidized to glutathione disulfide (GSSG), which is eventually revitalized by a glutathione reductase enzyme [108]. Other catalysts, such as catalases and the Trx system, are responsible for precipitating the decomposition of H2O2 into water and O2 and for reducing the actions of enzymes involved in the cellular redox balance, respectively [109]. On the other hand, nonenzymatic components of the ADS, such as ascorbic acid and tocopherol, remove free radicals synergistically, with ascorbic acid being necessary to generate reduced tocopherol [110]. Like carotenes, tocopherol exerts antioxidant effects by donating electrons to H2O2, -OH or O2- molecules, thereby inhibiting the formation of ROS in the cytoplasm [111]. Frequently, these antioxidant elements become deficient in cancer cells, facilitating the appearance of oxidative stress and the consequent deterioration of the genetic material, together with the promotion of other protumoral phenomena such as resistance to apoptosis or alterations in the regulation of the cell cycle [112]. An emerging model is that cancer cells increase the production of ROS to activate localized protumorigenic signaling but balance the increased ROS with elevated antioxidant activity to maintain redox balance [98,100].
2.6.10.4. Plasma metabolomics
Cancer has multiple effects on metabolism that include both rewiring of intracellular metabolism to allow cancer cells to proliferate inappropriately and adapt to the tumor microenvironment and changes in normal tissue metabolism. Metabolomics is a term used for the systematic identification and quantitation of all the metabolic products of a cell, tissue, body fluid, organ, or organism under varying conditions. Indeed, the metabolome of plasma is a dynamic collection of metabolites that represent its net response to current conditions [113]. Metabolomics techniques are being used to study metabolic shifts, including changes in metabolite concentrations and disturbed metabolic pathways, in the progression of cancer cachexia and expand the fundamental understanding of muscle loss [114]. In particular, the abundance of paraxanthine is decreased in cancer cachexia patients compared to those without cachexia. These patients experienced radical treatments with radio-/chemotherapy, and high 3-hydroxybutyrate levels were detected at an early stage of the treatment experienced by patients affected by head and neck squamous cell carcinoma cancer. Thus, 3-hydroxybutyrate could be exploited as a fast and sensitive biomarker of malnutrition or cachexia [115]. Overall, 45 metabolites and 18 metabolic pathways have been reported to be associated with cancer cachexia. Using random forest analysis, 15 of these metabolites have been identified as highly discriminating between disease states; within those metabolites, carnosine, leucine, and phenylacetate have been validated [116].
2.6.10.5. Oral and intestinal microbiota and metagenomics
The microbiota or microbiome refers to all of the microbial organisms that naturally exist within an ecosystem, e.g., an organism, part of an organism such as the oral cavity, the intestine, or the vagina. The concept of the microbiome refers not only to the members of the microbial ecosystem but also encompasses their collective functional capacity (metagenome) and activity (metabolome), including interactions within the community and with the host. Indeed, the metagenome is a term used to design the collective genome representative of the many microorganisms existing in a particular ecosystem, and metagenomics is the systematic study of the assemblages of genomes for those microorganisms.
Currently, much attention has been given to the oral microbiome and oral and systemic health [117]. The mouth has a variety of microbes second only to the gut in the complexity of human sites. Differences in the oral microbiome occur with old age, which may be due to oral conditions and diseases, e.g., cancer and other chronic diseases [118]. Many factors contribute to the salivary microbiome profile. In particular, radiotherapy for the treatment of head and neck cancer can produce damage to tissue and specifically salivary glands, causing an alteration in the composition of saliva accompanied by dermatitis, oral mucositis, xerostomia, dysgeusia, dysphagia, and dysbiosis [119]. The latter is related to changes in the quantitative and qualitative composition of the microbiota, mainly increased cariogenic cocci and yeast populations [120]. These changes may lead to altered host–microbe interactions or homeostatic imbalance that can contribute to a disease state, often with inflammation [121]. Recently, the oral microbiome has been suggested to be an explanatory factor for nasopharyngeal carcinoma prognosis. Lower within-community diversity was associated with higher mortality, and certain measures of between-community diversity were related to mortality [122]. Additionally, recent data suggest a potential association of the oral microbiome with mutational changes in oral squamous cell carcinoma [123]. Therefore, modifications in oral biofilms of irradiated patients improving dysgeusia, such as treatment with miraculin, could contribute to better oral health.
Current scientific evidence supports the finding that the composition and modification of the gut microbiome play an important role in the development of many different types of cancer. As an example, alterations in the oral, fecal and pancreatic microbiome composition have been associated with the etiology and progression of pancreatic ductal adenocarcinoma [124]. Metagenomic studies have reported that the intestinal microbiota can affect not only carcinogenesis but also cancer prevention and that microbes may act through various mechanisms sometimes opposite to each other (e.g., microorganisms are capable of acting as tumor suppressors or, conversely, as oncogenic), giving rise to a complex and bidirectional relationship [125,126]. The gut microbiota has also been found to be associated with extragastrointestinal tumors, such as breast cancer, leukemia, and lung cancer [127]. The intake of the miraculin-based food supplement, particularly in several cancers, e.g., head and neck cancer, would ameliorate dysgeusia and food intake, which in turn could contribute to the improvement of intestinal dysbiosis in cancer patients treated with radiotherapy.
2.7. Recruitment and timeline
The project presentation by the principal investigator to the health personnel of the Oncology Service (HULP), regular visits for nutritionists to the Day Hospital to explain the project to the patients who attended chemotherapy, recruitment of the Monographic Cancer consultation by physicians of the Clinical Nutrition and Dietetics Unit (HULP) or recruitment posters in patient waiting rooms are part of strategies for achieving adequate participant enrollment to reach target sample size.
The time schedule of enrollment, interventions, assessments, and visits for participants are shown in the schematic diagram (Figure 2).
2.8. Sample size
The sample size was established by the researchers as it was an exploratory study and in the absence of previous studies using miraculin-based supplements in cancer patients. At the end of this pilot and to assess the validity of the results, a statistical power calculation will be performed. The results obtained will serve as a basis for establishing the number of participants needed to carry out subsequent efficacy studies.
2.9. Assignment of interventions
Study patients are randomized into one of three study arms using computer-generated random numbers listed (in blocks of six) as a method of generating the allocation sequence. This sequence is generated by the Biostatistics Unit (HULP). At the same time, a second list is filled considering the most prevalent cancer types (head and neck, colorectal, lung, etc.). In this list, the ID patient number is noted in triples based on the randomly assigned treatment and cancer type. This second list ensured the balance of each type of cancer in each of the intervention groups. The allocation sequence is provided in a separate document that is unavailable to those who enroll participants or assign interventions. To implement the allocation, the sequence is sequentially numbered in opaque and sealed envelopes by a different researcher who enrolls and assigns participants to interventions. The envelope with the patient’s randomization was opened by the nutritionist when the patient signed his or her informed consent at visit 1.
Researchers, trial patients, care providers, outcome assessors, data analysts and the promoter are blinded after assignment to interventions. The blinding of the study is achieved by the presentation and identical characteristics of the product to be consumed. The chewable tablets, both the miraculin-based food supplement and placebo, are similar in appearance (Figure 3). These are packaged in white opaque bottles with 30 tablets, uniquely identified by a lot number (L01, L02, L03). The labeling identified the clinical trial name and HULP code, lot and serial number, use and dosage, as well as the expiration date and storage requirements. It is also identified with a unique barcode for tracking.
The chewable tablets are supplied by the promoter Medicinal Gardens S.L. However, they were produced, labeled, identified, and supplied by Activ Vial® from CSP Aptar Technologies. This company is the only one aware of the allocation until the opening of the blind once the statistical analysis was completed. To maintain blinding, patients are identified in the database with the ID number and the assigned lot number. Once the study has been completed, the data file will be verified, any protocol violations will be determined, the statistical analysis will be completed, and the codes will be opened.
2.10. Data collection and management
The study data will be treated following the referenced confidentiality standards and the quality criteria described above. A specific database will be created in Microsoft Excel using a standardized database creation process. All data collected in the research data collection will be entered by a member of the research team into the original database. This database will be designed with a double-entry system and filters to prevent and detect any type of inconsistency or error. Data will be incorporated based on the ID patient and visit where the results will be collected (vS, v1, v2, v3, v4, v5). The clinical trial Principal Investigator oversaw supervising the database construction. Databases will be stored in the HULP repository within the closed circuit, and RDC will be stored in the nutritionist’s office in a locked filing cabinet.
During the database creation process, a member of the research team will be in charge of notifying the principal investigator of the presence of missing values. These values will be those that for any reason have not been reflected in the RCD by the patient. The member of the research team indicated the affected cells in the database by coloring them yellow with the word “missing”. Once indicated, the sample size of the affected variable will be adjusted for subsequent statistical analysis. In no case will the patient record be deleted, only the missing value that affects the variable.
After incorporating all the data into the database, it will be duly cleaned, avoiding the appearance of symbols (<, >, etc.) that could interfere with the subsequent statistical analysis. The same member of the research team in charge of creating the original database will be in charge of creating a second database in which alphanumeric coding will be given to each variable to guarantee masking during data analysis. If so needed, new variables such as groupings or sums will be created to facilitate comparison between protocol main visits. When the database was finished, the Principal Investigator oversaw sending the Excel file to the Department of Biochemistry and Molecular Biology II (University of Granada) for analysis.
One of the plans to promote participant retention and complete follow-up is the delivery to the end of the trial of the solidarity cookbook “Cooking with Science against Cancer”, where renowned Spanish chefs designed simple dishes with foods that contain nutrients against cancer [128].
2.11. Statistical methods
A preliminary study to identify out-of-range values or outliers will be performed. Outliers will be considered those that are greater than the value of the means ± 2 standard deviations. A qualitative descriptive analysis of data will be performed in absolute and relative frequencies and percentages. Quantitative data will be presented as the means ± standard deviations (SD), medians, ranges, percentiles, and percentages. The normality of distribution for each variable will be determined using Kolmogorov‒Smirnov and Shapiro‒Wilks tests. Levene’s test will be used to evaluate the homogeneity of variances. Parametric or nonparametric tests will be performed depending on whether the variables are normally distributed.
A multivariate analysis of covariance (MANCOVA) for repeated measures will be used to analyze the relationship between a dependent variable and multiple independent variables while controlling for the effects of one or more covariates. A separate analysis of covariance (ANCOVA) on each independent variable controlling for the effects of the covariates will be carried out.
A general linear model (GLM) will be used to model the linear relationship between a dependent variable and one or more independent variables (including continuous, categorical, and binary data). The analysis of the qualitative variables and percentages will be carried out through χ2 or Fisher’s F analysis depending on the variable sample size.
Specific statistical and bioinformatic software will be used for metabolome, microbiome, and metagenome analyses. This included PCA, OPLS-DA, analysis of metabolic pathways with mummichog and GSEA, PERMANOVA, etc.
Double-sided tests will be applied when needed, and a p value < 0.05 will be considered statistically significant. Data will be analyzed using IBM SPSS Statistics for Windows, version 21.0 (IBM Corp., Armonk, NY, USA) and the R Project for Statistical Computing. R is available as Free Software under the terms of the Free Software Foundation’s GNU General Public License in source code form (https://www.r-project.org/).
2.12. Monitoring
After carrying out an exhaustive evaluation of the risks and benefits of the study, the establishment of a data monitoring committee was dismissed. This is a pilot clinical trial for the establishment of future study parameters; it has a small sample size, is not a long-term study and has a low complexity design [129]. In this sense, it has been established that it is a clinical trial with a low level of intervention, and it has a favorable safety profile and a very low risk of serious adverse effects. Additionally, although the parameters set to be measured are extensive, the collection and data analysis are relatively simple. However, periodic information on the clinical trial status will be communicated to the HULP Ethics Committee.
However, the stakeholders involved will meet every week through an online call to update on the clinical trial progress and any eventuality that may arise during the study. This commission is made up of the principal investigator of the study who summarizes the status of the study, raises the drawbacks, possible solutions to the problems, and supervises the proper development of the study; the study coordinator who presents the patients recruited, in follow-up, discharges, etc., and manages the consumables used; the project coordinator, who stipulates the next steps of the project (publications, communications to congresses, management of body samples); and the promoter, in charge of supplying the study products and providing the consumables material of the study.
The clinical trial medical team will oversee evaluating, reporting, and managing possible adverse events and other unintended effects. In this case, it will be the principal investigator, a physician by profession, who will make the final decision to end the clinical trial.
3. Materials and Equipment
3.1. Olfactory-gustatory tests
3.1.1. Electrogustometry
The threshold for an electric-induced taste stimulus (taste acuity) was measured using an electrogustometer (SI-03 Model, Sensonics International, New Jersey, USA). The electric stimulus is applied with a monopolar electrode (a single, flat, circular stainless-steel stimulus probe) placed on the tongue between the tip and behind the sulcus medianus linguae. The electrogustometer produces low-amplitude stimuli of a predetermined duration (0.5 seconds). All patients were instructed not to eat or drink for an hour before beginning the test. First, a 30 dB (256 𝜇A) stimulus is administered to test whether the subject is capable of recognizing electrogustometric stimuli. Once the threshold is checked, the stimulation starts at the zero-stimulus amplitude, and increasingly stronger stimuli are presented until the patient identifies the stimulus. To measure detection thresholds, the two-down one-up forced-choice single staircase procedure and a stimulus-response staircase are used. If the threshold for stimulus perception is not detected, the next higher- and lower-strength stimuli are presented to the patient. The electric threshold scores are measured at the area of the fungiform papillae on both sides of the tongue. Thresholds are measured in a randomized sequence chosen by the researcher.
The test starts with the 0 dB (8 𝜇A) configuration. If the patient fails to identify the stimulus (−) or (+ −), the intensity is increased (6 dB); if the patient succeeds in both measurements (+ +), the intensity is lowered (−6 dB). The same procedure is repeated at the new intensity, and the same criterion is maintained. If the patient fails (−) or (+ −), the intensity is increased, and if they succeed (+ +), the intensity is lowered. When the first negative point is reached, it is taken as a reference to start the analyses. From this point on, a total of 4 points need to be acquired: one positive (+ +), one negative (−) or (+ −), another positive (+ +), and another negative (−) or (+ −). This is represented in the template as a staircase. Once these four points have been obtained, an average of the decibel (dB) values obtained should be taken.
According to the guidelines of the German Society for Olfactology and Gustology, threshold differences between the left and right sides greater than 7 dB are considered abnormal [130].
3.1.2. Taste strips test
Taste strip tests are used to measure chemical taste perception. Based on taste-impregnated filter paper strips, the taste strip test is a validated examination method to determine the ability to taste [27,131] (“Taste Strips”, Burghart Messtechnik GmbH, Germany). Four different taste strips (sweet, sour, salty, and bitter) in four different concentrations (sweet: 0.4, 0.2, 0.1, 0.05 g/mL sucrose; sour: 0.3, 0.165, 0.09, 0.05 g/mL citric acid; salty: 0.25, 0.1, 0.04, 0.016 g/mL sodium chloride; bitter: 0.006, 0.0024, 0.0009, 0.0004 g/mL quinine hydrochloride). These taste strips are presented successively to the cancer patients in a pseudorandomized manner (Test sequence I: U-D-P-L-H-U-G-C-O-K-V-F-B-J-N-A-E-I-M; Test sequence II: U-H-L-P-D-U-K-O-C-G-V-N-B-F-J-E-M-I-A). Umami is not tested as a descriptor because it is not widely used in Spain. In addition to the impregnated strips, strips with no taste (blank U+V) are offered at the beginning of the test.
One hour before testing, subjects are asked not to eat or drink anything except water, not to smoke, and not to brush their teeth. For the assessment of whole-mouth gustatory function, the strips are placed on the tongue, and the mouth is closed for 10 seconds (the tongue may be moved). Once the strip was removed, the participant was asked to identify the taste. When a taste is not identified, participants are forced to guess. After each strip, the patient mount was rinsed with water to cleanse the palate.
Each correct answer yields one point with a maximum score of 16 points (4 concentrations of each of the 4 basic taste qualities). Blanks are not counted during the evaluation. At a score below the threshold value of nine, hypogeusia can be assumed regardless of age. Complete ageusia can be assumed if the highest concentrations of all four qualities are not detected. The total taste performance and the performance of each taste quality can be evaluated separately. For example, hypogeusia (total score = 7) with partial ageusia for sweet (“no perception of sweet”).
3.1.3. Sniffin’ Sticks Smell test
Orthonasal olfactory function (smell perception) is measured by the “Sniffin’ Sticks” test [132], which is based on odor-containing felt-tip pens (“Sniffin’ sticks” Burghart Messtechnik GmbH, Germany). This test consists of a total of 16 odors that are presented to the patient to be identified. The patient did not consume food, drinks, or cigarettes 15 minutes before testing, and tap water was permitted. For each odor pen, a choice card with 4 choices is provided (e.g., orange, strawberry, blackberry, pineapple). Patients have to choose the term that best matches their olfactory perception. Each is uncovered and held 2 cm from the tip of the nose for 3-4 timed seconds. When an odor is not identified, participants are forced to guess. The 16 pens are presented to the patient one after another at an interval of approximately 30 seconds. The score sums up all correct answers. Test results are used to differentiate between normosmia and hyposmia depending on the age of the patient (Figure 4).
3.2. Malnutrition Criteria
The nutritional diagnosis of malnutrition is established through the GLIM criteria (Global Leadership Initiative in Malnutrition), which classify nutritional status based on phenotypic and etiological criteria [20] (Table 2).
Reduced muscle mass is a phenotypic criterion with strong evidence to support its inclusion in the GLIM consensus criteria. GLIM refers to recommendations from the European Working Group on Sarcopenia in Older People (EWGSOP) [57]. Bioelectrical impedance analysis (BIA) and the body composition method are used to evaluate reduced muscle mass, and hand-grip strength functional assessment is considered a supportive measure.
To assess the reduced food assimilation, gastrointestinal symptoms as supportive indicators that can impair food intake or absorption (vomiting, dysphagia, constipation, nausea, diarrhea, or abdominal pain) are considered. It is used as a clinical judgment to discern severity based on the degree to which intake or absorption is impaired. Symptom intensity, duration and frequency are noted.
Inflammation status, major infection, trauma and acute conditions associated with mild to moderate inflammation are considered. Transient inflammation of a mild degree is not considered a threshold for this etiologic criterion. Chronic disease-related is associated with malignant disease, chronic obstructive pulmonary disease, congestive heart failure, chronic renal disease, or any disease with chronic or recurrent inflammation. Indeed, C-reactive protein (CRP) is used as a supportive laboratory measure of inflammation.
3.3. Morphofunctional Studies
3.3.1. Anthropometric parameters
Anthropometric variables are taken using standard techniques, following the international norms established by the WHO [133]. Body weight is measured using a clinical digital scale (capacity 0-150 kg), preferably in the morning after 12 hours of fasting and after evacuation to obtain the most stable values. When it was not possible, the time of day was noted. Height was measured with a height meter with an accuracy of 1 mm (range, 80-200 cm). This measure requires the subject to stand with their feet together and their heels, buttocks, and upper back in contact with the scale. The head should be positioned in the Frankfurt plane (the lower edge of the eye socket is in the same horizontal plane as the upper protrusion of the ear’s tragus) to obtain the highest point of the skull [134]. The patient is instructed to take and hold a deep breath, and while keeping the head in the Frankfurt plane, the measurement is taken at the end of a deep inhalation. Waist circumference is taken at the narrowest level, between the lower costal edge (10th rib) and the iliac crest. If there was no obvious minimum waist, the measurement was taken at the midpoint. The tape is readjusted to ensure that it does not slip or conform excessively to the skin. The subject should be breathing normally, and the measurement is taken at the end of an expiration (at the end of tidal volume) [135]. Body mass index (BMI) was determined using the following formula: [weight (kg)/height (m)2]. The relationship between the waist circumference (cm) and the height (m) of the individual was determined to obtain the waist-height index.
3.3.2. Bioelectrical Impedance Analysis
Body composition was evaluated using a multifrequency BIA (Bioelectrical Impedance Analyzer), the EFG ElectroFluidGraph® (Akern S.R.L., Pontassieve, Florence, Italy). Standardization of the BIA technique is a fundamental aspect of the validity of the estimates. In this study, the standard four-pole technique is used [136]. The conditions to reduce variations and guarantee the reliability of the measurement before performing the BIA are as follows: patient in a relaxed state, supine position on a nonconductive surface with bare feet and minimal clothing, limbs abducted at 45°, no metal accessories (earrings, chains, bracelets, etc.), adequate room temperature, fasting for more than 2 hours and without consuming alcohol, coffee, caffeinated soft drinks or chocolate in the 24 hours before the study; no strenuous exercise in the previous 24 hours, preferably not be in the menstrual period and not coincide with the 3 days that precede the same.
Subsequently, BIA electrodes were placed on the skin’s surface, on the right hand and on the right foot, according to a standard protocol. The inductors are positioned at a distance in the metacarpal (on the back of the hand between the knuckles of the index and middle fingers) and metatarsal (top of the foot at the base of the toes) line through surface electrodes. The sensors (black clamps) are attached via electrodes to the wrist and ankle joints and therefore inside the electric field. Once placed, a low constant electrical current is passed through the electrodes. The current is at a frequency of 50 kHz and a voltage of 800 millivolts. BIA equipment measures the resistance encountered by the electrical current as it passes through the body. This resistance is then used to estimate the body composition (fat mass [kg], free fat mass [kg], body cell mass [kg], total, extracellular, and intracellular water [L], hydration [%], ASMM [kg], SMI [kg/m2]) and other parameters (resistance [R], reactance [Xc], impedance [Z], phase angle [PhA], and standardized PhA), taking into account the height, weight, age, and sex of the patient through a mathematical algorithm. To calculate the ASMM index, the following formula was used: ASMM (kg)/height (m)2.
A vectorial analysis (BIVA) of the data was carried out to determine the nutritional and hydrated status.
3.3.3. Dinamometry
A dynamometer was used to measure patient strength and to determine muscle functionality in both hands. Strength was assessed by using a hand hydraulic dynamometer (Jamar®, Performance Health Supply Inc., Nottinghamshire, UK) with an adjustable handle, five grip positions (35−87 mm), a hydraulically sealed dual scale (pounds and kilograms), and an isometric grip force indicator (0−90 kg). The maximum force indicator remains after each reading until it is reset. The Jamar dynamometer has been shown to have high reliability and validity for measuring grip strength [137].
To ensure accurate and consistent results, the following standardized procedures were followed [138]. The patient had to rest for at least 5 minutes before. Any jewelry or objects that may interfere with the grip are removed. The dynamometer handle is adjusted to fit the subject’s hand size. The red peak-hold needle counterclockwise had to be zero. Patients are instructed to sit upright in an individual sitting position with their shoulder adducted and neutrally rotated, elbow flexed at 90°, wrist between 0 and 30° dorsiflexion and between 0 and 15° ulnar deviation, and forearm resting on a flat surface. The dynamometer handles parallel to the fingers. The patient is instructed to squeeze the dynamometer handle as hard as possible using their dominant hand for 5 seconds. The maximum force in kilograms displayed on the dynamometer is recorded. The grip strength measurement was repeated three times with a 30-second rest period between each measurement to obtain an average score. Scores within two standard deviations of the mean are considered within normal limits. For their interpretation, patient hand grip strength is compared to reference values based on age, sex, and body size for the Spanish population [59]. Grip strength is a reliable indicator of overall muscle strength and is correlated with daily living functional abilities.
3.3.4. Nutritional ultrasound
The Nutritional Ultrasound® methodology is based on the technical considerations and standardization carried out in Spain [61].
Muscle ultrasound technique. Ultrasound analysis measures muscle architecture parameters [139]. The present study focuses attention on the rectus femoris muscle of the quadriceps due to its correlation with strength and functional execution or performance tests [62].
Grayscale ultrasonography with a linear transducer with a coefficient of variation of 1.3% was used (Mindray Z50 Serie, Shenzhen, P.R. China). The measurement of the loss of muscle thickness is carried out using a linear transducer with high-frequency sound waves (1-10 MHz). This measurement includes the vastus medialis and rectus femoris muscles.
Twenty-four hours before the start of the procedure, the patient avoided exercising or performing strenuous activities. The patient being tested wore a gown to allow easy access to the muscle. First, the patient is placed in the supine position with the legs relaxed and extended at a 45° angle. Ultrasound conductive gel is applied to the skin over the muscle. The ultrasound probe is placed on the skin and moved over the muscle to obtain the muscle tissue images. Ultrasound sends high-frequency sound waves into the muscle tissue, which bounce back to the probe and create an image on the screen. A transverse image of the right leg was obtained. With the transducer at 90 degrees to the thigh, two measurements are taken at different thigh heights. The image is taken in the lower third of the imaginary line connecting the anterior superior iliac crest and the upper border of the patella once the anterior rectus muscle is located. Data obtained by muscle ultrasound are axes (X [cm] and Y [cm]), circumference (cm), and area (cm) of the anterior rectus muscle and subcutaneous adipose tissue (cm).
Adipose ultrasound technique. It is useful for evaluating the fat mass compartment: subcutaneous (superficial and deep-layer) and preperitoneal visceral adipose tissue of the abdomen. With the patient in the supine position, the transducer is kept perpendicular to the skin placed between the xiphoid process and the umbilicus along the linea alba. The skin is touched as lightly as possible with the transducer so that the fat layers are not compressed. Images were taken during expiration in a transverse plane with a variable probe depth of 4−10 cm, perpendicular to the skin. Superficial and deep layers are differentiated. Visceral adipose tissue was measured using the Hamagawa technique [140]. In the transverse position, the distance between the limit of the parietal peritoneum and the linea alba on the inside at the junction of the two rectus abdominis muscles is measured. Data obtained by abdominal ultrasound are total adipose tissue (cm), superficial adipose tissue (cm), and preperitoneal visceral adipose tissue (cm).
The superficial subcutaneous fat layer is related to energy reserve, a deep subcutaneous fat layer may play a role in neuroendocrine regulation via the secretion of adipokines, preperitoneal visceral adipose tissue is a visceral ectopic tissue (hepatic steatosis equivalent) and other pathological adipose tissues, and visceral deposits are related to metabolic manifestations such as diabetes or atherosclerosis [41].
3.3.5. Timed up and Go Test
The up-and-go test is a simple clinical assessment tool used to evaluate a patient’s ability to perform functional tasks (walking and turning), balance ability and coordination. During the test, patients are asked to rise from a seated position (back supported and their arms resting on the armrests), walk a distance of 3 meters, turn around, walk back to the chair, and sit down again. The time taken to complete the task is recorded. When the time required to complete the up-and-go test is ≥ 20 seconds, the patient is considered frail [57,65].
3.4. Surveys
3.4.1. Taste and Smell Survey
A modified version of the Taste and Smell Survey (TSS) [141] is used to explore the prevalence, characteristics and severity of taste and smell changes since becoming ill. This TSS has been used before in the oncology setting [142,143], including advanced cancer [141]. The TSS responses generate a chemosensory complaint score. It consists of 12 items, 7 of which are related to taste and 5 related to smell. One point is awarded for each reported complaint. An additional point is awarded when it is mild/moderate or rarely/sometimes and a further 2 points if it is severe/disabling or often/always. Taste changes are scored from 0 (no change) to 10 (multiple severe changes) and smell changes from 0 (no change) to 5 (multiple severe changes). A combined chemosensory complaint score of 0 to 15 points is calculated. Two open questions (Questions 10 and 12) allow patients to describe how taste and smell disturbances impacted their quality of life. Question 6 is also unscored.
3.4.2. Food Daily Record
For the quantitative assessment of the intake of energy and nutrients, a food daily record was used following the recommended guidelines [144]. Foods, drinks, dietary supplements and preparations consumed for three days (one of which must be a holiday) before the consultation are recorded. The information obtained is structured in mealtimes (breakfast, mid-morning, lunch, mid-afternoon, dinner, and other meal moments). Patients are asked about the meal place (home, work, restaurant, etc.), food consumption time, and time spent (start and end time meal is registered). Patients provided a detailed description of food consumption (ingredients, method of preparation, brands, type). Subjects are instructed to record the weight of the food consumed or, if this is not possible, to record household measurements (spoonfuls, cups, etc.). At each visit, all records were thoroughly reviewed by a nutritionist in the presence of the patient to ensure that the information collected was complete. To facilitate the process, the nutritionist uses the “Photo guide of common portion sizes of Spanish foods”, which includes 12 food groups, 204 foods commonly consumed by the Spanish population, and 944 photographs [145].
The energy and nutritional content of the foods and beverages consumed were calculated using DIAL software (Alce Ingeniería, Madrid, Spain).
3.4.3. Food Frequency Questionnaire
Dietary patrons are assessed using a semiquantitative 137-item food frequency questionnaire (FFQ) previously validated in Spain [146]. The questionnaire is based on the most common portion sizes (weight [g] and volume [mL]) and food groups in the Spanish population that are multiplied by the consumption frequency for each food. Frequency categories included never or almost never; 1-3 times a month; 1, 2−4 or 5−6 times a week and 1, 2−3, 4−6, >6 times a day. Although the FFQ indicates a range of consumption for each food, in the present study, the exact frequency of consumption is specified (2 times a week, 3 times a week, etc.). The information collected from the FFQ was obtained face-to-face with the patient by a trained nutritionist. The FFQ assesses the individual’s diet through nine food categories and 150 items: milk and milk products; eggs, meat and fish; vegetables and vegetables; fruit; legumes, cereals and potatoes; oils and fats; pastries and pastries; sauces, fried foods, snacks, sugars and salt; and drinks. It also included a special category about dietary supplement/product consumption.
3.4.4. Physical Activity
To assess physical activity patterns, the short version of the International Physical Activity Questionnaire (IPAQ) validated in the Spanish population is used [75]. This questionnaire consists of seven questions that explore physical activity patterns over the past 7 days. The questionnaire is divided into two sections. In the first section, patients are asked to describe the type, frequency, and intensity of activities performed in four areas (at work, at home, during transportation, and during leisure time). Questions are presented on a frequency scale (days per week) and duration (minutes per day). In the second section, patients are asked to indicate the time spent sitting during a typical day of the week. Questions are presented on a time scale (hours per day). Once the questionnaire is completed, a total physical activity score is calculated based on the duration and frequency of reported activities. The results provide quantitative [total energy metabolism rate (MET) per minute/week] and qualitative (low, moderate, or vigorous activity) information on physical activity.
To calculate the quantitative physical activity, time dedicated to each activity is taken into account (8 MET for vigorous activities, 4 MET for moderate activities and 3.3 MET for walking) by applying the following equation: Total MET (minutes/week) = MET x minutes/day x days/week.
To obtain qualitative information on physical activity, the following assumptions are considered. Low Activity (no activity is recorded or some activity is reported but not enough to fall into moderate activity), Moderate Activity (≥ 3 days of vigorous activity at least 20 min/day or ≥ 5 days of moderate activity and/or walking at least 30 min/day or ≥ 5 days of any combination of walking, moderate or vigorous activity or ≥ 600 total MET min/week), Vigorous Activity (≥ 3 days/week of high activity and at least ≥ 1500 MET min/week or ≥ 7 days/week of any combination of walking, moderate or vigorous activity + ≥ 3000 MET min/week). Time sitting (h) or walking (min) is also recorded.
3.4.5. Quality of life
Quality of life (QoL) was evaluated using the EORTC QLQ-C30 questionnaire for cancer patients validated in Spanish [147]. The questionnaire consists of 30 questions referring to the previous week. This is formed by 5 functional scales (daily activities and physical, emotional, cognitive and social functioning), 3 symptomatic scales (fatigue, pain and nausea and vomiting), 1 overall health scale, and 6 questions about dyspnea, insomnia, anorexia, constipation, diarrhea and economic impact. Values between 1 and 4 points are assigned (absolute [1 point], little [2 points], quite [3 points], and a lot [4 points]). The last two items (29 and 30) are given a score from 1 to 7, with 1 being terrible and 7 being excellent.
Scores obtained are standardized from 0 to 100 points to determine the disease impact for each scale. To score the scales, first, the average of the items that contribute to the scales (raw score, RS) is estimated. RS = (Q1 + Q2 +…+ Qn)/n. Then, a linear transformation was used to standardize the RS using the following formulas: Functional scales = [1-(RS-1)/range)]*100, Symptom scales/items and global health status (QoL) = [(RS-1)/range]*100. The range is the difference between the maximum possible value of RS and the minimum possible value. A high score on the global health status and functional scales indicates a better quality of life, while a low score on the symptoms scale indicates a decrease in quality of life.
3.4.6. Miraculin-based food supplement perception efficacy
A visual analog scale (VAS) was designed by the researchers to obtain information about the miraculin-based food supplement consumption patient perception efficacy. The questionnaire includes 5 questions to answer on a 10 cm scale, where 0 means not at all or very bad and 10 means very good or very effective. The questions included are as follows: Do you notice a food taste change after consuming the product? Does food taste better to you? Does it allow you to eat more food? What is your opinion about the product? Are you satisfied with the effectiveness of the product? Does the administration of the product seem adequate to you?
3.4.7. Tolerance and Adverse Events
A diary sheet is given where the patient writes down the possible adverse events, symptoms presented, symptoms date (beginning and end), intensity (mild, moderate, intense), a possible relationship with the product (yes, no, it is possible) and behavior adopted. On every visit, the patient is also asked about any other discomforts not written down because they are considered light and related to product consumption. Gastrointestinal disorders such as abdominal distension, abdominal pain, nausea, regurgitation or gastroesophageal reflux, vomiting, constipation, diarrhea, and flatulence are defined and recorded based on Common Terminology Criteria for Adverse Events (CTCAE) from the National Cancer Institute [79]. These adverse events are classified as Grade 0 (not described), Grade 1 (mild), Grade 2 (moderate), Grade 3 (severe), Grade 4 (mortality risk), and Grade 5 (death associated with an event).
3.4.8. Blood pressure and heart rate
Trained personnel measured blood pressure (BP) and heart rate in the right arm in triplicate with a validated semiautomatic oscillometer (Omron HEM-705CP; Hoofddorp, The Netherlands) (accuracy ± 5 mmHg) while the participant was in a seated position after 5 min of rest. The mean of the three systolic and diastolic BP measurements at 5 min intervals was calculated. BP values of 120/80 mmHg are considered normal references, and the ACC/AHA criteria are used for the diagnosis of arterial hypertension [148].
3.5. Blood Parameters
Blood samples were collected in the morning (approx. 8:00 am) by trained personnel at the Hospital University La Paz Extraction Unit coinciding with blood tests before chemotherapy to avoid more punctures and hospital visits than necessary. Fasting samples were collected in vacuum tubes, labeled, transported, and then centrifuged for 10 min at 1500×g for general biochemical analysis. Samples for specialized analysis were prepared as indicated below. Sample aliquots were prepared and labeled according to a numerical code and properly stored at -20 °C or -80 °C as appropriate.
3.5.1. General biochemical analysis.
In addition to the assessment of the hemogram and coagulation test, the biochemical parameters to be assessed at each of the visits are taken from the patient’s routine analysis closest to the study visit (v1, v3, v4, v5). The following parameters were analyzed: albumin, prealbumin, C-reactive protein (ultrasensitive), glucose, lipid profile (total cholesterol, triacylglycerols, HDL-c, LDL-c), transaminase GOT and GPT activities, uric acid, creatinine, fat-soluble vitamins (A, D, E), other vitamins (B9 (folates) and B12), and minerals (iron, zinc and selenium).
All these analyses were carried out in the Biochemistry Laboratory of the Hospital La Paz using methods developed by the researchers of this institution with an Olympus AU5400 Automated Chemistry Analyzer (Olympus Corporation, Izasa, CA, USA) (albumin, prealbumin, RBP, glucose, lipid profile (TC, TG, HDL, LDL), safety parameters (transaminases, urate, creatinine), fat-soluble vitamins (A, D, E), Vitamin B12, folate, iron metabolism, Zn, Se. Hemogram, lymphocytes, coagulation, PCRus).
3.5.2. Specialized biochemical analysis
3.5.2.1. Plasma and erythrocyte collection
Venous blood samples were collected in EDTA-containing tubes and processed within the following 2 hours. After centrifugation at 3500 × g for 10 min, the plasma was divided into aliquots for specialized biochemical analyses of plasma cytokines, nonenzymatic antioxidant defense system analytes and metabolomics and frozen at -80 °C until transport and analysis. The cell pellet was immediately washed three times with 0.9% NaCl isotonic solution, and the packed erythrocytes were collected and stored at -80 °C until analysis for the red blood cell enzymatic-antioxidant defense system and for lipid extraction and analysis. Erythrocyte fatty acid profile.
3.5.2.2. Urine collection
A sample of the morning urine will be taken using a standardized procedure in visits 1 and 5; samples will be aliquoted in 1 ml Eppendorf tubes and immediately frozen at -80 °C until further analysis.
3.5.2.3. Fatty acid profile of erythrocytes
Erythrocyte lipid extraction
For the extraction of erythrocyte lipids, approximately 1 mL of washed cells was successively treated with 3 mL of isopropanol containing 50 mg/L butylated hydroxytoluene as an antioxidant, 2 mL of isopropanol and 2 mL of hexane. After centrifugation for 10 min at 3000 g at 4 °C, the upper hexane phase was collected and re-extracted three times with 2 mL of hexane. The hexane extracts were combined and dried under nitrogen. For fatty acid methylation of erythrocytes, the procedure of Lepage & Roy (1988) [149] was followed. Briefly, a direct methylation procedure was carried out in 5.0 mL of methanol-acetyl chloride 50:1 (v/v). To stop the reaction, 3 ml of 6.0% K2CO3 was added. After adding 150 µL of hexane, shaking and centrifuging, the upper phase was separated and dried under nitrogen.
Separation and quantification of fatty acids from erythrocyte lipids.
Methylated fatty acids were resuspended in 100 µL of hexane, and 1 µL was injected into a gas‒liquid chromatograph coupled to mass spectrometry (GLC‒MS) with a capillary column (60 m x 32 mm inner diameter; 20 µm film thickness) impregnated with SP2330 FS (Supelco, Bellefonte, CA, USA). Fatty acid methyl esters are identified and quantified by comparison of retention times with those of previously used authentic standards and confirmation by MS [150].
3.5.2.4. Evaluation of corporal oxidative stress
Determination of 8-iso-PGF2α concentration in urine
The concentration of 8-iso-PGF2α in urine was determined by a highly specific and validated enzyme immunoassay (ELISA) as previously described [151] (EA85 Oxford Biomedical Research, Oxford, MI, USA) (CV: 14.13%). The detection limit of the analysis was 23 pmol/L.
Determination of 8-hydroxy-2’-deoxyguanosine concentration in urine
The concentration of 8-OHdG in urine was determined by a competitive enzyme-linked immunosorbent assay (ELISA) kit (JAICA, Fukuroi, Japan) (CV: 5.73%) as reported elsewhere [151,152]. Briefly, the primary monoclonal antibody and the sample or standard are added to microplates previously coated with 8-OHdG. After incubation for one hour at 37 °C, the plates were washed with phosphate-buffered saline (PBS). Horseradish peroxidase-conjugated secondary antibody was then added to each well, incubated at 37 °C for another hour and washed again with PBS. After the addition of the enzyme substrate to each well, the plate was allowed to react at room temperature for an additional 15 min. Finally, the reaction was terminated with phosphoric acid. The absorbance of each well was determined at 450 nm with a microplate reader. The determination range was 0.125-10 ng/mL. The concentration of 8-OHdG was adjusted according to urine levels of creatinine and is expressed as ng 8-OHdG/mg creatinine [153,154].
3.5.2.5. Evaluation of the antioxidant defense system Plasma total antioxidant capacity (TAC)
TAC was assessed using a spectrophotometric antioxidant assay kit (709001; Cayman). The antioxidant assay can be used to measure the total antioxidant capacity of plasma, serum, urine, saliva, or cell lysates. Water- and lipid-soluble antioxidants are not separated in this protocol, so the combined antioxidant activities of all their constituents, including vitamins, proteins, lipids, glutathione, uric acid, etc., are evaluated. The assay is based on the ability of the antioxidants in the sample to inhibit the oxidation of ABTS® (2,2’-azino-di-[3-ethylbenzozoline sulfonate]) to ABTS® by metamyoglobin. The amount of ABTS® produced can be monitored by reading the absorbance at 750 nm or 405 nm. Under the reaction conditions used, the antioxidants in the sample cause suppression of the absorbance at 750 nm or 405 nm to a degree that is proportional to their concentration.2-5 The ability of the antioxidants in the sample to prevent the oxidation of ABTS® was compared to that of Trolox, a water-soluble tocopherol analog, and quantified as millimolar equivalents of Trolox [155].
Determination of oxidized and reduced glutathione in erythrocytes
A specific kit for the determination of glutathione by colorimetric means was used (Invitrogen, catalog number: EIAGSHC (https://www.thermofisher.com/order/catalog/product/EIAGSHC). This kit is designed to quantitatively measure reduced glutathione (GSH) and oxidized glutathione (GSSG) present in a variety of samples, including erythrocytes. No separation or washing is needed. A GSSG standard was provided to generate a standard curve for the assay, and all samples were read on the standard curve. The kit uses a colorimetric substrate that reacts with the free thiol group of GSH to produce a highly colored product. The reagents supplied are in solution, so a simple dilution should be carried out for use in the assay. If 2-vinylpyridine is used to block any free GSH in the sample, oxidized glutathione (GSSG) can be determined. Samples that have not been treated with 2-vinylpyridine allow the determination of total GSH levels. The concentration of free GSH in the sample was calculated from the difference between the total GSH determined and the GSH generated from oxidized glutathione in samples treated with 2-vinylpyridine. The GSH concentration can be determined from an endpoint reading of the color developed at 405 nm or by measuring the rate of color development at 405 nm.
Erythrocyte antioxidant enzyme activities
The hemoglobin (Hg) concentration in blood samples was determined with a colorimetric cyanmethemoglobin method using Sigma Diagnostic Drabkin reagents. The activities of the antioxidant enzymes CAT, GR, GPx, and SOD were assayed in lysed erythrocytes by spectrophotometric-specific methods using a BIO-TEK Microplate Reader Synergy HT R (BioTek Instruments, Inc., Winooski, Vermont, U.S.A.). CAT activity was measured by assessing the decomposition of hydrogen peroxide in water at 240 nm as previously reported (Aebi, 1984) and expressed as kat/g Hb. GR activity is measured by the reduction in oxidized glutathione to reduced glutathione, and the results are expressed as μmol/min∗gHb [156]. GPx activity was assessed by the oxidized glutathione produced in the reaction at 340 nm and expressed as μmol/min∗gHb [157]. SOD activity was determined by dichromatic analysis (415/450 nm) using xanthine and xanthine oxidase to generate superoxide radicals and expressed as U/g Hb [152].
Determination of plasma antioxidants (retinol, β-carotene, and α-tocopherol)
Plasma concentrations of retinol, β-carotene, and α-tocopherol were determined by solvent extraction and ultrahigh-pressure liquid chromatography coupled to mass spectrometry (UHPLC‒MS) as reported elsewhere [158,159]. Briefly, 100 μL of plasma was extracted with 300 μl of isopropanol and centrifuged at 11,200 × g for 10 min; 5 μL of the supernatant was injected into an ACQUITY UPLCr BEH C18 50 mm x 2.1 mm internal diameter column with a 1.7 μm particle size at 50 °C (Waters Corporation, Milford, MA, USA). Retinol, β-carotene, and α-tocopherol were eluted using 0.1% formic acid in methanol as the solvent at a flow rate of 0.600 mL/min. Concentrations of plasma antioxidants are expressed in mg/L.
3.5.2.6. Plasma cytokines
Based on previous reports [92,93,94,95], relevant molecules previously described as associated with inflammatory processes and cancer cachexia will be selected for their analysis in plasma. Namely, TNFα, IL-6, IL-1β, IFN-γ, IL-4, IL-10, IL-15, IL-1RA, IL-15, IL-1RA, sIL-6R, sTNFRI, sIL-6R, sTNFRI, sTNFRII, human leukemia inhibitory factor (LIF), human ciliary neurotrophic factor (CNTF) and human proteolysis-inducing factor/dermicidin (PIF/DCD) will be analyzed. Plasma cytokine concentrations will be determined using the Luminex®200™ multianalyte profile analyzer on a Luminex R X MAPTM Technology, LabscanTM 100, (Luminex Corporation, Austin, TX, USA) and the MILLIPLEX® MAP Human High Sensitivity T-Cell Magnetic Bead Panel, Kit Cat. # HSTCMAG-28SK, Kit HCYTA-60K, Kit HSCRMAG-32K-03, Kit HCYP2MAG-62K-01 and Kit HPTP1MAG-66K-01 (MILLIPLEX MAP Multiplex Assay, EMD Millipore Corp, Billerica, MA, USA). Data will be analyzed using the 3.1 version of the xPONENT software (Millipore). The technique has an overall intra- and intraassay coefficient of variation of 10 and 15%, respectively.
3.5.2.7. Plasma metabolomics analysis.
For metabolomic analysis, three plasma aliquots of 0.5 mL each will be used. A multiplex strategy (GlobalMet from EureCat) will be used for the separation and evaluation of both water-soluble and fat-soluble plasma metabolites (lipidomics) based on semitargeted analysis by GLC‒MS (plasma metabolome analysis, nontargeted analysis by UPLC‒MS and targeted analysis by UPLC‒MS) [160,161,162].
3.6. Saliva and stool microbiota
3.6.1. Saliva sampling
The saliva samples obtained during the tests for taste and odor determination were poured into OMNIgene Oral OM-501 (DNA Genotek Inc. Ottawa, Ontario, Canada) tubes containing a bacterial DNA stabilizer and kept at 15-30 °C until they were frozen, in a period not exceeding 24 h, at -80 °C for subsequent transport with dry ice to the analysis site.
3.6.2. Stool sampling
Stool samples were coded and obtained according to the International Human Microbiome Standards (IHMS) guidelines (SOP 01 V2 and SOP-04 V2). Samples are collected directly by study participants at home using the OMNIgene Gut OM-200 (DNA Genotek Inc., Ottawa, Ontario, Canada) and stored immediately at -20 °C until transported on dry ice and immediately frozen at -80 °C in plastic tubes.
3.6.3. Flow cytometry
Microbial loads from saliva and fecal samples will be processed and analyzed by flow cytometry following a standardized procedure [163]. Briefly, 0.2 g aliquots will be suspended in physiological solution to a total volume of 100 mL (8.5 g l-1 NaCl, VWR); the suspension is diluted 1,000-fold; and samples are filtered using a sterile syringe filter (pore size 5 µm, Sartorius). Next, 1 ml of the microbial cell suspension was stained with 1 µl of SYBR Green I (1:100 dilution in DMSO, 15 min incubation at 37 °C, 10,000 concentrates, Thermo Fisher Scientific). Flow cytometry analysis was performed using a Symphony A5 flow cytometer (Becton Dickison Biosciences). Events are monitored using FL1 533/30-nm and FL3 >670-nm detectors. Instrument and gate settings are kept identical for all samples (fixed staining/gate strategy), and cell counts are converted to microbial loads per ml of saliva or per gram of fecal matter (microbial load index) [164].
3.6.4. Fecal DNA amplification and sequencing
Samples will be processed according to International Human Microbiome Standards (IHMS) guidelines (SOP-07 V2) using a QIAGEN QIAmp PowerFecal ProDNA Kit. DNA amplification will be performed by PCR of the 16S rRNA gene using bacterial-specific primers and adapter-binding barcoding (library preparation). Bacterial DNA sequencing will be analyzed following sequencing standards (IHMS SOP 08, 09 and 10 V1), and sequencing data will be further analyzed for data analysis standards (IHMS SOPs 11).
Sequencing of bacterial DNA from both saliva and feces will be performed with a nanopore procedure (MinION™) that enables direct reading of long DNA sequences [165,166]. Complete amplicons corresponding to the amplification of the bacterial 16S rRNAr gene will be analyzed. Subsequently, during bioinformatics analysis, only amplicons of a desired range can be selected (most reads are approximately 1.5 Kb), which avoids the bias that would be produced by analyzing amplicons of a few hundred bases. By sequencing the complete 16S rRNA gene, both the hypervariable regions (V1 to V9) and constants of the gene are analyzed, which allows greater reliability in the taxonomic characterization of the microbial community under study. In short, the reading of long sequences using nanopores provides a more precise analysis of the microbiological profile of interest compared to other classical technologies that analyze shorter reads, including the techniques known as NGS [166,167].
Briefly, PCR amplification of 16S rRNA genes was performed using the KAPA2G™ Robust HotStart ReadyMix PCR Kit (Kapa Biosystems, Wilmington, MA, USA) in a total volume of 25 μl containing internal primer pairs (50 nM each) and the barcoded external primer mix (3%) from the PCR Barcoding Kit (SQK-PBK004; Oxford Nanopore Technologies, Oxford, UK). Amplification was performed with the following PCR conditions: initial denaturation at 95 °C for 3 min, 5 cycles of 95 °C for 15 s, 55 °C for 15 s and 72 °C for 30 s, 30 cycles of 95 °C for 15 s, 62 °C for 15 s and 72 °C for 30 s, followed by a final extension at 72 °C for 1 min. The amplified DNA was purified with AMPure® XP (Beckman Coulter) and quantified with a NanoDrop® 1000 (Thermo Fischer Scientific, Waltham, MA, USA). A total of 100 ng of DNA was incubated with 1 μl of rapid adapter at room temperature for 5 min. The prepared DNA library (11 μl) was mixed with 34 μl of sequencing buffer, 25.5 μl of loading beads and 4.5 μl of water, loaded onto the R9.4 flow cell (FLO-MIN106; Oxford Nanopore Technologies) and sequenced on MinION™ Mk1B (Matsuo et al., 2021).
MINKNOW 1.11.5 software (Oxford Nanopore Technologies) was used for sequencing data acquisition and chimera removal, as well as for merging direct and reverse reads. The taxonomy will be assigned to ASVs using the classify sklearn naïve Bayes taxonomy classifier (via q2-feature-classifier) [168] against SILVA 16S V3-V4 v132_99 [169] with a similarity threshold of 99%.
3.6.5. Saliva and stool metagenomics
Potential functional profiles (metagenomic analysis) for the sequenced samples will be predicted using PICRUSt2 [170]. Briefly, phylotypes are placed in a reference tree containing 20,000 complete 16S rRNA genes from prokaryotic genomes in the Integrated Microbial Genomes (IMG) database. Functional annotation of these genomes is based on the Clusters of Orthologous Groups of proteins (COG) and Enzyme Commission numbers (EC) databases. To infer Metacyc metabolic pathways, EC numbers are first regrouped into MetaCyc reactions. Pathway abundances will be calculated as the harmonic mean of the abundances of the key reactions in each sample. To infer the abundance of each gene family per sample, phylotype abundances will be corrected for their 16S rRNA gene copy number and then multiplied by their functional predictions [171].
4. Detailed Procedure
The clinical trial is divided into two phases (Selection and Intervention Phase), which include a selection visit (v0) and five more visits through the study (Figure 1).
4.1. Selection Phase
4.1.1. Visit 0 (v0, selection visit).
After clinical trial approval by the Ethics Committee, patients undergoing neoadjuvant treatment with chemotherapy or chemoradiotherapy for at least three months and malnutrition who were referred to the Clinical Nutrition and Dietetics Unit from the Oncology Service were invited to participate in the study. If the patient is interested in participating, compliance with the study selection criteria is verified. When all requirements are met, an information-to-read document is provided. Two researchers are in charge of recruiting patients, explaining the protocol and providing the informed consent form. Once the patient’s doubts were clarified and if the patient was interested, informed consent was signed.
During this visit, the following activities are carried out:
- Nutritional status assessment (GLIM Criteria)
- Electrogustometry
- Taste strips test
- Taste and Smell Survey Modified
The following documentation is given to the patient to complete visit 1 (v1):
- Food Daily Record (3 days per holiday)
- Food Frequency Questionnaire
- International Physical Activity Questionnaire
- Quality of Life Questionnaire
During this visit, the patient is informed about the next visit date and provided with:
- Blood sample extraction appointment
- Stool container for microbiota and metagenome analysis
- Urine container for 8-iso-PGF2α determination
4.2. Experimental Phase
This phase includes 5 face-to-face visits. Except for visit 1, these visits are conditioned by the patients’ chemotherapy treatment sessions and are carried out in the following 4-7 days after their infusion, a period during which there is greater toxicity and taste affectation.
4.2.1. Visit 1 (v1)
Once it was verified that patients met the inclusion and exclusion criteria, the experimental phase’s first visit was made. In this visit, the patient is randomized, and the following initial measures are taken:
- Health study (blood pressure and heart rate)
-
Morphofunctional assessment:
- ▪
- Anthropometric measurements
- ▪
- Electrical bioimpedance
- ▪
- Dynamometry
- ▪
- Nutritional ultrasound
- ▪
- Up and Go Test
- Sniffin’ Stick Smell Test
- Collection and measurement of saliva volume
-
Blood sample extraction coinciding with the prechemotherapy analysis:
- ▪
- Biochemical parameters
- ▪
- Plasma metabolomic analysis
- ▪
- Plasma cytokine profile
- ▪
- Fatty acids from the erythrocyte membrane
- ▪
- Enzymatic antioxidant defense system in erythrocytes
- ▪
- Body oxidative stress in urine
- ▪
- Fecal microbiota and metagenome
- ▪
- Saliva microbiota and metagenome
During this visit, the following documentation is collected:
- Food Daily Record (3 days per holiday)
- Food consumption frequency
- International Physical Activity Questionnaire
- Quality of life questionnaire
- Feces sample
- Urine sample
Once the tests have been carried out, the patient is instructed on:
- Nutritional treatment. If an oral nutritional supplement is needed, a polymeric, hypercaloric, and hyperproteic formula enriched in omega-3 fatty acids is prescribed depending on their energy requirements.
- Healthy eating guidelines for cancer patients using the book “Cooking with Science Against Cancer” as a support are given to the patient.
- Physical exercise guidelines
During this visit, the study treatment (Miraculin-based food supplement or placebo) is delivered to the patient based on randomization, and the following documentation is delivered to bring the next visit (v2):
- Product efficacy satisfaction questionnaire (prechemotherapy)
- Next face-to-face visit date.
- The following documentation is also delivered to bring on the third visit (v3):
- Product consumption control daily sheet
- Product consumption tolerance record sheet
- Record sheet of adverse effects
4.2.1. Visit 2 (v2)
Carried out 4−7 days after the chemotherapy session, during this visit, the following measurements are made:
- Anthropometric measurements
- Electrogustometry
-
Smell and taste tests:
- ▪
- Taste Strips Test
- ▪
- Sniffin ‘Sticks Smell Test
- Collection and measurement of saliva volume
- Taste and Smell Modified Survey
- Product Efficacy Satisfaction Questionnaire (Post Chemotherapy)
The following behavioral reinforcements are also carried out on this visit:
- Nutritional treatment and physical activity
- Consumption and registration of the assigned treatment.
- Tolerance and adverse effects registry
At the end of this visit, the following documentation and material are given to the patient. These have to be delivered on the next visit (v3):
- Food Daily Record (3 days per holiday)
- International Physical Activity Questionnaire
- Quality of Life Questionnaire
- Blood sample extraction appointment
- Feces container
- Urine container
4.2.1. Visit 3 (v3)
This visit took place ±1 month after visit 1 (v1) and 3-4 days after the patient’s chemotherapy treatment session. During this visit, the following actions are carried out:
- Nutritional status assessment
- Health study (blood pressure and heart rate)
-
Morphofunctional assessment:
- ▪
- Anthropometric measurements
- ▪
- Electrical bioimpedance
- ▪
- Dynamometry
- ▪
- Up and Go Test
- Electrogustometry
-
Smell and taste tests:
- ▪
- Taste Strips Test
- ▪
- Sniffin ‘Sticks Smell Test
- Collection and measurement of saliva volume
-
Blood sample extraction coinciding with the prechemotherapy analysis:
- ▪
- Biochemical parameters
- ▪
- Plasma metabolomic analysis
- ▪
- Plasma cytokine profile
- ▪
- Fatty acids from the erythrocyte membrane
- ▪
- Enzymatic antioxidant defense system in erythrocytes
- ▪
- Body oxidative stress in urine
- ▪
- Fecal microbiota and metagenome
- ▪
- Saliva microbiota and metagenome
- Product efficacy satisfaction questionnaire
During this visit, the following documentation is collected:
- Food Daily Record (3 days per holiday)
- International Physical Activity Questionnaire
- Quality of Life Questionnaire
- Product consumption control daily sheet
- Product consumption tolerance record sheet
- Record sheet of adverse effects
- Feces sample
- Urine sample
The following behavioral reinforcements are also carried out on this visit:
- Nutritional treatment and physical activity
- Consumption and registration of the assigned treatment.
- Tolerance and adverse effects registry
At the end of this visit, the following documentation and material are given to the patient. These had to be delivered on the next visit (v4):
- Next face-to-face visit date
- Treatment product based on randomization
- Blood sample extraction appointment
- Food Daily Record (3 days per holiday)
- International Physical Activity Questionnaire
- Quality of Life Questionnaire
- Product consumption control daily sheet
- Product consumption tolerance record sheet
- Record sheet of adverse effects
4.2.1. Visit 4 (v4)
This visit took place ±2 months after visit 1 (v1) and 3-4 days after the patient’s chemotherapy treatment session. During this visit, the following actions are carried out:
- Nutritional status assessment
- Health study (blood pressure and heart rate)
-
Morphofunctional assessment:
- ▪
- Anthropometric measurements
- ▪
- Electrical bioimpedance
- ▪
- Dynamometry
- ▪
- Up and Go Test
- Electrogustometry
-
Smell and taste tests:
- ▪
- Taste Strips Test
- ▪
- Sniffin’ Sticks Smell Test
- Collection and measurement of saliva volume
-
Blood sample extraction coinciding with the prechemotherapy analysis:
- ▪
- Biochemical parameters
- ▪
- Plasma metabolomic analysis
- ▪
- Plasma cytokine profile
- ▪
- Fatty acids from the erythrocyte membrane
- ▪
- Enzymatic antioxidant defense system in erythrocytes
- ▪
- Body oxidative stress in urine
- ▪
- Fecal microbiota and metagenome
- ▪
- Saliva microbiota and metagenome
During this visit, the following documentation is collected:
- Food Daily Record (3 days, one holiday)
- International Physical Activity Questionnaire
- Quality of Life Questionnaire
- Product consumption control daily sheet
- Product consumption tolerance record sheet
- Record sheet of adverse effects
The following behavioral reinforcements are also carried out on this visit:
- Nutritional treatment and physical activity
- Consumption and registration of the assigned treatment.
- Tolerance and adverse effects registry
At the end of this visit, the following documentation and material are given to the patient. These have to be delivered on the next visit (v5):
- Next face-to-face visit date
- Treatment product based on randomization
- Food Daily Record (3 days per holiday)
- Food consumption frequency
- International Physical Activity Questionnaire
- Quality of Life Questionnaire
- Product consumption control daily sheet
- Product consumption tolerance record sheet
- Record sheet of adverse effects
- Blood sample extraction appointment
- Feces sample
- Urine sample
4.2.1. Visit 5 (v5)
This visit took place ±3 months after visit 1 (v1) and 3-4 days after the patient’s chemotherapy treatment session. During this visit, the following actions are carried out:
- Nutritional status assessment
- Health study (blood pressure and heart rate)
-
Morphofunctional assessment:
- ▪
- Anthropometric measurements
- ▪
- Electrical bioimpedance
- ▪
- Dynamometry
- ▪
- Nutritional ultrasound
- ▪
- Up and Go Test
- Electrogustometry
- Taste and Smell Survey Modified
-
Smell and taste tests:
- ▪
- Taste Strips Test
- ▪
- Sniffin’ Sticks Smell Test
- Collection and measurement of saliva volume
-
Blood sample extraction coinciding with the prechemotherapy analysis:
- ▪
- Biochemical parameters
- ▪
- Plasma metabolomic analysis
- ▪
- Plasma cytokine profile
- ▪
- Fatty acids from the erythrocyte membrane
- ▪
- Enzymatic antioxidant defense system in erythrocytes
- ▪
- Body oxidative stress in urine
- ▪
- Fecal microbiota and metagenome
- ▪
- Saliva microbiota and metagenome
- Product efficacy satisfaction questionnaire
During this visit, the following documentation is collected:
- Food Daily Record (3 days, one holiday)
- Food consumption frequency
- International Physical Activity Questionnaire
- Quality of Life Questionnaire
- Product consumption control daily sheet
- Product consumption tolerance record sheet
- Record sheet of adverse effects
- Feces sample
- Urine sample
The following behavioral reinforcements are also carried out on this visit:
- Nutritional treatment and physical activity
5. Expected Results
To the best of the authors’ knowledge, this is the first clinical trial conducted to examine the effects of regular consumption of the miraculin-based food supplement, containing the miracle fruit extract DMB, on taste perception and nutritional status in malnourished cancer patients undergoing active antineoplastic treatment. This trial employs a triple-blind randomized approach. This study uses a freeze-dried extract from the fruits of Synsepalum dulcificum, approved as a novel food and considered safe for human consumption in Europe by EFSA [67]. Orally dissolving tablets rich in miraculin, a glycoprotein with the ability to change the taste perception of sour foods to a sweet taste [172], are used to improve taste perception in cancer patients.
Taste and smell disorders are common in patients with cancer in active antineoplastic treatment; taste disturbance prevalence ranges from approximately 20–86% [28] and persists throughout the treatment [29], while smell disorders are approximately 5–60% in cancer patients undergoing chemotherapy [4]. In this sense, cancer patients with taste and smell disorders develop food aversions that reduce food intake and promote poor nutrition, deteriorate quality of life [5,26] and increase the risk of malnutrition [24,25,173]. Poor nutritional status is related to an increase in complications and toxicity of treatment, interruption or failure of treatments, longer hospital stays, readmissions, and infections and is responsible for up to 10–20% of the mortality of oncologic patients [174].
This is the first study carried out with the novel miraculin-based novel food ingredient DMB, contained in the miraculin-based food supplement, that objectively assesses taste perception in cancer patients undergoing active antineoplastic treatment through electrogustometry. In this sense, electrical taste evaluation provides an accurate means for quantitatively assessing the taste system [21], and although electrical stimulation seems to activate the same brain regions as chemical stimulation [22] and has high test-retest reliability [175], to complete taste perception assessment in cancer patients, a chemical assessment of taste has been performed. Taste and smell senses are closely related to food taste perception [176]. Taking this into account, the orthonasal olfactory function of malnourished cancer patients in active antineoplastic treatment will also be evaluated in the present study.
The main expected effect is that malnourished cancer patients with taste distortion and consuming the miraculin-based food supplement improve their food taste perception and promote better food intake, improving malnutrition and associated risks.
Some studies have shown the effect of Synsepalum dulcificum fruit for treating taste disorders in cancer patients undergoing chemotherapy. A pilot clinical trial in cancer patients with dysgeusia revealed that the consumption was safe, patients showed a taste improvement and, when taste stabilization was considered, the improvement rate was higher [18]. Later, a pilot crossover clinical trial demonstrated improvements in taste disorders; some patients increased food intake, and some reported metallic taste disappearance [19]. Both studies, however, had a short duration, making it impossible to evaluate their impact on the nutritional status of the patients. Other drawbacks are their designs, which were unblinded, and the lack of validated tools to assess changes in taste. However, these pilot clinical trials have set a precedent for miracle fruit use in taste disorders in patients with dysgeusia due to antineoplastic treatment.
Malnutrition is highly prevalent in cancer patients, and up to 10–20% of cancer patients may die because of malnutrition rather than the tumor [40]. Therefore, its early identification is vital in early treatment. This clinical trial is based on the new criteria for the diagnosis of malnutrition, which includes the assessment of phenotypic criteria (nonvolitional weight loss, low BMI, reduced muscle mass) and etiological criteria (reduced food intake or assimilation, disease burden/inflammation presence) [20]. The diagnosis of malnutrition includes at least one phenotypic and one etiological criterion. Malnutrition severity is given by the phenotypic criteria presented, while the etiologic criteria are used to provide the context to guide the nutritional intervention and anticipated outcomes. In this sense, morphofunctional assessment has been used to support malnutrition diagnosis. This new assessment tool includes classic parameters (anthropometric parameters, biochemical parameters, food intake) and emerging parameters (bioelectrical impedance, nutritional ultrasound, dynamometry, functional test, biochemical parameters) [41] that allow an accurate approximation of the nutritional status of a patient. This evaluation includes functional assessments such as hand-grip strength or TUG used as a supportive measure of malnutrition diagnosis [20].
The parameters that the morphofunctional assessment incorporates are expected to improve after the regular consumption of the miraculin-based food supplement since a change in the patient’s nutritional status will have a positive impact on them.
Taste and smell disorders are common in patients undergoing antineoplastic treatments, reducing not only their food intake but also their quality of life [177,178]. Moreover, malnutrition by itself negatively impacts the quality of life and oncologic treatment. Sour and salty tastes seem to be the tastes that are most affected by antineoplastic treatments [179]. In this sense, it is expected that the regular consumption of the miraculin-based food supplement improves the acid food taste perception and helps to improve the quality of life of patients.
In addition to miraculin, miracle berry contains a large amount of antioxidants. Indeed, it is rich in terpenoids (74.4%), phenolic compounds (15.8%), and flavonoids (11.9%) and exhibits a high antioxidant activity (18.9%) [180]. It also has anticancer abilities due to the different amides existing in the miracle fruit [181]. In cancer, high oxidative stress and profound alterations of the antioxidant defense system occur [98,99,100,101], partly associated with the inflammatory state [99] and partly related to the altered nutritional status affecting key molecules in the maintenance of oxidative homeostasis such as retinol, beta-carotene, vitamin E, vitamin C, increased ratio of oxidized to reduced glutathione, etc. [97,100,110,111]. Consequently, it is expected that the administration of DMB will contribute to decreasing the degree of oxidative stress, as evaluated in the present study through the urinary excretion of the biomarkers F2-alpha-isoprostanes and 8-hydroxy-deoxy-deoxy-guanosine [151,152,153,154]. Likewise, an improvement in both nonenzymatic and enzymatic antioxidant defense status [112] is expected, mainly based on the improvement in food intake and nutritional status of the treated patients.
Inflammation is a constant in cancer. As previously indicated, in addition to the production of proinflammatory cytokines and acute phase reactant proteins, tumor cells produce specific cytokines such as LIF and PIF, among others [92,93,94,95]. In the present project, it is expected that the improvement in nutritional status will contribute decisively to the reduction in the inflammatory process associated with cancer and, therefore, to a reduction in both proinflammatory cytokines and cancer-induced secretion factors themselves. Likewise, an increase in anti-inflammatory cytokines such as IL-4 and IL-10, which are decreased in tumor processes [92,93], presumably would occur.
As has been indicated before, malnutrition usually affects cancer patients. Beyond changes in the plasma proteome, this state of malnutrition causes changes in numerous low molecular weight biomarkers, many of which are derived from cellular metabolic activity, such as intermediary metabolism compounds, amino acids and amino acid derivatives, and compounds largely derived from nutrients and bioactive compounds derived from food intake [113,114]. The improvement of the latter and nutritional status should be associated with a metabolome closer to that of the healthy subject. In the present project, the study of the metabolome of compounds of molecular weight lower than 500 Da, as well as the lipidomic analysis, especially of lipid species (mono acyl, diacyl, and triacylglycerols, phospholipids, acylcarnitine derivatives, and oxylipins) [160,161,162], will allow us to know to what extent the miraculin supplementation translates into the improvement of the plasma metabolome in cancer subjects through the improvement of the nutritional status of the patients. On the other hand, it can be hypothesized that a higher and better quality food intake will be translated into higher intakes of essential fatty acids that should result in an improvement in the status of long-chain polyunsaturated fatty acids [88,89,90]. In this work, we plan to determine the status of essential fatty acids and their polyunsaturated derivatives by determining the fatty acid profile of the erythrocyte membrane [150]; given that supplementation with miraculin is extended for 12 weeks, this time is sufficient for the total pool of erythrocytes to be completely renewed, and therefore any change in the fatty acid profile would be indicative of improved nutritional status.
Numerous studies carried out in recent years using metagenomic techniques indicate that diet is a powerful agent involved in the establishment of specific microbiota, both in the oral cavity and in the colon [171]. In the present study, we addressed changes in the saliva and stool microbiota in cancer patients. Treatment with DMB and the increase in salivation related to some of its active compounds, such as some amides, as well as the change induced in food intake as a consequence of the improvement of taste and smell alterations, should result in relevant changes both in the salivary microbiome, which should be closer to that of the healthy subject, and in the bacterial pattern of the feces, indicative of the microbiome of the distal colon. Therefore, an improvement in the dysbiosis observed in both saliva and intestine [117,118,119,120,121,122,123,124,125,126] is expected in patients supplemented with miraculin.
One disadvantage of clinical trials is the potential decrease in the number of patients, which may be further reduced due to dropouts throughout the study. However, the primary objective of the pilot clinical trial is to comprehensively assess various parameters affected in cancer patients, who are susceptible to improvement through regular consumption of the miraculin-based food supplement.
The outcomes of this pilot clinical trial are anticipated to demonstrate whether the regular consumption of a miraculin-based food supplement, whose active principle is the miracle berry extract DMB, has a positive effect on taste distortion and the nutritional status of malnourished cancer patients undergoing active antineoplastic treatment and to determine the dosage at which maximum benefits are achieved.
Author Contributions
Conceptualization, Methodology, and Investigation, B.L.-P., A.G., T.H., J.F.B., and S.P.-M.; Resources, S.P.-M.; Writing Original Draft Preparation, B.L.-P, A.G., and A.M.-R.; Writing-Review and Editing, B.L.-P., A.G., and S.P.-M.; Visualization, B.L.-P; Supervision, A.G., S.P.-M., and B.L.-P.; Project Administration, B.L.-P.; Funding Acquisition, S.P.-M; all authors approved the final version of the manuscript.
Funding
This study is funded by Medicinal Gardens S.L. by the Center for Industrial Technological Development (CDTI), “Cervera” Transfer R&D Projects. Ref. IDI-20210622. (Science and Education Ministry, Spain).
Acknowledgments
The author would like to thank Medicinal Gardens S.L. (Baïa Food Co.) for providing the DMB® orally dissolving tablets (TasteCare®) and for its support and technical advice.
Conflicts of Interest
The funding sponsor had no role in the design of the study; in the collection, analyses, or interpretation of the data; in the writing of the manuscript, or in the decision to publish the results. The authors declare no conflict of interest, except for Adrian Menéndez-Rey and Loan Bensadon-Naeder, who are members of Medicinal Gardens S.L. The rest of the authors declare no conflicts of interest.
Appendix: Informed consent form
References
- Hovan, A.J.; Williams, P.M.; Stevenson-moore, P.; Wahlin, Y.B. A Systematic Review of Dysgeusia Induced by Cancer Therapies. Support Care Cancer 2010, 18, 1081–1087. [Google Scholar] [CrossRef] [PubMed]
- Erkurt, E.; Erkişi, M.; Tunali, C. Supportive Treatment in Weight-Losing Cancer Patients Due to the Additive Adverse Effects of Radiation Treatment and/or Chemotherapy. J. Exp. Clin. Cancer Res. 2000. [Google Scholar]
- Amézaga, J.; Alfaro, B.; Ríos, Y.; Larraioz, A.; Ugartemendia, G.; Urruticoechea, A.; Tueros, I. Assessing Taste and Smell Alterations in Cancer Patients Undergoing Chemotherapy According to Treatment. Support. Care Cancer 2018, 26, 4077–4086. [Google Scholar] [CrossRef] [PubMed]
- Gamper, E.M.; Zabernigg, A.; Wintner, L.M.; Giesinger, J.M.; Oberguggenberger, A.; Kemmler, G.; Sperner-Unterweger, B.; Holzner, B. Coming to Your Senses: Detecting Taste and Smell Alterations in Chemotherapy Patients. A Systematic Review. J. Pain Symptom Manage. 2012, 44, 880–895. [Google Scholar] [CrossRef] [PubMed]
- Berteretche, M.V.; Dalix, A.M.; D’Ornano, A.M.C.; Bellisle, F.; Khayat, D.; Faurion, A. Decreased Taste Sensitivity in Cancer Patients under Chemotherapy. Support. Care Cancer 2004, 12, 571–576. [Google Scholar] [CrossRef]
- Ponticelli, E.; Clari, M.; Frigerio, S.; De Clemente, A.; Bergese, I.; Scavino, E.; Bernardini, A.; Sacerdote, C. Dysgeusia and Health-Related Quality of Life of Cancer Patients Receiving Chemotherapy: A Cross-Sectional Study. Eur. J. Cancer Care (Engl). 2017, 26. [Google Scholar] [CrossRef]
- Henkin, R.I.; Schecter, P.J.; Friedewald, W.T.; Demets, D.L.; Raff, M. A Double Blind Study of the Effects of Zinc Sulfate on Taste and Smell Dysfunction. Am. J. Med. Sci. 1976, 272, 285–299. [Google Scholar] [CrossRef]
- Ripamonti, C.; Zecca, E.; Brunelli, C.; Fulfaro, F.; Villa, S.; Balzarini, A.; Bombardieri, E.; De Conno, F. A Randomized, Controlled Clinical Trial to Evaluate the Effects of Zinc Sulfate on Cancer Patients with Taste Alterations Caused by Head and Neck Irradiation. Cancer 1998, 82, 1938–1945. [Google Scholar] [CrossRef]
- Lyckholm, L.; Heddinger, S.P.; Parker, G.; Coyne, P.J.; Ramakrishnan, V.; Smith, T.J.; Henkin, R.I. A Randomized, Placebo Controlled Trial of Oral Zinc for Chemotherapy-Related Taste and Smell Disorders. J. Pain Palliat. Care Pharmacother. 2012, 26, 111–114. [Google Scholar] [CrossRef]
- Brizel, D.M.; Wasserman, T.H.; Henke, M.; Strnad, V.; Rudat, V.; Monnier, A.; Eschwege, F.; Zhang, J.; Russell, L.; Oster, W.; et al. Phase III Randomized Trial of Amifostine as a Radioprotector in Head and Neck Cancer. J. Clin. Oncol. 2000, 18, 3339–3345. [Google Scholar] [CrossRef]
- Büntzel, J.; Schuth, J.; Küttner, K.; Glatzel, M. Radiochemotherapy with Amifostine Cytoprotection for Head and Neck Cancer. Support. Care Cancer 1998, 6, 155–160. [Google Scholar] [CrossRef] [PubMed]
- Komaki, R.; Lee, J.S.; Milas, L.; Lee, H.K.; Fossella, F.V.; Herbst, R.S.; Allen, P.K.; Liao, Z.; Stevens, C.W.; Lu, C.; et al. Effects of Amifostine on Acute Toxicity from Concurrent Chemotherapy and Radiotherapy for Inoperable Non-Small-Cell Lung Cancer: Report of a Randomized Comparative Trial. Int. J. Radiat. Oncol. Biol. Phys. 2004, 58, 1369–1377. [Google Scholar] [CrossRef] [PubMed]
- Pellegrini, M.; Merlo, F.D.; Agnello, E.; Monge, T.; Devecchi, A.; Casalone, V.; Montemurro, F.; Ghigo, E.; Sapino, A.; Bo, S. Dysgeusia in Patients with Breast Cancer Treated with Chemotherapy-A Narrative Review. Nutrients 2023, 15. [Google Scholar] [CrossRef] [PubMed]
- Heckmann, S.M.; Habiger, S.; Wichmann, M.G., H. T. Zinc Gluconate in the Treatment of Dysgeusia: A Double Blinded Controlled Study. Chem. Senses. 2033, 28, E24. [Google Scholar]
- Hsieh, J.W.; Daskalou, D.; Macario, S.; Voruz, F.; Landis, B.N. How to Manage Taste Disorders. Curr. Otorhinolaryngol. Rep. 2022, 10, 385–392. [Google Scholar] [CrossRef] [PubMed]
- Kurihara, K.; Beidler, L.M. Taste-Modifying Protein from Miracle Fruit. Science 1968, 161, 1241–1243. [Google Scholar] [CrossRef]
- EFSA Panel on Nutrition, N.F. and F.A. (NDA); Turck, D.; Castenmiller, J.; Henauw, S. De; Hirsch-Ernst, K.I.; Kearney, J.; Maciuk, A.; Mangelsdorf, I.; McArdle, H.J.; Naska, A.; et al. Safety of Dried Fruits of Synsepalum Dulcificum as a Novel Food Pursuant to Regulation (EU) 2015/2283. EFSA J. 2021, 19, 6600. [Google Scholar] [CrossRef]
- Soares, H.P.; Cusnir, M.; Schwartz, M.A.; Pizzolato, J.F.; Lutzky, J.; Campbell, R.J.; Beaumont, J.L.; Eton, D.; Stonick, S.; Lilenbaum, R. Treatment of Taste Alterations in Chemotherapy Patients Using the “Miracle Fruit”: Preliminary Analysis of a Pilot Study. J. Clin. Oncol. 2010, 28, e19523–e19523. [Google Scholar] [CrossRef]
- Wilken, M.K.; Satiroff, B.A. Pilot Study of “Miracle Fruit” to Improve Food Palatability for Patients Receiving Chemotherapy. Clin. J. Oncol. Nurs. 2012, 16. [Google Scholar] [CrossRef]
- Cederholm, T.; Jensen, G.L.; Correia, M.I.T.D.; Gonzalez, M.C.; Fukushima, R.; Higashiguchi, T.; Baptista, G.; Barazzoni, R.; Blaauw, R.; Coats, A.; et al. GLIM Criteria for the Diagnosis of Malnutrition - A Consensus Report from the Global Clinical Nutrition Community. Clin. Nutr. 2019, 38, 1–9. [Google Scholar] [CrossRef]
- Frank, M.E.; Smith, D.V. Electrogustometry: A Simple Way to Test Taste. In Smell and Taste in Health and Disease; Getchell, T.V., Doty, R.L., Vartoshuk, L.M., Snow, J.B., Eds.; New York, 1991; pp. 503–5014. [Google Scholar]
- Barry, M.A.; Gatenby, J.C.; Zeiger, J.D.; Gore, J.C. Hemispheric Dominance of Cortical Activity Evoked by Focal Electrogustatory Stimuli. Chem. Senses 2001, 26, 471–482. [Google Scholar] [CrossRef] [PubMed]
- Murtaza, B.; Hichami, A.; Khan, A.S.; Ghiringhelli, F.; Khan, N.A. Alteration in Taste Perception in Cancer: Causes and Strategies of Treatment. Front. Physiol. 2017, 8. [Google Scholar] [CrossRef]
- Bromley, S.M. Smell and Taste Disorders: A Primary Care Approach. Am. Fam. Physician 2000, 61, 427–436. [Google Scholar]
- Özkan, İ.; Taylan, S.; Eroğlu, N.; Kolaç, N. The Relationship between Malnutrition and Subjective Taste Change Experienced by Patients with Cancer Receiving Outpatient Chemotherapy Treatment. Nutr. Cancer 2022, 74, 1670–1679. [Google Scholar] [CrossRef]
- De Melo Silva, F.R.; De Oliveira, M.G.O.A.; Souza, A.S.R.; Figueroa, J.N.; Santos, C.S. Factors Associated with Malnutrition in Hospitalized Cancer Patients: A Croos-Sectional Study. Nutr. J. 2015, 14, 1–8. [Google Scholar] [CrossRef]
- Mueller, C. , Kallert, S. , Renner, B., Stiassny, K., Temmel, A.F., Hummel, T., Kobal, G. Quantitative Assessment of Gustatory Function in a Clinical Context Using Impregnated “Taste Strips.” Rhinology 2003, 41, 2–6. [Google Scholar]
- Sevryugin, O.; Kasvis, P.; Vigano, M.L.; Vigano, A. Taste and Smell Disturbances in Cancer Patients: A Scoping Review of Available Treatments. Support. Care Cancer 2021, 29, 49–66. [Google Scholar] [CrossRef] [PubMed]
- Takei, M.; Okada, N.; Nakamura, S.; Kagawa, K.; Fujii, S.; Miki, H.; Ishizawa, K.; Abe, M.; Sato, Y. A Genome-Wide Association Study Predicts the Onset of Dysgeusia Due to Anti-Cancer Drug Treatment. Biol. Pharm. Bull. 2022, 45, 114–117. [Google Scholar] [CrossRef]
- Cohen, J.; E. Wakefield, C.; G. Laing, D. Smell and Taste Disorders Resulting from Cancer and Chemotherapy. Curr. Pharm. Des. 2016, 22, 2253–2263. [Google Scholar] [CrossRef]
- Uí Dhuibhir, P.; Barrett, M.; O’Donoghue, N.; Gillham, C.; El Beltagi, N.; Walsh, D. Self-Reported and Objective Taste and Smell Evaluation in Treatment-Naive Solid Tumour Patients. Support. Care Cancer 2020, 28, 2389–2396. [Google Scholar] [CrossRef]
- Rozin, P. “Taste-Smell Confusions” and the Duality of the Olfactory Sense. Percept. Psychophys. 1982, 31, 397–401. [Google Scholar] [CrossRef] [PubMed]
- Hummel, T.; Podlesek, D. Clinical Assessment of Olfactory Function. Chem. Senses 2021, 46, 1–12. [Google Scholar] [CrossRef] [PubMed]
- Landis, B.N.; Frasnelli, J.; Reden, J.; Lacroix, J.S.; Hummel, T. Differences between Orthonasal and Retronasal Olfactory Functions in Patients with Loss of the Sense of Smell. Arch. Otolaryngol. Head. Neck Surg. 2005, 131, 977–981. [Google Scholar] [CrossRef]
- Deems, D.A.; Doty, R.L.; Settle, R.G.; Moore-Gillon, V.; Shaman, P.; Mester, A.F.; Kimmelman, C.P.; Brightman, V.J.; Snow, J.B. Smell and Taste Disorders, a Study of 750 Patients from the University of Pennsylvania Smell and Taste Center. Arch. Otolaryngol. Head. Neck Surg. 1991, 117, 519–528. [Google Scholar] [CrossRef] [PubMed]
- Wrobel, B.B.; Leopold, D.A. Clinical Assessment of Patients with Smell and Taste Disorders. Otolaryngol. Clin. North Am. 2004, 37, 1127–1142. [Google Scholar] [CrossRef] [PubMed]
- Sobotka, L. Basics in Clinical Nutrition, Galen, Ed., 4th ed.; 2012. [Google Scholar]
- Pirlich, M.; Schütz, T.; Kemps, M.; Luhman, N.; Minko, N.; Lübke, H.J.; Rossnagel, K.; Willich, S.N.; Lochs, H. Social Risk Factors for Hospital Malnutrition. Nutrition 2005, 21, 295–300. [Google Scholar] [CrossRef]
- Cederholm, T.; Barazzoni, R.; Austin, P.; Ballmer, P.; Biolo, G.; Bischoff, S.C.; Compher, C.; Correia, I.; Higashiguchi, T.; Holst, M.; et al. ESPEN Guidelines on Definitions and Terminology of Clinical Nutrition. Clin. Nutr. 2017, 36, 49–64. [Google Scholar] [CrossRef]
- Muscaritoli, M.; Arends, J.; Bachmann, P.; Baracos, V.; Barthelemy, N.; Bertz, H.; Bozzetti, F.; Hütterer, E.; Isenring, E.; Kaasa, S.; et al. ESPEN Practical Guideline: Clinical Nutrition in Cancer. Clin. Nutr. 2021, 40, 2898–2913. [Google Scholar] [CrossRef]
- Almeida, J.M.G.; García, C.G.; Aguilar, I.M.V.; Castañeda, V.B.; Guerrero, D.B. Morphofunctional Assessment of Patient’s Nutritional Status: A Global Approach. Nutr. Hosp. 2021, 38, 592–600. [Google Scholar] [CrossRef]
- García de Lorenzo, A.; Álvarez Hernández, J.; Planas, M.; Burgos, R.; Araujo, K. ; Spain, multidisciplinary consensus work-team on the approach to hospital malnutrition in Multidisciplinary Consensus on the Approach to Hospital Malnutrition in Spain. Nutr. Hosp. 2011, 26. [Google Scholar] [CrossRef]
- Madden, A.M.; Smith, S. Body Composition and Morphological Assessment of Nutritional Status in Adults: A Review of Anthropometric Variables. J. Hum. Nutr. Diet. 2016, 29, 7–25. [Google Scholar] [CrossRef] [PubMed]
- Mili, N.; Paschou, S.A.; Goulis, D.G.; Dimopoulos, M.A.; Lambrinoudaki, I.; Psaltopoulou, T. Obesity, Metabolic Syndrome, and Cancer: Pathophysiological and Therapeutic Associations. Endocrine 2021, 74, 478–497. [Google Scholar] [CrossRef] [PubMed]
- Ashwell, M.; Gunn, P.; Gibson, S. Waist-to-Height Ratio Is a Better Screening Tool than Waist Circumference and BMI for Adult Cardiometabolic Risk Factors: Systematic Review and Meta-Analysis. Obes. Rev. 2012, 13, 275–286. [Google Scholar] [CrossRef] [PubMed]
- Grundy, S.M.; Brewer, H.B.; Cleeman, J.I.; Smith, S.C.; Lenfant, C. Definition of Metabolic Syndrome: Report of the National Heart, Lung, and Blood Institute/American Heart Association Conference on Scientific Issues Related to Definition. Circulation 2004, 109, 433–438. [Google Scholar] [CrossRef] [PubMed]
- Cederholm, T.; Bosaeus, I.; Barazzoni, R.; Bauer, J.; Van Gossum, A.; Klek, S.; Muscaritoli, M.; Nyulasi, I.; Ockenga, J.; Schneider, S.M.; et al. Diagnostic Criteria for Malnutrition - An ESPEN Consensus Statement. Clin. Nutr. 2015, 34, 335–340. [Google Scholar] [CrossRef] [PubMed]
- Shah, U.A.; Ballinger, T.J.; Bhandari, R.; Dieli-Cornwright, C.M.; Guertin, K.A.; Hibler, E.A.; Kalam, F.; Lohmann, A.E.; Ippolito, J.E. Imaging Modalities for Measuring Body Composition in Patients with Cancer: Opportunities and Challenges. J. Natl. Cancer Inst. Monogr. 2023, 2023, 56–67. [Google Scholar] [CrossRef] [PubMed]
- Rinaldi, S.; Gilliland, J.; O’Connor, C.; Chesworth, B.; Madill, J. Is Phase Angle an Appropriate Indicator of Malnutrition in Different Disease States? A Systematic Review. Clin. Nutr. ESPEN 2019, 29, 1–14. [Google Scholar] [CrossRef]
- Norman, K.; Stobäus, N.; Pirlich, M.; Bosy-Westphal, A. Bioelectrical Phase Angle and Impedance Vector Analysis – Clinical Relevance and Applicability of Impedance Parameters. Clin. Nutr. 2012, 31, 854–861. [Google Scholar] [CrossRef]
- Arab, A.; Karimi, E.; Vingrys, K.; Shirani, F. Is Phase Angle a Valuable Prognostic Tool in Cancer Patients’ Survival? A Systematic Review and Meta-Analysis of Available Literature. Clin. Nutr. 2021, 40, 3182–3190. [Google Scholar] [CrossRef]
- García-García, C.; Vegas-Aguilar, I.M.; Rioja-Vázquez, R.; Cornejo-Pareja, I.; Tinahones, F.J.; García-Almeida, J.M. Rectus Femoris Muscle and Phase Angle as Prognostic Factor for 12-Month Mortality in a Longitudinal Cohort of Patients with Cancer (AnyVida Trial). Nutrients 2023, 15. [Google Scholar] [CrossRef]
- Paiva, S.I.; Borges, L.R.; Halpern-Silveira, D.; Assunção, M.C.F.; Barros, A.J.D.; Gonzalez, M.C. Standardized Phase Angle from Bioelectrical Impedance Analysis as Prognostic Factor for Survival in Patients with Cancer. Support. Care Cancer 2010, 19, 187–192. [Google Scholar] [CrossRef] [PubMed]
- Jiang, N.; Zhang, J.; Cheng, S.; Liang, B. The Role of Standardized Phase Angle in the Assessment of Nutritional Status and Clinical Outcomes in Cancer Patients: A Systematic Review of the Literature. Nutrients 2022, 15. [Google Scholar] [CrossRef] [PubMed]
- Norman, K.; Stobäus, N.; Gonzalez, M.C.; Schulzke, J.D.; Pirlich, M. Hand Grip Strength: Outcome Predictor and Marker of Nutritional Status. Clin. Nutr. 2011, 30, 135–142. [Google Scholar] [CrossRef] [PubMed]
- Budziareck, M.B.; Pureza Duarte, R.R.; Barbosa-Silva, M.C.G. Reference Values and Determinants for Handgrip Strength in Healthy Subjects. Clin. Nutr. 2008, 27, 357–362. [Google Scholar] [CrossRef] [PubMed]
- Cruz-Jentoft, A.J.; Bahat, G.; Bauer, J.; Boirie, Y.; Bruyère, O.; Cederholm, T.; Cooper, C.; Landi, F.; Rolland, Y.; Sayer, A.A.; et al. Sarcopenia: Revised European Consensus on Definition and Diagnosis. Age Ageing 2019, 48, 16–31. [Google Scholar] [CrossRef]
- Gariballa, S.; Alessa, A. Impact of Poor Muscle Strength on Clinical and Service Outcomes of Older People during Both Acute Illness and after Recovery. BMC Geriatr. 2017, 17. [Google Scholar] [CrossRef] [PubMed]
- Sánchez Torralvo, F.J.; Porras, N.; Abuín Fernández, J.; García Torres, F.; Tapia, M.J.; Lima, F.; Soriguer, F.; Gonzalo, M.; Rojo Martínez, G.; Olveira, G. Normative Reference Values for Hand Grip Dynamometry in Spain. Association with Lean Mass. Nutr. Hosp. 2018, 35, 98–103. [Google Scholar] [CrossRef]
- Dodds, R.M.; Syddall, H.E.; Cooper, R.; Benzeval, M.; Deary, I.J.; Dennison, E.M.; Der, G.; Gale, C.R.; Inskip, H.M.; Jagger, C.; et al. Grip Strength across the Life Course: Normative Data from Twelve British Studies. PLoS One 2014, 9. [Google Scholar] [CrossRef]
- García-Almeida, J.M.; García-García, C.; Vegas-Aguilar, I.M.; Ballesteros Pomar, M.D.; Cornejo-Pareja, I.M.; Fernández Medina, B.; de Luis Román, D.A.; Bellido Guerrero, D.; Bretón Lesmes, I.; Tinahones Madueño, F.J. Nutritional Ultrasound®: Conceptualisation, Technical Considerations and Standardisation. Endocrinol. diabetes y Nutr. 2023, 70 Suppl 1, 74–84. [Google Scholar] [CrossRef]
- Berger, J.; Bunout, D.; Barrera, G.; de la Maza, M.P.; Henriquez, S.; Leiva, L.; Hirsch, S. Rectus Femoris (RF) Ultrasound for the Assessment of Muscle Mass in Older People. Arch. Gerontol. Geriatr. 2015, 61, 33–38. [Google Scholar] [CrossRef]
- Podsiadlo, D.; Richardson, S. The Timed “Up & Go”: A Test of Basic Functional Mobility for Frail Elderly Persons. J. Am. Geriatr. Soc. 1991, 39, 142–148. [Google Scholar] [CrossRef] [PubMed]
- Bergland, A.; Jørgensen, L.; Emaus, N.; Strand, B.H. Mobility as a Predictor of All-Cause Mortality in Older Men and Women: 11.8 Year Follow-up in the Tromsø Study. BMC Health Serv. Res. 2017, 17. [Google Scholar] [CrossRef] [PubMed]
- Bischoff, H.A.; Stähelin, H.B.; Monsch, A.U.; Iversen, M.D.; Weyh, A.; von Dechend, M.; Akos, R.; Conzelmann, M.; Dick, W.; Theiler, R. Identifying a Cut-off Point for Normal Mobility: A Comparison of the Timed “up and Go” Test in Community-Dwelling and Institutionalised Elderly Women. Age Ageing 2003, 32, 315–320. [Google Scholar] [CrossRef]
- FD, O. Definition of Standardized Nutritional Assessment and Interventional Pathways in Oncology. Nutrition 1996, 12, S15–S19. [Google Scholar] [CrossRef]
- European Food Safety Authority (EFSA) Dietary Reference Values for Nutrients Summary Report. EFSA Support. Publ. 2017, 14. [CrossRef]
- Serra Majem, L. Objetivos Nutricionales Para La Población Española: Consenso de La Sociedad Española de Nutrición Comunitaria 2011. Rev. española Nutr. comunitaria = Spanish J. community Nutr. 2011, 17, 178–199. [Google Scholar]
- López García, E.; Bretón Lesmes, I.; Díaz Perales, A.; Moreno Arribas, V.; Portillo Baquedano, M.; Rivas Velasco, A.; Fresán Salvo, U.; Tejedor Romero, L.; Ortega Porcel, B.; Lizalde Gil, M.; et al. Informe Del Comité Científico de La Agencia Española de Seguridad Alimentaria y Nutrición (AESAN) Sobre Recomendaciones Dietéticas Sostenibles y Recomendaciones de Actividad Física Para La Población Española. Rev. científica la AESAN 2022, 36, 11–70. [Google Scholar]
- SENC Guía Alimentaria 2016 de La SENC. Nutr. Hosp. 2016, 33, 60.
- Gibney, E.; Elia, M.; Jebb, S.A.; Murgatroyd, P.; Jennings, G. Total Energy Expenditure in Patients with Small-Cell Lung Cancer: Results of a Validated Study Using the Bicarbonate-Urea Method. Metabolism 1997, 46, 1412–1417. [Google Scholar] [CrossRef]
- Moses, A.W.G.; Slater, C.; Preston, T.; Barber, M.D.; Fearon, K.C.H. Reduced Total Energy Expenditure and Physical Activity in Cachectic Patients with Pancreatic Cancer Can Be Modulated by an Energy and Protein Dense Oral Supplement Enriched with N-3 Fatty Acids. Br. J. Cancer 2004, 90, 996–1002. [Google Scholar] [CrossRef]
- Mctiernan, A.; Friedenreich, C.M.; Katzmarzyk, P.T.; Powell, K.E.; Macko, R.; Buchner, D.; Pescatello, L.S.; Bloodgood, B.; Tennant, B.; Vaux-Bjerke, A.; et al. Physical Activity in Cancer Prevention and Survival: A Systematic Review. Med. Sci. Sports Exerc. 2019, 51, 1252–1261. [Google Scholar] [CrossRef] [PubMed]
- Medicine, I. of Dietary Reference Intakes for Energy, Carbohydrate, Fiber, Fat, Fatty Acids, Cholesterol, Protein, and Amino Acids. Diet. Ref. Intakes Energy, Carbohydrate, Fiber, Fat, Fat. Acids, Cholesterol, Protein, Amin. Acids, 2002; 1–1331. [Google Scholar] [CrossRef]
- Booth, M. Assessment of Physical Activity: An International Perspective. Res. Quartely Excercise Sport 2000, 71, s114–120. [Google Scholar] [CrossRef] [PubMed]
- Langius, J.A.E.; Zandbergen, M.C.; Eerenstein, S.E.J.; van Tulder, M.W.; Leemans, C.R.; Kramer, M.H.H.; Weijs, P.J.M. Effect of Nutritional Interventions on Nutritional Status, Quality of Life and Mortality in Patients with Head and Neck Cancer Receiving (Chemo)Radiotherapy: A Systematic Review. Clin. Nutr. 2013, 32, 671–678. [Google Scholar] [CrossRef] [PubMed]
- Husson, O.; de Rooij, B.H.; Kieffer, J.; Oerlemans, S.; Mols, F.; Aaronson, N.K.; van der Graaf, W.T.A.; van de Poll-Franse, L.V. The EORTC QLQ-C30 Summary Score as Prognostic Factor for Survival of Patients with Cancer in the “Real-World”: Results from the Population-Based PROFILES Registry. Oncologist 2020, 25, e722–e732. [Google Scholar] [CrossRef] [PubMed]
- Boltong, A.; Keast, R.; Aranda, S. Experiences and Consequences of Altered Taste, Flavour and Food Hedonics during Chemotherapy Treatment. Support. Care Cancer 2012, 20, 2765–2774. [Google Scholar] [CrossRef] [PubMed]
- National Cancer Institute Common Terminology Criteria for Adverse Events. 2009. Available from: Https://Evs.Nci.Nih.Gov/Ftp1/CTCAE/CTCAE_4.03/Archive/CTCAE_4.0_2009-05-29_QuickReference_8.5x11.Pdf. 2009, 1–78.
- Kobayashi, Y.; Inose, H.; Ushio, S.; Yuasa, M.; Hirai, T.; Yoshii, T.; Okawa, A. Body Mass Index and Modified Glasgow Prognostic Score Are Useful Predictors of Surgical Site Infection After Spinal Instrumentation Surgery: A Consecutive Series. Spine (Phila. Pa. 1976). 2020, 45, E148–E154. [Google Scholar] [CrossRef]
- Beck, F.K.; Rosenthal, T.C. Prealbumin: A Marker for Nutritional Evaluation. Am. Fam. Physician 2002, 65, 1575–1579. [Google Scholar] [PubMed]
- Evans, D.C.; Corkins, M.R.; Malone, A.; Miller, S.; Mogensen, K.M.; Guenter, P.; Jensen, G.L. The Use of Visceral Proteins as Nutrition Markers: An ASPEN Position Paper. Nutr. Clin. Pract. 2021, 36, 22–28. [Google Scholar] [CrossRef]
- Kano, H.; Midorikawa, Y.; Song, P.; Nakayama, H.; Moriguchi, M.; Higaki, T.; Tsuji, S.; Takayama, T. High C-Reactive Protein/Albumin Ratio Associated with Reduced Survival Due to Advanced Stage of Intrahepatic Cholangiocarcinoma. Biosci. Trends 2020, 14, 304–309. [Google Scholar] [CrossRef]
- Li, L.; Dai, L.; Wang, X.; Wang, Y.; Zhou, L.; Chen, M.; Wang, H. Predictive Value of the C-Reactive Protein-to-Prealbumin Ratio in Medical ICU Patients. Biomark. Med. 2017, 11, 329–337. [Google Scholar] [CrossRef]
- Calder, P.C. N-3 Polyunsaturated Fatty Acids, Inflammation, and Inflammatory Diseases. Am. J. Clin. Nutr. 2006, 83. [Google Scholar] [CrossRef] [PubMed]
- Dewey, A.; Baughan, C.; Dean, T.; Higgins, B.; Johnson, I. Eicosapentaenoic Acid (EPA, an Omega-3 Fatty Acid from Fish Oils) for the Treatment of Cancer Cachexia. Cochrane database Syst. Rev. 2007, 2007. [Google Scholar] [CrossRef]
- Ishihara, T.; Yoshida, M.; Arita, M. Omega-3 Fatty Acid-Derived Mediators That Control Inflammation and Tissue Homeostasis. Int. Immunol. 2019, 31, 559–567. [Google Scholar] [CrossRef] [PubMed]
- Murphy, R.A.; Devarshi, P.P.; Ekimura, S.; Marshall, K.; Mitmesser, S.H. Long-Chain Omega-3 Fatty Acid Serum Concentrations across Life Stages in the USA: An Analysis of NHANES 2011-2012. BMJ Open 2021, 11. [Google Scholar] [CrossRef] [PubMed]
- Chen, Q.; Wang, J.; Wang, J.; Lin, J.; Chen, L.; Lin, L. song; Pan, L. zhen; Shi, B.; Qiu, Y.; Zheng, X. yan; et al. Erythrocyte ω-3 Polyunsaturated Fatty Acids Are Inversely Associated with the Risk of Oral Cancer: A Case-Control Study. Nutr. Diabetes 2020, 10. [Google Scholar] [CrossRef] [PubMed]
- Farrell, S.W.; DeFina, L.F.; Tintle, N.L.; Leonard, D.; Cooper, K.H.; Barlow, C.E.; Haskell, W.L.; Pavlovic, A.; Harris, W.S. Association of the Omega-3 Index with Incident Prostate Cancer with Updated Meta-Analysis: The Cooper Center Longitudinal Study. Nutrients 2021, 13, 1–8. [Google Scholar] [CrossRef] [PubMed]
- Westheim, A.J.F.; Stoffels, L.M.; Dubois, L.J.; van Bergenhenegouwen, J.; van Helvoort, A.; Langen, R.C.J.; Shiri-Sverdlov, R.; Theys, J. The Modulatory Effects of Fatty Acids on Cancer Progression. Biomedicines 2023, 11. [Google Scholar] [CrossRef]
- Argilés, J.M.; López-Soriano, F.J.; Stemmler, B.; Busquets, S. Cancer-Associated Cachexia - Understanding the Tumour Macroenvironment and Microenvironment to Improve Management. Nat. Rev. Clin. Oncol. 2023, 20. [Google Scholar] [CrossRef]
- Argilés, J.M.; Busquets, S.; Stemmler, B.; López-Soriano, F.J. Cancer Cachexia: Understanding the Molecular Basis. Nat. Rev. Cancer 2014, 14, 754–762. [Google Scholar] [CrossRef]
- Mendes, M.C.S.; Pimentel, G.D.; Costa, F.O.; Carvalheira, J.B.C. Molecular and Neuroendocrine Mechanisms of Cancer Cachexia. J. Endocrinol. 2015, 226, R29–R43. [Google Scholar] [CrossRef]
- Tisdale, M.J. Are Tumoral Factors Responsible for Host Tissue Wasting in Cancer Cachexia? Future Oncol. 2010, 6, 503–513. [Google Scholar] [CrossRef] [PubMed]
- Klein, G.L.; Petschow, B.W.; Shaw, A.L.; Weaver, E. Gut Barrier Dysfunction and Microbial Translocation in Cancer Cachexia: A New Therapeutic Target. Curr. Opin. Support. Palliat. Care 2013, 7, 361–367. [Google Scholar] [CrossRef] [PubMed]
- Pizzino, G.; Irrera, N.; Cucinotta, M.; Pallio, G.; Mannino, F.; Arcoraci, V.; Squadrito, F.; Altavilla, D.; Bitto, A. Oxidative Stress: Harms and Benefits for Human Health. Oxid. Med. Cell. Longev. 2017, 2017. [Google Scholar] [CrossRef] [PubMed]
- Sullivan, L.B.; Chandel, N.S. Mitochondrial Reactive Oxygen Species and Cancer. Cancer Metab. 2014, 2, 99–116. [Google Scholar] [CrossRef]
- Tafani, M.; Sansone, L.; Limana, F.; Arcangeli, T.; De Santis, E.; Polese, M.; Fini, M.; Russo, M.A. The Interplay of Reactive Oxygen Species, Hypoxia, Inflammation, and Sirtuins in Cancer Initiation and Progression. Oxid. Med. Cell. Longev. 2016, 2016. [Google Scholar] [CrossRef] [PubMed]
- Schumacker, P.T. Reactive Oxygen Species in Cancer: A Dance with the Devil. Cancer Cell 2015, 27, 156–157. [Google Scholar] [CrossRef]
- Shagieva, G.; Domnina, L.; Makarevich, O.; Chernyak, B.; Skulachev, V.; Dugina, V. Depletion of Mitochondrial Reactive Oxygen Species Downregulates Epithelial-to-Mesenchymal Transition in Cervical Cancer Cells. Oncotarget 2017, 8, 4901–4913. [Google Scholar] [CrossRef]
- Brooks, S.A.; Lomax-Browne, H.J.; Carter, T.M.; Kinch, C.E.; Hall, D.M.S. Molecular Interactions in Cancer Cell Metastasis. Acta Histochem. 2010, 112, 3–25. [Google Scholar] [CrossRef]
- Karwowski, B.T. FapydG in the Shadow of OXOdG-A Theoretical Study of Clustered DNA Lesions. Int. J. Mol. Sci. 2023, 24, 5361. [Google Scholar] [CrossRef]
- Franco, R.; Schoneveld, O.; Georgakilas, A.G.; Panayiotidis, M.I. Oxidative Stress, DNA Methylation and Carcinogenesis. Cancer Lett. 2008, 266, 6–11. [Google Scholar] [CrossRef]
- Srinivas, U.S.; Tan, B.W.Q.; Vellayappan, B.A.; Jeyasekharan, A.D. ROS and the DNA Damage Response in Cancer. Redox Biol. 2019, 25. [Google Scholar] [CrossRef] [PubMed]
- Pisoschi, A.M.; Pop, A. The Role of Antioxidants in the Chemistry of Oxidative Stress: A Review. Eur. J. Med. Chem. 2015, 97, 55–74. [Google Scholar] [CrossRef] [PubMed]
- Kanzaki, H.; Wada, S.; Narimiya, T.; Yamaguchi, Y.; Katsumata, Y.; Itohiya, K.; Fukaya, S.; Miyamoto, Y.; Nakamura, Y. Pathways That Regulate ROS Scavenging Enzymes, and Their Role in Defense Against Tissue Destruction in Periodontitis. Front. Physiol. 2017, 8. [Google Scholar] [CrossRef] [PubMed]
- Burton, G.J.; Jauniaux, E. Oxidative Stress. Best Pract. Res. Clin. Obstet. Gynaecol. 2011, 25, 287–299. [Google Scholar] [CrossRef] [PubMed]
- Birben, E.; Sahiner, U.M.; Sackesen, C.; Erzurum, S.; Kalayci, O. Oxidative Stress and Antioxidant Defense. World Allergy Organ. J. 2012, 5, 9–19. [Google Scholar] [CrossRef] [PubMed]
- Vissers, M.C.M.; Das, A.B. Potential Mechanisms of Action for Vitamin C in Cancer: Reviewing the Evidence. Front. Physiol. 2018, 9. [Google Scholar] [CrossRef]
- Jiang, Q. Natural Forms of Vitamin E as Effective Agents for Cancer Prevention and Therapy. Adv. Nutr. 2017, 8, 850–867. [Google Scholar] [CrossRef] [PubMed]
- Zalewska-Ziob, M.; Adamek, B.; Kasperczyk, J.; Romuk, E.; Hudziec, E.; Chwalińska, E.; Dobija-Kubica, K.; Rogoziński, P.; Bruliński, K. Activity of Antioxidant Enzymes in the Tumor and Adjacent Noncancerous Tissues of Non-Small-Cell Lung Cancer. Oxid. Med. Cell. Longev. 2019, 2019. [Google Scholar] [CrossRef]
- Schmidt, D.R.; Patel, R.; Kirsch, D.G.; Lewis, C.A.; Vander Heiden, M.G.; Locasale, J.W. Metabolomics in Cancer Research and Emerging Applications in Clinical Oncology. CA. Cancer J. Clin. 2021, 71, 333–358. [Google Scholar] [CrossRef]
- Cui, P.; Li, X.; Huang, C.; Li, Q.; Lin, D. Metabolomics and Its Applications in Cancer Cachexia. Front. Mol. Biosci. 2022, 9. [Google Scholar] [CrossRef]
- Boguszewicz; Bieleń, A. ; Mrochem-Kwarciak, J.; Skorupa, A.; Ciszek, M.; Heyda, A.; Wygoda, A.; Kotylak, A.; Składowski, K.; Sokół, M. NMR-Based Metabolomics in Real-Time Monitoring of Treatment Induced Toxicity and Cachexia in Head and Neck Cancer: A Method for Early Detection of High Risk Patients. Metabolomics 2019, 15. [Google Scholar] [CrossRef]
- Yang, Q.J.; Zhao, J.R.; Hao, J.; Li, B.; Huo, Y.; Han, Y.L.; Wan, L.L.; Li, J.; Huang, J.; Lu, J.; et al. Serum and Urine Metabolomics Study Reveals a Distinct Diagnostic Model for Cancer Cachexia. J. Cachexia. Sarcopenia Muscle 2018, 9, 71–85. [Google Scholar] [CrossRef] [PubMed]
- Adami, G.R. The Oral Microbiome.Methods and Protocols; Adami, G.R., Ed.; Methods in Molecular Biology; Springer US: New York, NY, 2021; Vol. 2327; ISBN 978-1-0716-1517-1. [Google Scholar]
- Schwartz, J.L.; Peña, N.; Kawar, N.; Zhang, A.; Callahan, N.; Robles, S.J.; Griebel, A.; Adami, G.R. Old Age and Other Factors Associated with Salivary Microbiome Variation. BMC Oral Health 2021, 21. [Google Scholar] [CrossRef] [PubMed]
- Jabaz, M.F.; Yassir, A.D.; Jebur, A.N. Biochemical Changes of Saliva in Patients with Radiotherapy in Comparison to Healthy Subjects. Res. J. Pharm. Technol. 2023, 16, 184–186. [Google Scholar] [CrossRef]
- Gaetti-Jardim, E.; Jardim, E.C.G.; Schweitzer, C.M.; da Silva, J.C.L.; Oliveira, M.M.; Masocatto, D.C.; dos Santos, C.M. Supragingival and Subgingival Microbiota from Patients with Poor Oral Hygiene Submitted to Radiotherapy for Head and Neck Cancer Treatment. Arch. Oral Biol. 2018, 90, 45–52. [Google Scholar] [CrossRef]
- Vivarelli, S.; Salemi, R.; Candido, S.; Falzone, L.; Santagati, M.; Stefani, S.; Torino, F.; Banna, G.L.; Tonini, G.; Libra, M. Gut Microbiota and Cancer: From Pathogenesis to Therapy. Cancers (Basel). 2019, 11. [Google Scholar] [CrossRef] [PubMed]
- Du, Y.; Feng, R.; Chang, E.T.; Debelius, J.W.; Yin, L.; Xu, M.; Huang, T.; Zhou, X.; Xiao, X.; Li, Y.; et al. Influence of Pre-Treatment Saliva Microbial Diversity and Composition on Nasopharyngeal Carcinoma Prognosis. Front. Cell. Infect. Microbiol. 2022, 12. [Google Scholar] [CrossRef]
- Yang, S.F.; Huang, H. Da; Fan, W.L.; Jong, Y.J.; Chen, M.K.; Huang, C.N.; Chuang, C.Y.; Kuo, Y.L.; Chung, W.H.; Su, S.C. Compositional and Functional Variations of Oral Microbiota Associated with the Mutational Changes in Oral Cancer. Oral Oncol. 2018, 77, 1–8. [Google Scholar] [CrossRef]
- Kartal, E.; Schmidt, T.S.B.; Molina-Montes, E.; Rodríguez-Perales, S.; Wirbel, J.; Maistrenko, O.M.; Akanni, W.A.; Alashkar Alhamwe, B.; Alves, R.J.; Carrato, A.; et al. A Faecal Microbiota Signature with High Specificity for Pancreatic Cancer. Gut 2022, 71. [Google Scholar] [CrossRef]
- Álvarez-Mercado, A.I.; del Valle Cano, A.; Fernández, M.F.; Fontana, L. Gut Microbiota and Breast Cancer: The Dual Role of Microbes. Cancers (Basel). 2023, 15. [Google Scholar] [CrossRef]
- Li, Z.; Ke, X.; Zuo, D.; Wang, Z.; Fang, F.; Li, B. New Insights into the Relationship between Gut Microbiota and Radiotherapy for Cancer. Nutrients 2022, 15. [Google Scholar] [CrossRef] [PubMed]
- Laborda-Illanes, A.; Sánchez-Alcoholado, L.; Boutriq, S.; Plaza-Andrades, I.; Peralta-Linero, J.; Alba, E.; González-González, A.; Queipo-Ortuño, M.I. A New Paradigm in the Relationship between Melatonin and Breast Cancer: Gut Microbiota Identified as a Potential Regulatory Agent. Cancers (Basel). 2021, 13. [Google Scholar] [CrossRef] [PubMed]
- Marchal, J.A.; Galisteo, F.; Rueda, F. Cocina Con Ciencia Contra El Cáncer; Editorial Almuzara, S.L., 2018; ISBN 978-84-17558-57-4.
- Lin, J.Y.; Lu, Y. Establishing a Data Monitoring Committee for Clinical Trials. Shanghai Arch. psychiatry 2014, 26, 54–55. [Google Scholar] [CrossRef] [PubMed]
- Arbeitsgemeinschaft OuG, S. AWMF: Aktuelle Leitlinien; 1996. [Google Scholar]
- Landis, B.N.; Welge-Luessen, A.; Brämerson, A.; Bende, M.; Mueller, C.A.; Nordin, S.; Hummel, T. “Taste Strips” - a Rapid, Lateralized, Gustatory Bedside Identification Test Based on Impregnated Filter Papers. J. Neurol. 2009, 256, 242–248. [Google Scholar] [CrossRef] [PubMed]
- Oleszkiewicz, A.; Schriever, V.A.; Croy, I.; Hähner, A.; Hummel, T. Updated Sniffin’ Sticks Normative Data Based on an Extended Sample of 9139 Subjects. Eur. Arch. Otorhinolaryngol. 2019, 276, 719–728. [Google Scholar] [CrossRef] [PubMed]
- WHO/FAO/UNICEF Methodology of Nutritional Surveillance. Report of a Joint FAO/UNICEF/WHO Expert Committee.; World Health Organ Tech Rep Ser. 593, 1976; ISBN 9241205938.
- Norton, K.; Whittingham, N.; Carter, L.; Kerr, C.; Goere, C.; Marfell-Jones, M. Measurement Techniques in Anthropometry; Editorial: Sydney, 1966. [Google Scholar]
- International Society for the Advancement of Kinathropometry (ISAK) International Standard for Anthropometric Assessment; International Society for the Advancement of Kinathropometry (ISAK): New Zealand, 2001.
- Lukaski, H.C. Methods for the Assessment of Human Body Composition: Traditional and New. Am. J. Clin. Nutr. 1987, 46, 537–556. [Google Scholar] [CrossRef]
- Mathiowetz, V.; Weber, K.; Volland, G.; Kashman, N. Reliability and Validity of Hand Strength Evaluations. J. Hand Surg. Am. 1984, 9, 222–226. [Google Scholar] [CrossRef]
- Mathiowetz, V.; Kashman, N.; Volland, G.; Weber, K.; Dowe, M.; Togers, S. Grip and Pinch Strength: Normative Data for Adults. Arch. Phys. Med. Rehabil. 1985, 66, 69–74. [Google Scholar]
- Buckinx, F.; Landi, F.; Cesari, M.; Fielding, R.A.; Visser, M.; Engelke, K.; Maggi, S.; Dennison, E.; Al-Daghri, N.M.; Allepaerts, S.; et al. Pitfalls in the Measurement of Muscle Mass: A Need for a Reference Standard. J. Cachexia. Sarcopenia Muscle 2018, 9, 269–278. [Google Scholar] [CrossRef]
- Hamagawa, K.; Matsumura, Y.; Kubo, T.; Hayato, K.; Okawa, M.; Tanioka, K.; Yamasaki, N.; Kitaoka, H.; Yabe, T.; Nishinaga, M.; et al. Abdominal Visceral Fat Thickness Measured by Ultrasonography Predicts the Presence and Severity of Coronary Artery Disease. Ultrasound Med. Biol. 2010, 36, 1769–1775. [Google Scholar] [CrossRef]
- McGettigan, N.; Dhuibhir, P.U.; Barrett, M.; Sui, J.; Balding, L.; Higgins, S.; O’Leary, N.; Kennedy, A.; Walsh, D. Subjective and Objective Assessment of Taste and Smell Sensation in Advanced Cancer. Am. J. Hosp. Palliat. Care 2019, 36, 688–696. [Google Scholar] [CrossRef] [PubMed]
- Imai, H.; Soeda, H.; Komine, K.; Otsuka, K.; Shibata, H. Preliminary Estimation of the Prevalence of Chemotherapy-Induced Dysgeusia in Japanese Patients with Cancer. BMC Palliat. Care 2013, 12. [Google Scholar] [CrossRef] [PubMed]
- Bernhardson, B.M.; Olson, K.; Baracos, V.E.; Wismer, W.V. Reframing Eating during Chemotherapy in Cancer Patients with Chemosensory Alterations. Eur. J. Oncol. Nurs. 2012, 16, 483–490. [Google Scholar] [CrossRef] [PubMed]
- Ortega, R.M.; Perez-Rodrigo, C.; Lopez-Sobaler, A.M. Dietary Assessment Methods: Dietary Records. Nutr. Hosp. 2015, 31 Suppl 3, 38–45. [Google Scholar] [CrossRef]
- Ruíz, M.; Martínez, E.; Gil, A. Fotográfica de Porciones de Alimentos Consumidos En España; Fundación; España: Granada, 2019; ISBN 978-84-09-08860-7. [Google Scholar]
- Martin-moreno, J.M.; Boyle, P.; Gorgojo, L.; Maisonneuve, P.; Fernandez-rodriguez, J.C.; Salvini, S.; Willett, W.C. Development and Validation of a Food Frequency Questionnaire in Spain. Int. J. Epidemiol. 1993, 22, 512–519. [Google Scholar] [CrossRef] [PubMed]
- Arraras, J.I.; Arias, F.; Tejedor, M.; Pruja, E.; Marcos, M.; Martínez, E.; Valerdi, J. The EORTC QLQ-C30 (Version 3.0) Quality of Life Questionnaire: Validation Study for Spain with Head and Neck Cancer Patients. Psychooncology. 2002, 11, 249–256. [Google Scholar] [CrossRef] [PubMed]
- Whelton, P.K.; Carey, R.M.; Aronow, W.S.; Casey, D.E.; Collins, K.J.; Himmelfarb, C.D.; DePalma, S.M.; Gidding, S.; Jamerson, K.A.; Jones, D.W.; et al. 2017 ACC/AHA/AAPA/ABC/ACPM/AGS/APhA/ASH/ASPC/NMA/PCNA Guideline for the Prevention, Detection, Evaluation, and Management of High Blood Pressure in Adults: A Report of the American College of Cardiology/American Heart Association Task Force on Clinical Practice Guidelines. Hypertens. (Dallas, Tex. 1979) 2018, 71, E13–E115. [Google Scholar] [CrossRef]
- Lepage, G.; Roy, C.C. Specific Methylation of Plasma Nonesterified Fatty Acids in a One-Step Reaction. J Lipid Res 1988, 29, 227–235. [Google Scholar] [CrossRef]
- de la Torre-Aguilar, M.J.; Gomez-Fernandez, A.; Flores-Rojas, K.; Martin-Borreguero, P.; Mesa, M.D.; Perez-Navero, J.L.; Olivares, M.; Gil, A.; Gil-Campos, M. Docosahexaenoic and Eicosapentaenoic Intervention Modifies Plasma and Erythrocyte Omega-3 Fatty Acid Profiles But Not the Clinical Course of Children With Autism Spectrum Disorder: A Randomized Control Trial. Front. Nutr. 2022, 9. [Google Scholar] [CrossRef]
- Miles, E.A.; Noakes, P.S.; Kremmyda, L.S.; Vlachava, M.; Diaper, N.D.; Rosenlund, G.; Urwin, H.; Yaqoob, P.; Rossary, A.; Farges, M.C.; et al. The Salmon in Pregnancy Study: Study Design, Subject Characteristics, Maternal Fish and Marine n-3 Fatty Acid Intake, and Marine n-3 Fatty Acid Status in Maternal and Umbilical Cord Blood. Am. J. Clin. Nutr. 2011, 94. [Google Scholar] [CrossRef]
- García-Rodríguez, C.E.; Mesa, M.D.; Olza, J.; Vlachava, M.; Kremmyda, L.S.; Diaper, N.D.; Noakes, P.S.; Miles, E.A.; Ramírez-Tortosa, M.C.; Liaset, B.; et al. Does Consumption of Two Portions of Salmon per Week Enhance the Antioxidant Defense System in Pregnant Women? Antioxid. Redox Signal. 2012, 16, 1401–1406. [Google Scholar] [CrossRef] [PubMed]
- García-Rodríguez, C.E.; Helmersson-Karlqvist, J.; Dolores Mesa, M.; Miles, E.A.; Noakes, P.S.; Vlachava, M.; Kremmyda, L.S.; Diaper, N.D.; Godfrey, K.M.; Calder, P.C.; et al. Does Increased Intake of Salmon Increase Markers of Oxidative Stress in Pregnant Women? The Salmon in Pregnancy Study. Antioxid. Redox Signal. 2011, 15, 2819–2823. [Google Scholar] [CrossRef] [PubMed]
- Garcia-Rodriguez, C.E.; Olza, J.; Mesa, M.D.; Aguilera, C.M.; Miles, E.A.; Noakes, P.S.; Vlachava, M.; Kremmyda, L.S.; Diaper, N.D.; Godfrey, K.M.; et al. Fatty Acid Status and Antioxidant Defense System in Mothers and Their Newborns after Salmon Intake during Late Pregnancy. Nutrition 2017, 33, 157–162. [Google Scholar] [CrossRef] [PubMed]
- Re, R.; Pellegrini, N.; Proteggente, A.; Pannala, A.; Yang, M.; Rice-Evans, C. Antioxidant Activity Applying an Improved ABTS Radical Cation Decolorization Assay. Free Radic. Biol. Med. 1999, 26, 1231–1237. [Google Scholar] [CrossRef] [PubMed]
- Carlberg, I.; Mannervik, B. Glutathione Reductase. Methods Enzymol. 1985, 113, 484–490. [Google Scholar] [CrossRef]
- Flohé, L.; Günzler, W.A. Assays of Glutathione Peroxidase. Methods Enzymol. 1984, 105, 114–120. [Google Scholar] [CrossRef] [PubMed]
- Battino, M.; Leone, L.; Bompadre, S. High-Performance Liquid Chromatography-EC Assay of Mitochondrial Coenzyme Q9, Coenzyme Q9H2, Coenzyme Q10, Coenzyme Q10H2, and Vitamin E with a Simplified On-Line Solid-Phase Extraction. Methods Enzymol. 2004, 378, 156–162. [Google Scholar] [CrossRef]
- Ordóñez-Díaz, M.D.; Gil-Campos, M.; Flores-Rojas, K.; Muñoz-Villanueva, M.C.; Mesa, M.D.; de la Torre-Aguilar, M.J.; Gil, Á.; Pérez-Navero, J.L. Impaired Antioxidant Defence Status Is Associated With Metabolic-Inflammatory Risk Factors in Preterm Children With Extrauterine Growth Restriction: The BIORICA Cohort Study. Front. Nutr. 2021, 8. [Google Scholar] [CrossRef]
- Rangel-Huerta, O.D.; Pastor-Villaescusa, B.; Gil, A. Are We Close to Defining a Metabolomic Signature of Human Obesity? A Systematic Review of Metabolomics Studies. Metabolomics 2019, 15. [Google Scholar] [CrossRef]
- Rangel-Huerta, O.D.; Gil, A. Nutrimetabolomics: An Update on Analytical Approaches to Investigate the Role of Plant-Based Foods and Their Bioactive Compounds in Non-Communicable Chronic Diseases. Int. J. Mol. Sci. 2016, 17. [Google Scholar] [CrossRef]
- Rangel-Huerta, O.D.; Gomez-Fernández, A.; de la Torre-Aguilar, M.J.; Gil, A.; Perez-Navero, J.L.; Flores-Rojas, K.; Martín-Borreguero, P.; Gil-Campos, M. Metabolic Profiling in Children with Autism Spectrum Disorder with and without Mental Regression: Preliminary Results from a Cross-Sectional Case-Control Study. Metabolomics 2019, 15. [Google Scholar] [CrossRef] [PubMed]
- Vandeputte, D.; Kathagen, G.; D’Hoe, K.; Vieira-Silva, S.; Valles-Colomer, M.; Sabino, J.; Wang, J.; Tito, R.Y.; De Commer, L.; Darzi, Y.; et al. Quantitative Microbiome Profiling Links Gut Community Variation to Microbial Load. Nature 2017, 551, 507–511. [Google Scholar] [CrossRef] [PubMed]
- Prest, E.I.; Hammes, F.; Kötzsch, S.; van Loosdrecht, M.C.M.; Vrouwenvelder, J.S. Monitoring Microbiological Changes in Drinking Water Systems Using a Fast and Reproducible Flow Cytometric Method. Water Res. 2013, 47, 7131–7142. [Google Scholar] [CrossRef] [PubMed]
- Nygaard, A.B.; Tunsjø, H.S.; Meisal, R.; Charnock, C. A Preliminary Study on the Potential of Nanopore MinION and Illumina MiSeq 16S RRNA Gene Sequencing to Characterize Building-Dust Microbiomes. Sci. Rep. 2020, 10, 3209. [Google Scholar] [CrossRef]
- Matsuo, Y.; Komiya, S.; Yasumizu, Y.; Yasuoka, Y.; Mizushima, K.; Takagi, T.; Kryukov, K.; Fukuda, A.; Morimoto, Y.; Naito, Y.; et al. Full-Length 16S RRNA Gene Amplicon Analysis of Human Gut Microbiota Using MinIONTM Nanopore Sequencing Confers Species-Level Resolution. BMC Microbiol. 2021, 21. [Google Scholar] [CrossRef]
- de Siqueira, G.M.V.; Pereira-dos-Santos, F.M.; Silva-Rocha, R.; Guazzaroni, M.E. Nanopore Sequencing Provides Rapid and Reliable Insight Into Microbial Profiles of Intensive Care Units. Front. public Heal. 2021, 9. [Google Scholar] [CrossRef]
- Bokulich, N.A.; Kaehler, B.D.; Rideout, J.R.; Dillon, M.; Bolyen, E.; Knight, R.; Huttley, G.A.; Gregory Caporaso, J. Optimizing Taxonomic Classification of Marker-Gene Amplicon Sequences with QIIME 2′s Q2-Feature-Classifier Plugin. Microbiome 2018, 6. [Google Scholar] [CrossRef]
- Quast, C.; Pruesse, E.; Yilmaz, P.; Gerken, J.; Schweer, T.; Yarza, P.; Peplies, J.; Glöckner, F.O. The SILVA Ribosomal RNA Gene Database Project: Improved Data Processing and Web-Based Tools. Nucleic Acids Res. 2013, 41. [Google Scholar] [CrossRef]
- Douglas, G.M.; Maffei, V.J.; Zaneveld, J.R.; Yurgel, S.N.; Brown, J.R.; Taylor, C.M.; Huttenhower, C.; Langille, M.G.I. PICRUSt2 for Prediction of Metagenome Functions. Nat. Biotechnol. 2020, 38, 685–688. [Google Scholar] [CrossRef]
- Plaza-Díaz, J.; Manzano, M.; Ruiz-Ojeda, F.J.; Giron, M.D.; Salto, R.; López-Pedrosa, J.M.; Santos-Fandila, A.; Garcia-Corcoles, M.T.; Rueda, R.; Gil, Á. Intake of Slow-Digesting Carbohydrates Is Related to Changes in the Microbiome and Its Functional Pathways in Growing Rats with Obesity Induced by Diet. Front. Nutr. 2022, 9. [Google Scholar] [CrossRef]
- Brouwer, J.N.; Glaser, D.; af Segerstad, C.H.; Hellekant, G.; Ninomiya, Y.; van der Wel, H. The Sweetness-Inducing Effect of Miraculin; Behavioural and Neurophysiological Experiments in the Rhesus Monkey Macaca Mulatta. J. Physiol. 1983, 337, 221–240. [Google Scholar] [CrossRef] [PubMed]
- Comeau, T.B.; Epstein, J.B.; Migas, C. Taste and Smell Dysfunction in Patients Receiving Chemotherapy: A Review of Current Knowledge. Support. Care Cancer 2001, 9, 575–580. [Google Scholar] [CrossRef] [PubMed]
- Benoist, S.; Brouquet, A. Nutritional Assessment and Screening for Malnutrition. J. Visc. Surg. 2015, 152 Suppl 1, S3–S7. [Google Scholar] [CrossRef]
- Pavlidis, P.; Schittek, G.A.; Saratziotis, A.; Ferfeli, M.; Kekes, G.; Gouveris, H. Electrogustometry: Normative Data for Stimulus Duration, Tongue Site and Age Decline. Clin. Otolaryngol. 2021, 46, 767–774. [Google Scholar] [CrossRef]
- Obiefuna, S.; Donohoe, C. Neuroanatomy, Nucleus Gustatory. StatPearls 2023. [Google Scholar]
- Buttiron Webber, T.; Briata, I.M.; DeCensi, A.; Cevasco, I.; Paleari, L. Taste and Smell Disorders in Cancer Treatment: Results from an Integrative Rapid Systematic Review. Int. J. Mol. Sci. 2023, 24. [Google Scholar] [CrossRef] [PubMed]
- Hiroyuki Otani; Amano, K. ; Morita, T.; Miura, T.; Mori, N.; Tatara, R.; Kessoku, T.; Matsuda, Y.; Tagami, K.; Mori, M.; et al. Impact of Taste/Smell Disturbances on Dietary Intakes and Cachexia-Related Quality of Life in Patients with Advanced Cancer. Support. Care Cancer 2023, 31. [Google Scholar] [CrossRef]
- Turcott, J.G.; Juárez-Hernández, E.; De La Torre-Vallejo, M.; Sánchez-Lara, K.; Luvian-Morales, J.; Arrieta, O. Value: Changes in the Detection and Recognition Thresholds of Three Basic Tastes in Lung Cancer Patients Receiving Cisplatin and Paclitaxel and Its Association with Nutritional and Quality of Life Parameters. Nutr. Cancer 2016, 68, 241–249. [Google Scholar] [CrossRef]
- Inglett, G.E.; Chen, D. Contents of Phenolics and Flavonoids and Antioxidant Activities in Skin, Pulp, and Seeds of Miracle Fruit. J. Food Sci. 2011, 76, C479–C482. [Google Scholar] [CrossRef]
- Swamy, K.B.; Hadi, S.A. b.; Sekaran, M.; Pichika, M.R. a. The Clinical Effects of Synsepalum Dulcificum: A Review. J. Med. Food 2014, 17, 1165–1169. [Google Scholar] [CrossRef]
Figure 1.
Clinical trial outline.
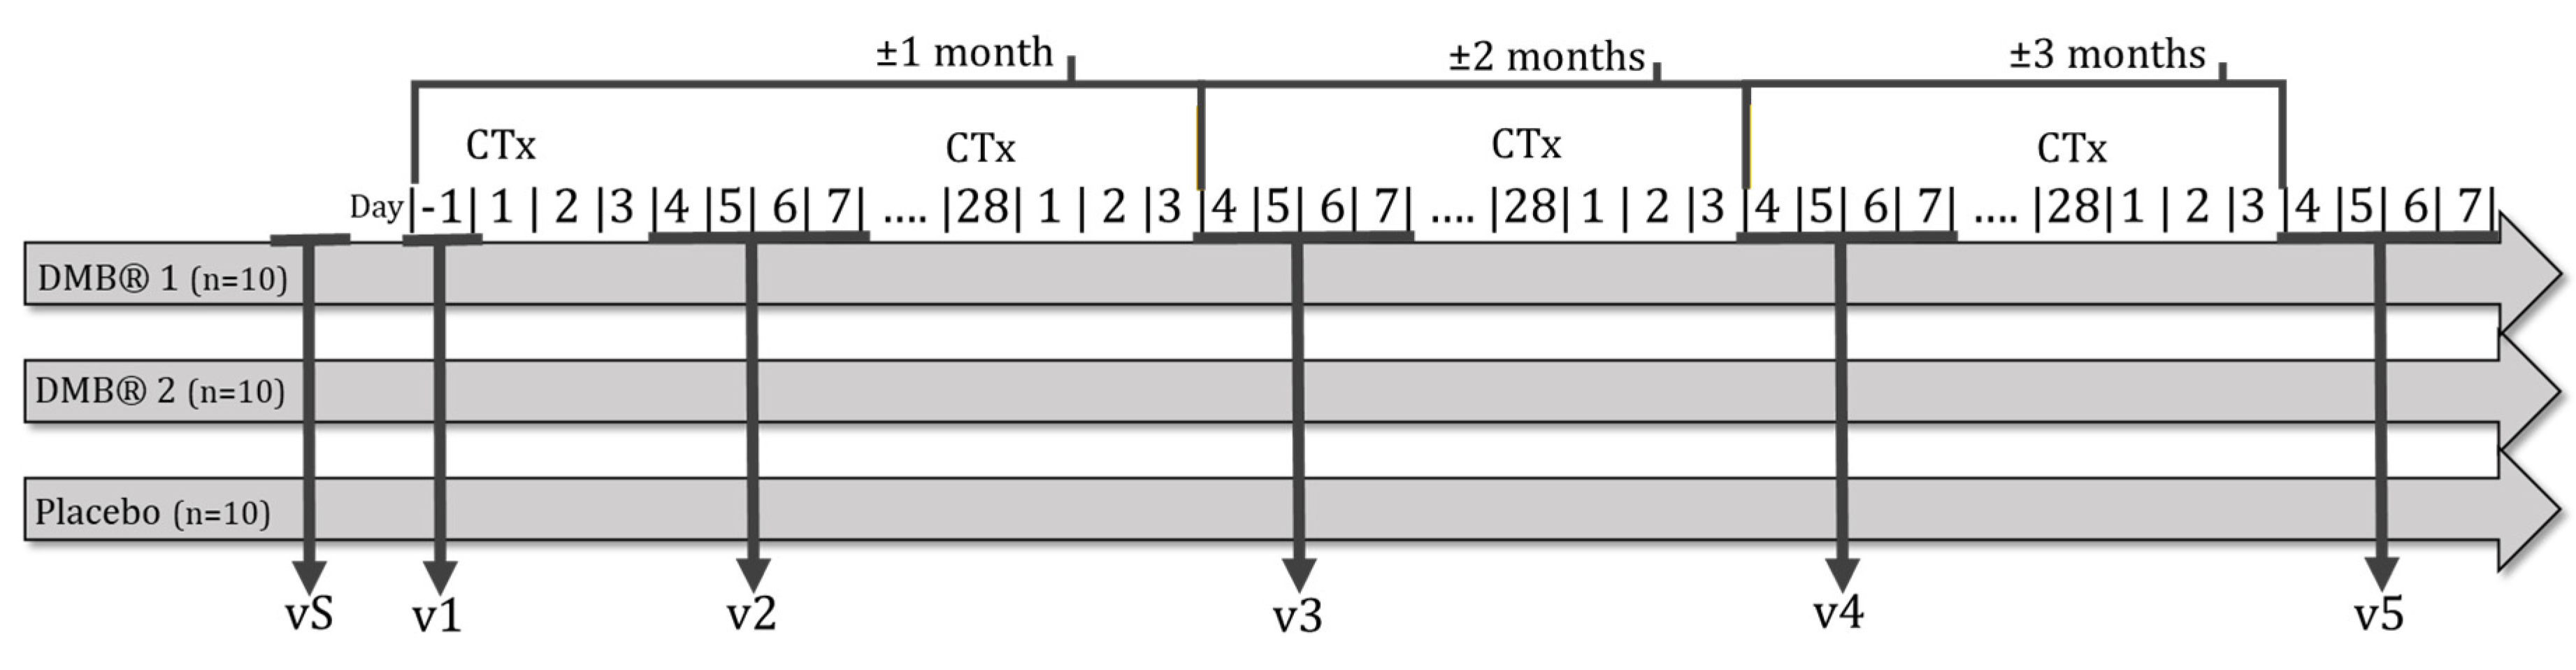
Figure 2.
Clinical trial schedule.
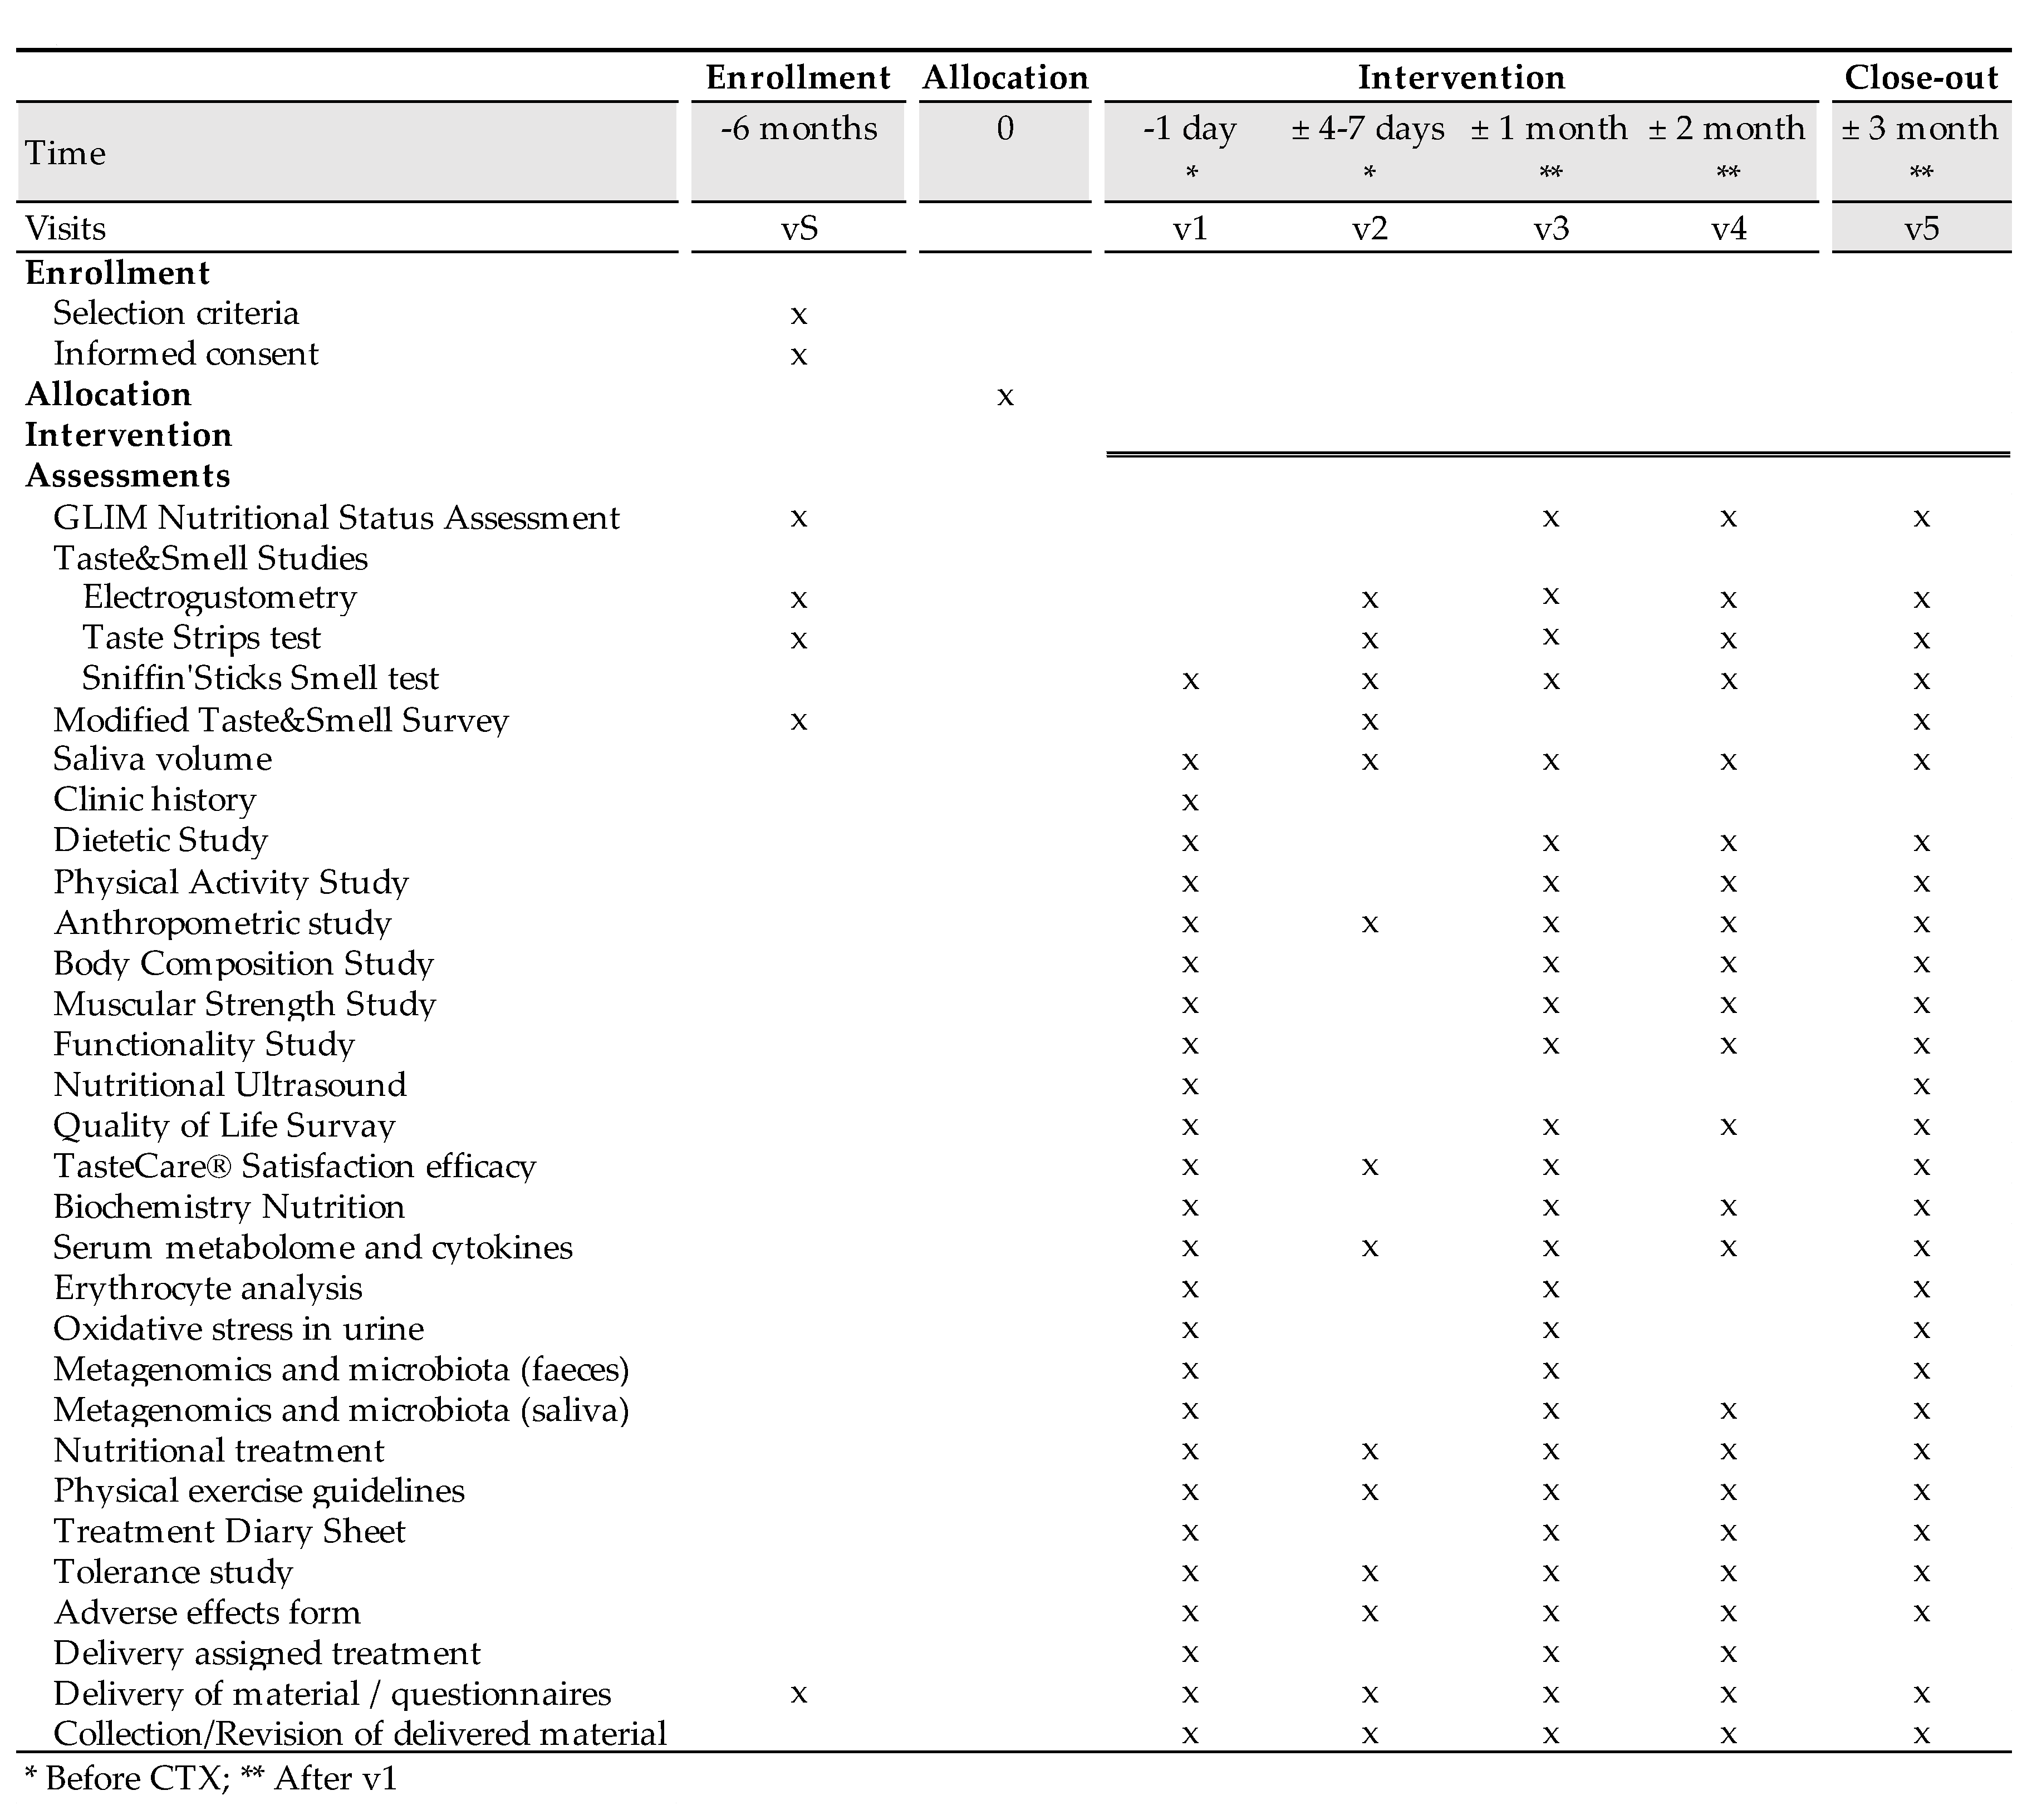
Figure 3.
The appearance of the miraculin-based food supplement and placebo.
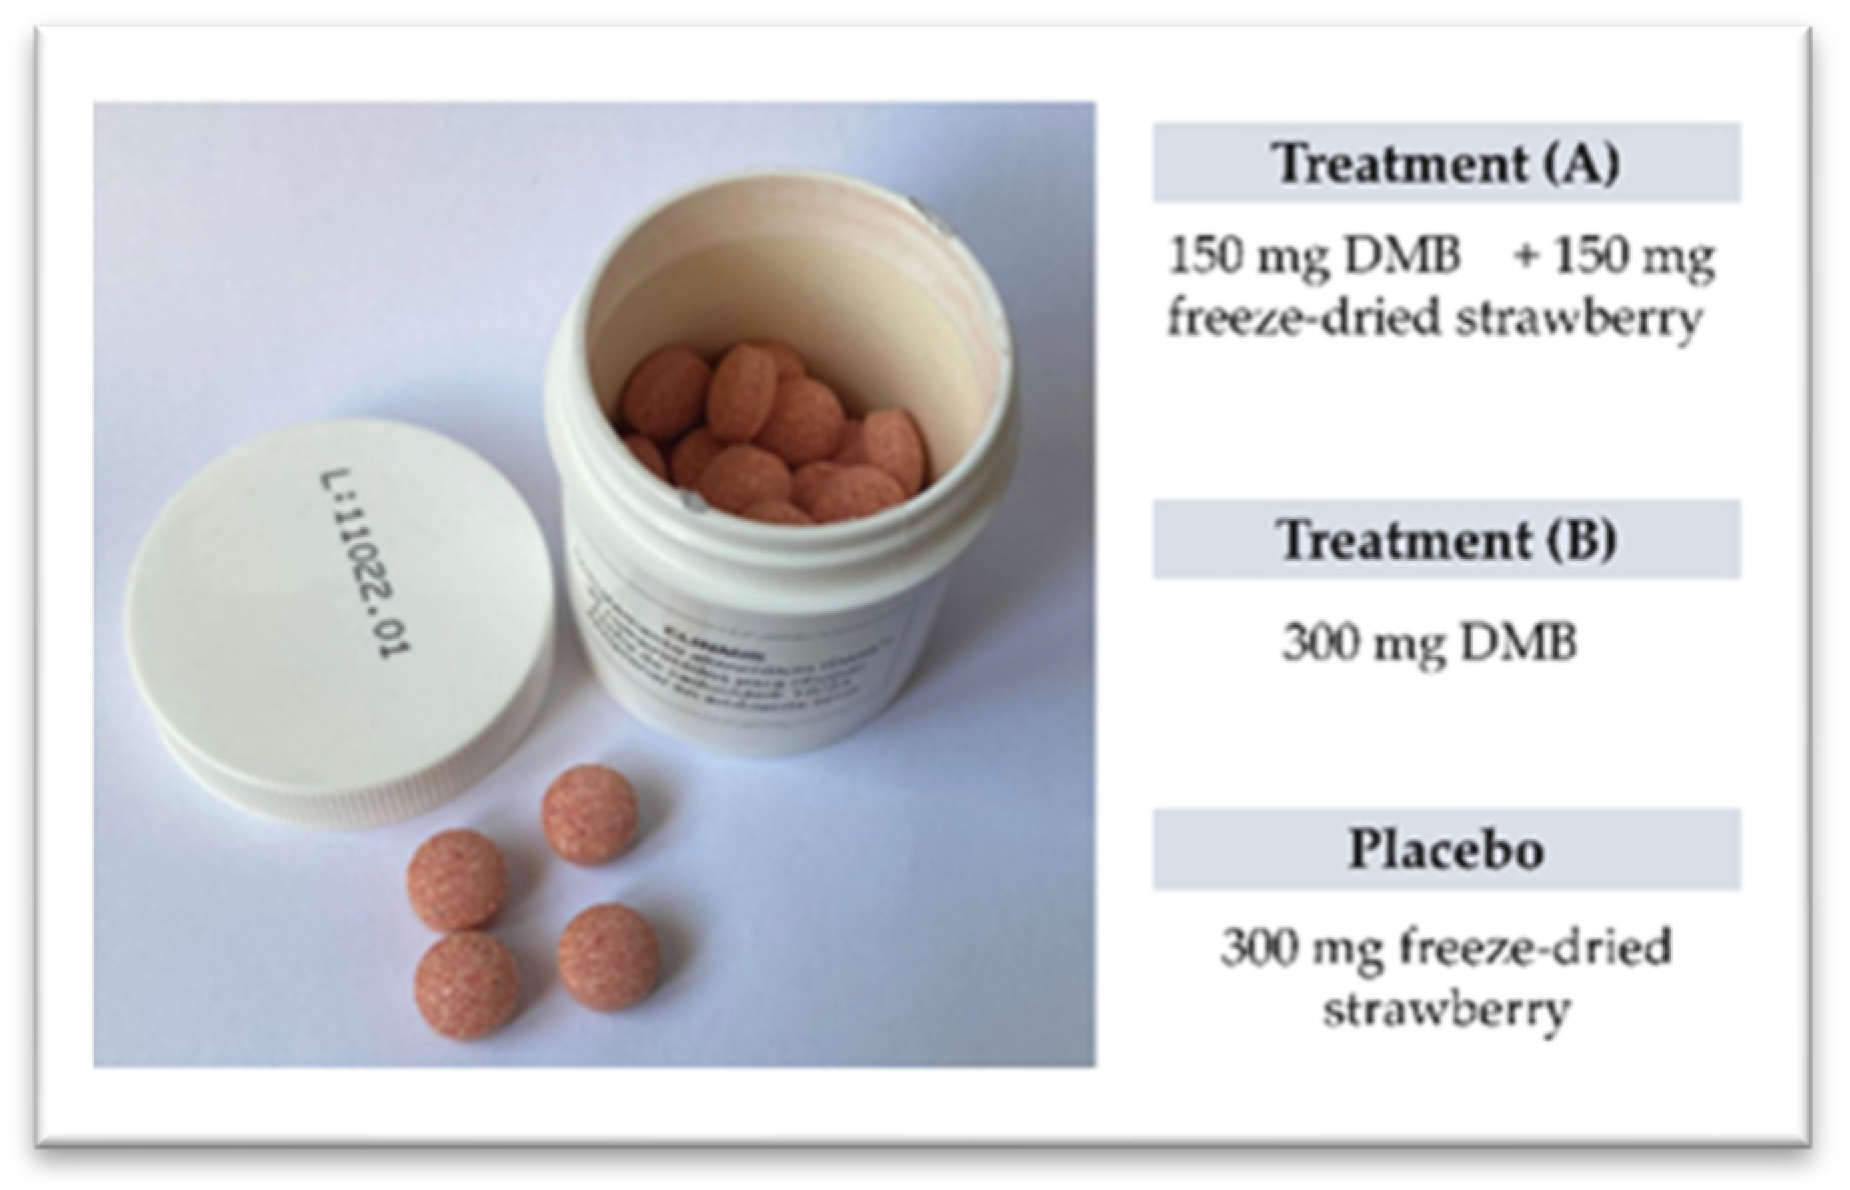
Figure 4.
Orthonasal olfactory function classification.
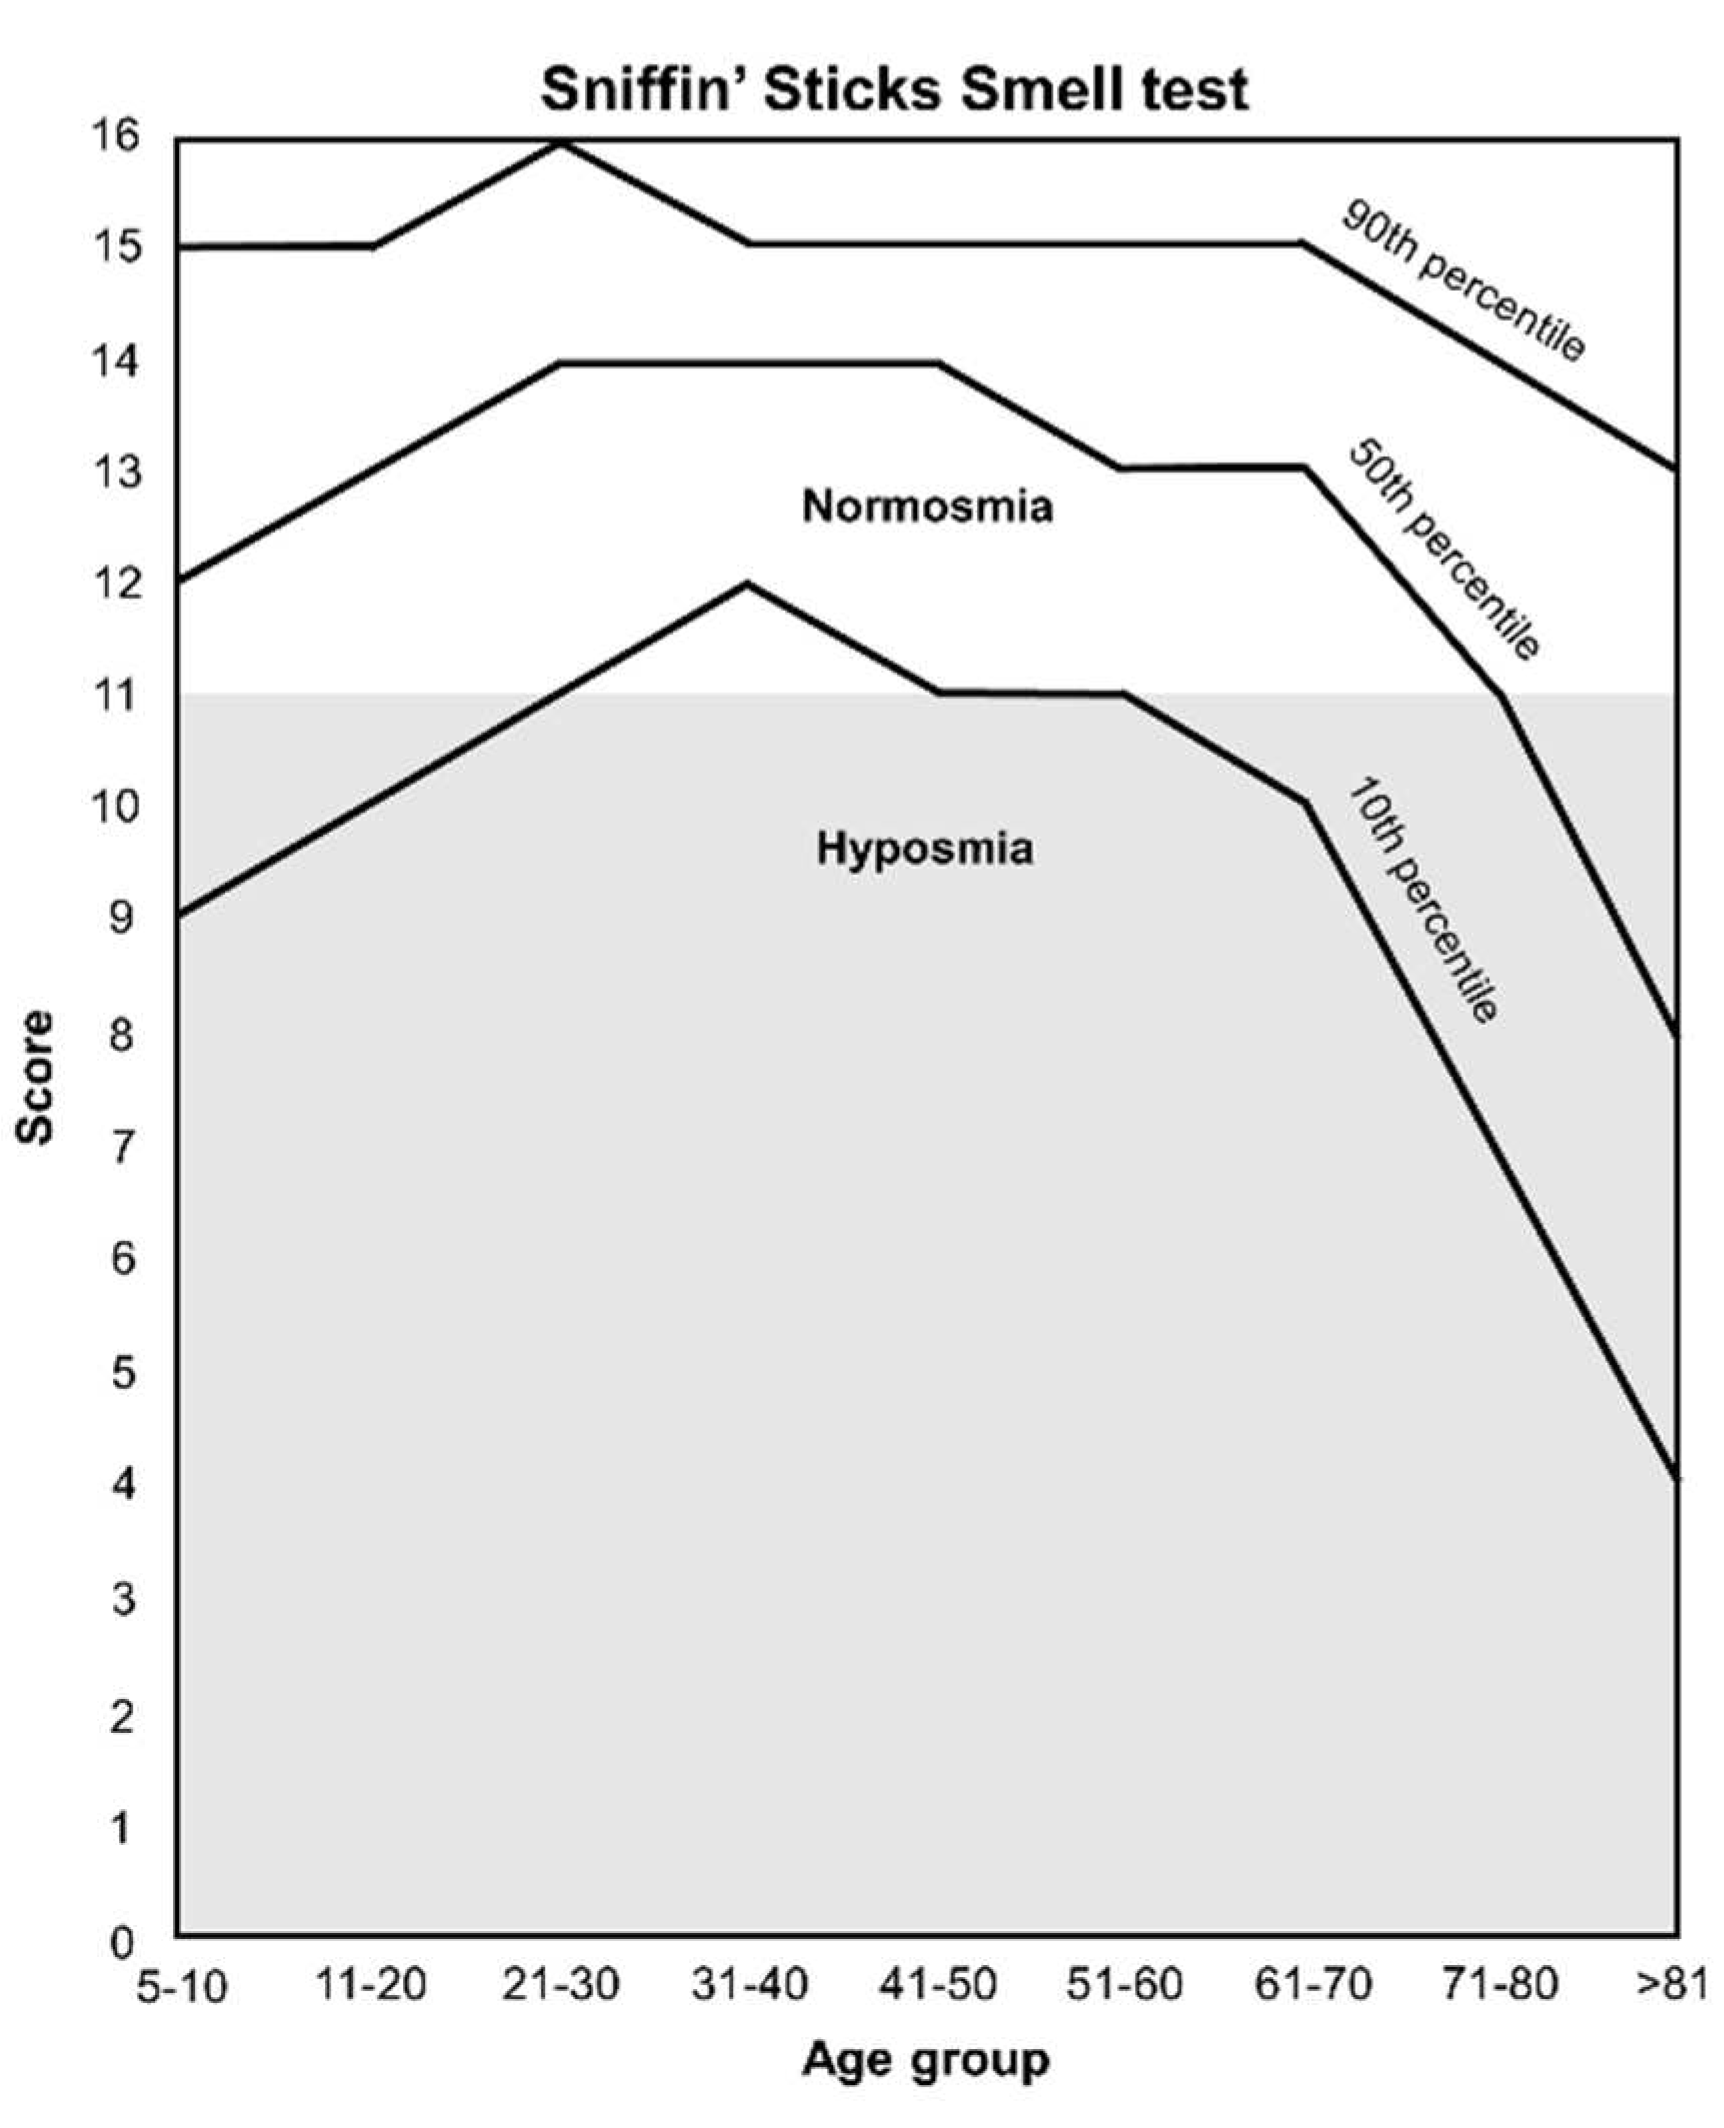

Table 1.
Nutritional composition of the miraculin-based food supplement and placebo.
| 150 mg DMB + 150 mg strawberry freeze-dried | 300 mg DMB | Placebo (300 mg strawberry freeze-dried) | ||
|---|---|---|---|---|
| Energy | kcal | 0.99 | 1 | 0.97 |
| Carbohydrates | mg | 194 | 234 | 154 |
| Sugars | mg | 156 | 162 | 150 |
| Fiber | mg | 26 | 6 | 46 |
| Proteins | mg | 20 | 15 | 24 |
| Lipids | mg | 9 | 5 | 12 |
| Saturated fatty acids | mg | 2 | 2 | 1 |
| Sodium chloride | mg | 0.1 | 0.1 | 0.03 |
| Humidity | mg | 4 | 4 | 5 |
| Ash | mg | 12 | 14 | 15 |
| Miraculin | mg | 2.8 | 5.5 | 0 |
Nutritional composition provided by Medicinal Gardens, S.L.
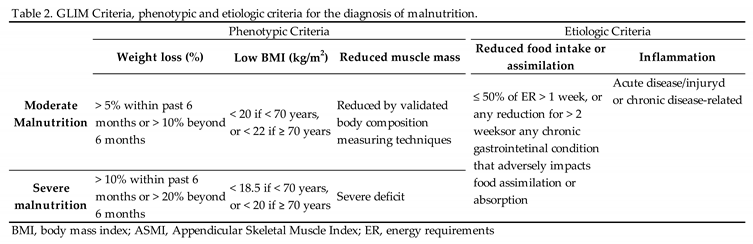 |
Disclaimer/Publisher’s Note: The statements, opinions and data contained in all publications are solely those of the individual author(s) and contributor(s) and not of MDPI and/or the editor(s). MDPI and/or the editor(s) disclaim responsibility for any injury to people or property resulting from any ideas, methods, instructions or products referred to in the content. |
© 2023 by the authors. Licensee MDPI, Basel, Switzerland. This article is an open access article distributed under the terms and conditions of the Creative Commons Attribution (CC BY) license (http://creativecommons.org/licenses/by/4.0/).
Copyright: This open access article is published under a Creative Commons CC BY 4.0 license, which permit the free download, distribution, and reuse, provided that the author and preprint are cited in any reuse.


