Submitted:
10 October 2023
Posted:
13 October 2023
You are already at the latest version
Abstract
Keywords:
1. Introduction
2. Materials and Methods
2.1. Samples Characterization
2.2. Computational Methods
3. Results
3.1. Indirect MCE Estimation
3.2. Direct MCE Measurements
3.3. Computational Results
4. Discussions
5. Conclusions
Author Contributions
Funding
Data Availability Statement
Acknowledgments
Conflicts of Interest
References
- Giauque, W.F.; MacDougall, D.P. Attainment of Temperatures Below 1 Absolute by Demagnetization of Gd2(SO4)3·8H2O. Phys. Rev. 1933, 43, 768. [Google Scholar] [CrossRef]
- Koshkid’ko, Yu. S.; Dilmieva, E.T.; Kamantsev, A.P.; Mashirov, A.V.; Cwik, J.; Kol’chugina, N.B.; Koledov, V.V.; Shavrov, V.G. Magnetocaloric Materials for Low-Temperature Magnetic Cooling. J. Commun. Technol. Electr. 2023, 68, 379–388. [Google Scholar] [CrossRef]
- Tishin, A.M.; Spichkin, Y.I. The Magnetocaloric Effect and its Applications. Publisher: IOP Publ., Bristol, 2003; 476 p.
- Belov, K.P. The Magnetothermal Phenomena in Rare-Earth Magnetics. Publisher: Nauka, Moscow, 1990.
- Khovaylo, V.V.; Taskaev, S.V. Magnetic Refrigeration: From Theory to Applications. Encycl. Smart Mater. 2022, 5, 407–417. [Google Scholar]
- Zhang, H.; Sun, Y.J.; Niu, E.; Yang, L.H.; Shen, J.; Hu, F.X.; Sun, J.R.; Shen, B.G. Large magnetocaloric effects of RFeSi (R = Tb and Dy) compounds for magnetic refrigeration in nitrogen and natural gas liquefaction. Appl. Phys. Lett. 2013, 103, 202412. [Google Scholar] [CrossRef]
- Timmerhaus, K.D.; Reed, R.P. Cryogenic Engineering: Fifty Years of Progress. Publisher: Springer Science & Business Media, New York, 2007.
- Suslov, D.A.; Shavrov, V.G.; Koledov, V.V.; Mashirov, A.V.; Terentyev, Yu. A.; Petrov, A.O.; Kamantsev, A.P.; Samvelov, A.V.; Yasev, S.G.; Taskaev, S.V.; Kolesov, K.A. Comparison of thermodynamic efficiency of cryogenic gas and solid-state magnetocaloric cycles. Chel. Phys.-Math. J. 2020, 5, 612–617. [Google Scholar] [CrossRef]
- Andreenko, A.S.; Belov, K.P.; Nikitin, S.A.; Tishin, A.M. Magnetocaloric effects in rare-earth magnetic materials. Sov. Phys. Usp. 1989, 32, 649–664. [Google Scholar] [CrossRef]
- Zheng, X.Q.; Xu, Z.Y.; Zhang, B.; Hu, F.X.; Shen, B.G. The normal and inverse magnetocaloric effect in RCu2 (R= Tb, Dy, Ho, Er) compounds. J. Magn. Magn. Mater. 2017, 421, 448–452. [Google Scholar] [CrossRef]
- Kamantsev, A.P.; Koshkidko, Y.S.; Taskaev, S.V.; Khovaylo, V.V.; Koshelev, A.V.; Cwik, J.; Shavrov, V.G. Inverse Magnetocaloric Effect and Kinetic Arrest Behavior in As-Cast Gd2In at Cryogenic Temperatures. J. Supercond. Nov. Magn. 2022, 35, 2181–2186. [Google Scholar] [CrossRef]
- Nikitin, S.A.; Skokov, K.P.; Koshkid’ko, Yu. S.; Pastushenkov, Yu. G.; Ivanova, T.I. Giant Rotating Magnetocaloric Effect in the Region of Spin-Reorientation Transition in the NdCo5 Single Crystal. Phys. Rev. Lett. 2010, 105, 137205. [Google Scholar] [CrossRef]
- Nikitin, S.A.; Ivanova, T.I.; Zvonov, A.I.; Koshkid'ko, Yu.S.; Ćwik, J.; Rogacki, K. Magnetization, magnetic anisotropy and magnetocaloric effect of the Tb0.2Gd0.8 single crystal in high magnetic fields up to 14 T in region of a phase transition. Acta Mater. 2018, 161, 331. [Google Scholar] [CrossRef]
- Kuznetsov, A.S.; Mashirov, A.V.; Musabirov, I.I.; Mitsiuk, V.I.; Anikin, M.S.; Kamantsev, A.P.; Koledov, V.V.; Shavrov, V.G. Inverse Magnetocaloric Effect in Mn5Si3 Compound. J. Commun. Technol. Electr. 2023, 68, 413–419. [Google Scholar] [CrossRef]
- Koshkid'ko, Y.; Cwik, J.; Dilmieva, E.; Pandey, S.; Quetz, A.; Aryal, A.; Dubenko, I.; Ali, N.; Granovsky, A.; Lähderanta, E.; Zhukov, A.; Stadler, S. Inverse magnetocaloric effects in metamagnetic Ni-Mn-In-based alloys in high magnetic fields. J. Alloy. Compd. 2017, 695, 3348–3352. [Google Scholar] [CrossRef]
- Dilmieva, E.T.; Koshkid’ko, Yu. S.; Kamantsev, A.P.; Koledov, V.V.; Mashirov, A.V.; Shavrov, V.G.; Khovaylo, V.V.; Lyange, M.V.; Cwik, J.; Gonzalez-Legarreta, L.; Grande, H.B. Research of magnetocaloric effect of Ni-Mn-In-Co Heusler alloys by the direct method in magnetic fields up to 14 T. IEEE Trans. Magn. 2017, 53, 2503705. [Google Scholar] [CrossRef]
- Konoplyuk, S.M.; Kokorin, V.V.; Mashirov, A.V.; Kamantsev, A.P.; Koledov, V.V.; Shavrov, V.G.; Koshelev, A.V. Direct measurements of adiabatic temperature change in Ni49.9Mn37.03Sb12.3Fe0.77 alloy due to magnetocaloric effect in the temperature range of martensitic transformation. IEEE Trans. Magn. 2018, 54, 2500204. [Google Scholar] [CrossRef]
- Sokolovskii, V.V.; Nachinova, D.V.; Buchel’nikov, V.D.; Dilmieva, E.T.; Koshkidko, Yu. S.; Emelyanova S., M.; Marchenkova, E.B.; Marchenkov, V.V. Magnetic and magnetocaloric properies of Heusler alloys Ni-Mn-Sn with an excess of Mn within the theoreticaland experimental approaches. Chel. Phys.-Math. J. 2020, 5, 493–503. [Google Scholar] [CrossRef]
- Beckmann, B.; Koch, D.; Pfeuffer, L.; Gottschall, T.; Taubel, A.; Adabifiroozjaei, E.; Miroshkina, O.N.; Riegg, S.; Niehoff, T.; Kani, N.A.; Gruner, M.E.; Molina-Luna, L.; Skokov, K.P.; Gutfleisch, O. Dissipation losses limiting first-order phase transition materials in cryogenic caloric cooling: A case study on all-d-metal Ni (-Co)-Mn-Ti Heusler alloys. Acta Mater. 2023, 246, 118695. [Google Scholar] [CrossRef]
- Elerman, Y.; Dinçer, I.; Yüzüak, E.; Emre, B.; Yüce, S.; Ener, S.; Akarca, B. Ferromanyetik Ni-ve Co-tabanlı Heusler alaşımlarının yapısal, manyetokalorik, ısısal, elektriksel ve spintronik özelliklerinin incelenmesi. Publisher: Ankara Üniversitesi Bilimsel Araştırma Projeleri, 2011, 48 p. http://hdl.handle.net/20.500. 1257. [Google Scholar]
- Gaifullin, R.Yu.; Kirilyuk, K.K.; Safarov, I.M.; Musabirov, I.I. Structure of Ni44.4Mn36.2Sn14.9Cu4.5 alloy applicable for thermomechanical treatment. Lett. Mater., 2023, 13(2), 164-170.
- Anand, A.; Manjuladevi, M.; Veena, R.K.; Veena, V.S.; Koshkid'ko, Y.S.; Sagar, S. A study on spin memory, nature of magnetic transition, and magnetocaloric effect in Nd0.5Ca0.5MnO3. J. Magn. Magn. Mater. 2021, 528, 167810. [Google Scholar] [CrossRef]
- Kresse, G.; Furthmüller, J. Efficient iterative schemes for ab initio total-energy calculations using a plane- wave basis set. Phys. Rev. B. 1996, 54, 11169–11186. [Google Scholar] [CrossRef] [PubMed]
- Kresse, G.; Joubert, D. From ultrasoft pseudopo-tentials to the projector augmented-wave method. Phys. Rev. B 1999, 59, 1758–1775. [Google Scholar] [CrossRef]
- Perdew, J.P.; Burke, K.; Ernzerhof, M. Generalized Gradient Approximation Made Simple. Phys. Rev. Lett. 1996, 77, 3865–3868. [Google Scholar] [CrossRef]
- Ebert, H.; Ködderitzsch, D.; Minár, J. Calculating condensed matter properties using the KKR-Green’s function method-recent developments and applications. Rep. Prog. Phys. 2011, 74, 096501–48. [Google Scholar] [CrossRef]
- Landau, D.; Binder, K. A guide to Monte Carlo simulations in statistical physics; Publisher: Cambridge university press, 2021; p. 578. [Google Scholar]
- Koshkid'ko, Y.S.; Dilmieva, E.T.; Cwik, J.; Rogacki, K.; Kowalska, D.; Kamantsev, A.P.; Koledov, V.V.; Mashirov, A.V.; Shavrov, V.G.; Valkov, V.I.; Golovchan, A.V.; Sivachenko, A.P.; Shevyrtalov, S.N.; Rodionova, V.V.; Shchetinin, I.V.; Sampath, V. Giant reversible adiabatic temperature change and isothermal heat transfer of MnAs single crystals studied by direct method in high magnetic fields. J. Alloyю Comp. 2019, 798, 810–819. [Google Scholar] [CrossRef]
- Koshkid'ko, Y.S.; Ćwik, J.; Ivanova, T.I.; Nikitin, S.A.; Miller, M.; Rogacki, K. Magnetocaloric properties of Gd in fields up to 14 T. J. Magn. Magn. Mater. 2017, 433, 234–238. [Google Scholar] [CrossRef]
- Moruzzi, V.L.; Janak, J.F.; Schwarz, K. Calculated thermal properties of metals. Phys. Rev. B 1988, 37, 790–799. [Google Scholar] [CrossRef]
- Comtesse, D.; Gruner, M.E.; Ogura, M.; Sokolovskiy, V.V.; Buchelnikov, V.D.; Grünebohm, A.; Arróyave, R.; Singh, N.; Gottschall, T.; Gutfleisch, O.; et al. First-principles calculation of the instability leading to giant inverse magnetocaloric effects. Phys. Rev. B 2014, 89, 184403–6. [Google Scholar] [CrossRef]
- Sokolovskiy, V.V.; Buchelnikov, V.D.; Zagrebin, M.A.; Entel, P.; Sahool, S.; Ogura, M. First-principles investigation of chemical and structural disorder in magnetic Ni2Mn1+xSn1−x Heusler alloys. Phys. Rev. B. 2012, 86, 134418–11. [Google Scholar] [CrossRef]
- Sokolovskiy, V.; Grünebohm, A.; Buchelnikov, V.; Entel, P. Ab initio and Monte Carlo approaches for the magnetocaloric effect in Co- and In-doped Ni-Mn-Ga Heusler alloys. Entropy. 2014, 16, 4992–5019. [Google Scholar] [CrossRef]
- Buchelnikov, V.D.; Sokolovskiy, V.V.; Zagrebin, M.A.; Klyuchnikova, M.A.; Entel, P. First-principles study of the structural and magnetic properties of the Ni45Co5Mn39Sn11 Heusler alloy. J. Magn. Magn. Mater. 2015, 383, 180–185. [Google Scholar] [CrossRef]
- Kuz’min, M.D. Landau-type parametrization of the equation of state of a ferromagnet. Phys. Rev. B, 2008, 77, 184431. [Google Scholar] [CrossRef]
- Kamantsev, A.P.; Amirov, A.A.; Zaporozhets, V.D.; Gribanov, I.F.; Golovchan, A.V.; Valkov, V.I.; Pavlukhina, O.O.; Sokolovskiy, V.V.; Buchelnikov, V.D.; Aliev, A.M.; Koledov, V.V. Effect of Magnetic Field and Hydrostatic Pressure on Metamagnetic Isostructural Phase Transition and Multicaloric Response of Fe49Rh51 Alloy. Metals. 2023, 13, 956. [Google Scholar] [CrossRef]
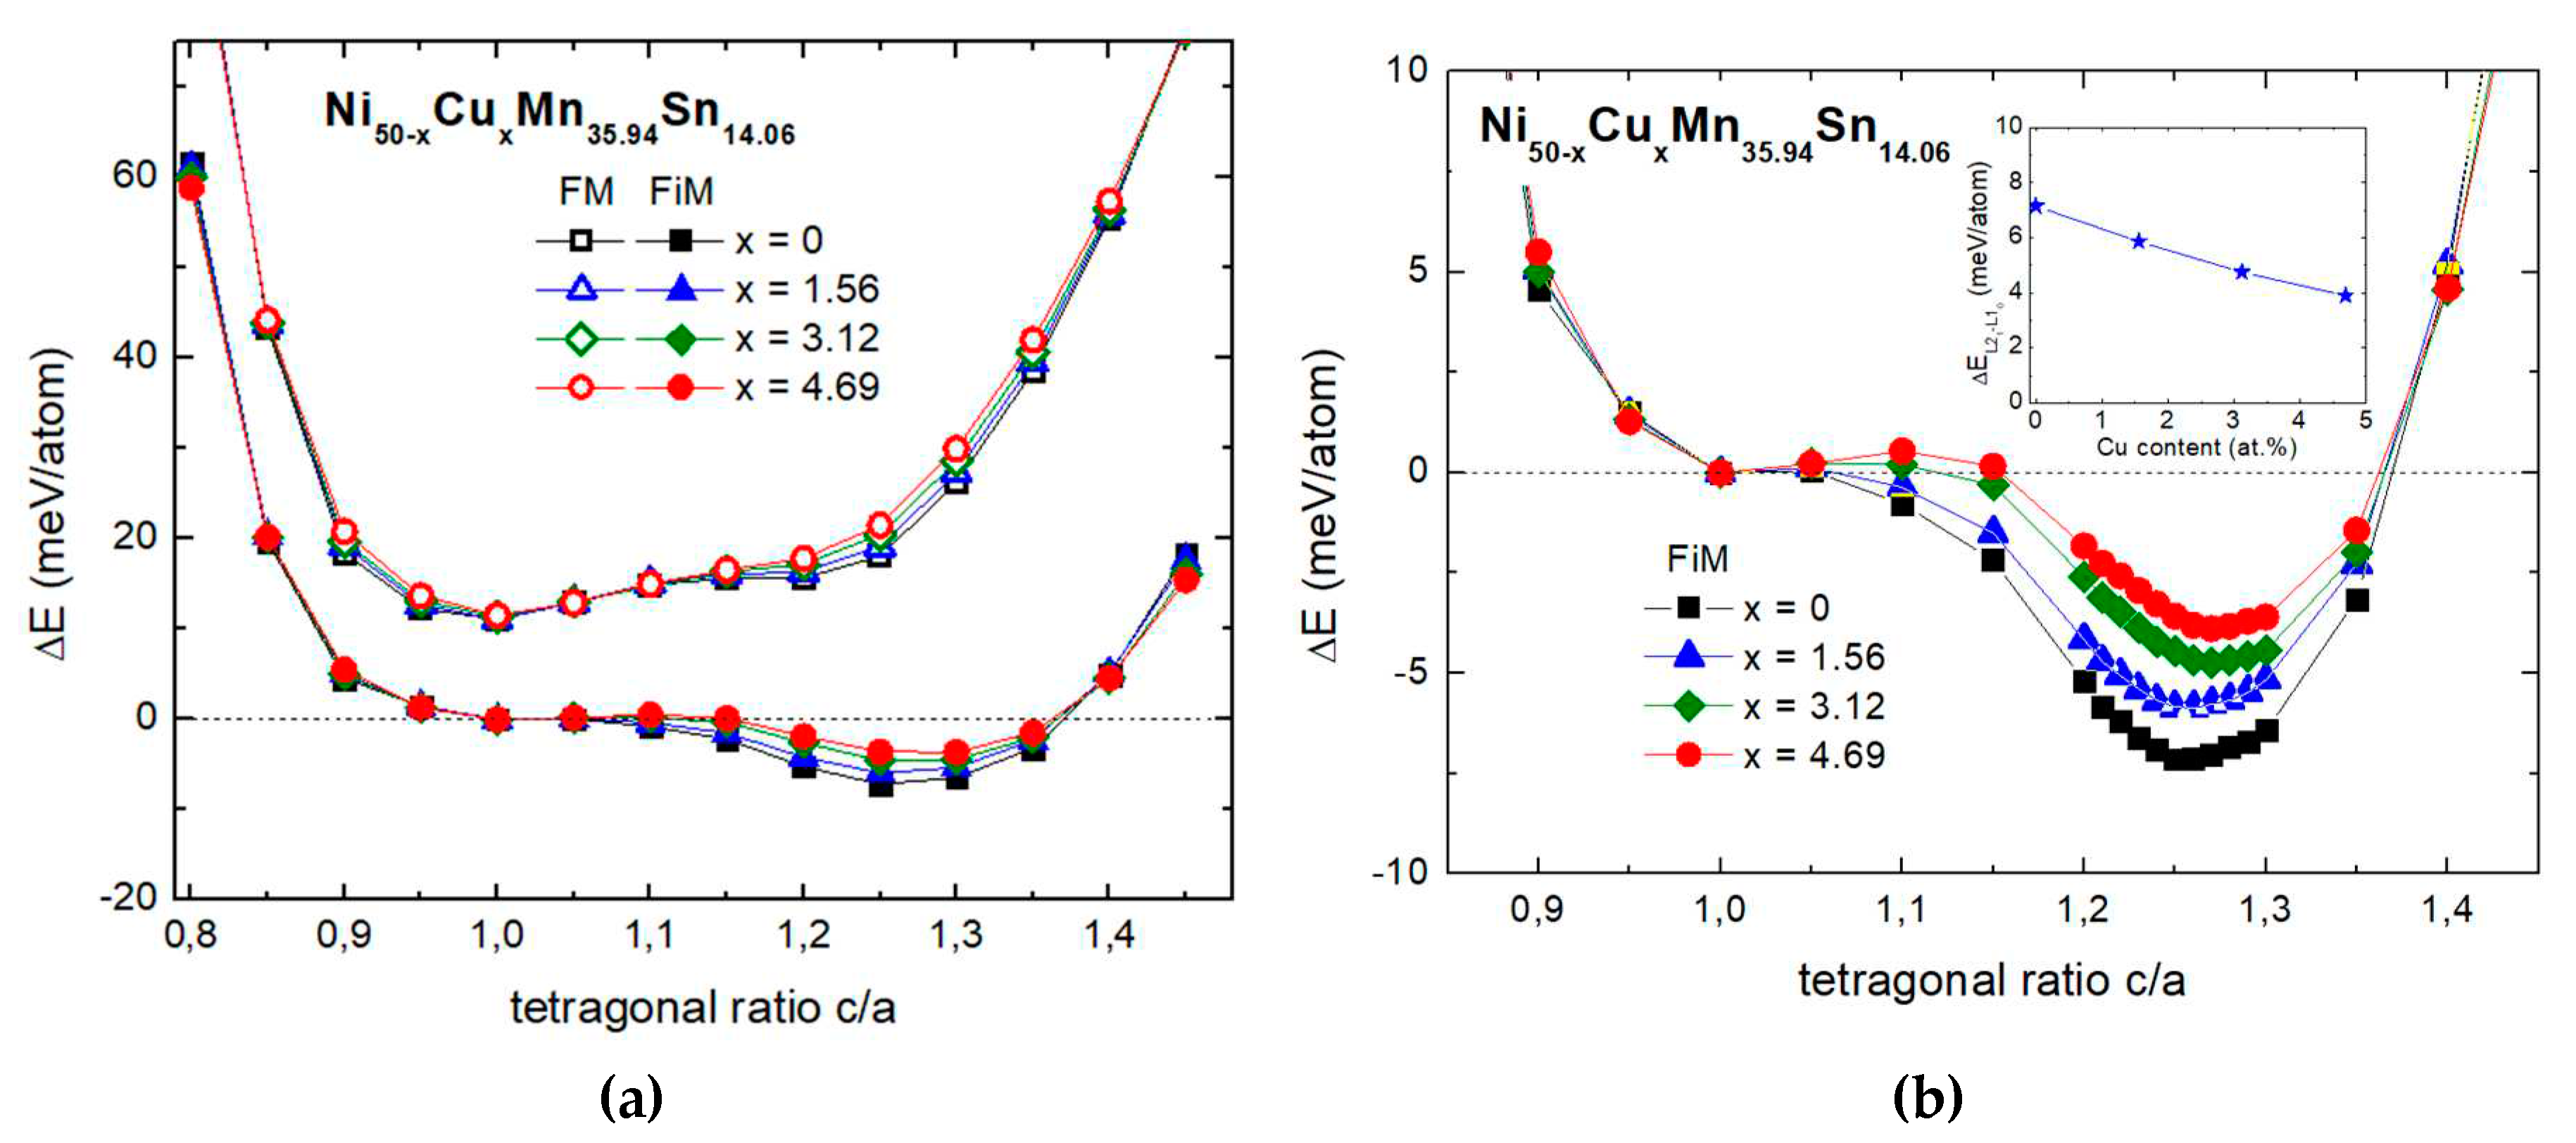
| Phase | Parameters | x=0 | x=1.56 | x=3.12 | x=4.69 |
|---|---|---|---|---|---|
| FiM cubic (c/a = 1) | a0 (Å) | 5.953 | 5.955 | 5.959 | 5.963 |
| (K) | 316 | 308 | 293 | 282 | |
|
FiM tetragonal (c/a = 1.27) |
at (Å) | 5.526 | 5.513 | 5.502 | 5.500 |
| c (Å) | 6.908 | 6.947 | 6.988 | 6.994 | |
| c/a | 1.25 | 1.26 | 1.27 | 1.27 | |
| (K) | 333 | 325 | 308 | 295 |
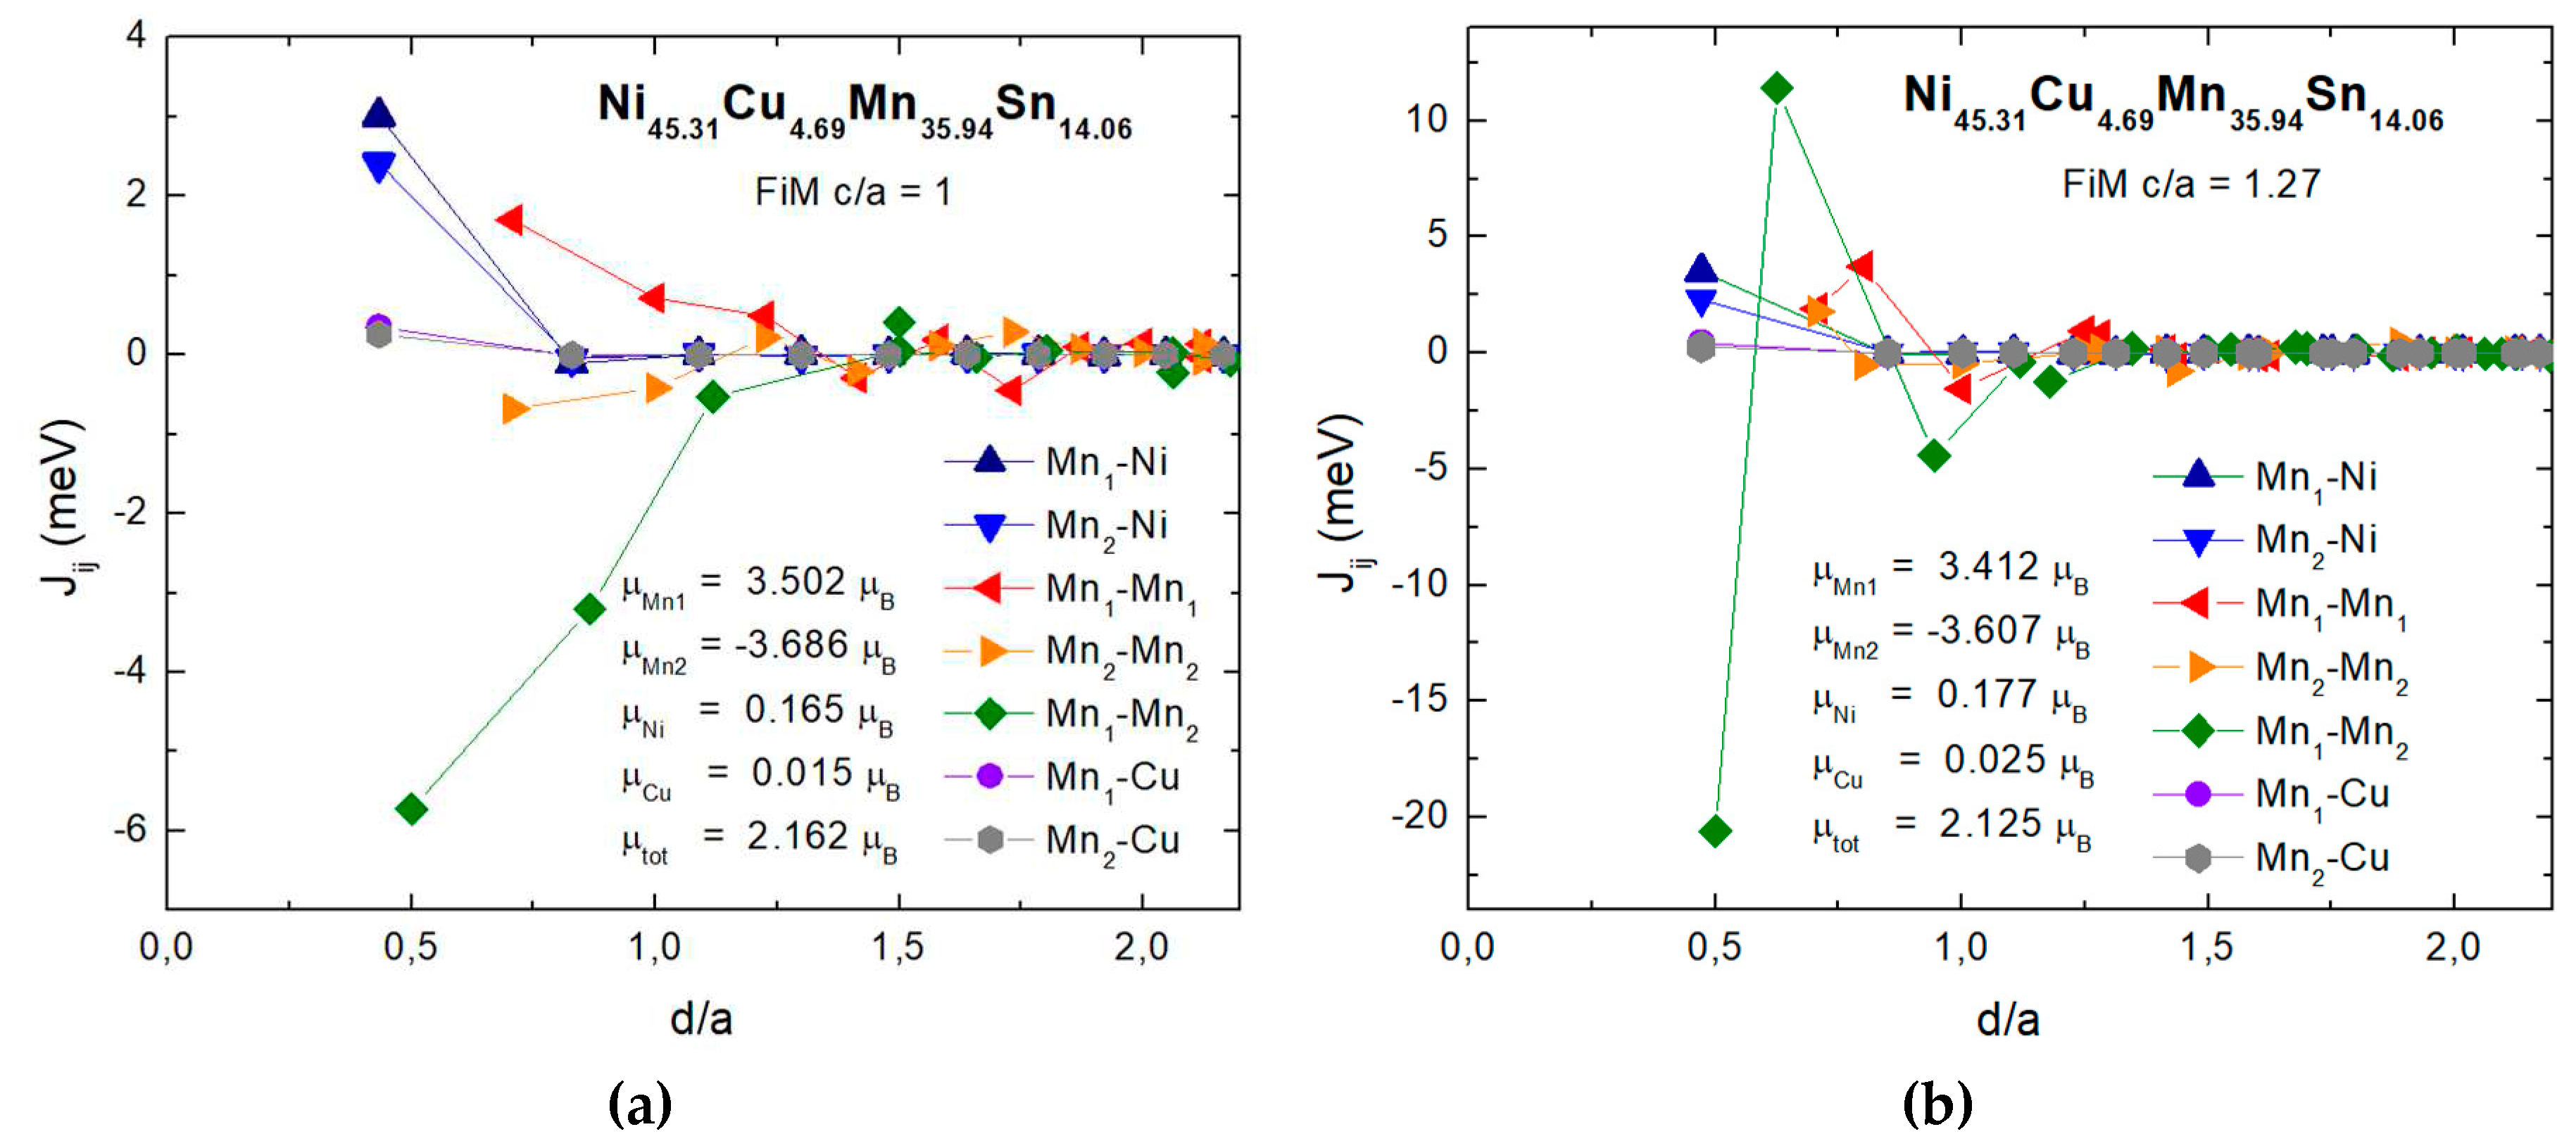
| x | Mn1-Ni | Mn2-Ni | Mn1-Mn1 | Mn2-Mn2 | Mn1-Mn2 | TC (MC) | TC (MFA) |
|---|---|---|---|---|---|---|---|
| FiM cubic structure | |||||||
| 0 | 2.961 | 2.341 | 1.082 | -0.936 | -6.065 | 425 | 423.4 |
| 1.56 | 2.977 | 2.364 | 1.201 | -0.837 | -5.925 | 430 | 433.5 |
| 3.12 | 2.988 | 2.384 | 1.492 | -0.772 | -5.859 | 452 | 444.8 |
| 4.69 | 2.999 | 2.402 | 1.702 | -0.678 | -5.722 | 464 | 453.1 |
| FiM tetragonal structure | |||||||
| 0 | 3.514 | 2.308 | 2.035 | 1.859 | -21.902 | 484 | 544.9 |
| 1.56 | 3.502 | 2.299 | 1.985 | 1.826 | -21.513 | 506 | 547.5 |
| 3.12 | 3.495 | 2.294 | 1.942 | 1.798 | -21.071 | 514 | 549.6 |
| 4.69 | 3.489 | 2.287 | 1.906 | 1.779 | -20.598 | 523 | 551.4 |
Disclaimer/Publisher’s Note: The statements, opinions and data contained in all publications are solely those of the individual author(s) and contributor(s) and not of MDPI and/or the editor(s). MDPI and/or the editor(s) disclaim responsibility for any injury to people or property resulting from any ideas, methods, instructions or products referred to in the content. |
© 2023 by the authors. Licensee MDPI, Basel, Switzerland. This article is an open access article distributed under the terms and conditions of the Creative Commons Attribution (CC BY) license (http://creativecommons.org/licenses/by/4.0/).


