Submitted:
11 October 2023
Posted:
12 October 2023
Read the latest preprint version here
Abstract
Tracked vehicles play a significant role in engineering. Supportive trafficability is the salvation of any tracked vehicle. Terrain characteristics have a substantial impact on tracked vehicle mobility. We consider a tracked vehicle traversing known terrain in this paper. Vehicle-terrain interaction covers track-soil friction, soil compaction, traction, bearing capacity, and sinkage resistance. Identifying the soil parameters upon which a tracked vehicle moves will likely lead to more accurate traversability predictions, better traction control, and more accurate trajectory tracking. Conventional terramechanical models cannot adequately describe the connection between tracks and soil. Obtaining real-time measurements of the ground pressure of the soil as the unmanned tracked vehicle moves in the soil bin of dimensions 610 cm long, 245 cm wide, and 180 cm deep is challenging. The utilization of real-time data enables monitoring dynamic variations in ground pressure exerted by the operational components within a soil bin. A ground pressure monitoring device suitable for wet and dry soil was designed to reduce the accumulation of choked damp soil, clay, or mud in the sensor, sensor bracket, track, and other equipment. The device uses a pressure sensor, a data logger, and wireless measurement technology. It can simultaneously measure up to 8 pressure sensors and transmit measurement data remotely to a computer. This reduces the labor intensity of measuring personnel in muddy soil. Data analysis showed that the crewless tracked vehicle’s ground pressure and forward resistance increased with forward speed and vertical load. A law was also discovered explaining how ground pressure (sinkage) spreads between the trackpad and the soil. A general technique is presented in this paper that can be applied to any tracked vehicle. The conclusions show that the ground pressure measurement system works steadily in different humidity scenarios. In addition, the data that has been gathered can be transmitted to a computer using wireless communication methods.
Keywords:
terramechanics
; sensors
; tracked vehicle
; ground pressure
; soil bin
; cone penetrometer
; bearing capacity
; pressure-sinkage
1. Introduction
Terramechanics, the discipline focused on the dynamic interaction between vehicles and terrain, is instrumental in shaping the performance of off-road vehicles [1]. This field holds paramount importance in developing and assessing off-road machinery tailored for specific terrain types. Over the years, researchers have devised various methodologies to probe the mobility of these vehicles [2,3,4,5,6], given their crucial role in navigating challenging terrains [7,8]. Distinct from their wheeled counterparts, tracked vehicles promise a multitude of advantages in off-road applications. Their design ensures a broader contact surface with the ground, leading to uniform weight distribution and a reduced risk of sinking. This design feature has garnered their prominence across sectors such as the military, construction, agriculture, and mining. These vehicles, equipped with rubber tracks, promise enhanced grip, lower ground pressure, and elevated mobility. Understanding the behavior of these rigid-flexible tracked vehicles across different soil beds is of paramount importance. Their ability to traverse varying terrains stems from the complex interplay between the vehicle’s vehicle’s characteristics and the soil’s inherent properties, including its texture, moisture content, and structural stability.
Soil bins offer an invaluable platform for in-depth studies on pressure sinkage and bearing capacity [7]. They facilitate controlled experiments, illuminating the interplay between various soil factors like type, density, and moisture content. Pioneering studies, such as those by Shaikh et al. [9] and Oh et al [10], have harnessed soil bins to understand the profound effects of soil moisture content and soil compaction, respectively, on pressure sinkage and bearing capacity in the context of tracked vehicles. However, despite the wealth of knowledge derived from these studies, a gap remains in the realm of real-world field tests. Comprehensive research is needed to discern the myriad factors influencing tracked vehicle mobility across an expansive range of terrains and conditions. Tracked vehicles, in particular, have emerged as superior performers in off-road terrains due to their unique design advantages compared to traditional wheeled vehicles [11]. Their extensive ground contact area, leading to even weight distribution, provides robust stability in challenging terrains. Moreover, introducing rubber tracks has further enhanced these vehicles’ capabilities, promising excellent traction and optimized ground pressure. However, despite these advancements, there remains a significant research challenge in gaining a comprehensive understanding of how tracked vehicles behave on various types of soil.
A critical aspect of this challenge involves the complex interplay of mechanical properties between the vehicle and the terrain. Soil, in all its diverse forms—whether it’s moisture-rich Bentonite or granular Diatom—presents distinct challenges to vehicle mobility. Questions arise, such as how a tracked vehicle’s weight interacts with the moisture content of the soil or how its mechanical treads engage with the granular structure of the soil. Researchers have tackled these questions using tools like soil bins for controlled experiments, delving into pressure sinkage and bearing capacity [7,12,13,14]. However, while these findings have been groundbreaking, they have often been limited by laboratory settings, highlighting the need for real-time validations.
Vehicles’ mobility and dynamic performance largely hinge on the nuanced interaction with the terrain during operation [15]. Terrain mechanical characteristics bifurcate into two primary dimensions: the anticipated (pressure-sinkage relationship) and the tangential (shear load versus slippage). Classical models, like those posited by M.G. Bekker [16] and Reece [2] , sought to capture these interactions, but they often fall short in replicating real-world interactions, especially overlooking variables like soil moisture content. Given this context, traditional thermomechanical models, although pioneering, sometimes fall short of replicating real-world scenarios accurately. Their ability to simulate the intricate relationship between tracks and various soil types is often limited, especially when variables like soil moisture and loading conditions come into play [8,15]. To address this gap, our study aims to navigate this intricate terrain by presenting a refined model that combines the fundamental principles of established models with contemporary research discoveries. In this study, we examine the relationship between tracked vehicles and terrains. Using experiments on a custom test track and detailed analysis, we aim to address gaps in current Terramechanics research. Our goal is to offer insights that can guide the next steps in off-road vehicle design and terrain studies.
2. Materials and Methods
Tools and Sensors
In this study, we utilized various tools and sensors (Table 1) to gather accurate and detailed information about the vehicle’s interaction with different types of terrain, including a pressure sensor known as the ZNHM-D1-2T-22121401 model. This sensor works with a voltage range of 5-15V DC and can measure pressures of up to 214.5 kPa/214500 N/m2. It’s incredibly accurate, with a precision of 99.9%. To monitor soil moisture levels, the JXBS-3001-TR_4G moisture sensor was used. This sensor operates with 12-24V DC and can measure moisture levels from 0-100% over a temperature range of -40 ℃ to 80 ℃ and provides accurate readings, with a 3% margin of error for moisture levels between 0-53% and a 5% margin of error for moisture levels between 53-100%. For assessing soil compaction, the SC 900 Cone Penetrometer was used, which is powered by four AAA alkaline batteries and can measure depths from 0-18” (0-45 cm) and pressures from 0-1000 PSI (0-7000 kPa). It has a depth accuracy of ±0.5”” (±1.25 cm) and a pressure accuracy of ±15 PSI (±103 kPa).
Data collection was managed using the FD0843 data logger, which features a wireless serial communication module that operates on 9~24V DC power and consumes less than 10W. This device can handle various A/D update rates, with the capability to go up to 1600Hz. In addition, it was designed to operate in high temperatures ranging from -30° to 65℃ and relative humidity levels of 10% to 95%, with the data transfer rate for this logger being 100Mb/s. To capture vehicle orientation data, the WT901BLECL5.0 sensor model was utilized. This sensor operates on 3.7V with a 260mah battery and can transmit data at different rates, with an angular accuracy of 0.20 for the X and Y axes and 10 for the Z axis. More details about the sensor and data logger is are given in supplementary sections.
Experimental Procedure
We selected a rubber-based flexible tracked vehicle for our experiments, suitable for various applications—the vehicle measured 120 cm in length and 90 cm in width, illustrated in Figure 1. Our tests were conducted in an indoor soil bin located at the Institute of Deep-Sea Science and Engineering (IDSSE) of the Chinese Academy of Sciences. The dimensions of this bin were 610 cm x 245 cm x 180 cm. It was filled with a composite of 17% sand, 13% gravel (sized 2-5 mm), and 70% Diatom/Bentonite soil. After each trial, the soil had been tilled, leveled, and compacted. Post-leveling, a cone penetration test (CPT) was used to determine the soil’s compaction and moisture levels (Figure 2). A sophisticated data logger, as previously mentioned, was employed to record ground sinkage pressure data, and sensors were strategically positioned within the soil bin.
Initially, large amounts of Bentonite, Diatom, and a mixture of sand and gravel (ranging from 2mm to 5mm) were sourced. The composite comprised 17% sand, 13% gravel, and 70% Diatom/Bentonite soil. Both Bentonite and Diatom had been sun-dried until they turned into a loose powdered state, allowing for subsequent moisture content adjustments. This dried soil was then transported to the soil bin and introduced layer by layer at 5 cm increments. A small wooden roller and hand shovel were utilized to distribute it evenly across the bin. This soil deposition process continued until the bin’s soil level reached 40 cm. A calculated quantity of water was added to achieve uniformity and increase the moisture content to levels of 10%, 20%, and 30%. After mixing thoroughly, the soil was left to settle for 24 hours.
The testing bin, measuring 610 cm x 245 cm x 180 cm with a thickness of 4 mm, was constructed from steel sheets reinforced with steel bars, ensuring it could bear the imposed loads and prevent any soil leakage. Before initiating the experiments, the bin had been lined with a geomembrane liner to inhibit moisture evaporation. A foundational layer of drainage gravel was introduced for effective drainage. The sand-gravel mixture was carefully deposited into the bin in approximately 30 cm thick layers. Any debris, large stones, or potential obstructions were removed from the soil bin’s surface to ensure uniform compaction. Once the soil was confirmed to be evenly spread and slightly damp, the surface was allowed to settle for an additional 24 hours prior to the onset of the experiments. Post each trial, the soil was manually loosened using a hand shovel. A moisture sensor had been horizontally embedded within the compacted Bentonite/Diatom soil layer, tracking any fluctuations during the experimental phases. These sensors were wirelessly linked to a data logger for real-time monitoring. Each test was repeated three times to account for inconsistencies stemming from the soil samples’ random non-uniformity.
Soil Path Setup and Experimentation
A specific path was designated for soil compaction and testing in the soil bin. After determining the appropriate size for the soil bin, path boundaries were delineated using markers like paint or tape. Before soil introduction, the bin’s base was leveled with the sand-gravel mixture, ensuring the removal of any potential obstructions. Shovels or leveling tools were used to achieve a flat soil surface within these boundaries. The soil was then uniformly added and compacted to the desired thickness along this path. Pressure and moisture sensors were installed within the bin and connected to a wireless data acquisition system.
The tracked vehicle was placed at one end of the bin. Following the sensor layout, it was driven at speeds between 0.1 to 0.3 m/sec over the predetermined path. Parameters such as sinkage, vehicle speed, and pass count were recorded. This test was performed repeatedly at different speeds to better understand soil behavior under various loading conditions. Upon completion, data was analyzed to understand pressure distribution and its correlation with factors like sinkage, soil-bearing capacity, vehicle speed, and moisture content. It should be noted that test procedures might differ based on the pressure sinkage test objectives, soil type, and the specific tracked vehicle utilized.
Multiple parameters were recorded for the pressure sinkage test on the bentonite/diatom terrain using a rubber-tracked vehicle, including contact pressure, sinkage, soil moisture content, and occasionally vehicle speed. Pressure sensors, placed strategically within the bin, were calibrated and synced with a data logger for real-time data capture. Before the primary tests, a dry run ensured the sensors’ functionality and familiarized the operator with the terrain and path. The soil’s moisture level was consistently checked using a moisture meter since moisture significantly impacts sinkage and pressure distribution. As the vehicle traversed the terrain, the sensors captured data on the pressure exerted by the tracks. Sinkage was either measured using displacement sensors or visually using side bin markings. Other parameters were assessed, including load, inclination, and vehicle speed. A 9-axis attitude sensor was utilized to monitor the vehicle’s speed and trajectory in the bin. Post-experiment, the captured data was validated externally to derive pressure-sinkage relationships. Graphical representations of sinkage versus pressure for the Bentonite and Diatom soil were plotted using Python. The overall experimental setup flow diagram is given in Figure 3.
Note: A strict adherence to safety protocols was maintained throughout the experimentation, and all tasks were overseen by seasoned professionals. Careful analyses of the experimental results provided invaluable insights into the soil’s reactions under different conditions.
3. Results and discussion
Track Vehicle Sinkage Observations
This study analyzed the effects of varying soil moisture levels on the sinkage of a tracked vehicle moving at a constant speed of 0.1 m/s across two soil types, Bentonite and Diatom (Table 2). For Bentonite, as the moisture content increased from 5% to 30%, there was a notable progression in sinkage, from 1.10 cm with normal track wear at 5% to a significant 3.80 cm with increased track slippage at 30%. This progression in Bentonite sinkage, especially at increased moisture levels, resonates with prior findings that heightened water content tends to soften soil aggregates and the bond between them, leading to increased compressibility, particularly at lower vertical stresses [17,18]. The consequence of this is evident in the severe rutting and track deformation observed starting at 20% moisture content in our study.
On the other hand, the Diatom soil exhibited a different trend. At 5% moisture, sinkage was a modest 0.55 cm with regular wear on the tracks. As the moisture content ramped up to 30%, the peak sinkage noted was 1.30 cm, marked by profound track deformation and sinking. This disparity in the response of the two soils indicates that the tracked vehicle confronted more formidable challenges on Bentonite, especially at elevated moisture levels, than on the Diatom soil under analogous conditions. The shift in hydraulic conductivity with moisture, which affects soil permeability, might provide an added layer of explanation for the marked sinkage and deformation at high moisture levels, drawing parallels with observations from Cuisinier et al.[19] and Wang et al. [20], making navigation more taxing for the vehicle. The presented track-soil data holds significance as it facilitates a comprehensive understanding of the interplay between vehicle tracks and soil under varying moisture conditions. By examining the behavior of vehicle tracks on the soil surface, researchers and engineers can acquire valuable knowledge regarding the soil’s reaction to different wetness levels. The data mentioned above offers promising potential for applications in diverse sectors such as mining, agriculture, construction, and geotechnical engineering.
Soil behavior
The analysis of soil behavior under varying moisture content was undertaken for two soil types, Bentonite and Diatom, focusing on several metrics, including loose density, compacted density, compaction percentage, depth, and cone index (Figure 4). For Bentonite at 10% moisture, the loose and compacted densities were observed to be 1.3 g/cm³ and 1.5 g/cm³, respectively, resulting in a compaction of 15.38%. This level of compaction can potentially be attributed to the intrinsic behavior of soil under stress, as emphasized by Alaoui and Helbling [21], who noted the collapse of the soil structure due to compaction at similar depths. Specifically, the cone index values presented noticeable variability at this moisture level: 94.12 kPa at 10 cm, soaring to 215.25 kPa at 20 cm, then decreasing to 127.36 kPa at 30 cm, and again increasing to 179.48 kPa at 40 cm. As the moisture content for Bentonite increased to 20%, the loose density reduced slightly to 1.2 g/cm³ and the compacted density to 1.4 g/cm³. Yet, intriguingly, the compaction percentage rose to 17.67%. Zhang et al. [22], in their observations on the impact of tractor movement on soil compaction, might shed some light on this. They found increased soil bulk density with enhanced tractor movement, hinting at the likelihood of a similar relationship between moisture content and compaction in Bentonite. In this moisture setting, the cone index exhibited a pattern, starting with an initial spike to 184.16 kPa at 10 cm depth, then a reduction to 94.28 kPa at 20 cm, before alternating between 179.4 kPa at 30 cm and 127.52 kPa at 40 cm. At the apex moisture content of 30% for Bentonite, the loose and compacted densities further declined to 1.1 g/cm³ and 1.3 g/cm³, respectively. This was coupled with a compaction percentage of 18.18%, suggesting even more pronounced effects of moisture on soil’s structural integrity. The cone index at this moisture level shows a diverse landscape, displaying values of 94.44 kPa, 162.36 kPa, 127.6 kPa, and 215.72 kPa for depths of 10 cm, 20 cm, 30 cm, and 40 cm, respectively.
Diatom soil, unlike Bentonite, shows distinct reactions to moisture variations. At 10% moisture, the densities suggest a 22.29% compaction, potentially influenced by Diatom’s unique properties. The consistent cone index progression from 269.14 kPa at 10 cm to 342.59 kPa at 40 cm signifies a growing resistance with depth, possibly due to overlying soil pressures. As moisture rises to 20%, densities drop, but compaction grows to 25.4%. This could be attributed to water-soil particle dynamics affecting particle arrangement, a phenomenon aligning with Alaoui and Helbling [21], where compaction restricted water movement. The increasing cone index from 219.38 kPa to 278.59 kPa can be related to increased resistance from soil layer pressures or decreased porosity, as Samuel and Ajav [23] observed. At 30% moisture, despite lower densities, there’s a peak compaction of 28.57%. This tighter packing, coupled with the cone index’s rise, resonates with findings from Zhang et al. [22] and Botta et al. [24], indicating similarities between mechanical impact and moisture’s effect on soil.
Ground Pressure and Sinkage Test Results
The behavior of Bentonite, as observed in Figure 5, offers valuable insights into its response to different speed and moisture conditions. At a relatively lower speed of 0.1 m/s, as moisture content increases, there’s an apparent linear increase in ground pressure from 23 kPa to 27 kPa. The linearity suggests that moisture content directly influences the mechanical properties of Bentonite, potentially affecting its cohesive and adhesive characteristics. Comparatively, a past study by Mishra et al. [25] observed a slightly lower range, suggesting a different mechanical response to moisture. This progression in pressure is mirrored in the sinkage values, which grow from 1.5 cm to 3.8 cm. One could posit that at this speed, the moisture aids in binding the Bentonite soil particles, thereby increasing the resistance to external pressures, a phenomenon also supported by the rise in sinkage values.
Interestingly, as we increase the speed to 0.2 m/s, the ground pressure seems to inversely correlate with moisture content, decreasing from 21 kPa to 25 kPa. This inverse correlation can possibly signify a mechanical threshold for Bentonite, where increased kinetic energy (speed) may mitigate moisture’s binding effect. Yet, the sinkage consistently rises, possibly indicating that while the ground may resist pressure effectively, it may not be as adept at supporting weight or volume at this speed. The trend is further accentuated at 0.3 m/s, where even lower ground pressures of 19 kPa to 23 kPa are contrasted with the highest sinkage values, suggesting a diminished structural integrity of Bentonite at higher speeds and moisture levels.
Contrastingly, the behavior of Diatom soil shows a different picture. At the base speed of 0.1 m/s, even as ground pressures are notably higher than Bentonite (29 kPa to 33 kPa), sinkage values are comparatively subdued, ranging between 0.8 cm and 1.3 cm. Despite higher ground pressures, the relative stability in Diatom’s sinkage alludes to its potentially higher shear strength or internal friction, possibly attributed to its structural composition. This hints at Diatom soil’s inherent higher compaction or density, potentially due to its unique mineralogical composition [26]. As speeds increase to 0.2 m/s and 0.3 m/s, the ground pressures reduce across the moisture gradient, but there’s a more erratic behavior in sinkage values. This erraticism could potentially underscore a complexity in ‘Diatom’s response to mechanical stress, revealing an intricate interplay between its physical structure and moisture content. This could be indicative of the intricate interplay between soil particle arrangement, moisture, and external pressure in Diatom soil, making it react differently than Bentonite.
Impact of moist soil content on sinkage exponent
The sinkage exponent and the cohesive modulus for both Bentonite and Diatom soil types are displayed in Figure 6. For Bentonite, there is an evident progressive increase in the sinkage exponent with increasing moisture content. Starting at 5% moisture, the sinkage exponent is recorded at 0.3 and ascends steadily, reaching 1.3 at a moisture content of 30%. This indicates a direct relationship between moisture levels and the sinkage behavior of Bentonite, suggesting that as the soil becomes wetter, its propensity to sink under pressure magnifies. Given these observations, it can be inferred that the complex interplay between water molecules and Bentonite soil particles may result in increased flexibility, thereby facilitating more significant sinkage under applied loads. Such behavior can have significant implications, especially in construction or agricultural settings where precise knowledge of soil’s response to moisture is paramount [27]. Contrarily, the cohesive modulus for Bentonite depicts an inverse relationship with moisture. Commencing at a robust 150 kPa at 5% moisture, this value dwindles consistently to 12.5 kPa at 30% moisture. This sharp decline underscores that as Bentonite becomes more saturated, its cohesive strength—or its ability to stick together—diminishes considerably. This weakening of cohesion with increased moisture content aligns with prior observations made in the field, emphasizing water’s critical role in altering soil’s mechanical properties. It’s interesting to note that even a slight increase in moisture can lead to significant changes in the cohesive modulus, potentially highlighting the sensitivity of Bentonite to water content.
On the other hand, Diatom soil demonstrates a pattern somewhat parallel to Bentonite but with certain distinct variations. The sinkage exponent for Diatom begins at a lower value of 0.1 for 5% moisture but experiences a consistent surge, reaching 1.1 at 30% moisture. This mirrors the trend observed in Bentonite, pointing to an increased sinkage susceptibility with moisture saturation. The cohesive modulus of Diatom, starting from 75 kPa at 5% moisture, follows a decreasing trajectory similar to Bentonite. However, by the time we reach a moisture content of 30%, the cohesive modulus descends to a mere 6.25 kPa, suggesting that Diatom, at higher moisture levels, may possess even lesser cohesive strength compared to Bentonite. The observed behavior in Diatom soil further establishes the pivotal role of moisture in dictating the structural characteristics of different soil types. The steeper decline in the cohesive modulus of Diatom, as compared to Bentonite, might be indicative of the inherent differences in their compositions and how they interact with water.
The results of the vehicle track testing revealed that the pressure sensor readings increased as soil moisture content and vehicle speed increased. The pressure sensor measurements were also higher in bentonite soil than in diatom soil. This is because bentonite soil contains more clay than diatom soil. Clay particles are more porous and are smaller in size than sand particles. This indicates they can retain more water and produce a more cohesive soil. The more excellent clay content of bentonite soil makes it more challenging for a vehicle to permeate the soil, resulting in higher pressure sensor readings.
The vehicle’s pace also substantially impacted the pressure sensor readings. The pressure sensor readings increased as the vehicle’s speed increased. The vehicle imparts more force to the soil at higher velocities. The greater force compacts the soil more, resulting in higher pressure sensor readings.
This research has implications for the development of off-road vehicles. The results indicate that the soil type and moisture content can significantly impact the readings from the pressure sensor. This data can be used to design vehicles that are better adapted for various terrain types. The results also indicate that the vehicle’s speed can substantially influence the pressure sensor readings. This data can be used to design vehicles that are optimally adapted for various operating velocities.
4. Conclusions
In conclusion, this study sheds light on the complex relationship between tracked vehicles and different types of terrains, with a particular focus on how soil moisture levels significantly impact the sinking of vehicles. While traditional models like those proposed by Bekker and Reece have provided valuable foundational knowledge, our research highlights the critical need for models that better capture the intricate dynamics of soil-vehicle interactions in real-world situations. The stark differences in sinkage behavior observed between Bentonite and Diatom soils, particularly under varying moisture conditions, underscore the complexity of this issue. Moving forward, we recommend incorporating these findings into the development of advanced terramechanical models that excel at simulating practical off-road scenarios. By considering factors such as soil type, moisture content, and their inherent physical properties, these models can greatly enhance their predictive accuracy. This, in turn, will offer invaluable insights for the design of future off-road vehicles and a deeper understanding of terrain mechanics.
Supplementary Materials
Attached all the technical information of sensor, detailed experimental set-up and data acquisition.
Author Contributions
Conceptualization, OR and YN; methodology, OR and YN; software, OR; validation, OR and MHX; formal analysis, OR and YN; investigation, OR and YN; resources, OR; data curation, OR; writing—original draft preparation, OR; writing—review and editing, OR and YN; visualization, YN; supervision, YN; project administration, YN, MHX; funding acquisition, YN. All authors have read and agreed to the published version of the manuscript.
Funding
This work was supported by the Special Fund from China Merchant Industry (CMI) and the Institute of Deep-sea Science and Engineering (IDSSE), Chinese Academy of Sciences (Grant no. 2019000075).
Institutional Review Board Statement
Not applicable.
Informed Consent Statement
Not applicable.
Data Availability Statement
New data was investigated in this study. Data sharing does not apply to this article.
Acknowledgments
I would like to thank Dr. Ma Haoxiang and Dr. Ramganesh Selvarajan for supporting during the experimentation and draft writing. I would like to thank my spouse and kids, for their consideration and encouragement throughout my research journey.
Conflicts of Interest
The authors declare no conflict of interest
References
- Wong, J.Y. Terramechanics and off-road vehicle engineering: Terrain Behaviour. off-road Veh. Perform. Des. 2010, 129–149. [Google Scholar]
- Wong, J.-Y.; Reece, A.R. Prediction of rigid wheel performance based on the analysis of soil-wheel stresses: Part II. Performance of towed rigid wheels. J. Terramechanics 1967, 4, 7–25. [Google Scholar] [CrossRef]
- Beketov, S.A. The concept of the controlled movement of the tracked vehicle. Izv. MGTU MAMI 2018, 12, 16–20. [Google Scholar] [CrossRef]
- Zhang, Y.; Qiu, M.; Liu, X.; Li, J.; Song, H.; Zhai, Y.; Hu, H. Research on characteristics of tracked vehicle steering on slope. Math. Probl. Eng. 2021, 2021, 1–18. [Google Scholar] [CrossRef]
- Li, J.; Khajepour, A.; Huang, Y.; Wang, H.; Tang, C.; Qin, Y. A new coordinated control strategy for tracked vehicle ride comfort. Proc. Inst. Mech. Eng. Part K J. Multi-body Dyn. 2018, 232, 330–341. [Google Scholar] [CrossRef]
- Wong, J.Y. Optimization of the tractive performance of articulated tracked vehicles using an advanced computer simulation model. Proc. Inst. Mech. Eng. Part D J. Automob. Eng. 1992, 206, 29–45. [Google Scholar] [CrossRef]
- Shibly, H.; Iagnemma, K.; Dubowsky, S. An equivalent soil mechanics formulation for rigid wheels in deformable terrain, with application to planetary exploration rovers. J. terramechanics 2005, 42, 1–13. [Google Scholar] [CrossRef]
- Bekker, M.G. Introduction to terrain-vehicle systems. part i: The terrain. part ii: The vehicle; University of Michigan Press, 1969.
- Shaikh, S.A.; Li, Y.; Ma, Z.; Chandio, F.A.; Tunio, M.H.; Ahmad, F.; Solangi, K.A. Effects of soil mechanical properties on the height and tractive performance of rubber grouser at different moisture contents. Int. J. Agric. Biol. Eng. 2022, 15, 31–37. [Google Scholar]
- Oh, J.; Nam, J.-S.; Kim, S.; Park, Y.-J. Influence of tire inflation pressure on the estimation of rating cone index using wheel sinkage. J. Terramechanics 2019, 84, 13–20. [Google Scholar] [CrossRef]
- Bekker, M.G. Theory of land locomotion: the mechanics of vehicle mobility; University of Michigan Press, 1956.
- Ani, O.A.; Uzoejinwa, B.B.; Ezeama, A.O.; Onwualu, A.P.; Ugwu, S.N.; Ohagwu, C.J. Overview of soil-machine interaction studies in soil bins. Soil Tillage Res. 2018, 175, 13–27. [Google Scholar] [CrossRef]
- Badgujar, C.; Flippo, D.; Welch, S. Artificial neural network to predict traction performance of autonomous ground vehicle on a sloped soil bin and uncertainty analysis. Comput. Electron. Agric. 2022, 196, 106867. [Google Scholar] [CrossRef]
- Badgujar, C.M.; Flippo, D.; Brokesh, E.; Welch, S. Experimental investigation on traction, mobility, and energy usage of a tracked autonomous ground vehicle on a sloped soil bin. J. ASABE 2022, 65, 835–847. [Google Scholar] [CrossRef]
- Wong, J.Y. Theory of Ground Vehicles; John Wiley, New York, 2008.
- Bekker, M.G. Mechanics of locomotion and lunar surface vehicle concepts. Sae Trans. 1964, 549–569. [Google Scholar]
- Tang, A.-M.; Cui, Y.-J.; Eslami, J.; Défossez, P. Analysing the form of the confined uniaxial compression curve of various soils. Geoderma 2009, 148, 282–290. [Google Scholar] [CrossRef]
- Kochmanov, N.; Tanakai, H. Influence of the Soil Fabric on the Mechanical Properties of Unsaturated Clays. Soils Found. 2011, 51, 275–286. [Google Scholar] [CrossRef]
- Cuisinier, O.; Auriol, J.-C.; Le Borgne, T.; Deneele, D. Microstructure and hydraulic conductivity of a compacted lime-treated soil. Eng. Geol. 2011, 123, 187–193. [Google Scholar] [CrossRef]
- Wang, Q.; Cui, Y.-J.; Tang, A.M.; Barnichon, J.-D.; Saba, S.; Ye, W.-M. Hydraulic conductivity and microstructure changes of compacted bentonite/sand mixture during hydration. Eng. Geol. 2013, 164, 67–76. [Google Scholar] [CrossRef]
- Alaoui, A.; Helbling, A. Evaluation of soil compaction using hydrodynamic water content variation: Comparison between compacted and non-compacted soil. Geoderma 2006, 134, 97–108. [Google Scholar] [CrossRef]
- Zhang, S.; Grip, H.; Lövdahl, L. Effect of soil compaction on hydraulic properties of two loess soils in China. Soil Tillage Res. 2006, 90, 117–125. [Google Scholar] [CrossRef]
- Samuel, T.M.; Ajav, E.A. Optimum tillage system for pepper production in an alfisol of South-western Nigeria. African J. Agric. Res. 2010, 5, 2647–2652. [Google Scholar]
- Botta, G.F.; Becerra, A.T.; Tourn, F.B. Effect of the number of tractor passes on soil rut depth and compaction in two tillage regimes. Soil Tillage Res. 2009, 103, 381–386. [Google Scholar] [CrossRef]
- Mishra, A.K.; Ohtsubo, M.; Li, L.Y.; Higashi, T. Influence of the bentonite on the consolidation behaviour of soil–bentonite mixtures. Carbonates and Evaporites 2010, 25, 43–49. [Google Scholar] [CrossRef]
- Sha, F.; Xi, M.; Chen, X.; Liu, X.; Niu, H.; Zuo, Y. A recent review on multi-physics coupling between deep-sea mining equipment and marine sediment. Ocean Eng. 2023, 276, 114229. [Google Scholar] [CrossRef]
- Yang, C.; Yang, G.; Liu, Z.; Chen, H.; Zhao, Y. A method for deducing pressure–sinkage of tracked vehicle in rough terrain considering moisture and sinkage speed. J. Terramechanics 2018, 79, 99–113. [Google Scholar] [CrossRef]
Figure 1.
Proposed tracked vehicle’s lab view and Solidworks schematic track diagram.
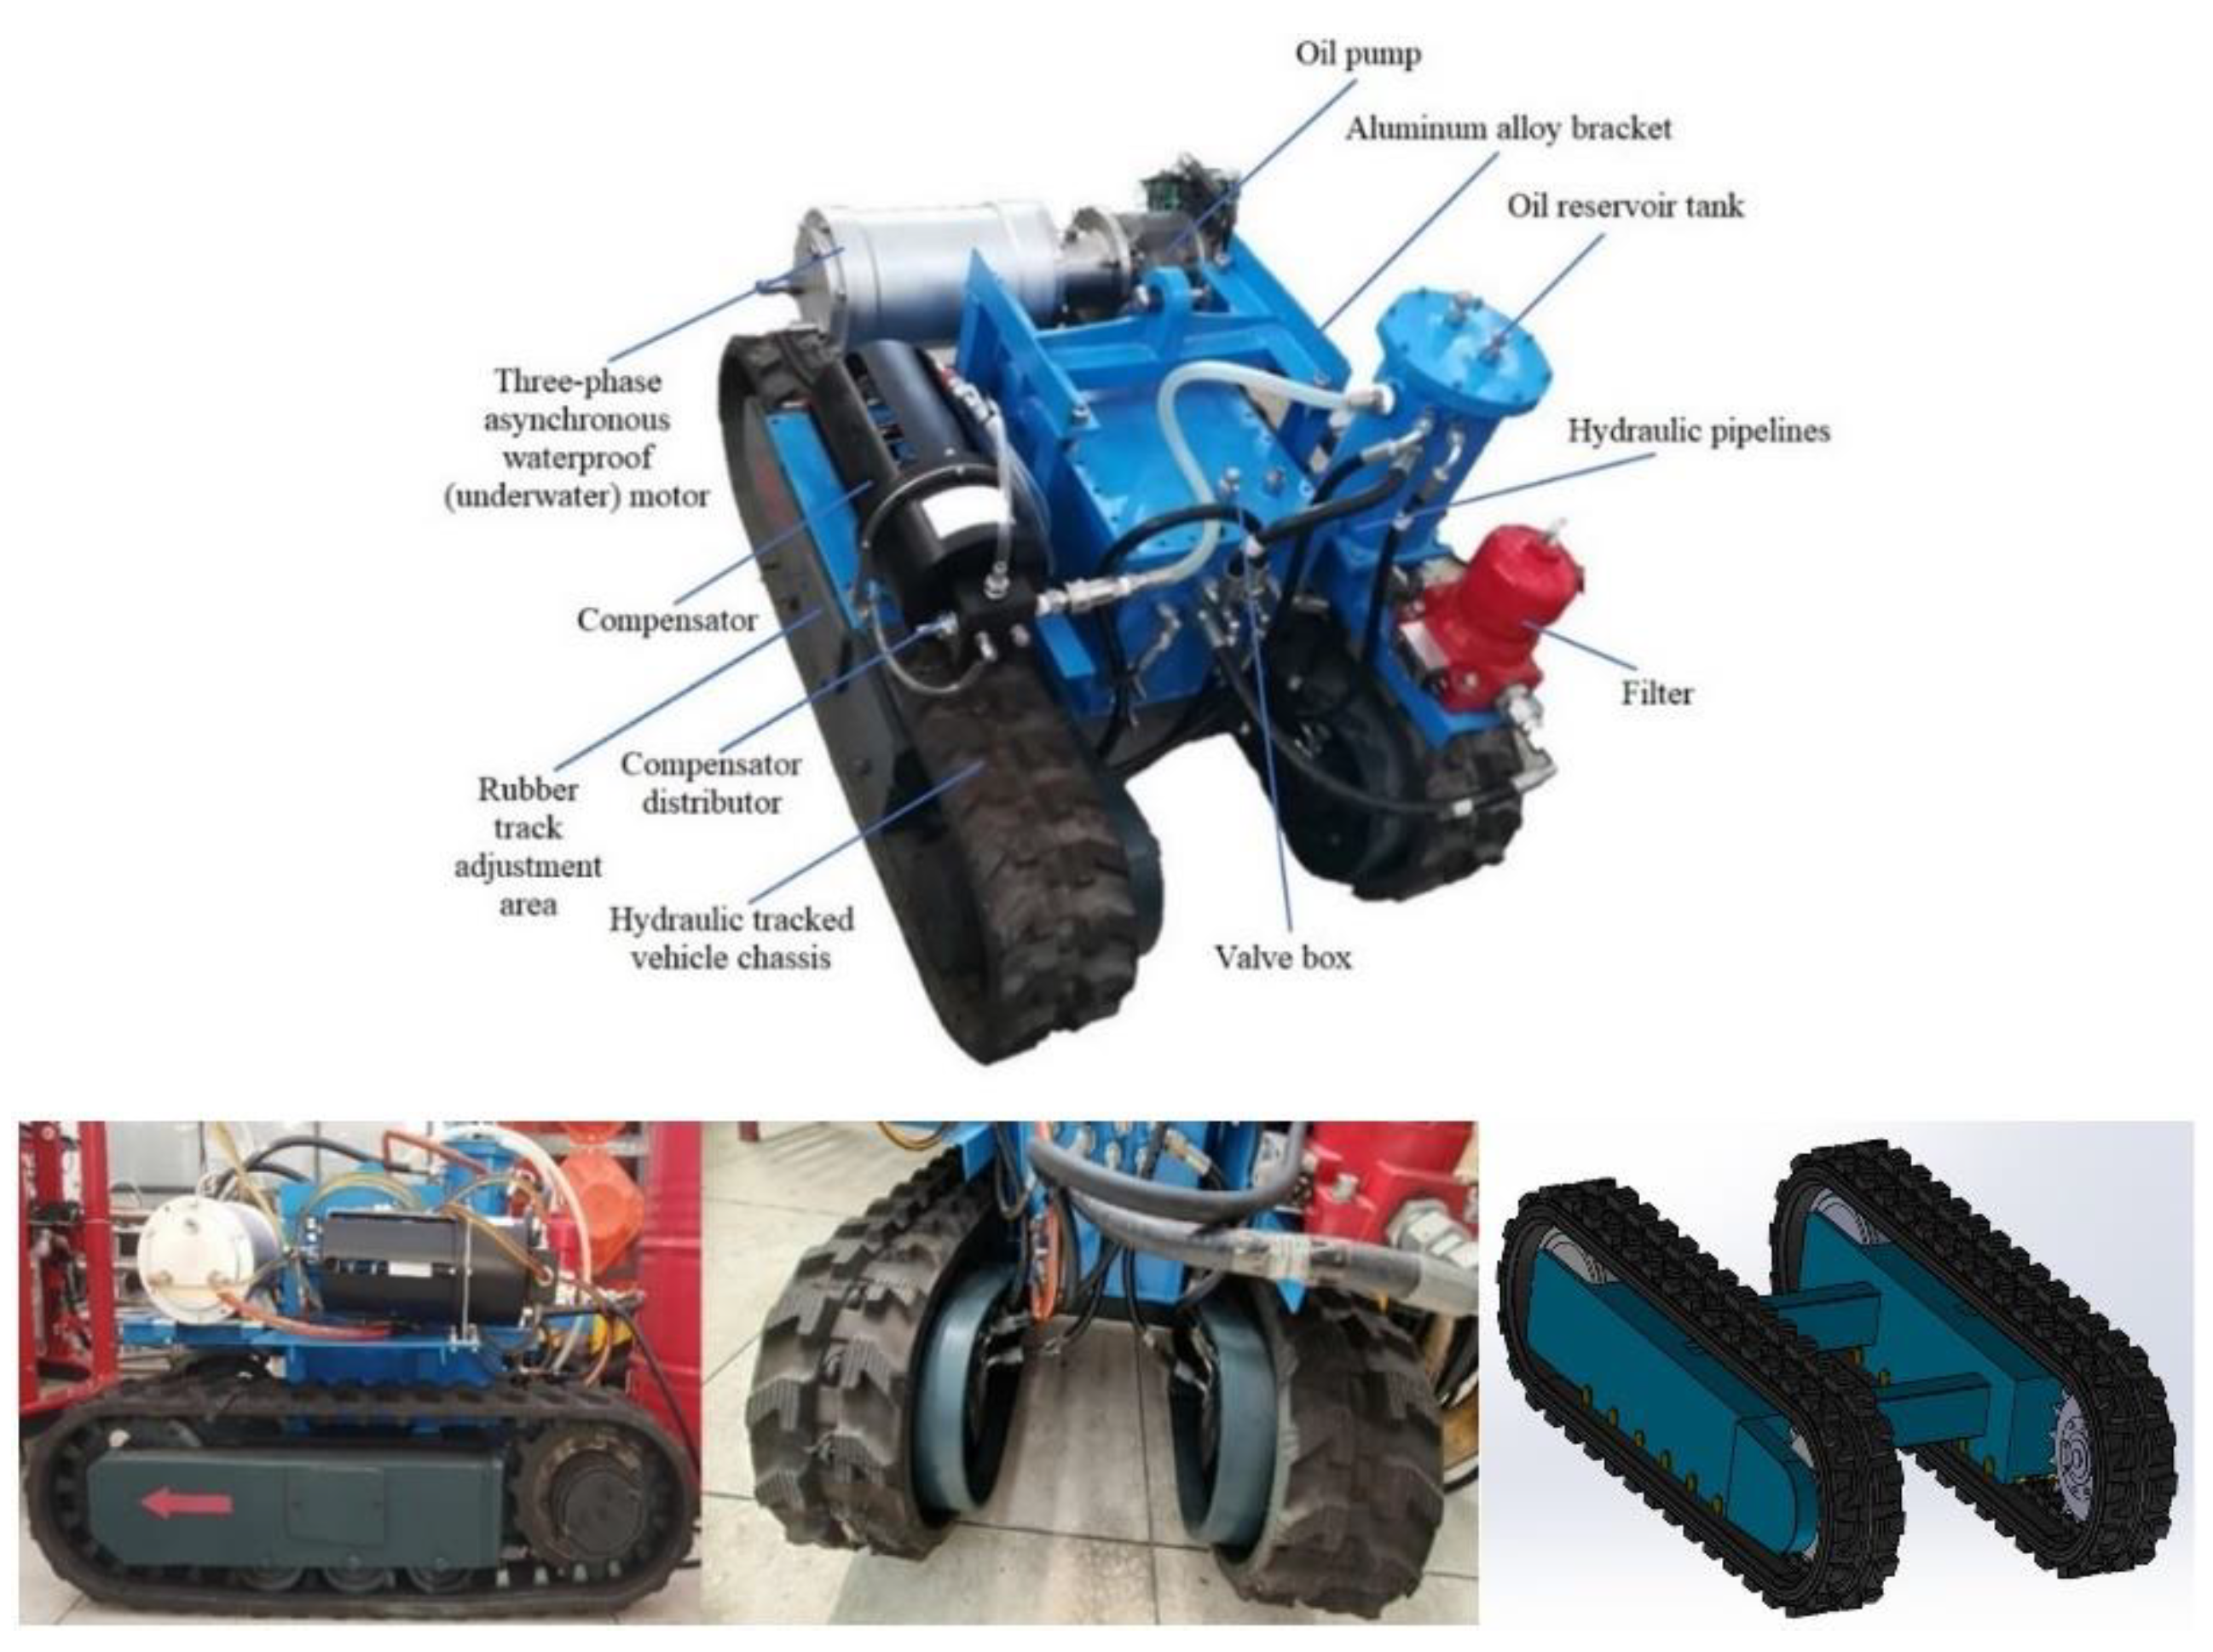
Figure 2.
Cone penetrometer and sampling by cone penetrometer.
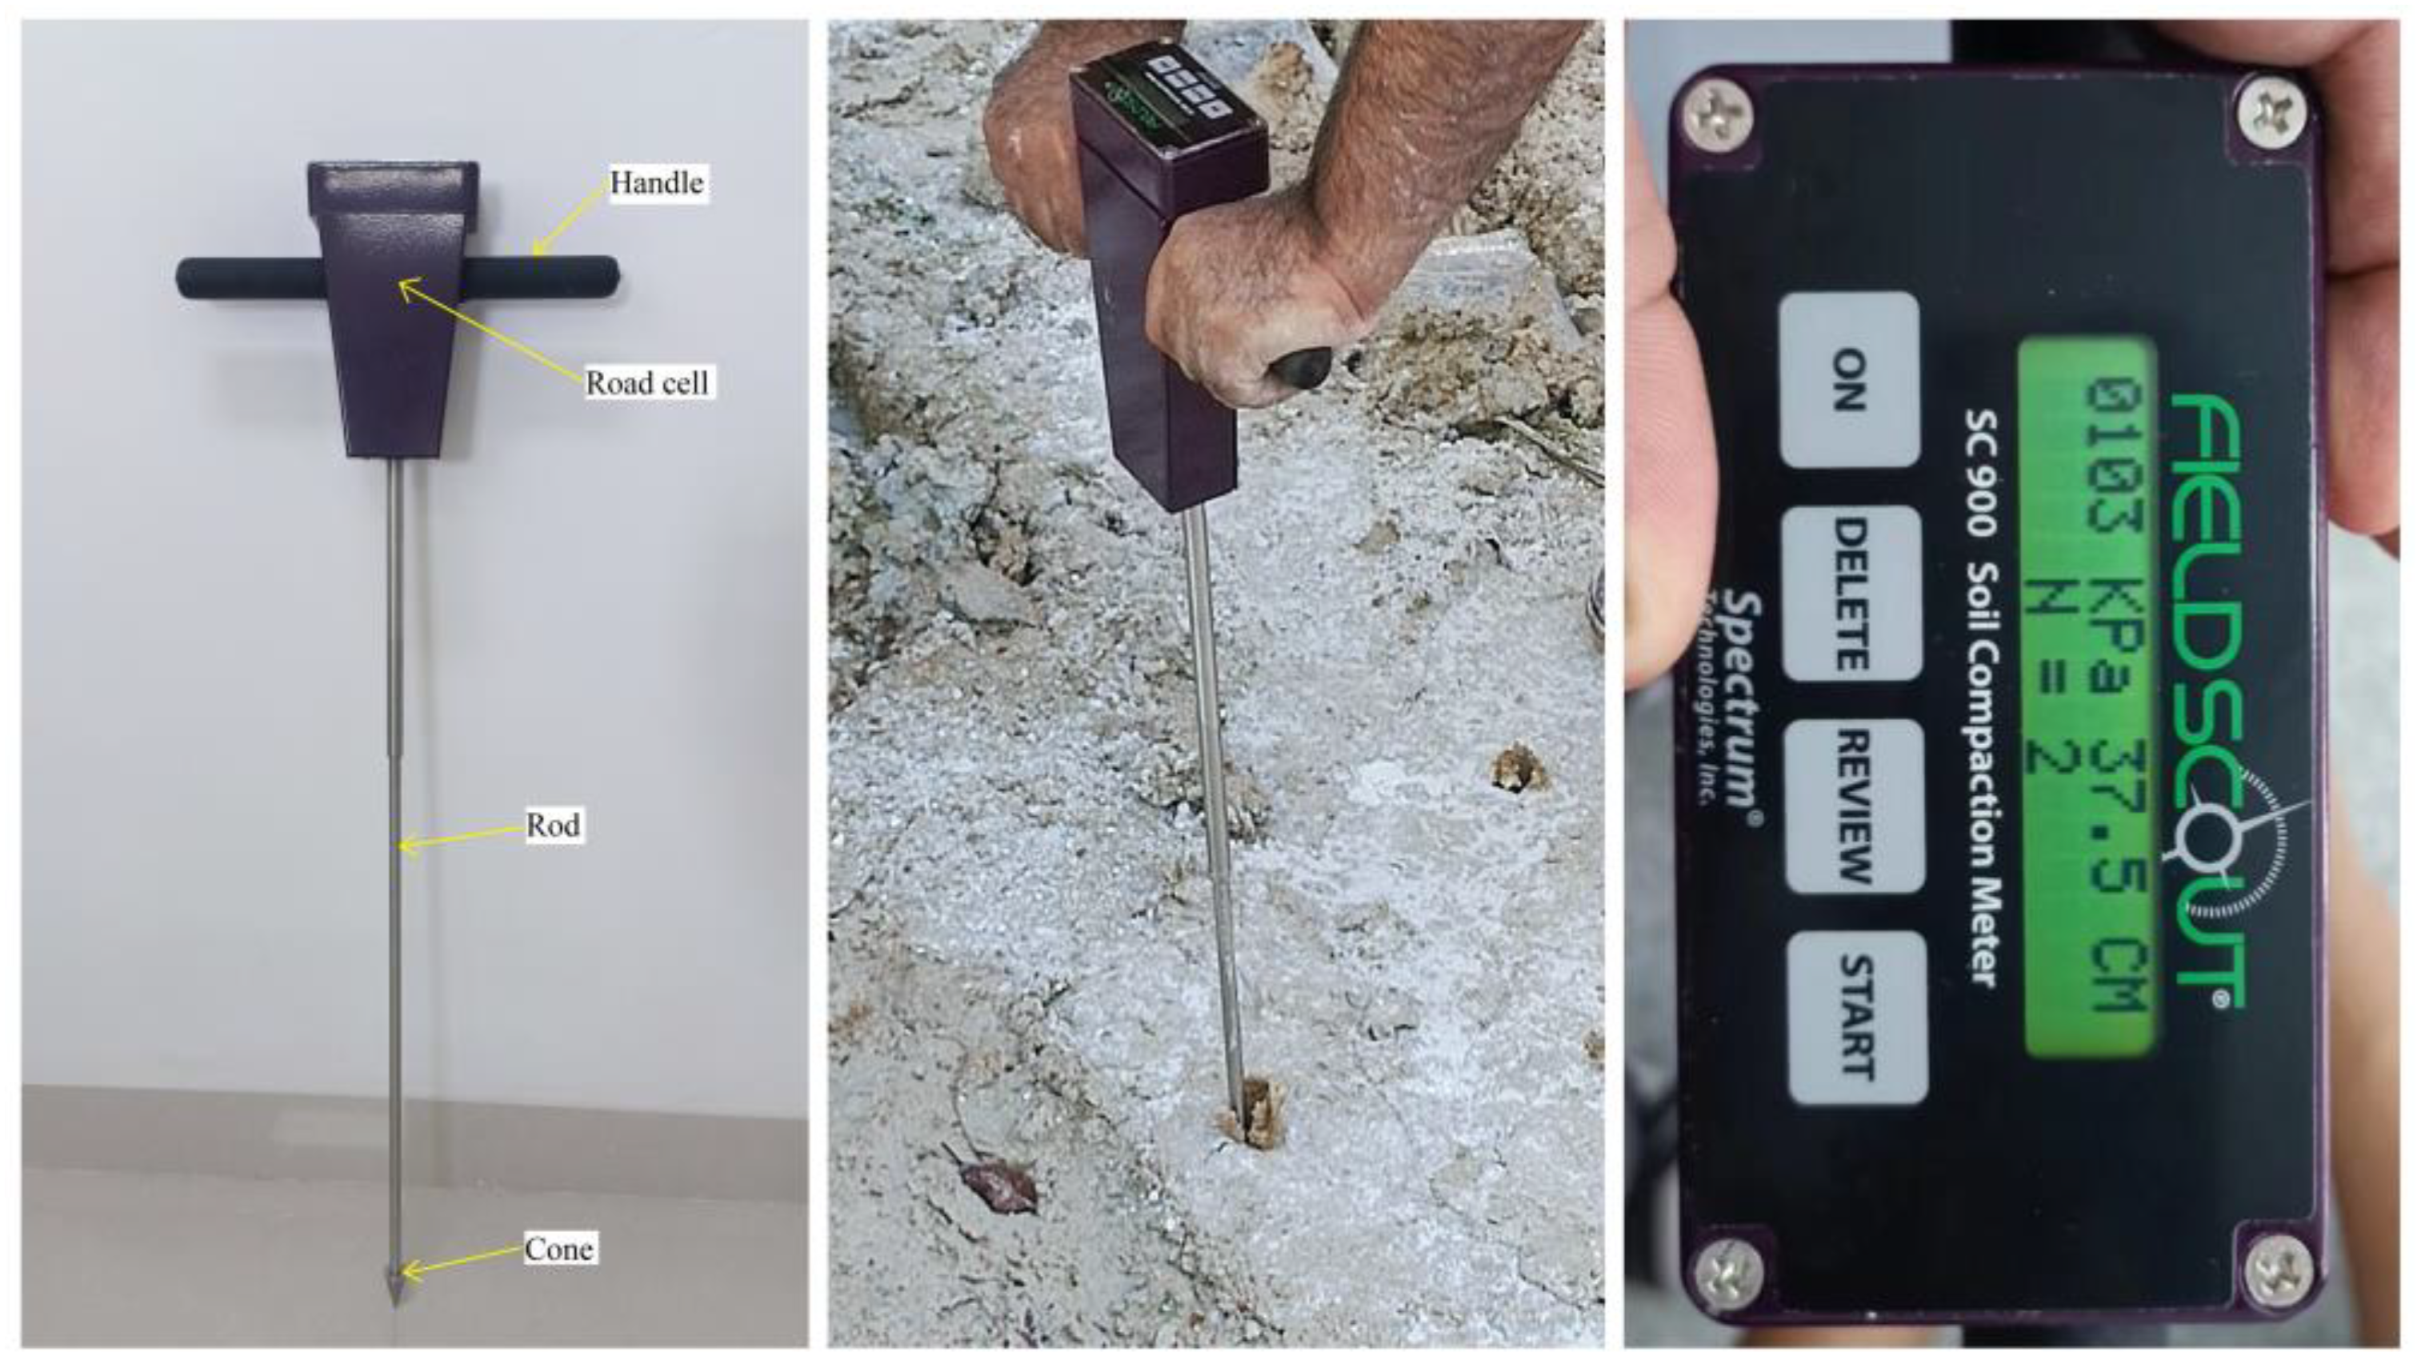
Figure 3.
Flow diagram of complete ground instrumentation system for pressure sinkage measurement experiment.
Figure 3.
Flow diagram of complete ground instrumentation system for pressure sinkage measurement experiment.
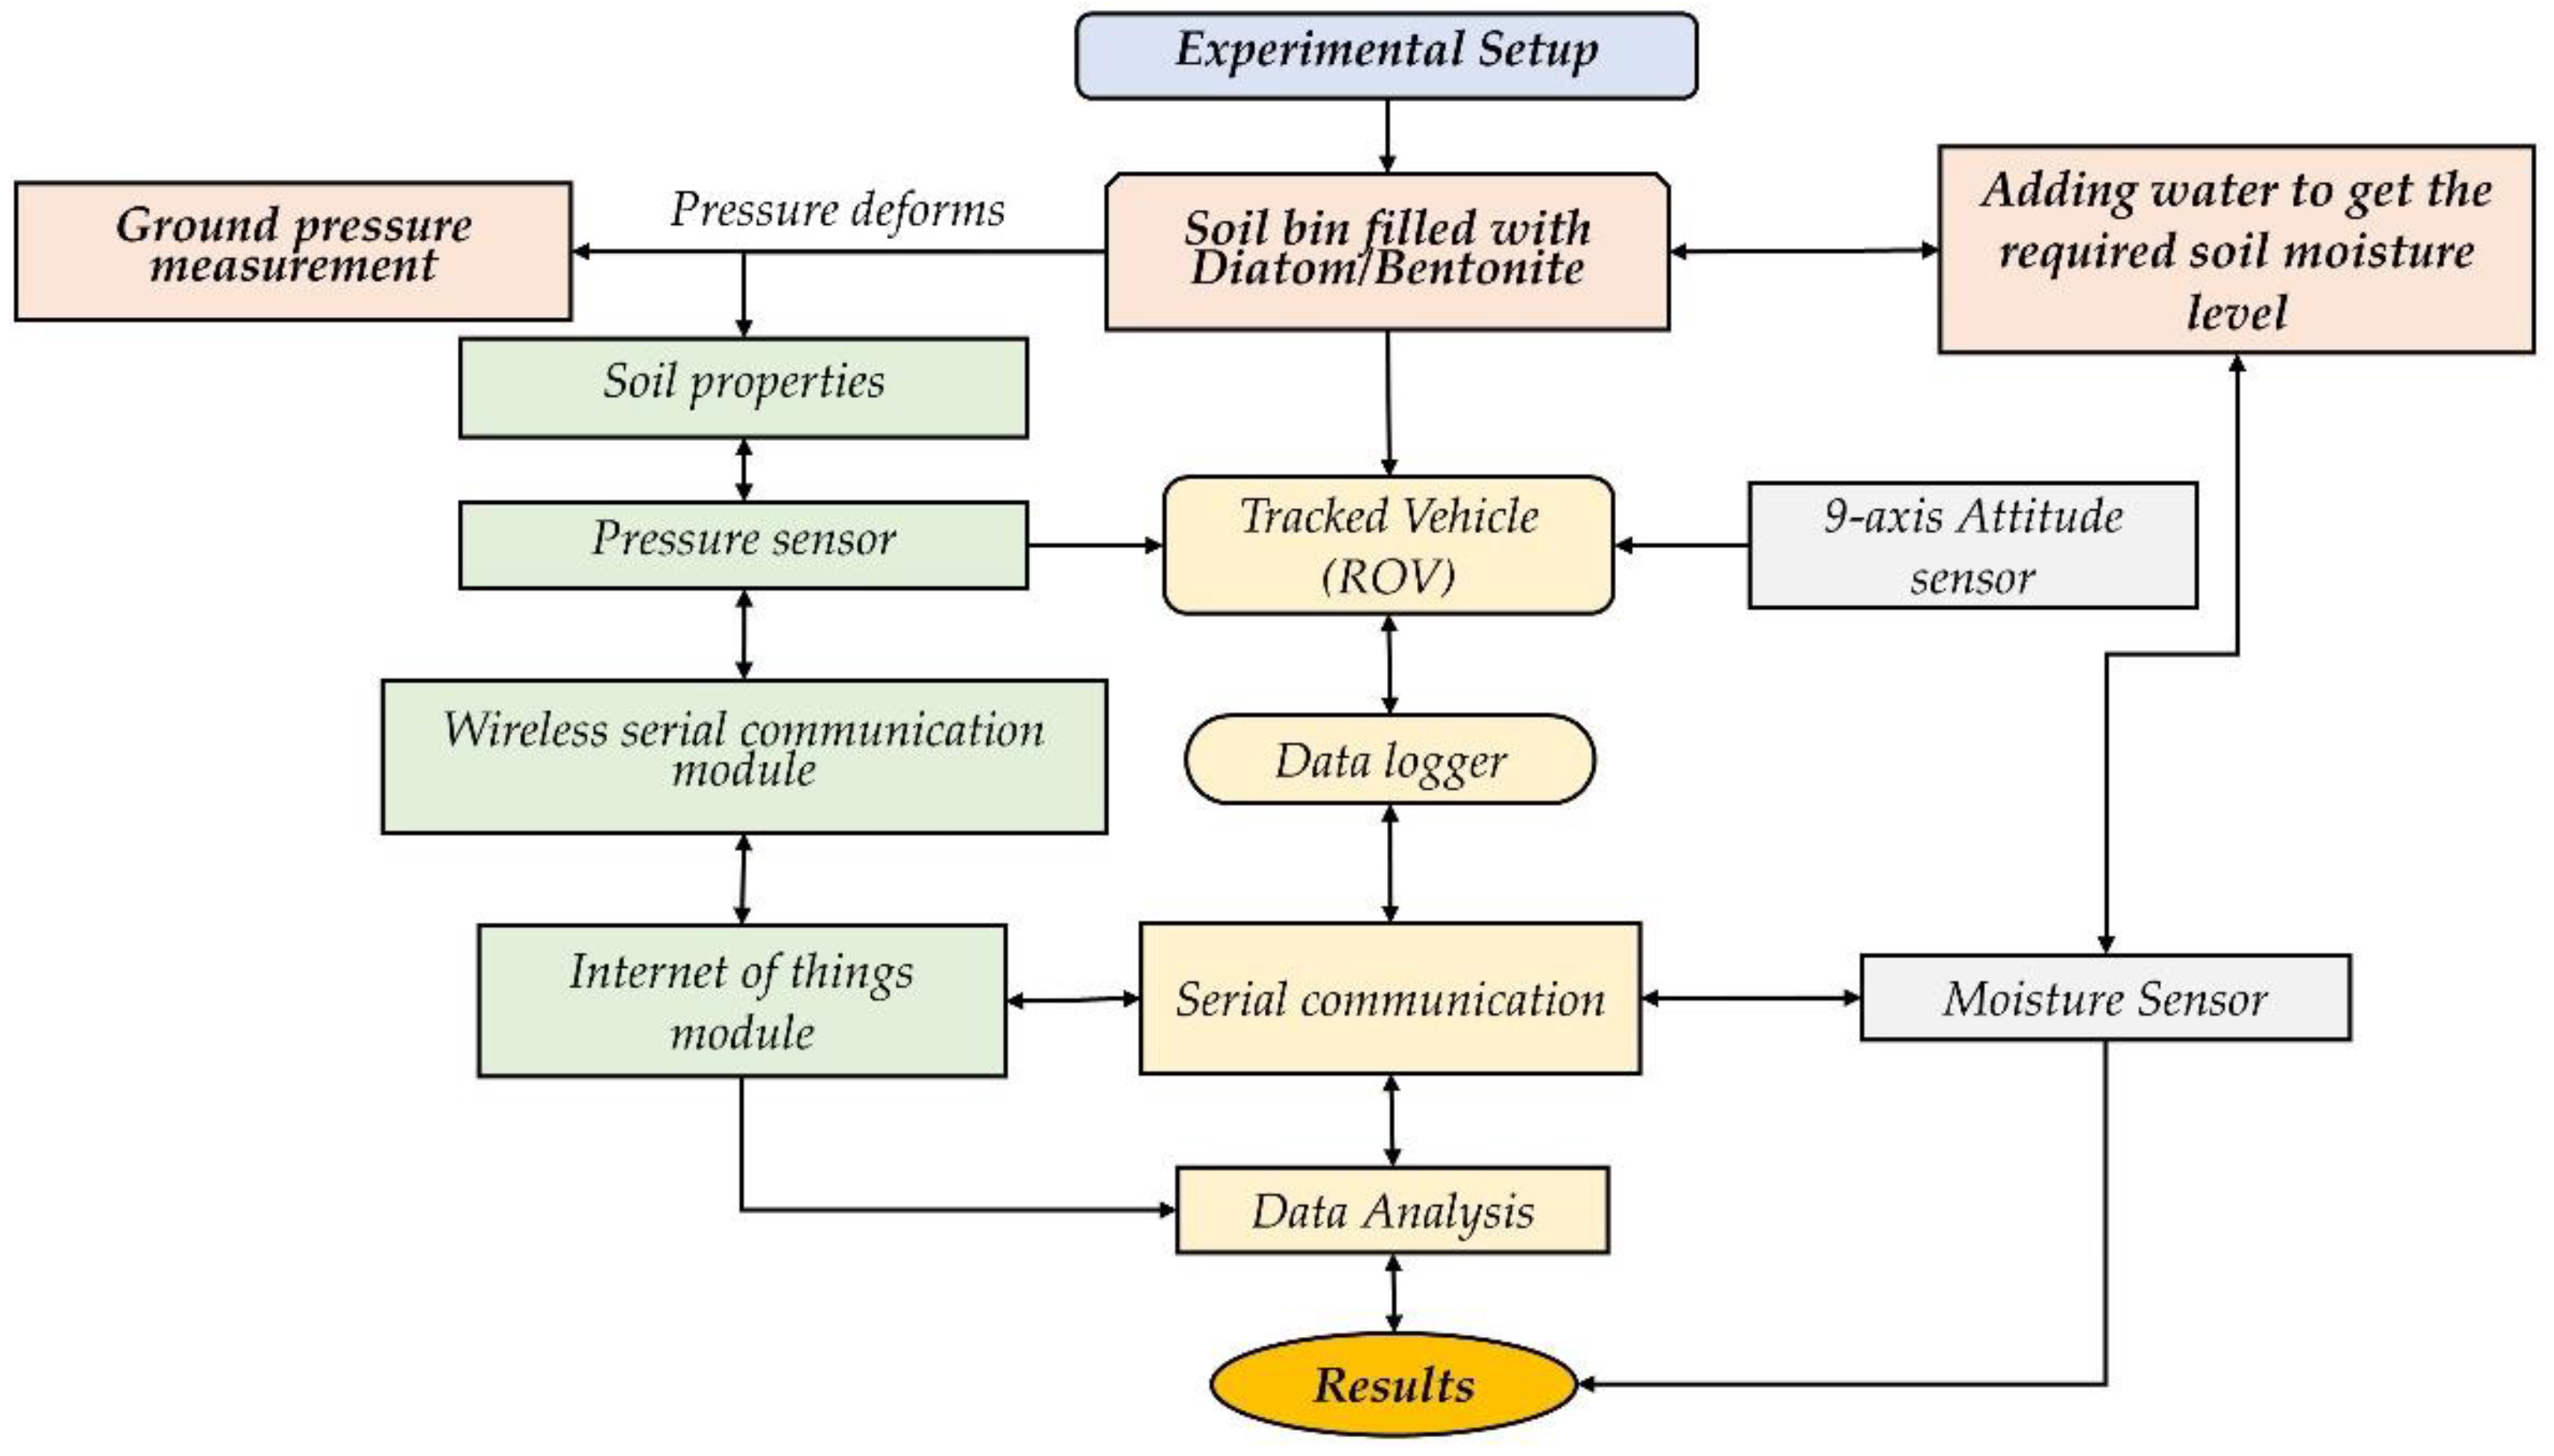
Figure 4.
Measurement of Bentonite and ‘Diatom’s Cone Index, Moist Level, and Penetration Depth.
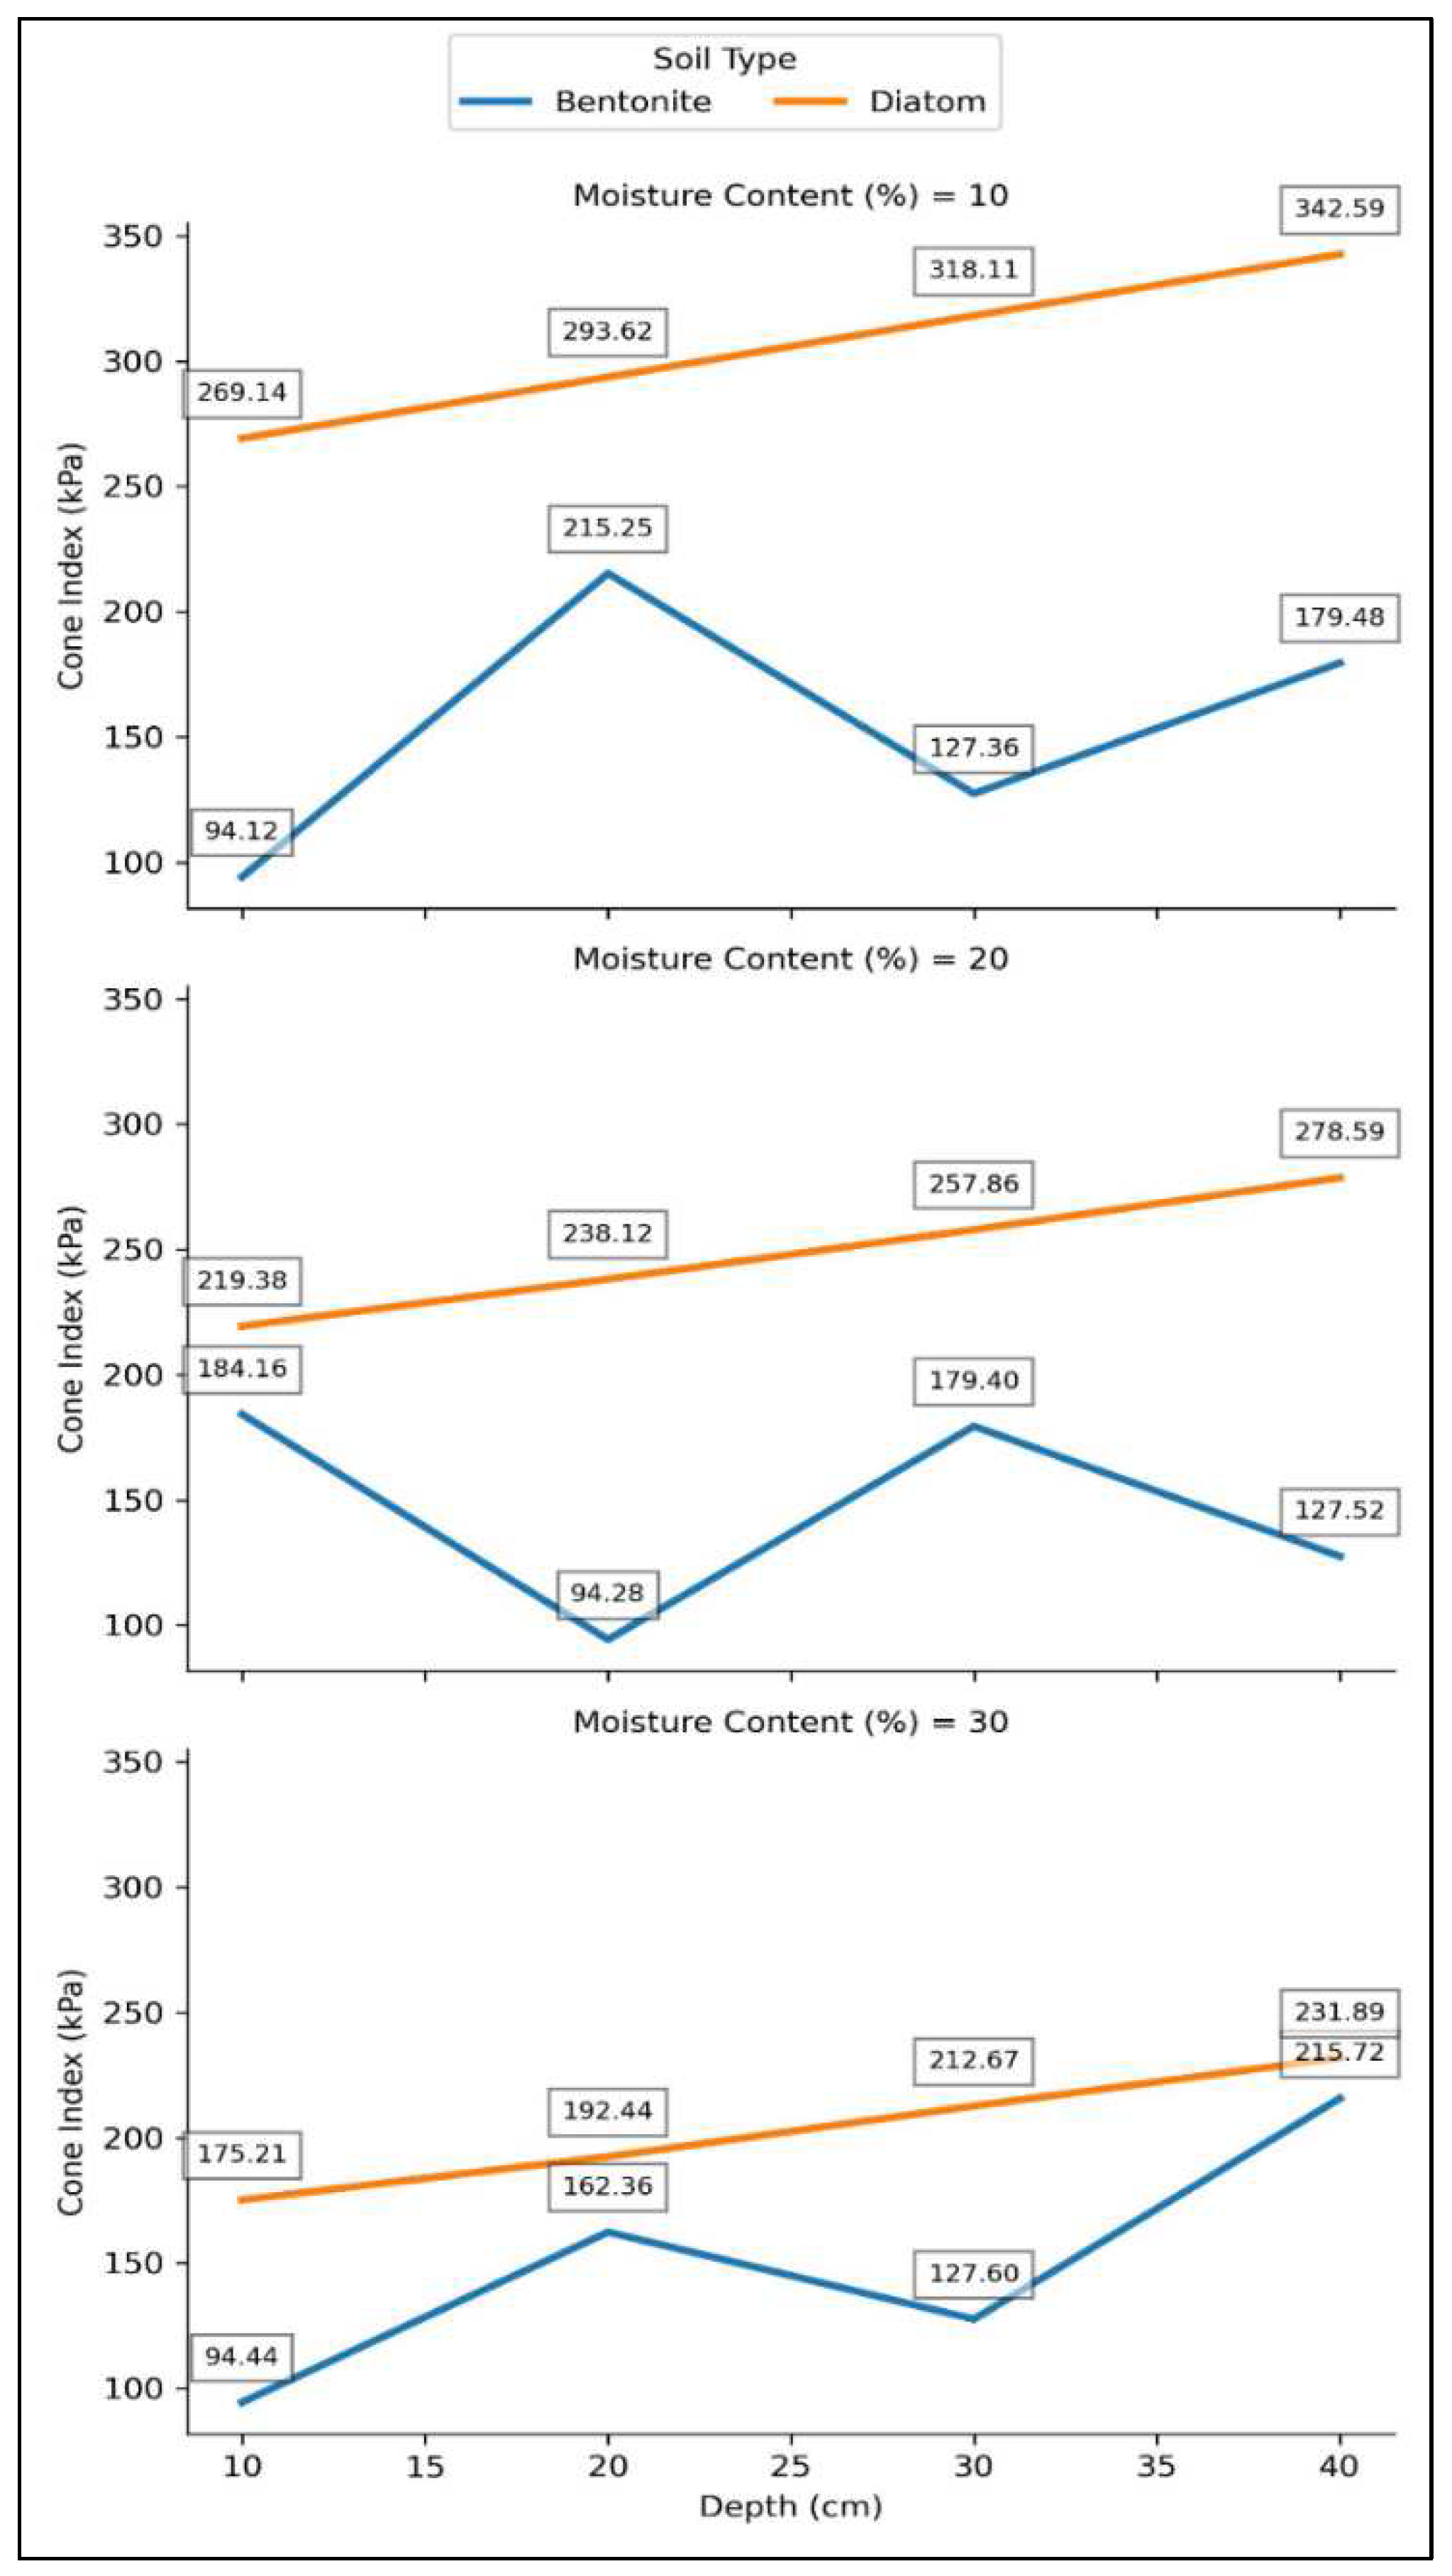
Figure 5.
A graphical data plot of rubber-tracked car sinkage testing on bentonite and diatom soil at different Moisture conditions (10%, 20%, 30%) and Ground Pressure (kPa). On the graph’s x-axis, soil moisture ranges from 10% to 30%. Tracked vehicles apply ground pressure in kilopascals (kPa) on the y-axis.
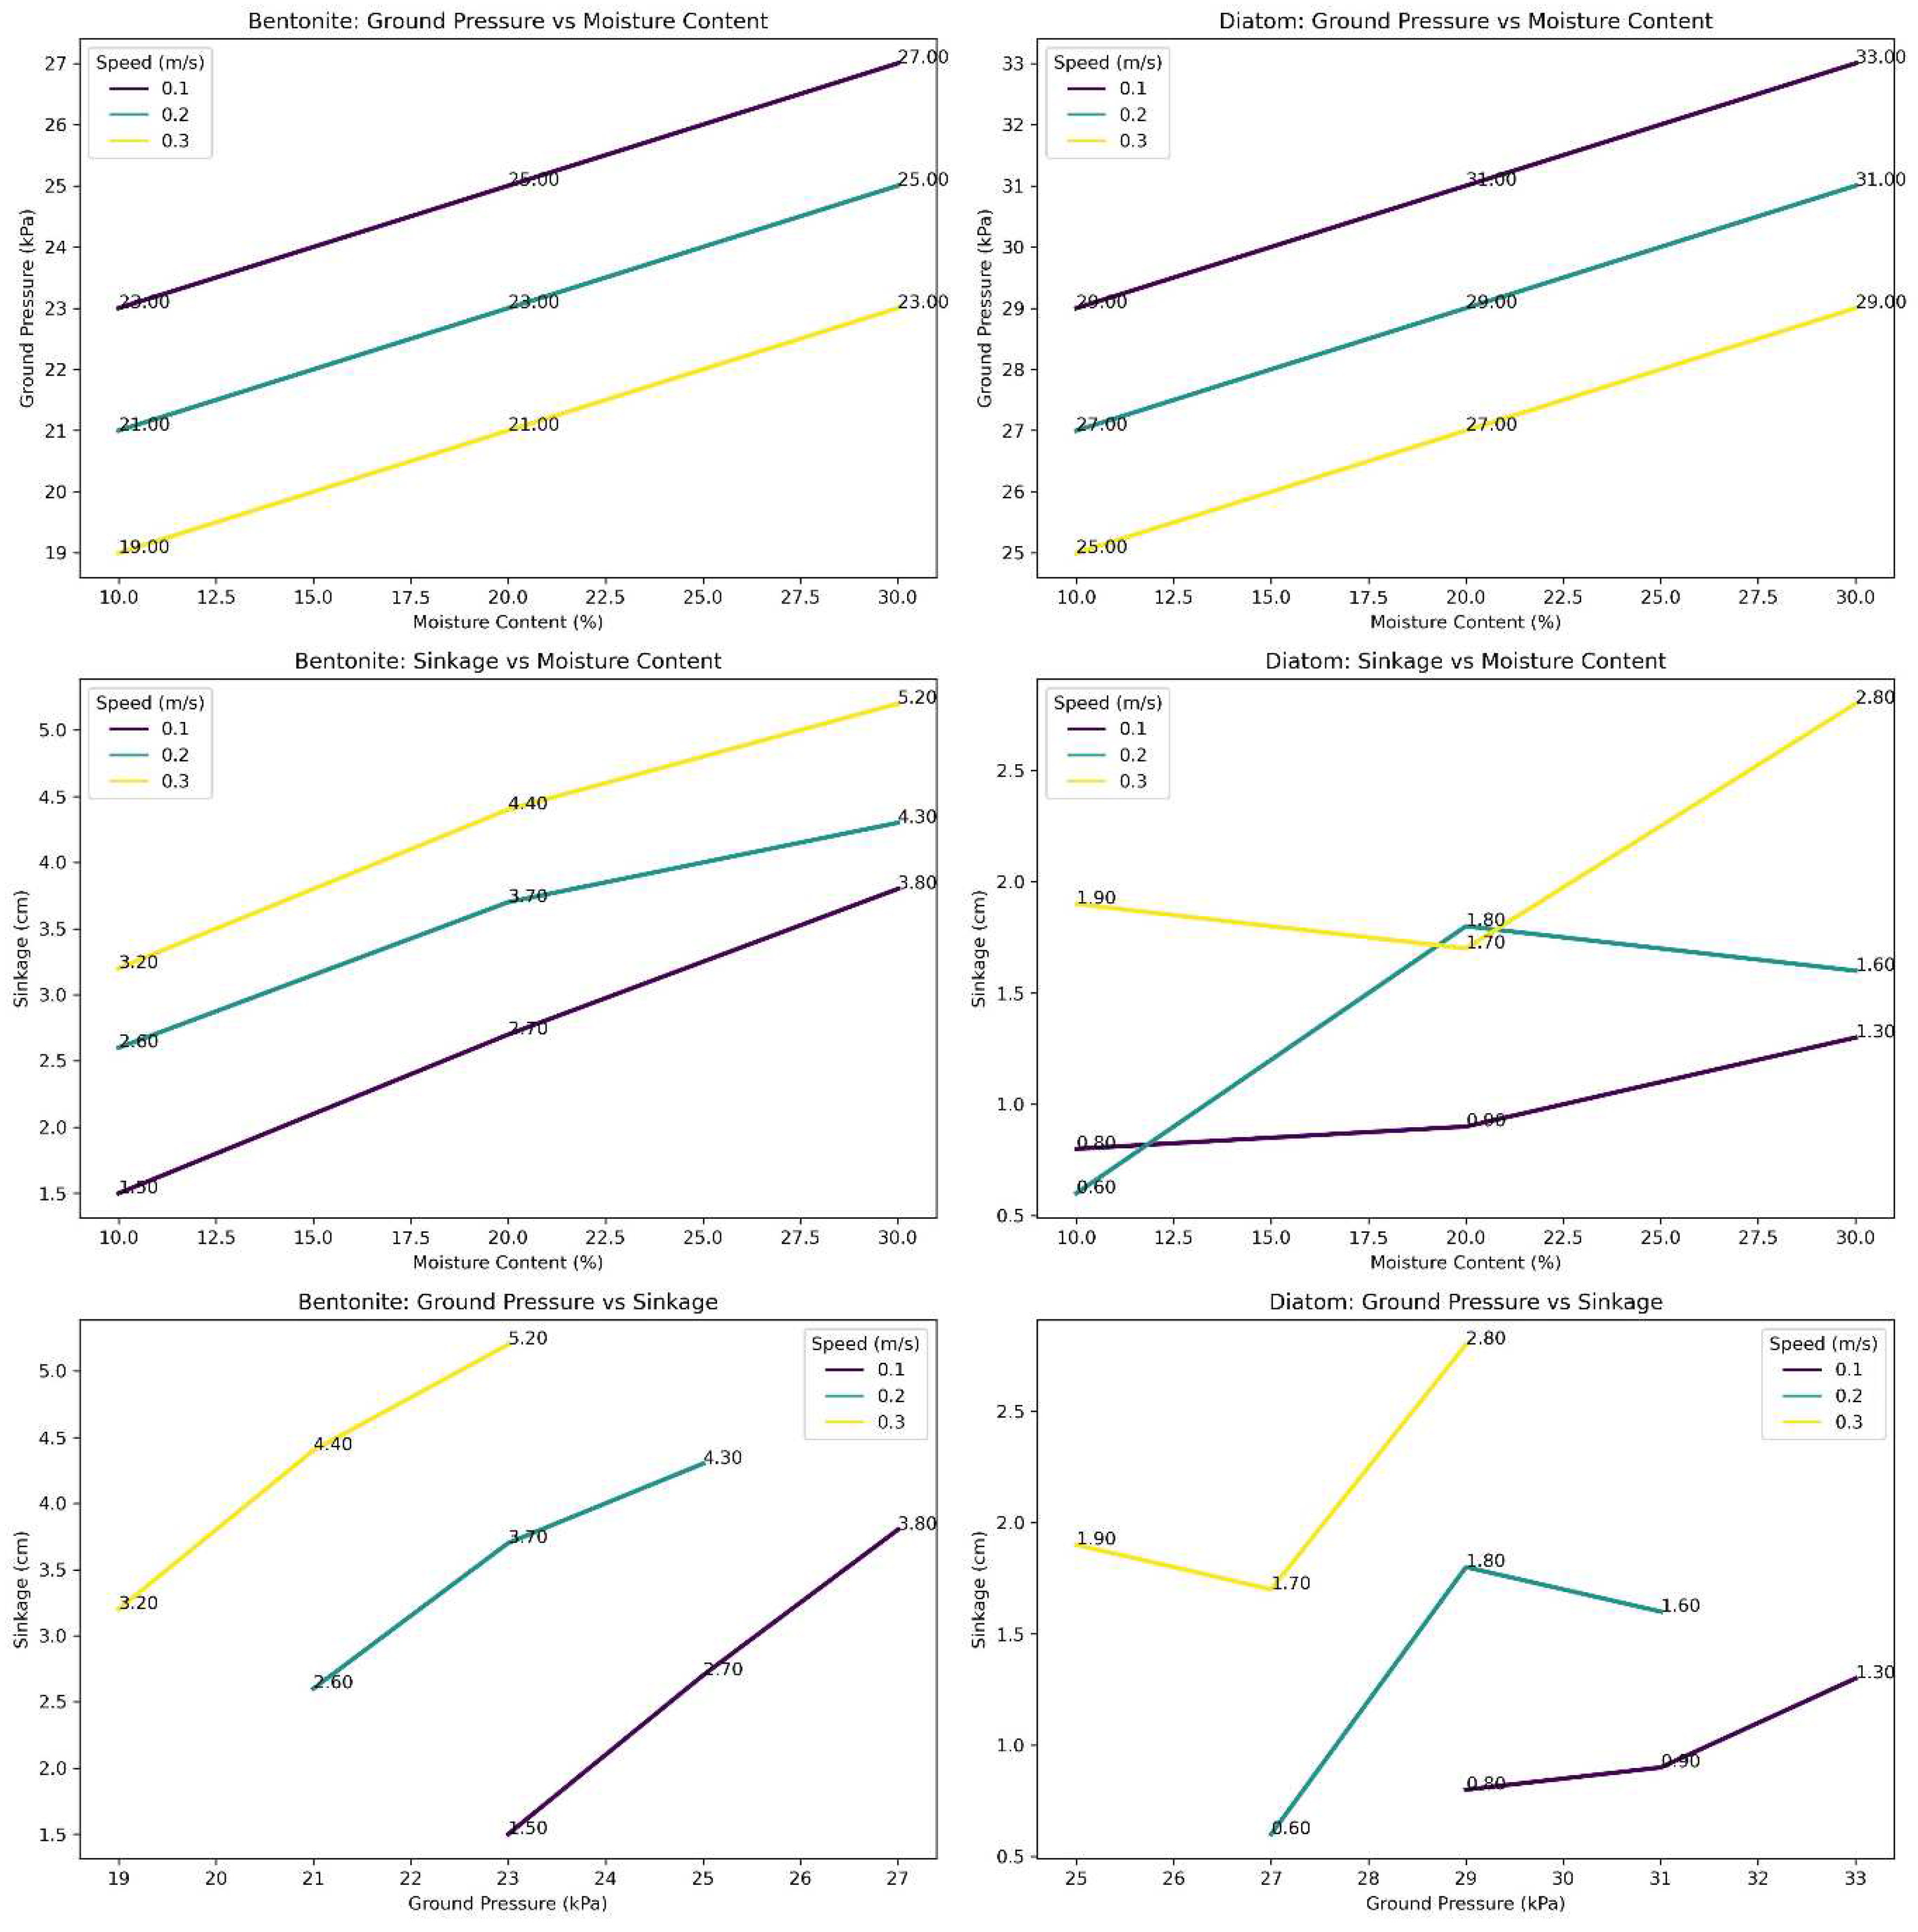
Figure 6.
Bentonite and Diatom Sinkage exponent, Moisture, and Cohesive modulus.
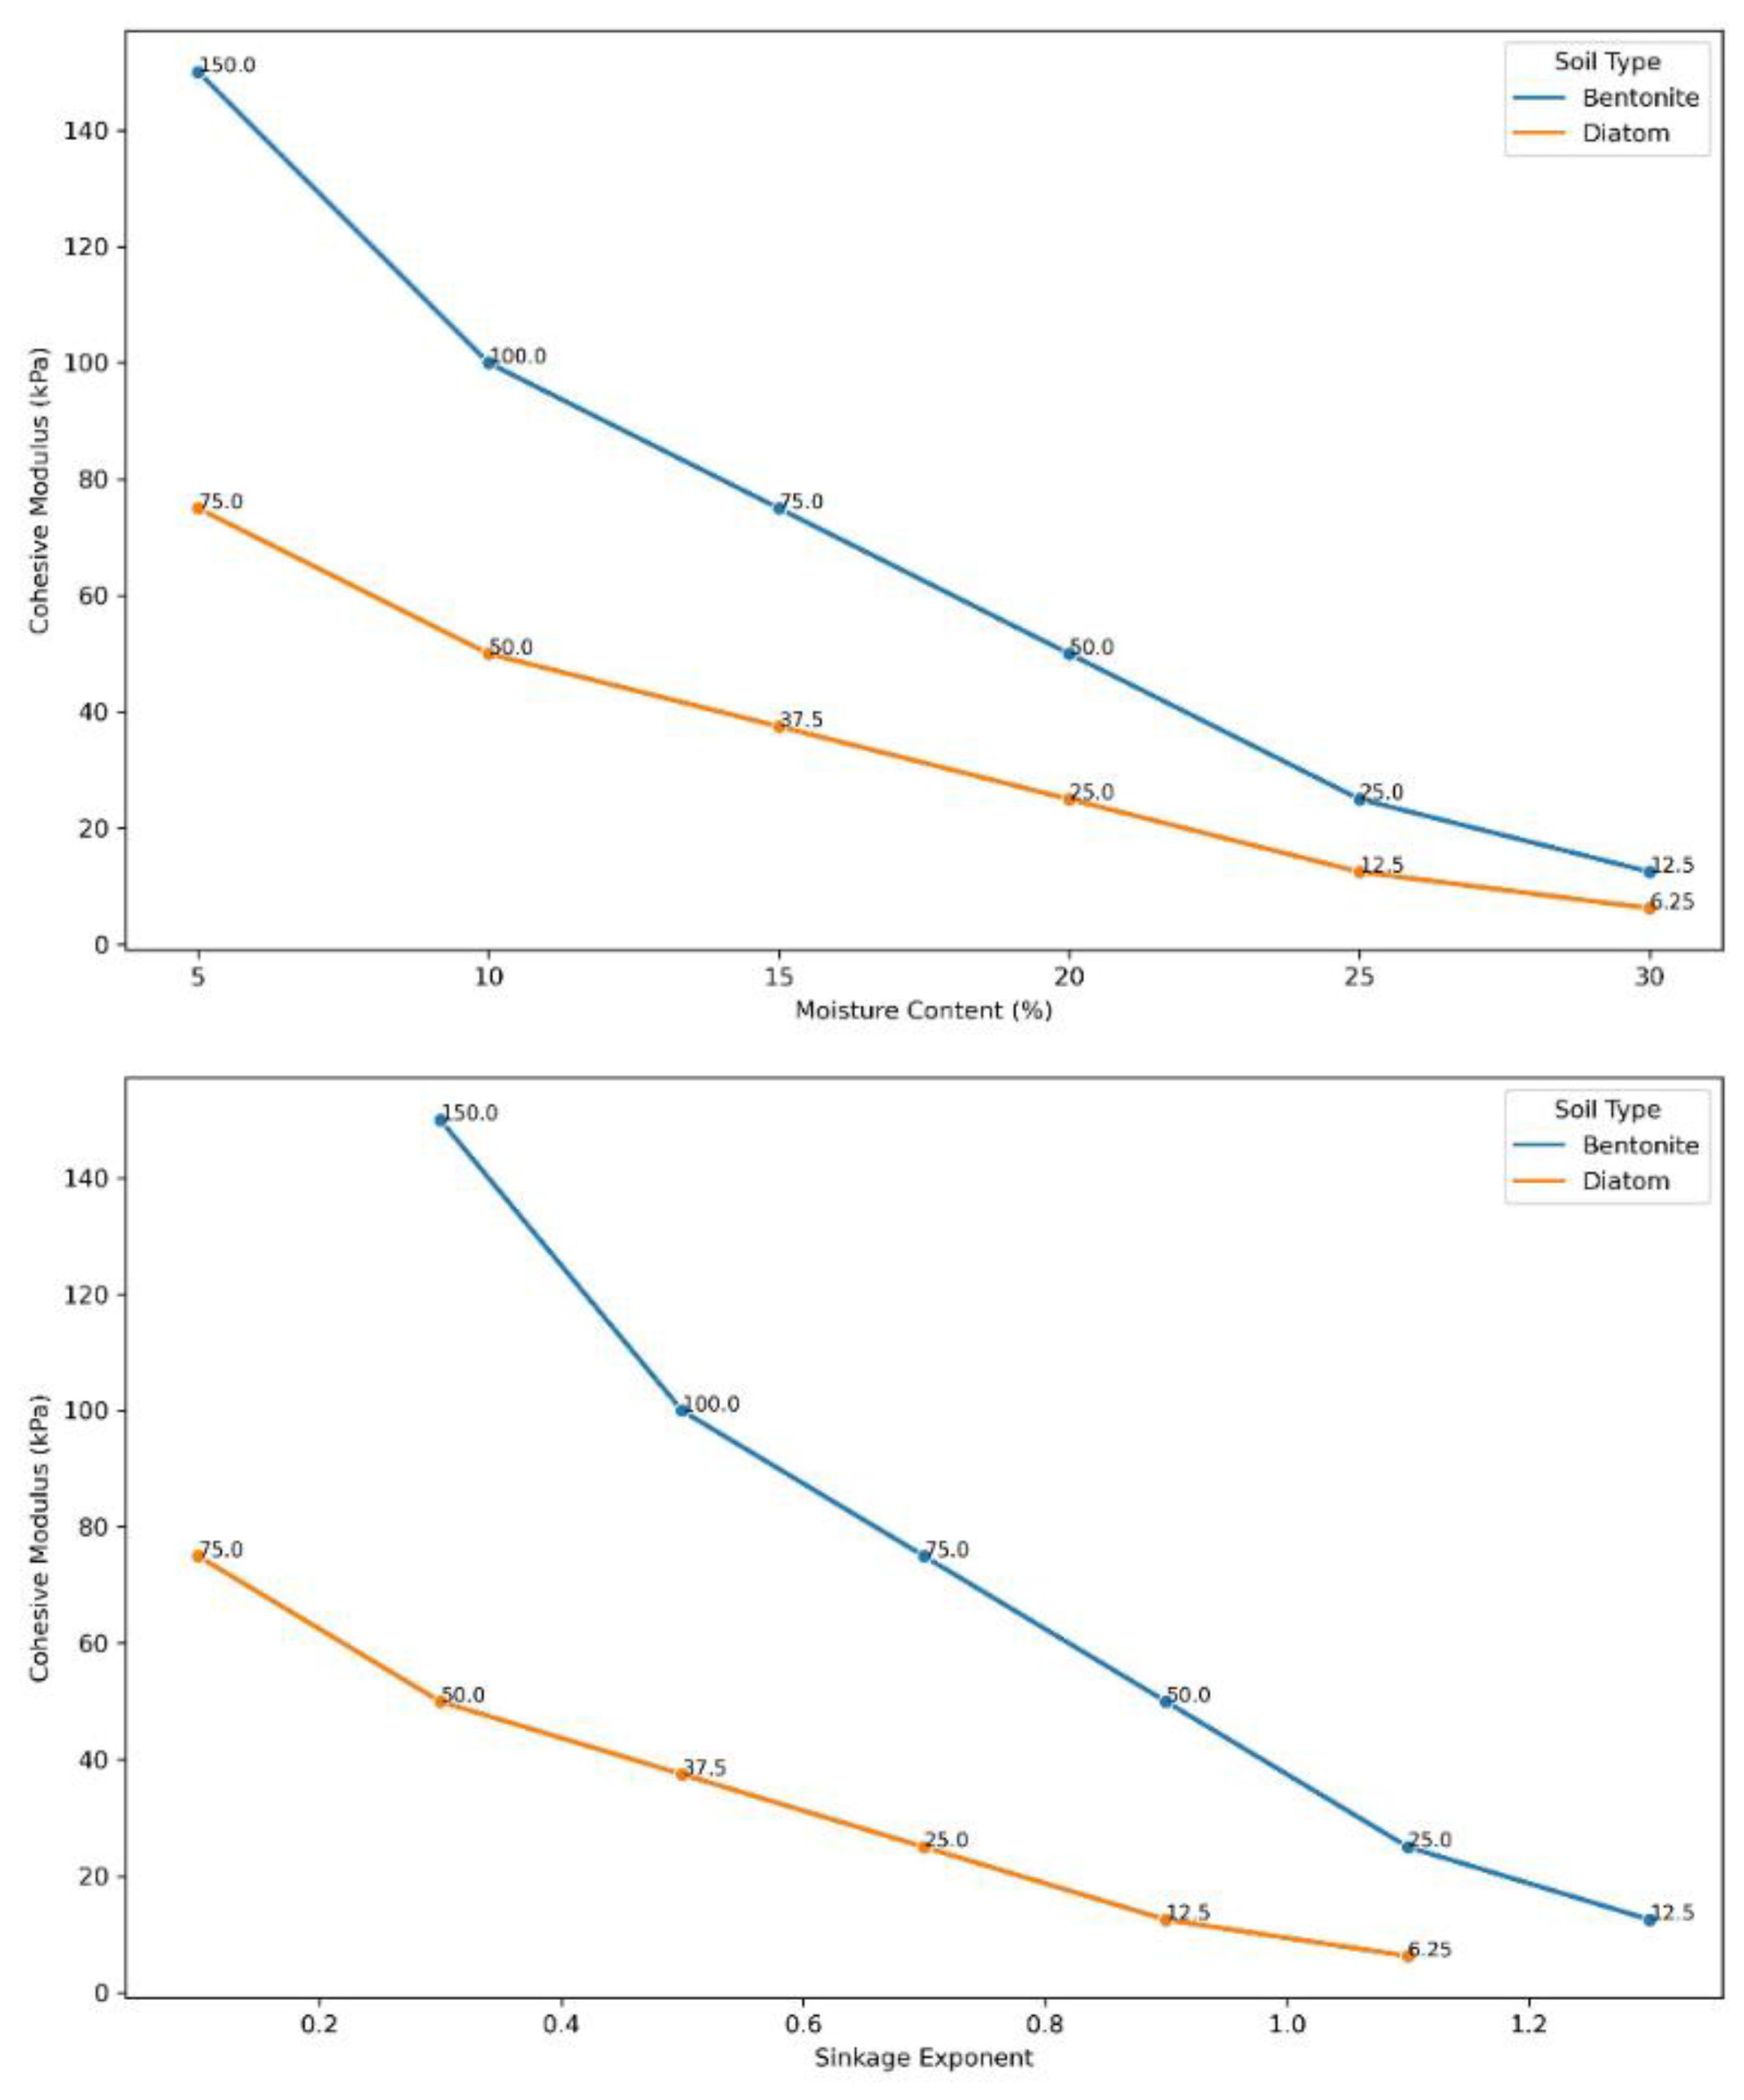

Table 1.
Brief information about apparatuses used and measurement instrumentations.
| Items | Model | Operating voltage | Measuring range | Measurement accuracy |
|---|---|---|---|---|
| Pressure sensor | ZNHM-D1-2T-22121401 | 5-15V DC | 214.5kPa -40 to 85°C |
99.9% ±0.5% FS |
| Moisture sensor | JXBS-3001-TR_4G | 12-24V DC | 0-100% -40 ℃-80 ℃ |
3% in the range of 0-53% 5% in the range of 53-100% |
| Cone Penetrometer | SC 900 | 4 AAA alkaline batteries | 0 - 18" (0 - 45 cm) 0 – 1000 PSI (0 - 7000 kPa) | ±0.5” (±1.25 cm) ±15 PSI (±103 kPa) |
| Data logger built-in Wireless serial communication module | FD0843 (6 Channel) |
9~24V DC, <10W | 100/200/400/800/1600 | Temp: -30°~ 65℃ Relative humidity: 10%~ 95% A/D Update rate: 1600Hz Data transfer rate:100Mb/s |
| 9-axis attitude sensor | WT901BLECL5.0 | 3.7V – 260mah | TCP: 1~10Hz UDP: 1~200Hz |
Angular accuracy X, Y axis 0.2°, Z axis 1° |
Table 2.
Vehicle Pressure Sinkage Test Observations @ 0.1m/sec velocity.
| Soil | Moisture (%) | Speed (m/s) | Sinkage (cm) | Track-Soil Observations |
|---|---|---|---|---|
| Bentonite | 5 | 0.1 | 1.10 | Normal wear and tear on tracks |
| Bentonite | 10 | 0.1 | 1.50 | Rutting beginning tracks deforming |
| Bentonite | 15 | 0.1 | 2.40 | Deep rutting, tracks digging in |
| Bentonite | 20 | 0.1 | 2.70 | Severe rutting, tracks stuck |
| Bentonite | 25 | 0.1 | 3.20 | Severe track deformation and sinking |
| Bentonite | 30 | 0.1 | 3.80 | Increased track slippage |
| Diatom | 5 | 0.1 | 0.55 | Normal wear and tear on tracks |
| Diatom | 10 | 0.1 | 0.80 | Minor rutting |
| Diatom | 15 | 0.1 | 0.83 | Rutting |
| Diatom | 20 | 0.1 | 0.90 | Deep Rutting |
| Diatom | 25 | 0.1 | 1.21 | very soft soil, tracks dug in |
| Diatom | 30 | 0.1 | 1.30 | Severe track deformation and sinking |
Disclaimer/Publisher’s Note: The statements, opinions and data contained in all publications are solely those of the individual author(s) and contributor(s) and not of MDPI and/or the editor(s). MDPI and/or the editor(s) disclaim responsibility for any injury to people or property resulting from any ideas, methods, instructions or products referred to in the content. |
© 2023 by the authors. Licensee MDPI, Basel, Switzerland. This article is an open access article distributed under the terms and conditions of the Creative Commons Attribution (CC BY) license (http://creativecommons.org/licenses/by/4.0/).
Copyright: This open access article is published under a Creative Commons CC BY 4.0 license, which permit the free download, distribution, and reuse, provided that the author and preprint are cited in any reuse.


